
Abstract
The idea that matching personality expression with situational demands is adaptive is implicit in many accounts of personality. Numerous constructs and measures have been posited to address this or similar phenomena. Few have proven adequate. In response, we proposed and tested a novel measurement approach (the APR index) assessing real-time behavior to rate participants’ success in matching personality expression with situational demands, which we denote adaptive personality regulation. An experimental study (N = 88) and an observational study of comedians (N = 203) provided tests of whether the APR index constituted a useful metric of adaptive personality regulation. In both studies, the APR index showed robust psychometric properties; was statistically unique from mean-level personality, self-monitoring, and the general factor of personality expression; and provided incremental concurrent prediction of task/job performance. The results suggest that the APR index provides a useful metric for studying the phenomenon of successfully matching personality expression to situational demands.
Mean or trait levels of personality provide useful descriptions of human behavior, so too does the considerable intraindividual variability in personality expression (aka state personality; Fleeson, 2001, 2004; Fleeson & Gallagher, 2009). Experience sampling studies that assess personality expression over short timeframes have estimated that mean levels explain around 35% of the variance in momentary behavior with around 65% explained by intraindividual variability in personality expression (Fleeson & Gallagher, 2009; Sherman et al., 2015).
Subsequent studies have demonstrated that intraindividual variability in personality expression correlates with situational characteristics (e.g., Fleeson & Law, 2015; Sherman et al., 2015; Wright & Mischel, 1987) and current goals (e.g., Bleidorn, 2009; Heller et al., 2007; McCabe & Fleeson, 2016; Perunovic et al., 2011; Sauerberger & Funder, 2017). Individual differences in intraindividual variability in personality expression also show impressive levels of reliability (Baird et al., 2006; Fleeson, 2001). Thus, it appears that “not only does behavior change across contexts, but it changes meaningfully with the demands of the situation at hand” (Sauerberger & Funder, 2017, p. 270). Perhaps the situation-contingent personality expression, observed within the literature, represents, in part, attempts to regulate personality expression to meet situational requirements and goals.
Many theories are concerned with the relationship between expressed personality and situational variables/appraisals, including whole trait theory (Fleeson & Jayawickreme, 2015), cybernetic Big 5 theory (DeYoung, 2015), and trait-activation theory (Tett & Burnett, 2003). Whole trait theory notes that an empirical relationship exists between personality expression and situational variables, but is mute as to a possible explanation. Cybernetic Big 5 Theory explicitly discusses this relationship in the form of characteristic adaptations. Trait-activation theory considers that different situations elicit the expression of different personality traits. Each of these theories, at least implicitly, suggests that a meaningful proportion of personality state expressions represent attempts to express situation relevant personality characteristics. Put another way, “To survive and function well as a member of society—or at all—people must be able to adapt their behavior to the situation that confronts them” (Sauerberger & Funder, 2017, p. 264). Thus, finding an index or measure of how people express their personality in response to situational requirements would greatly facilitate current research efforts to understand personality dynamics (e.g., Cervone & Little, 2019; Sauerberger & Funder, 2017, see also special issues in the European Journal of Personality, 2015; Frontiers in Psychology, 2017; Journal of Research in Personality, 2015, 2017, Personality and Individual Differences, 2019).
Accordingly, we propose a novel measurement index of the phenomenon outlined above, which we term, adaptive personality regulation, tentatively defined as, the ability or propensity to express personality to meet situational requirements. Based on this definition, an index of adaptive personality regulation must assess (a) the expression of personality required within a situation and (b) the extent to which the appropriate levels of personality are expressed.
Numerous constructs address similar phenomena, including self-monitoring (Snyder, 1974); functional flexibility (Kashdan & Rottenberg, 2010; Paulhus & Martin, 1988); behavioral signatures (Mischel & Shoda, 1995); flux, pulse, and spin measures (Côté et al., 2012; Moskowitz & Zuroff, 2004, 2005); intraindividual personality variability across situations (Lievens et al., 2018); and situation-contingent personality expression (Bleidorn, 2009; Judge et al., 2014; Minbashian et al., 2010; Wood et al., 2019). Table 1 displays prototypical summaries of these constructs, including definitions, approach to personality assessment, approach to assessing situational requirements, and whether they differentiate between adaptive and maladaptive regulation. Creating constructs and measures for the sake of it stifles rather than strengthens scientific progress (Hughes, 2018; Hughes & Evans, 2018); thus, we have taken great care to review existing work to ensure that adaptive personality regulation and the associated measurement index are indeed substantively novel. As evident from Table 1, and the discussion that will follow, these constructs and their assessment procedures differ from that we propose.
Prototypical Descriptions of the Definitions and Assessment Protocols of Constructs Related to Adaptive Personality Regulation.
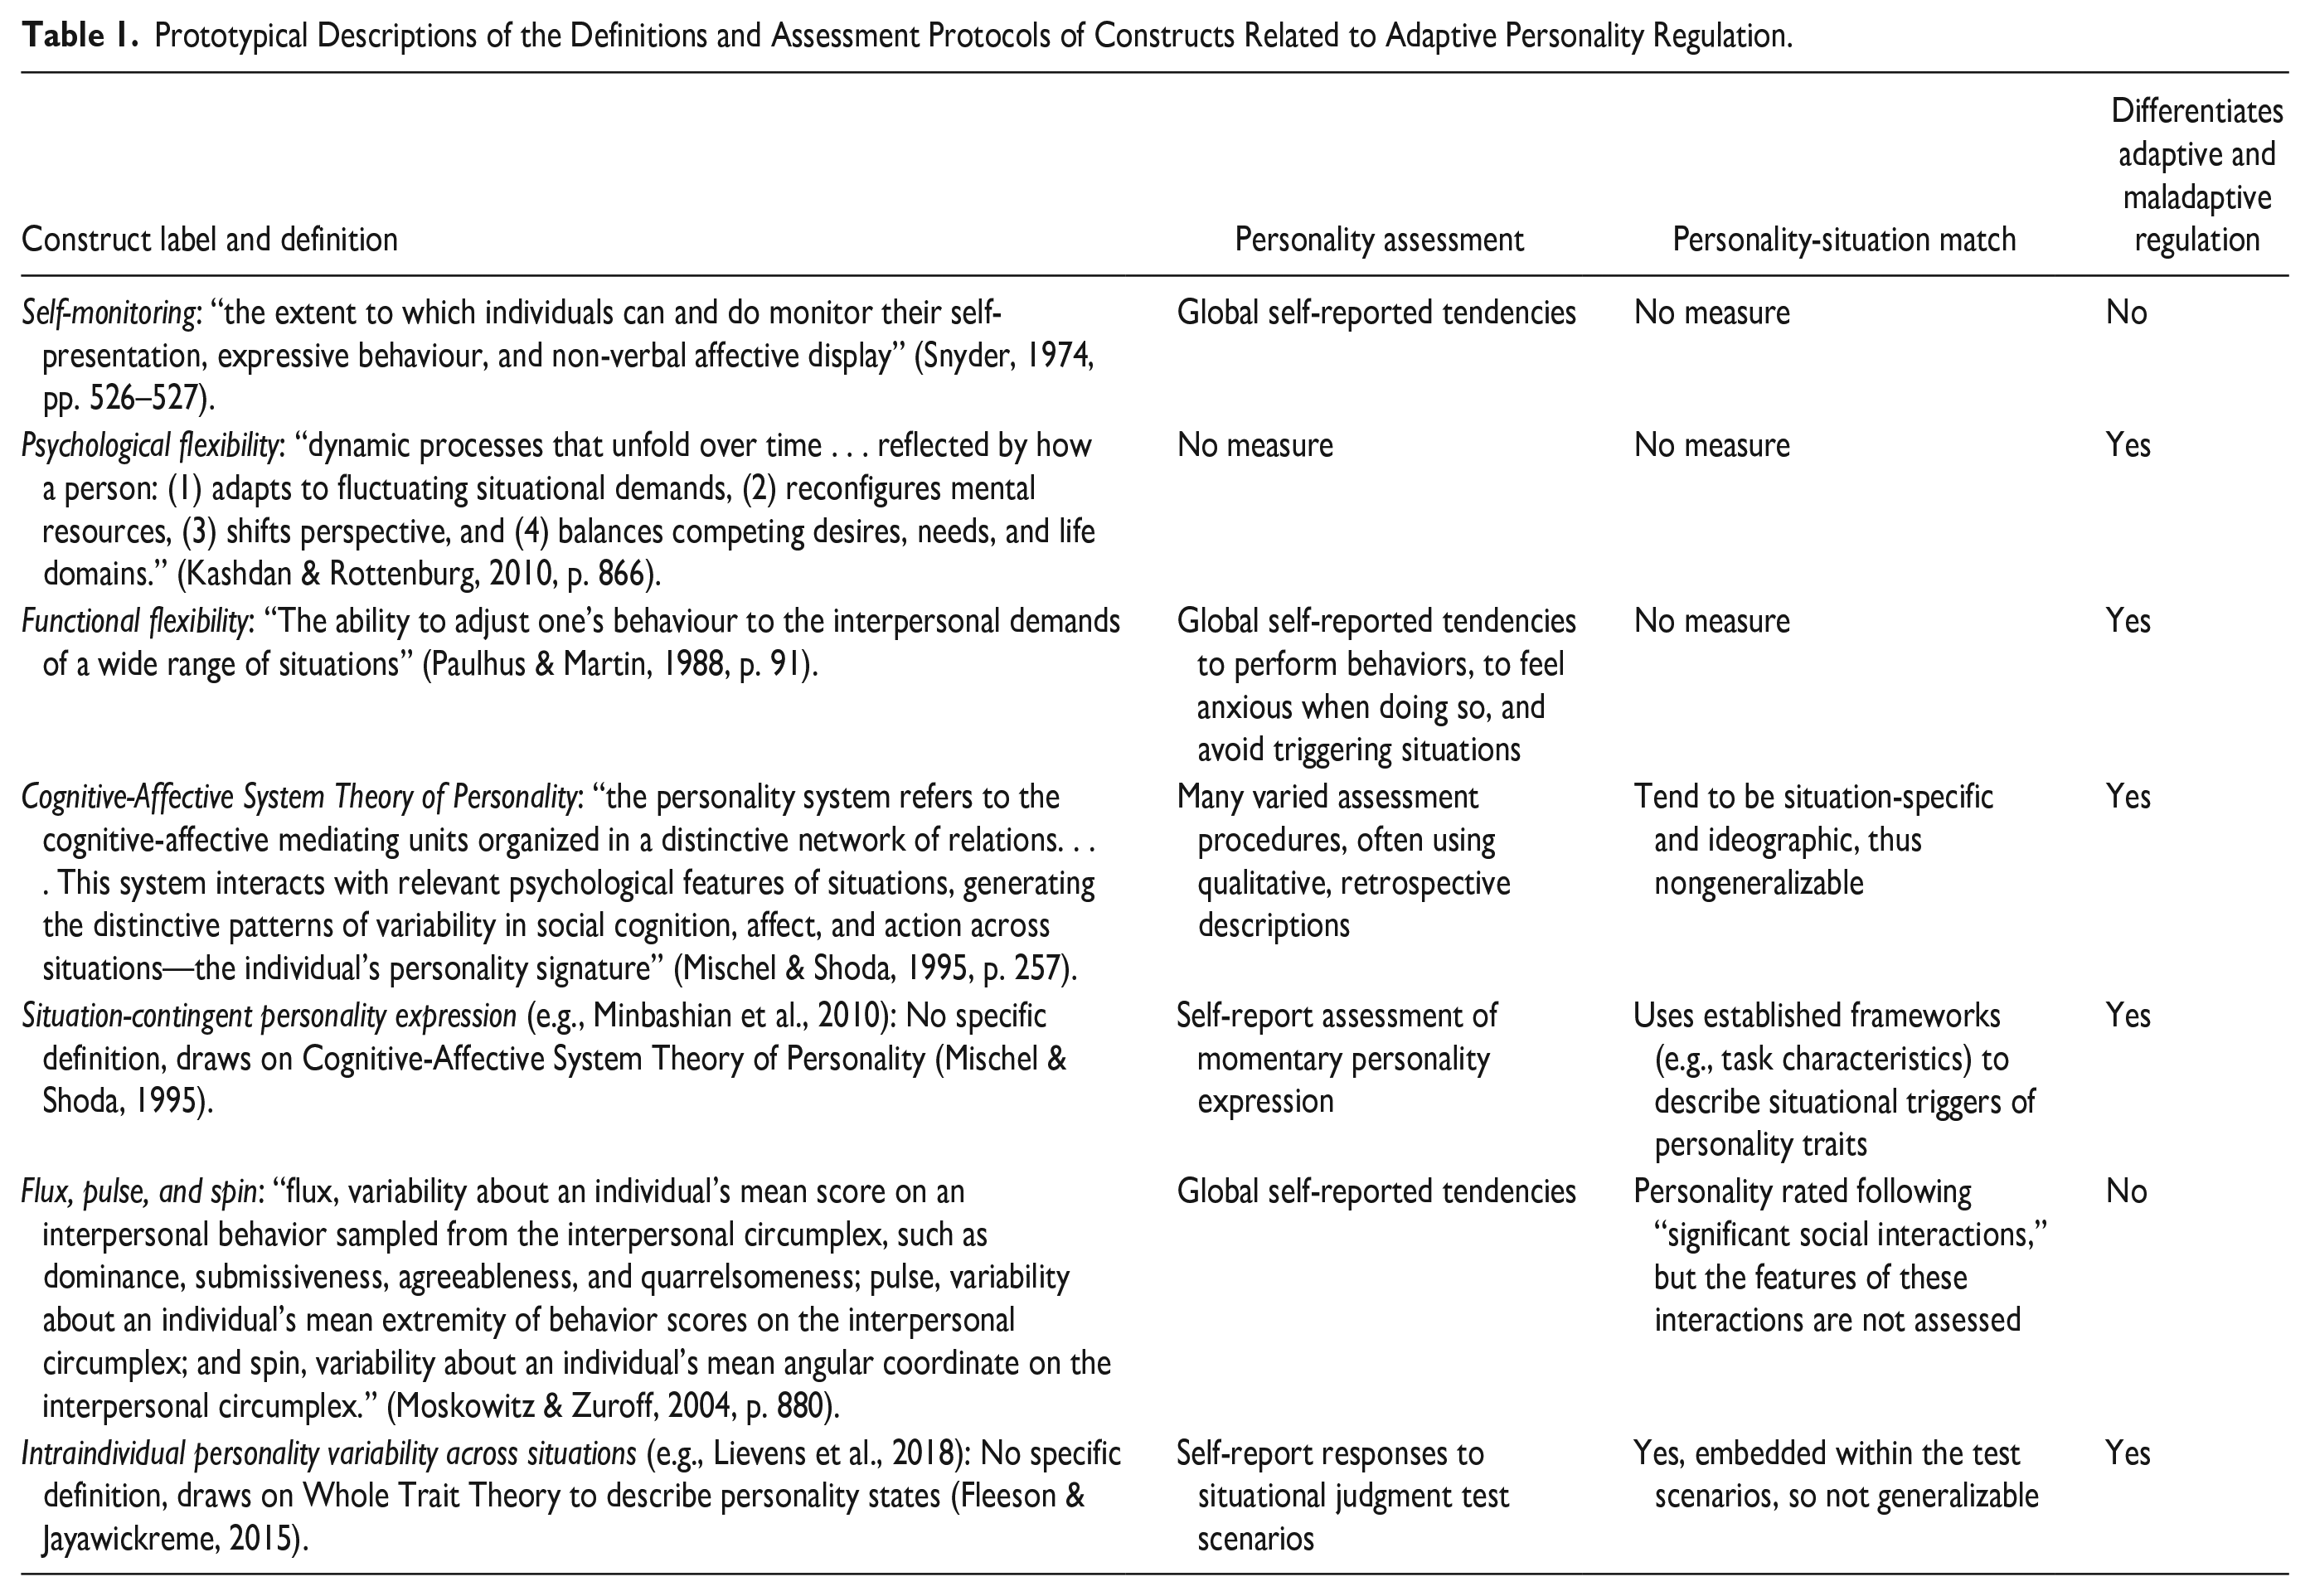
Regarding definition, functional flexibility is “the ability to adjust one’s behavior to the interpersonal demands of a wide range of situations” (Paulhus & Martin, 1988, p. 91)—and one aspect of psychological flexibility—“how a person (1) adapts to fluctuating situational demands” (Kashdan & Rottenberg, 2010, p. 866)—perhaps comes closest to what we think of as adaptive personality regulation. However, both of these conceptions are in different ways circumscribed. Psychological flexibility because it remains theoretical and does not have an associated measure, and functional flexibility because it focuses exclusively on interpersonal situations, whereas the need to regulate personality expression should include all classes of situations, such as when working alone.
Regarding personality assessment, most of the existing approaches utilize static and global self-assessments akin to normal self-report personality inventories (see Table 1). Although such global self-reports can be informative, they are prone to many well-established limitations (e.g., socially desirable responding) and do not provide dynamic assessments of personality. Put simply, we agree with Erickson et al. (2009) who concluded that the Battery of Interpersonal Capabilities (BIC; the assessment tool for functional flexibility) does not measure flexibility and that “this particular personality construct may not be amenable to standard self-report measurement formats” (p. 908). Beyond the use of global self-reports, one other reason that many previous measures have proven suboptimal is that they do not assess whether variation in behavior is adaptive/functional (Lievens et al., 2018; Minbashian et al., 2010) or maladaptive/dysfunctional (Clifton & Kuper, 2011; Côté et al., 2012; Fournier et al., 2009; Zeigler-Hill et al., 2013). To do so, one would need to take account of whether the expressed personality states match situational requirements.
Regarding the assessment of personality-situation match, the most common approach has been to identify “psychologically significant” situational characteristics and to measure their contingent relationships with personality. Early work based on the Cognitive-Affective System Theory of Personality typically took an ad hoc ideographic approach to identifying both relevant situational characteristics and behaviors using retrospective qualitative reports (Mischel & Shoda, 1995; Wright & Mischel, 1987). This work yields rich information but does not yield a generalizable index of adaptive personality regulation that would meet our criteria.
Other approaches have used standardized and generalizable descriptive frameworks such as job characteristics or broader taxonomies of situations (e.g., DIAMONDS, CAPTION, Parrigon et al., 2017; Rauthmann et al., 2014; Riverside Situational Q-Sort, Sauerberger & Funder, 2020) and worked backward to identify relevant personality traits (e.g., Minbashian et al., 2010), somewhat similarly to trait-activation theory (e.g., Holman & Hughes, 2021). One difficulty with using these frameworks to assess adaptive personality regulation is that the line of theoretical inference from situational characteristics to required personality characteristics is in its infancy (Sherman et al., 2015) and requires a convoluted line of inference. For example, using the CAPTIONS model, we might conclude that a situation is high in (a) “Typicality” because it is characterized as “typical, regular, standard” and (b) “Adversity” because it is characterized as “stressful, fatiguing, frustrating.” Next, we would work backward to understand which traits such situations trigger. In the case of typicality, this seems fairly straightforward because the defining characteristics describe conscientiousness. However, in terms of “Adversity,” this is less straightforward because the characteristics arguably describe a mix of neuroticism, disagreeableness, and low extraversion. Similar difficulties are evident with other situational models.
A simpler approach, which we favor, is to assess situational requirements directly in terms of expert ratings of the personality states needed to facilitate successful goal attainment. For example, successful networking (i.e., meeting and attempting to befriend strangers) is likely to require the expression of a range of extraverted behaviors and would be rated accordingly. Interestingly, this was exactly the approach adopted in a study of transactions between personality and occupational roles (Denissen et al., 2014), which found that ratings of optimal personality profiles of jobs (i.e., the traits or trait expressions required to perform successfully) are very reliable whether made by experts or amateurs.
The Current Study 1
Our goal is to identify an index of adaptive personality regulation, which we define as the ability or propensity to express personality to meet situational requirements. The literature reviewed above supports the contention that, although many conceptually similar constructs and measures exist, none meet our criteria as a measure of adaptive regulation. We now propose a general framework.
First, we avoid global self-reports of typical tendencies and instead directly assess behavior. Second, to assess whether variation in personality expression is adaptive or maladaptive, we must take account of whether the expressed personality states match situational requirements. Third, we should adopt standardized and generalizable frameworks. Fourth, these frameworks should be intuitive and preclude convoluted processes of inference when matching situations and required personality expression. Accordingly, we propose to measure adaptive personality regulation by observing individuals in situ and assessing the extent to which (a) their expressed personality (b) approximates expert ratings of the personality expression required within the situation. Henceforth, we will refer to this approach to measuring adaptive personality regulation as the APR index. For clarity, we provide a general expression for the calculation of the APR index:
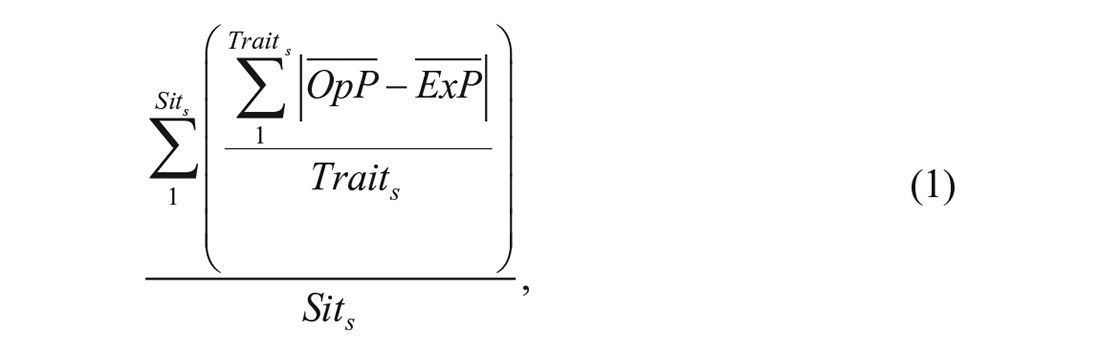
where
The question now arises as to what form of evidence would support this approach to conceptualizing adaptive personality regulation. First, and most fundamentally, is that individuals shift their expression of personality according to situational requirements. There is already a substantial body of evidence supporting this contention (see above). Nevertheless, we must establish this in the current framework:
Second, although many systems might be involved in regulating personality expression, we posit adaptive personality regulation as an index of a general ability to regulate personality across situations. Thus, we predict that those who are able to regulate one trait in one situation will be able to regulate a second trait in a second situation, which will give rise to a common or general factor. This prediction is in line with studies of the structure of intraindividual variability that also support a general factor (e.g., Baird et al., 2006):
Third, as we discussed earlier, introducing novel concepts, terms, or labels without good cause hinders rather than helps psychological science. Thus, “discriminant [validity] evidence is particularly important for showing that a new measure is actually new and preventing construct proliferation . . . which occurs when ostensibly new constructs are proposed that are theoretically and/or empirically indistinguishable from existing constructs” (Hughes, 2018, p. 771). Thus, we provide robust tests of what is traditionally termed “discriminant validity” by examining whether adaptive personality regulation differs from conceptually similar constructs (Le et al., 2010; Shaffer et al., 2016). Specifically, we examine whether adaptive personality is discriminant from mean-level personality and self-monitoring (Snyder, 1974), with the latter providing one measure of goal-directed regulation of personality expression:
In addition to capturing unique variance (i.e., being discriminant) in describing behavior, for the APR index to be of value, it must also explain unique variance in relevant outcomes (Hughes, 2018). The expectation is that the APR index will predict task/job performance. 2 The Big 5 broad personality factors predict job performance, but weakly (coefficients from .07 to .24; Barrick et al., 2001). However, the “predictive validity” of personality can be improved using other ratings, facets rather than broad factors, and by measuring specific rather than broad performance criteria (see Hughes & Batey, 2017, for review). One reason that mean-level personality provides underwhelming prediction likely stems from the fact that most jobs require performance in multiple domains/situations, thus requiring adaptive personality regulation:
We now present two studies in which we examined these hypotheses and the potential suitability of the APR index as a measure of adaptive personality regulation. In both, we observed people in situations that differed in terms of the personality expression required and assessed the degree to which they expressed the relevant personality. Study 1 was a laboratory experiment and Study 2 was a real-world, high-stakes, job performance setting, namely, observing comedians perform live at one of the premier venues in the United Kingdom.
Study 1 Method
Design
The key feature of adaptive personality regulation is that people shift their personality to meet situational requirements. Thus, we used a repeated measures design in which participants would have to express different levels of personality to succeed. We chose tasks that required large shifts in the levels of expressed extraversion. Specifically, we observed participants in two experimental conditions, that represented “strong situations”, and were unambiguous regarding the requirements for success (Judge & Zapata, 2015): first, a networking condition in which participants were tasked with being the “most memorable person in the room”, and second, an independent working condition in which participants were tasked with scoring a number of test responses.
These tasks likely require regulation of multiple traits. However, we focused on extraversion because it is included in the majority of personality models (Funder, 2004), and according to the realistic accuracy model (Funder, 1995, 2012), expressions of extraverted traits are readily observable and well suited to observational ratings. By contrast, facets of conscientiousness (e.g., detail-consciousness), which might help in the scoring task, are difficult to observe (Funder, 1995, 2012).
Sample
We used G*Power 3.1.9.4 to conduct a series of a priori power analyses for each study hypothesis. Following current recommendations (Funder & Ozer, 2019; Lakens, 2013), we set alpha to a level of .05, power to .80, and the effect size to f = .204 (i.e., r = .2), representing a medium effect. H1 concerns a test of two dependent means (i.e., repeated measures or matched pairs t test) for which G*Power recommended a minimum required sample of N = 27. H3 concerns tests of discriminant validity through the assessment of bivariate correlations, for which G*Power recommended a minimum required sample of N = 118. H4 concerns the incremental validity of the APR index above six other variables (i.e., mean-level big five and self-monitoring) within a linear multiple regression, for which G*Power recommended a minimum required sample of N = 78. For H2, which concerned a test of the fit of a single-factor CFA, we used the power calculation procedures of Preacher and Coffman (2006). MacCallum et al. (2006) recommend the calculation of power based on a range of plausible models. In this instance, we did not have strong a priori predictions concerning the magnitude of the factor loadings and so estimated required power based on simulation models that adopt moderate loadings (e.g., Hu & Bentler, 1998, 1999) and large loadings (McNeish et al., 2017), respectively. With moderate loadings, models are considered to fit with root mean square error of approximation (RMSEA) values of approximately .05 with values greater than .1 indicating model misfit (Hu & Bentler, 1998, 1999). When loadings are large, models are considered to fit with RMSEA values of approximately .1 with values greater than .2 indicating model misfit (McNeish et al., 2017). According to these power calculations, minimum samples sizes of 245 for a model with moderate loadings and 62 for large loadings were required.
In practice, the initial sample comprised 99 participants, which was reduced to 88 due to failures in video-recording equipment. Of the final sample, 32 (36.4%) were male, 55 (62.5%) female, with one missing value. The mean age was 27.90 (SD = 6.53). With respect to educational level, 63.6% had a postgraduate university education, 20.5% had undergraduate university education, 4.5% had nonuniversity higher education, and 10.2% had secondary school education to age 18. Thus, the sample surpassed the minimum required N in most cases, but not all, meaning that we generally had adequate power to detect the specific effects hypothesized in this study. However, it must be noted that all power calculations are estimates and the power analyses conducted here pertain to the detection of significant medium-sized effects (i.e., r = .2 or greater) rather than precise estimates of the true population parameter. To estimate the true population parameter, much larger sample sizes are required (Lakens, 2013). However, the current sample is close to adequate for the focal hypotheses tested.
Procedure
Participants were recruited via student email contact lists from the University of Manchester, Department of Humanities and via Facebook advertisements. Those who indicated their willingness to participate were contacted by telephone or message and invited to one of the prescheduled laboratory sessions at the Alliance Manchester Business School. Prior to the experimental session, participants completed online self-report measures of Self-Monitoring (Snyder, 1974), the Big Five Inventory (BFI; John et al., 1991), and demographic items. Participants received a £10 Amazon voucher.
During the experimental session, participants were seated at a table with five people (three participants and two confederates recruited from the University drama society). Each participant first completed a consent form approved by the university ethics committee.
The participants then took part in the memorability task. The memorability task, which required participants to be the most memorable person in the room and lasted 5 min. Participants were instructed that
Your task is to be the most memorable person in the room. You need to get people to pay attention to you and remember as many [of the ten facts] about you as possible. If you do not know the answer to any of these questions you can make them up for the purpose of this exercise. (See Supplementary Materials, “Study 1 task materials” for the full details)
The scoring task involved scoring response sheets for a putative 40-item questionnaire and lasted 9 min. Participants were instructed that
. . .you will be taking part in a “speed and accuracy” exercise. You have been provided with some completed response sheets to a questionnaire (you do not have the question sheets). Your task is to score these as quickly and accurately as possible.
During this time, the confederates attempted to engage participants in conversation, thus encouraging extraverted behavior, which was dysfunctional with respect to high performance on this task. Although the confederates had no active role in the first task, they took part in both tasks to preserve their appearance as genuine participants. The behavior of each participant was videotaped for the full duration of both sessions, using two cameras, each positioned face-on (see Supplementary Materials for full experimental protocols and instructions).
Measures
The following measures were derived from the pre-experiment online questionnaire.
Self-Monitoring
We used Snyder and Gangestad’s (1986) 18-item scale. Each item was rated as true or false. A meta-analysis has reported a sample weighted reliability of .73 for this scale (Day et al., 2002), and in an extensive review, Gangestad and Snyder (2000) argued that the general factor conforms most closely to the construct of self-monitoring; thus, the scale score equated to the mean item score.
Self-Reported Personality
Self-ratings of mean-level personality were gathered using the BFI (John et al., 1991). The BFI comprises 44 items assessing extraversion, neuroticism, openness, conscientiousness, and agreeableness. Participants respond using a 5-point Likert-type scale (1 = strongly disagree, 5 = strongly agree). The BFI demonstrates strong internal consistency (α ≈ .83), a clear factor structure, and convergence with other Big 5 measures (John & Srivastava, 1999). In the current Study, Cronbach alpha reliabilities ranged from .76 to .85 with an average of .81.
The following measures were derived from the experimental tasks and subsequent observations.
Task Performance
Memorability Criterion
Eight raters were recruited to assess the memorability of participants. All raters were educated to undergraduate degree or above and all were working in a professional role that required team working within consequential and high-pressure situations. Thus, they were well attuned to processing real-time verbal information. Each rater received one-to-one training conducted by the authors, which involved briefing them on the procedure (i.e., what they would see, notes could not be taken, and how to complete the form after watching the video) but not the study goals. Raters were shown an example video (not one that was to be included in the subset they were rating) and completed their ratings as a form of direct training. There was also the opportunity for them to ask questions before the rating began. After training, the eight raters were organized into pairs and each pair viewed approximately one quarter of the recordings. Immediately after viewing each recording, the raters recorded the information they could recall about each participant. Each participant had been instructed to communicate 10 facts about themselves (e.g., birthday month, favorite drink, nature of their last night out; see Supplemental Materials for full list), so the maximum score was 10. Interrater reliabilities within the pairs, estimated using Spearman’s rho, ranged from rs = .59 to .71 with an average of .66.
Test-Scoring Criterion
Performance in Task 2 was assessed by summing the total number of subscales scored by the participant.
Adaptive Personality Regulation
Two experts in personality rated the videotapes of all 88 participants for level of expressed extraversion using seven of the corresponding BFI items (John et al., 1991, 2008). The items were rated on a 5-point scale ranging from strongly disagree to strongly agree (for details, see Supplemental Materials—Study 1 rating form), which were scored from 0 to 4. We used these ratings to calculate the APR index following Equation 1. Specifically, we subtracted the mean ratings of expressed personality from ratings of the optimal level of expressed personality (i.e., maximum extraversion in Task 1 and minimum extraversion in Task 2), for each personality item. This generated an item-level APR index. We then took the modulus (to remove the signs) of the item-level APR index scores and averaged them to create a total APR index. In this study, the APR index had a mean of 2.73 and a standard deviation of 0.45, on the 0 to 4 scale.
Analysis
Scale Scoring
All analyses were carried out using Mplus version 8.2. We used confirmatory factor models to test Hypotheses 1 (participants should shift in their personality expression) and 2 (the APR index should conform to a single factor), given that they provide stringent tests of the psychometric properties of constructs (Booth & Hughes, 2014). However, to maintain consistency with conventional scoring of self-monitoring and the BFI, all predictor variables in the multiple regressions were represented by observed scores calculated as the average of the item scores.
Estimators
When analyzing ordinal data, we used the Weighted Least Squares Means and Variances (WLSMV) estimator because simulations have supported the consistency, efficiency and unbiasedness of its parameter estimates (Flora & Curran, 2004; Wirth & Edwards, 2007). For similar reasons, we preferred the maximum likelihood estimator with non-normality corrections (MLR), when using scale scores, as these provide an approximation to continuous measurement (Yuan & Bentler, 2000). For the cross-classified mixed effects models, we used a Bayes estimator (Nestler & Back, 2017).
Goodness of Fit
We considered acceptable model fit to be indicated by values of ≤.08 for the RMSEA and standardized root mean square residual (SRMR), and ≥.90 for the Tucker–Lewis index (TLI) and comparative fit index (CFI; Hu & Bentler, 1999; Schermelleh-Engel, et al., 2003).
Results
Correlations and descriptive statistics for all Study 1 variables are shown in Supplemental Materials, Table S1.
H1: Individuals Shift Their Expression of Personality to Conform to Situational Requirements
The memorability task required high levels of extraversion to achieve the goal of being “the most memorable person,” whereas the scoring task required low levels of extraversion to achieve the goal of scoring the maximum number of tests. To examine shift, we applied an intraindividual CFA to the averaged extraversion ratings from Tasks 1 and 2 (Adolf et al., 2014). First, we tested for measurement invariance because for comparison of latent mean scores to be meaningful; configural, metric, and scalar invariance must hold (Chen, 2007; Millsap & Tein, 2004). Following Millsap and Tein’s (2004) procedure for ordered categorical variables and applying Chen’s (2007) fit criteria, configural invariance, partial metric invariance, and partial scalar invariance were supported (see Table 2).
Fit Indices for Invariance Tests.
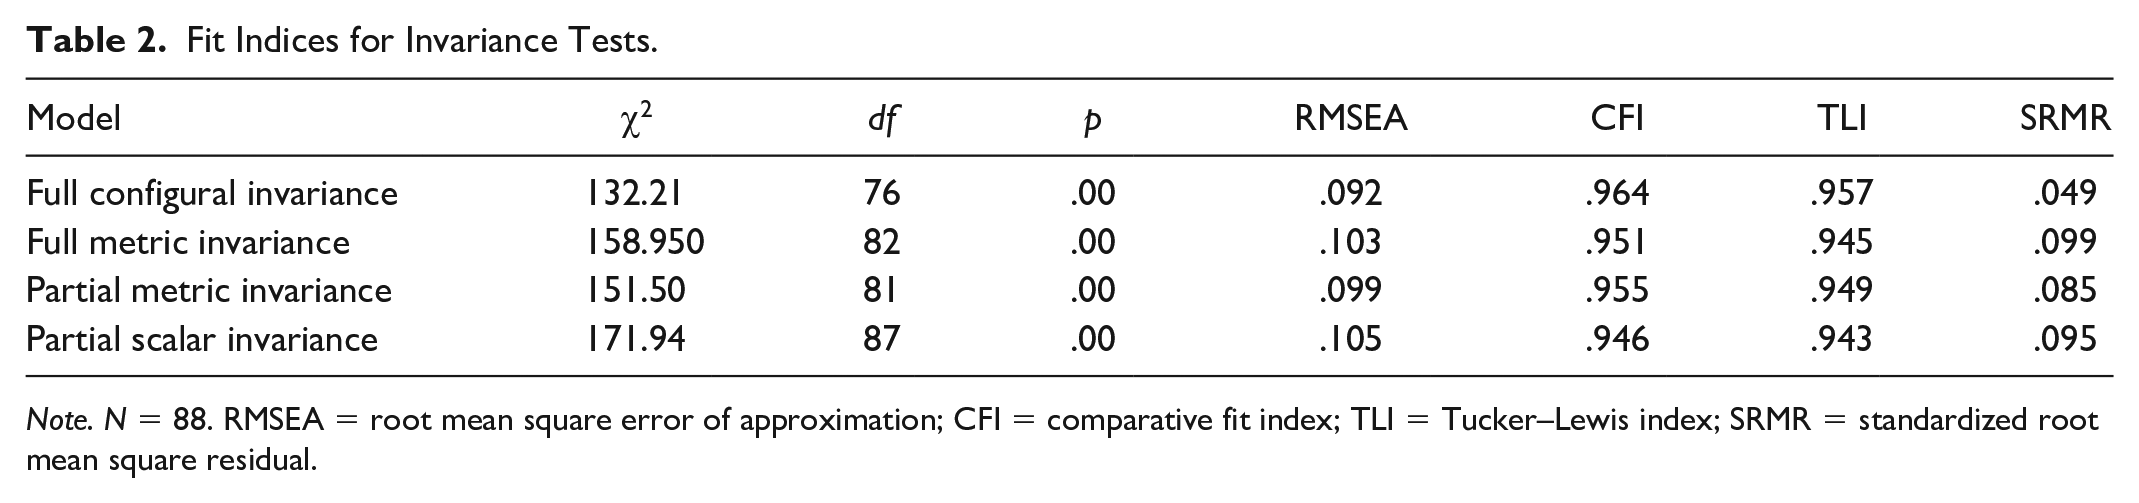
Note. N = 88. RMSEA = root mean square error of approximation; CFI = comparative fit index; TLI = Tucker–Lewis index; SRMR = standardized root mean square residual.
The standardized factor loadings of the partially scalar invariant solution are shown in Table 3. The item measuring assertiveness was noninvariant, probably because in Task 2, it was unobservable, as participants worked largely in silence. Thus, it was removed from the estimate of mean shift.
Standardized Factor Loadings for Task 1 and Task 2 Extraversion: Scalar Invariant.
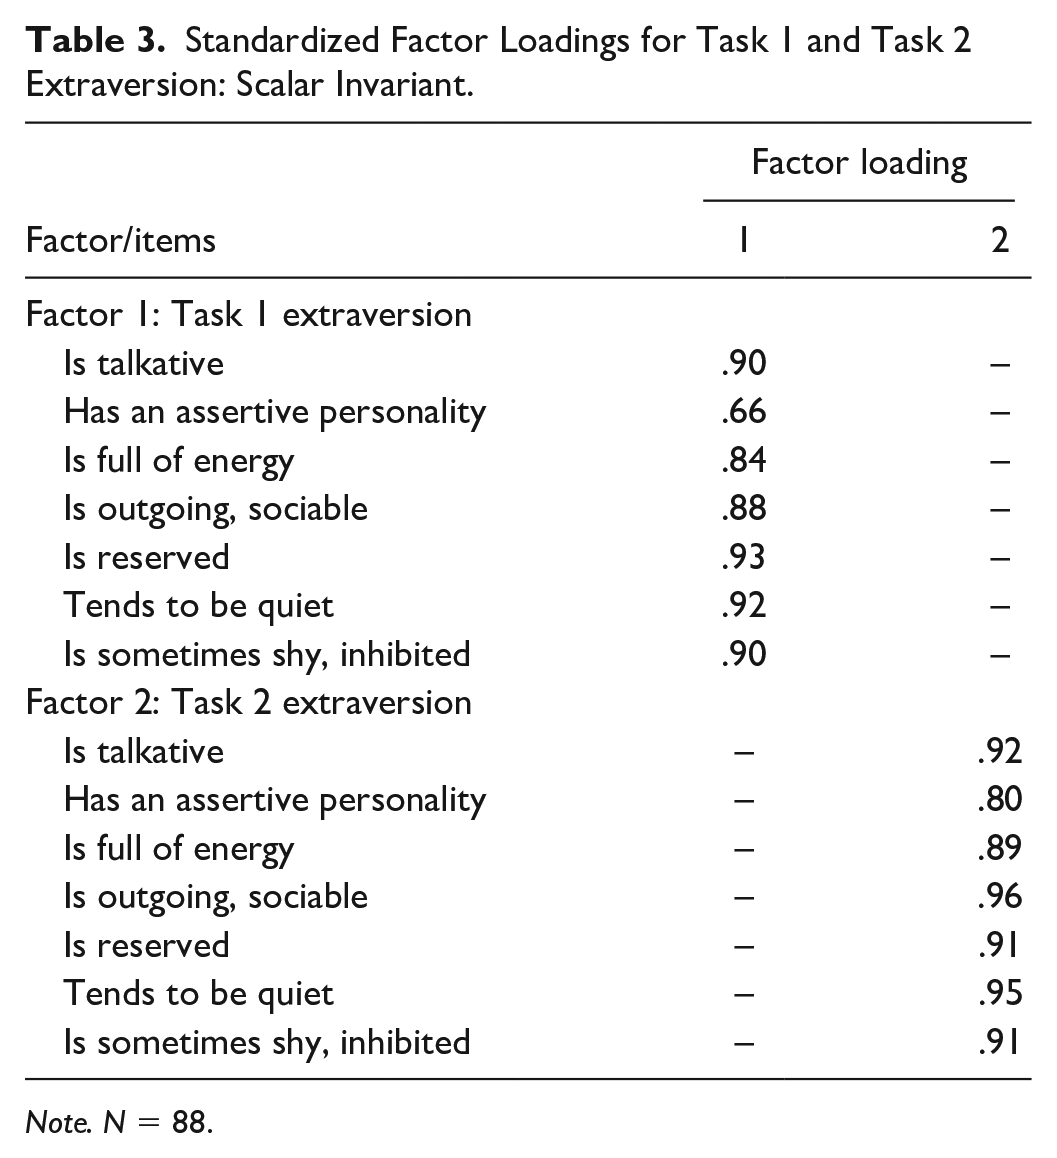
Note. N = 88.
The mean shift in extraversion scores from Task 1 to 2 was estimated at d = −1.43 [–1.74, –1.18]. Cohen (1988) describes a d score of ≥.8 as large, so the observed shift from extraversion in Task 1 to introversion in Task 2 is very large. Table 4 provides descriptive statistics for the mean shift in observed extraversion scores on a scale from 0 to 4. It may be concluded that the observed shift is highly variable, and very large in some cases, but never achieves the maximum possible.
Shift in Extraversion Scores From the Memorability to the Scoring Task.
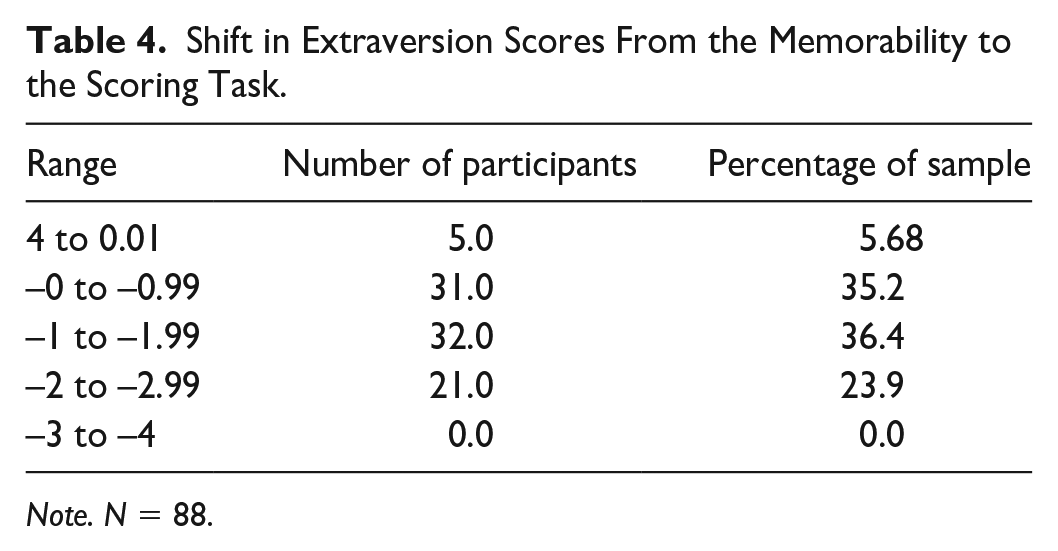
Note. N = 88.
H2. The APR Index Should Conform to a Single-Factor Model
As explained above, we calculated “match scores” (i.e., the difference between “ideal personality expression” and “rated personality expression”) for each of the BFI items and averaged the “match” scores across both raters and tasks. These average match scores constituted the indicators of adaptive personality regulation and were entered into a single-factor CFA. The model showed close fit with respect to three of the fit statistics, with the RMSEA marginally above the cut-off indicative of close fit (χ2 = 24.17, df = 14, p = .04, CFI = .98, TLI = .97, RMSEA = .091 [.015–.150], SRMR = .027). However, the RMSEA tends to overreject models when factor loadings are large (McNeish et al., 2017), which is the case here (see Table 5). Thus, the APR index conforms to a single factor and the large loadings, high average variance extracted (AVE), and reliability all support its psychometric robustness (Table 5).
Standardized Factor Loadings on Adaptive Personality Regulation of Average Ratings of Expressed Extraversion.
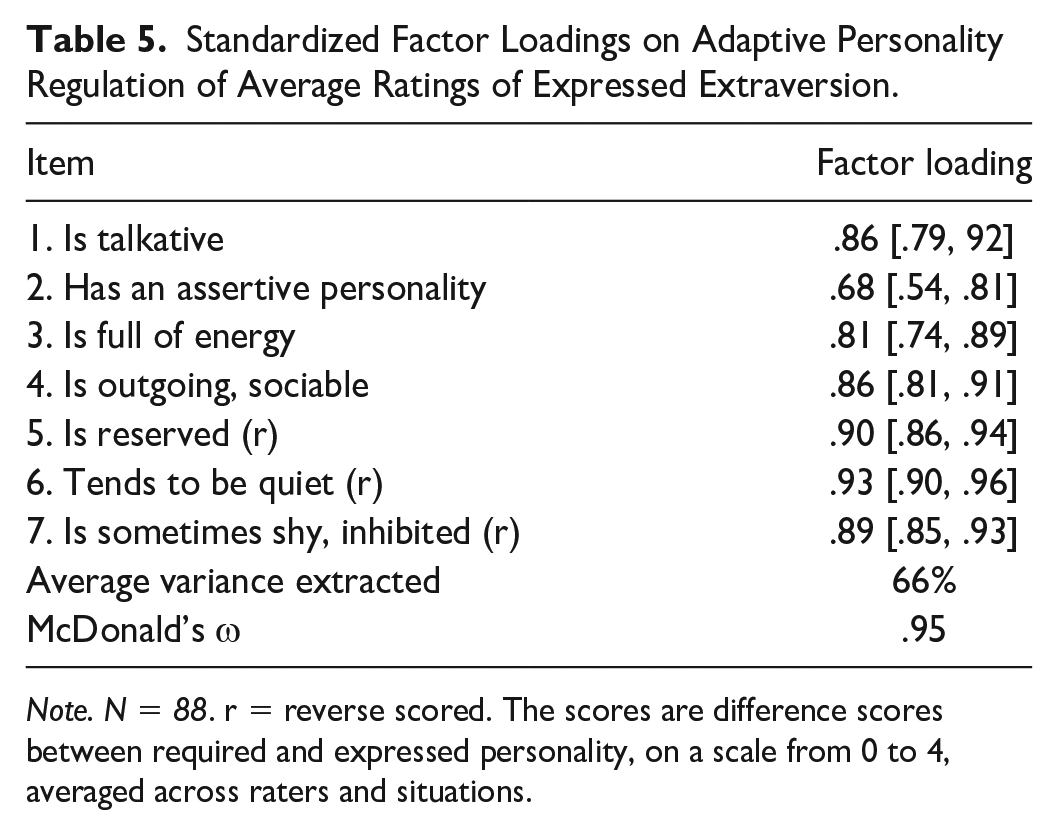
Note. N = 88. r = reverse scored. The scores are difference scores between required and expressed personality, on a scale from 0 to 4, averaged across raters and situations.
H3. The APR index Should Show Discriminant Validity With Respect to Mean-Level Personality, and Self-Monitoring
Discriminant validity evidence was obtained when two criteria were met: first, when the APR index correlated with the other variables at less than r = .85 (Shaffer et al., 2016) and second, when the correlation between the two variables was less than the square root of the average variance extracted of each variable (Henseler et al., 2015). Both tests are convincingly satisfied; indeed, all correlations are not significantly different from zero (Table 6).
Correlations, and Square Root of AVE, for the APR Index With Self-Monitoring and Mean-Level Personality.
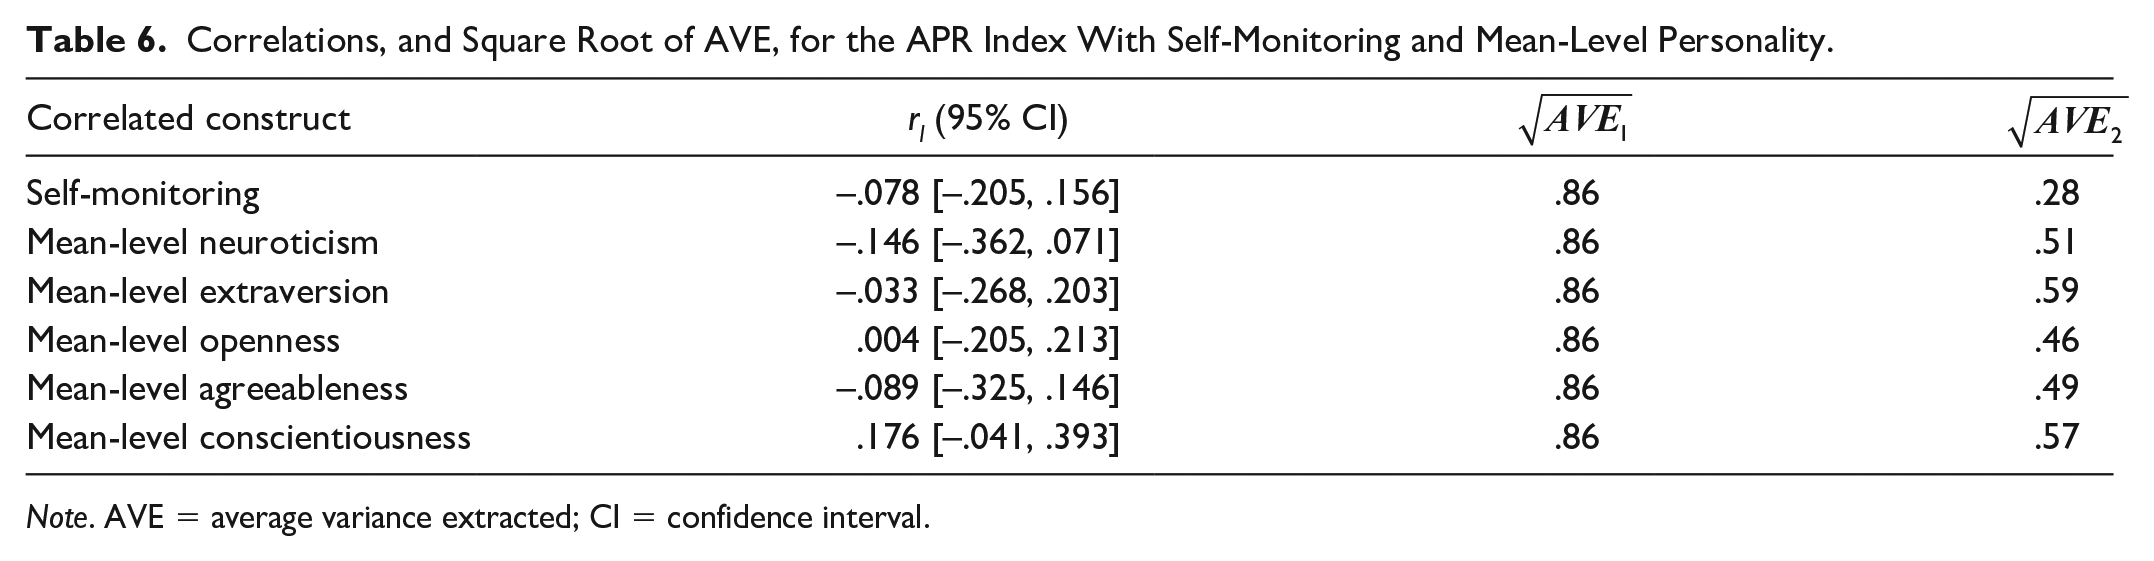
Note. AVE = average variance extracted; CI = confidence interval.
H4. The APR Index Will Show Concurrent and Incremental Prediction of Task Performance Compared With Mean-Level Personality and Self-Monitoring
Memorability Task
We used cross-classified mixed effects models (CC-MM; Nestler & Back, 2017) to estimate the regression models because the memorability scores are nested in two sources of nonindependence: participants and raters. First, we examined the proportion of variance (i.e., intraclass correlation) in the memorability scores, due to participants (.67), raters (.05), and the residual (.28), showing that a substantial proportion of variance in scores was due to participants, which is required for the subsequent regressions to be meaningful. Second, we regressed the memorability criterion (i.e., the number of facts recalled by the raters) from the memorability task onto mean-level personality and self-monitoring (Model 1.1, Table 7). Second, we added in the APR index as a predictor (Model 1.2, Table 7). In the first model, only mean-level extraversion was a significant predictor and the overall model accounted for 20.6% of the variance. When added to the regression equation, the APR index was the largest predictor and explained an additional 4.9% variance in performance.
Regression Models of Memory Score for 10 Facts From the Most Memorable Person Task 1, and Test Scores From Task 2, on Self-Monitoring, Mean-Level Personality, and Adaptive Personality Regulation.
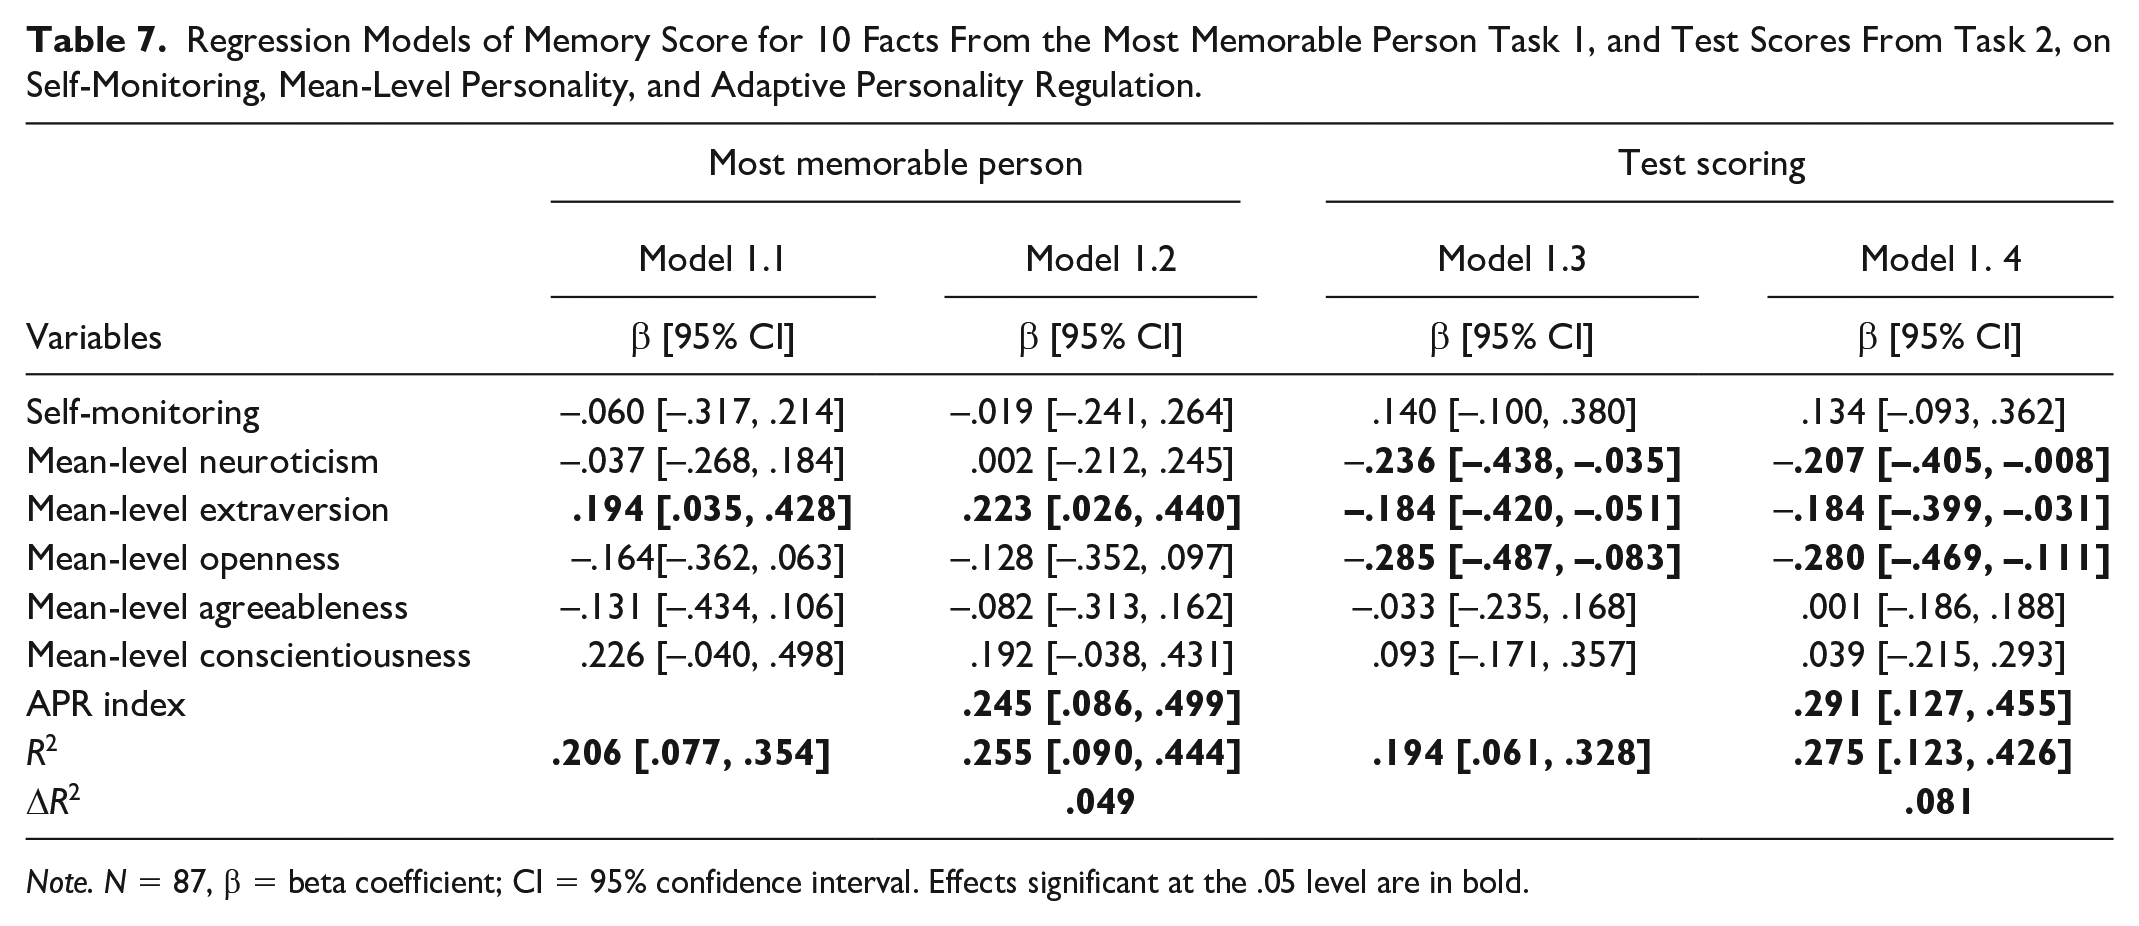
Note. N = 87, β = beta coefficient; CI = 95% confidence interval. Effects significant at the .05 level are in bold.
Scoring Task
We regressed the test-scoring criterion (i.e., the number of tests scored in the allotted time) onto mean-level personality and self-monitoring in one model, and then added the APR index in a second. From the model that comprised mean-level personality and self-monitoring (Model 1.3, Table 7), Neuroticism, Extraversion, and Openness were significant and negative predictors of performance. Again, when added to the regression equation, the APR index was the largest predictor and explained an additional 8.1% variance in performance.
Study 1: Discussion
To a substantial degree, the results of Study 1 support the four hypotheses. First, as predicted, and has been shown in many other studies (e.g., Fleeson & Gallagher, 2009; Sauerberger & Funder, 2017), individuals’ expression of personality shifted across situations in line with situational requirements, and on average, they showed a very large degree of shift, in terms of Cohen’s (1988) effect size criteria. Here, we observed high and low levels of extraversion. An additional and novel observation was that when the required expression of personality is diametrically opposite (i.e., at both extremes of the trait spectrum), that individuals vary greatly in their degree of shift from none at all, to large.
Second, the APR index, which assessed the degree to which expressed personality matched with expert ratings of the optimal levels of personality expression, conformed to a single-factor CFA model with excellent psychometric properties. Calculation of the APR index revealed a range of individual differences whereby for some, personality expression was close to the optimal levels, whereas for others, it was not.
Third, discriminant validity evidence demonstrated that the APR index was distinct from self-monitoring and mean-level personality. Indeed, the correlations were near-zero meaning that the APR index captures novel variance.
Fourth, the unique and novel variance captured by the APR index proved useful, explaining nontrivial levels of incremental variance in task performance compared with mean-level personality and self-monitoring.
Overall, the psychometric properties, correlations, and predictive capacity of the APR index provide initial support for its accuracy and appropriateness as a measure of adaptive personality regulation.
Study 2
Study 2 was devised to investigate a number of the same hypotheses as Study 1, but within a real-world, high-stakes scenario, namely, by studying comedians performing stand-up comedy. Specifically, we examined whether the APR index conforms to a single-factor structure (H2), is discriminant from mean-level personality and self-monitoring (H3), and offers concurrent and incremental prediction of task performance (H4). The methodology was also similar, but represented an advance in three ways that we expected would enhance ecological validity, relative to Study 1.
First, Study 1 examined adaptive personality regulation using a convenience sample within a controlled but relatively contrived environment. In contrast, Study 2 examined adaptive personality regulation using adult comedians in a real-world, high-stakes, job performance setting, namely, watching them perform live at one of the two pre-eminent U.K. comedy establishments (Irwing et al., 2020). For professional comedians, stage performances comprise a key part of their job that can “make or break” their career. Thus, the comedians are exhibiting a practiced skill and their motivation is high.
Second, the video recordings we used to assess adaptive personality regulation and level of performance were routinely recorded by the comedy venue, so it seems likely that there were minimal study-specific demand characteristics associated with gathering these data (Orne, 1962). Although effects of demand characteristics, evaluation apprehension, and other artifacts induced by taking part in research can never be fully eliminated, the high-stakes nature of the comedians’ performance should have acted as a strong counterbalance to minimize such effects (Orne, 1962).
Third, the ratings of task performance (i.e., success of the stand-up performance) were taken from subject matter experts, namely, comedy professionals of considerable experience and stature within the industry.
In addition, in Study 1 we were able to show that the APR index, averaged across scenarios that required high and low extraversion, conformed to a single factor, thus suggesting that adaptive regulation of personality generalizes across situations. An important advance in Study 2 was that we were able to investigate adaptive personality regulation with regard to all dimensions of the Big 5, not just extraversion, because facets from each domain were judged to be important to comedic performance, and observable (Funder, 2012). Accordingly, we were able to test the extent to which adaptive personality regulation generalized across the Big 5 dimensions and to determine whether the resultant APR index still conformed to a single-factor model.
Method
Participants
An a priori power analysis using G*Power 3.1.9.4, testing for R2 increase in a linear multiple regression fixed model, with seven predictor variables, with alpha = .05, power = .80, and effect size of f = .204 (i.e., r = .2) (Funder & Ozer, 2019; Lakens, 2013) suggested a minimum sample of N = 78. In practice, the recruited sample comprised 206 comedians, 77 professional comedians (67 males, 10 females, Mage = 42.5, SD = 9.4) and 126 amateur comedians (107 males, 18 females, one missing, Mage = 35.4, SD = 8.57). Thus, our sample exceeded the minimum required N. In some cases, there were small amounts of missing data, and in some cases, we had additional data, which are noted in the tables. Professional comedians were employed to perform at a “new material” show or were the master of ceremonies at an amateur comedian night. Amateur comedians worked, unpaid, at a professional “gong show.” Both groups were operating in a high-stakes situation, the professionals to further their career and the amateurs to establish one.
Procedure
Comedians were contacted via email by the club’s general manager and/or in person on the night of their performance. Participants consented to have their performance recorded by the comedy club and completed the BFI and self-monitoring scales. All, except gong show participants, completed the questionnaire on the night of their performance in the comedy club dressing room. Gong show participants were emailed the questionnaire, which they completed within 2 weeks of their performance. A test of whether completing the BFI on the night or at home biased responses found a nonsignificant Hotelling’s T (V = .051, F = 1.20, df1 = 5, df2 = 112, p = .31), with follow-up tests similarly nonsignificant, suggesting little-no bias resulted from the location in which the questionnaires were completed.
With the comedians’ agreement, two experts viewed and rated a 5-min sample of their videoed performance. However, for gong show comedians, the sample only lasted until they were “gonged.” The experts were an internationally successful comedian and the comedy club’s Technical Director.
Measures
Self-Reported Personality
We used the BFI (John & Srivastava, 1999). In this study, Cronbach’s alpha reliabilities ranged from .74 to .84 with an average of .80.
Self-Monitoring
We used Snyder and Gangestad’s (1986) 18-item scale. In the current study, the Cronbach’s alpha was .67.
Comedic Performance Scale
The measurement of job performance represents a key problem in organizational psychology that arguably has never been fully resolved (Campbell & Wiernik, 2015) and none of the major attempts to develop universal frameworks (e.g., Bartram, 2005) applies very well to the stage performance of comedians. For this reason, we developed a dedicated measure.
Twelve subject matter experts, who had multiple roles in the comedy industry, including reviewer, headline comedian, agent, television comedy producer, promoter, and festival director were asked to list “as many criteria as you can think of to assess a comedian’s stage performance.” The resultant list conformed to five categories: material, delivery, stagecraft, off-stage professionalism, and audience response (see Supplementary Materials). The recordings of the comedians’ stage performance did not allow us to assess off-stage professionalism or the audience response, so we asked the expert raters (the same two industry experts who rated other aspects of the videoed performance of comedians) to rate six items, two each with regard to material, delivery, and stagecraft, on a 7-point scale ranging from strong disagreement (1) to strong agreement (7). A CFA supported this three-factor structure, and a known-groups design provided evidence of construct validity (see Supplementary Materials).
Adaptive Personality Regulation
Ten comedy-relevant facets of personality formed the basis of the observations that were used to develop the APR index. To identify these, we interviewed the 12 subject matter experts noted above. The 30 NEO-PI-R (Revised NEO Personality Inventory; Costa & McCrae, 1992) facets were described to interviewees. In response to each, interviewees were asked to indicate whether the facet (a) is observable when comedians perform and (b) impacts comedians’ effectiveness. Ten facets met both criteria: Angry Hostility, Straightforwardness, Self-consciousness, Assertiveness, Ideas, Compliance, Self-discipline, Anxiety, Deliberation, and Impulsiveness.
For the observations that formed the basis of the APR index, the poles of each facet were defined and combined with a 10-point scale where 1 denoted the low end of the facet and 10 denoted the high end. Each facet together with its response scale was presented twice. In response to the first, the two experts were asked to indicate the level that was required for the comedians’ performance, to achieve as high a level of success as possible. In response to the second, they rated the comedians’ expressed behavior in relation to the facet. The reliability of the mean ratings of situational requirements with respect to the 10 facets was 0.86 across the two sets of expert ratings. To control for the possibility that, requiring the two experts to rate both required and observed behavior, may have created a method artifact, we obtained a further sample of 11 professional comedians who provided independent ratings of required behavior. The means of the two sets of ratings correlated at .99. As the original ratings were recorded immediately after watching the videos of stage performances (about 180 times), and were, therefore, not subject to memory biases, we used these ratings.
The expert ratings were used to calculate the APR index, in line with Equation 1, essentially adopting the same scoring approach as described in Study 1, but with one additional step because we assessed adaptive personality regulation across each of the Big 5. First, we subtracted the mean ratings of expressed personality from ratings of the optimal level of expressed personality, for each personality item. This generated item-level APR indices. We then took the modulus (to remove the signs) of the item-level APR indices and then the mean to create domain-level APR indices for each of the big five. Finally, we averaged the APR indices from each of the Big 5 to create a total APR index.
The optimal personality expression for the comedy relevant traits identified by our comedy experts, on a scale of 1 to 10, were: angry hostility 3.67, self-consciousness 2.58, anxiety 3.00, and impulsivity 3.41, for neuroticism facets; assertive 7.58, for extraversion faects; intellectual curiosity 7.54, for openness facets; straightforwardness 4.55 and compliance 4.65, for agreeableness facets; and self-discipline 6.95, deliberation 4.57, for conscientiousness facets. In short, successful stage performances are generally low in expression of neurotic traits, high in assertiveness, high in self-discipline, and about average in agreeableness. These traits are similar to those of successful actors (Nettle, 2006) and differ markedly from comedians’ mean-level personalities (Irwing et al., 2020). In addition, successful comedic performances were judged to exhibit comparatively high levels of intellectual curiosity, which no doubt contributes to the surprise and novelty characteristic of successful comedy. In Study 1, optimal performance in each scenario required maximal expression of the personality trait. In Study 2, the comedians could express either too little or too much of the relevant trait. In consequence, the match scores that comprised the overall APR index diverged substantially from simple linear measures of trait expression.
Analysis Strategy
Given the similarity in hypotheses, the analysis strategy essentially duplicated that of Study 1.
Results
Correlations and descriptive statistics for all Study 2 variables are shown in Supplemental Materials, Table S2.
H2. The APR Index Should Conform to a Single-Factor Model
First, we tested whether the APR index conformed to a single, higher-order factor model. In contrast to Study 1 (which examined adaptive personality regulation exclusively in regard to Extraversion), we assessed adaptive personality regulation across each of the Big 5, because the expert judges expected that facets from each would be important for performance. We entered all five averaged match scores into a single-factor CFA. The SRMR and CFI suggested excellent fit and the TLI and RMSEA were indicative of acceptable fit (χ2 = 19.16, df = 5, p = .001, CFI = .94, TLI = .87, RMSEA = .117 [.065–.175], SRMR = .040). Table 8 includes the factor loadings from this model, which range from .34 to .75. The McDonald’s Omega of .70 and the average variance extracted of 33% suggest the model is reliable (Widaman et al., 2011). As in Study 1, these findings are broadly supportive of the construct, its indicators, and the presence of a higher-order factor of adaptive personality regulation.
Standardized Factor Loadings on Adaptive Personality Regulation.
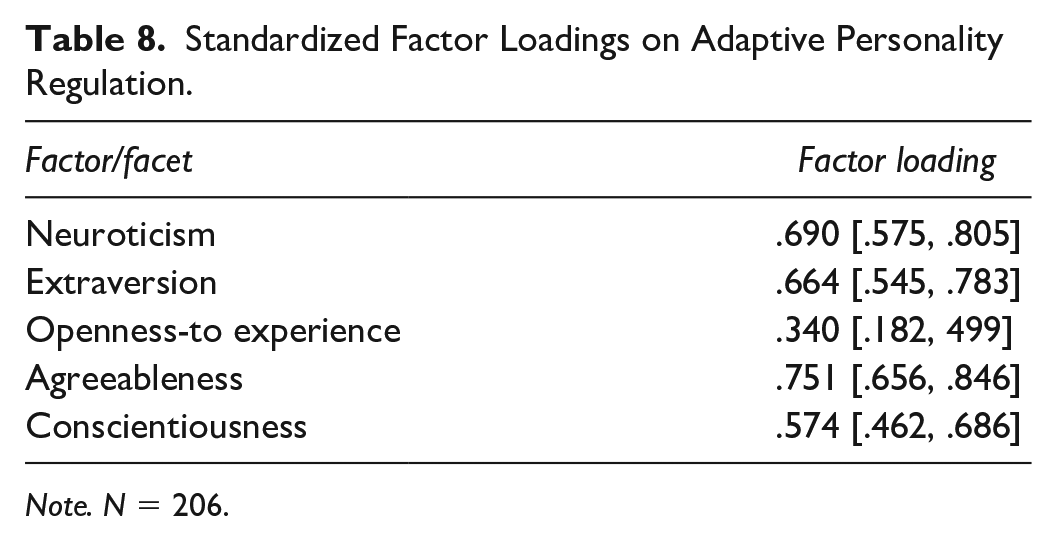
Note. N = 206.
H3. The APR Index Should Show Discriminant Validity With Respect to Mean-Level Personality, and Self-Monitoring
To examine the degree to which the APR index was distinct from self-monitoring and each of the Big 5, we again assessed the magnitude of the correlations, the 95% confidence interval for the correlations, and the magnitude of the correlations relative to the square root of the average variance extracted. The discriminant validity evidence convincingly supported the uniqueness discriminant validity of the APR index (see Table 9).
Correlations, and Square Root of AVE, for Adaptive Personality Regulation With Self-Monitoring, and Mean-Level Personality.
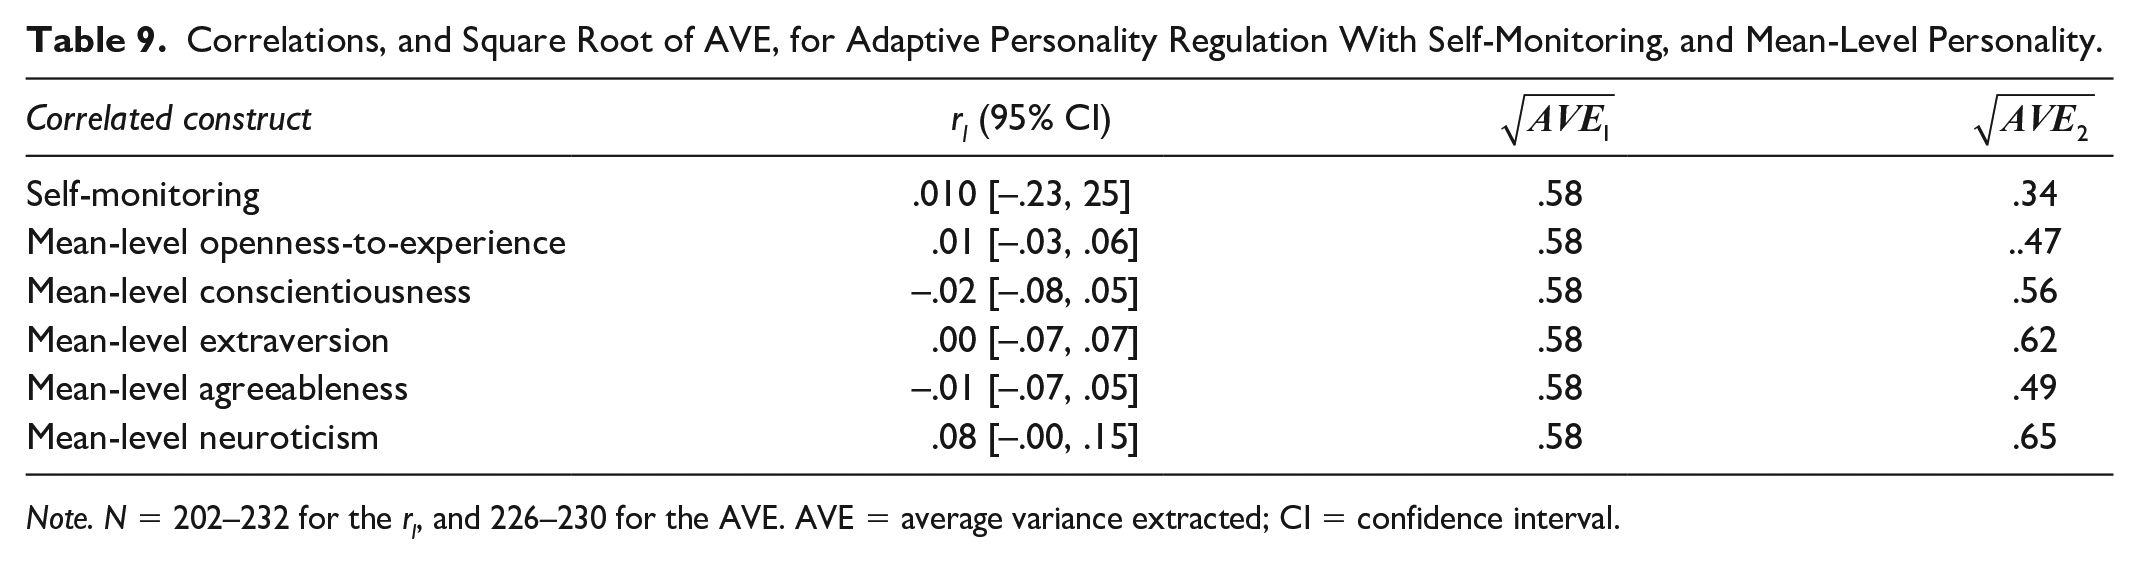
Note. N = 202–232 for the
H4. The APR Index Will Show Concurrent and Incremental Prediction of Task Performance Compared With Mean-Level Personality and Self-Monitoring
We examined the extent to which the APR index offered concurrent and incremental prediction of three dimensions of job performance (i.e., quality of delivery, material, and stagecraft) after controlling for the effects of self-monitoring and mean-level Big Five scores.
First, we tested whether the five mean-level personality dimensions and self-monitoring each showed concurrent prediction with respect to the three measures of stage performance, which were modeled as latent variables. All but two effects (Neuroticism as a predictor of Material and Stagecraft) were negligible, and collectively, all six predictors explained between 4.7% and 8.3% of the variance in comedians’ performance (see Table 10, Models 2.1–2.3). When the APR Index was added to these equations, its beta coefficients were substantial and significant, adding between 14% and 35.5% incremental variance (Models 2.4–2.6).
Regression of Quality of Delivery on Self-Monitoring, Mean-Level Personality, and Adaptive Personality Regulation.
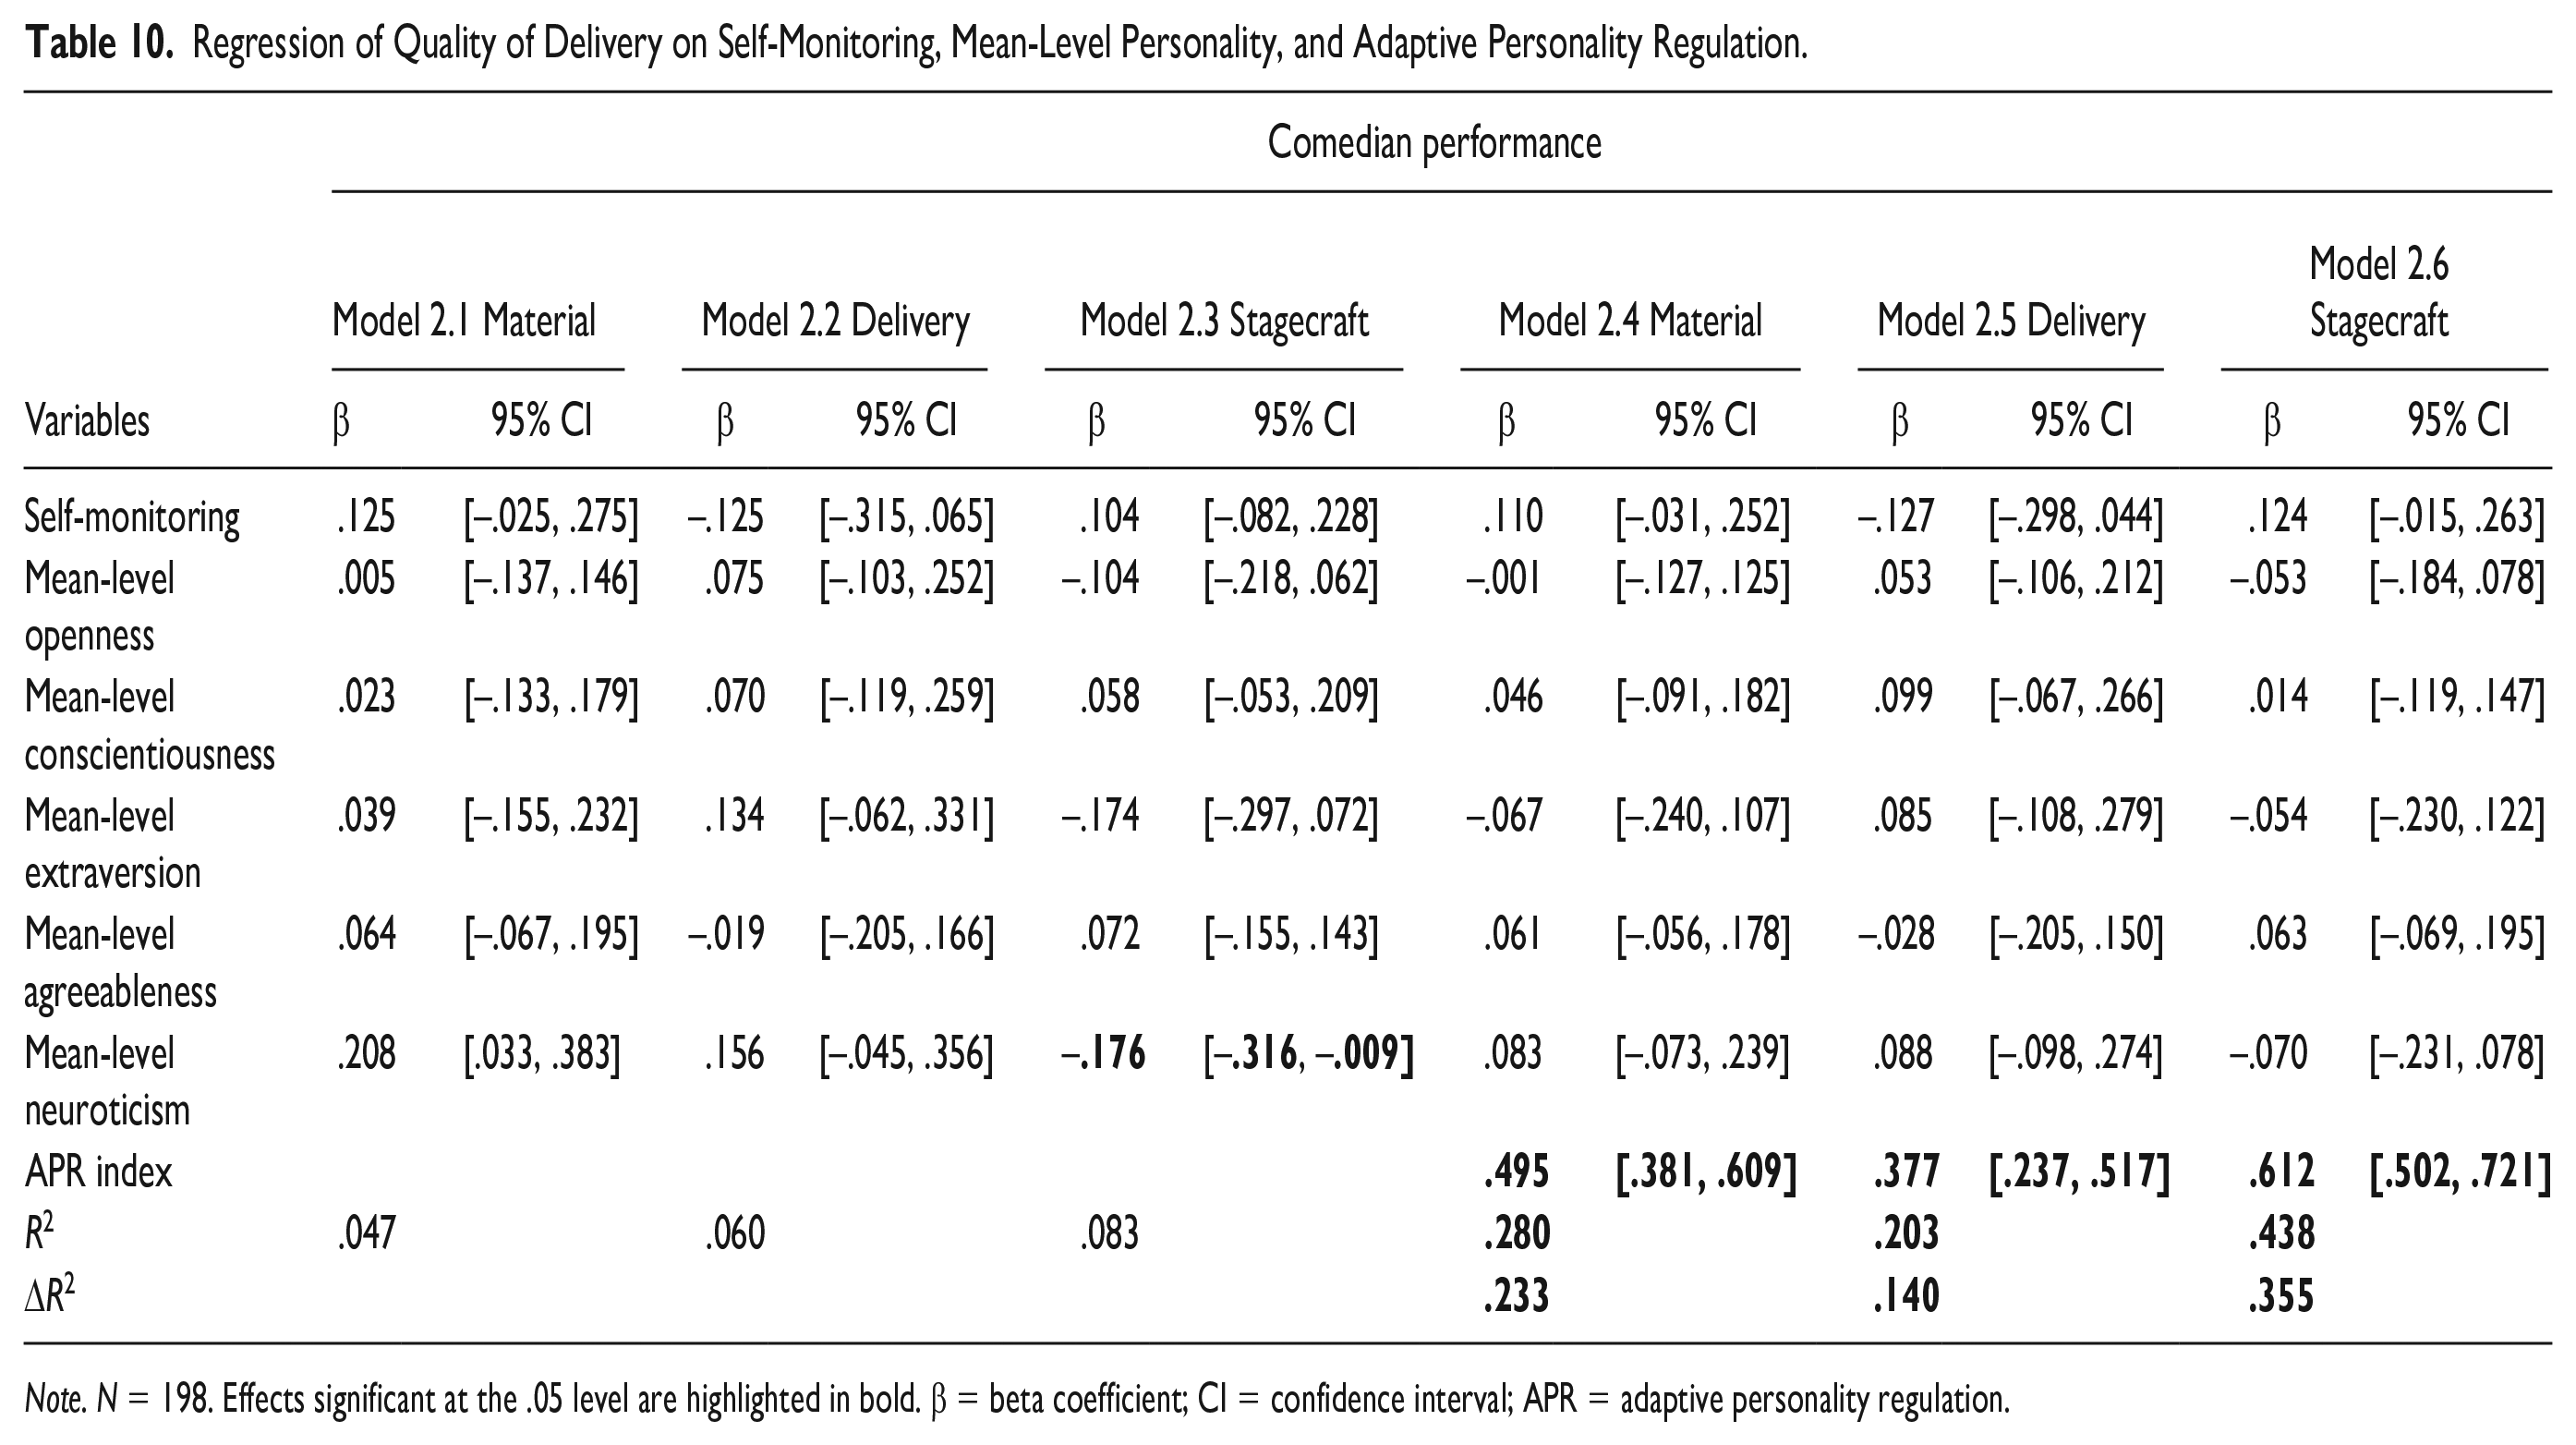
Note. N = 198. Effects significant at the .05 level are highlighted in bold. β = beta coefficient; CI = confidence interval; APR = adaptive personality regulation.
Additional Exploratory Analysis: The Relative Magnitude of the Concurrent Effects of Separate Big 5 Components of the APR Index
Our a priori hypotheses regarded the APR index as a general factor. However, during the review process, we were asked to conduct some interesting exploratory analyses to examine whether regulation in some trait domains was more important than others. Accordingly, we regressed each of the three comedic performance criteria onto APR indices calculated for each Big 5 domain using both simple and multiple regression. The multiple regression analyses showed that the APR indices of openness and neuroticism had unique effects on quality of material, APR extraversion had a unique effect on delivery, and the APR indices of openness, extraversion, and neuroticism had unique effects on stagecraft (see Table 11). The simple regressions showed that all but two slope coefficients were significant with the largest average effect sizes for extraversion followed by openness, neuroticism, conscientiousness and agreeableness, in descending order of magnitude. Thus, although adaptive regulation does appear to generalize across traits (i.e., conform to a general factor), the predictive properties of the trait domains vary and prediction is enhanced when we examine trait-specific regulation. These results resemble well-established effects in mean-level personality research, namely, that predictive power increases as personality assessment becomes more nuanced (Hughes & Batey, 2017).
Simple and Multiple Regression of Quality of Performance on Big 5 Domain APRs.
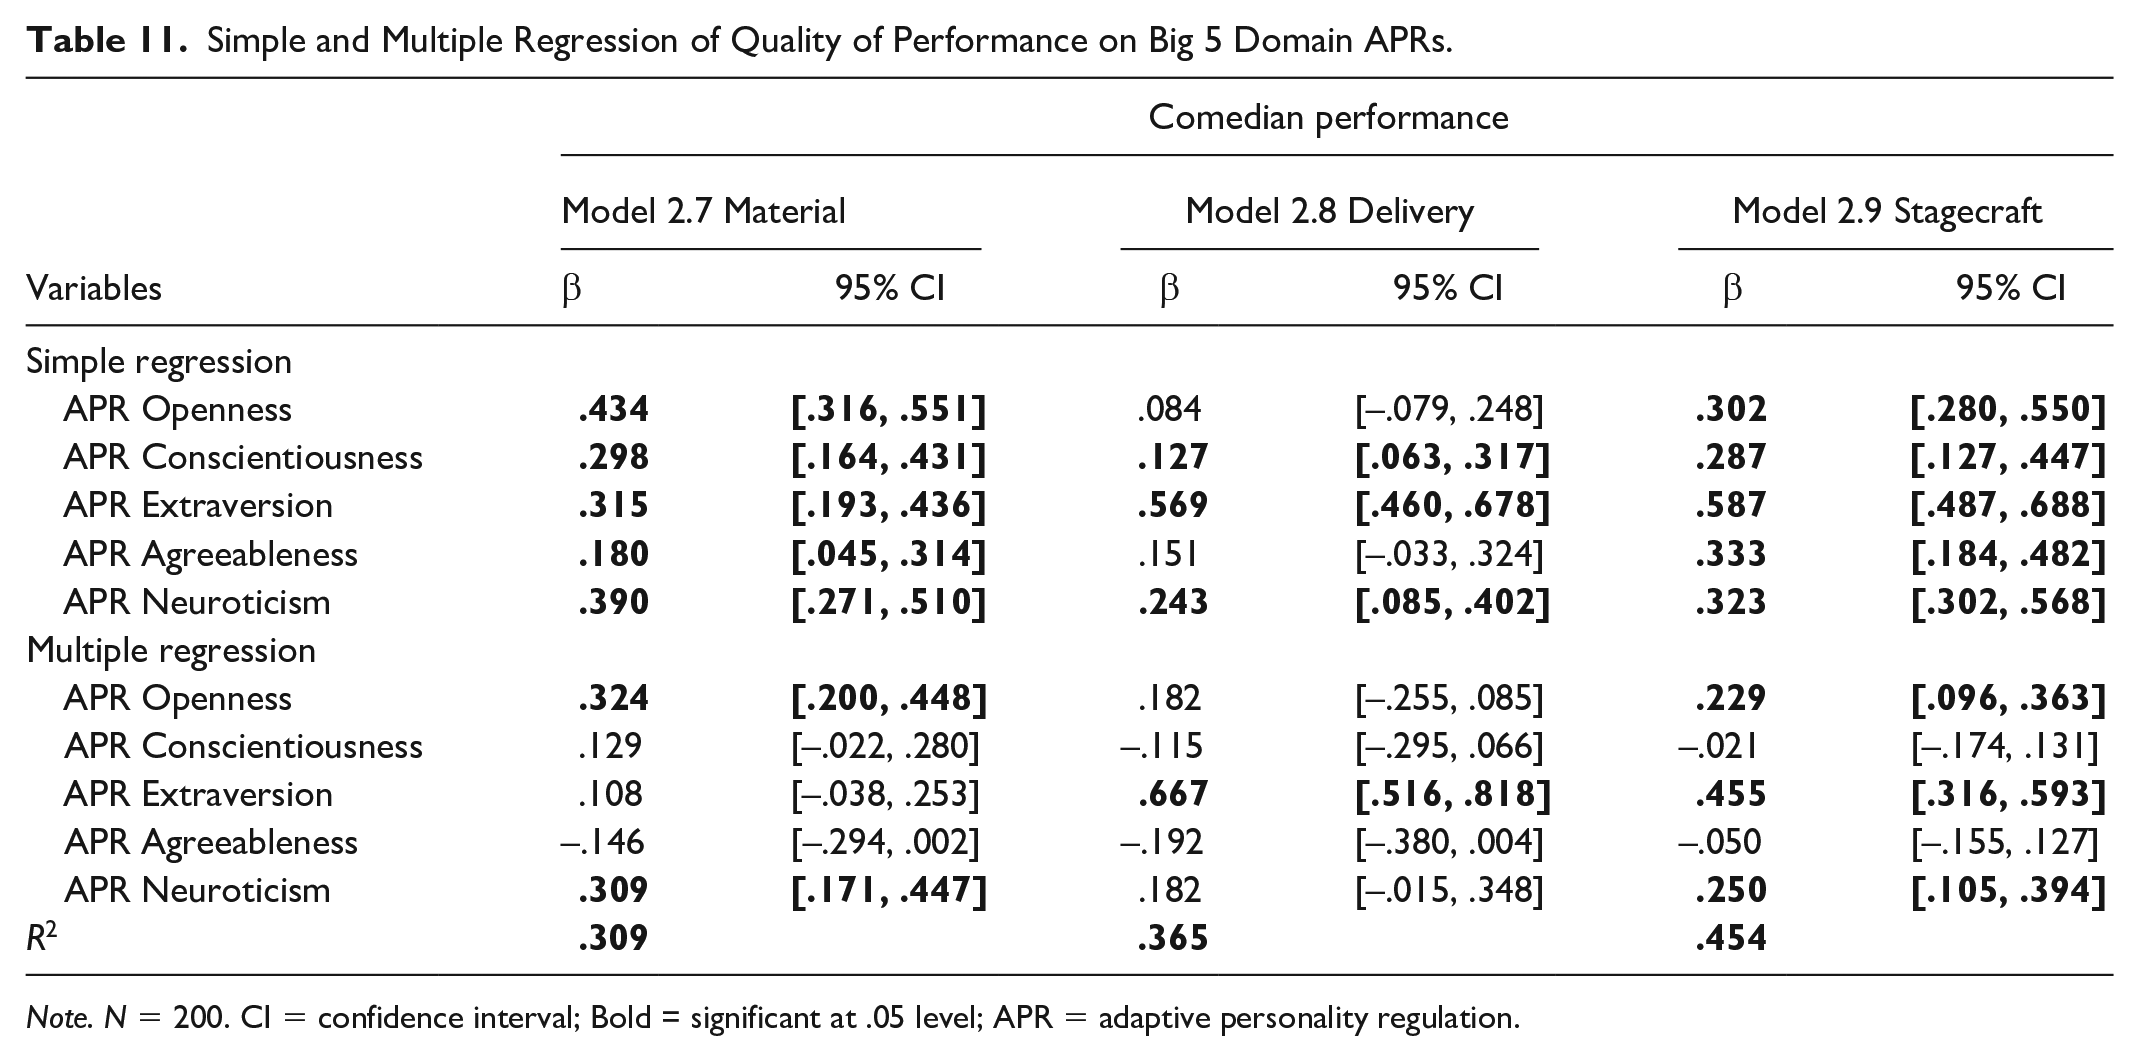
Note. N = 200. CI = confidence interval; Bold = significant at .05 level; APR = adaptive personality regulation.
Additional Exploratory Analysis: The APR Index Versus the General Factor of Personality Expression
When presenting related work at the 2019 World Conference of Personality, we were asked whether the APR index was meaningfully distinct from the general factor of personality expression, which emerges from assessment center data (see Breil & Back, 2019), a question that we had not thought of a priori. Now aware of this possibility, we conducted a post hoc exploratory analysis to examine the relationship between the APR index and general factor of personality expression.
First, we examined the nature of the general factor of personality expression using CFA. In contrast to the APR index, which showed acceptable to good levels of model fit, the general factor of personality expression failed to fit by a substantial margin (χ2 = 142.38, df = 5, p = .001, CFI = .385, TLI = –.230, RMSEA = .359 [.310, .411], SRMR = .171). Given this remarkable lack of fit, it is questionable whether the general factor of personality expression represents much more than a statistical artifact. Indeed, it is difficult to imagine what construct is represented by the common variance of personality expression within any given situation. Nevertheless, we continued to estimate a correlation between the APR index and the general factor of personality expression. The two correlated at r = .466 [.361, .572], sharing approximately 21.7% of variance. Thus, although related because they are calculated using the same data, they are by no means identical. It is clear from the fact that summed scores of personality expression correlate only weakly with the APR index that in the current study there is an unambiguous empirical distinction, and theoretical distinction, between expressed personality and the index of adaptive personality regulation.
Discussion
Our major research goal was to identify an index of adaptive personality regulation, which we defined as the ability or propensity to express personality to meet situational requirements. In two studies, we investigated the properties of the APR index, which examined the degree to which participants expressed situation-appropriate personality (as defined by expert judges). To a substantial degree, the results of both studies support our hypotheses and suggest that the APR index has value for researchers and practitioners who wish to assess individuals’ propensity to regulate their personality expression to meet situational demands. We now consider each hypothesis in turn.
H1 and H2 concerned the most fundamental features of adaptive personality regulation: that individuals would shift their personality expression according to situational requirements (H1) and that the APR Index reflects a general ability to regulate personality across different situations and/or traits and thus should fit a single-factor CFA (H2). Evidence regarding the shift of personality expression across situations was best demonstrated in Study 1. Here, participants shifted from a high extraversion (memorability) to a low extraversion (scoring) task. Consistent with past research, the overall degree of shift was very large and there were considerable individual differences, with some adapting well in both tasks, some in just one, and some in none (Sauerberger & Funder, 2017). Two pieces of evidence supported H2: (a) APR index measures estimated within separate tasks correlated substantially and (b) these two within-task measures, when averaged, conformed to a well-fitting single-factor CFA model. In Study 2, we observed comedians in just one situation, so we were unable to assess the degree of personality shift across situations. However, we have previously reported a group level analysis of some of the data from the current study (Irwing et al., 2020). Specifically, we found that, on average, comedians’ on-stage personality expression differed considerably from their mean-level personality, suggesting that shift does occur when performing on stage.
Evidence that adaptive regulation of personality generalizes across traits was best demonstrated in Study 2. Here, we assessed personality expression across facets from each of the Big 5 domains. Again, the trait-specific APR index measures calculated for each Big 5 domain loaded onto a single higher-order APR index factor, within a well-fitting CFA model. Taken together, the results from the two studies suggest, that even when examined using the most robust methods (i.e., CFA, which is notoriously challenging to personality measures; Booth & Hughes, 2014), that the APR index generalizes across tasks and traits. Thus, we would tentatively suggest that initial evidence supports the notion that there is a general factor of adaptive personality regulation and that the APR index captures individuals’ ability or propensity to express personality to meet situational requirements. However, one caveat is that, in an additional analysis, we found that APRs calculated at the domain level both varied in their predictive validity and explained more criterion variance.
To consider adaptive personality regulation (the construct) and the APR index (the assessment tool) as useful additions to the literature, a minimal condition is that they are distinct from conceptually similar phenomena (H3). Across both studies, the correlations between the APR index and mean-level personality and self-monitoring were essentially zero. This evidence, together with the ratio between the AVEs and the correlations, strongly suggested that the APR index was distinct from these other constructs. Given the theoretical similarity between self-monitoring and adaptive personality regulation, the near-zero correlation might appear surprising. However, we believe there are two plausible explanations. First, self-monitoring is assessed by self-report scales, which have questionable psychometric properties (e.g., Briggs & Cheek, 1988; Kudret et al., 2019), and as we discussed in the introduction, it seems highly likely that dynamic constructs such as adaptive personality regulation are “not amenable to standard self-report measurement formats” (Erickson, et al., p. 908). Second, the original conceptualization of self-monitoring as, “an individual’s observation, regulation, and control of his or her expressive behavior and self-presentation guided by social and situational cues (Kudret et al., 2019; Snyder, 1974; Snyder & Gangestad, 1986, p. 193), is very close to our conceptualization of adaptive personality regulation. However, the nature of self-monitoring is contested. For example, Gangestad and Snyder (2000) proposed a revised definition suggesting that self-monitoring reflects tendencies “. . . to engage in, or eschew, forms of impression management tactics that involve the construction of social appearances and cultivation of social images [that] . . . relates to status-oriented impression management motives” (Gangestad & Snyder, 2000, pp. 546–547). Defined as a measure of status-oriented impression management, self-monitoring is quite far removed from a general tendency to adaptively regulate personality.
In addition, in Study 2 the APR index was distinct from the general factor of personality expression that emerges from assessment center data (see Breil & Back, 2019). Furthermore, the APR index showed acceptable to good model fit and the general factor of personality expression did not. Collectively, this evidence calls into question the adequacy and nature of the general factor of personality expression, whereas the method for calculating the APR index is readily interpretable as the extent to which personality meets situational requirements. In support of arguments within the introduction, it seems that measuring variability in the expression of personality per se is insufficient as an index of adaptive personality regulation. Instead, it is necessary to take account of whether the expressed personality matches situational requirements to distinguish between adaptive and maladaptive variation.
A second minimal condition to support the utility of adaptive personality regulation and the APR index concerns practical value. In both studies, the APR index explained more variance in task/job performance than the big five and self-monitoring combined (H4). Mean-level personality has historically demonstrated reliable but modest prediction of task and job performance (Barrick et al., 2001). The picture here was consistent, with mean-level Big Five personality traits explaining 10% to 20% of the variance in Study 1’s experimental tasks and less than 10% of the variance in comedians’ job performance. Self-monitoring fared worse, with beta coefficients often close to zero. The APR index, on the contrary, explained incremental and significant proportions of variance in both tasks in Study 1 and comedian performance in Study 2. Although preliminary, these findings might offer a partial explanation for the relatively underwhelming performance of mean-level personality as a predictor of task-related job performance (Barrick et al., 2001). That is, jobs are not simple and require more than a broad, static, personality profile to explain success (Hughes & Batey, 2017). Indeed, they likely require the ability to adapt personality to a variety of task and situational demands.
Limitations
Three notable limitations to our studies must be considered when interpreting the findings. First, the data collection methods were very intensive. Both studies required expert ratings of the personality expression needed for success, ratings of expressed personality, and standard psychometric data. In general, “direct observations of behavior have remained comparatively rare in personality research, likely because they are harder to obtain for sufficiently large samples” (Mõttus et al., 2020). The sentiments of Mõttus et al. (2020) were true of this study, particularly Study 1, for which the sample was smaller than would be ideal, and although it surpassed the minimum required by a priori power analyses for some tests (e.g., the main regression model), it did not for others (e.g., the full correlation matrix). Thus, replication and extension with much larger samples is required.
Second, our current studies were confined to “strong situations” in which the appropriate course of action was well defined (Judge & Zapata, 2015). In weak situations, individuals often pursue varied goals and employ diverse strategies to achieve them. Thus, the APR index might be less useful in weak situations because a priori expert ratings of the optimal levels of expressed personality are difficult under conditions characterized by equifinality. The nature of the generalizability of the APR index within “weak(er) situations” remains an open question that future studies should investigate.
Third, our measures of task performance were generated specifically for this study. The outcomes for Study 1 (i.e., number of memorable facts recalled and number of tests correctly scored) were relatively objective and easy to quantify. In contrast, although the measure of comedians’ performance performed well psychometrically, it relied upon subjective ratings. Such ratings are common in the measurement of job performance (Campbell & Wiernik, 2015) and are widely regarded as a useful metric of performance in complex domains, especially when the ratings assess specific facets of performance (Bartram, 2005; Rojon et al., 2015). Nevertheless, a more objective metric (e.g., frequency and volume of laughter/applause) might have been preferable.
Conclusion
We proposed and tested the APR index as a metric of adaptive personality regulation: the ability or propensity to express personality to meet situational requirements. In both studies, the APR index showed robust psychometric properties, was distinct from related concepts (e.g., mean-level personality, self-monitoring, and the general factor of personality expression), and provided incremental concurrent prediction of task/job performance. Given the promising findings and the centrality of the concept underlying adaptive personality regulation (i.e., matching personality expression to situational requirements) to many previously proposed measures, further research is warranted.
Supplemental Material
sj-docx-1-psp-10.1177_01461672231177567 – Supplemental material for Toward an Index of Adaptive Personality Regulation
Supplemental material, sj-docx-1-psp-10.1177_01461672231177567 for Toward an Index of Adaptive Personality Regulation by Paul Irwing, Clare Cook and David J. Hughes in Personality and Social Psychology Bulletin
Footnotes
Correction (August 2023):
This article has been updated with minor grammatical or style corrections since its original publication.
Author Contributions
P.I. contributed to study design, data analysis, manuscript writing, theory development, and reference search. C.C. contributed to study design, data collection, theory development drafted parts of manuscript, and prepared Supplementary Materials. D.J.H. contributed to study design, data analysis, manuscript writing, theory development, and prepared Supplementary Materials.
Declaration of Conflicting Interests
The author(s) declared no potential conflicts of interest with respect to the research, authorship, and/or publication of this article.
Funding
The author(s) received no financial support for the research, authorship, and/or publication of this article.
Supplemental Material
Supplemental material is available online with this article.
Notes
References
Supplementary Material
Please find the following supplemental material available below.
For Open Access articles published under a Creative Commons License, all supplemental material carries the same license as the article it is associated with.
For non-Open Access articles published, all supplemental material carries a non-exclusive license, and permission requests for re-use of supplemental material or any part of supplemental material shall be sent directly to the copyright owner as specified in the copyright notice associated with the article.