
Abstract
Objectives
To explore the associated factors of otitis media with effusion (OME) and analyze the diagnostic value of the adenoid-nasopharyngeal (A/N) ratio to OME.
Methods
Patients with adenoid hypertrophy (AH) recently in 2 years were collected, including sex, age, duration, with/without rhinosinusitis, and examination results, including Cone Beam Computerized Tomography (CBCT) sinus imaging, tympanometry, pure tone audiometry (PTA), blood test, and allergen detection. According to Liden/Jerger’s classification, the patients were divided into two groups: Type B and type C, which were defined as the tympanometry abnormal group (TAG), and the rest were classified as the tympanometry normal group (TNG).
Results
A total of 316 children were included in this study. Age and duration were significantly younger and shorter in TAG (6.0(4.0-9.0) vs.5.0(4.0-7.0)); 12.0(4.0-24.0) vs.6.0(2.0-12.0)). Compared to TNG, the allergen test results of fx5 (protein, milk, cod, wheat, peanut, and soybean) in TAG were higher (0.09(0.04-0.25) vs.0.14(0.05-0.45)), but eosinophilia in blood was lower (count: 0.21(0.13-0.35) vs. 0.18(0.12-0.27); ratio: 3.10 (1.90-4.70) vs. 2.50 (1.65-3.80)). A/N ratio and Visual obstruction ratio had a statistical difference (Z = −3.770, P < .01) but the two ratios didn’t have too much disparity (0.82(0.74-0.88) VS 0.80(0.75-0.80)), and they had a positive correlation (r = 0.345, P < .01). A/N ratio of TAG was higher than TNG (0.78(0.70-0.85) vs. 0.86(0.82-0.90)) and had a positive correlation with increasing negative middle ear pressure (r = −3.777, P < .01). A/N ratio was an associated factor of OME (OR:1355.611, P = .006), the cut-off value of A/N ratio was 0.815(sensitivity: 75.3%, specificity: 64.3%, area under the curve (AUC): 0.747)
Conclusions
A/N ratio indirectly reflected the abnormality of tympanometry in this study. When A/N ratio reaches 0.815, patients are at a higher risk of having OME so it could be a predictor of OME in patients with adenoid hypertrophy.
Keywords
Introduction
Adenoid hypertrophy (AH) is a common otorhinolaryngologist disease in about 19%–70% of children occurred, which could cause snoring, mouth breathing, hypoplasia of mid-face, and is always complicated with otitis media with effusion (OME). 1 –4 The etiology of OME could be related to eustachian tube reflux caused by AH, bacterial accumulation in adenoids, and immunological dysfunction of adenoids, especially attached to the mechanical obstruction of eustachian tube. 5 –7 About 90% of OME patients could self-cure in three months, but a small proportion would develop into irreversible hearing loss, cholesteatoma, and other concerns like speech development delays as well as behavioral disorders. 6,8 Most kids and their parents didn't learn they had hearing loss until after hearing examinations were performed. 9,10 Fujioka 11 introduced the adenoid-nasopharyngeal (A/N) ratio, which means the adenoid size takes the proportion of the nasopharyngeal. It is a classical index to evaluate the extent of AH that can reflect the obstruction ratio of nasopharyngeal. 6,12 When browsing CT sinus scans, we observed that patients of AH with OME usually have a higher A/N ratio than those of AH without OME. In that case, we calculated the cut-off value of A/N ratio to predict the possibility of AH children combined with OME to improve the hearing loss attention of their parents and doctors.
Materials and Methods
Methods
This is a retrospective clinical study about patients diagnosed with adenoid hypertrophy (AH). All patients’ data were collected from Shandong Provincial ENT Hospital, China, from 2019 to 2022. All patients were under 18 years old and ruled out who had tympanic membrane perforation or other otitis media. The patients without tympanogram were also excluded. The selected patients’ basic information, including sex, age, duration, and with/without rhinosinusitis were picked out. Beyond that, patients’ examination results, including computed tomography (CT) sinus imaging, tympanometry, pure tone audiometry (PTA), blood test, and allergen detection, were also collected. The patients were divided into two groups, the tympanogram normal group (TNG) and the tympanogram abnormal group (TAG) based on Liden/Jerger’s classification. Type B was considered the classical OME image, and type C was considered to have a trend to develop into OME or have a possibility to recover from OME, so Type B and type C were defined as TAG. 13,14 We obtained the written consent from all patients’ guardians and the local ethical committee (number: XYK20190103).
Clinical Examination
Cone beam computerized tomography
Considering the less radiation, costs, and convenience of assessment for sinus and mild ear disease development, Cone beam computerized tomography(CBCT) was more suitable for children, so CBCT (SCANORA 3Dx, Finland, SCANORA) was performed by physicians of the radiology department to evaluate sinus imaging. And A/N ratio was calculated by three different physicians based on the Fujioka method, each doctor calculated three times for every patient, and took the average as the final result of A/N ratio.
Audiometric test
Pure tone audiometry (PTA, AUDIOSTAR PRO, America, GSI) and Tympanometry (TYMPSTAR PRO, America, GSI) were performed by professional physicians of the Clinical Audiology Center. We divided the patients into two groups, one of which is TNG and the other is TAG based on Liden/Jerger’s classification. Type B was considered the classical OME image, and type C was considered to have a trend to develop into OME or have a possibility to recover from OME, so Type B and type C were defined as TAG.
Blood test
Each blood sample was sent to the clinical laboratory and tested by a laboratory physician with the same machine (BC-5390 CRP, China, Mindary) under the same standard.
Nasal endoscopic examination
The results of the nasal endoscopy (Storz, Germany) were provided by the two physicians of the nasal endoscopy room, and the Visual obstruction ratio was subjectively measured by the physicians.
Allergen detection
ImmunoCAP, the most common system for the detection of sIgE (special IgE), is the golden standard for allergen detection. 15 ImmunoCAP (Thermo Fisher Science, Sweden) was used by the same professional physician to detect the usual allergen, including a-IgE (total IgE), d1 (house dust mite), d2 (Dermatophagoides farinae), fx1 (peanut, hazelnut, Brazil nut, almond, and coconut), fx5 (protein, milk, cod, wheat, peanut, and soybean), and phadiatop (inhaled allergen) under the same standard with the same reagents.
Statistical analysis
All data were analyzed by SPSS software (version 26). Shapiro-Wilk test was used to check the normality of the data. Nonnormality continuous variables were described using the median and 25th–75th interquartile: median (P25-P75). The distribution and of categorical variables were used χ2 test and the correlation of different variables were used Spearman correlation. Mann–Whitney U test and Kruskal-Wallis Test were applied to the comparisons. Binary Logistic Regression was applied for dichotomous outcomes to detect the risk factors. Receiver Operating Characteristic curve (ROC curve) was applied to calculate the cut-off value, sensitivity, and specificity. P-values lower than 0.05 were considered statistically significant.
Results
1. TAG has a Higher A/N Ratio than TNG.
Demographics and Test Results.
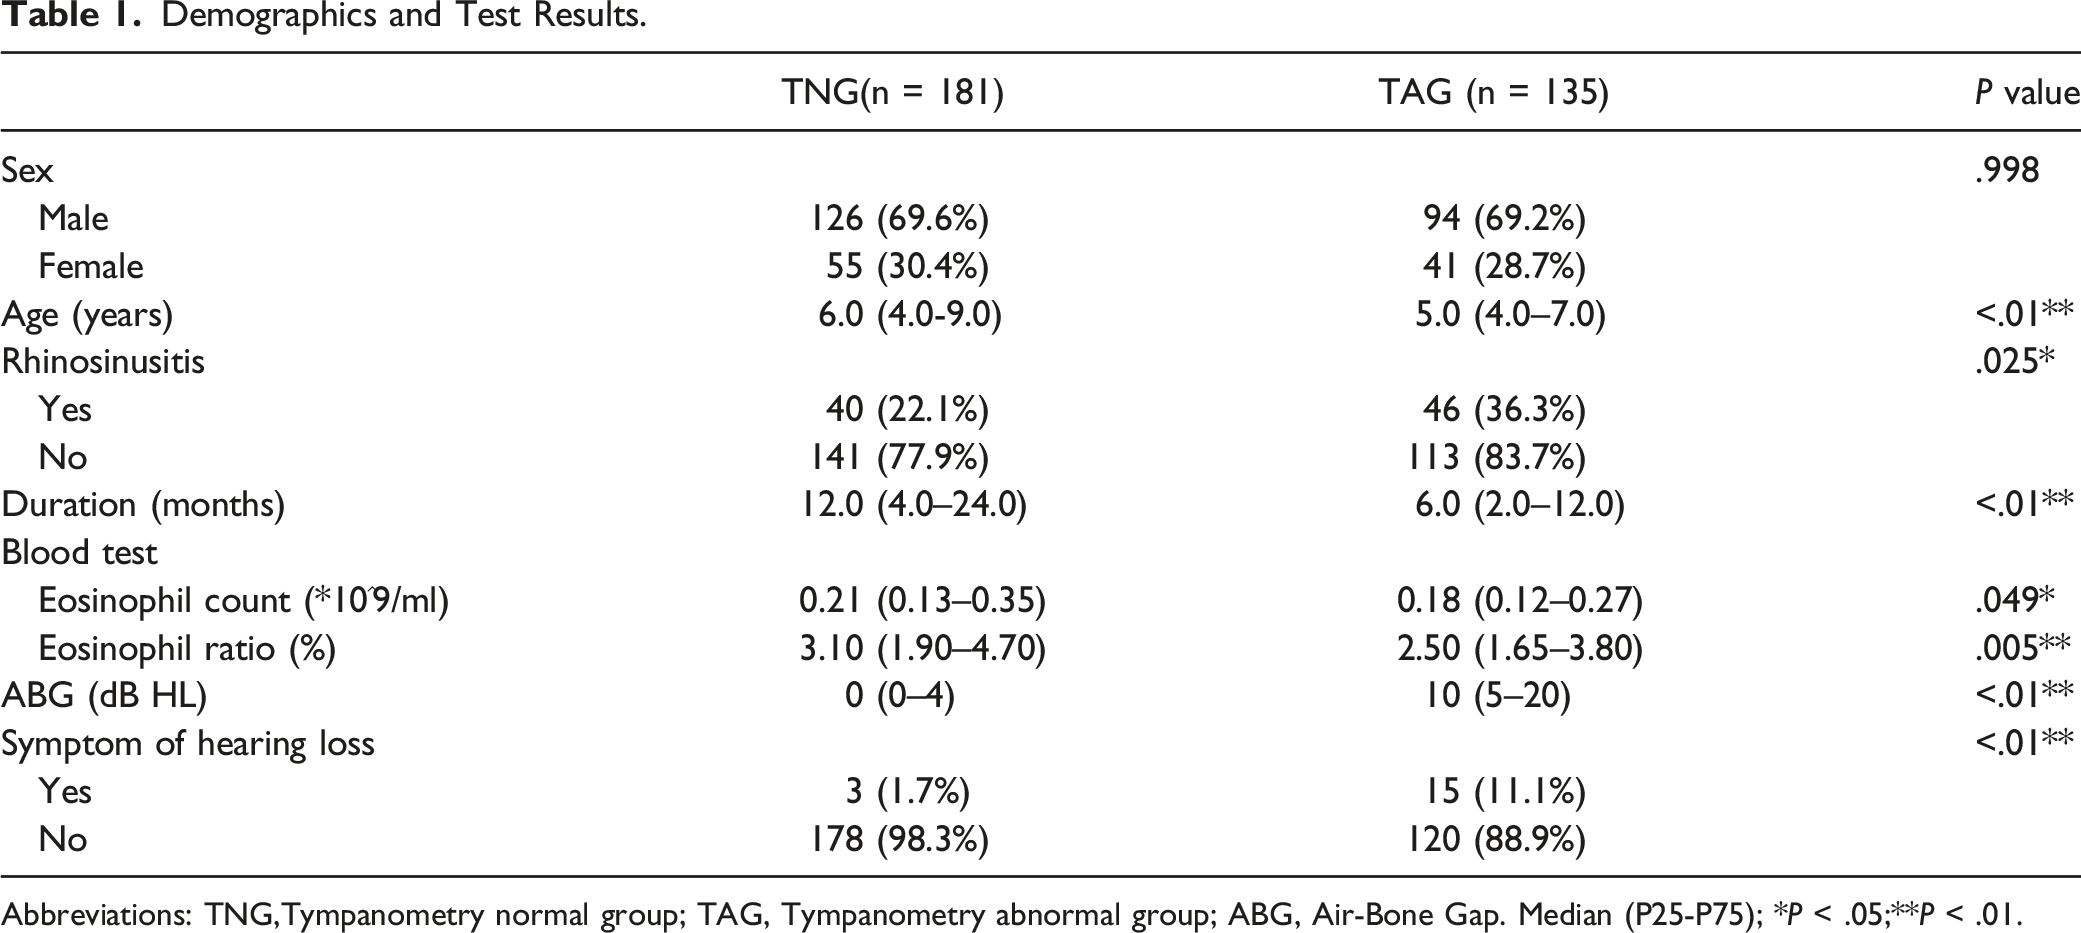
Abbreviations: TNG,Tympanometry normal group; TAG, Tympanometry abnormal group; ABG, Air-Bone Gap. Median (P25-P75); * P < .05;** P < .01.
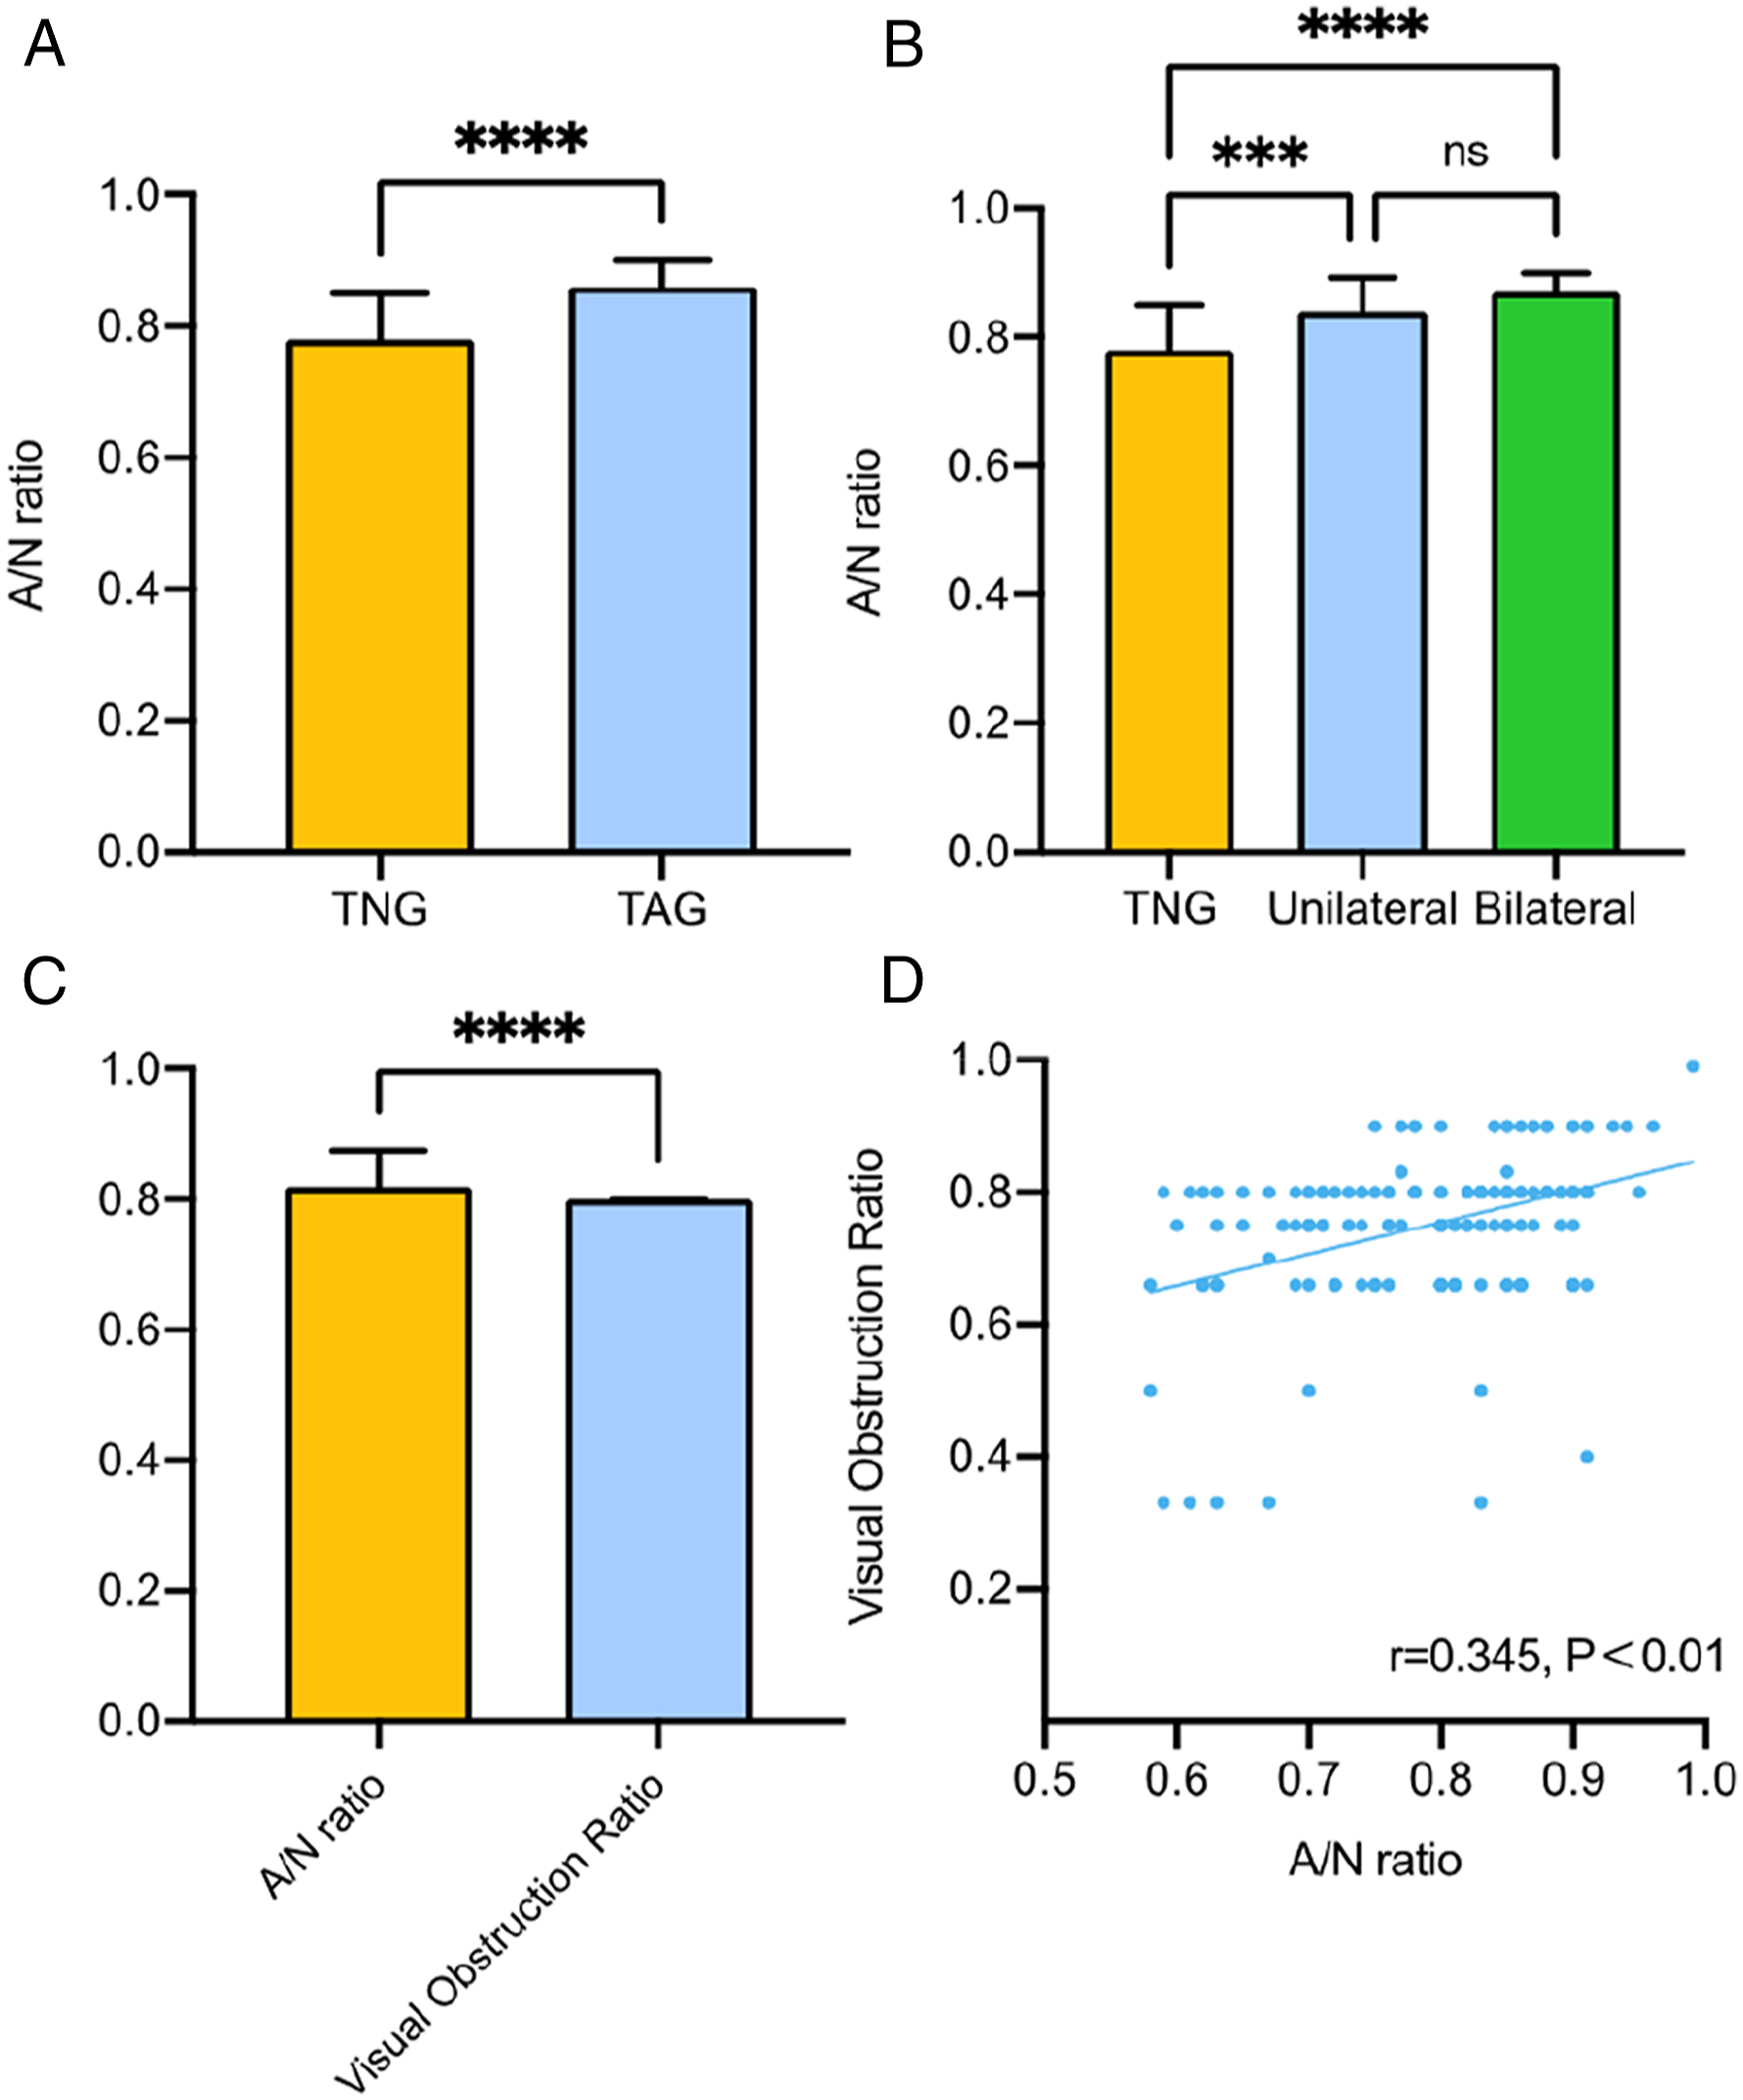
The difference of A/N ratio in the different groups and the comparison with Visual obstruction ratio. (A) A/N ratio was larger in TAG than TNG. (B) A/N ratio in the tympanometry unilateral abnormal group and the tympanometry bilateral abnormal group were both larger than TNG, but the A/N ratio of the tympanometry unilateral abnormal group and the tympanometry bilateral abnormal group had no difference. (C) A/N ratio was larger than the Visual obstruction ratio in the same patient. (D) A/N ratio and Visual obstruction ratio had a positive correlation (r = 0.345, P < .01). TNG: tympanometry normal group; TAG: tympanometry abnormal group; ns: no significance; *** P < .001; **** P < .0001.
2. Duration in TAG was Shorter than in TNG and Age was Higher in TNG.
All patient’s ages ranged from 2 to 16, TNG has higher age compared with TAG (6.0(4.0-9.0) vs. 5.0(4.0-7.0), Table 1). We also analyzed the relationship between ages and A/N ratio, the result certified that A/N ratio had a negative correlation with ages (r = −0.385, P < .01, Figure 2A). The duration of all patients ranged from 0.16 to 120 months. In TNG, the duration was 12.0(4.0-24.0), and TAG was 6.0(2.0-12.0). A significant difference existed between the two groups under the duration distribution (Z = −3.273, P < .01, Table 1). To certificate relations between A/N ratio and duration, we analyzed these two factors and found that with an increasing of A/N ratio, the duration of AH patients decreased (r = −0.238, P = .01, Figure 2B). (A)The correlation of A/N ratio with age and duration. Age had a negative correlation with A/N ratio (r = −0.385, P < .01) (B) Duration had a negative correlation with A/N ratio (r = −0.238, P = .01). TNG: tympanometry normal group; TAG: tympanometry abnormal group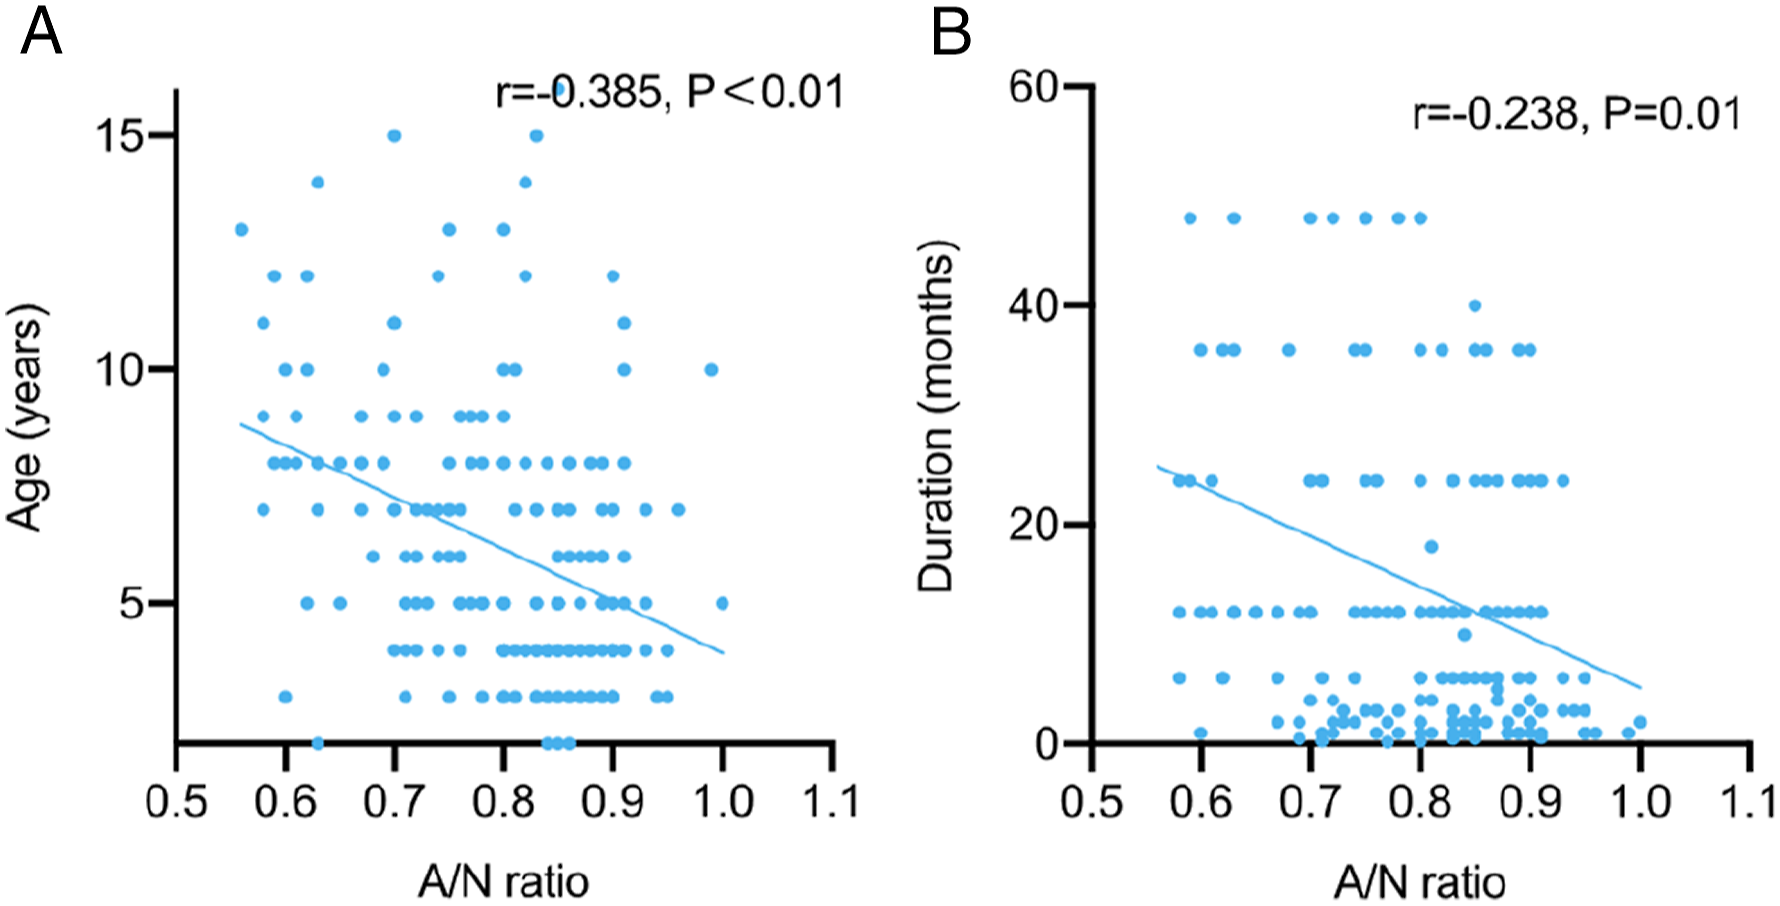
3. Negative Middle Ear Pressure had Negative Correlations with Lund-Mackay Score and A/N Ratio.
Based on TNG and TAG, the results of the Lund-Mackay (LM) total scores for TNG and TAG were 0(0-7) and 3(0-8), which showed significant differences (Z = −-2.868, P = .004, Figure 3A). Negative middle ear pressure of TAG was much lower than TNG group (Figure 3B), and had a negative correlation with A/N ratio (Figure 3C) and Lund-Mackay scores (Figure 3D), which may indicate that with the rise of A/N ratio, the middle ear pressure decreased heavily and caused the abnormal of CT sinus image.
16
Differences of Lund-Mackay scores and negative middle ear pressure between TNG and TAG and the correlations of Negative Middle Ear Pressure with Lund-Mackay Scores and A/N ratio. (A) Lund-Mackay score in TAG was higher than TNG. (B) Negative middle ear pressure in TAG was larger than TNG. (C) Negative middle ear pressure negatively correlated with A/N ratio (r = −.0.395, P = 0.01). (D) Negative middle ear pressure negatively correlated with Lund-Mackay scores (r = −0.215, P < .01). TNG: tympanometry normal group; TAG: tympanometry abnormal group; **
P < .01; ****
P < .0001.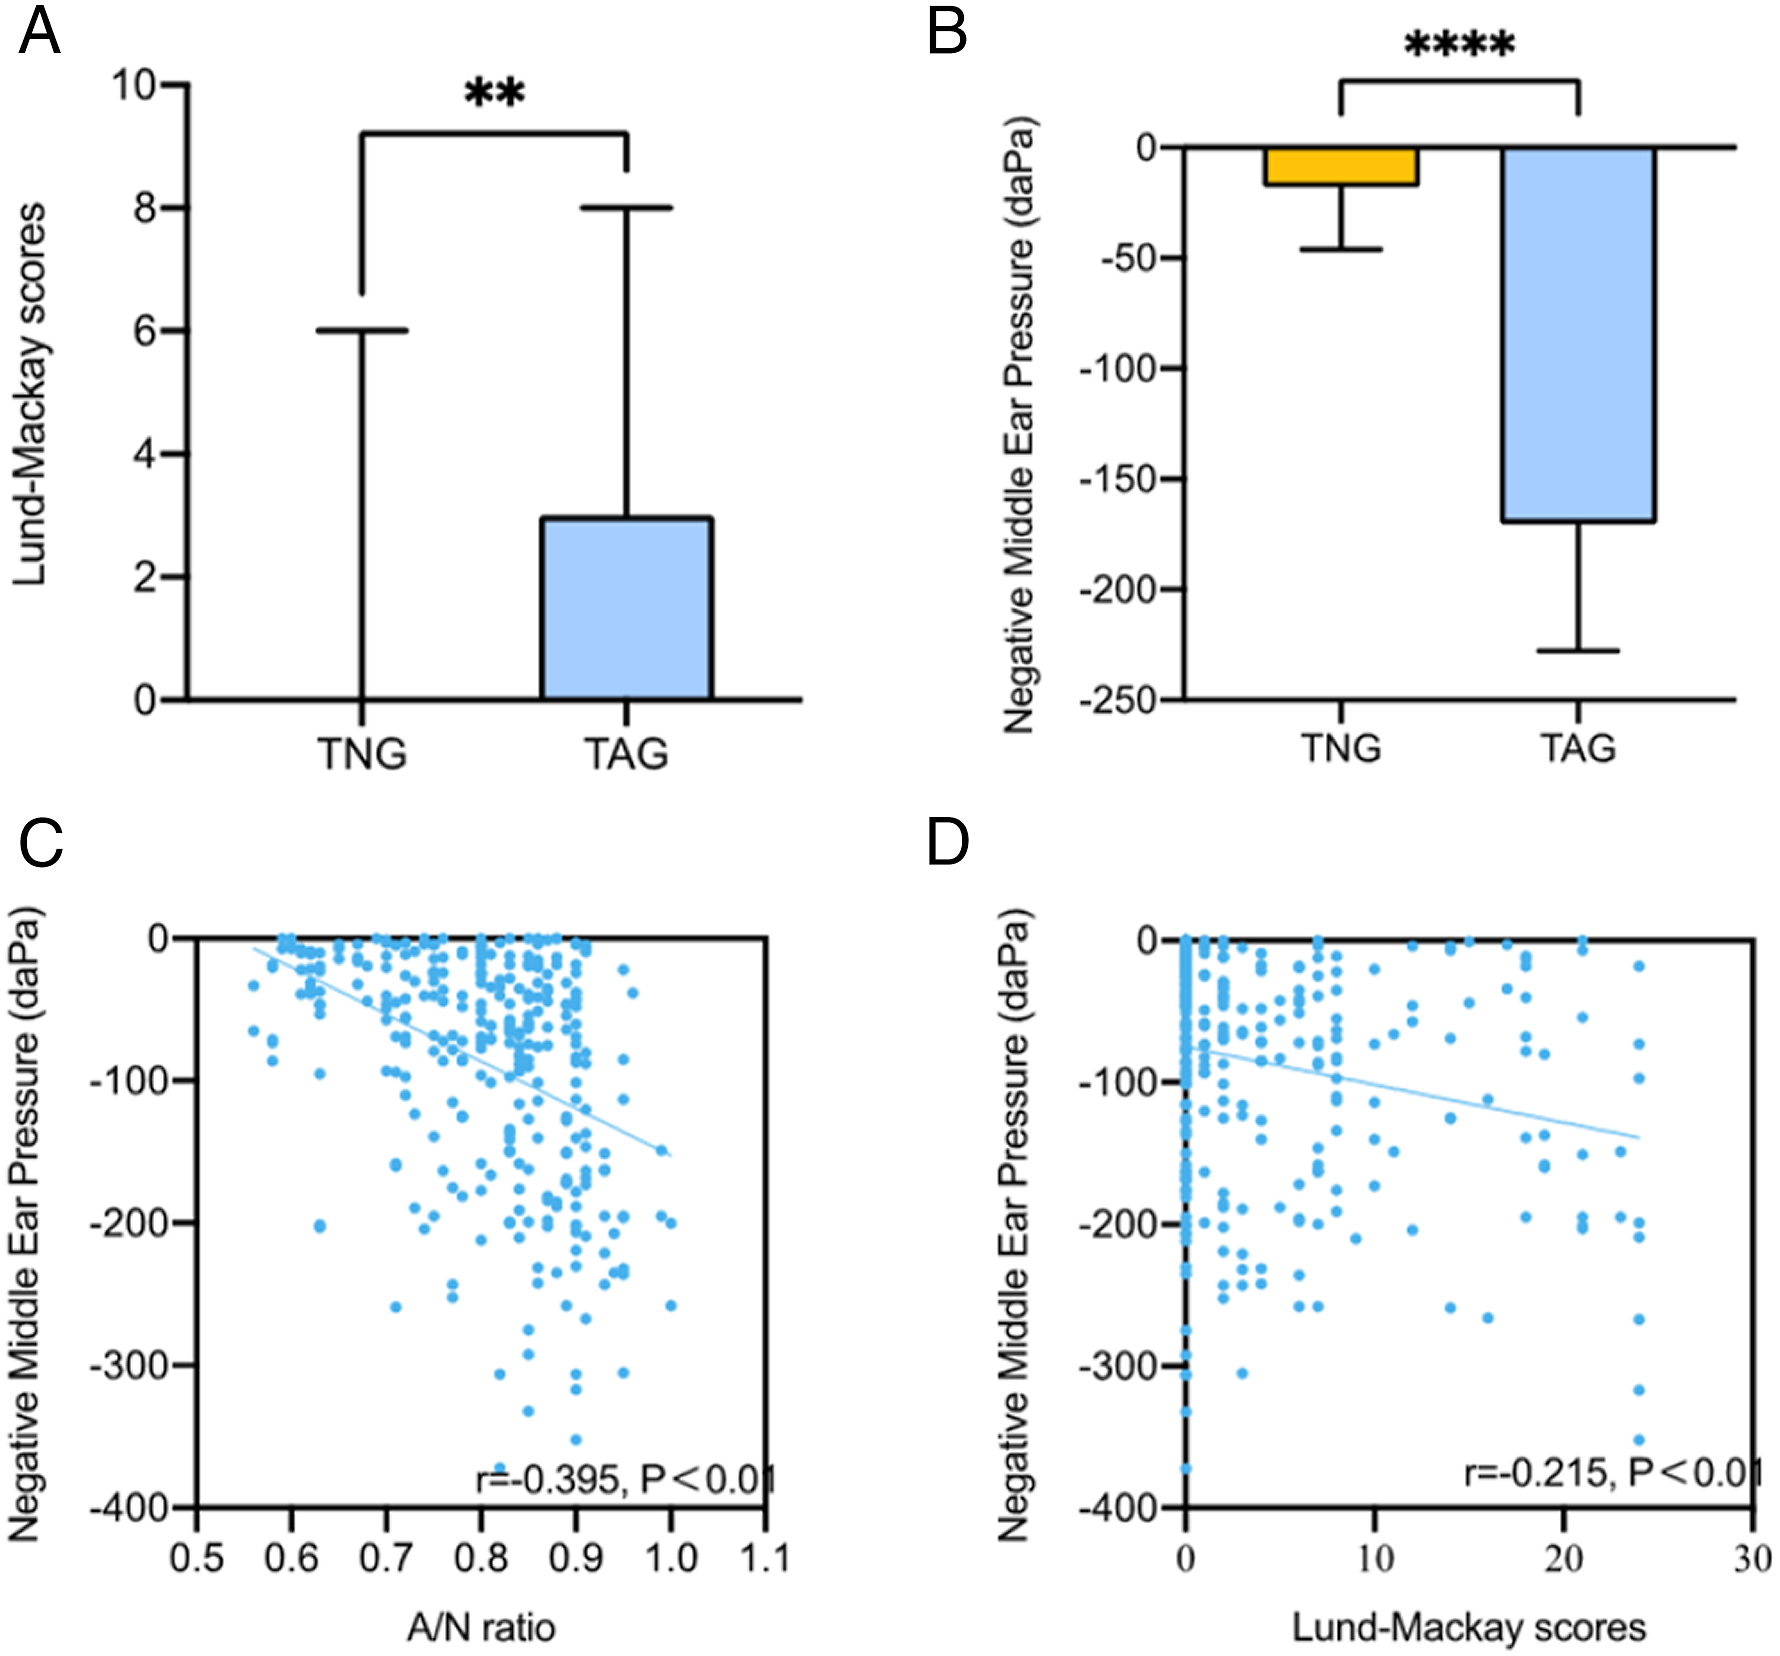
4. Laboratory Examination in TNG and TAG
Blood test
Median eosinophil count of TNG and TAG were 0.21(0.13–0.35) and 0.18(0.12–0.27), and eosinophil ratio of TNG and TAG were 3.10% (1.90%–4.70%) were 2.50% (1.65%–3.80%). Both the count and ratio of eosinophil in TNG were higher than TAG with significant meaning (Z = −1.064 P = .049; Z = −2.823 P = .005, Table 1).
Allergen detection
Allergen Detection Results in Adenoid Hypertrophy Patients.
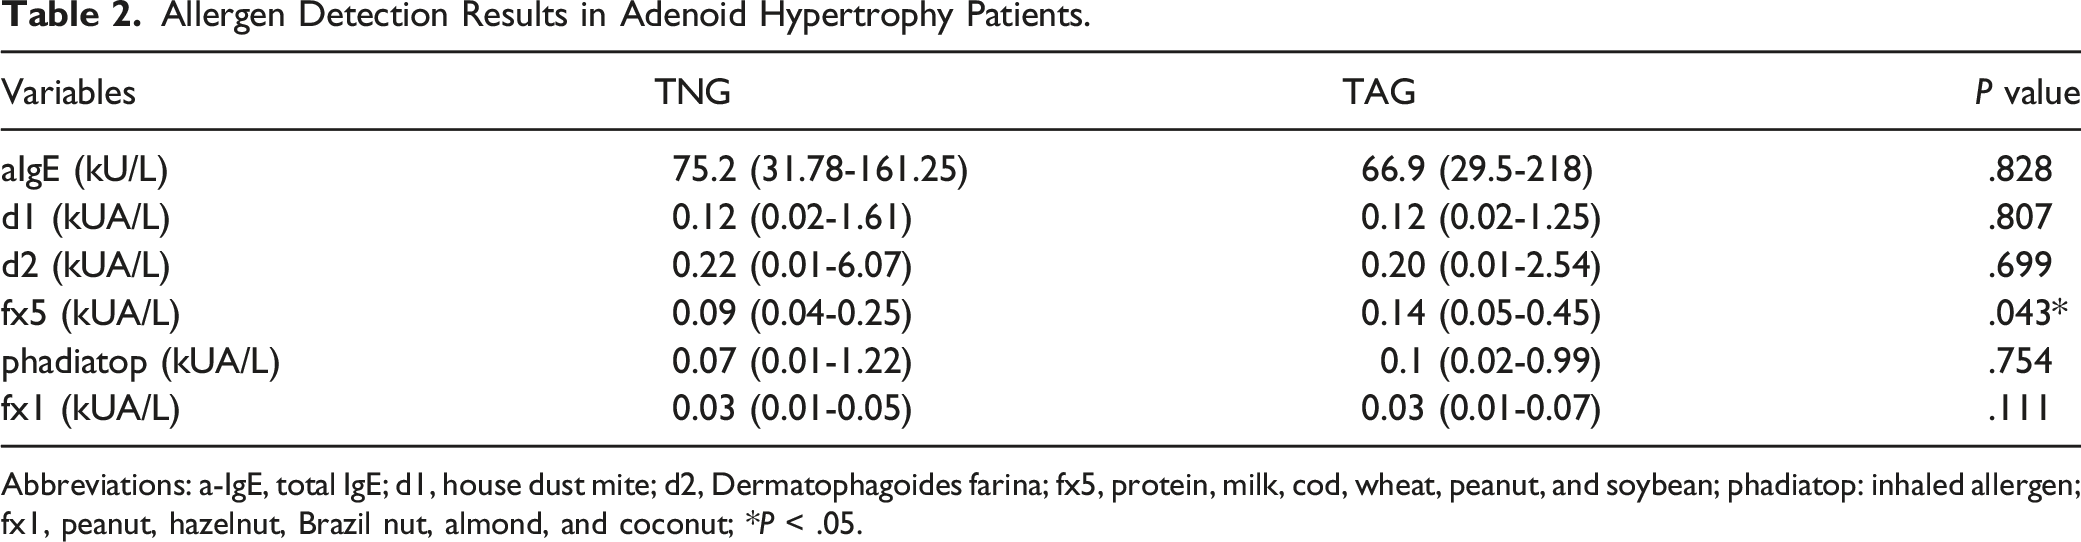
Abbreviations: a-IgE, total IgE; d1, house dust mite; d2, Dermatophagoides farina; fx5, protein, milk, cod, wheat, peanut, and soybean; phadiatop: inhaled allergen; fx1, peanut, hazelnut, Brazil nut, almond, and coconut; * P < .05.
Pure tone audiometry
Types of Hearing Loss (each ear).
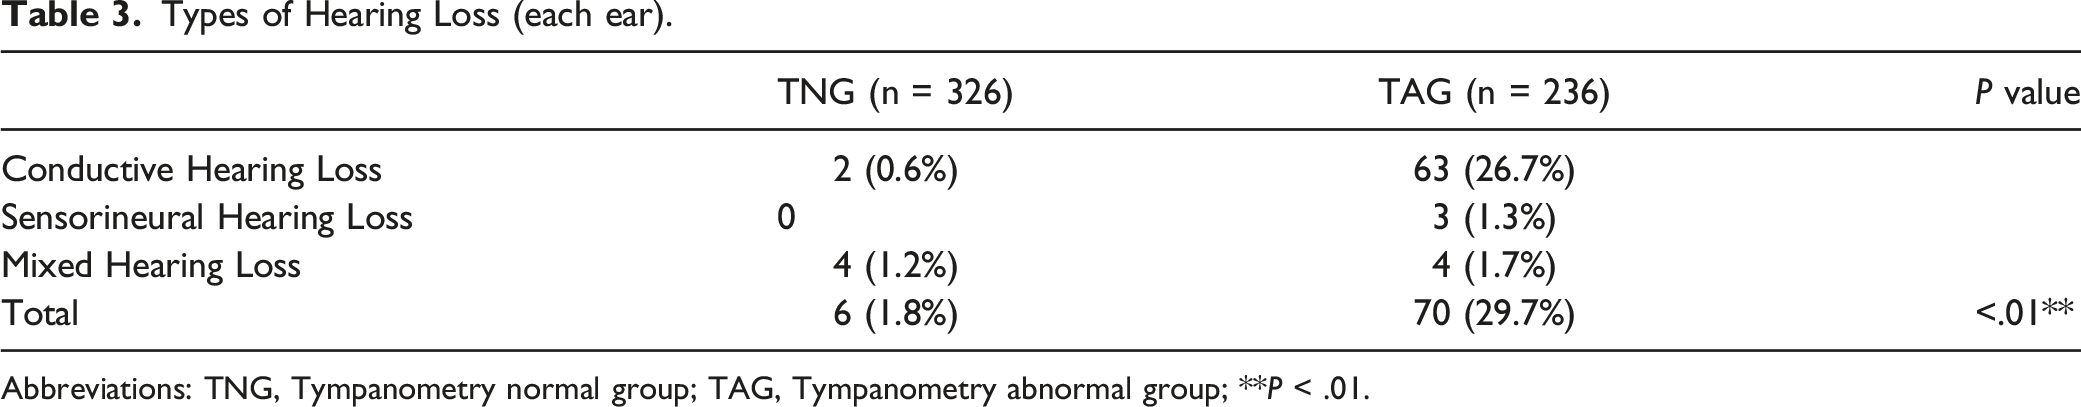
Abbreviations: TNG, Tympanometry normal group; TAG, Tympanometry abnormal group; ** P < .01.
5. Logistic Regression and ROC curve
Multivariate Logistic Regression Associated with OME.
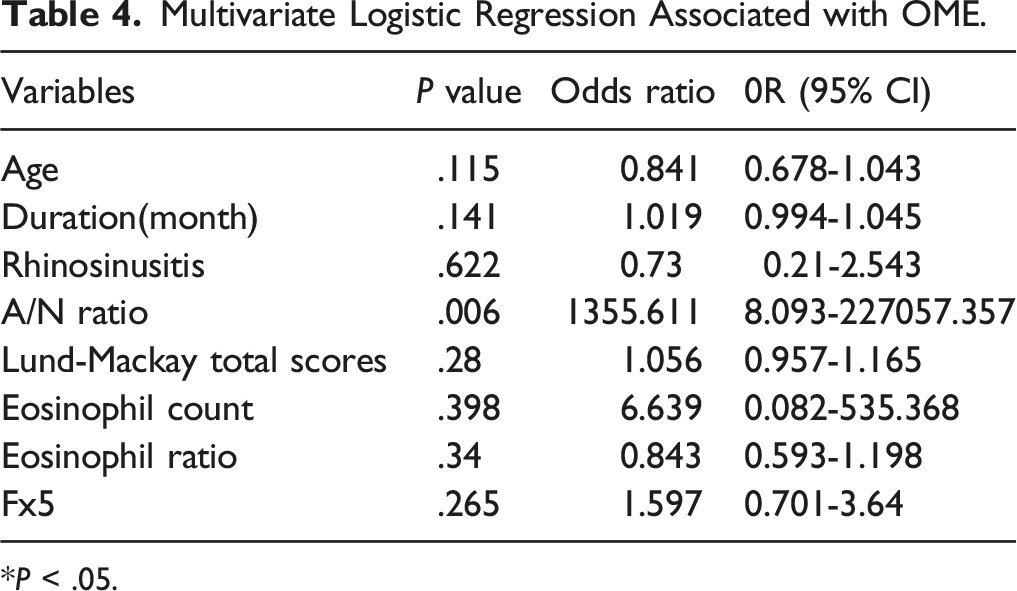
* P < .05.
ROC Curve.
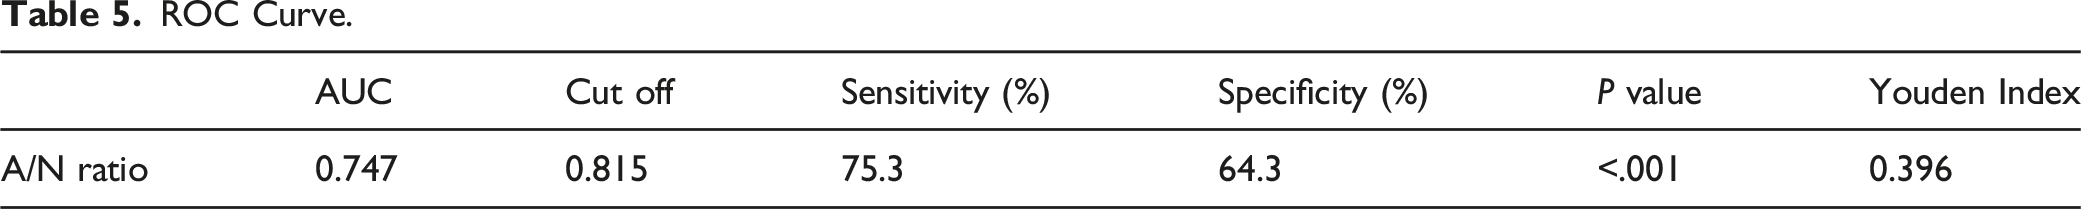
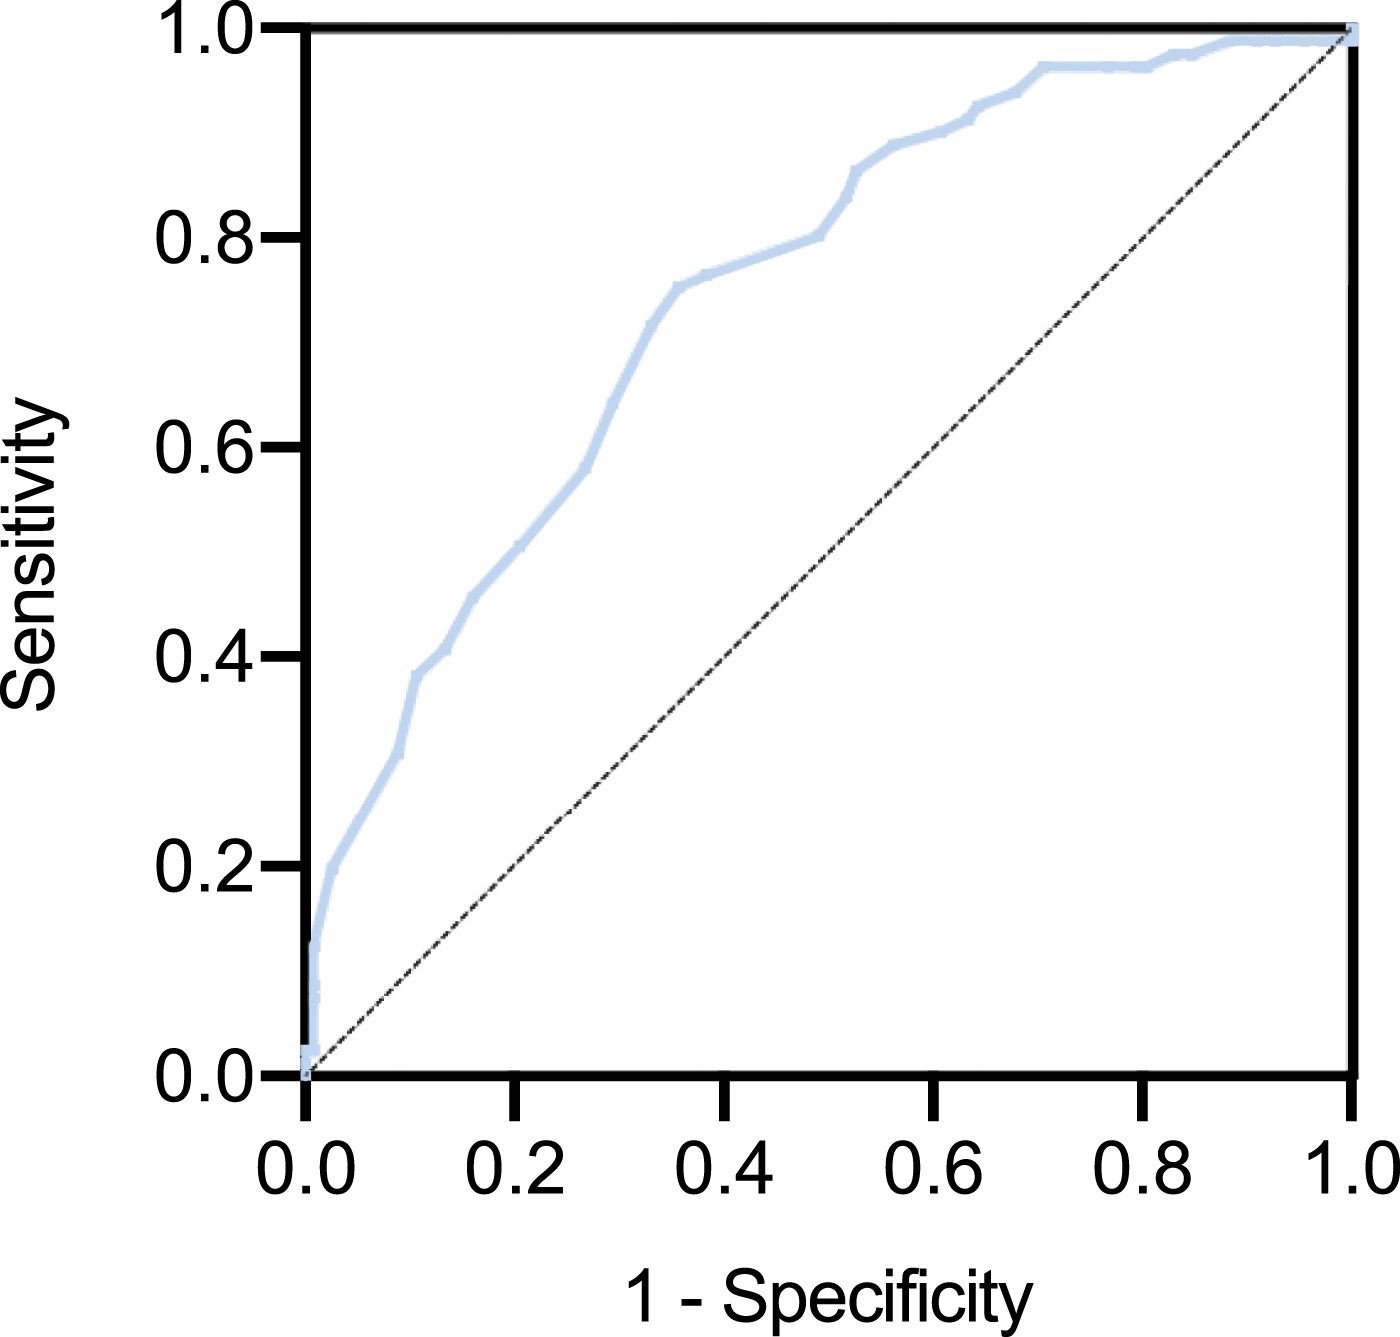
ROC curve of A/N ratio sensitivity: 75.3%, specificity: 64.3%, AUC: 0.747.
Discussion
In this study, the median age of TAG was 5 years and TNG was 6 years, the two groups had a negative correlation which means that the younger children have a greater possibility of getting OME according to the guideline. 13 The duration of TAG is shorter than TNG, and the reason could be that AH without OME children had milder clinical symptoms than those with OME in that uncomplicated AH patients came to see doctors much later.
Lund-Mackay score, the evaluation of sinus lesions, represented rhinosinusitis to some degree. In this study, AH with OME children was more easily combined with rhinosinusitis. Daval et al. 17 reported the same view that OME correlated with chronic rhinosinusitis (CRS). The mechanism possible is: (1) CRS resulted to eustachian tube dysfunction; (2) obstruction of eustachian tube; and (3) congestion or inflammation of nasal and middle ear mucosae. 17 –19 Negative middle ear pressure was associated with A/N ratio that negative pressure decreased with A/N ratio increasing, which is consistent with the study of Sogebi. 10
In the allergen we detected, only fx5 had a statistical difference between uncomplicated AH children and AH with OME children. This study told us that AH with OME children might have a greater chance of getting the allergic disease, moreover, we might see patients with allergic diseases are easier to get AH with OME. When we focus on the blood test results, it’s interesting to know that eosinophil count and ratio in TAG were lower than TNG, contrasting to the allergy outcomes. Many studies mentioned eosinophilic otitis media with eosinophilia in peripheral blood increasing, 20,21 also contrary to this study. There is still controversy about whether OME is associated with allergy. 6 Aydoğan 22 reported 44.6% of OME patients had food allergies. Corso 23 reported a connection between allergy and OME, but the relationship is uncertain and in conflict. A review by Zernotti mentioned that age could affect the relationship between allergy and OME. 24 In the review of Ciprandi, 25 OME children with an allergy could reach up to 90%, but the mechanism between allergy and OME still didn’t figure out without robust evidence of them.
In our study, children took a higher proportion of conductive hearing loss, and the median hearing loss of AH with OME children was 10(5–20) dB HL, which was lower than Cai reported averages of 18–35 dB HL. 26 Due to the variety of individuals, facilities, and degree of cooperation, could have differences between different studies. Though we excluded the children whose ages were below 5 years, PTA was still a subjective examination with errors that couldn't rely on its accuracy.
11.1% AH combined with OME children with hearing impairment when they saw the doctors, but 88.9% of children were asymptomatic, consistent with the study of Sogebi. 10 Most children and their guardians don’t realize the hearing loss problem. Most children could recure, but the rest could develop severe outcomes. From some perspective, using A/N ratio as a tool to predict OME has its unique value because it is calculated from CT or Lateral X-ray, which could get much information about other diseases, in that way, patients could reduce their economic cost. But in another way, the accuracy of A/N ratio remains controversial. A review by Baldassari 27 said A/N ratio could be affected by patients’ position and a review by Feres said the utility of A/N ratio could not be proven because of the difference in measurement. 28 Besides, this study couldn’t explain the difference between Visual obstruction ratio and A/N ratio from doctors’ subjective measurement errors or the difference in the length of left-right and up-down of adenoid. Same as Caylakli. 29 This study also found Visual obstruction ratio and A/N ratio had a positive correlation. Although they had a statistical difference, they reflected the same phenomenon which means A/N ratio could represent the size of adenoid. To some extent, A/N ratio was more objective and tolerable compared to nasal endoscopy, and it can be an index to predict the happening of OME.
Conclusion
In summary, patients in TAG with higher A/N ratio and Lund-Mackay scores, both had negative correlations with Negative Middle Ear Pressure. It indicated that children with larger size of adenoid have more possibility to get OME and AH with OME children more easily have CRS than AH without OME children. From multivariate logistic regression and ROC curve, A/N ratio was an associated factor of OME, in that we can use A/N ratio as an index to predict OME in AH children when A/N ratio reaches up to 0.815.
Supplemental Material
Supplemental Material - Predictive value of adenoid-nasopharyngeal ratio in the diagnosis of secretory otitis media
Supplemental Material for Predictive value of adenoid-nasopharyngeal ratio in the diagnosis of secretory otitis media by Ping Li, Tao Li, Liang Yu, Aiping Chen, Yisha Wu, Yuzhu Wan and Li Shi in Ear, Nose & Throat Journal
Footnotes
Acknowledgments
We thank all colleagues in the Department of Otolaryngology Head & Neck Surgery, Shandong Provincial ENT Hospital, Shandong University.
Declaration of Conflicting Interests
The author(s) declared no potential conflicts of interest with respect to the research, authorship, and/or publication of this article.
Funding
The author(s) disclosed receipt of the following financial support for the research, authorship, and/or publication of this article: This work was supported by the National Natural Science Foundation of China (81670909, 81873692); Key R&D Program of Shandong Province (2018CXGC1214).
Ethics Approval
Ethical approval to report this case was obtained from Shandong Provincial ENT Hospital ethical committee (number: XYK20190103).
Statement of Human and Animal Rights
All procedures in this study were conducted in accordance with the Shandong Provincial ENT Hospital ethical committee (number: XYK20190103) approved protocols. This article does not contain any studies animal subjects.
Informed Consent
Written informed consent was obtained from the guardians of the patients for their anonymized information to be published in this article.
Supplemental Material
Supplemental material for this article is available online.
References
Supplementary Material
Please find the following supplemental material available below.
For Open Access articles published under a Creative Commons License, all supplemental material carries the same license as the article it is associated with.
For non-Open Access articles published, all supplemental material carries a non-exclusive license, and permission requests for re-use of supplemental material or any part of supplemental material shall be sent directly to the copyright owner as specified in the copyright notice associated with the article.