
Abstract
The rapid rise in building construction creates the energy demand for nearly half of the world's energy demand. To minimize energy consumption in buildings, a concept called net-zero energy building (NZEB) is gaining popularity in developing countries and is being implemented in India as well. The NZEB aims to match the on-site renewable energy generation available at the building location with the building energy consumption (BEC) without relying on grid energy. To attain this concept in a real-time scenario, it requires information about the energy generation at the building and the energy consumption at each instant. It is necessary to predict the dynamically varying building loads to easily manage the available sources without the involvement of the grid. This can be achieved by designing an accurate prediction model. This article presents a comparative assessment of recent metaheuristic algorithms for hyperparameter optimization of a support vector regression (SVR) model to enhance the prediction performance of BEC. The analysis was conducted using hourly campus-scale energy consumption data collected from the National Institute of Technology Silchar, Assam, India, from 1 March 2018 to 29 February 2020, comprising 17,544 samples. The Polar Fox Optimization algorithm, Flood Algorithm, and Hiking Optimization Algorithm (HOA) were comparatively evaluated for SVR hyperparameter tuning in this application. The mean absolute error (MAE), mean absolute percentage error (MAPE), root mean squared error (RMSE), R2, percentage BIAS (PBIAS), and Willmott's Index (WI) error metrics are used to evaluate the performance of the optimized SVR models. The recently developed HOA algorithm exhibits better prediction accuracy with an MAE of 8.3099 kWh, RMSE of 11.1283 kWh, R2 of 0.9986, MAPE of 2.7820%, PBIAS of −0.0759%, and WI of 0.9996 when compared to other models. The comparative results for different models show that the recent metaheuristic optimization methods can improve the performance of SVR model for accurate BEC prediction in NZEB applications.
Keywords
Introduction
Developed and developing countries are focused on the growth of urbanization. This creates a rapid rise in building construction in both residential and commercial sectors. This causes a huge energy demand from the building loads. The energy consumption by buildings is around 40%–50% of the total world's energy consumption. Many developed countries observed this problem and started a concept called net-zero energy buildings (NZEBs) in 2010 (Omrany et al., 2022). The target of NZEB is to encourage the on-site renewable energy sources available at the building location to satisfy its electrical demand and be independent of the grid's energy. But due to the intermittent nature of renewable energy sources, it is impossible to balance on-site generation to satisfy building loads (Christopher et al., 2023). So, the grid is connected and acts as a buffer whenever energy is deficient from the on-site generation. If the on-site generation is surplus, then the excess energy is supplied to the grid. However, the energy transactions between the on-site generation and the grid should be zero for a year. There are many advantages of the NZEBs in terms of reducing the usage of fossil fuels, enhancing the occupants’ comfort, reducing the toxic gases into the atmosphere, and encouraging different possible renewable energy generation(Bala Krishna et al., 2046; Thota & Sinha, 2022, 2023), encouraging energy-efficient practices, and less dependency on grid energy (Chen et al., 2025).
The target of the NZEBs is to balance the on-site renewable energy generation and the building load. This will raise two issues: one is managing or scheduling the available on-site renewable resources, and the second is predicting the energy consumption of the buildings (Chen et al., 2025). This research work considers the second issue, that is, the prediction of the energy consumption of the buildings. Since even if some want to schedule or manage the resources, first they must know about the current and future electricity demand. This context motivates the authors to initiate research on the prediction of the energy consumption problem in the NZEBs. The solution for this problem is to design a data-driven model that predicts energy consumption with good accuracy (Chen et al., 2025; Khalil et al., 2022; Yang et al., 2025). Many machine learning (ML) models have been applied to load prediction problems using different datasets (Ji et al., 2025). Previous investigation on the same dataset indicated that support vector regression (SVR) provides competitive prediction performance among commonly used ML models, which supports its selection as the core predictive model in the present study (Thota and Sinha, 2024). The authors in this article present some investigations on model selection with their proposed dataset (Zhong et al., 2019), and implemented on the same dataset on popular ML algorithms, linear regression, AdaBoost, random forest (RF), K-nearest neighbor, SVR, and recurrent neural network in that investigation. This investigation reveals that the SVR performs well with that dataset. So, in this work, directly considered the SVR model for the prediction of energy consumption in the NZEB scenario.
As discussed above, many ML models have been implemented for this research problem. So, anyhow, the authors selected the SVR model for solving the current issue. However, the fact is that SVR has already been implemented in previous works for similar tasks (Liu et al., 2020). For any ML model, the objective is to enhance the prediction accuracy (Thota et al., 2025). In this direction, the authors decided to enhance the prediction accuracy of the SVR model. It can be possible by tuning the hyperparameters of the SVR model. This is the current trend of research on improving the accuracy of the ML model. This work aims to enhance the prediction accuracy of the SVR model by optimizing key hyperparameters using advanced optimization algorithms. One way to enhance prediction accuracy is by tuning the hyperparameters of a ML model. Previously, conventional methods such as Grid Search (GS) and Random Search (RS) were used for optimizing the hyperparameters of the predictive model. These methods are simple and easy to implement for different models for different applications. The authors in the reference (Zhang et al., 2014) proposed an SVR model for the prediction of short-term wind power. The performance of the SVR model has been enhanced by tuning hyperparameters using a grid search optimization algorithm when compared with the conventional approaches, like neural networks. The article (Shams et al., 2024) presents the optimized ML models, such as gradient boosting and multilayer perceptron, using the grid search method for tuning the hyperparameters to enhance the water quality index prediction performance. The authors proposed a random search optimization technique to optimize the hyperparameters of the LSTM model to enhance the performance of the regional streamflow and water level prediction in (Hosseini et al., 2024). The GS and RS methods are designed without intelligence. Hence, there are a few drawbacks of these methods, like failing to achieve the global optimum solutions. The next level of optimization algorithm is based on probabilistic models called the Bayesian optimization (BO) algorithm (Wu et al., 2019), which is designed on the principle of Bayes’ theorem. The article (Elshewey et al., 2023) developed the BO-based SVR model (BO-SVR) with better accuracy for classifying Parkinson's disease using clinical and sensor data. The article (Ramadevi and Das, 2024) proposed a BO-SVR for the classification of chest X-ray images that achieves higher accuracy compared with the default SVR and a convolutional neural network.
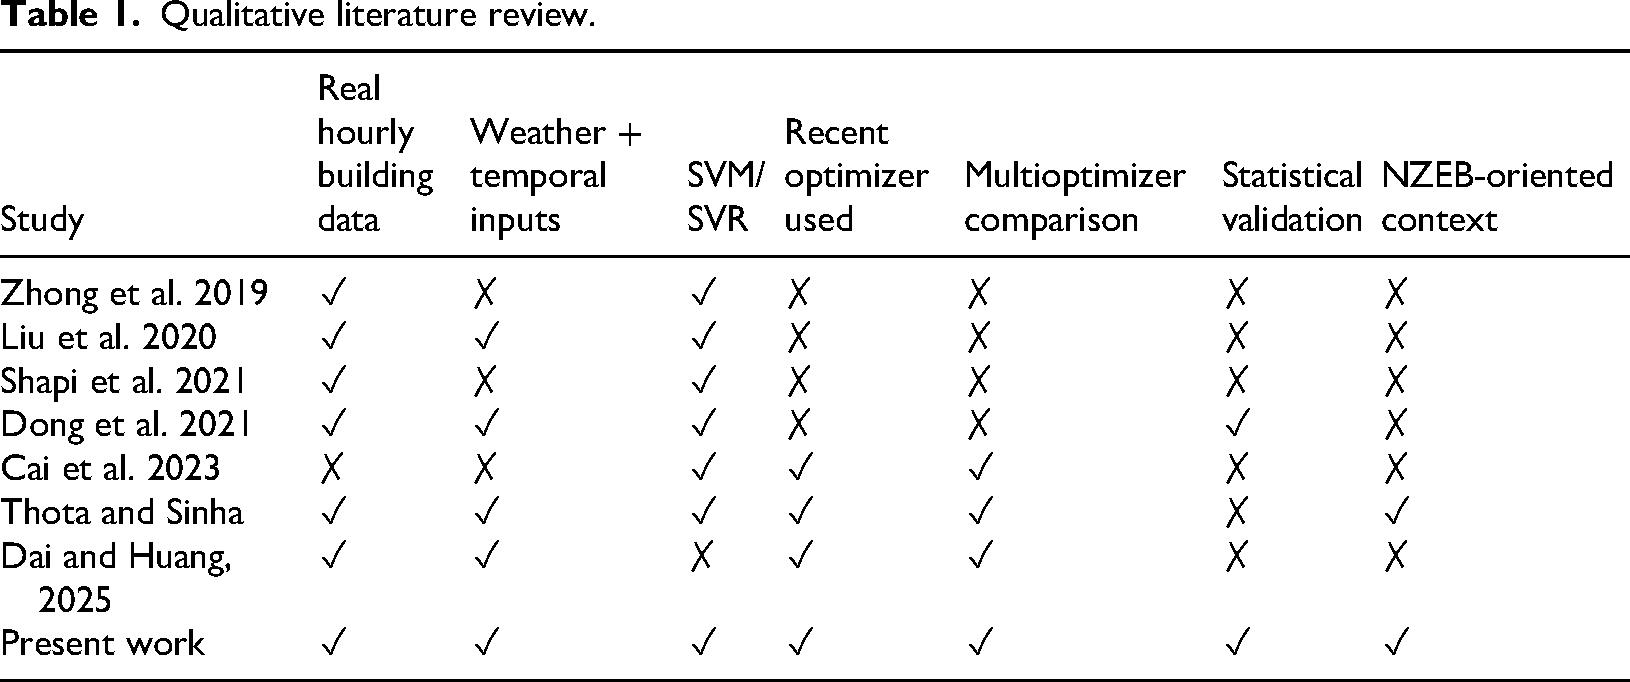
Later, metaheuristic algorithms were applied to tune the model's hyperparameters. These algorithms are designed based on the intelligence of human behavior, swarm behavior, and concepts from physics and mathematics. SVM, ANN, and k-NN models were implemented on Microsoft Azure for energy consumption prediction, where k-NN, optimized via hyperparameter tuning, achieved the best performance (mean absolute percentage error [MAPE] ∼20%) (Shapi et al., 2021). An optimized ensemble learning method with pattern classification was used, where Decision Trees classified energy patterns, and optimized ensemble models (like Boosted Trees) achieved superior accuracy, reducing CVRMSE by 17.7% (Dong et al., 2021). The article (Cai et al., 2023) presented different metaheuristic-based SVR models that optimize the different parameters for enhancing the prediction accuracy of the energy consumption in buildings. The authors in the article (Dai and Huang, 2025) worked on improving the prediction accuracy for the same task by optimizing different models, such as LightGBM, RF, and XGBoost, with the help of various advanced algorithms, and this analysis revealed that the LightGBM model outperforms. The article (Mahmoodzadeh et al., 2022) employs SVR combined with metaheuristic optimization algorithms such as GA, PSO, and GWO to predict Mode-I rock fracture toughness (Algamal et al., 2021; Fan et al., 2025; Liang and Chen, 2025; Wan et al., 2025). Among these, the GWO-optimized SVR model outperforms others, delivering the highest prediction accuracy and demonstrating its effectiveness in modeling complex fracture behaviors. The authors in the article (Zhou et al., 2021) optimize an SVM model using metaheuristic algorithms, including PSO, GA, and ACO, to forecast the Tunnel Boring Machine (TBM) advance rate. The results show that PSO-optimized SVM delivers superior predictive performance, effectively capturing the nonlinearities in TBM operation data. In a broader predictive modeling context, recent studies have also emphasized the value of hybrid optimization strategies, feature-selection-driven learning, and metaheuristic-guided model enhancement, which further support the relevance of comparative optimizer assessment in forecasting problems (Karthiga et al., 2022, 2024, 2025; Vijaya et al., 2026). There are many such metaheuristic-based optimizations of the SVR model that prove the enhanced performance for different tasks in different applications. To position the present study more clearly with respect to recent building energy consumption (BEC) prediction literature, a qualitative comparison of representative existing works and the present work is provided in Table 1.
Qualitative literature review.
In this direction, the current research work was inspired and implemented with the newly evolved metaheuristic algorithms for the SVR model optimization. Hence, the three algorithms, namely Polar Fox Optimization algorithm (PFOA), Flood Algorithm (FLA), and Hiking Optimization Algorithm (HOA), were considered in this work. These algorithms were based on the nature, swarm, and human intelligences and are specially designed for achieving the global solutions by balancing the two search phases called exploration and exploitation. The main aim of this work is a comparative assessment of recent metaheuristic algorithms for SVR hyperparameter optimization in hourly BEC prediction. These models were used for the first time to optimize the SVR model and also for the application of energy consumption prediction in NZEBs. The detailed discussion on the application of these three new algorithms is given in the subsequent sections.
The major contributions of the current research work are:
The recent metaheuristic optimization algorithms, such as PFOA, FLA, and HOA, were proposed for optimizing the hyperparameters of the SVR model to enhance the prediction accuracy of energy consumption in NZEBs. The conventional optimization methods (such as GS, RS, and BO) and the existing metaheuristic optimization methods (such as PSO, GWO, and AOA) were implemented for optimizing the hyperparameters of the SVR model to compare the performance of the proposed algorithms. The error metrics such as mean absolute error (MAE), root mean squared error (RMSE), R2, MAPE, percentage BIAS (PBIAS), and Willmott's Index (WI) were used to compare the performance of the existing and proposed algorithms for tuning the hyperparameters of the SVR. The comparative assessment identifies HOA algorithm outperforms all the existing and proposed algorithms, and this work suggests the HOA_SVR algorithm for tuning the SVR's hyperparameters as a better accuracy model.
The remaining part of the article is designed as follows: Section 2 discusses the complete methodology that includes data description, the concept of hyperparameter tuning in the SVR model using conventional, existing metaheuristic, and proposed metaheuristic algorithms, along with the pseudocodes. Section 3 gives the results and discussions on the optimization performance, model prediction performance, and statistical analysis. Section 4 concludes the article.
Methodology
Building energy consumption data
The dataset plays a major role in the prediction problem using data-driven ML models. The prediction accuracy completely depends on the quality and quantity of the dataset. It also depends on the features considered in the dataset for a particular prediction problem. In this direction, the proposed research work was conducted using the hourly energy consumption dataset of buildings at the National Institute of Technology, Silchar, Silchar City, Assam, India. Geographically, it occupies approximately 625 acres of land and lakes, and the coordinates of the institute are latitude of 24° 45′ 18″ north and a longitude of 92° 47′ 13″ east, given in Figure 1. The institute has several buildings, such as classroom galleries, department buildings, hostels, library, and quarters. The total connected load of the institute is 2138.60 kW. The hourly energy consumption data of the overall institute was provided by the Estate Engineering department. This department maintains the records of electrical energy-related data, and they helped in the preparation of the energy consumption data in kWh from 1st March 2018 to 29th February 2020. The total number of samples in the dataset is 17,544, pictorially given in Figure 2. The hourly average energy consumption is 443.15 kWh. The other features in the dataset are related to the weather data. The overall features of the dataset along with the statistical information are given in Table 2.
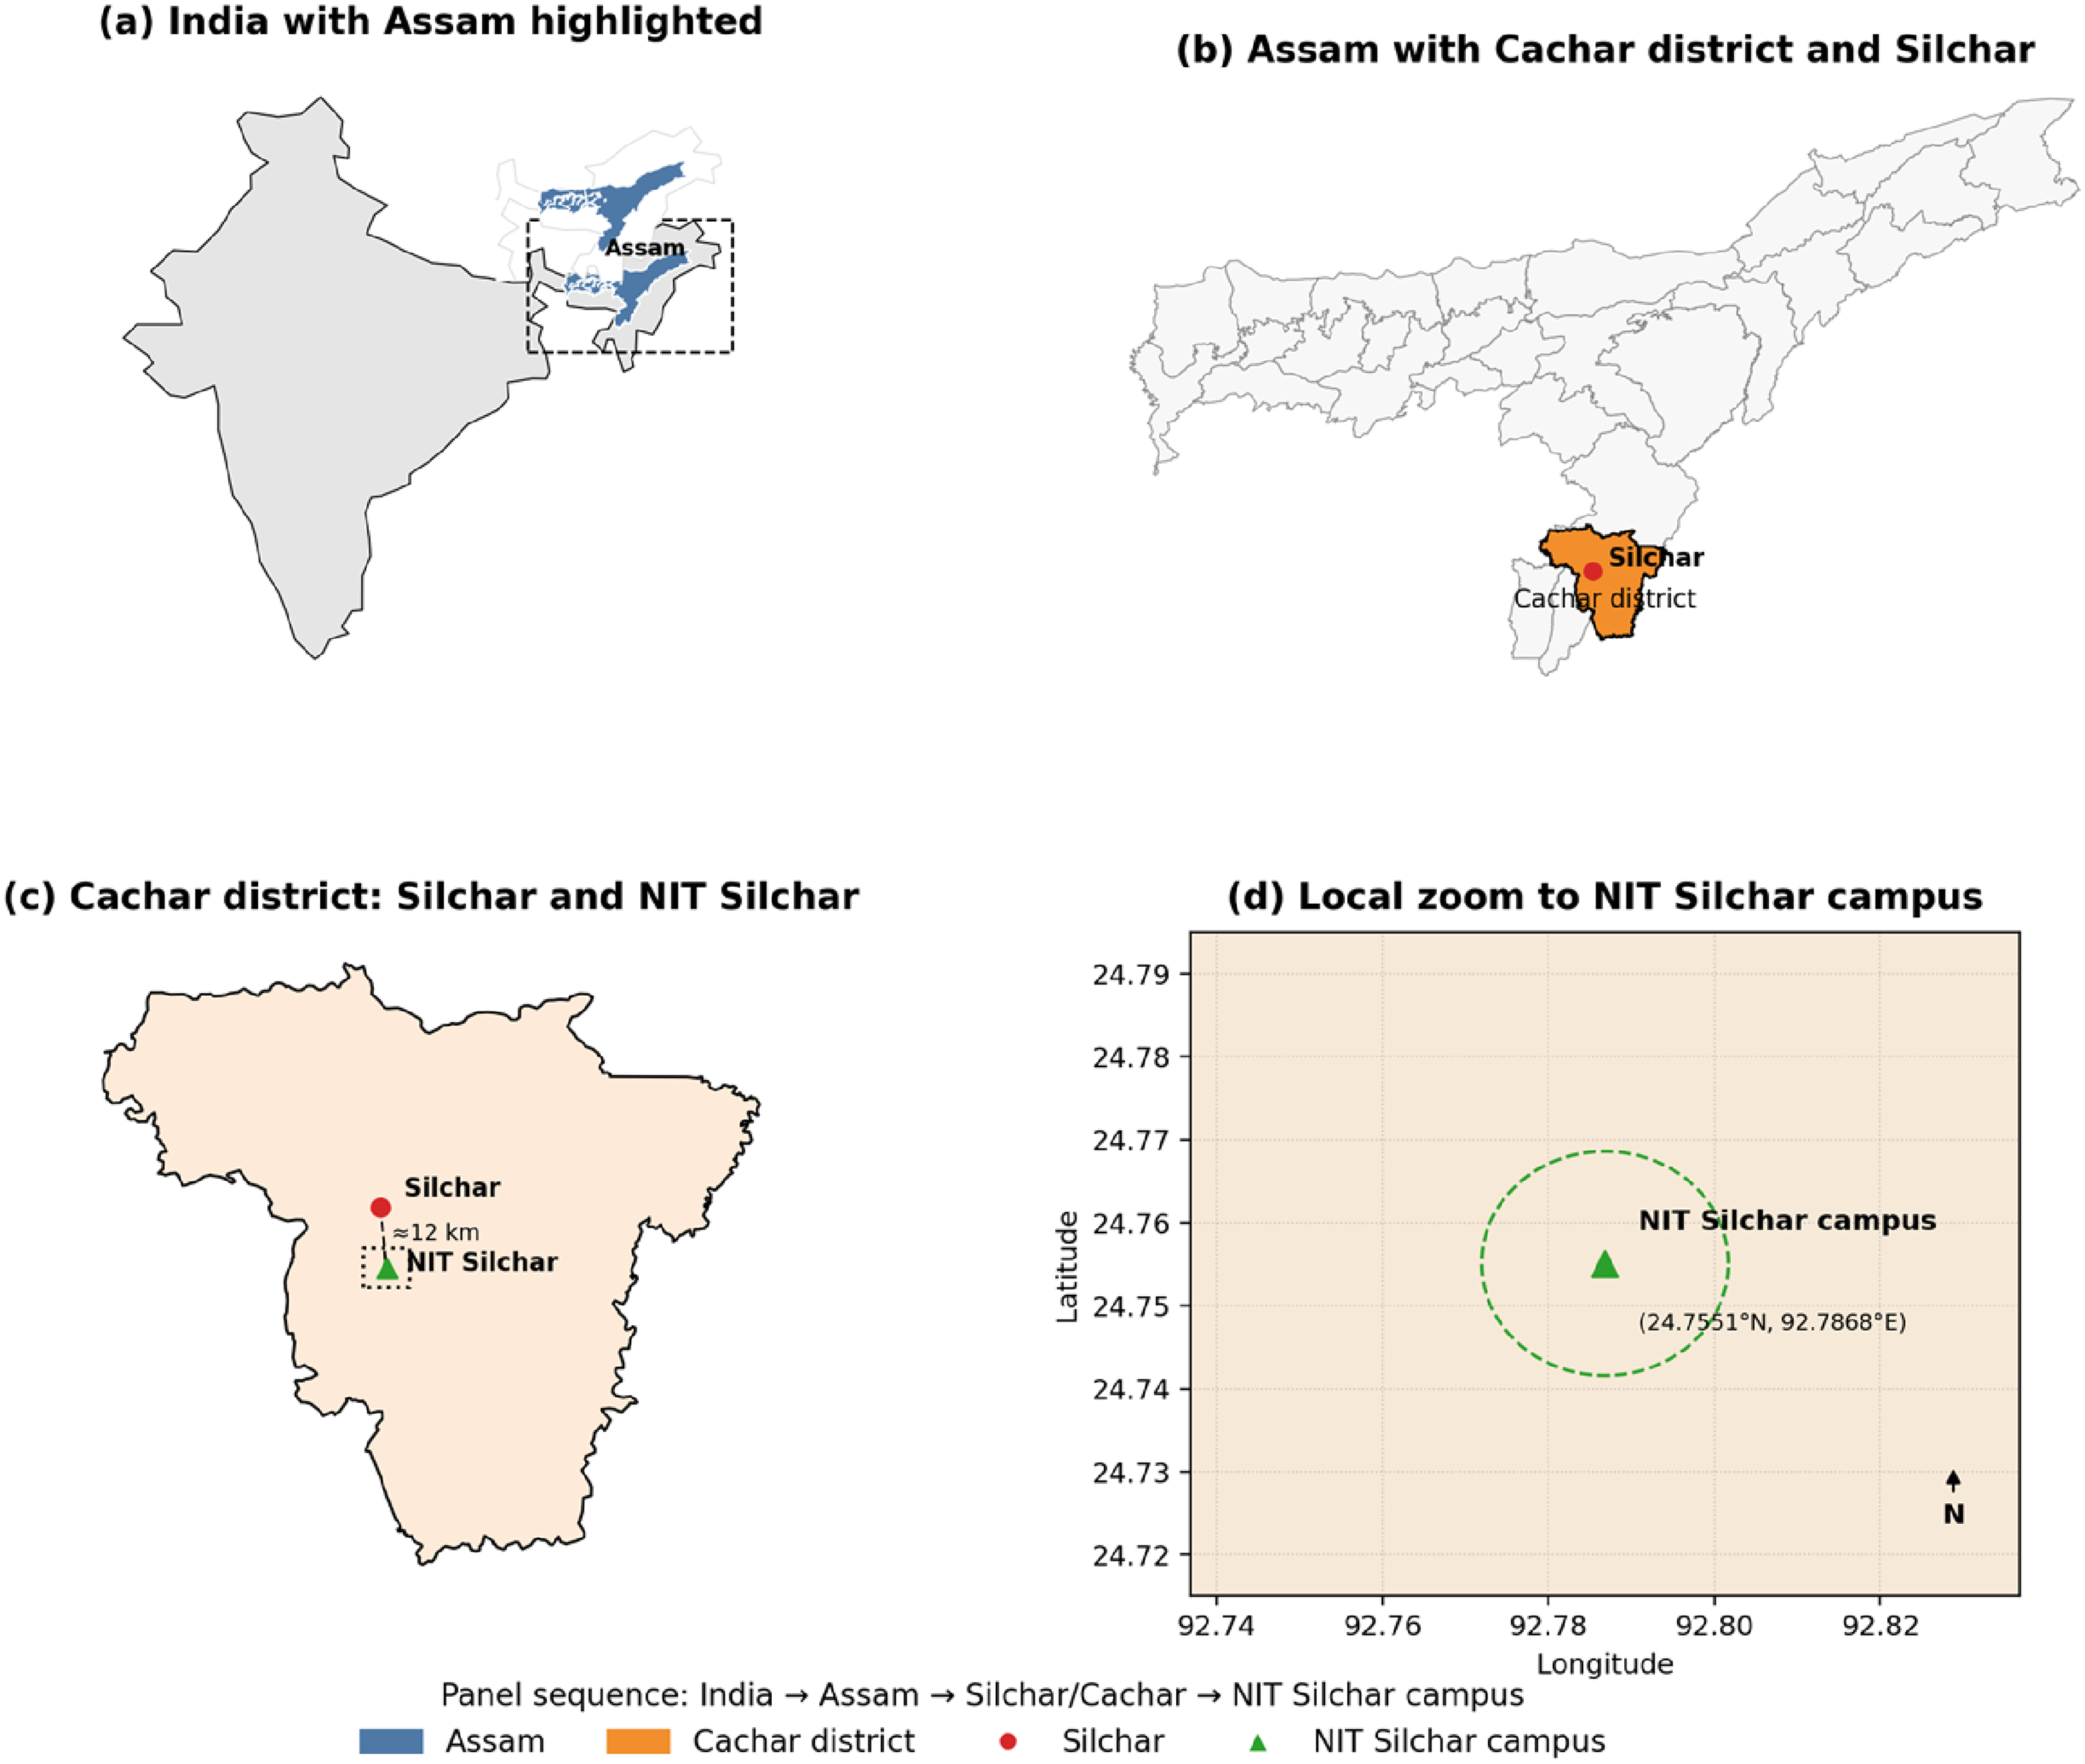
Experimental geographic location.
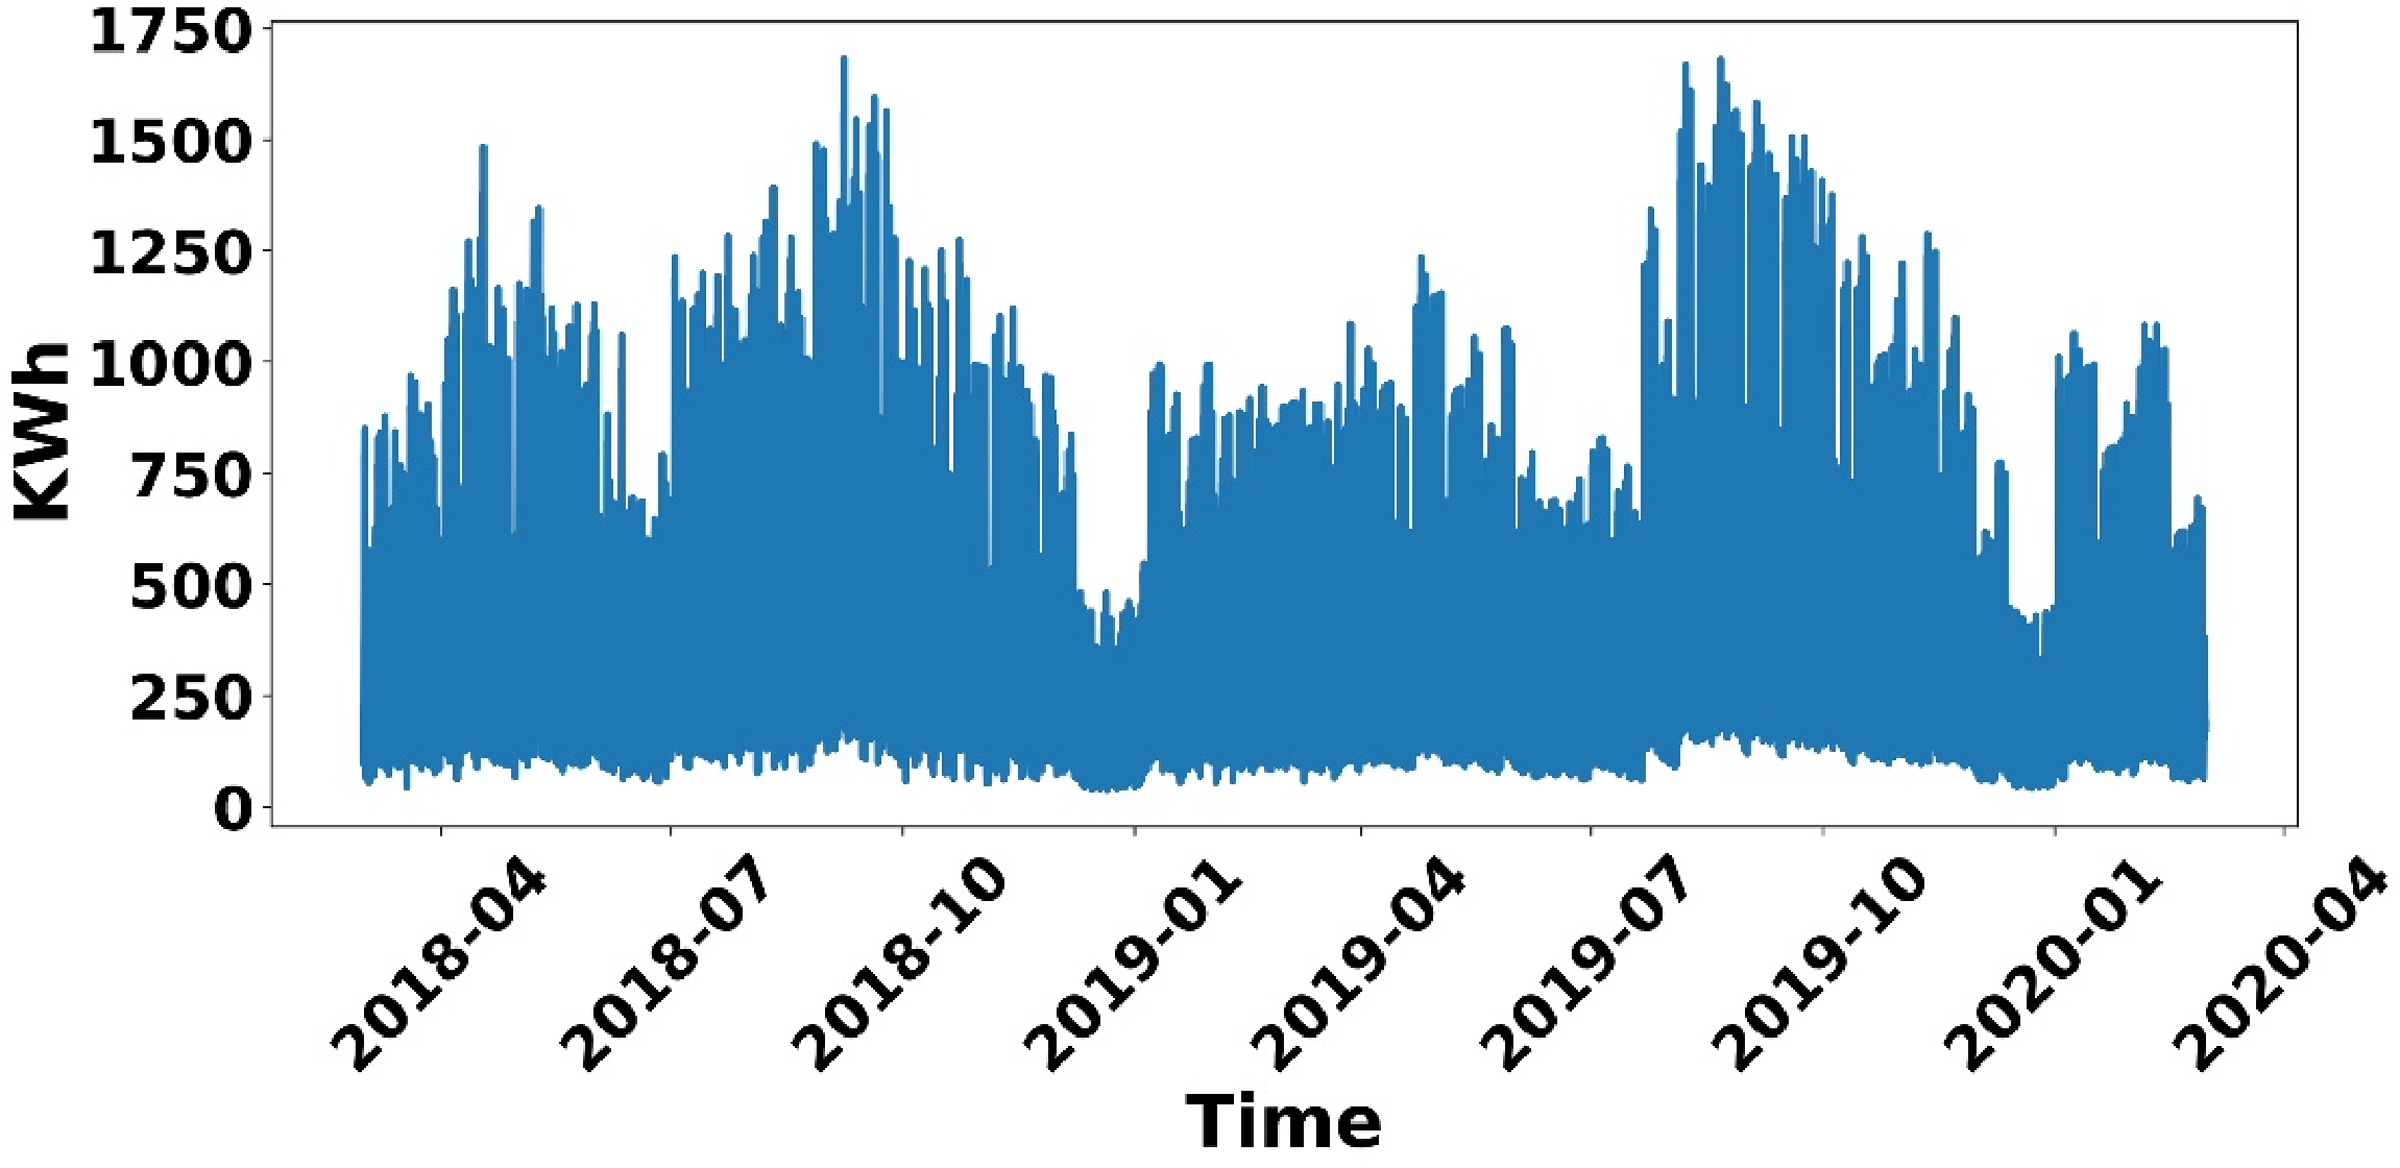
Hourly energy consumption data.
Statistical information for overall features.

Data preprocessing
The data collection is the first step in the prediction problem using ML models. The raw data are not efficient for training and testing the models. The raw dataset consists of many unwanted samples that may cause a lower accuracy of the model. The process of treating the raw dataset is called data preprocessing. Many preprocessing techniques are available in the literature that can be used to convert the raw dataset to a useful dataset. This useful or refined dataset does not consist of missing values, outliers, standardization, etc. The missing values or null values are replaced with the mean values. The outliers are removed from the raw dataset, which further improves the model performance. Also, feature transformation has been implemented using StandardScalar function from the python library. This feature transformation helps to convert all features into a symmetrical from which helps in better training of the ML models. After preprocessing of the dataset, the kWh feature is considered a target variable, and other variables are independent variables. Table 1 gives the complete information about the dataset features along with the statistical information of each feature. The correlation between all the features represented as a heatmap is given in Figure 3.

Heatmap for the processed dataset.
Model selection
The refined dataset, which is obtained after the preprocessing of the raw dataset, is now used to train and test the ML models. To do this, the dataset is divided into two parts: one is the training dataset of 80% of the total dataset, and another is the testing dataset of 20%. This can be easily accomplished using the train_test_split function in the Python platform. Now, the question is, which model is used to do this task? Yes, the selection of the model is also essential and difficult. Since the model with one dataset shows better accuracy, the same model may not perform well with another dataset. As discussed earlier, the nature of the dataset decides the performance of the model. The authors in Thota and Sinha (2024) investigated the same dataset with different popular models and concluded that the SVR model shows better prediction performance given in Figure 4. In this work, SVR was selected as the core predictive model due to its proven ability to capture complex nonlinear dependencies, generalize well with limited data, and its compatibility with optimization-based hyperparameter tuning. These strengths make SVR a suitable candidate for high-accuracy energy consumption prediction in NZEBs.
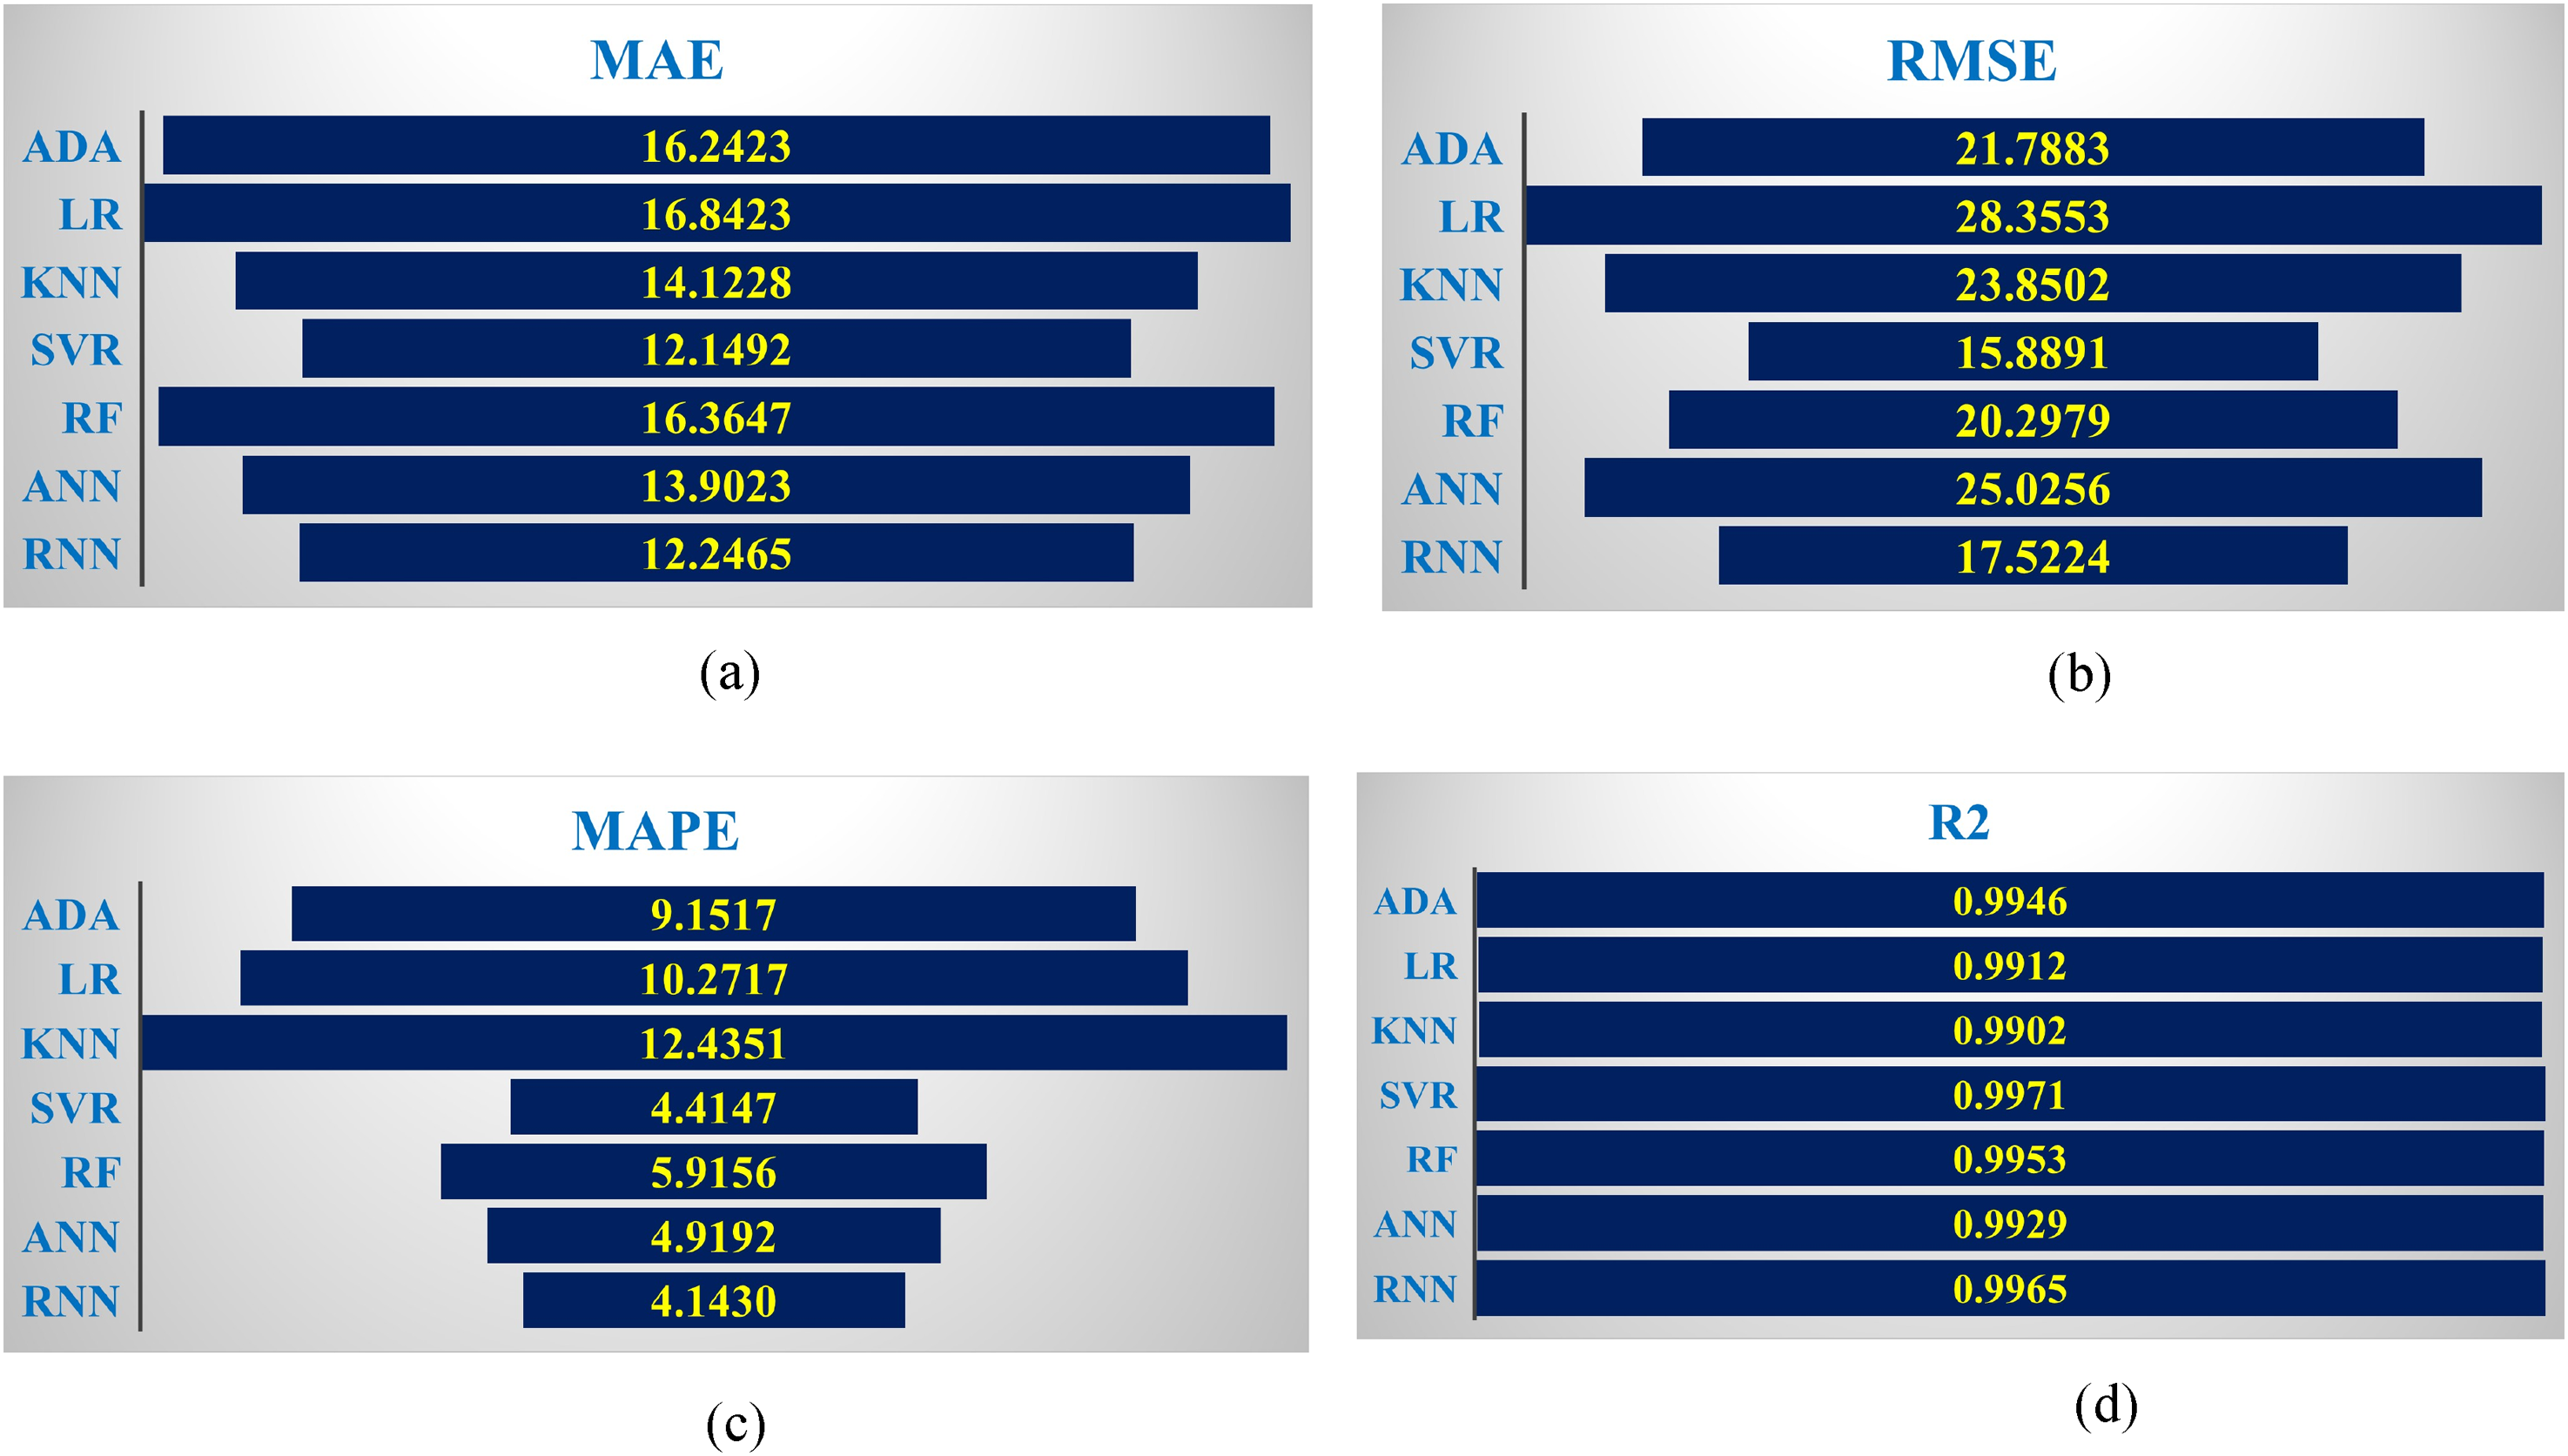
(a) Mean absolute error (MAE), (b) root mean squared error (RMSE), (c) mean absolute percentage error (MAPE), and (R2) values for different models.
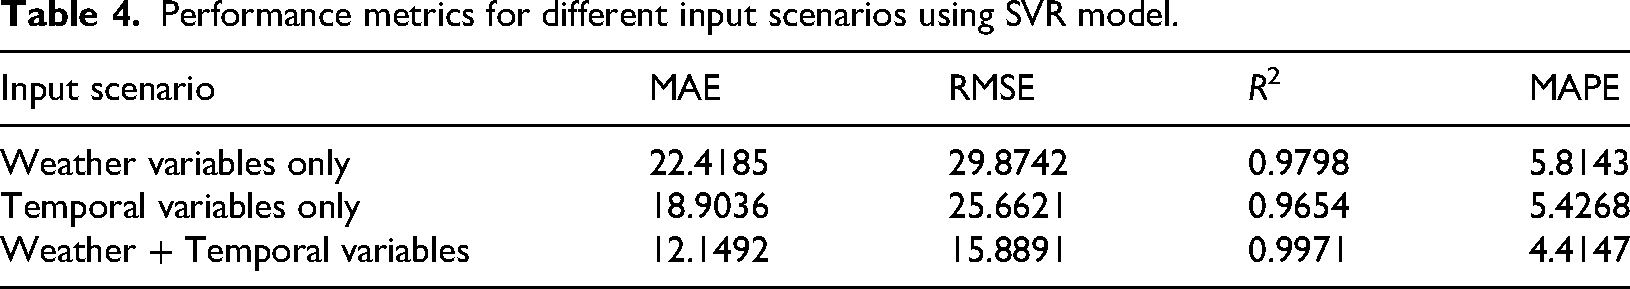
Input scenario screening using default SVR
The SVR model is selected from the above investigation as a core predictive model. The input scenario screening was conducted for checking the different input features group on the BEC prediction. To do this, three input scenarios were formed from the considered dataset. The scenario-1 defines the weather-related variables that influence BEC based on climatic conditions. The scenario-2 defines the temporal variables which are influence on seasonal consumption patterns. The scenario-3 is a combination of the first two scenarios, which is a both weather and temporal variables indirectly say full dataset given in Table 3. As a part of investigation, these three scenarios were evaluated with the selected SVR model. The performance of each input scenario was evaluated using standard popular error metrics given in Table 4. This performance comparison table reveals that the scenario-3 was selected a best input feature group, which is a combination of weather and temporal features.
Input scenarios.

Performance metrics for different input scenarios using SVR model.
Hyperparameter optimization of the SVR model
From the above investigations, it is selected an SVR model and the input feature group as scenario-3 for the hyperparameter tuning using both conventional and new metaheuristic algorithms to enhance the BEC prediction accuracy. Before training the ML model, it is crucial to design the model's hyperparameters. Every model is a mathematical representation of dependent and independent features, consisting of many design parameters (constants and variables). These variables are called hyperparameters. These hyperparameters will influence the model's performance in terms of prediction accuracy. Generally, in Python programming, each ML model is designed with default hyperparameters and is available in open-source packages. Now, the biggest challenge to the researchers is how to enhance the model's performance. In this direction, metaheuristic optimization algorithms are used to optimize these hyperparameters for a particular dataset, which improves the prediction accuracy.
The different optimization methods, from the conventional to the recently evolved metaheuristic algorithms, are implemented on the SVR model to tune the very important hyperparameters “C”- generalization parameter, and “gamma” is a kernel coefficient. These two are key hyperparameters to control the complexity, regularization, and generalization ability of the model. Hence, these hyperparameters are optimized to enhance the model accuracy by keeping the kernel function as a radial basis function. Initially, the conventional methods such as GS, RS, and BO algorithms are used to optimize the parameters. Later, many metaheuristic algorithms (PSO, GWO, AOA, PFOA, FLA, and HOA) are implemented to optimize the “C” and “gamma.” The novelty of this work is that PFOA, FLA, and HOA are the new algorithms, and they are implemented first time for optimization of the hyperparameters of SVR for the application of hourly energy consumption in NZEBs. The block diagram for the complete work is shown in Figure 5.
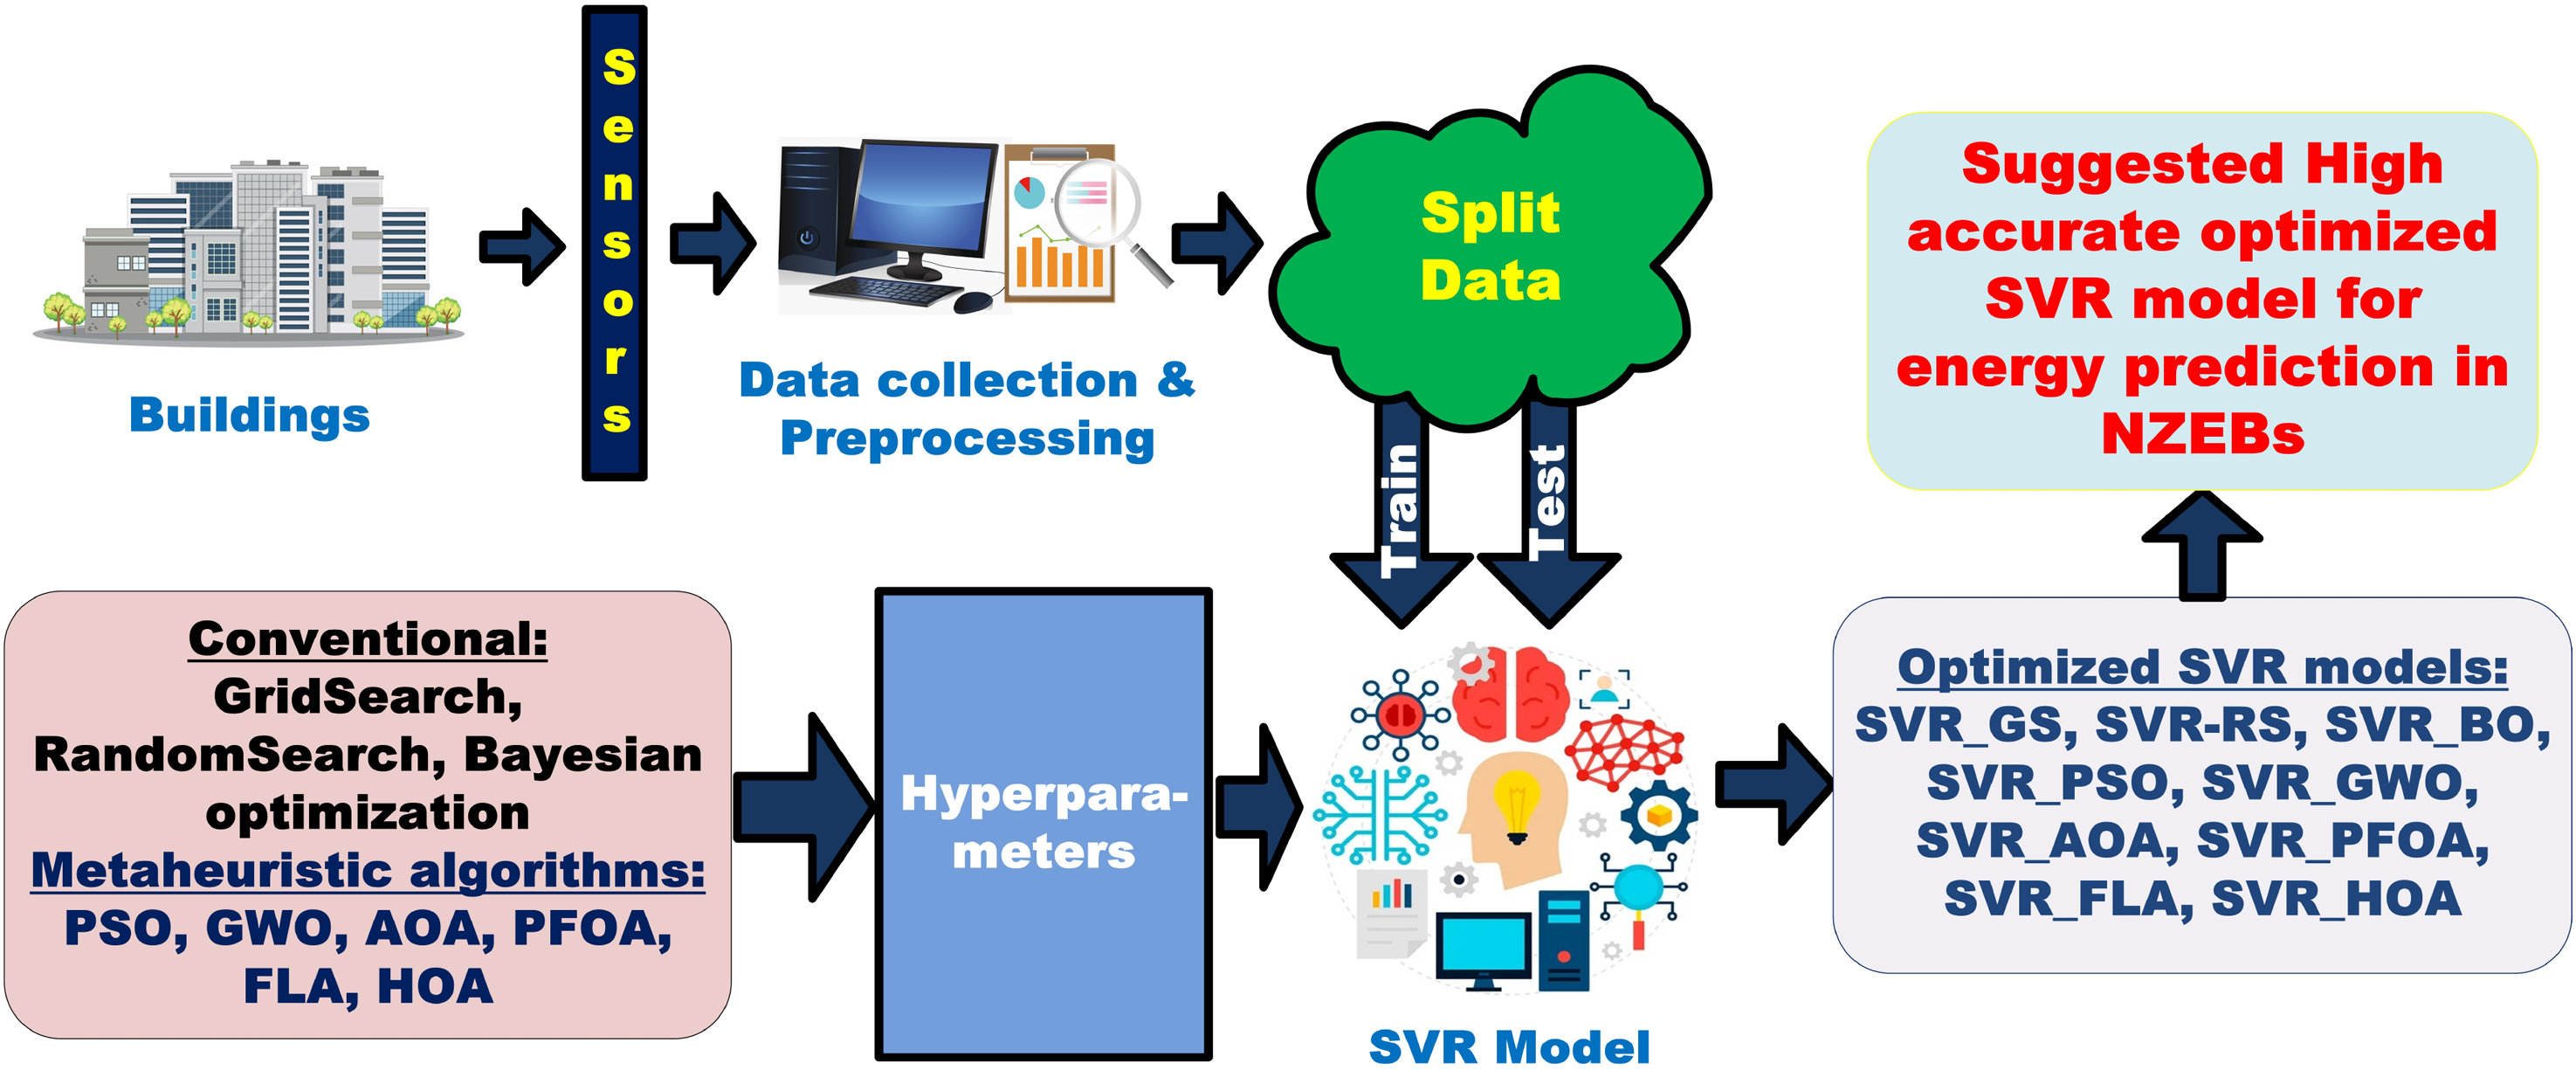
Block diagram of the proposed methodology.
Conventional algorithms
The GS, RS, and BO algorithms are the conventional methods for tuning the hyperparameters of the ML models. The GS method is generally an exhaustive search in a predefined grid space by taking the combinations of the parameters set. This method is simple and finds the best hyperparameters. But this method is time-consuming, and if the set of hyperparameters becomes complex. To overcome these issues, an RS method comes into play. It will make the random samples of hyperparameter combinations in well-defined distributions. So, it will give the best hyperparameters from a smaller number of random samples. Hence, it is a faster and effective exploration than the GS method. But there is a disadvantage to this method, which is that it may fail in the exploitation phase in global best search due to its random nature. Later on, the BO method came in an intelligent way of optimizing the model parameters. It generally uses a probability function to model the objective function and incorporates prior evaluation results; it balances exploration and exploitation to identify optimal parameters efficiently.
However, these three methods are going to be implemented on the SVR model with the considered building dataset to understand their nature of optimization. Now moving into a more intelligent way, the SVR model hyperparameters are going to be optimized with the help of the metaheuristic optimization algorithms. There are several algorithms available in the literature; some are already implemented on different datasets for different applications. Many such algorithms are implemented for tuning the hyperparameters of SVR. These algorithms are divided into two categories: (1) existing algorithms and (2) proposed algorithms.
Existing metaheuristic algorithms
The existing algorithms include PSO, GWO, and AOA, which have already been implemented on various datasets of BEC. The PSO and GWO are simple optimization methods that evolved based on the intelligent behavior of the swarm. They are very basic optimization algorithms that are good when the system is simple, but when the system becomes complex, the performance is poor. Since the populations in these algorithms always follow the best one, suppose the best one gets stuck in the local optimum, then the whole population may get stuck at that point. The AOA is a different category which designed based on the intelligence of the arithmetic operations in mathematics. This algorithm also has a disadvantage in that the search process equations make the solution always move with constant steps in the search phases. This causes poor exploration and may lead to getting stuck at the local solution. However, the authors used these algorithms for tuning the hyperparameters of SVR for the given dataset.
Proposed metaheuristic algorithms
The hyperparameters of the SVR model are going to be optimized with the help of newly evolved metaheuristic algorithms such as PFOA, FLA, and HOA. These algorithms are designed to achieve the global optimum value by striking a balance between exploration and exploitation. This is the first time that these algorithms are being applied for the BEC prediction task in the NZEBs, which are discussed below:
Polar fox optimization algorithm:
The PFOA is a multiphase nature-inspired metaheuristic based on the social hunting behavior and unique prey-capturing technique of Arctic foxes. This algorithm is designed to balance the exploration and exploitation phases for reaching the global optimum solution of any complex optimization problem (Ghiaskar et al., 2024). The search will start by dividing the foxes into four groups:

where

where

where r is a random number, PF is a jump power factor, and D is the direction of the search.

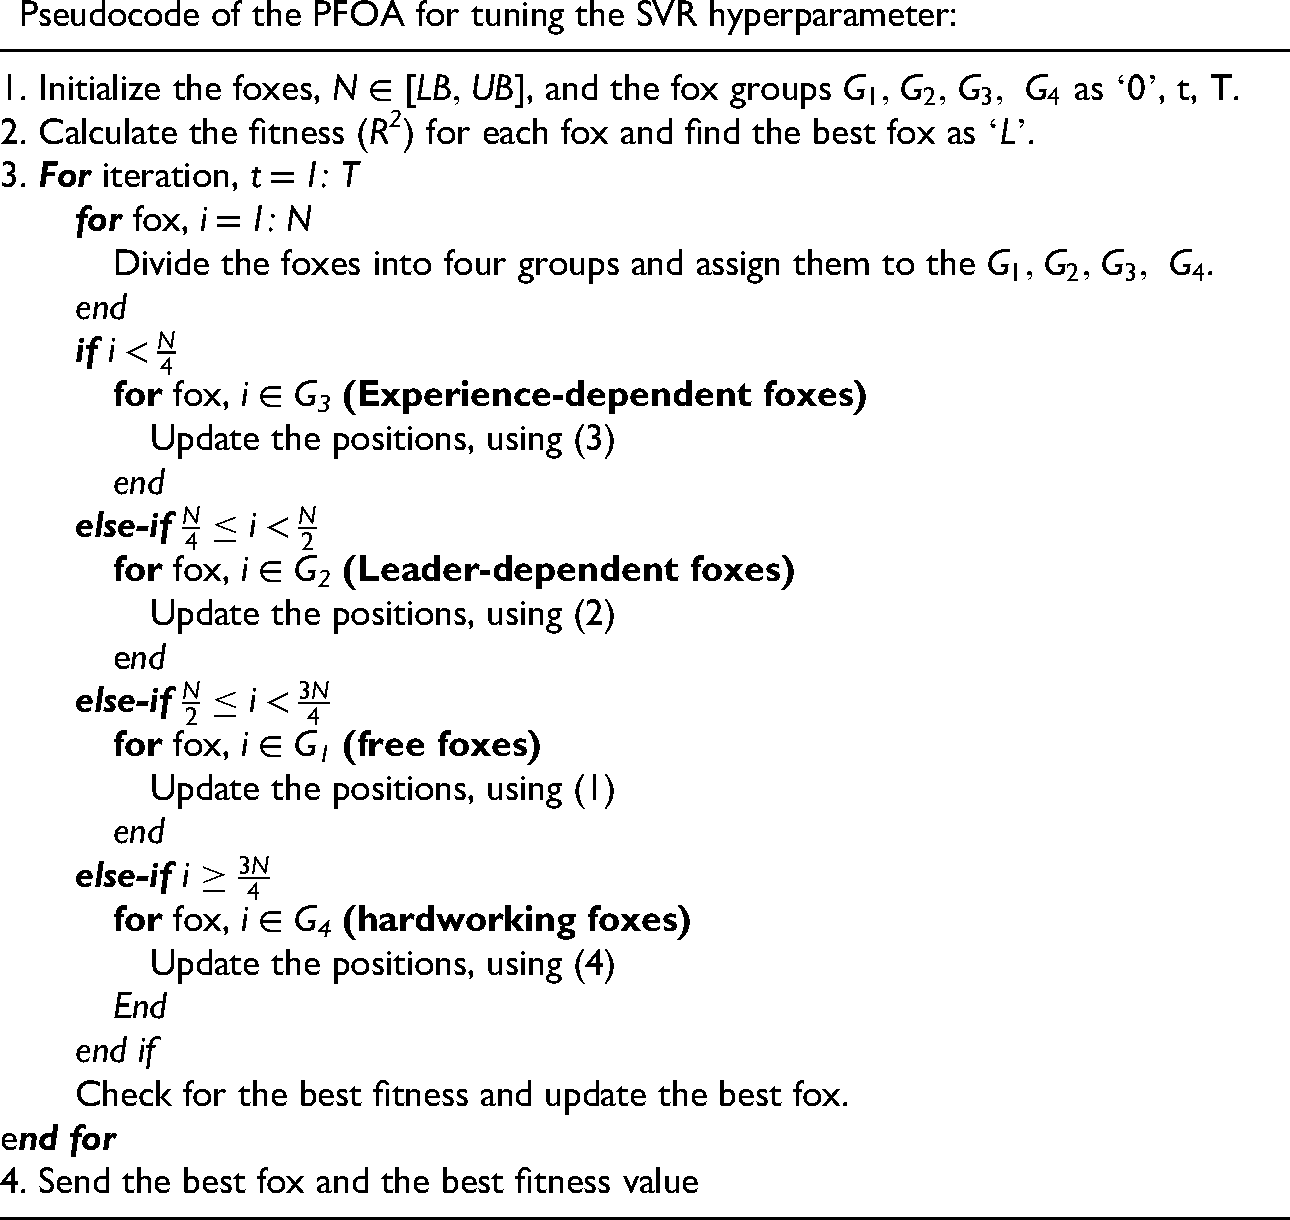
The complete random search phenomenon in the exploration and exploitation guarantees the global solution. Taking advantage of the PFOA, it is being implemented for the problem of tuning the hyperparameters of the SVR model for the energy consumption prediction in the NZEBs. The pseudo code for the PFOA is given below:
Pseudocode of the PFOA for tuning the SVR hyperparameter:
ii. Flood algorithm:
The FLA is a metaheuristic optimization method inspired by the behavior of floodwaters in nature. It models the way water flows downhill (5), spreads unpredictably during floods (6), and gradually evaporates or gets absorbed (7). In this algorithm, each solution (s) is treated such as a droplet or unit of water (Ghasemi et al., 2024). These solutions move toward lower terrain—representing better fitness values—by following a path similar to a slope toward the current best solution. When certain particles are underperforming, a flood mechanism randomly disturbs them to help the search escape local optima. FLA also introduces new solutions periodically, similar to how rain or snowmelt adds more water to the system, ensuring diversity. To maintain the process balanced, poor solutions are removed in the form of evaporation, so the population doesn’t grow uncontrollably. What makes FLA stand out is how it combines natural flow, randomness, and adaptive adjustment over time, which allows it to explore widely in the early stages and gradually focus on refining the best regions as the search progresses:


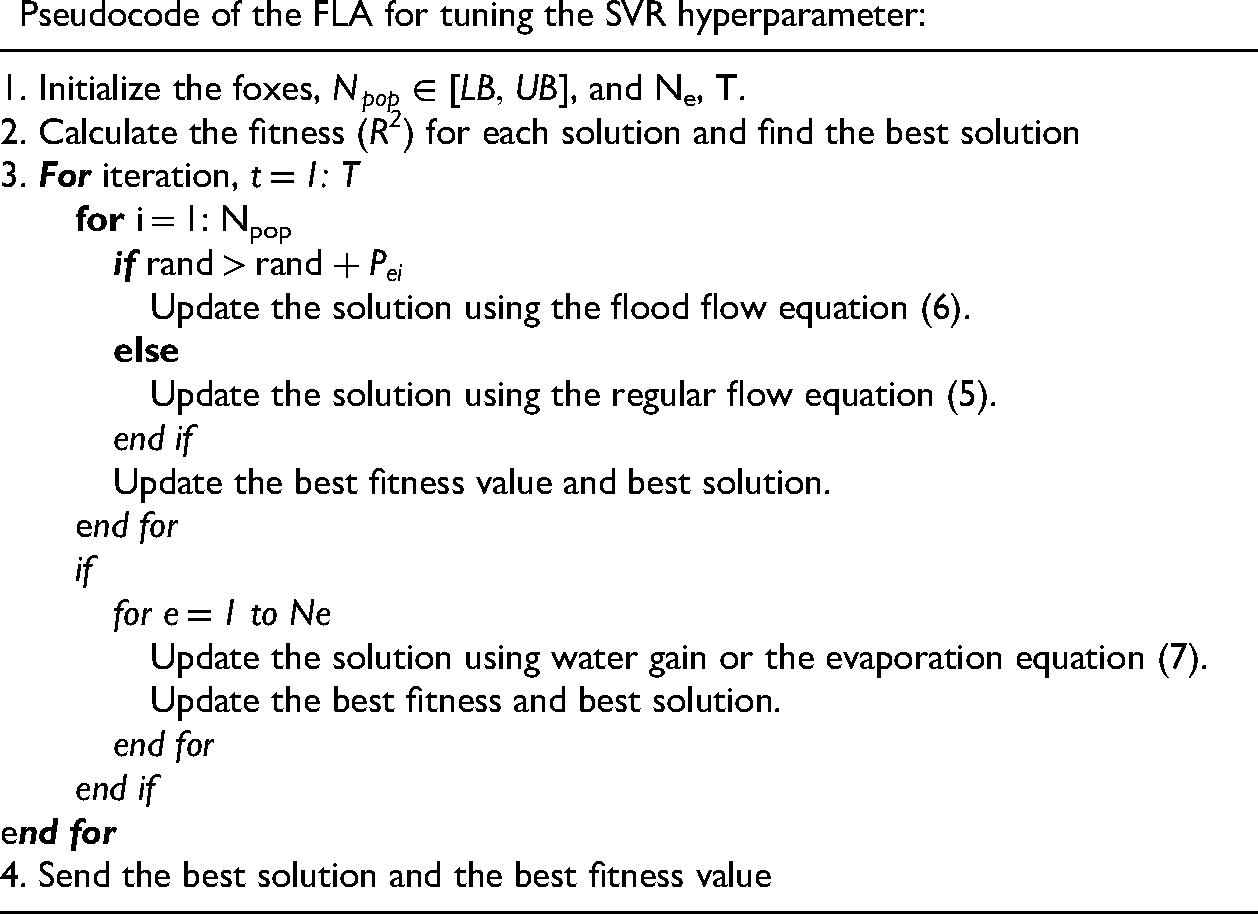
The FLA is being implemented to address the issue of tuning the hyperparameters of the SVR model for energy consumption prediction in NZEBs. The pseudo code for the FLA is given below:
Pseudocode of the FLA for tuning the SVR hyperparameter:
iii. Hiking optimization algorithm:
The HOA is inspired by the way real hikers navigate uneven terrain while aiming for a goal, like reaching a mountain summit. It tries to model how humans change their walking speed and direction depending on how steep or easy the path is, and also how they might follow others if someone finds a better route, given in (8), (9), and (10). One of the key ideas behind HOA is Tobler's hiking function, which mathematically links slope with walking speed—showing that people tend to move fastest on gentle downward paths. In the algorithm, each “hiker” (i.e., candidate solution) updates its position based on this slope, its own previous step, and how far it is from the best solution found so far (Oladejo et al., 2024). HOA also includes a mechanism to stop hikers from straying too far by applying a sweep factor, which helps keep their movements under control. This approach strikes a nice balance between exploring new areas and refining existing effective solutions. Because it relies on simple rules and adapts based on feedback from the environment, HOA can be a strong choice for solving tricky problems where other algorithms might get stuck or slow down: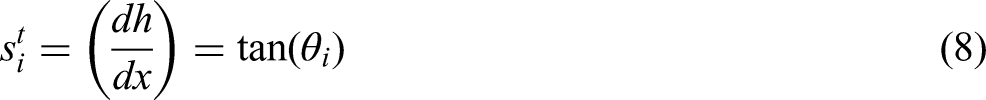


The HOA is being implemented to address the issue of tuning the hyperparameters of the SVR model for energy consumption prediction in NZEBs. The pseudo code for the HOA is given below:
Pseudocode of the HOA for tuning the SVR hyperparameter:

Model evaluation
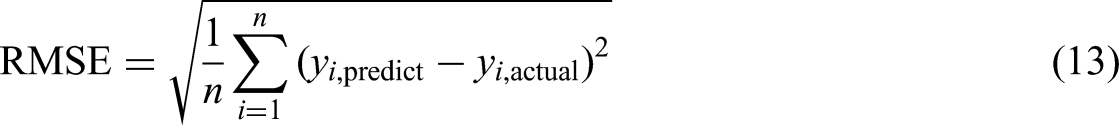
The methods discussed above are implemented on the hyperparameter tuning of the SVR model. Hence, the model changed to the optimized SVR model names as SVR_GS, SVR_RS, SVR_BO, SVR_PSO, SVR_GWO, SVR_AOA, SVR_PFOA, SVR_FLA, and SVR_HOA. The performance of these models is evaluated with the standard error metrics, MAE, RMSE, coefficient of determination (R2), MAPE, PBIAS, and WI of Agreement, which are given in the following equations:


The PBIAS values should be closer to zero, and the WI values should be near to 1, which indicates the good performance of a model. Along with the error metrics, the performance of models is also tested with statistical tests such as the Friedman test, Nemenyi test, and the rankings are calculated with the help of the critical difference value. The performance of each model is compared with others, and the best model for the energy consumption prediction in NZEBs is suggested in this work.
Results and discussions
The main intention of this work is to present a more accurate ML model for energy consumption prediction in NZEBs. This can be done by optimizing the hyperparameters of the SVR model. The different optimization algorithms were discussed in the previous section, from conventional methods to the advanced metaheuristic algorithms. In this direction, this work proposed and implemented successfully three new metaheuristic algorithms are PFOA, FLA, and HOA, for tuning the accuracy of the SVR model by optimizing the hyperparameters (“regularization” parameter and “gamma” parameter = decides the support vectors). Hence, the algorithms are named as SVR_PFOA, SVR_FLA, and SVR_HOA.
The performance of these algorithms is compared with the popular existing metaheuristic algorithms (SVR_PSO, SVR_GWO, and SVR_AOA), conventional algorithms (SVR_GS, SVR_RS, and SVR_BO), and the default SVR model. The conventional algorithms and proposed algorithms were successfully implemented on a Personal Computer with processor = Intel(R) Core (TM) i5-8250U CPU @1.80 GHz; internal RAM = 16.0 GB (15.7 GB usable); Storage = 233 GB SSD, 1.82 TB HDD; Graphic card = AMD Radeon R7 M460 (2 GB), Intel(R) UHD Graphics 620 (128 MB); and OS = WINDOWS 10 64bit; Software = Python platform version 3 in Jupyter Notebook IDE. This section discusses the results of the optimization performance and the model prediction performance of the optimized SVR models and their statistical analysis.
Optimization convergence analysis
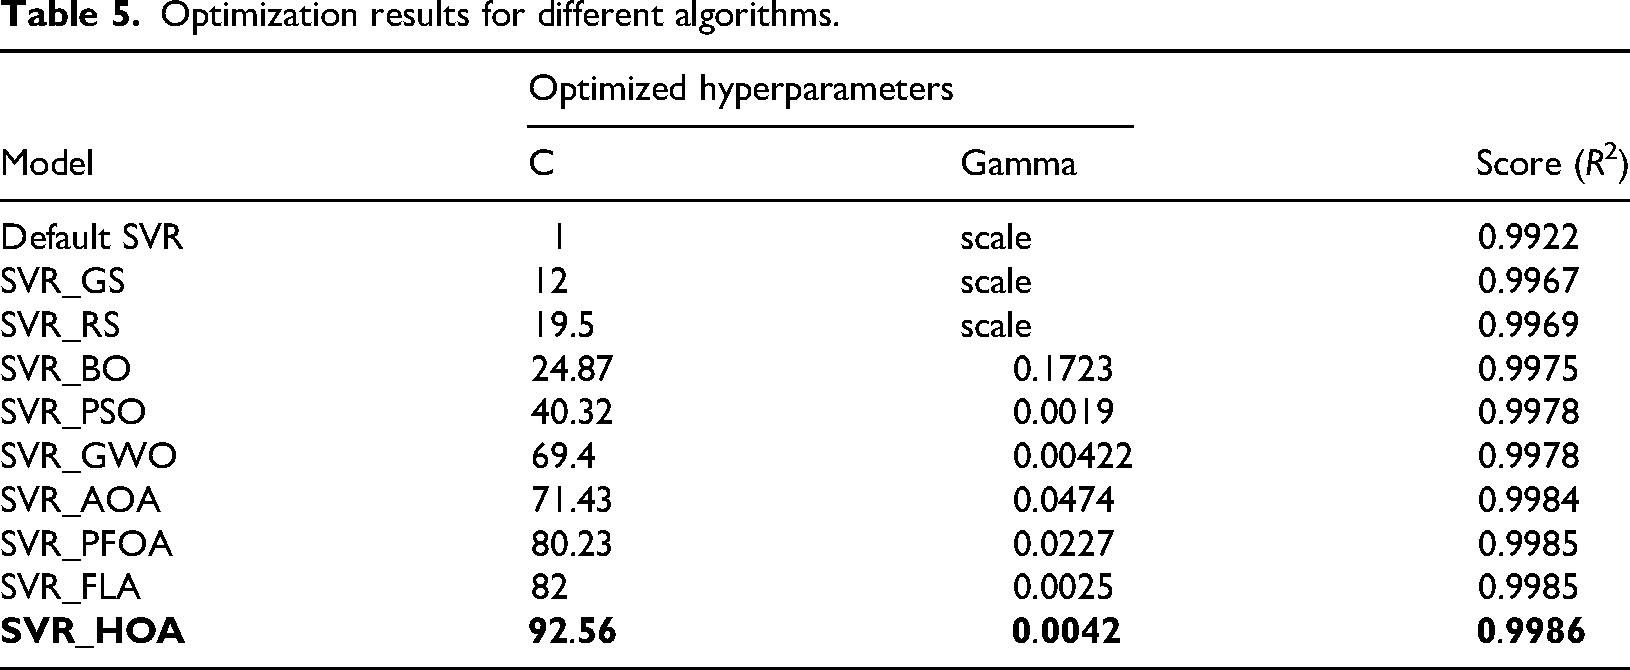
The two important hyperparameters of the SVR model are “C” and “gamma” and are considered as a population or solution for an optimization problem. The boundaries of these parameters are [1, 100] and [0.0001, 0.1], respectively. The coefficient of determination (R2) is used as a fitness function in this work. The number of iterations considered in this work is 100 for each algorithm. To show the robustness of the algorithms, each algorithm is run 10 times. The average of the 10 runs was taken as the final value of the fitness function since every algorithm incorporated randomness. The iterations of the SVR_GS and SVR_RS algorithms depend on the cross-validation (CV) value, which is considered CV = 3, and R2 is the fitness function. The optimized hyperparameters are C = 12 and gamma = scale for SVR_GS and C = 19.5 and gamma = scale for SVR_RS.
These two algorithms show poor performance, and fitness values are 0.9967 and 0.9969, respectively, in the task of energy consumption in NZEBs. Since there is no intelligence in searching for the global optimum values in such algorithms. SVR_BO is another conventional but it searches for a solution using the “optuna” framework, which is better than the previous two. This algorithm uses CV = 3, R2 as the fitness function, and number of trials for tuning (n_trial) = 100. The optimized parameters are C = 24.87 and gamma = 0.1723. The performance of this algorithm is better than that of SVR_GS and SVR_RS, with the fitness values of 0.9975.
Later, the metaheuristic optimization algorithms use the intelligence from the swarm, physics, mathematics, and humans. These intelligent algorithms, such as SVR_PSO, SVR_GWO, SVR_AOA, SVR_PFOA, SVR_FLA, and SVR_HOA, are applied for tuning the hyperparameters (“C” and “gamma”) of the SVR model. The new algorithms SVR_PFOA, SVR_FLA, and SVR_HOA were proposed in this work. To compare the performance of the new algorithms, the existing popular algorithms SVR_PSO, SVR_GWO, and SVR_AOA were considered. The newly evolved algorithms implemented, such as SVR_HOA, better optimize the parameters as C = 92.56 and gamma = 0.0042, and the fitness value is 0.9986. The SVR_FLA also optimizes the parameters in a better way with C = 82 and gamma = 0.0025, and the accuracy value is 0.9985. The SVR_PFOA gives the optimized parameters as C = 80.23 and gamma = 0.0227, which gives a fitness value of 0.9985. The existing methods such as SVR_PSO, SVR_GWO, and SVR_AOA were also implemented for tuning the SVR model parameters, and the best parameters and the best fitness values for each algorithm are given in Table 5.
Optimization results for different algorithms.
The convergence curves for each algorithm are shown in Figure 6. From this figure, it is observed that the proposed new algorithms show better fitness values and better convergence compared with the existing methods. Out of the new algorithms, the SVR_HOA shows better performance in terms of accuracy and convergence. The final values of the optimized parameters “C,” “gamma,” and the fitness score are pictorially given in Figure 7.
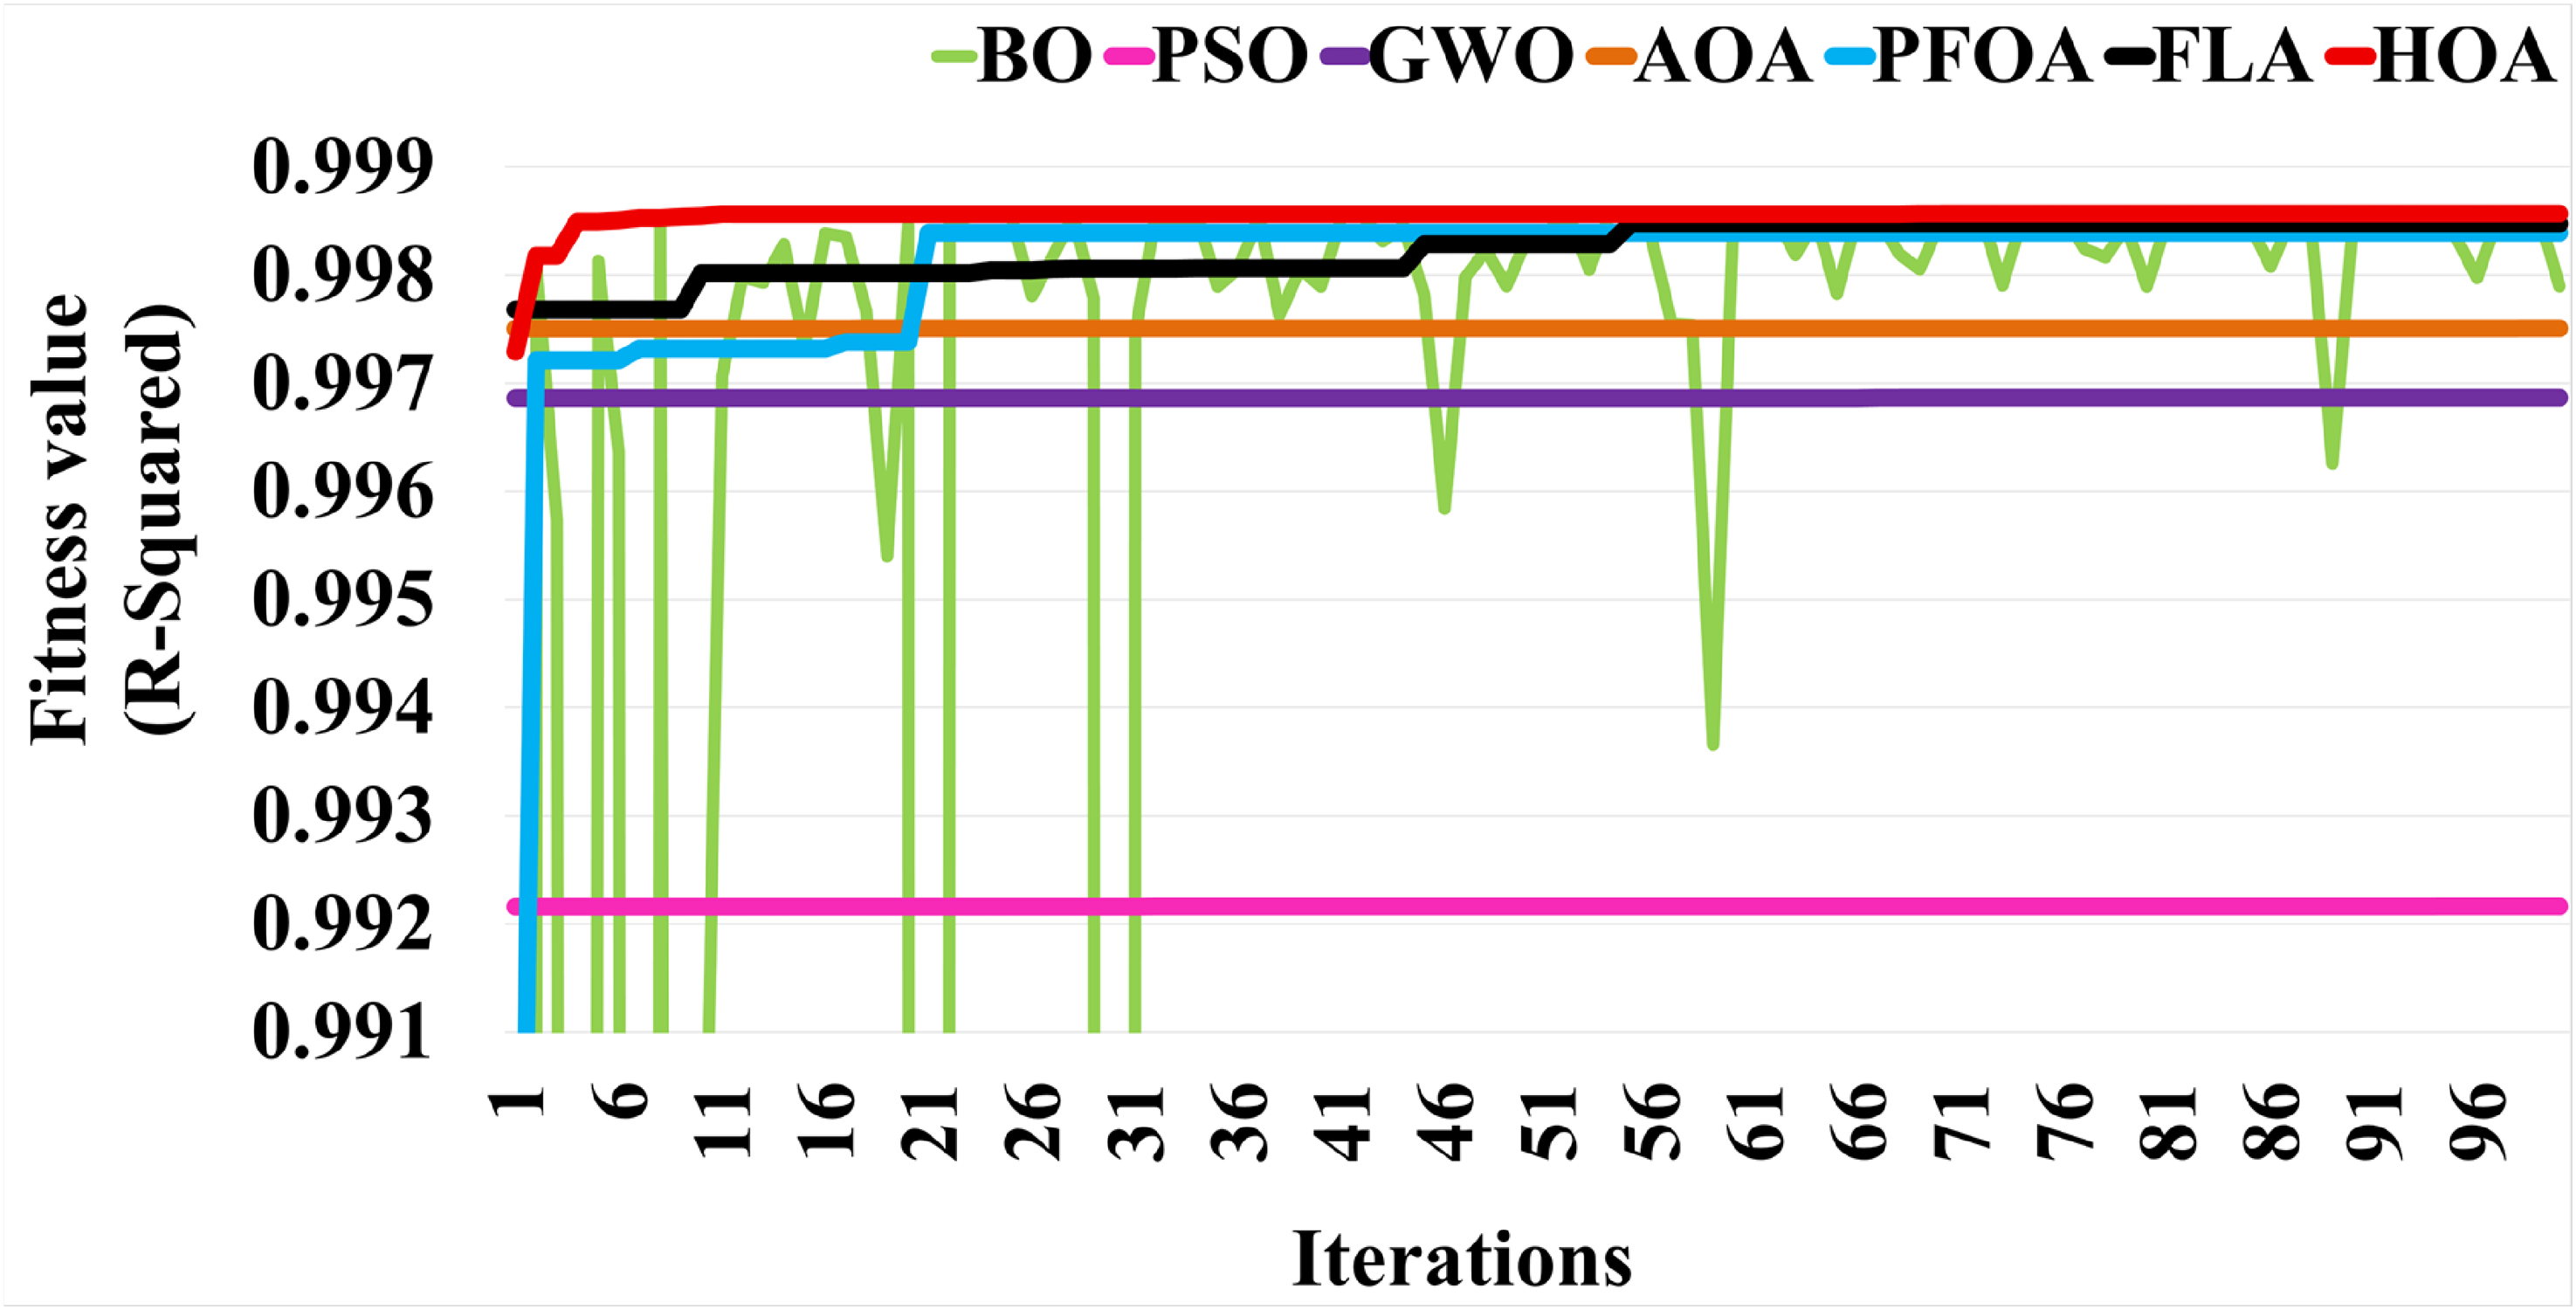
Convergence curves for the different hyperparameter tuning algorithms.
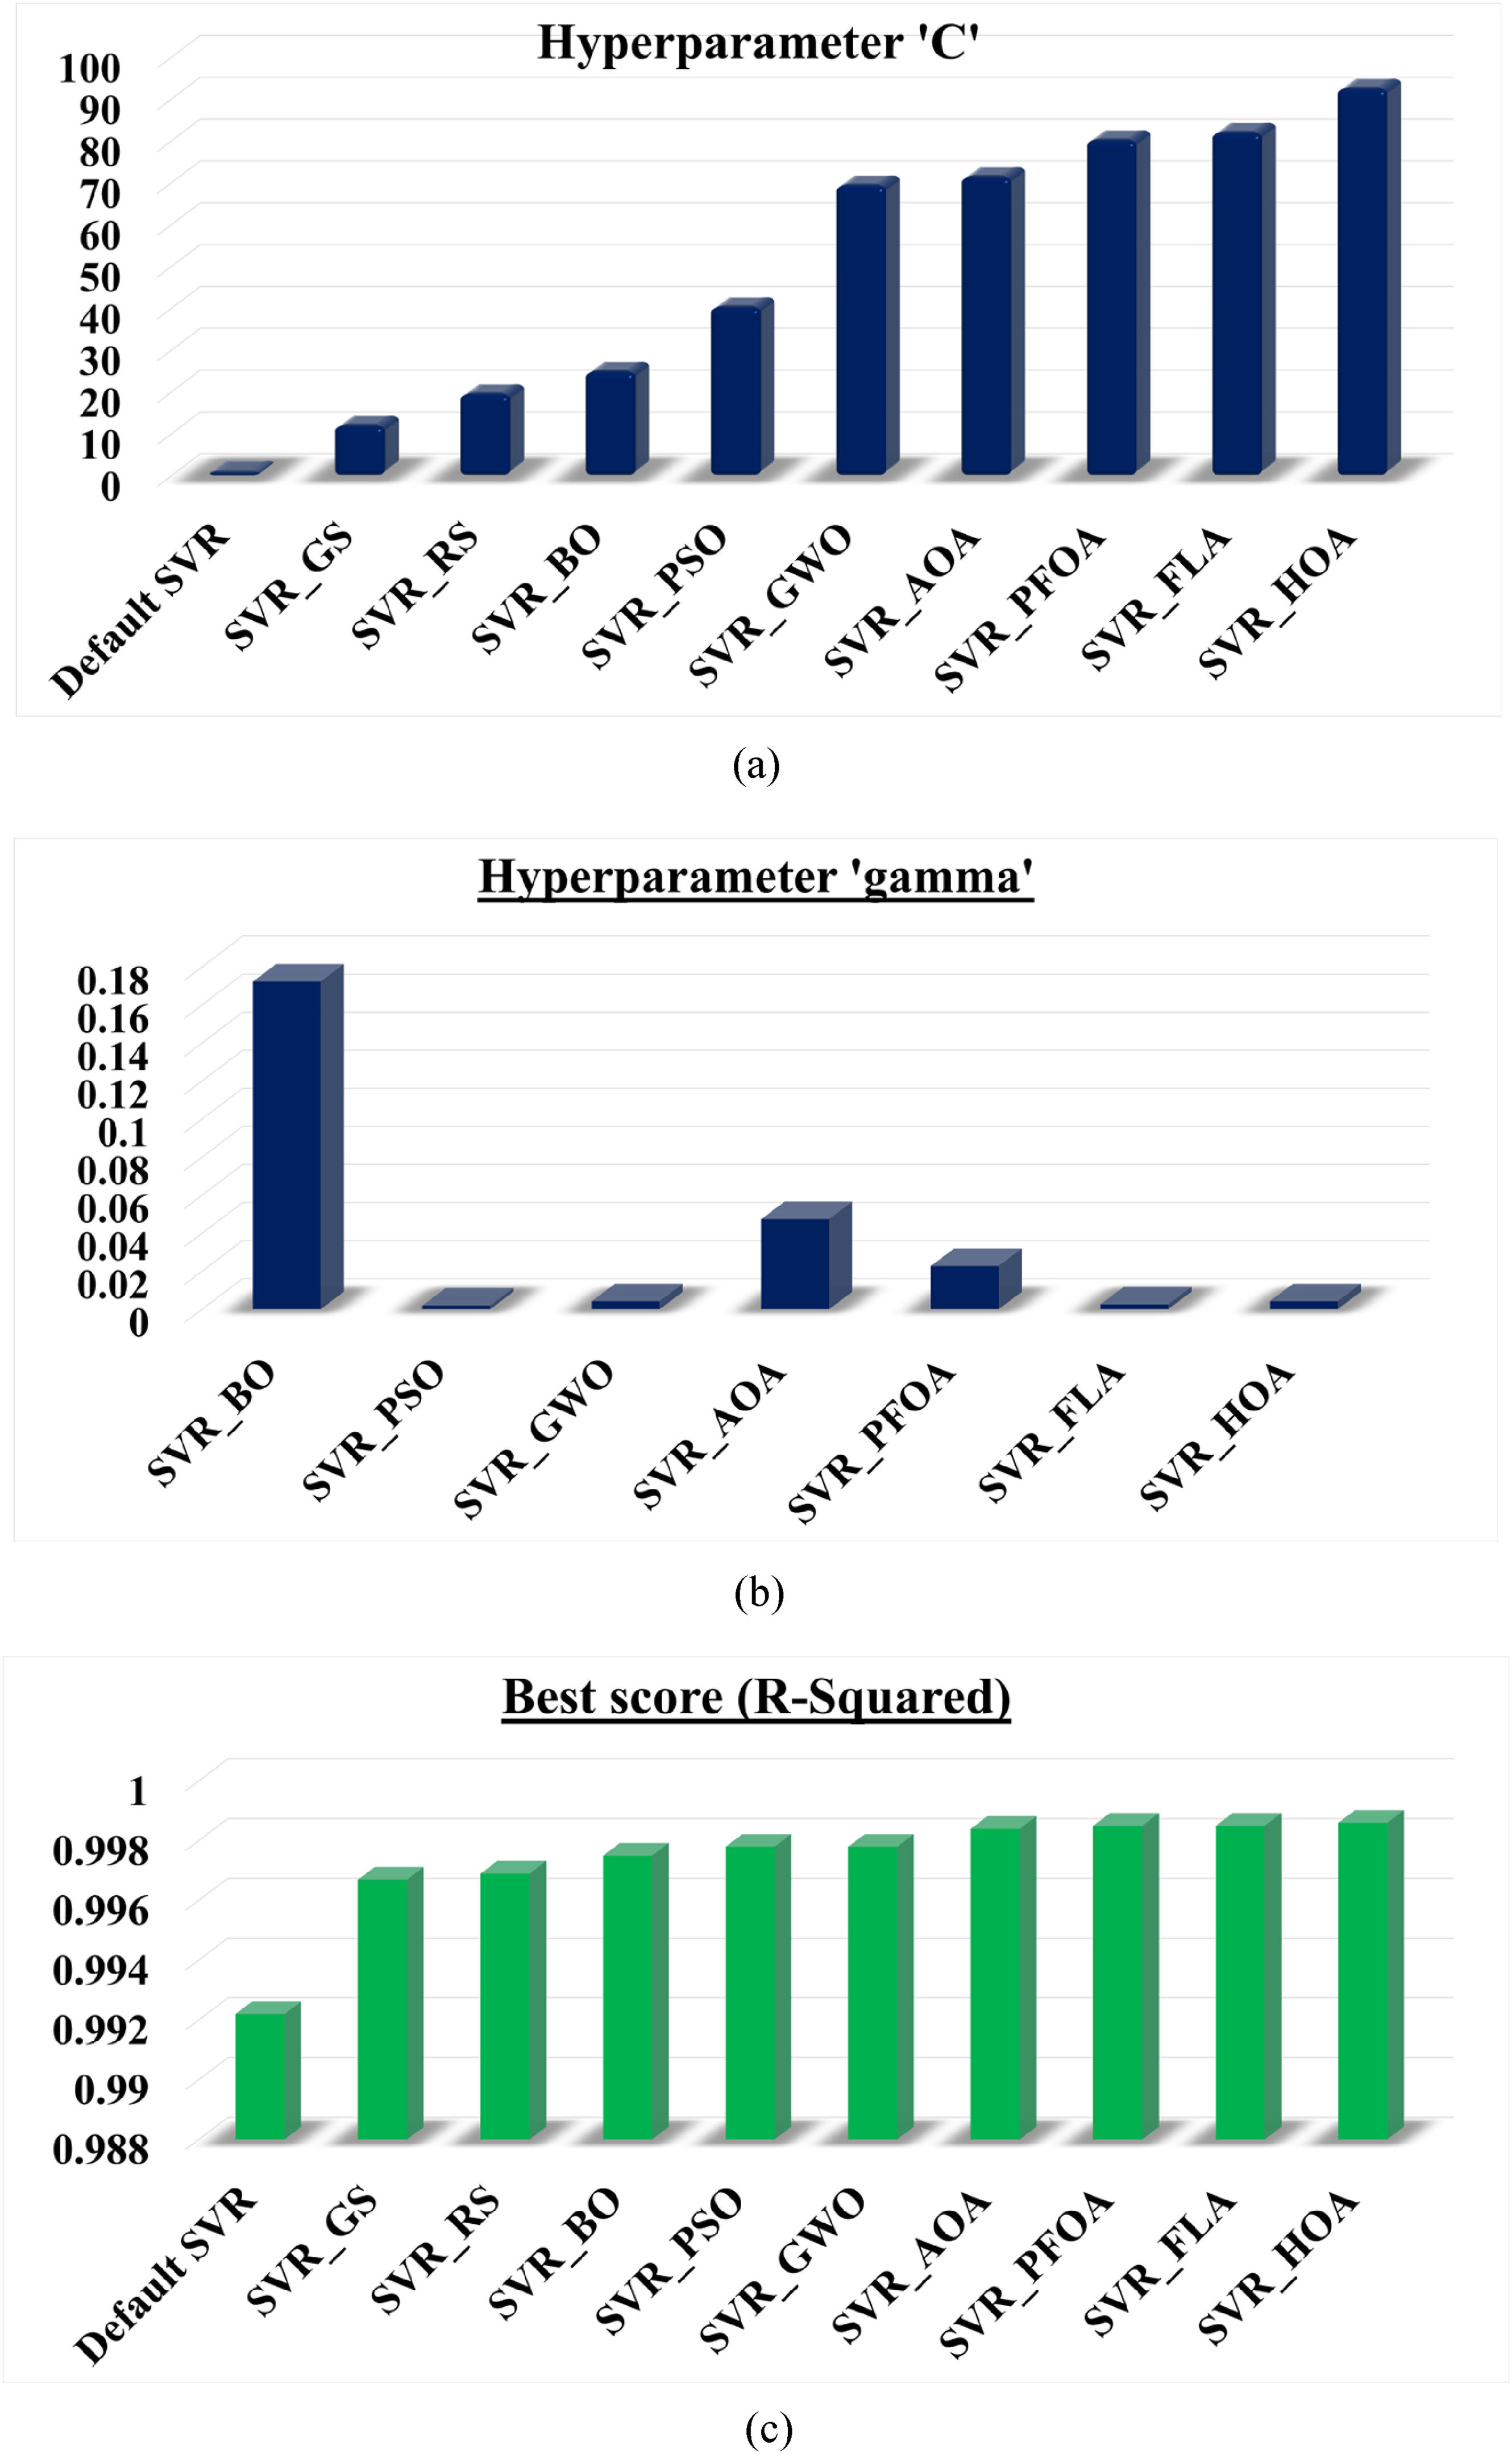
Optimized final hyperparameters: (a) “C,” (b) “gamma,” and (c) fitness scores for the different hyperparameter tuning algorithms.
Prediction accuracy comparison
The different optimized SVR models discussed above are now evaluated by calculating the different error metrics, MAE, RMSE, R2, and MAPE. The dataset was split into a training dataset and a testing dataset at 80% and 20%, respectively. Now every optimized model is trained with the help of a training dataset. The trained models were validated with the test dataset. The error metrics were evaluated to check the training performance. Similarly, the performance metrics were calculated to validate the testing perf models. Table 6 represents the training accuracies for different optimized SVR models along with the default model, and Table 7 represents the testing accuracies for the same. From these tables, it is observed that the SVR_HOA shows better accuracy for both the training and testing performance for predicting energy consumption in NZEBs. The pictorial representation of the training and testing performance for different models with different metrics is shown in Figures 8 and 9.
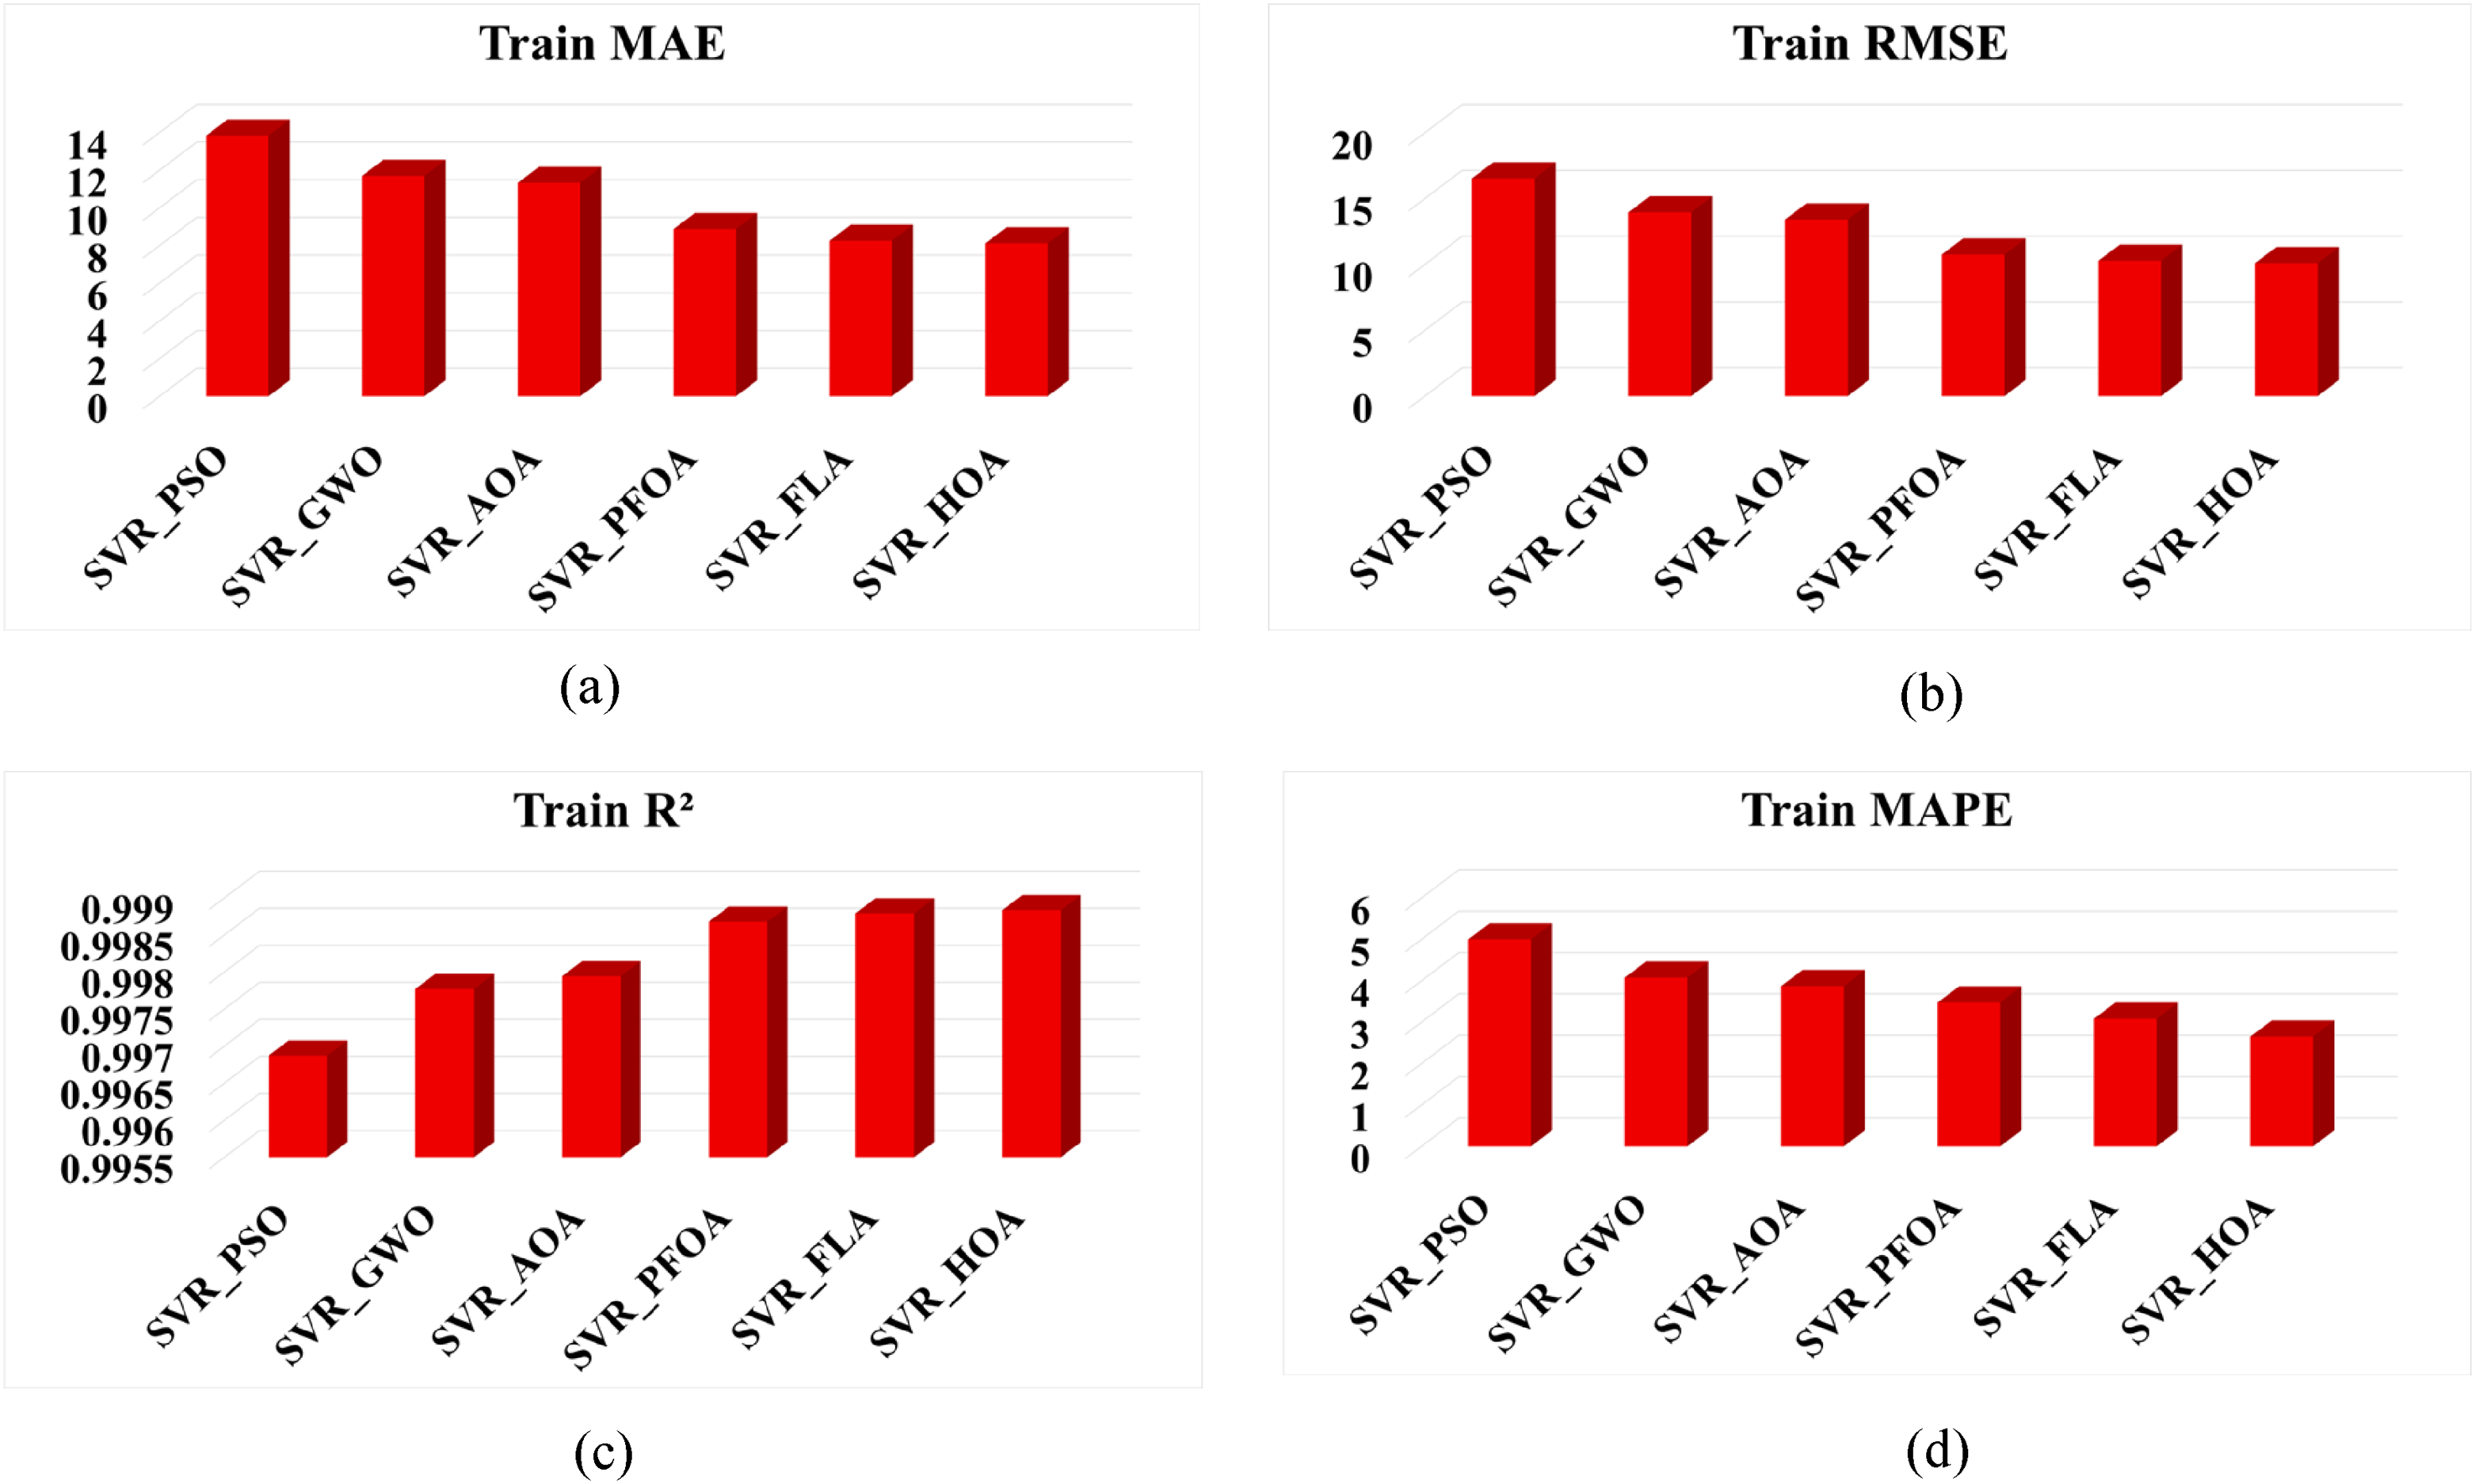
Training accuracies: (a) mean absolute error (MAE), (b) root mean squared error (RMSE), (c) R2, and (d) mean absolute percentage error (MAPE) for the different hyperparameter optimization algorithms.
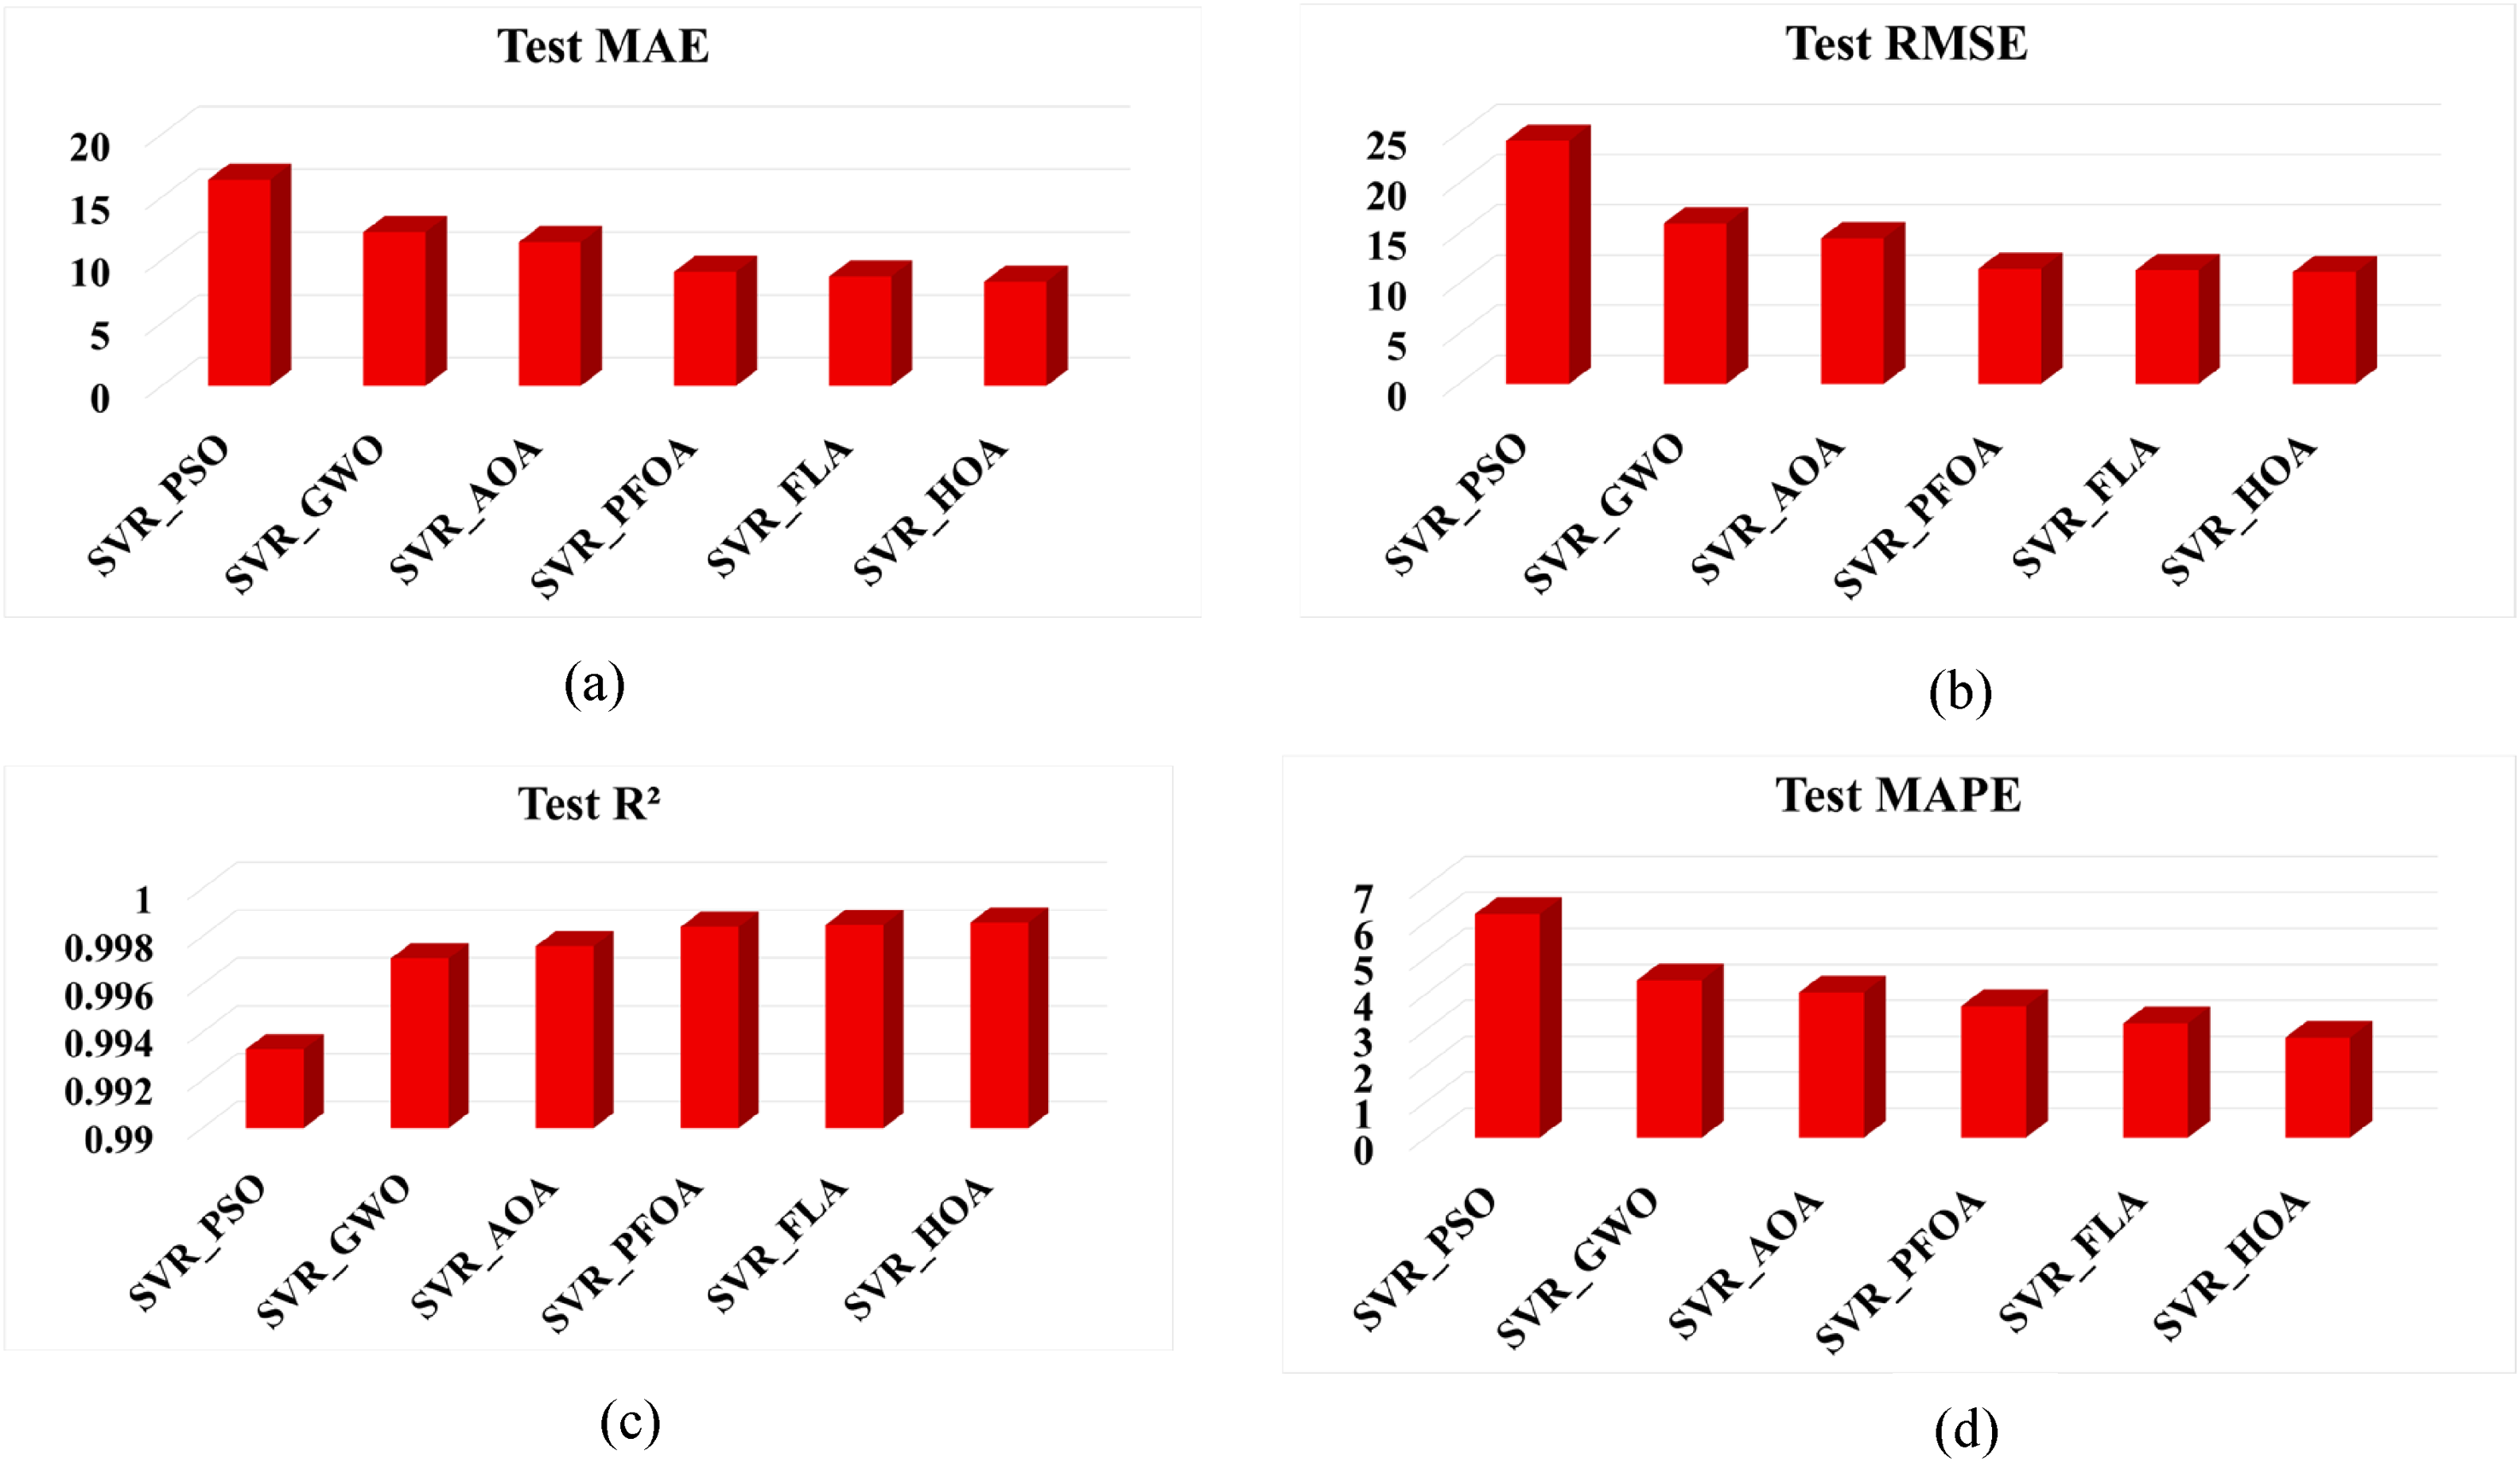
Testing accuracies: (a) mean absolute error (MAE), (b) root mean squared error (RMSE), (c) R2, and (d) mean absolute percentage error (MAPE) for the different hyperparameter optimization algorithms.
Training accuracies for the different optimization algorithms.

Testing accuracies for the different optimization algorithms.
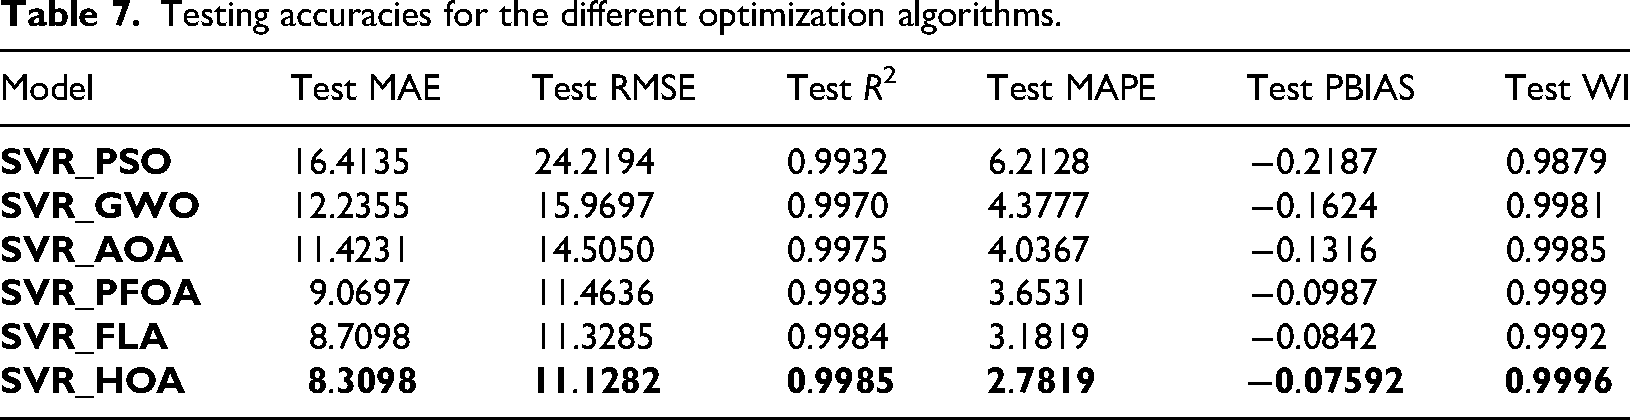
The performance of the model was further investigated with the other two evaluation metrics are PBIAS and EI along with the abovediscussed error metrics. From Tables 3 and 4, it is observed that the PBIAS values for both training and testing results are near to zero. This indicates the predictions having very low systematic bias. Similarly, the WI values are very close to one that indicates the higher agreement between predicted and actual BEC values. However, these comparisons show that the SVR model with HOA algorithms outperforms with the low value of testing PBIAS of −0.0759%, and the high testing WI of 0.9996 that confirms its reliability for more accurate predictions of BEC in NZEB applications.
The radar plots for training accuracies and testing accuracies are also displayed in Figure 10 to show the performance of each algorithm effectively. The plots between predicted output and actual output for both the training and testing datasets are shown in Figure 11. During the training phase, the predicted curve nearly coincides with that of the actual curve during most of the time horizon, which means that the model effectively represents the major pattern of load variation of the campus buildings. During the testing stage, the model generalizes well on unseen data by the fact that the predicted values still follow the actual trend. However, from the above discussions, it is observed that the SVR_HOA outperforms compared to the other algorithms.
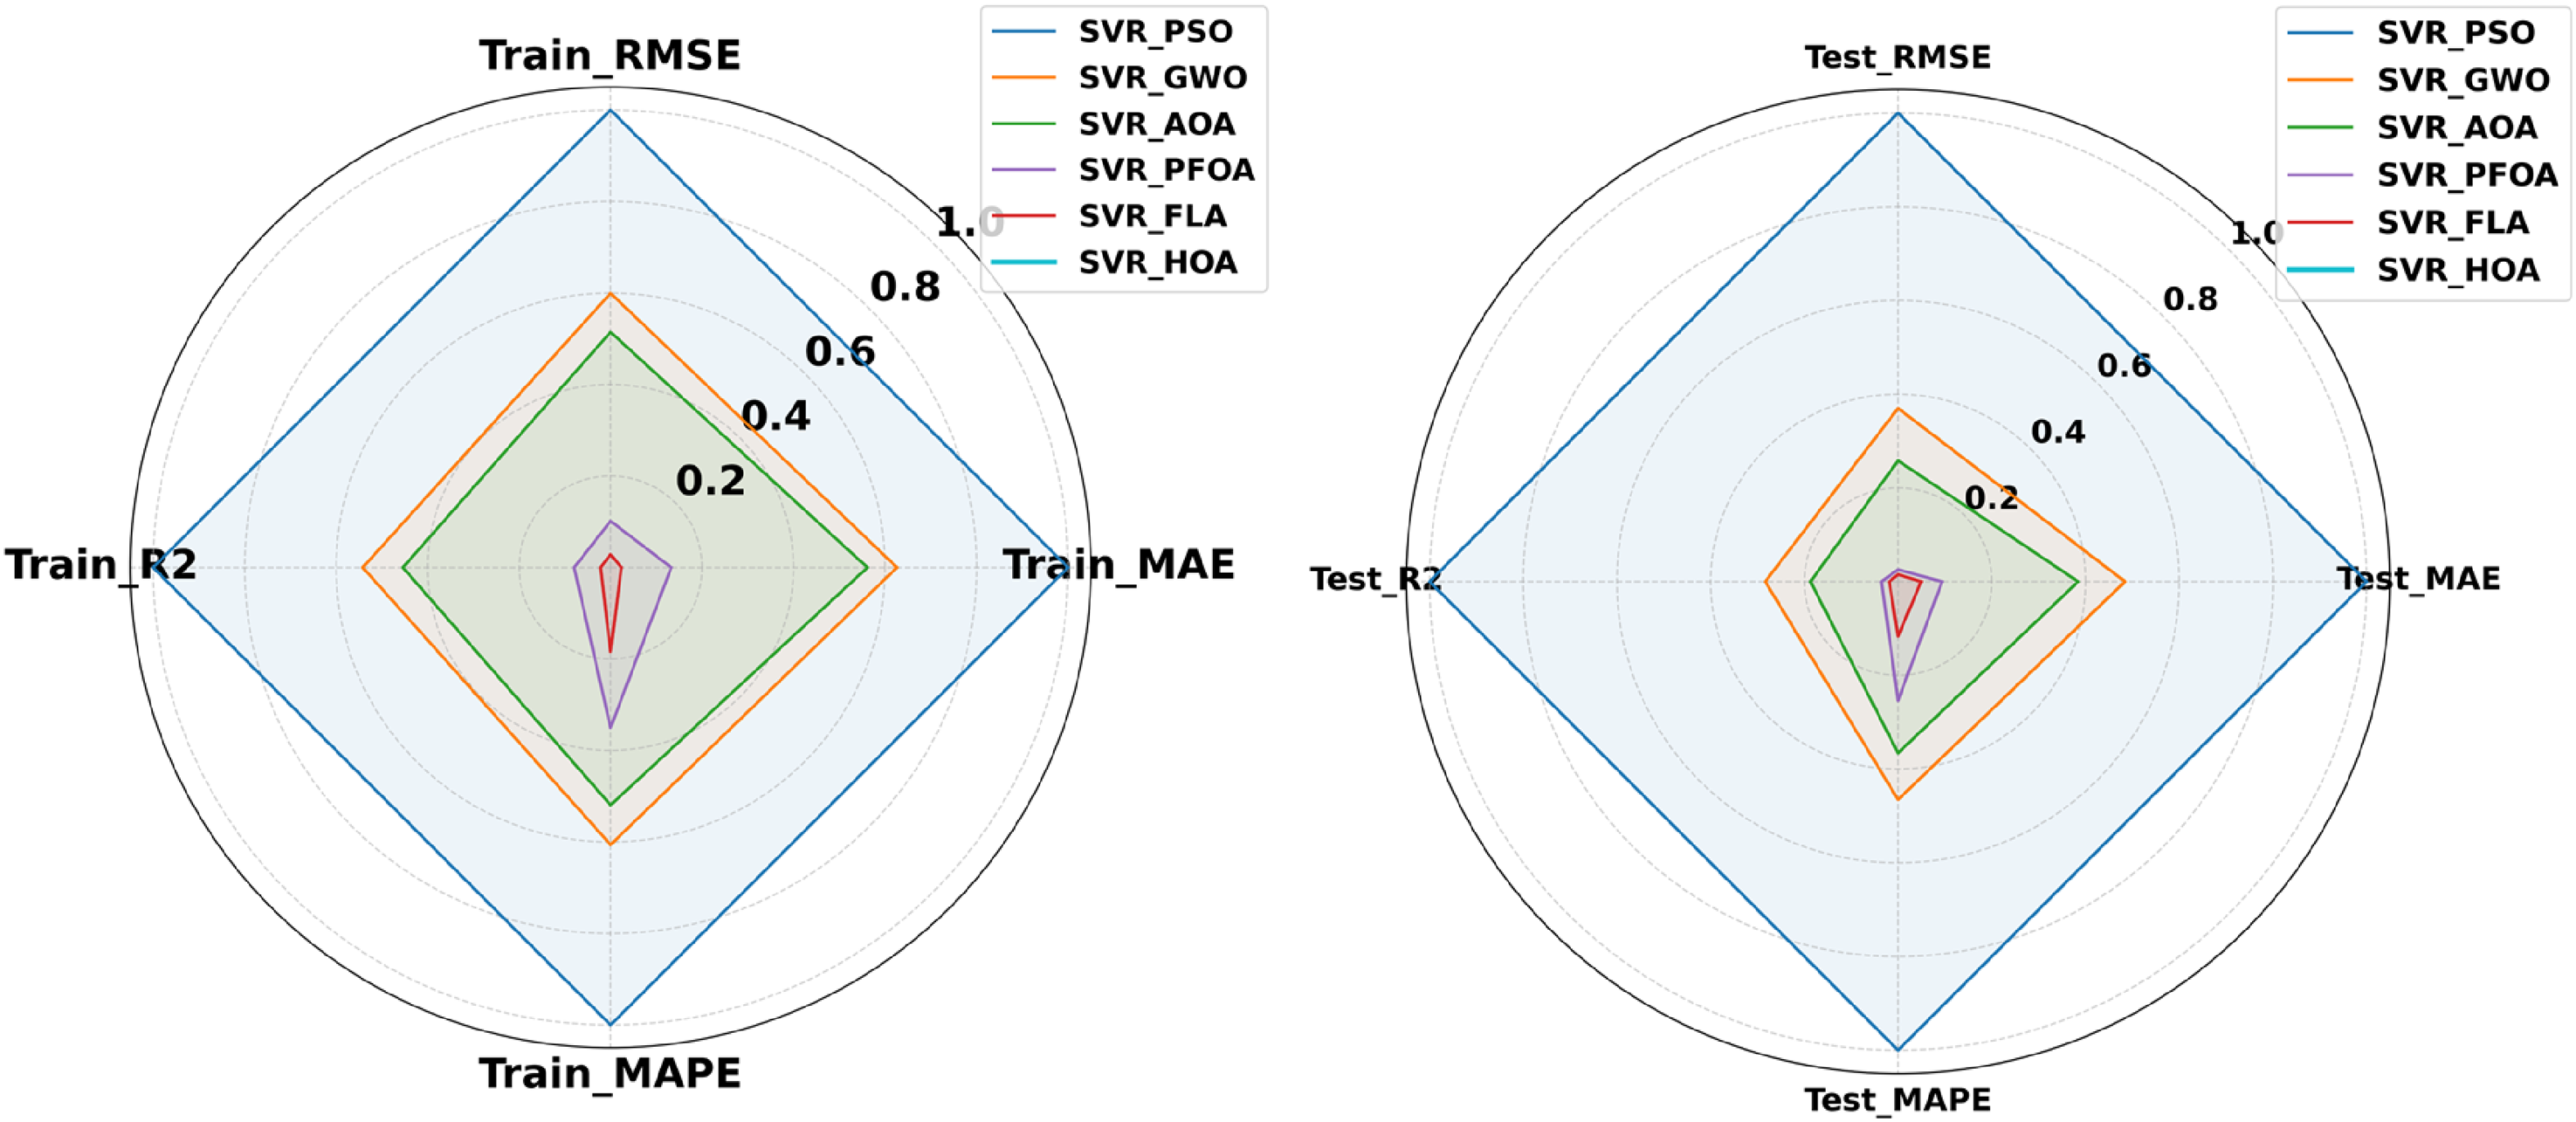
Radar plots of training and testing accuracies for the different algorithms.

Predicted and actual plots: (a) training data and (b) testing data.
Statistical significance testing
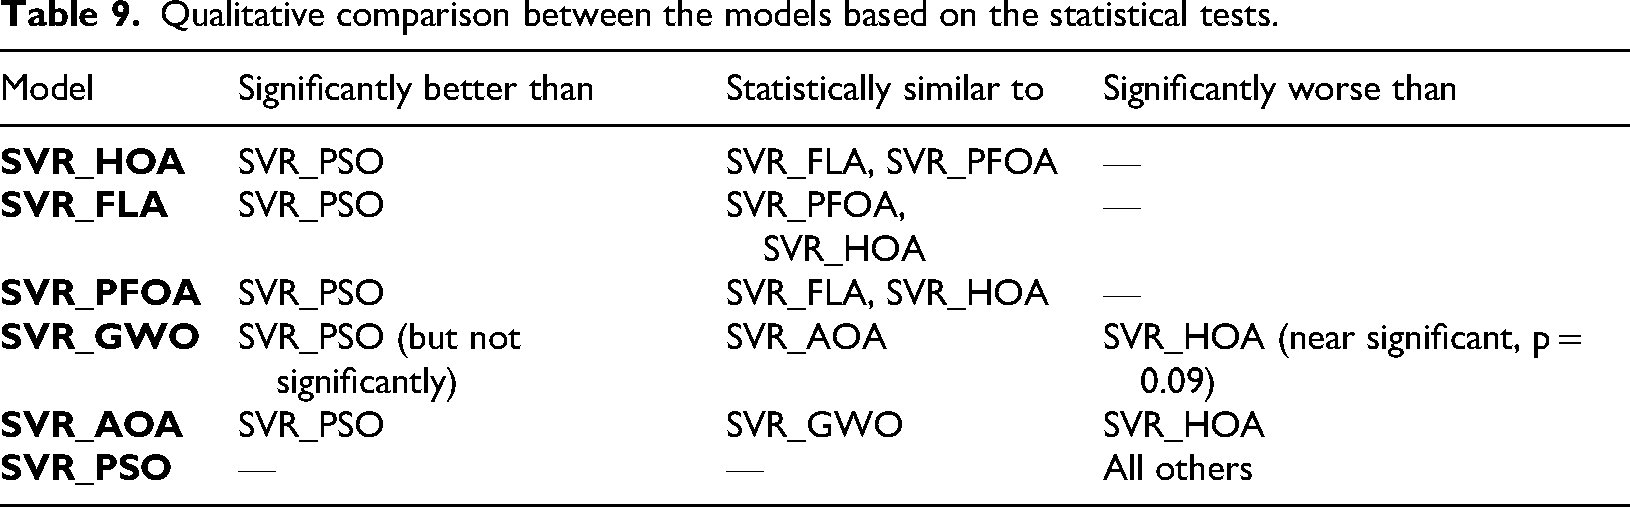
The present work proposes many metaheuristic algorithms for tuning the hyperparameters of the SVR model for the task of energy consumption prediction in NZEBs. The optimization performance and the prediction performance of each model are discussed above. Now, to find an effective and efficient algorithm, it is very important to conduct some statistical tests on these algorithms. In this work, a Friedman test, post hoc Nemenyi p-values, and the critical difference (CD) value were calculated to find the better model out of the many algorithms. The Friedman test gives a value of 12.0 with p-value of 0.00247 which is less than 0.05 indicating that there is a much difference between the compared algorithms. Similarly, the post hoc Nemenyi p-values are given in Table 8, and the quantitative comparison between the models is given in Table 9. The average ranks of the different models showing in Figure 12, where a lower rank suggests the better performance model. This analysis suggests the SVR_HOA is a better compared to other models. However, the other recent methods SVR_FLA, SVR_PFOA, show statistically remains same performance as SVR_HOA in terms of pairwise analysis of the models. Therefore, the superiority of SVR_HOA should be interpreted as comparatively stronger rather than absolutely dominant out of the top three recent algorithms. The critical difference line in Figure 12 helps to find whether rank differences between models are statistically meaningful, and models falling within this range should be treated as statistically comparable.
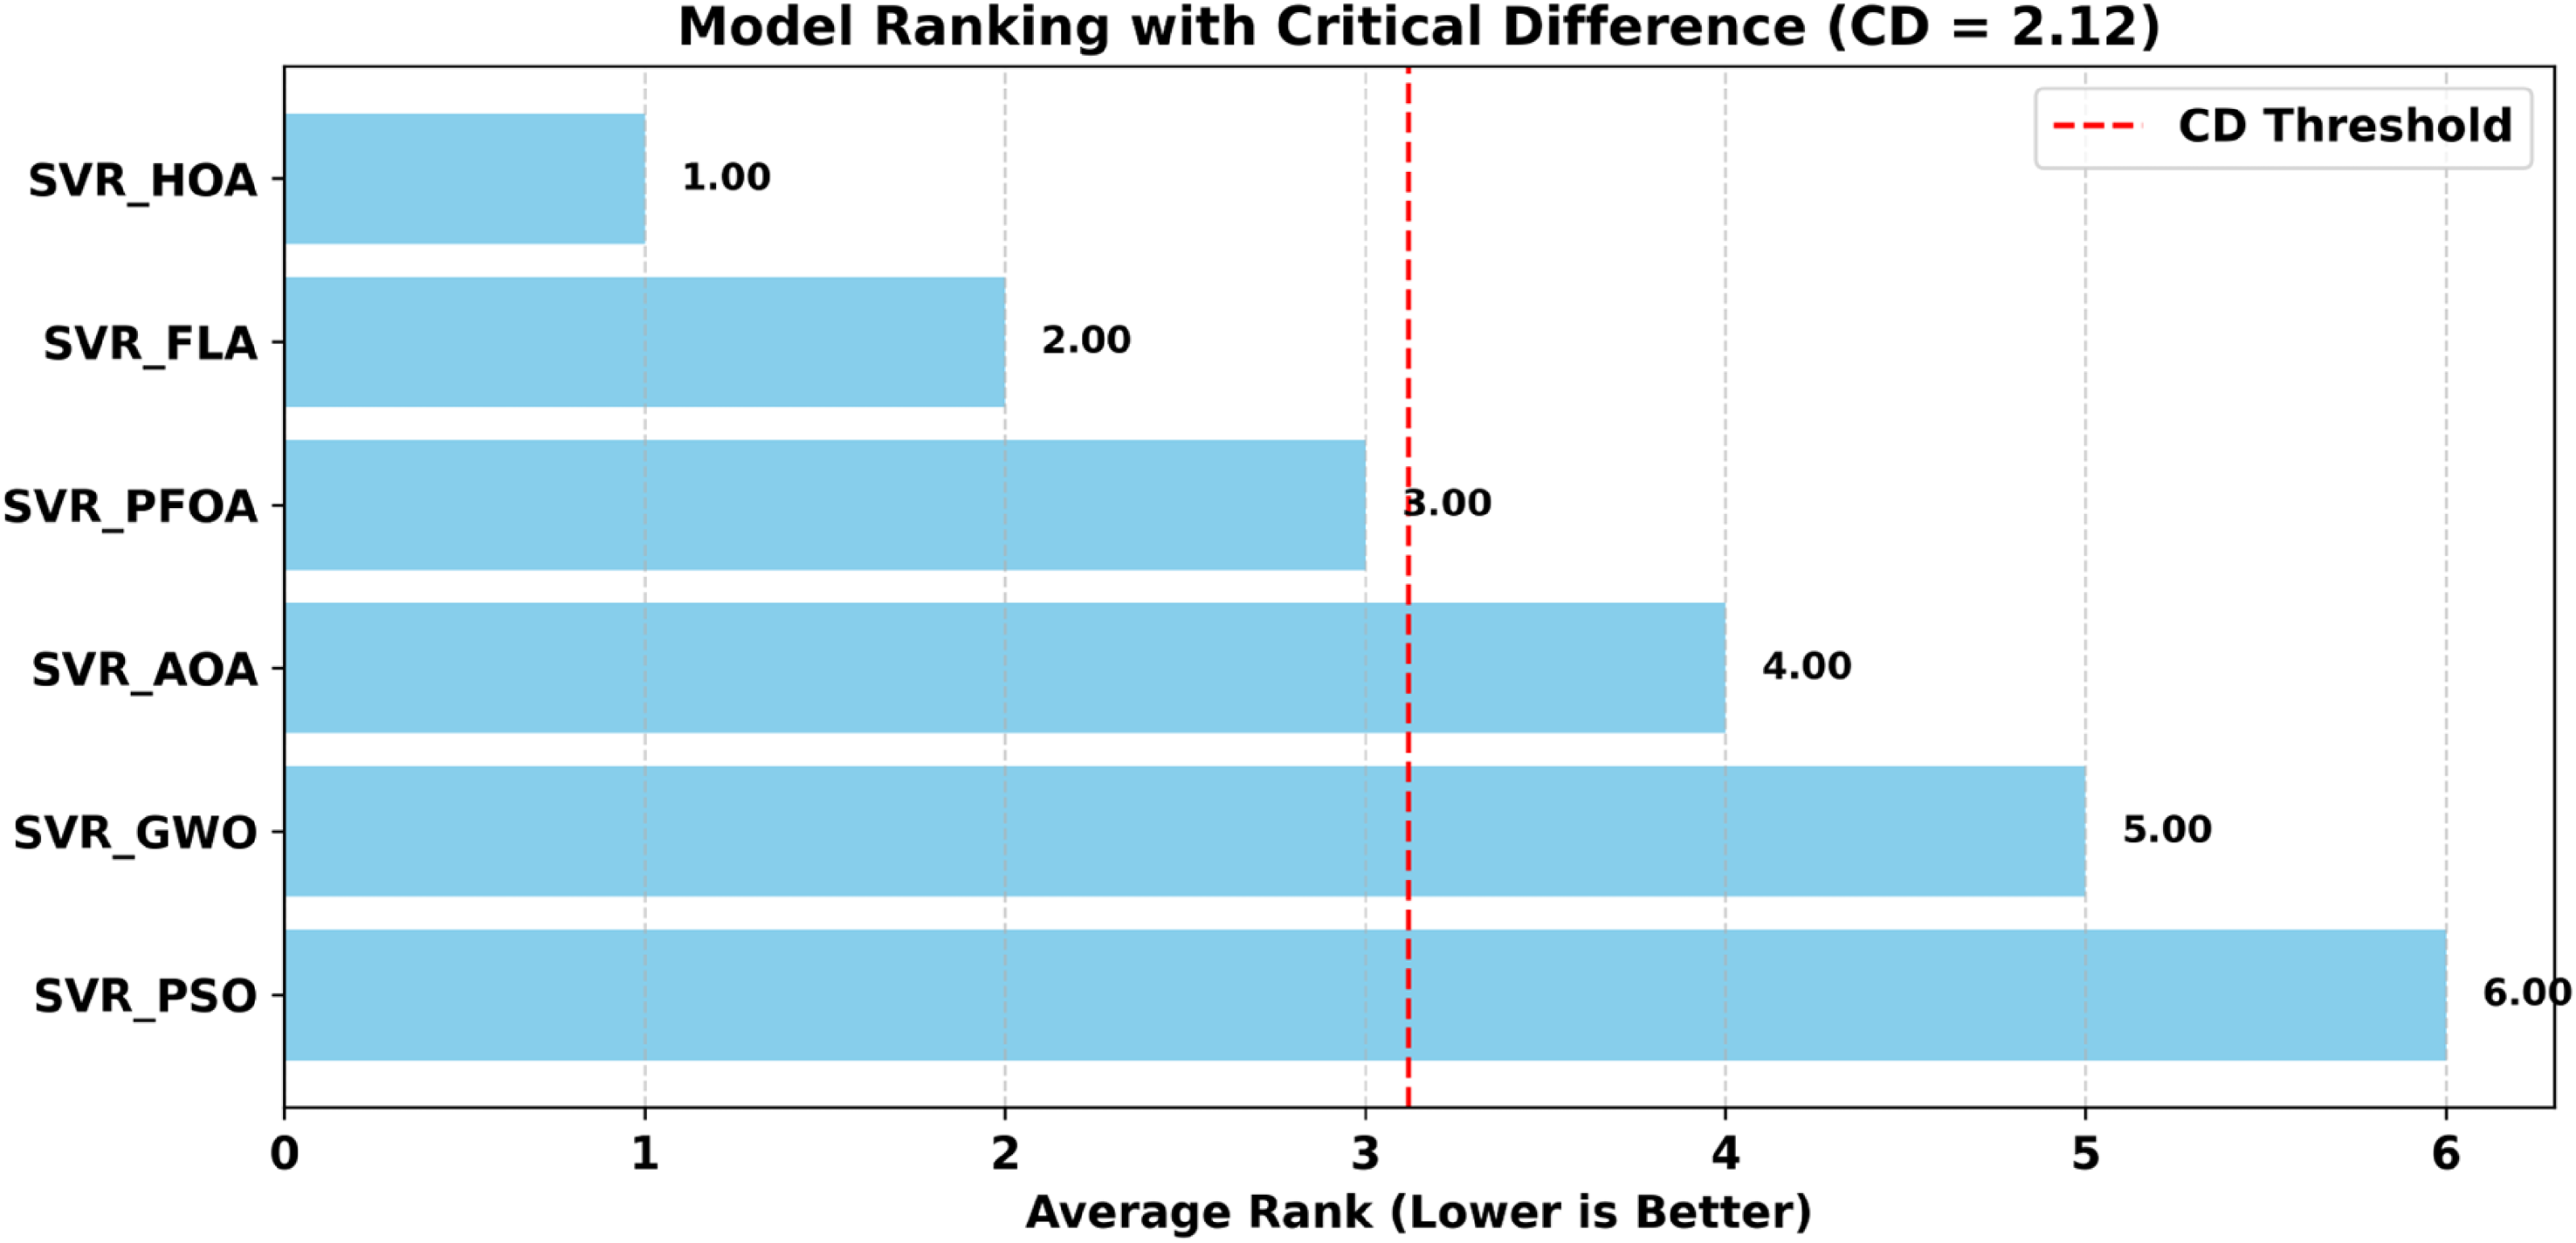
Average ranks for the different models based on the statistical tests.
Statistical test results.

Qualitative comparison between the models based on the statistical tests.
Practical implications
The resulted accuracy of prediction proves that the optimized SVR models can be used to predict energy consumption of buildings on a short-term basis in NZEB. Specifically, the SVR_HOA model demonstrated the best overall test results, with low MAE and RMSE, high R2, close to zero PBIAS, and WI, which is close to 1. These findings indicate that the model can assist in making more consistent load forecasts, enhancing operational planning, and greater coordination of building demand and on-site renewable generation. Though the statistical comparison demonstrates that SVR_FLA and SVR_PFOA are also similarly competitive, all the results show that SVR_HOA offers the most promising balance of predictive performance to the dataset considered.
Advantages and limitations
Practically, the framework developed has a number of benefits. It enhances predictive accuracy of SVR without altering the underlying regression form, allows dependable hourly load forecasting with actual campus-level data, and offers a comparative benchmark to select an effective optimizer based on the quality of forecasting. The excellent correspondence of the predicted and actual values also means that the model could be helpful in planning and scheduling operations, as well as short-term operational support in NZEB applications.
The study's model may lack generalization across diverse building types and climates due to limited dataset diversity. SVR's scalability issues can hinder performance on large-scale or high-frequency real-time data. Additionally, the computational overhead of metaheuristic optimization tuning may not be suitable for time-sensitive applications. The analysis covers a two-year period from 1 March 2018 to 29 February 2020, which may not fully capture longer-term seasonal and operational variations. A fixed stopping criterion of 100 iterations was used for all optimization algorithms, and no adaptive or early stopping rule was considered. This may increase computational cost and may not fully reflect the actual convergence efficiency of different methods.
Future scope
Future work can explore deep learning models for handling large, complex datasets and develop adaptive learning frameworks for real-time applications. Integrating load prediction with automated energy management systems will enhance NZEB control strategies. Validation on real-world NZEB pilot projects and incorporating occupant behavior modeling can further improve prediction robustness and practical utility. One can integrate the occupant behavior and building operational patterns to improve the prediction reliability. The proposed framework can be validated using multiple climatic zones and geographic locations to evaluate its generalizability. In another way, it can be extended to different building types such as residential, commercial, and industrial buildings. Future studies can focus on reducing the computational burden of metaheuristic optimization through improved stopping criteria. One can use effective preprocessing and feature engineering techniques to emphasize the datasets for more accurate results.
Conclusion
This research work successfully presents a comparative assessment of recent metaheuristic algorithms for hyperparameter optimization of an SVR model for BEC prediction in NZEBs. The National Institute of Technology Silchar, Assam, provided campus buildings’ hourly energy consumption data, comprising 17,544 samples used in this work. The processed dataset was divided into training (80%) and testing (20%) data using the train_test_split function. The training data were used to train the different optimized SVR models. The accuracy of the SVR model has been enhanced with the help of tuning the hyperparameters of the model. Initially, the parameters are optimized successfully with the help of conventional methods such as Grid search, Random search, and BO. Further enhancement in the accuracy of the model with the help of metaheuristic algorithms such as PSO, GWO, AOA, PFOA, FLA, and HOA algorithms was implemented successfully to optimize the hyperparameters of the SVR. Among the evaluated methods, the HOA-based SVR model achieved the best predictive performance on the test data, with a MAE of 8.3099 kWh, a RMSE of 11.1283 kWh, a coefficient of determination (R2) of 0.9986, a MAPE of 2.7820%, PBIAS of −0.0759%, and WI of 0.9996. The results show that the recent metaheuristic algorithms can improve the accuracy of SVR model for the BEC prediction in NZEB applications and also revealing that the newly evolved HOA algorithms show better accuracy for the BEC prediction. The statistical results show that the FLA and PFOA are the next better methods. However, the nature-inspired algorithms-based SVR models are more reliable for BEC prediction and also improve the operational planning in NZEB environments.
Footnotes
Author contributions
Rajasekar Thota, Pydi Bala Krishna, and Dasari Sreeman contributed to conceptualization, methodology, software, visualization, investigation, and writing—Original draft preparation. Busireddy Hemanth Kumar and Arvind R. Singh contributed to data curation, validation, supervision, resources, and writing—review & editing. Mohit Bajaj and Viktoriia Bereznychenko contributed to project administration, supervision, resources, and writing—review & editing.
Funding
The authors received no financial support for the research, authorship, and/or publication of this article.
Declaration of conflicting interests
The authors declared no potential conflicts of interest with respect to the research, authorship, and/or publication of this article.
Data availability statement
The datasets used and/or analyzed during the current study available from the corresponding author on reasonable request.