
Abstract
Hydrogen has recently been investigated as a promising renewable energy carrier. One of the most widely studied methods is water electrolysis, in which an electric current is applied to water to generate hydrogen gas. A recent study used a steel electrolyzer without a membrane, using potassium hydroxide electrolytes and solar panels for energy. Experimental results indicated that each electrolyzer plate required approximately 2–3 V, highlighting the need to match the number of plates with the operating voltage of the solar panels. The production of hydrogen per square meter of solar panel surface ranged from 1919 to 6919 liters, indicating optimal values for panel size and plate size are important for efficiency and device performance.
Keywords
Introduction
Renewable energy sources, including solar, wind, and hydroelectric power, have long been touted as the answer to environmental woes. The idea is that harnessing energy from sources that naturally replenish themselves can drastically reduce reliance on fossil fuels and decrease harmful emissions. Solar panels soak up the sun's rays, wind turbines spin in the breeze, and hydroelectric dams make use of flowing water - all without emitting greenhouse gases or polluting the air (Edwards et al., 2008; Hijikata, 2002). Basically, instead of relying on finite fossil fuels like oil and gas, we can use hydrogen as a clean and abundant alternative. This stuff can be produced from renewable sources like wind or solar power, and when it's burned or used in fuel cells, it only releases water vapor as a byproduct, so it's super eco-friendly (Haghmoradkhani et al., 2025; Mohammad et al., 2025). Plus, hydrogen can be stored and transported easily, making it a versatile option for powering vehicles, homes, and industries (Alayi and Ebazadeh, 2025; Elfizon et al., 2023). Electrolysis of water is a process that can produce hydrogen without causing pollution (Carmo et al., 2013). This method is seen as a hopeful way to create hydrogen (Zhang et al., 2025). Hydrogen has many advantages as an alternative to fossil fuels. It is highly efficient, abundant, and can be stored in various ways. Hydrogen can also be transported over long distances. There are different methods for producing hydrogen, such as coal and biomass gasification, thermochemical processes, natural gas extraction, and water electrolysis (Anazi et al., 2023). Hydrogen production via the electrolysis of water, also known as the water-splitting reaction, is a fascinating process that allows for the storage of excess renewable energy for future use (Sudrajat et al., 2018). When surplus electricity from sources like solar or wind power is available, it can be used to power electrolysis cells that split water molecules into hydrogen and oxygen (Ebazadeh et al., 2024; Rajhi et al., 2024). The hydrogen gas produced can then be stored and later used as a clean fuel source for various applications, such as powering vehicles or generating electricity (Baltacioglu et al., 2016). This method of hydrogen production is environmentally friendly and sustainable, making it an attractive solution for storing and utilizing excess energy in a way that reduces carbon emissions and reliance on fossil fuels (Alayi et al., 2022). Further research on hydrogen production and utilization by other experts in the field will also be explored.
In 2004, Prisecaru et al. experimented to validate a CFD model using a hydrogen mixture. Their findings revealed that the flame of the HHO gas mixture behaves uniquely at atmospheric pressure due to the high oxidation rate of hydrogen when mixed with oxygen in the correct ratio (Prisecaru et al., 2004). The process involves a primary zone, similar in length to the injection nozzle diameter, followed by a special area for separating water vapor with a nozzle diameter 10 to 15 times larger. This is then followed by a secondary combustion zone with temperature values around 645 °C.
Mizuno et al. (2005) optimized the electrode surface, plasma electrolysis temperature, current density, and input voltage using K2CO3 electrolyte and plasma electrolysis and concluded that the hydrogen production using the plasma electrolysis process was 80 times higher than that of conventional electrolysis. In a study conducted by Khelfaoui et al. (2021), an Experimental investigation of solar hydrogen production PV/PEM electrolyzer performance in the Algerian Sahara regions. Kelly significantly increased the efficiency of hydrogen by electrolyzers by inducing DC square waves with a frequency of about 40 kHz. He concluded that the resonant frequency of electrolyzer cells depends on many parameters, and this frequency varies for each electrolyzer with different sizes and specifications. In a study conducted by Mandal et al. (2012), tests were done using cylindrical and plate electrodes to compare energy consumption and efficiency of hydrogen production. The study also looked at the energy consumption and efficiency of hydrogen production when using pulsed current. The results indicated that electrolysis efficiency increases by 25 to 30% when using cylindrical electrodes compared to plate electrodes. Additionally, energy consumption efficiency increases by 34% when using pulsed current technology instead of DC.
Kaya et al. (2017) investigated an electrolyzer made of 304 stainless steels using the magnetic field method. They also examined the effect of the concentration of the potassium hydroxide electrolyte and concluded that the Lorentz force, if directed upwards, increases the hydrogen production by approximately 17% for 5 wt% and 15 wt% potassium hydroxide solutions. When the current density is increased to 5 wt%, 10 wt%, and 15 wt% concentrations, the hydrogen production increases by 19%, 5%, and 13%, respectively. However, if the force is directed downwards, the hydrogen production decreases by 14%, 8%, and 7% for 5 wt%, 10 wt%, and 15 wt% potassium hydroxide concentrations. Choi et al. (2017) conducted a study where they built a 20-cell 1 kW electrolyzer using nickel hydroxide positive plates and metal hydride negative plates. Their experiments showed that thin and porous electrodes are better at transferring electrical charge, resulting in a hydrogen production rate of 259.1 mL per watt-hour. Vincent et al. (2018) conducted a study where they used an electrochemical cycle to produce hydrogen and oxygen separately by using intermittent pulsed current. They discovered that the highest electrolysis efficiency was achieved with a current density of 0.2 A/cm2. The most effective conditions for reaching this efficiency were a cell voltage of 1.69 V, a solution temperature of 25 °C, and a frequency of 500 Hz.
In their study, Efendi and Nurisma (2019) researched a stainless steel electrolyzer that used potassium hydroxide as a catalyst. They discovered that increasing the concentration of potassium hydroxide resulted in greater electricity usage. The optimal production of hydrogen occurred at a concentration of 70 g/L of potassium hydroxide, achieving an efficiency of 54.76%. Bow et al. conducted a study on producing hydroxy gas using an electrolyzer (Bow and Dewi, 2019). Mousa et al. (2024) conducted a study on energy conversion efficiency for producing oxy-hydrogen gas using a simple generator based on water electrolysis. In a study by Subramanian and Thangavel (2020), the rate of hydroxy gas production was calculated using both numerical and experimental methods. The study involved running an electrolyzer at 40 amperes per hour and 80°C. Under these conditions, they were able to produce 0.75 liters of gas per minute. Their numerical model predicted a production rate of 1.3 liters per minute under the same conditions. Additionally, they examined how factors like electrolyte concentration, time, and temperature influenced production rate, energy requirements, and the number of modules needed for gas production. Salek et al. (2020) introduced a new hybrid system that utilizes an electrolyzer to create hydroxy gas using a pulse method. This hydroxy gas is then injected into the vehicle's engine. Their research demonstrated that the energy needed for the electrolyzer can be provided by the vehicle itself. The findings revealed that injecting hydroxy gas into the vehicle engine can decrease carbon monoxide levels by as much as 98%.
Imran and Hussain (2024) reviewed emerging innovations in solar-driven water splitting, providing comparative and economic analyses of various technologies. This article furnishes an overview of the available water-splitting technologies for harnessing solar energy as the primary source for hydrogen production, emphasizing the significant solar-to-hydrogen (STH) conversion efficiency. Ren et al. (2024) examined advancements in water electrolysis for hydrogen production, ranging from hybrid systems to self-powered and catalyzed devices. In a study by Abbas et al. (2024), an experimental investigation on a solar-powered oxy-hydrogen gas system for enhanced plastic pyrolysis.
Łosiewicz (2024) conducted a study on technology for green hydrogen production: desk analysis. Bilbao (2021) conducted a study in Chile to enhance hydrogen production by using an alkaline electrolyzer with a photovoltaic system. The aim was to utilize solar cells to warm up the water before it enters the electrolyzer. The findings revealed that in the specific conditions of the Chilean region, the water temperature entering the electrolyzer could be maintained at approximately 80 °C. Operating the electrolyzer at this temperature resulted in a 0.22% increase in annual hydrogen production and a 0.33% boost in electrolyzer efficiency compared to operating at varying temperatures. Additionally, by considering the thermal energy produced by the electrolyzer as a valuable output of the system, the overall energy efficiency improved by 13%.
In this study, a comprehensive experimental assessment of a multi-cell steel-plate electrolyzer directly powered by monocrystalline photovoltaic modules is performed under both constant and real daily radiation conditions. The work uniquely investigates a wide range of plate numbers (5 to 25) and PV configurations (one to five modules), enabling the identification of the optimal plate–voltage matching for each configuration. Furthermore, new datasets are provided regarding instantaneous and daily hydrogen-production behavior, system efficiency, and energy-consumption intensity across varying irradiance levels. These contributions address the current research gap related to the integrated performance evaluation of PV-driven electrolyzer systems and offer practical guidelines for optimizing hydrogen production under realistic solar operating conditions.
System description
The diagram in Figure 1 shows the electrolyzer and its plates. The plates are 18.5*20 cm in size, made of porous 325 steel, and 2 mm thick. The electrolyzer consists of 25 steel plates, but the number of plates can be adjusted from 5 to 25. To prevent the plates from touching, a 2 mm thick O-ring is used in a circular configuration. The plates are pressed together using two thick Teflon sheets that are 2 cm thick and long longitudinal screws to seal the electrolyzer. In the system operation depicted in Figure 2, a mixture of water and potassium hydroxide is prepared in a tank and distributed to all cells through the electrolyzer via the lower holes. By the application of electrical energy, hydrogen is generated and subsequently exits through the superior aperture of the plates. The inlet for the water-electrolyte mixture and the outlet for the hydrogen both return to the tank to inhibit the reintroduction of the electrolyte alongside the gas, particularly under conditions of elevated power levels. A conduit positioned at the apex of the tank is utilized to direct the hydrogen toward the instrumentation for production measurement. Solar cells, as delineated in Table 1, furnish the requisite energy for the electrolyzer utilized in this investigation. Upon the generation of electricity by the solar cells, the energy is transmitted via a cable to facilitate the process of electrolysis. In this manner, the volume of hydrogen produced is quantified based on the gas that is subsequently collected.
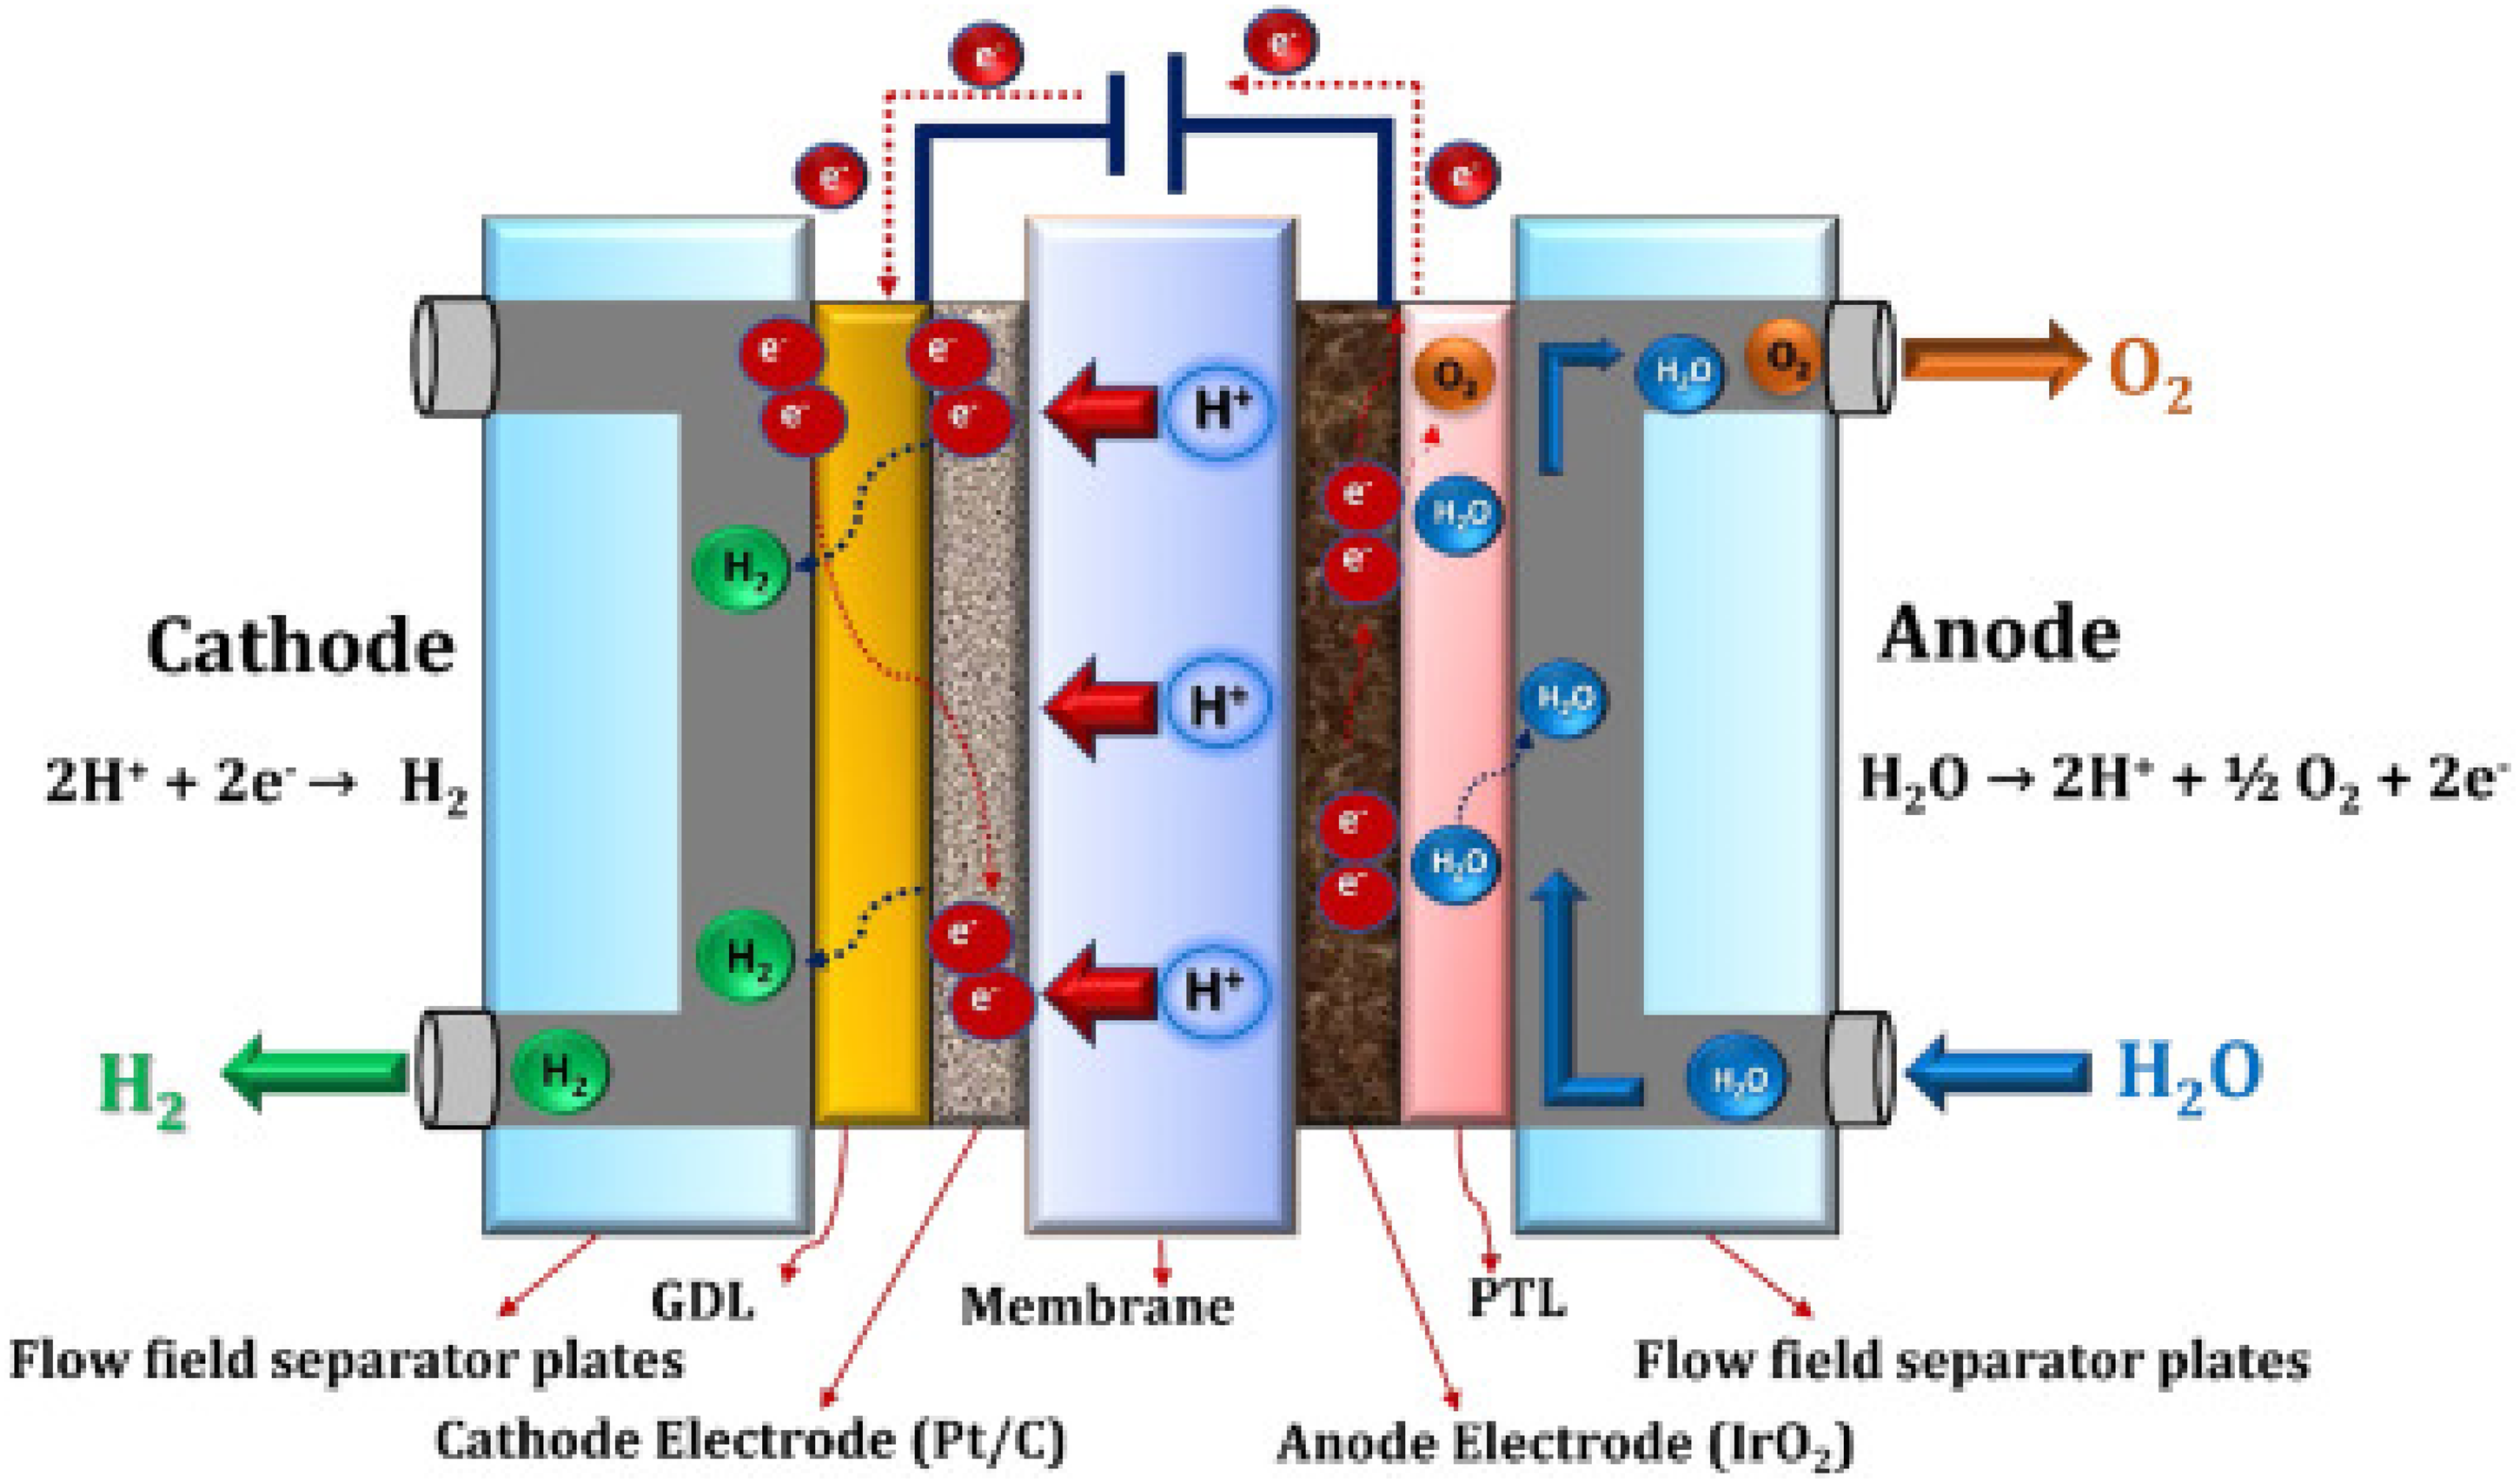
Schematic illustration of proton exchange membrane (PEM) electrolyzer, featuring the core components such as the anode, cathode, and PEM, along with the direction of water input, oxygen, and hydrogen gas output, and the flow of proton (H+) ions across the membrane, powered by a DC source.
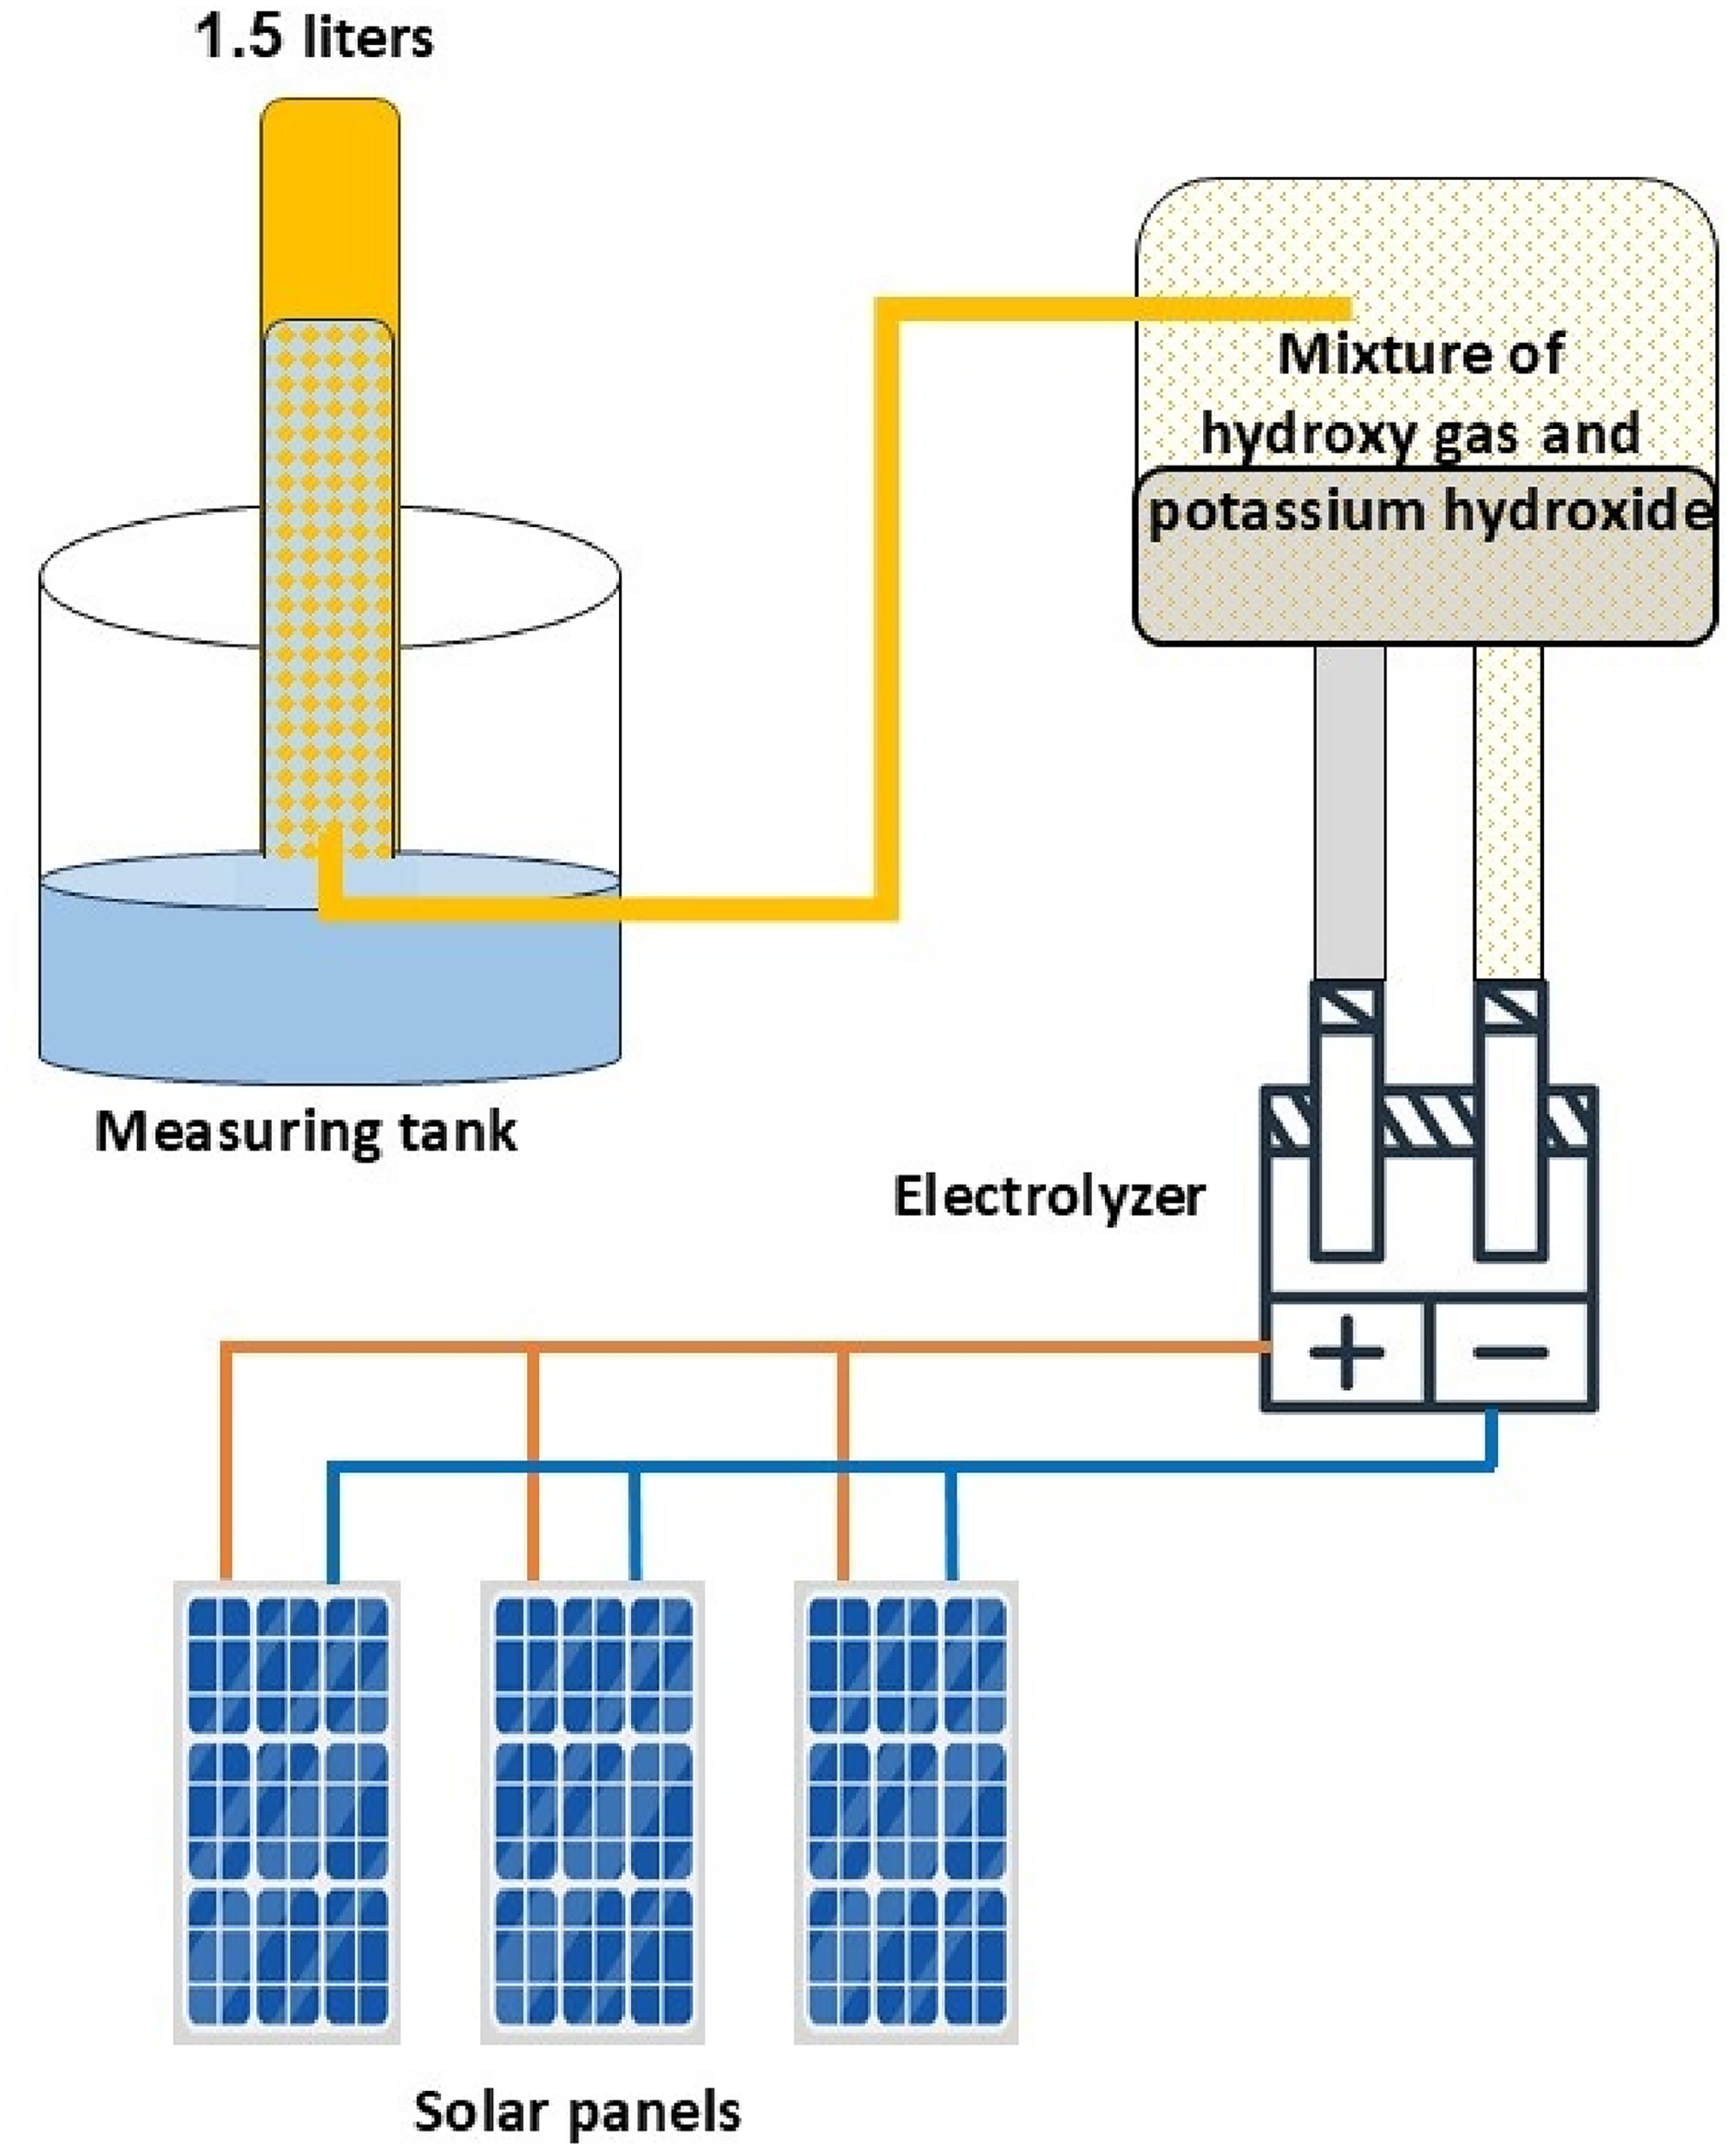
Schematic model for hydrogen gas electrolyzers powered by solar cells.
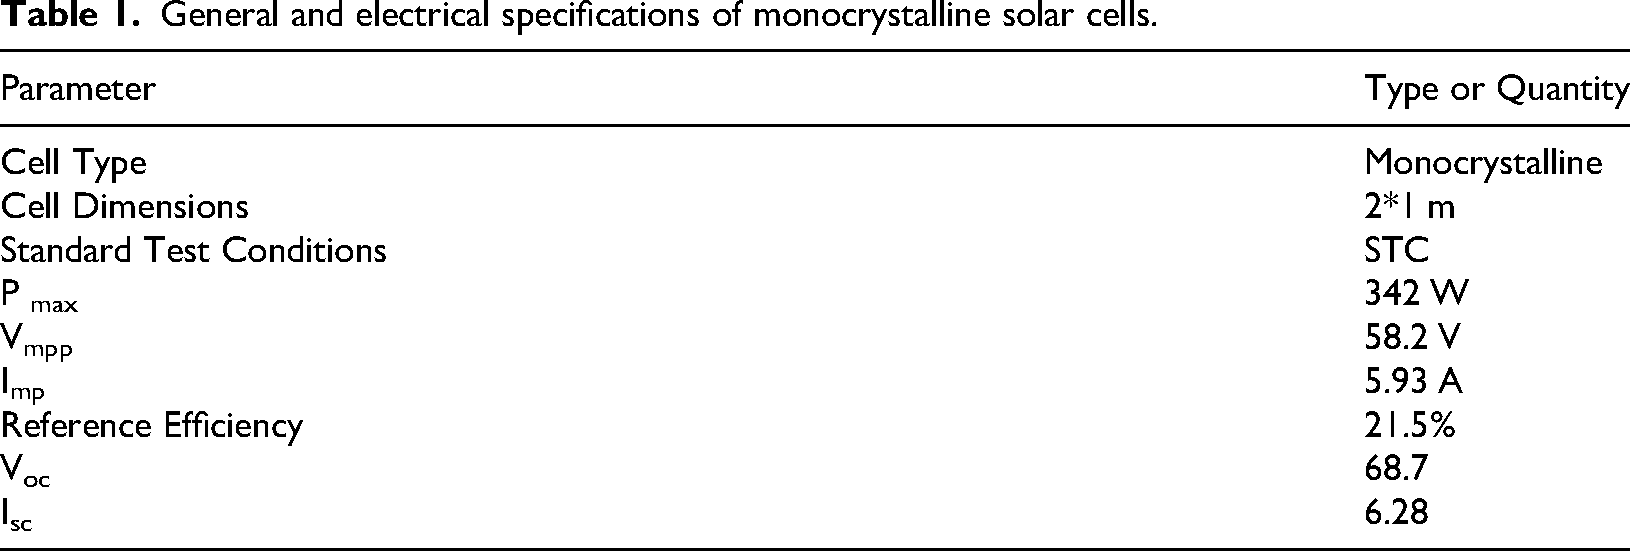
General and electrical specifications of monocrystalline solar cells.
Test conditions
Solar cells are widely used in hydrogen-production research due to their clean operation and lack of fuel requirements. In this study, solar cells provide the electrical energy needed for electrolysis. The three photovoltaic modules together are capable of generating nearly 1 kW under standard test conditions. Figure 3 illustrates the configuration of the renewable-energy-powered electrolysis system. The system includes a solar panel, electrolysis equipment, solar charge controller, lead-acid battery, and buck converter. Lead–acid batteries are suitable for off-grid applications due to their low cost, rapid response, and service life of approximately 10 to 15 years. Unlike lithium-ion batteries, they can provide power even when they are nearly empty. The system uses a solar panel with amorphous silicon cells, capable of generating up to 342 W, with an open-circuit voltage of 68.7 V and a short-circuit current of 6.28 A under standard conditions (1000 W/m2 solar irradiance at 25 °C). The electrical power generated by the photovoltaic system is supplied to the electrolysis unit, where water molecules are decomposed into hydrogen and oxygen through electrochemical reactions, as schematically shown in Figure 4.
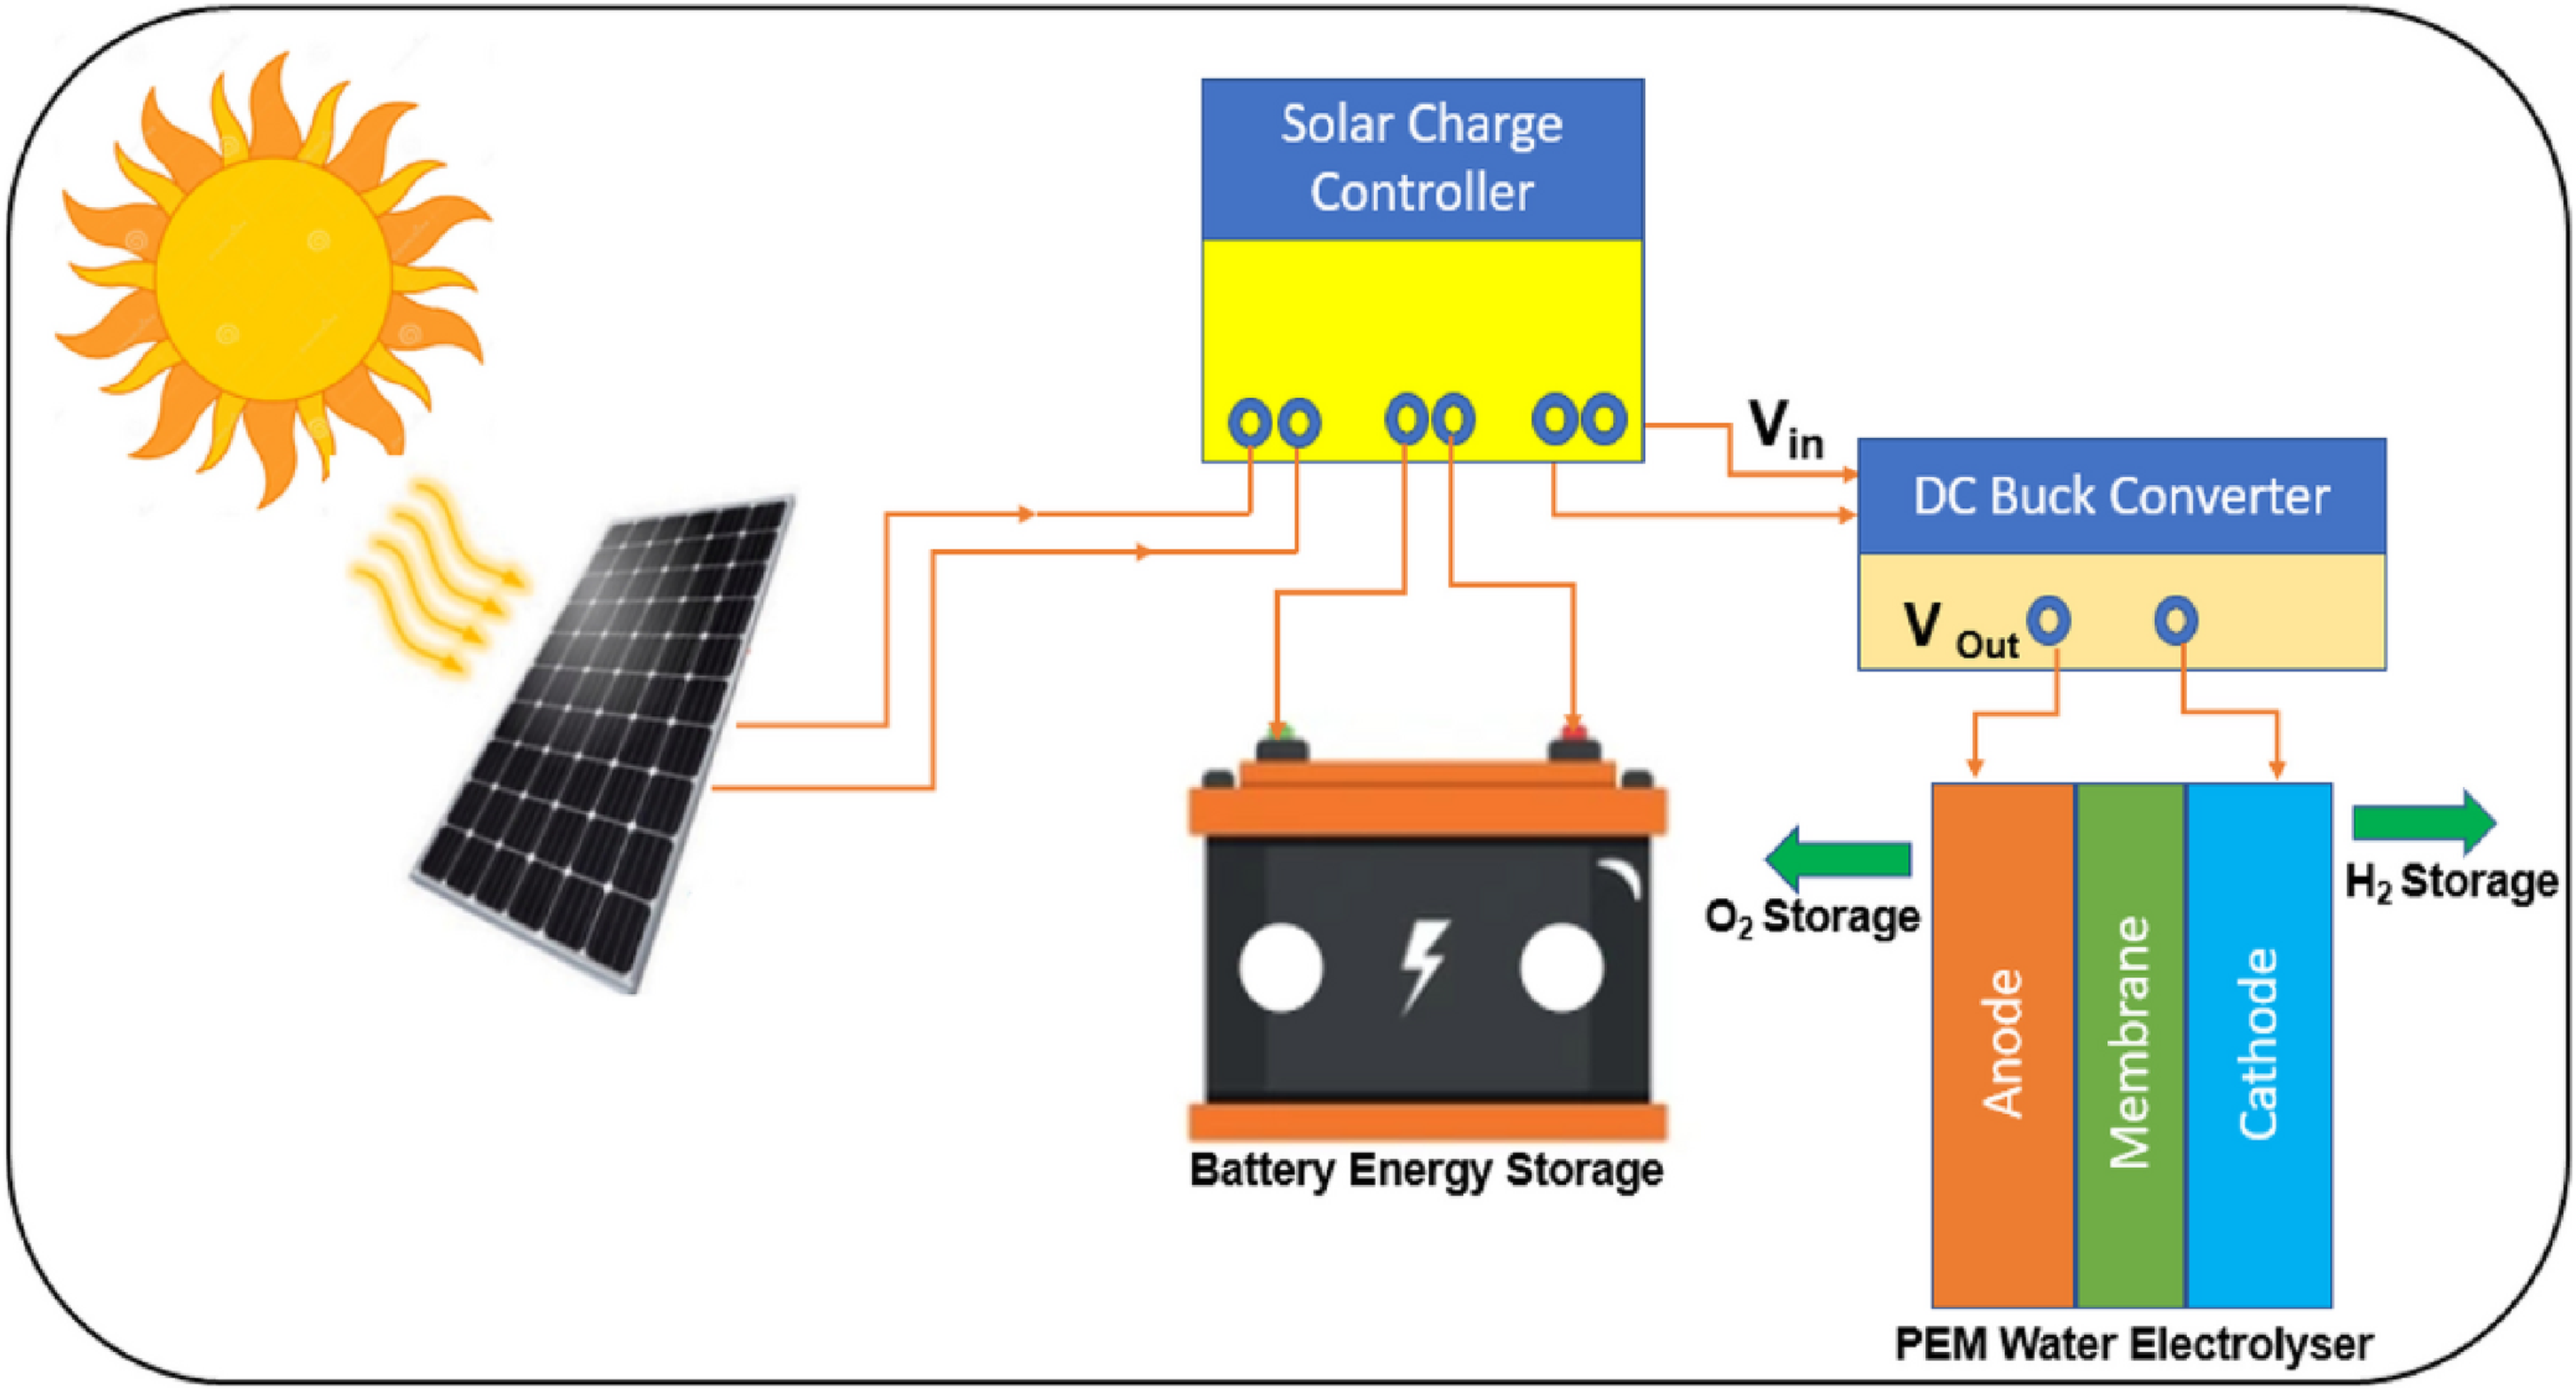
Schematic representation of the proposed energy management strategy for the pv-electrolysis system for hydrogen production.
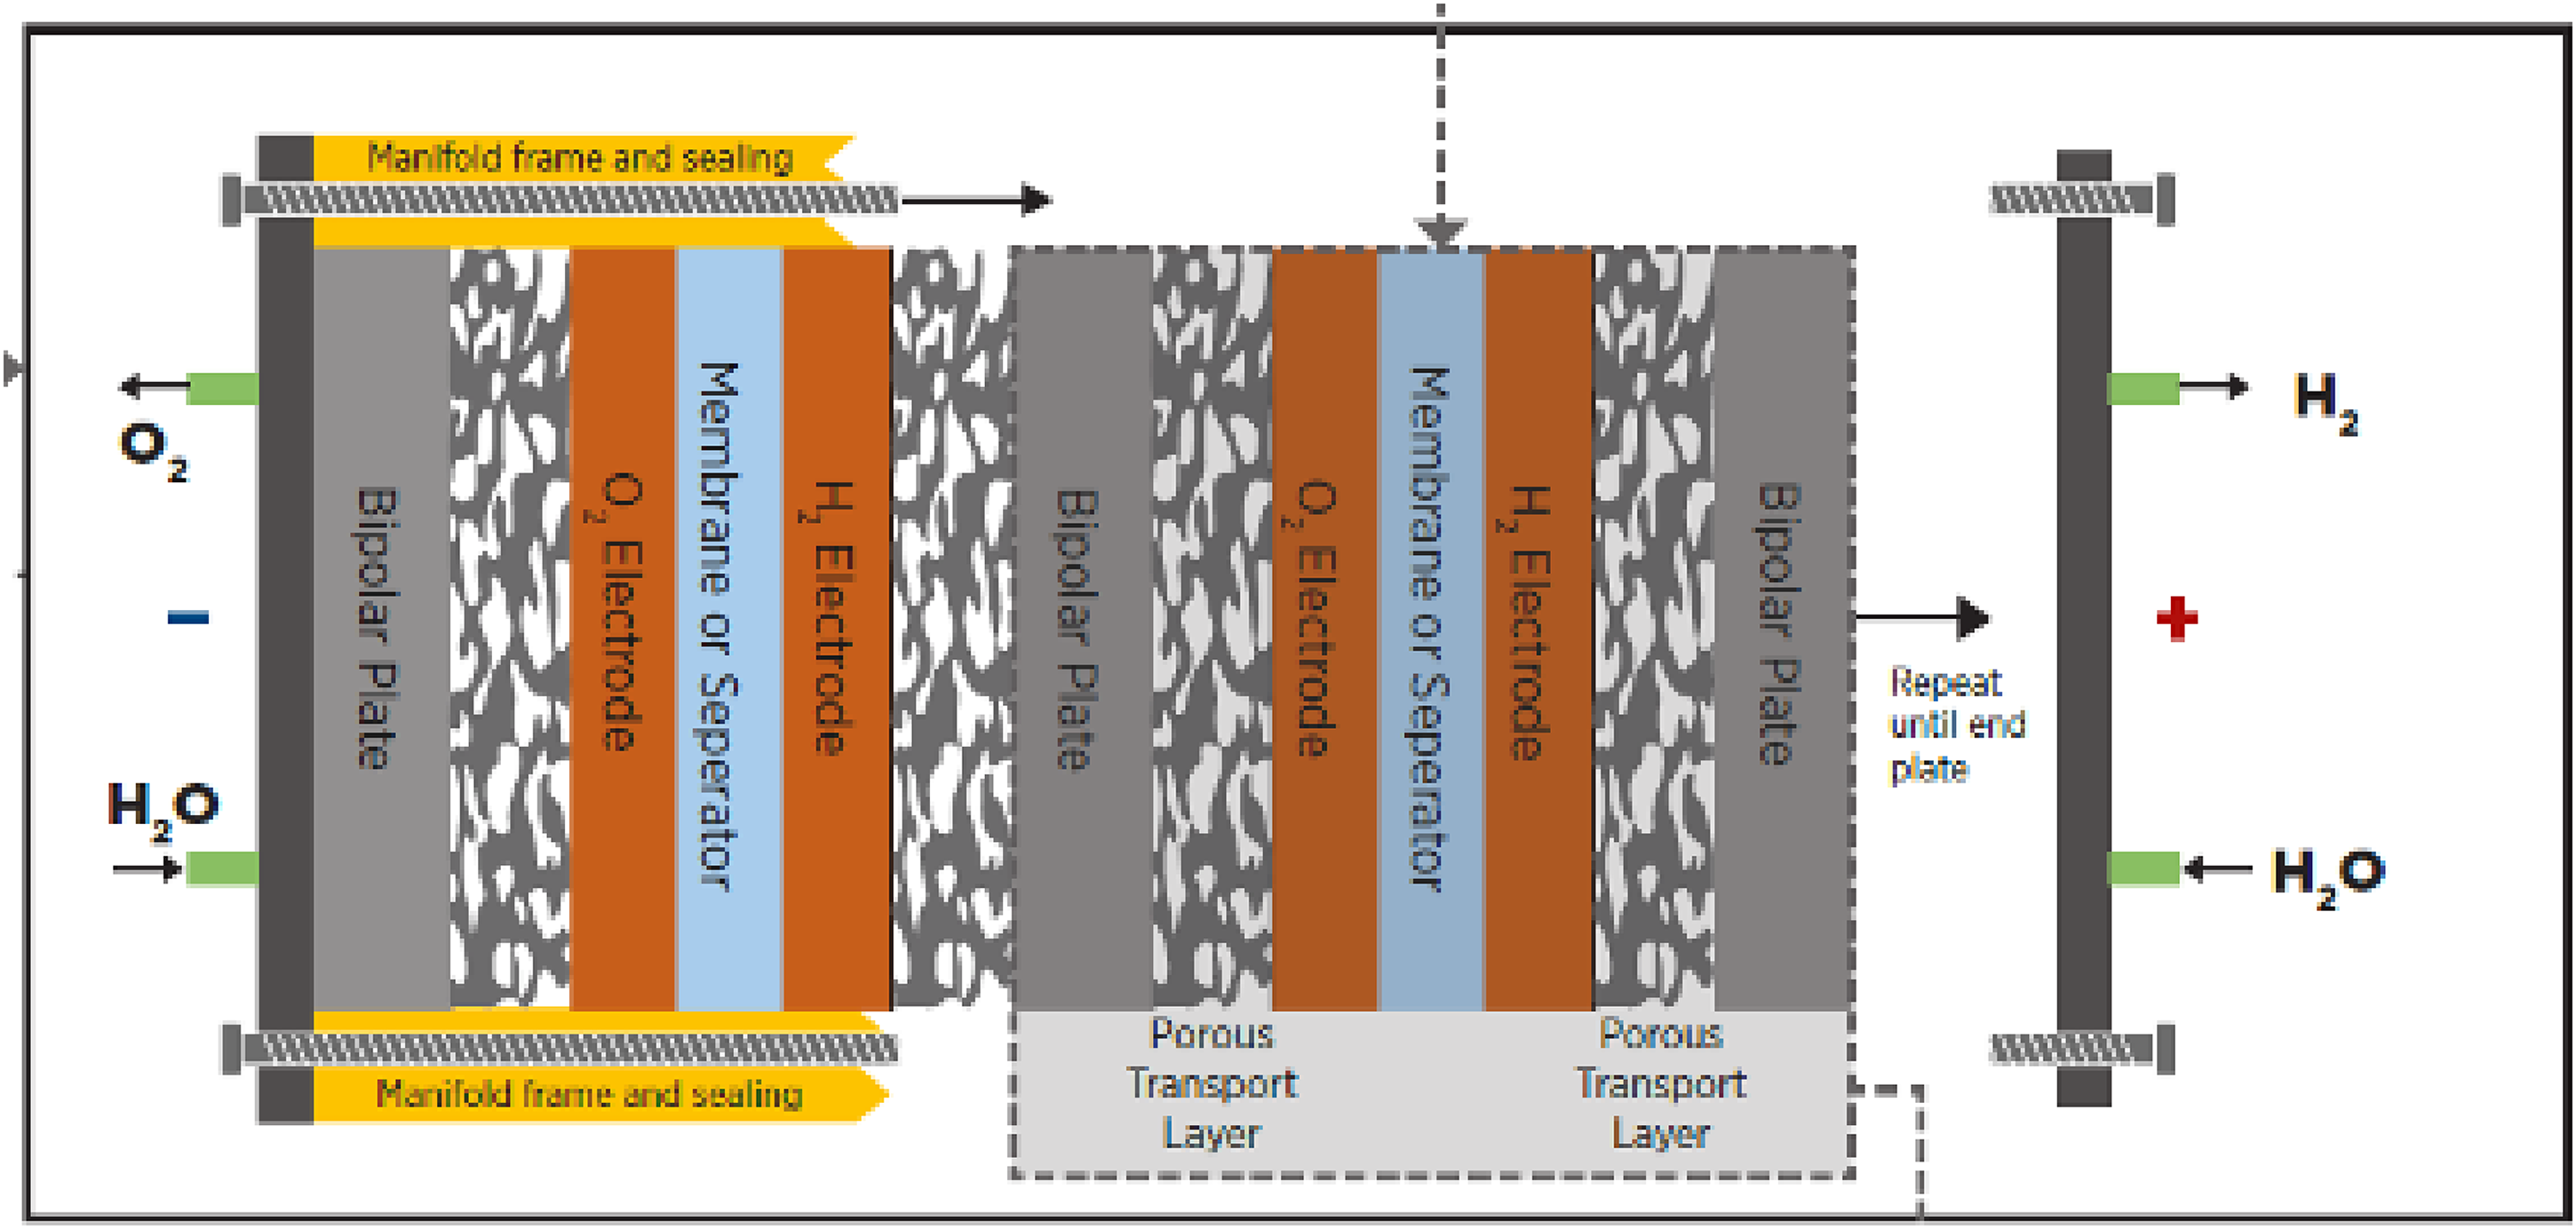
Schematic illustration of the water electrolysis working principle.
Device performance parameters
The method of calculating the power of the solar cell is shown in equation (1).
In equation (1), V stands for the cell voltage, and I stands for the ampere rating of the solar cell. Equation (2) is used to determine the hydrogen production rate per unit area.
This equation explains that GP represents the rate at which hydrogen is produced, while the AHHO,cell represents the surface area of the plates used in the electrolyzer. Equation (3) shows how to calculate the power density.
This equation shows how to calculate the energy consumption intensity of an electrolyzer. In the equation, V stands for the voltage used by the electrolyzer, I stands for the current used by the electrolyzer, APlate represents the area of each electrolyzer plate, and Np represents the number of electrolyzer plates.
Equation (5) shows how the efficiency of the solar system used in this study is calculated.
The intensity of solar radiation is represented by S, and the surface area of the solar cell is represented by APV.
To strengthen the theoretical foundation of the performance model, a hybrid experimental–theoretical formulation was incorporated. The improved model explicitly links the plate-level voltage requirement (1.5–2.1 V per plate), real-irradiance dependent PV power input, and electrolyzer power density to predict hydrogen production more accurately. Unlike conventional steady-state models, the present formulation accounts for variations in solar radiation, the nonlinear increase in current with plate number, and the influence of thermal behavior on production rate. By integrating these experimentally validated correlations into the model, a unified representation of energy consumption intensity, hydrogen-production kinetics, and plate–voltage matching is achieved. This provides a new predictive capability for determining the optimal plate count under different PV configurations.
Results
To enhance the interpretative clarity of the findings, a comparative assessment was carried out across all PV-electrolyzer configurations. The results show that although increasing the number of plates reduces the internal resistance and increases current flow, the optimal configuration depends strongly on the available PV power. For instance, the highest hydrogen-production rates occur when plate number and PV voltage are properly matched, as seen in the combinations of 17 plates with one module, 19 plates with two modules, 16 plates with three modules, 14 plates with four modules, and 15 plates with five modules. A comparison of the energy-consumption intensity among these cases reveals that two modules provide the most balanced performance, demonstrating lower consumption per liter of hydrogen than the higher-power configurations. Under daily radiation conditions, production trends follow the solar-irradiance curve, yet the relative differences among the five configurations remain consistent, confirming that the plate–PV matching mechanism governs system behavior more strongly than short-term irradiance fluctuations. These comparative insights highlight the operational advantages and trade-offs of different configurations and provide a clearer basis for selecting the optimal PV–electrolyzer arrangement.
Results of tests with constant radiation (1000 ± 25 W/m2)
The experimental procedures were undertaken during the midday period when the solar irradiation incident upon the surface of the cell exhibited a relative stability, characterized by fluctuations not exceeding 2.1%. The principal variables influencing the experimental outcomes were the quantity of electrolyzer plates and the arrangement of solar cells. The quantity of electrolyzer plates varied between 5 and 25, while the solar cells were evaluated in configurations comprising one, two, three, four, and five cells operating in parallel. Figure 5 illustrates the relationship between current consumption and voltage across various operational modes.
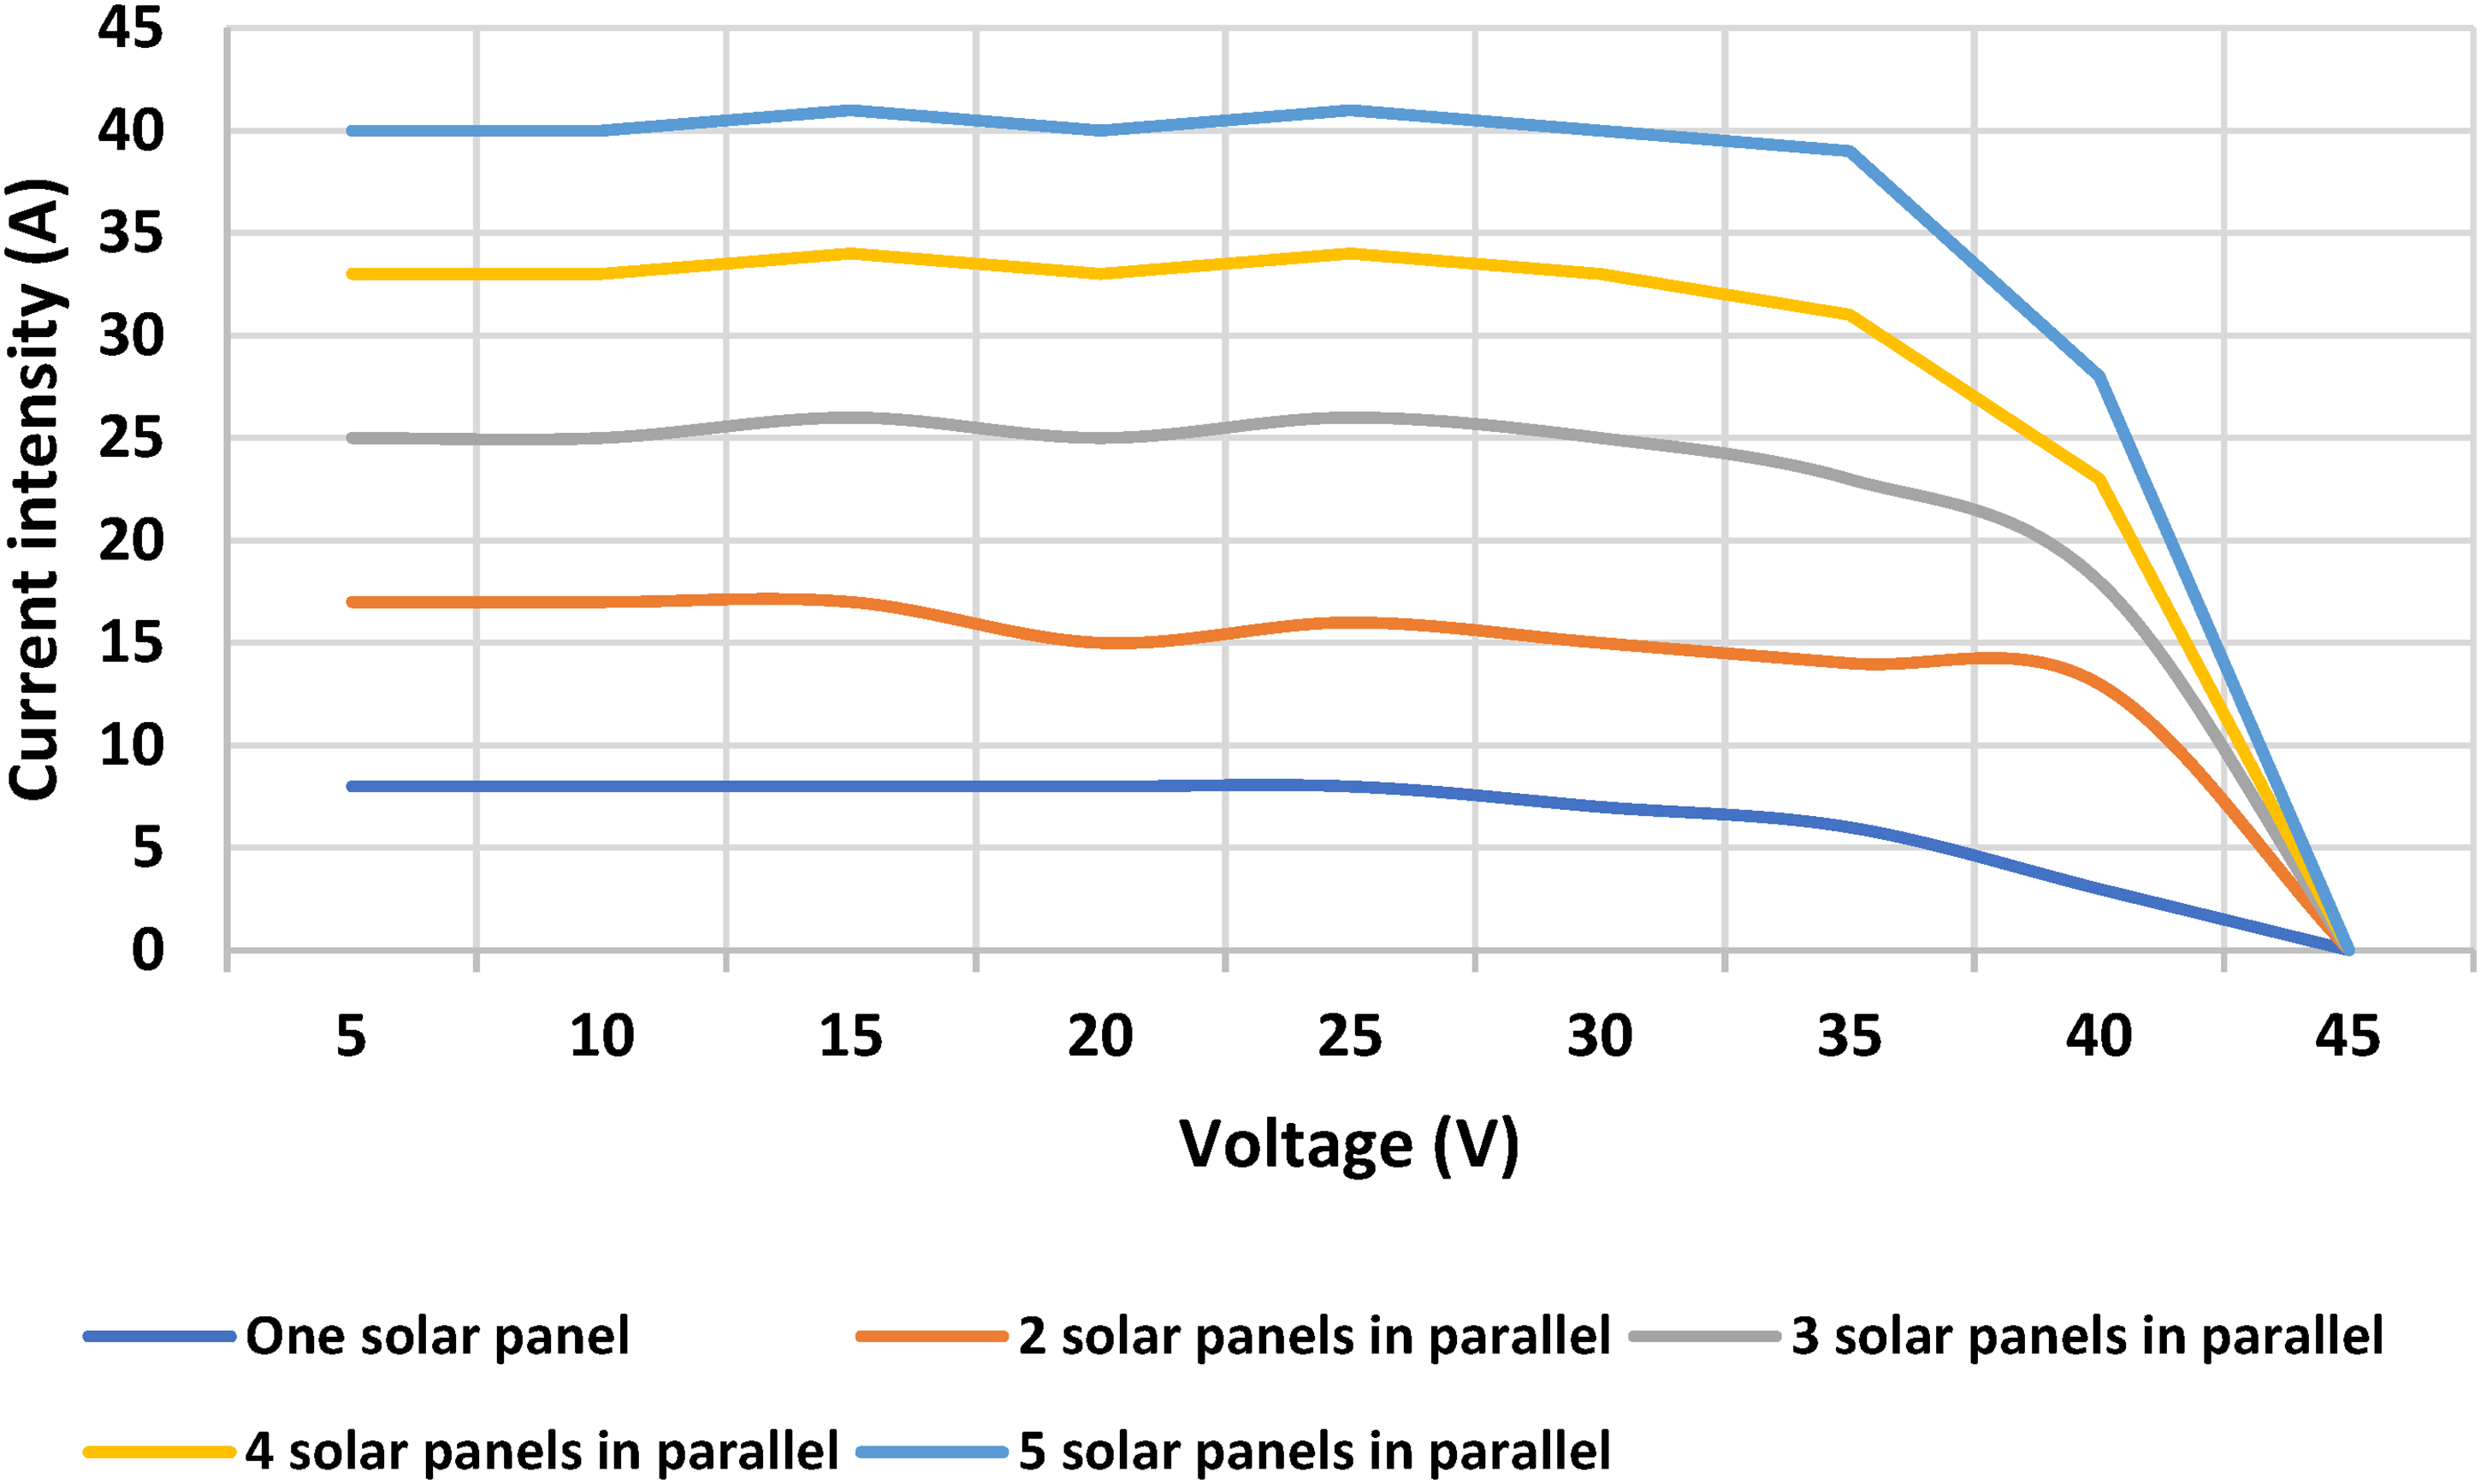
The current consumption versus voltage for different modes.
The illustration presented in Figure 5 delineates the correlation between current consumption and voltage across various operational modes. As the quantity of plates within the electrolyzer escalates, the resistance encountered by the electrolyzer diminishes, thereby facilitating an increased flow of current throughout the circuit. This interrelationship between the number of plates and current consumption is imperative for the enhancement of the efficiency of the solar circuit. Through the modulation of the number of plates in the electrolyzer, one can regulate the magnitude of current traversing the system and thereby optimize the energy yield from the solar cells.
This is because the more plates there are in a cell, the greater the surface area available for chemical reactions to occur. This increased surface area allows for more efficient conversion of chemical energy into electrical energy, ultimately leading to higher power output. However, it is important to find a balance, as adding too many plates can also lead to increased resistance and decreased efficiency. Therefore, finding the optimal number of electrolyzer plates is crucial in maximizing power output from the cells. Figure 6 shows the voltage consumption of the electrolyzer versus the number of plates.
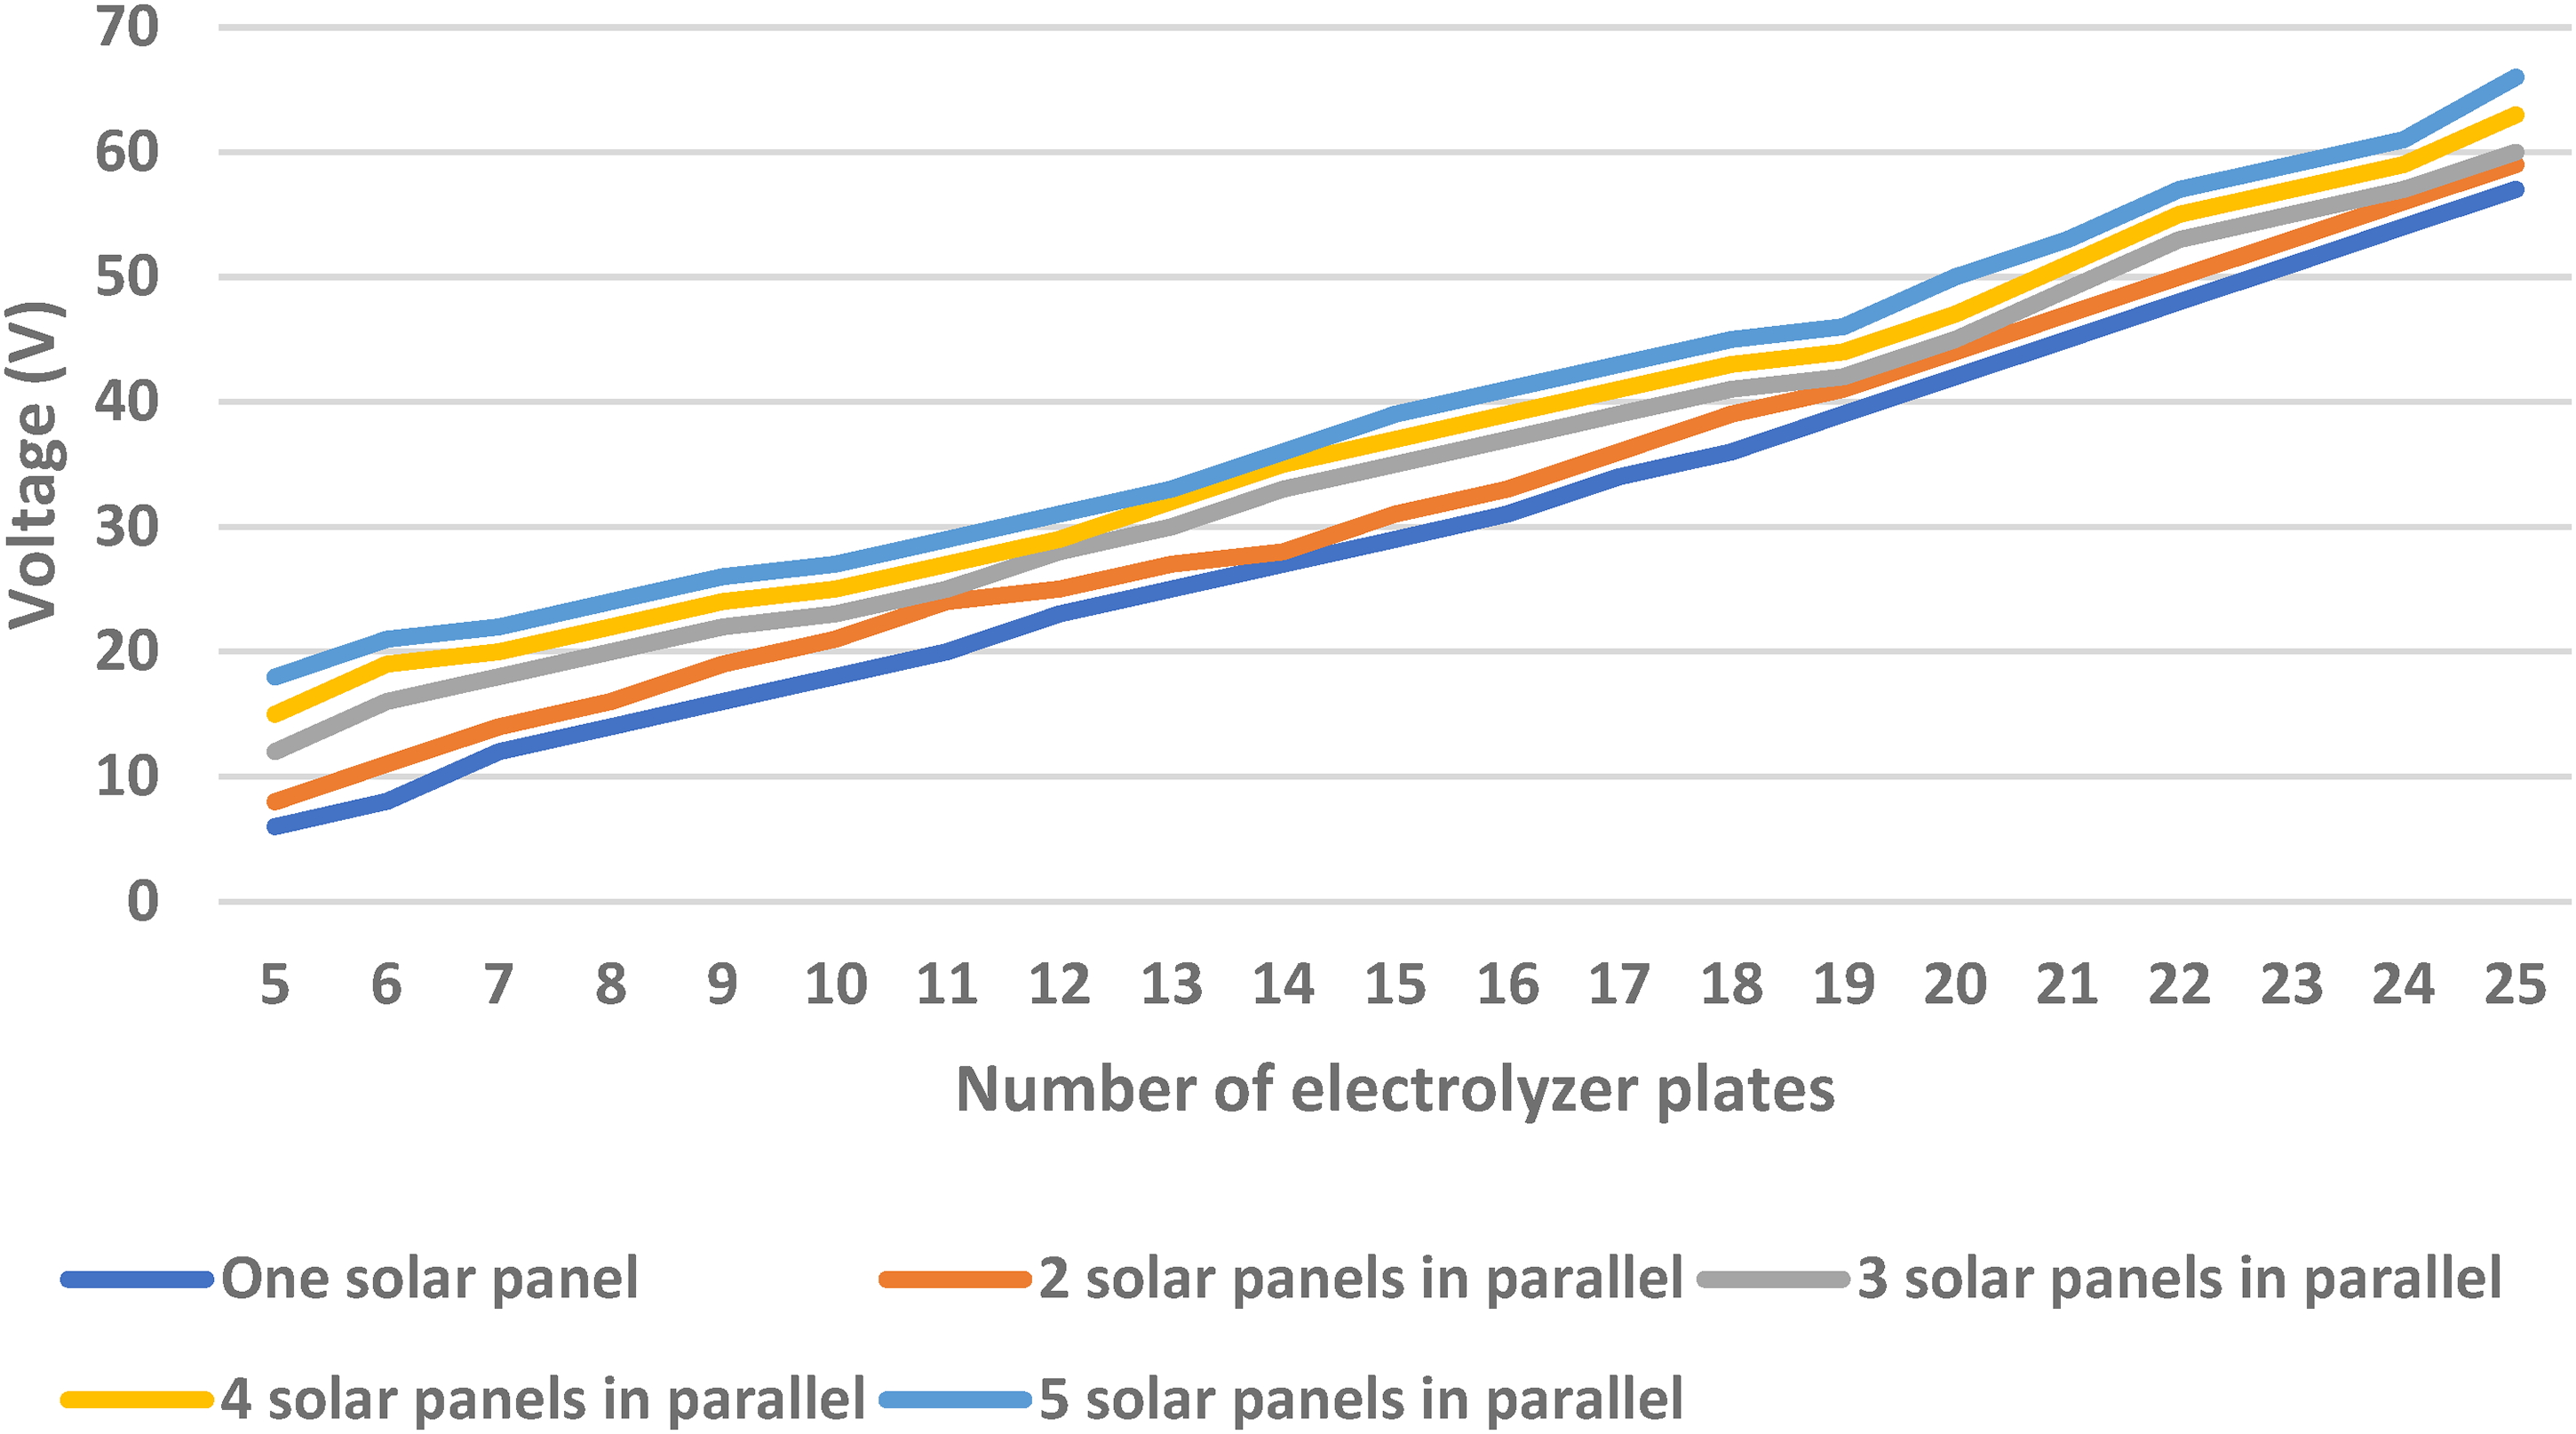
The electrical voltage utilization of the electrolyzer in relation to the number of plates.
As more electrolyzer plates are connected in series, the total voltage of the cells increases linearly. This means that the overall voltage consumption of the electrolyzer also increases with the number of plates. Figure 6 illustrates this relationship, showing a clear upward trend in voltage consumption as more plates are added to the electrolyzer system. It is important to consider this increase in voltage consumption when designing and operating an electrolyzer system. The experimental results show that the voltage consumption of the electrolyzer increases linearly with plate number. When 25 plates are present, the voltage consumption is between 63 and 66 V. The power produced by the cells must be compared to that of the electrolyzer. Each cell can generate up to 342 W with an open circuit current of 6.28 amperes and an open circuit voltage of 68.7 V.
As shown in Figure 7, the generated power reaches its expected peak based on the number of plates and photovoltaic configuration.
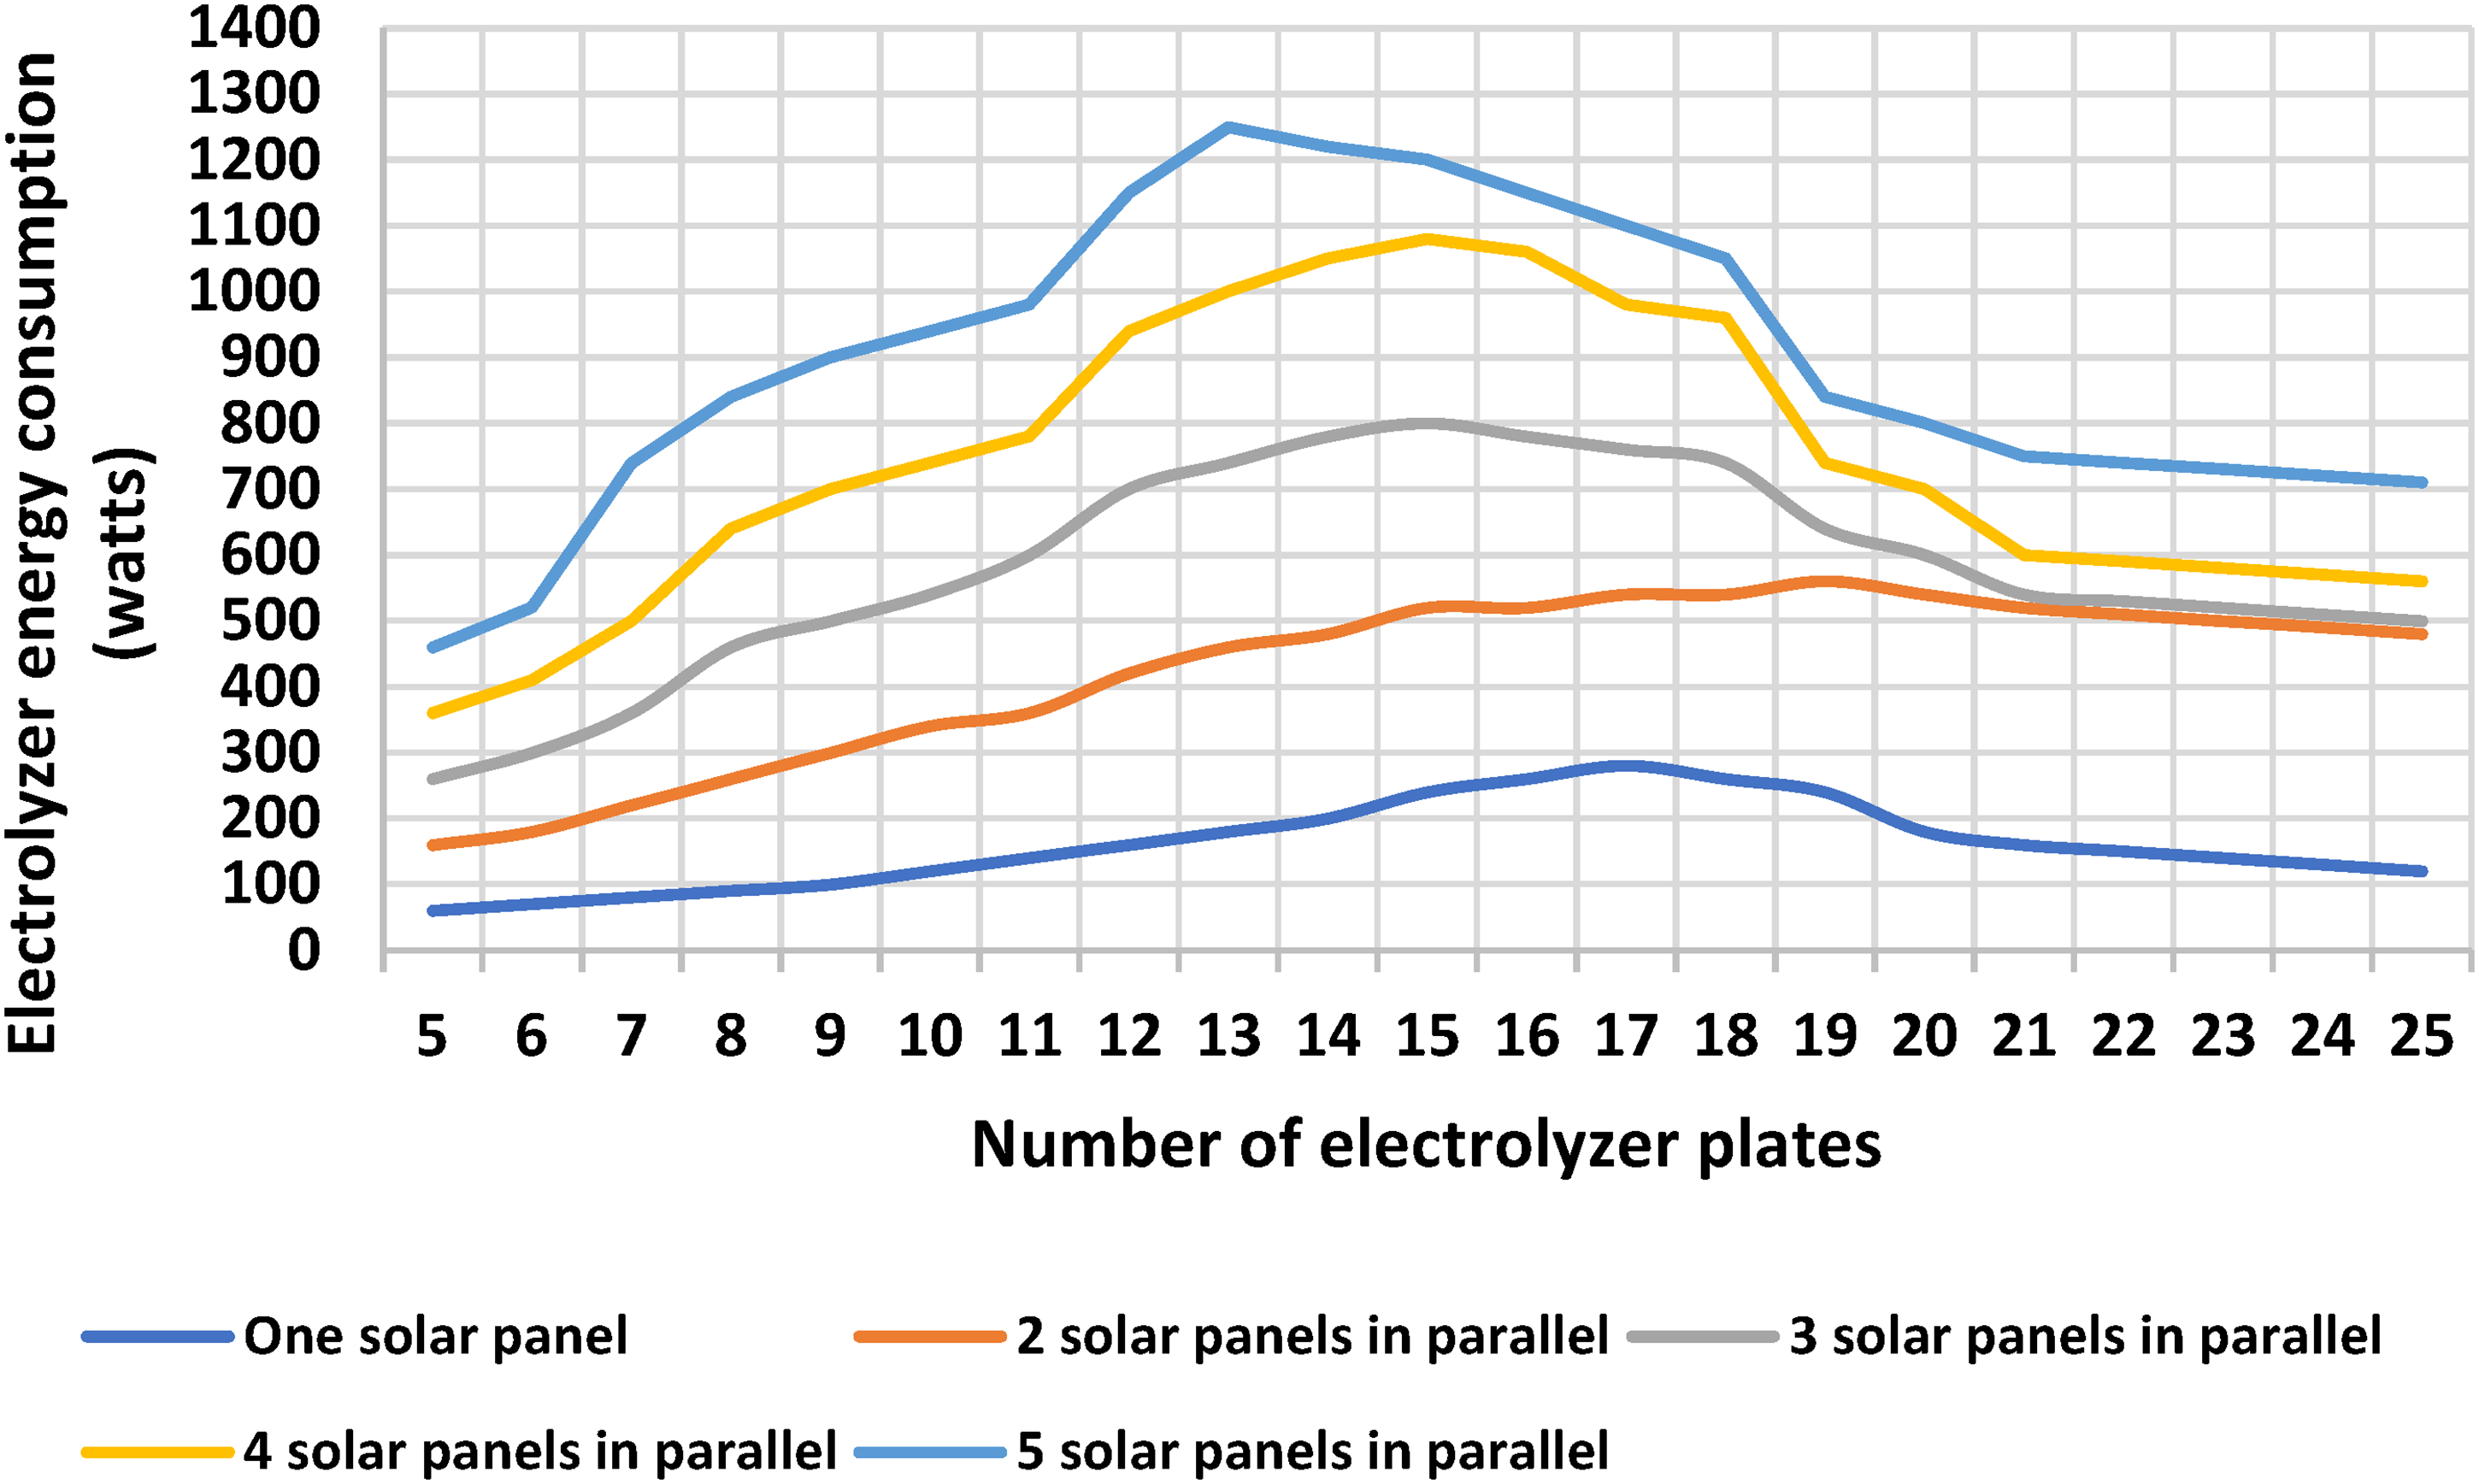
The role of plate number in the electrical performance of electrolyzers.
The experimental results show that connecting three solar cells in parallel results in the electrolyzer reaching its maximum power consumption when using 13 plates. The graph in Figure 8 clearly illustrates that the number of electrolyzer plates has a significant impact on the amount of hydrogen gas produced. It is evident that using two parallel solar cells with 19 plates each yields the highest gas production, followed closely by using one solar cell with 17 plates. These results confirm the effectiveness of photovoltaic-driven electrolysis for hydrogen generation.
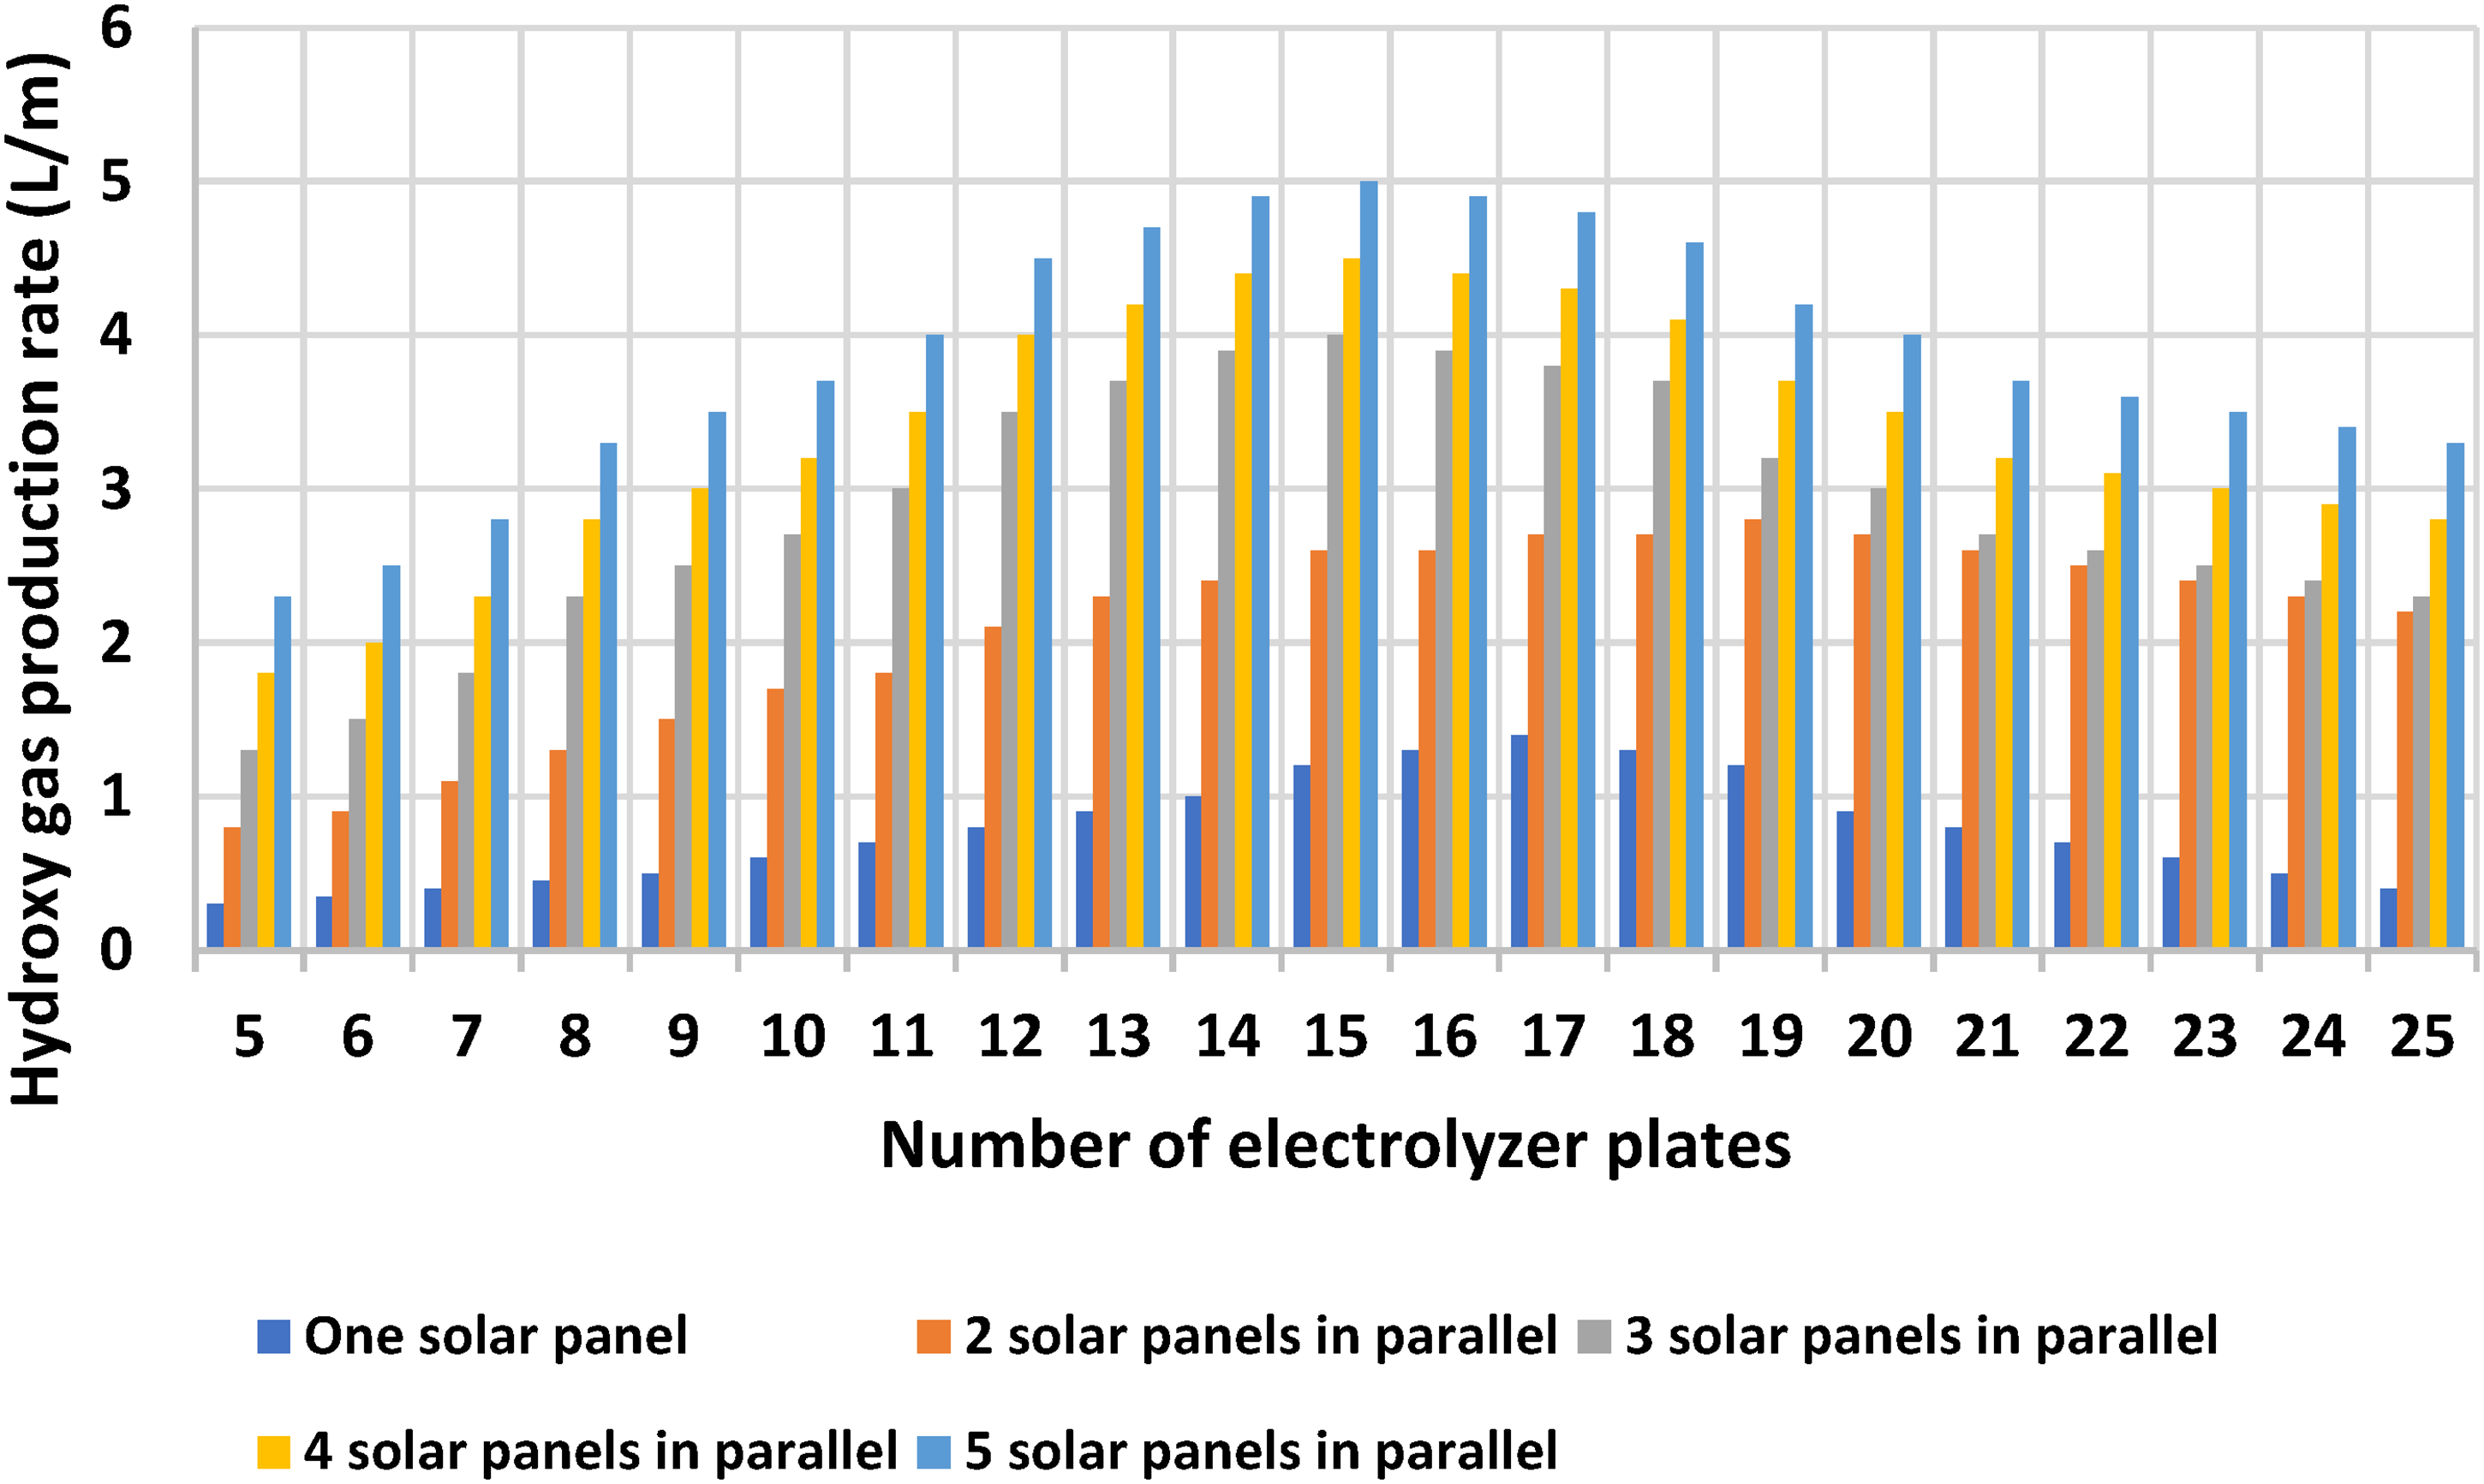
Correlation between hydrogen production rate and electrode plate configuration in electrolyzer systems.
The highest hydrogen production occurs when the cells reach their maximum power output. For example, when one solar cells are connected in parallel, peak power consumption and hydrogen production occur with 17 plates, resulting in 1.4 L per minute. In contrast, the utilization of two parallel solar cells results in optimal hydrogen generation and energy usage at 19 plates, producing 2.4 L/min. The implementation of four parallel solar cells demonstrates that peak hydrogen generation and energy consumption transpire at 14 plates, resulting in 4.6 L/min, while the incorporation of five parallel solar cells indicates that maximum hydrogen generation and energy consumption occur at 15 plates, yielding 5 L/min.
Results of daily tests
Tests conducted with constant radiation have revealed that the ideal number of electrolyzer plates for generating the most hydrogen with five, four, three, two, and one solar cells is 15, 14, 16, 19, and 17, respectively. These optimal plate quantities were used to analyze the solar electrolyzer system under typical daily conditions. Table 2 presents the various parameters, including the optimal plate count, maximum power output from the solar cells, hydrogen production rate, and efficiency. The solar radiation intensity in all scenarios is 1000 ± 25 watts. The results also show the solar system's efficiency. Daily experiments were conducted in mid-June and during the summer.
System parameter optimization at constant radiation levels (1000 W) to enhance engineering performance.
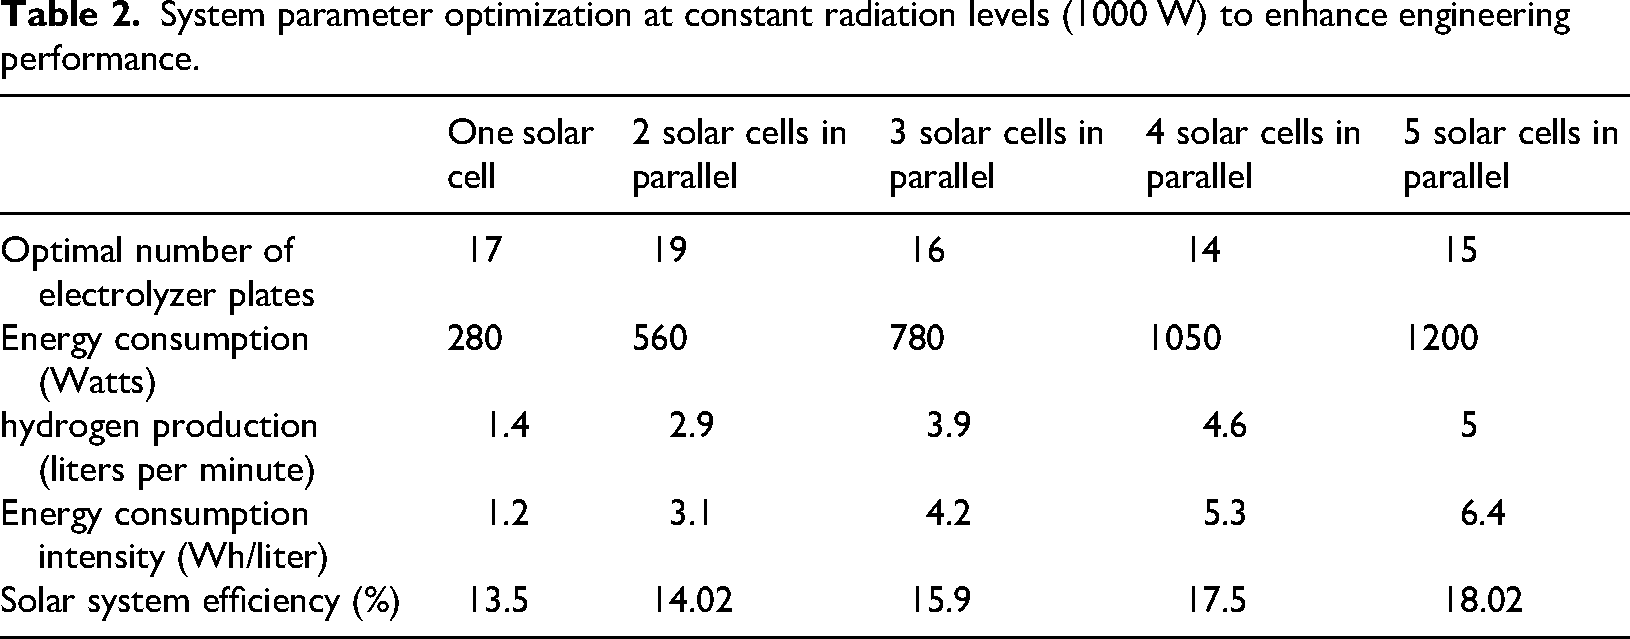
Figure 9 shows the daily radiation and ambient temperature in Yazd, Iran. The city has a longitude of 54.3675, a latitude of 31.8972, and an altitude of 1237 meters above sea level. The ambient temperature increased during the morning hours and exhibited minimal variation throughout the afternoon. A pyranometer and thermometer were used to measure solar radiation and ambient temperature. Figure 10 depicts the power output of the photovoltaic modules and their correlation with the electrolyzer's power consumption over time. An increase in solar irradiance enhances the power output of the photovoltaic modules, thereby increasing the electrolyzer's power intake and hydrogen-production rate.
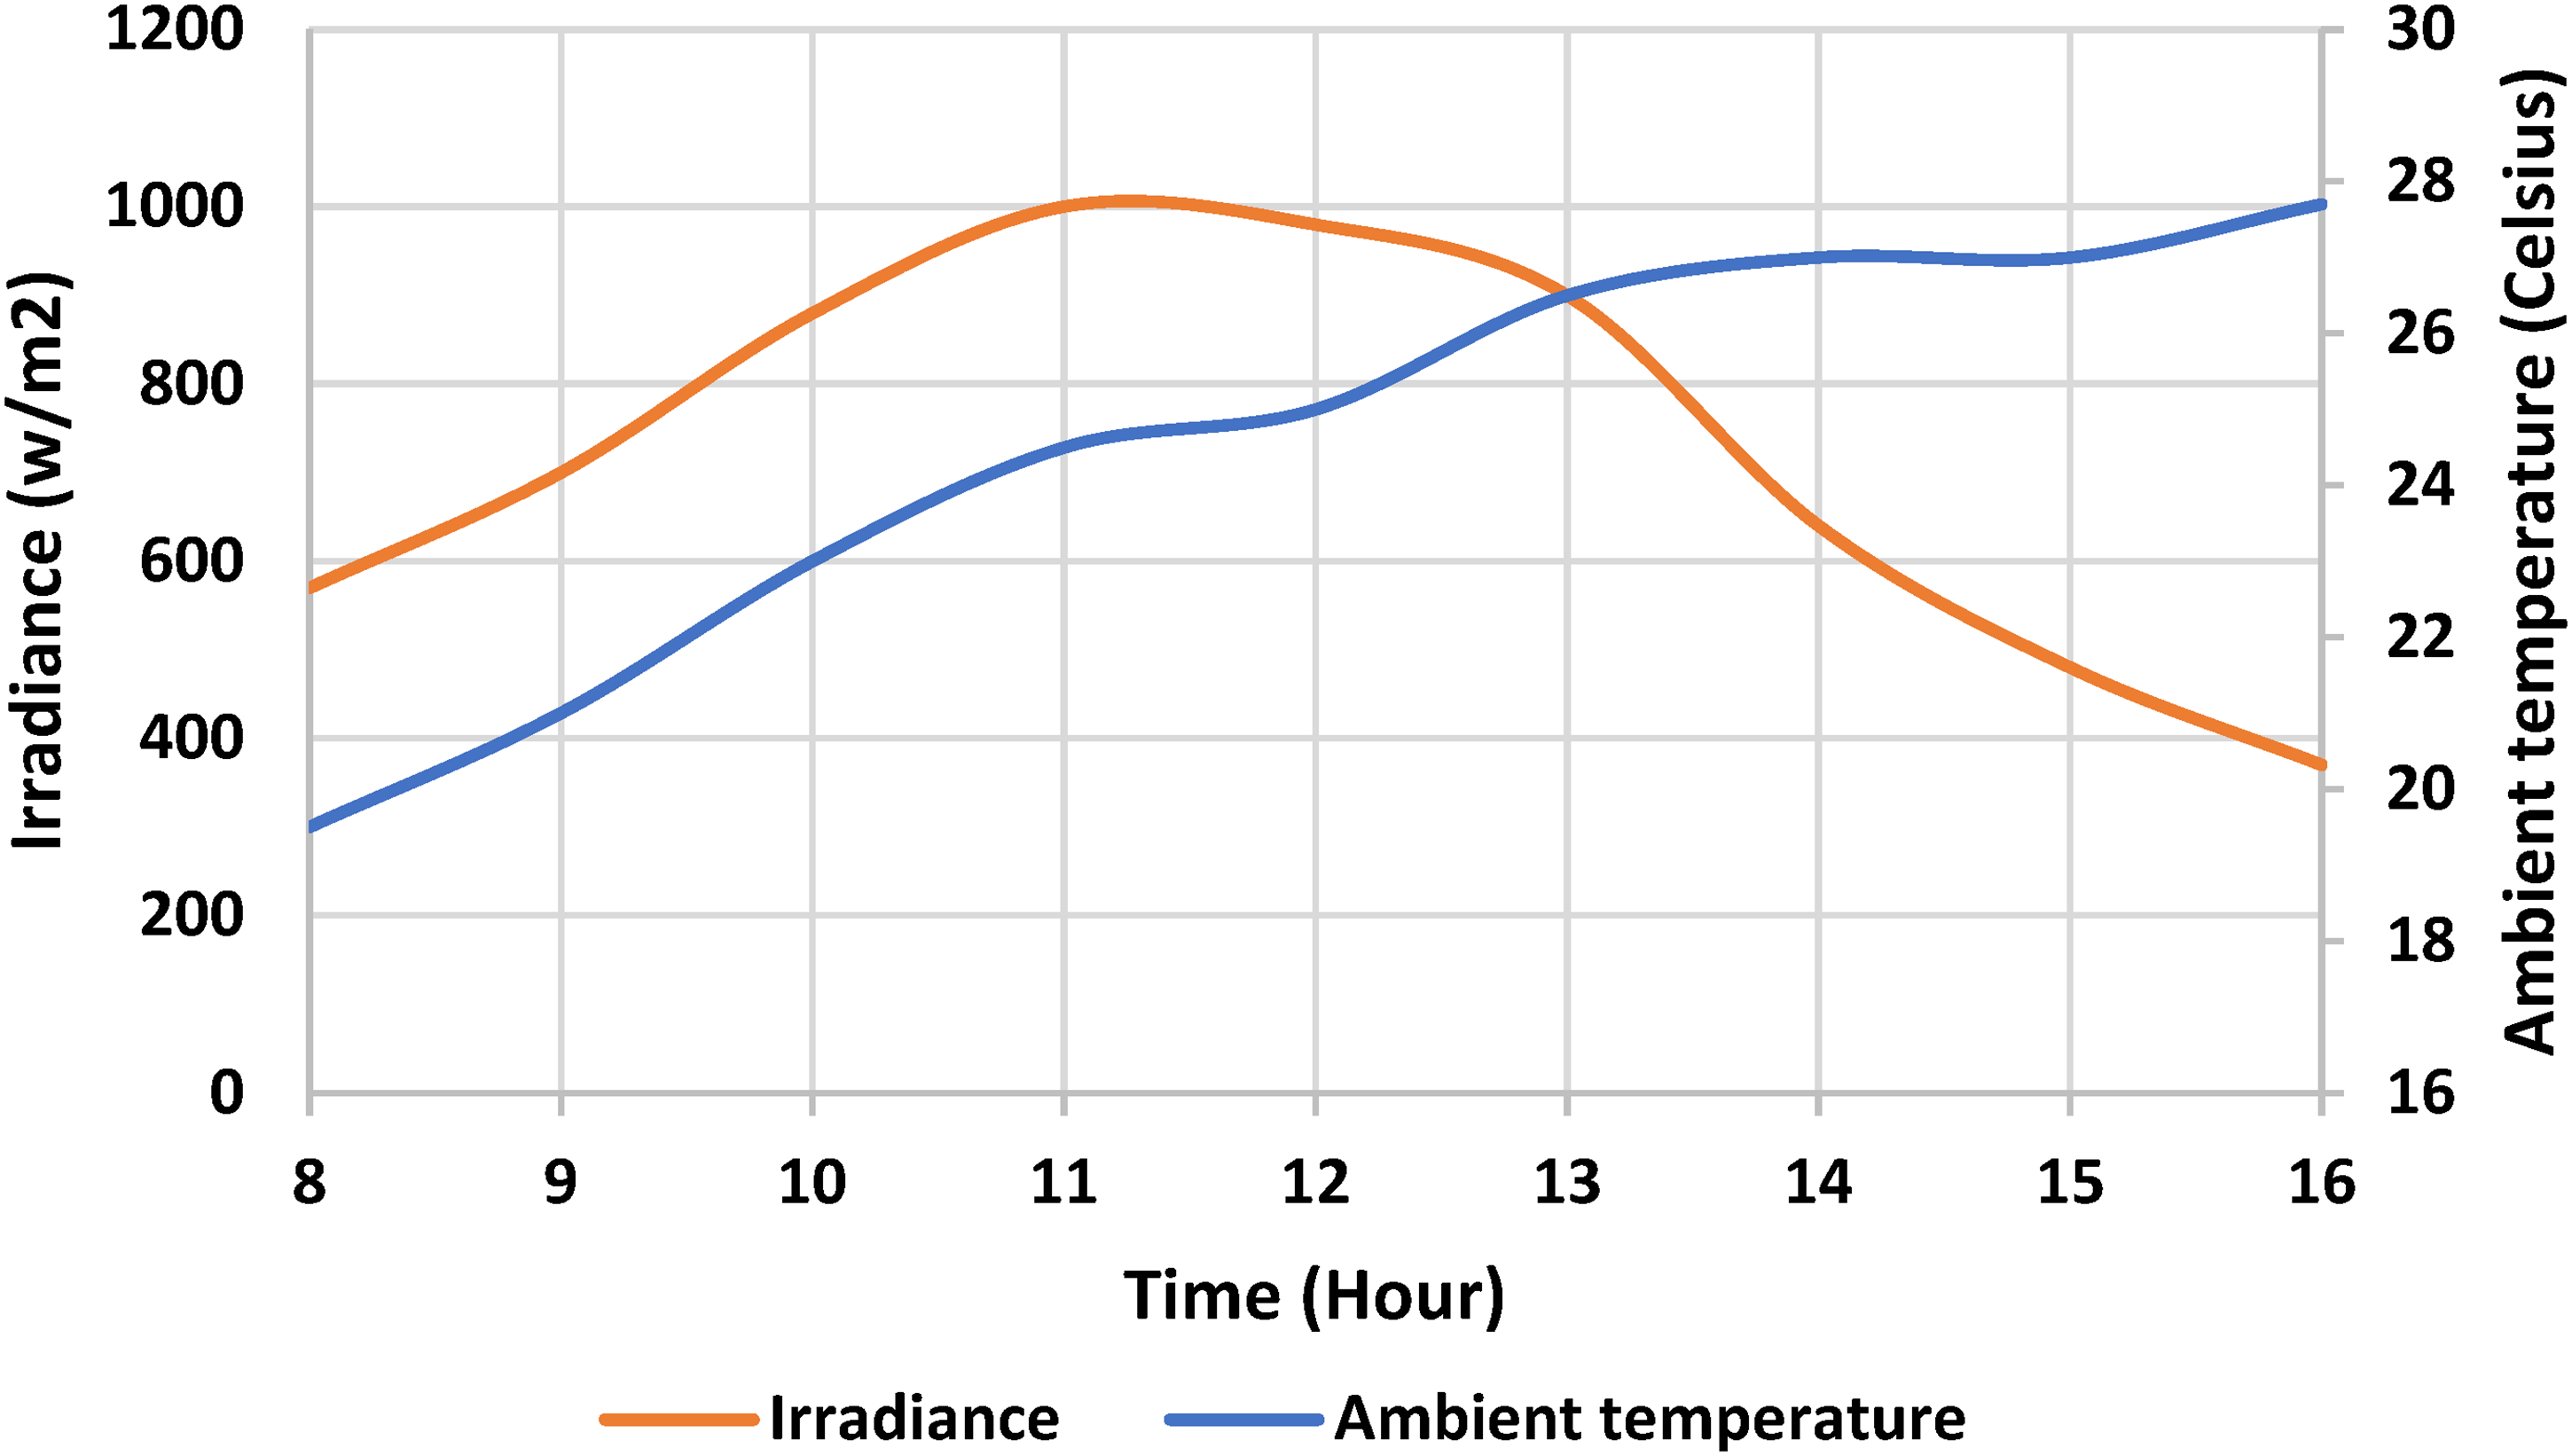
Impact of daily radiation in Yazd City, Iran.
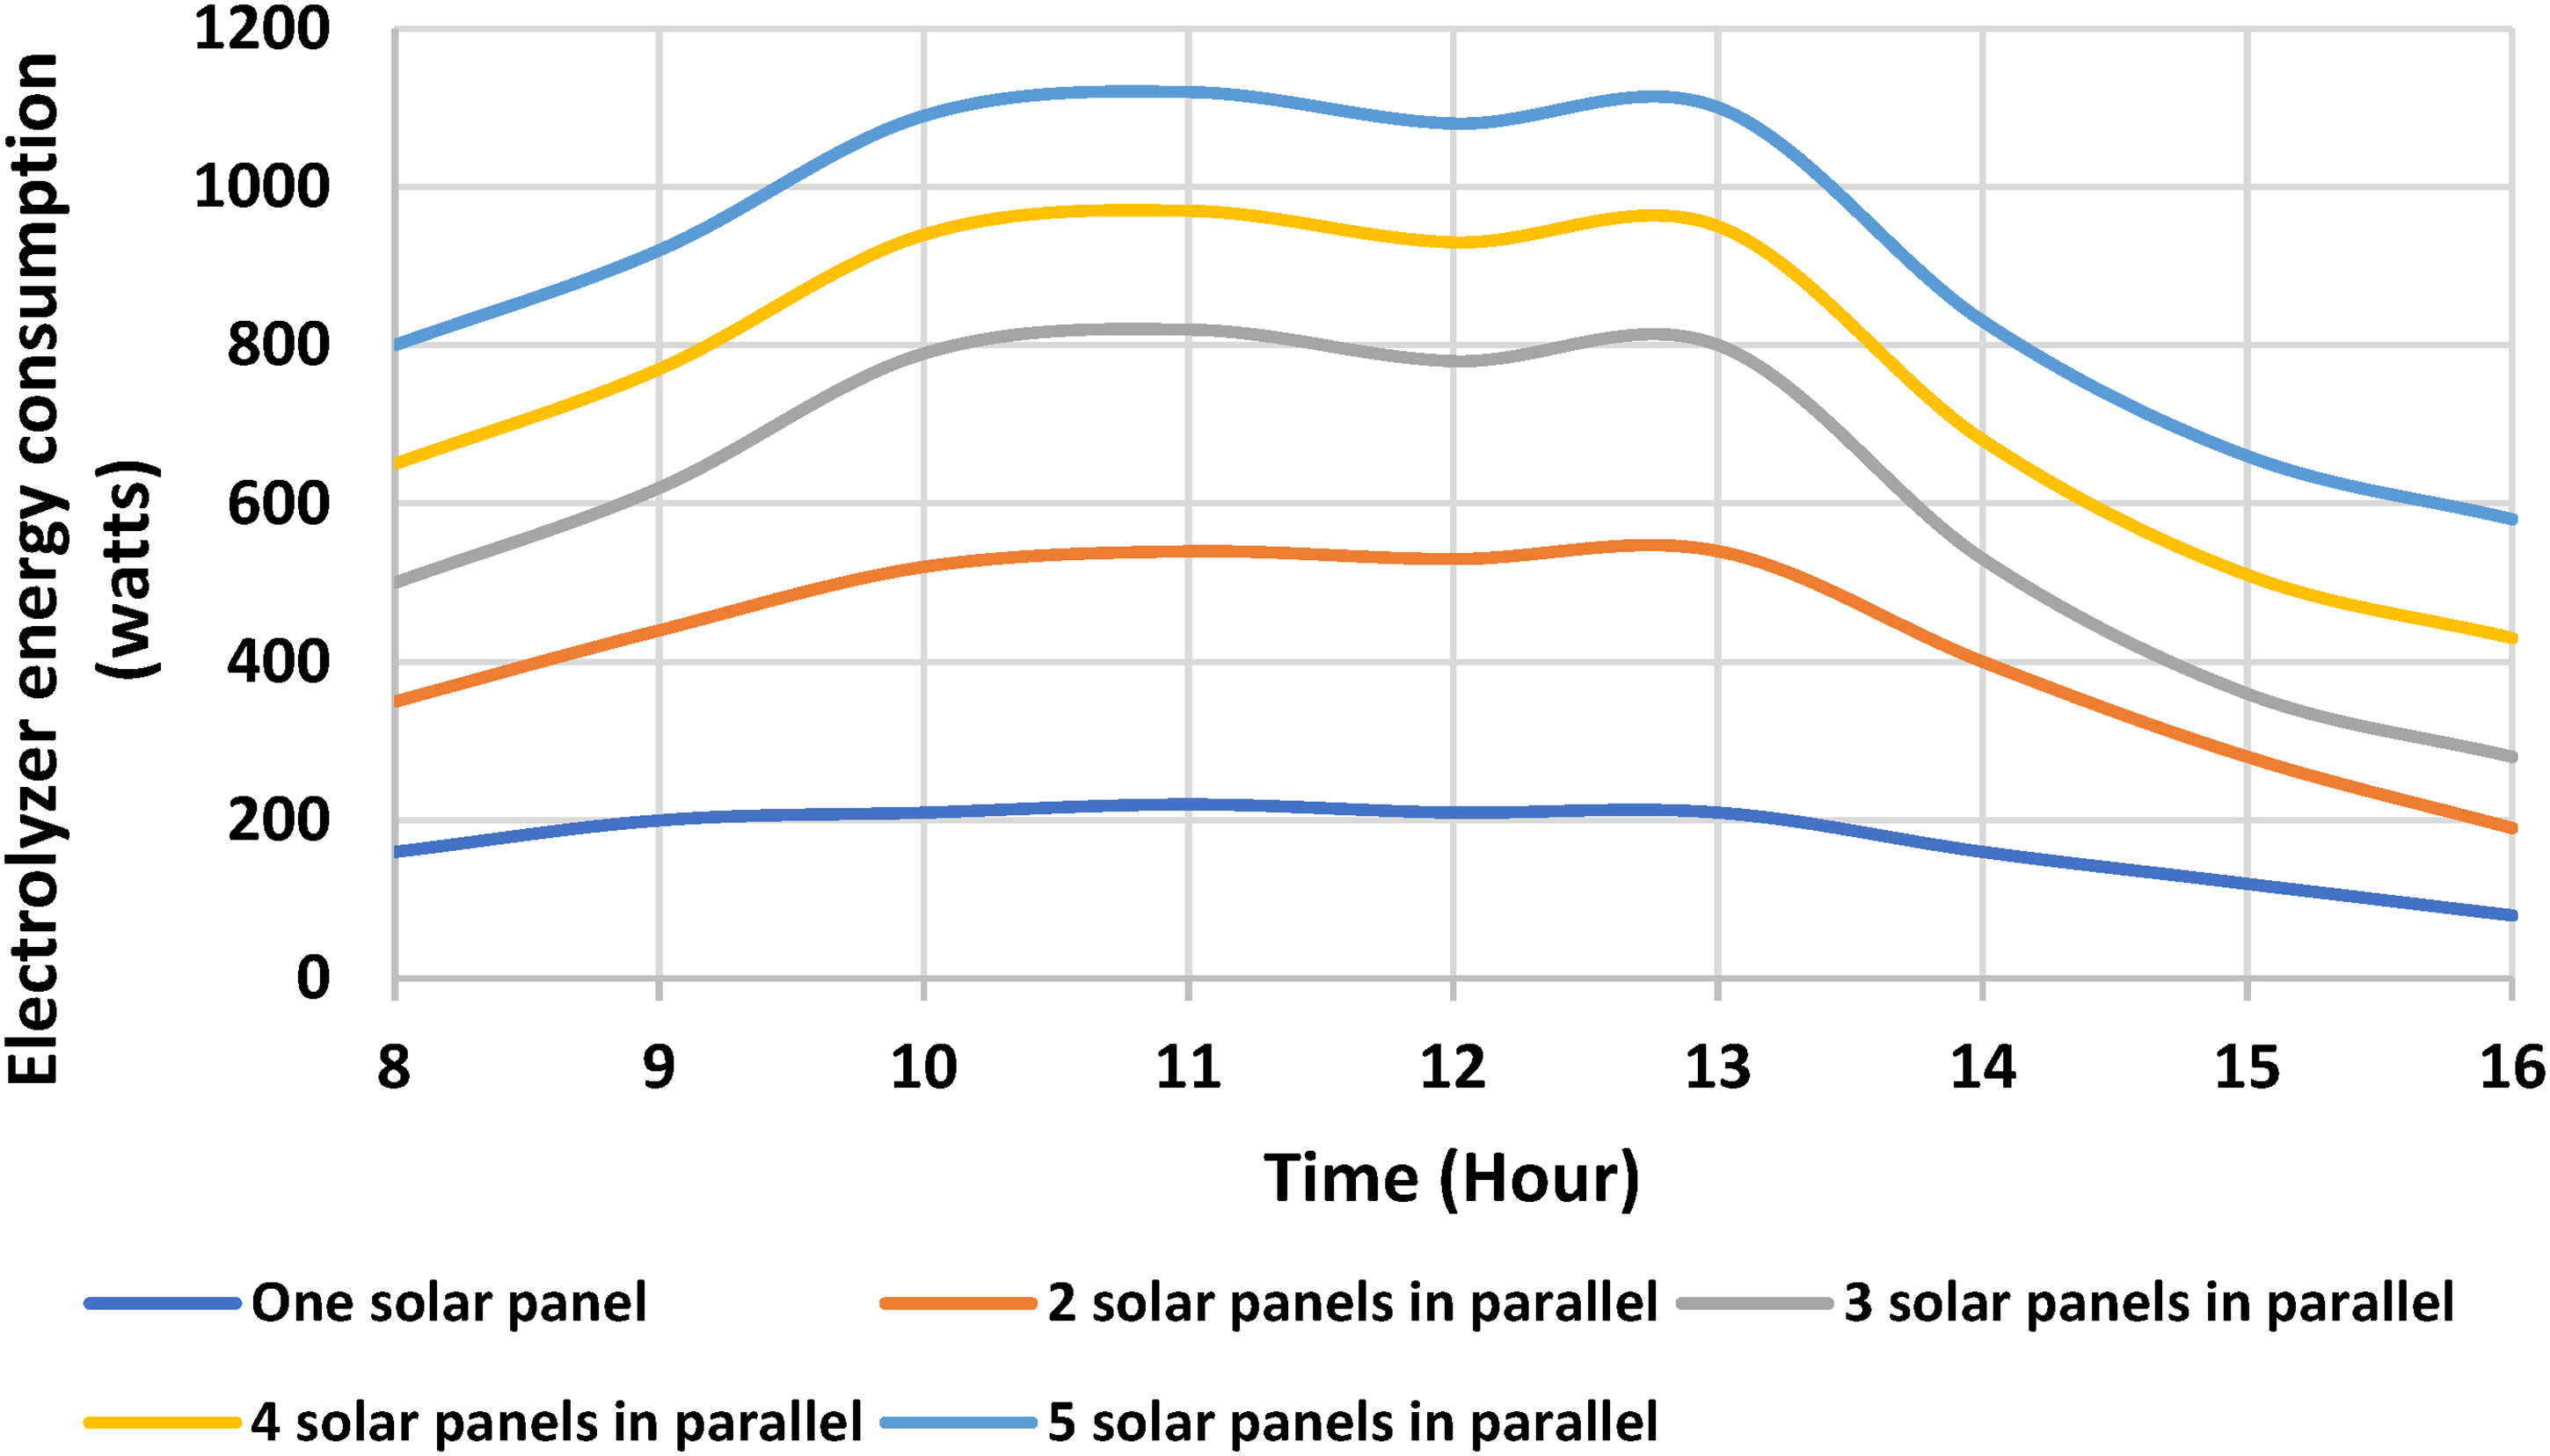
The electrolyzer's power consumption over time.
Figure 10 shows that the highest electrolyzer consumption is 1120 watts with five solar cells, 970 watts with four solar cells, 820 watts with three solar cells, 540 watts with two solar cells, and 220 watts with one solar cell. Figure 11 presents the temporal variation in hydrogen production. It is evident that as the number of cells increases, the production of hydrogen also increases.
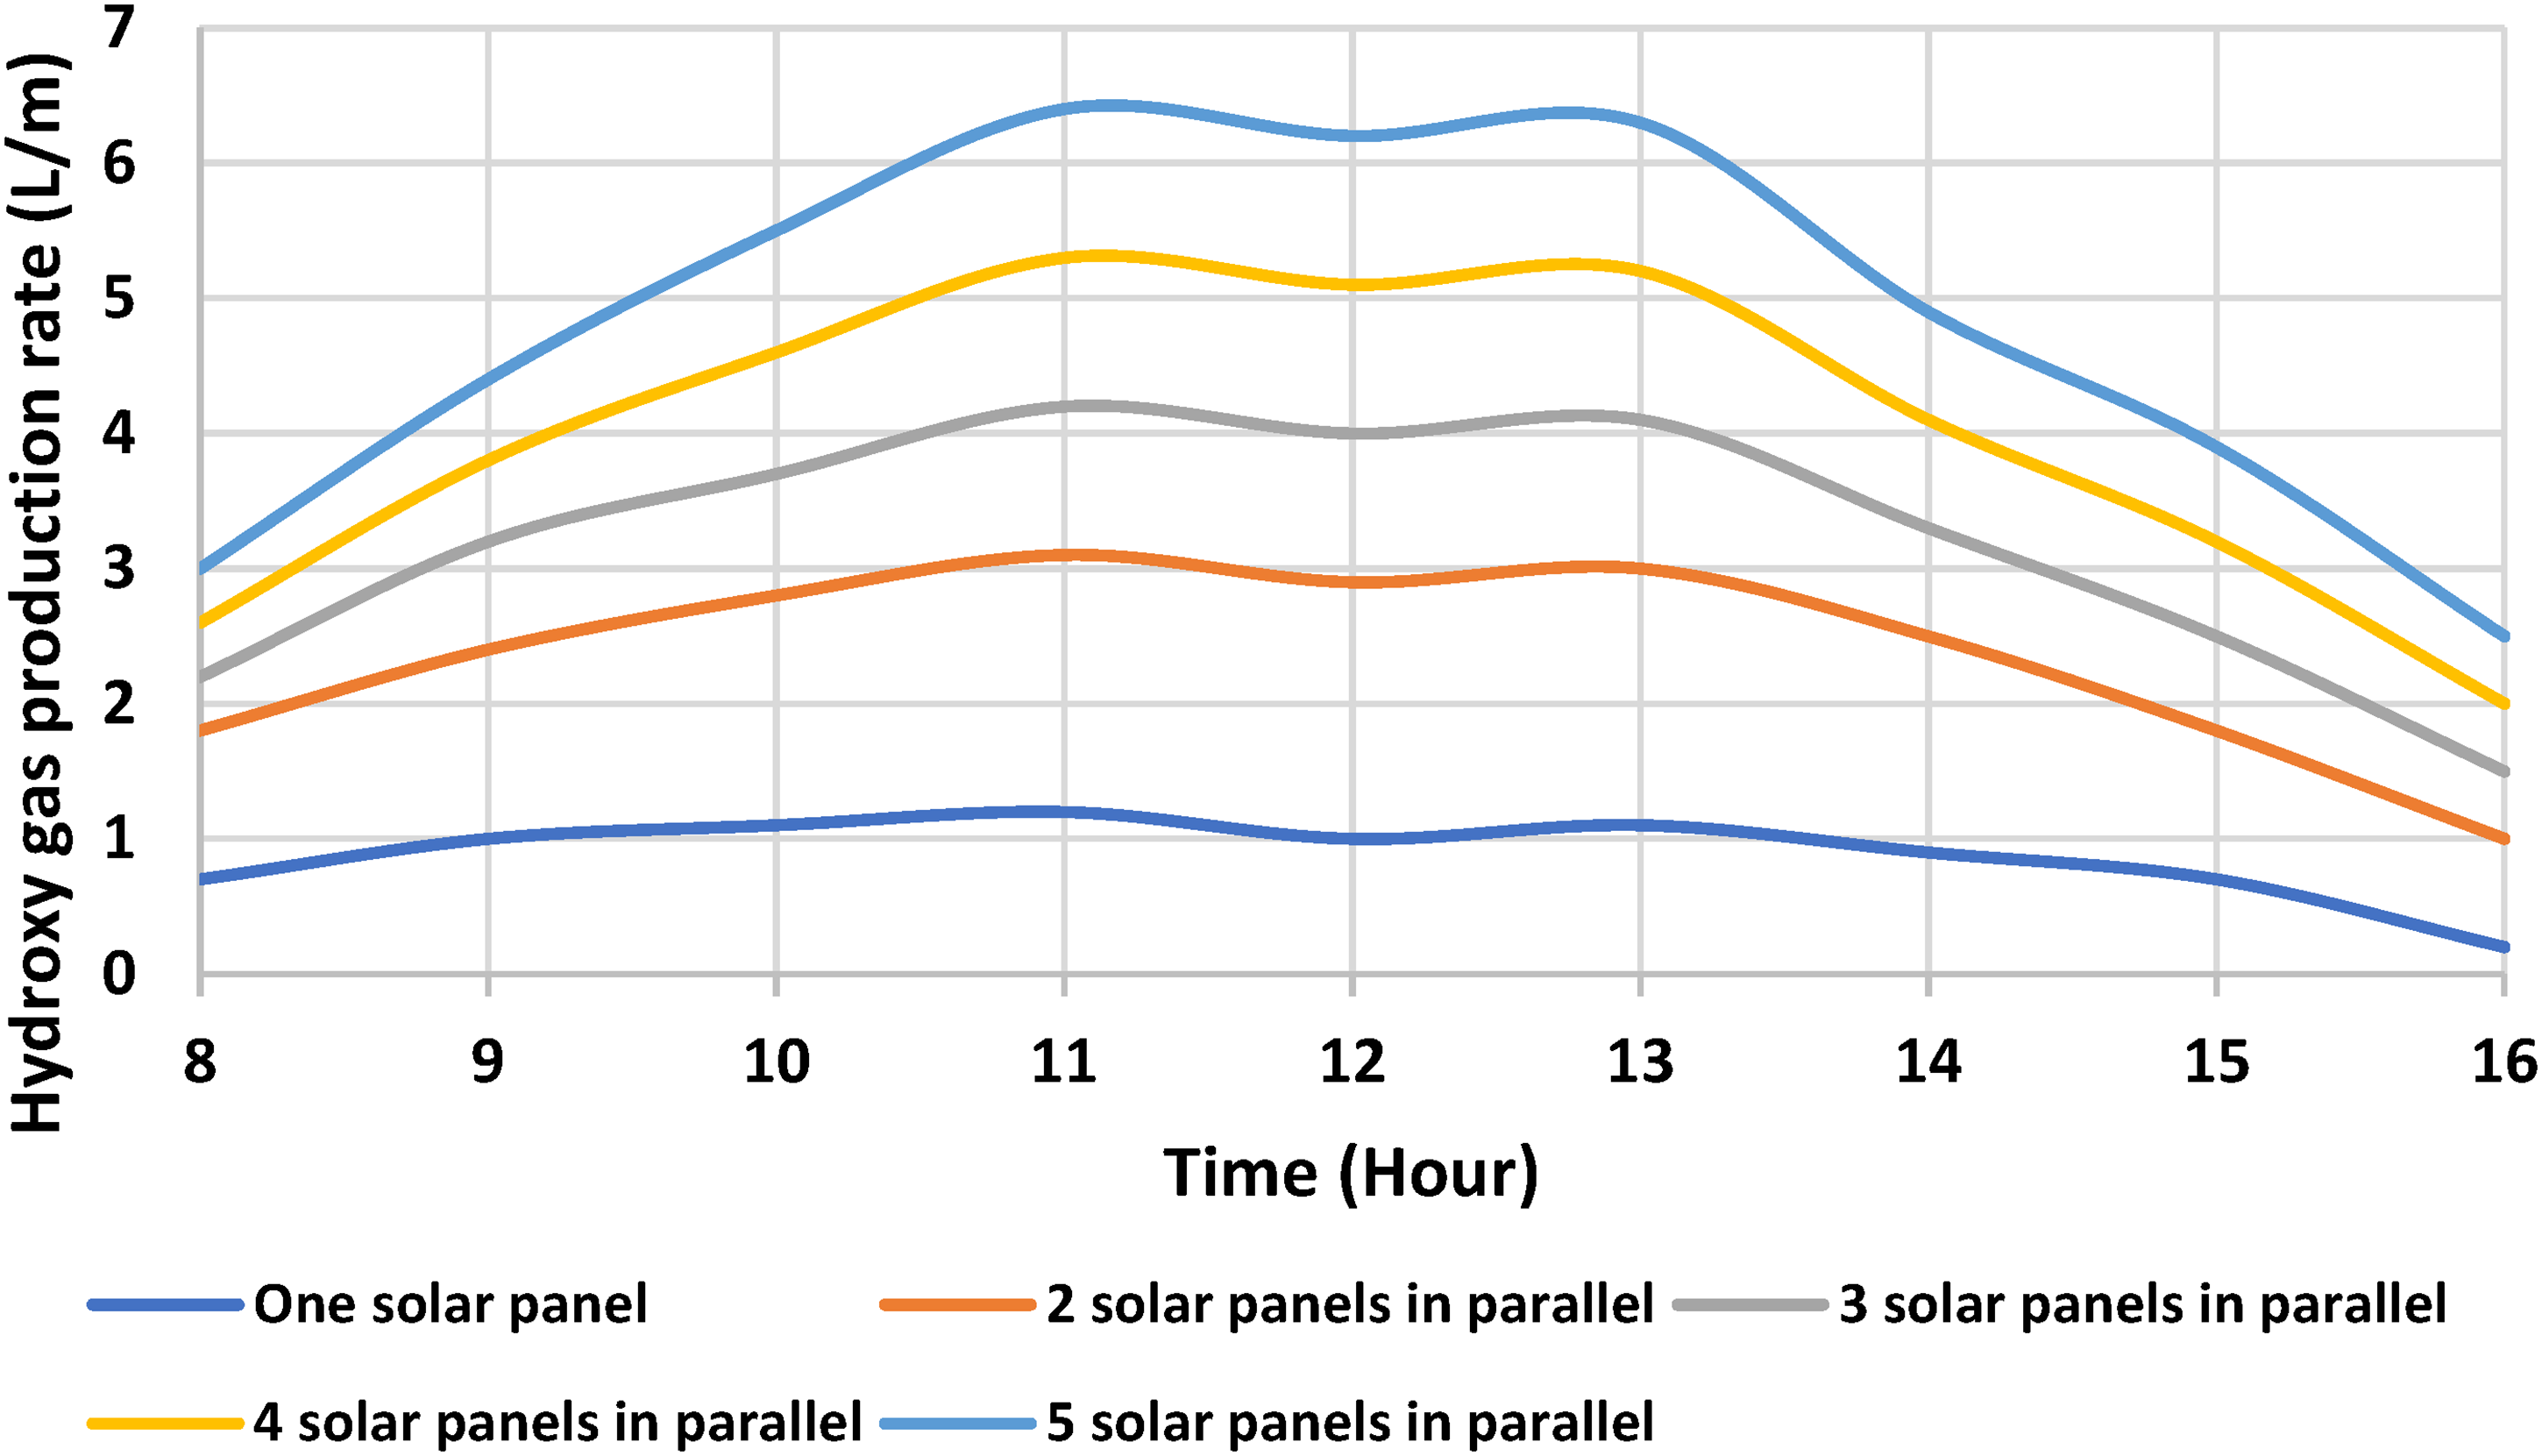
The hydrogen production over time.
To provide a clearer quantitative understanding of the effect of fluctuating solar radiation on system performance, the hydrogen production rate was evaluated at different irradiance levels throughout the daily test period. During morning hours, when solar radiation ranged between 450 and 650 W/m2 (Figure 9), the hydrogen production rate was measured at 30–45% of the corresponding midday values. As irradiance increased toward 900–1050 W/m2 at noon, hydrogen generation increased proportionally, reaching peak values of 6.4, 5.3, 4.2, 3.1, and 1.2 L/min for systems powered by five, four, three, two, and one solar cell, respectively. This proportional increase reflects the direct dependence of electrolyzer current and voltage on available PV power. Moreover, the optimal number of plates determined from constant-irradiance tests (Table 2) ensured that the electrolyzer voltage remained well-matched to the PV output throughout the day, minimizing energy losses under varying conditions. These observations confirm a strong quantitative correlation between solar irradiance, plate configuration, and hydrogen production, demonstrating that real-time irradiance fluctuations directly govern the dynamic performance of the PV-powered electrolyzer.
As can be seen from Figure 11, the highest production of hydrogen with five, four, three, two, and one solar cell is 6.4, 5.3, 4.2, 3.1, and 1.2 L/min, respectively, during peak solar radiation. In total, the production of hydrogen in the five scenarios mentioned above was 2586 L, 2154 L, 1722 L, 1278 L, and 474 L, respectively. Daily experiments were carried out using the electrolyzer equipped with the optimal plate configurations listed in Table 2. It should be noted that connecting two solar cells in parallel improves the energy-consumption intensity and overall system efficiency compared with the other configurations. Furthermore, the production of hydrogen increases with increasing power consumption.
Temperature effects on electrolyzer performance
Temperature is a critical parameter influencing the electrochemical behavior of alkaline electrolyzers, particularly under direct photovoltaic powering where current and voltage vary with real-time irradiance. During daily operation, the electrolyzer's temperature increases naturally due to ohmic heating, elevated current density at peak radiation hours, and the limited heat dissipation capacity of the multi-plate stack. This temperature rise not only alters the cell overpotentials but also affects the overall energy consumption intensity (EI).
Figure 12 presents an illustrative profile of the relationship between electrolyzer temperature and EI, demonstrating how higher operating temperatures contribute to increased specific energy consumption. As shown in Figure 12, EI exhibits a gradual increase as cell temperature rises from the morning values (25–30 °C) toward midday conditions (reaching nearly 40–45 °C). This trend is attributed to the intensification of ohmic losses within the electrolyte and across the porous 325-steel plates, resulting in higher voltage demand for sustaining the same hydrogen generation rate.
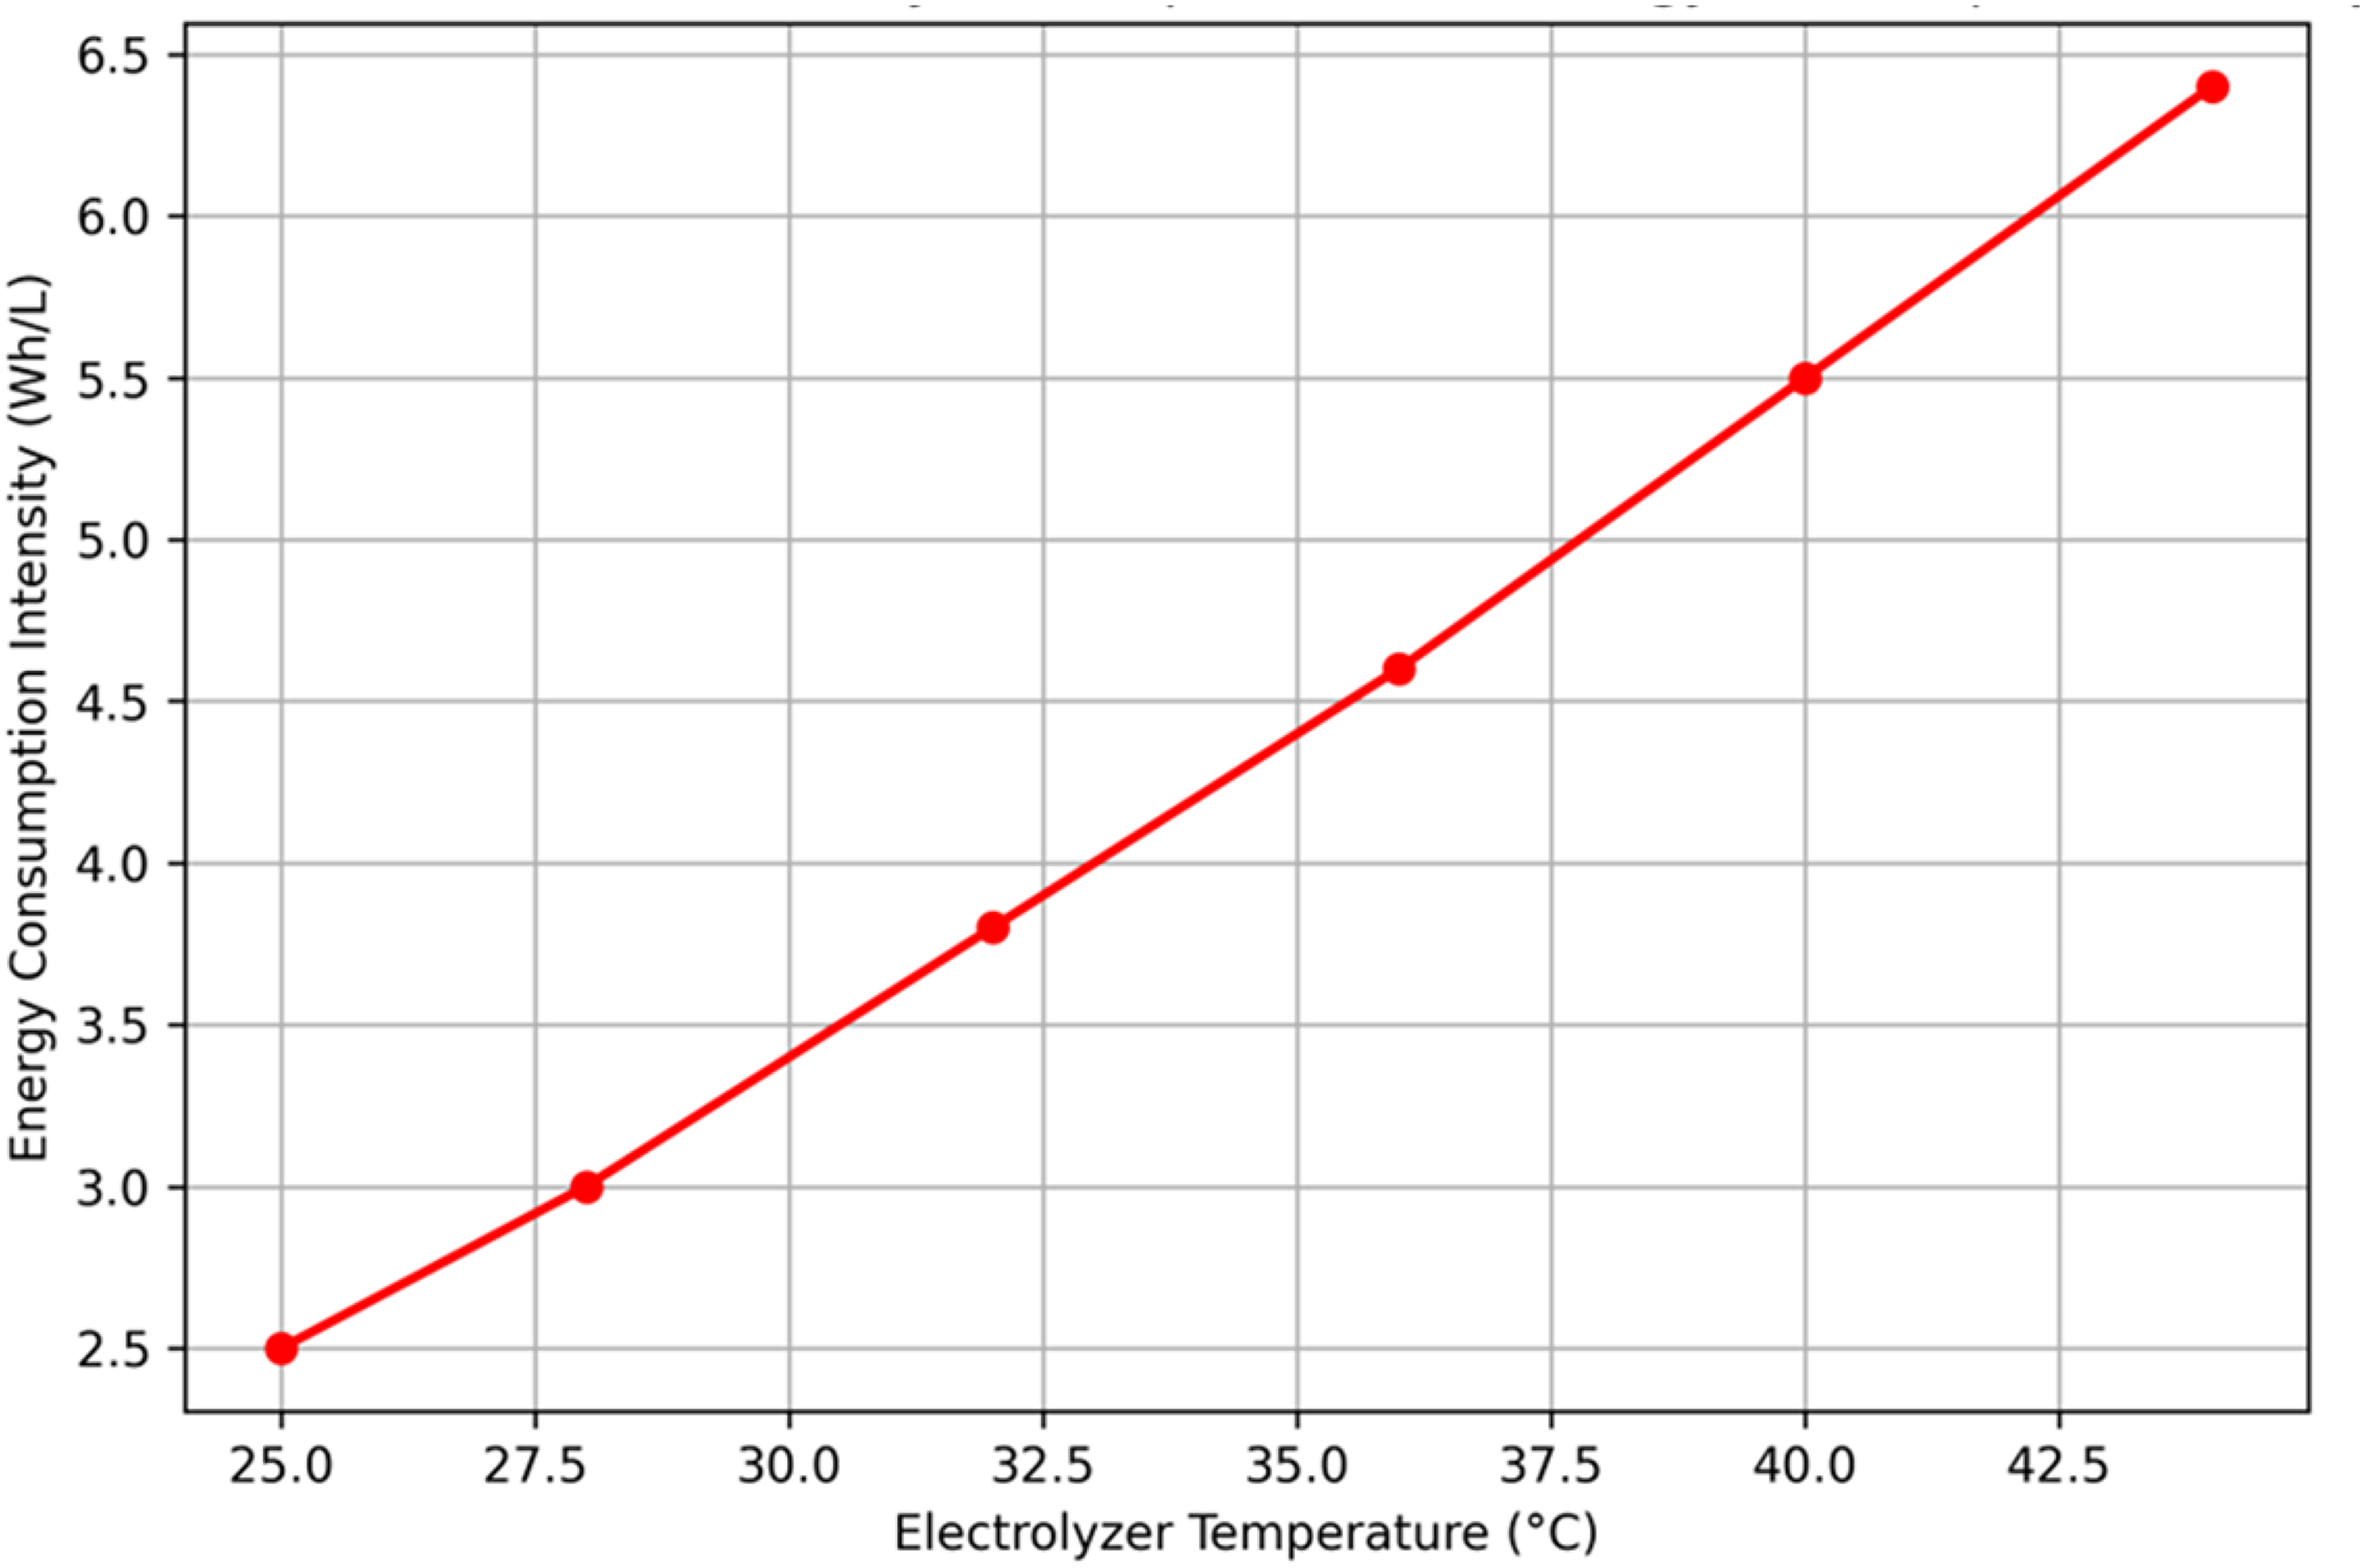
Relationship between electrolyzer temperature and energy consumption intensity (EI).
The results further indicate that, although a moderate temperature rise may enhance ionic mobility in the alkaline solution, the combined effect of increased current flow at peak irradiance and elevated internal resistance outweighs these benefits, leading to higher energy consumption per unit of hydrogen produced. These observations are consistent with the daily test outcomes, where EI of the three-cell configuration was comparatively higher due to greater thermal buildup within the stack. The findings emphasize that uncontrolled temperature rise (if not effectively managed) can undermine the performance advantages of multi-plate electrolyzers operating under strong solar input.
Long-term stability considerations
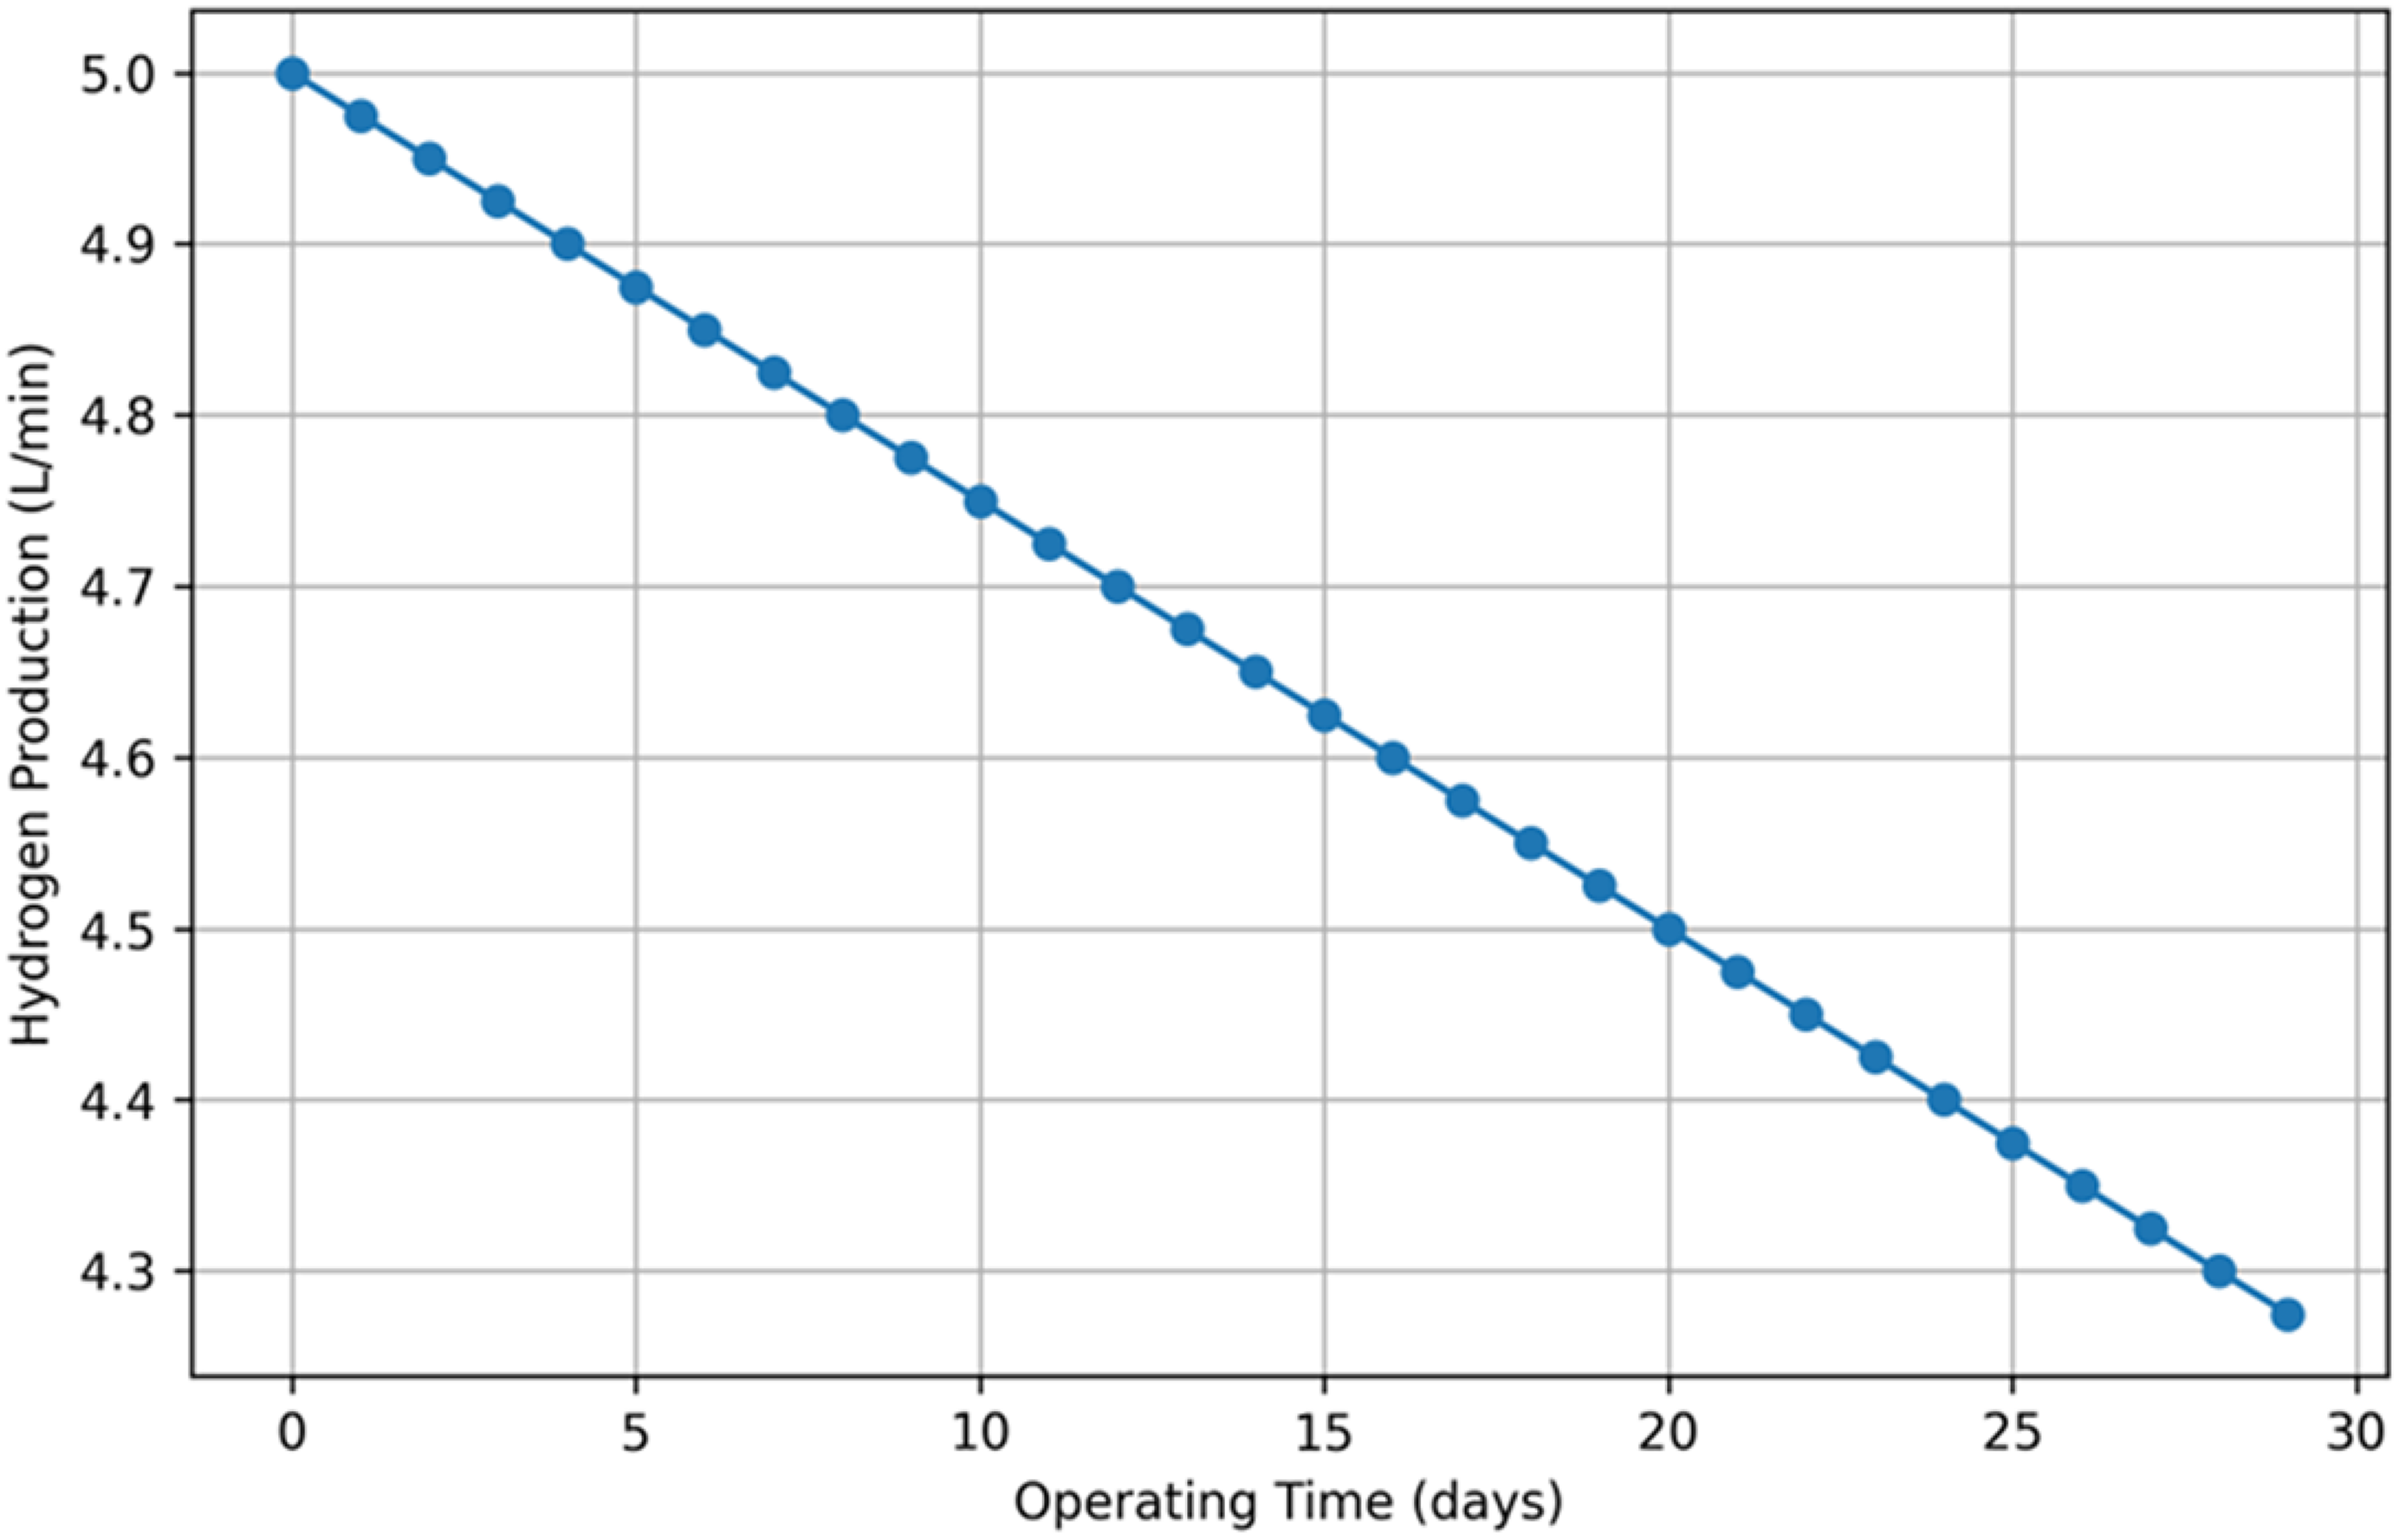
Long-term operational stability is a key factor in determining the practical reliability of solar-powered multi-cell electrolyzers. Although the primary scope of this study involved short-term experiments under real irradiance conditions, repeated daily trials provide valuable insight into the expected degradation trends. To support this discussion, an illustrative long-term stability profile is presented in Figure 13, showing the hypothetical evolution of hydrogen production rate over extended operating periods.
Long-term degradation profile of the PV-powered multi-cell electrolyzer.
As depicted in Figure 13, a gradual decline in hydrogen production can be observed as operating days increase. This trend conceptually represents the cumulative influence of thermal cycling, current fluctuations, and electrolyte evaporation on system degradation. Although the porous 325-steel plates exhibited no visible corrosion or structural damage during repeated full-day tests, the daily temperature swing between approximately 25–45 °C can incrementally increase internal resistance. This increase originates from slight oxide formation on the plate surfaces, reduced ionic conductivity due to localized electrolyte thinning, and non-uniform wetting within the plate stack. Such microscopic changes (while not critical in short-term performance) may result in measurable voltage drift and a reduction in hydrogen output during long-term operation. Furthermore, electrolyzer configurations with higher plate numbers tend to accumulate more heat during peak irradiance hours, accelerating the onset of degradation mechanisms. Similarly, sustained high currents at elevated solar radiation levels can increase overpotentials, creating additional electrical stress on the system. As suggested by the downward trend in Figure 13, these combined effects could potentially lead to a progressive decline in electrolyzer efficiency if continuous operation is maintained over several weeks.
These observations underscore the importance of developing dedicated thermal management strategies (such as forced electrolyte circulation, passive cooling surfaces, or current-limiting control algorithms) to mitigate long-term degradation. Future work will include multi-week endurance testing to quantitatively measure the rate of performance decline, evaluate resistance growth, track EI variations over time, and assess how the interactions between temperature, current density, and plate configuration influence the durability of the PV-electrolyzer system.
Conclusion
This research endeavors to explore the assessment and enhancement of a multi-cell electrolyzer designed for hydrogen production utilizing 325 stainless-steel sheets powered by monocrystalline solar cells. A potassium hydroxide concentration of seven percent was employed to increase water conductivity. The study confirmed a direct relationship between plate number, voltage consumption, and current flow, demonstrating that each plate operates within an approximate voltage range of 1.5 to 2.1 volts. Experimental tests under constant and daily solar-radiation conditions revealed that increasing the number of solar cells raises the peak power absorbed by the electrolyzer, consequently increasing hydrogen-production rates from 1.4 to 5 liters per minute. The optimal plate configurations for one to five solar cells were found to be 17, 19, 16, 14, and 15 plates, respectively. Daily hydrogen-production rates ranged from 474 to 2586 liters. The results further showed that two solar cells in parallel provided the most favorable balance between hydrogen-production rate and energy-consumption intensity. Overall system efficiency decreased at higher power levels due to elevated temperatures and higher current flow. Several practical challenges were encountered during implementation.
Fluctuating solar-radiation intensity, especially during daily tests, introduced transient variations in current and voltage that complicated stable data acquisition. Thermal rise inside the electrolyzer, particularly at higher current levels and with three or more solar panels, affected energy-consumption intensity and reduced efficiency. Matching the electrolyzer's required plate voltage with the PV module's nominal voltage demanded careful optimization; minor mismatches caused notable power losses. Measurement accuracy under varying irradiance required repeated trials and careful calibration of sensors, especially during peak solar flux conditions. Non-uniform temperature distribution within the electrolyte occasionally influenced hydrogen-production consistency. Recommendations for Future Research: To further improve the design and performance of solar-driven electrolyzer systems, several directions are suggested. Integrating advanced thermal-management systems, such as heat exchangers or controlled electrolyte circulation, to reduce temperature-induced efficiency losses. Developing real-time power-matching controllers or maximum-power-point-tracking (MPPT) strategies dedicated to electrolyzers to minimize voltage mismatch. Investigating long-term durability of the multi-plate stainless-steel stack under varying electrolyte concentrations and extended operational periods. Evaluating alternative electrode materials or surface modifications to reduce overpotential and enhance efficiency. Conducting scale-up studies to assess performance and cost-effectiveness for larger off-grid hydrogen-production systems. Incorporating hybrid energy-storage options (batteries or supercapacitors) to stabilize electrolyzer input during transient solar conditions.
The practical outcome of this study is the development of an experimentally validated framework that can be directly used to design off-grid, low-cost hydrogen-production units for real applications. By identifying the optimal number of electrolyzer plates for each PV configuration, engineers can accurately match the electrolyzer voltage with the PV output, thereby minimizing energy losses and improving system efficiency. The quantified hydrogen-production rates (ranging from 474 to 2586 L per day under real solar conditions) demonstrate the feasibility of deploying this system in remote areas, agricultural sites, small industrial workshops, and research laboratories as an independent hydrogen source. Moreover, the identification of the most energy-efficient configuration (two PV modules in parallel) provides a practical guideline for reducing operational costs. These insights can support the development of decentralized green-hydrogen units for fuel-cell charging, thermal applications, and energy-storage systems in regions with abundant solar radiation.
Footnotes
Acknowledgements
The research is funded by Zarqa University.
Funding
The authors received no financial support for the research, authorship, and/or publication of this article.
Declaration of conflicting interests
The authors declared no potential conflicts of interest with respect to the research, authorship, and/or publication of this article.
Data availability statement
All data used to support the findings of this study are included within the study.