
Abstract
Solar photovoltaic technology is one of the renewable technologies, which has a potential to shape a clean, reliable, scalable and affordable electricity system for the future. This article provides a comprehensive review of solar photovoltaic technology in terms of photovoltaic materials efficiency and globally leading countries. Based on past years review and photovoltaic installations in the year 2014, the major five leading countries identified are China, Japan, USA, Germany and UK. These five countries altogether accounted for 80% of photovoltaic installations in 2014. The article also discusses the driving policies, funding and Research and Development activities: to gauge the reasons behind the success of the leading countries. Finally, this article reviews the photovoltaic cost analysis in terms of the photovoltaic module cost, balance of system cost and project cost with the help of listed 98 globally installed projects.
Keywords
Introduction
Electricity systems worldwide are changing. Global demand for, and dependence on electricity is increasing and, as environmental concerns become more pressing, so does the focus on the reduction of greenhouse gas emissions (Energy World, 2015). This is resulting in a move towards a decarbonised electricity system based on a large volume of variable renewables generation, predominantly delivered by wind and solar photovoltaic (PV). Solar PV technology is one of the renewable technologies which have a potential to shape a clean, reliable, scalable and affordable electricity system for the future (Tyagi et al., 2013). Considering this fact, all over the world governments are encouraging the development and deployment of solar PV technology. A wide range of PV materials are available worldwide. Globally, there are hundreds of companies involved in the manufacturing of PV modules with varying efficiencies and limitations. At the same time, installation costs differ from system to system and from project to project. The objective of this article is to review the most recently published information about solar PVs in terms of materials and module efficiency, the global PV status and the driving policies, research and development (R&D) activities and funding sources as well as the potential of electricity generation.
List of companies based on relevant countries and their reference numbers.

This paper then leads on to provide a review on global PV status where five leading countries are reported, i.e. China, USA, Japan, Germany and UK. The ‘Leading PV countries worldwide’ section analyses the success and deployment of PV of these leading countries, their PV-related driving policies, R&D activities, funding and electricity generation by PV. The aim of this section is to identify the reasons behind being leading countries in terms of PV systems and the lessons that can be learnt from them. Later on, to analyse the economic aspect, i.e. installation cost (£/W) of PV projects, the ‘PV cost analysis’ section takes into account 98 PV projects installed worldwide. This knowledge deems to be of assistance to investors in gauging the amount of investment that is needed in PV projects, i.e. based on the size of the project. The total investment, however, may vary significantly among countries, as there are several factors that influence the installation cost (see ‘PV cost analysis’ section). Lastly, the article draws conclusions of the entire article with some general recommendations on PV policies, which can be implemented to all the countries to improve their own PV policies. The flow chart in Figure 1 summarises the framework of the article.
Major framework of article.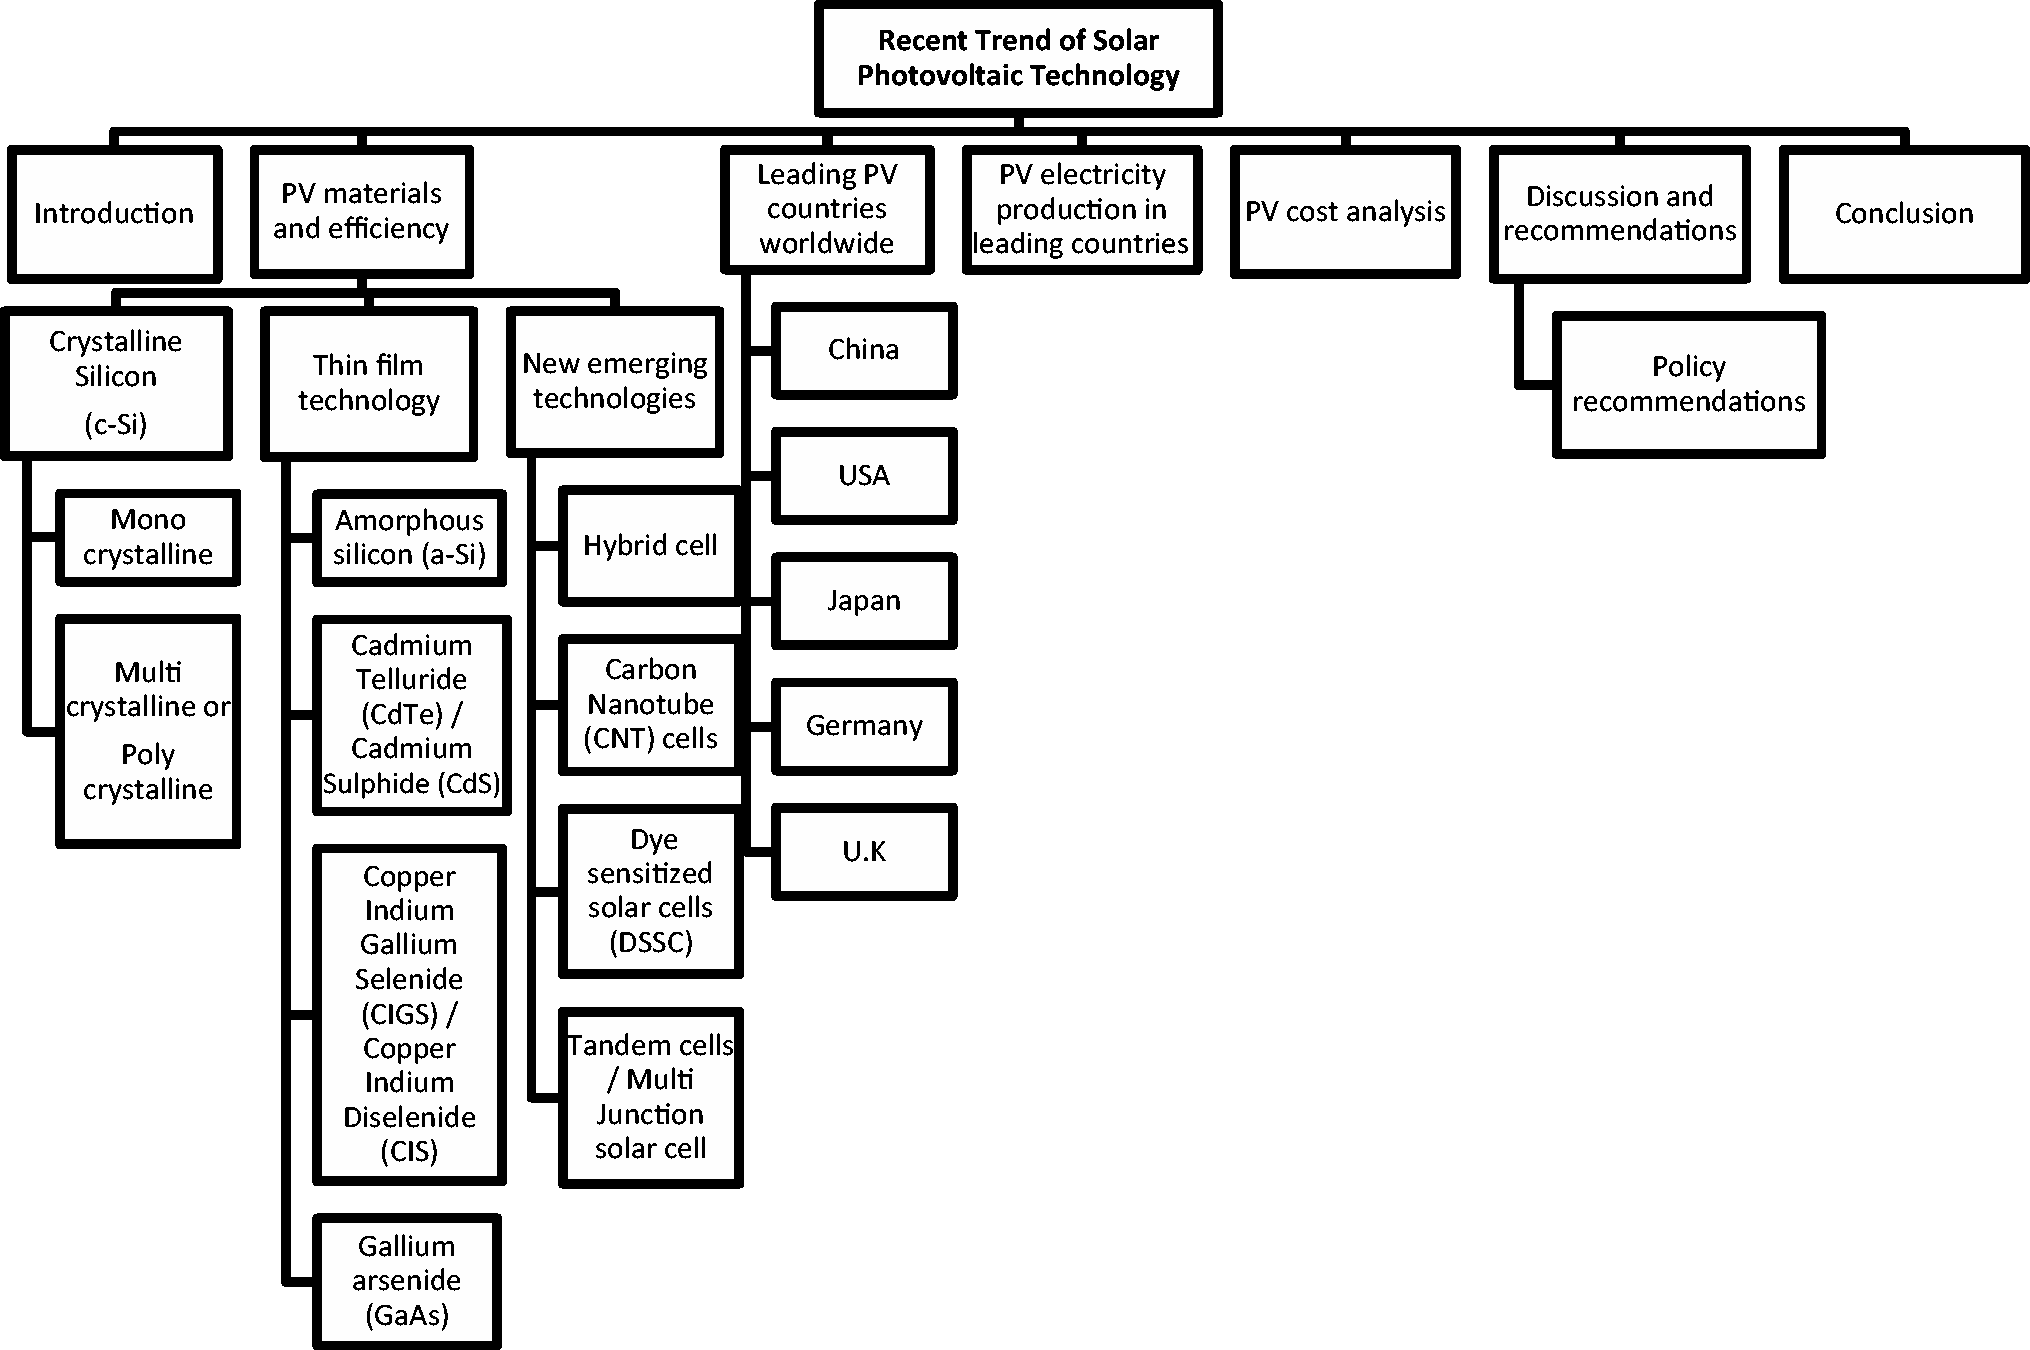
PV materials and efficiency
JRC Science and Policy Report (Jäger-Waldau, 2014) identified the 20 largest PV dealing companies worldwide and have provided a short description of them in terms of actual production, shipments, etc. The report also states that globally there are more than 350 companies involved in manufacturing of PV cells (Jäger-Waldau, 2014). However, it does not give a complete list of all the companies. Hence, on the basis of internet search, i.e. availability, Table 1 is prepared with 143 such companies and is arranged in alphabetical order of countries. The purpose of Table 1 is to provide the reader at a glance about number of companies identified in each country. It can be noticed from the table that China has the highest number of companies (43 companies), followed by Germany (21 companies), USA (19 companies) and Taiwan (15 companies). Other countries like India, Italy, Japan, Spain and UK are in the range of three to seven companies each. Remaining countries such as Australia, Austria, Belgium, Brazil, Canada, Croatia, Cyprus, Finland, France, Hong Kong, Korea, Malaysia, Netherland, Portugal, Russia, Slovenia, South Africa, Sweden, Switzerland, Thailand are in the range of one to two companies each. For ease of referencing herein (mainly in ‘PV materials and efficiency’ section), a reference number is assigned to each company based on its country's initials. For example, first company of Australia is E-solar which is referenced as AU1 where AU is based on the country name and number 1 indicates the company number in numerical order. Similarly, the 19th company for the USA in the table is referenced as US19. The reason of assigning each company an individual reference number is to ensure ease of reading and identification later on in the article.
Please note that Table 1 is solely produced on the basis of data availability via internet research and it does not take into account the factors like popularity, production capacity, success, etc. of the companies and also such factors are not the aim of this article. The Reference (Dropbox, 2015) provides an individual list of references (websites) of all 143 companies, which is uploaded on dropbox. The reason of preparing an individual list is for ease of reader and to avoid too many websites in the references section.
The PV industry is long value chain, which starts from raw materials to manufactured modules and reaches till maintenance of installed projects. The brief overview of different materials efficiencies is described in the ‘PV materials and efficiency’ section.
Crystalline silicon (c-Si)
According to Bruton (2002), silicon is one of the most dominating materials in solar PV technology. The first generation PV modules were manufactured from crystalline structure of silicon. However, this technology is not obsolete but it is constantly under R&D phase. After the invention of bipolar transistor in 1948, a semiconductor era was evolved, in which there was a rapid progression on silicon solar cell, which raised the efficiency up to 15%. Thereafter in second stage in 1970, due to achievements of microelectronic technology, silicon solar cell efficiency reached to 17%, and after that in 1980s and 2000+, the cell efficiency has almost reached to 25% (Green et al., 2001). The University of New South Wales, demonstrated the efficiency of 24.7% of silicon solar cells from Passivated Emitter, Rear Locally (PERL) on Flat Zone (FZ) silicon substrate and another 24.5% efficiency based on Passivated Emitter, Rear Totally (PERT) diffused silicon solar cells fabricated on Magnetically Confined Czochralski (MCZ) substrates (Zhao et al., 2011). Goetzberger and Hebling (2000) reviewed the history of PV materials and tried to look at possible future scenarios with silicon as main concern.
On broad classification, monocrystalline and multi-crystalline are two basic forms of crystalline technology. As compared to all other types of solar PV technology, crystalline silicon technology has the highest commercial efficiency.
The PV module manufacturing market has globally evolved. Crystalline silicon is the traditional cell material for solar modules and has maintained at least 80% of market share of worldwide production of PV modules. To date, crystalline silicon has achieved highest module efficiency under Standard Test Conditions. In addition, crystalline silicones have most highly developed manufacturing process (Key and Peterson, 2009).
Monocrystalline
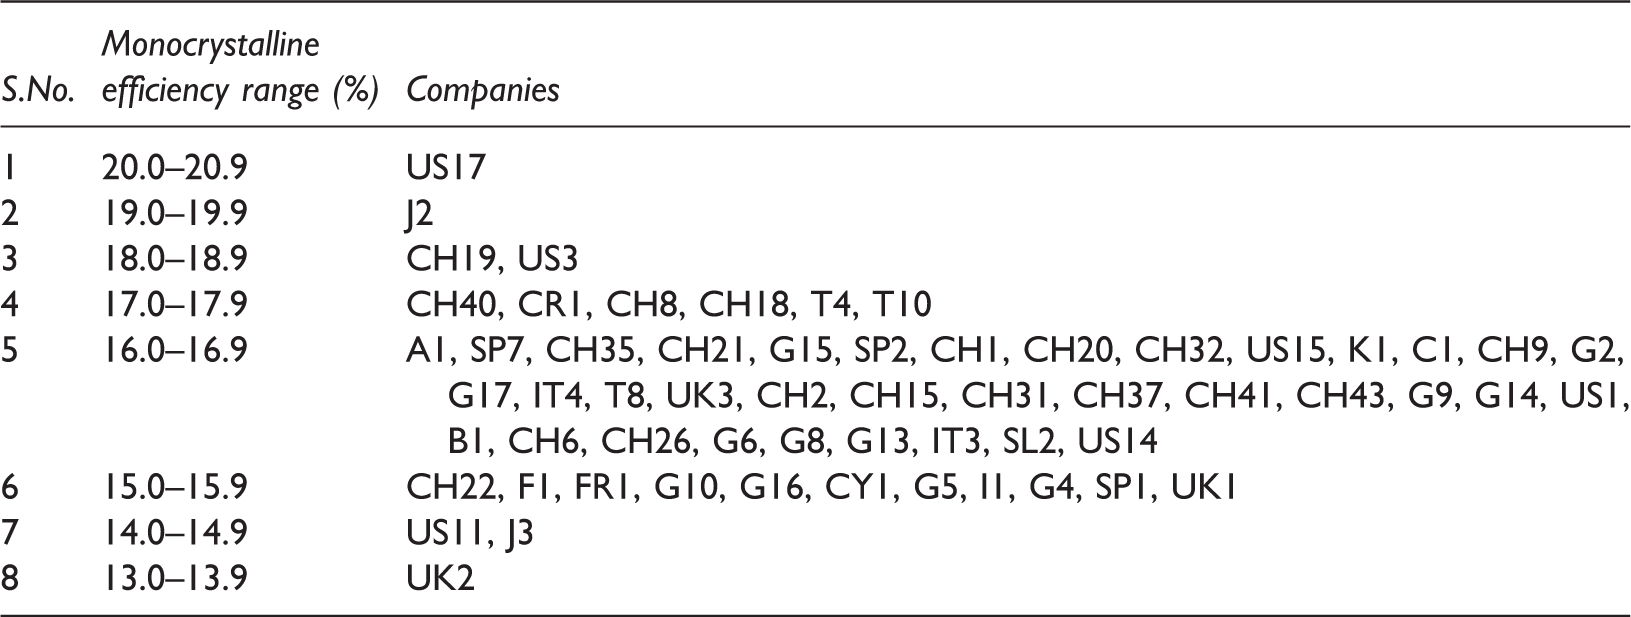
Monocrystalline material is widely used because of its high efficiency level as compared to multi-crystalline. Zhao et al. (1998) reported the honeycomb textured monocrystalline solar cells, with an efficiency of 24.4%. However, it is essential to note that module efficiency is always lower than the cell efficiency.
Efficiency of monocrystalline PV modules.
Multi-crystalline or poly crystalline
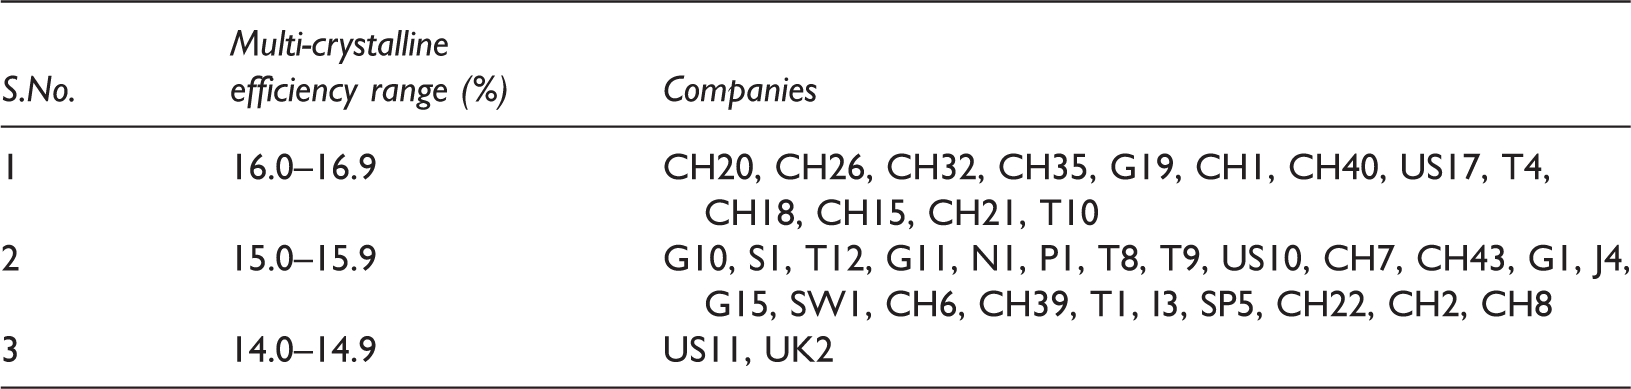
Zhao et al. (1998) reported the honeycomb textured solar cells, with an efficiency of 19.8% for multi-crystalline. Multi-crystalline solar modules are cheaper to manufacture, they are preferred more in market. However, they are less efficient as compared to monocrystalline solar modules.
Efficiency of multi-crystalline PV modules.
Thin film technology
Thin film is an alternative technology, which uses less or no silicon in the manufacturing process. The more in depth review of amorphous and crystalline thin film silicon solar cell is done by Roedern (2003) and in the initial phases of development of thin film solar cells, 10.7% efficiency was demonstrated by Yamamoto et al. (2001).
Amorphous silicon (a-Si)
Amorphous silicon is the most commonly developed and a non-crystalline allotropic form of silicon. It is most popular among thin film technology but it is prone to degradation. Some of the varieties of a-Si are amorphous silicon carbide (a-SiC), amorphous silicon germanium (a-SiGe), microcrystalline silicon (μ-Si) and amorphous silicon-nitride (a-SiN) (Parida et al., 2011).
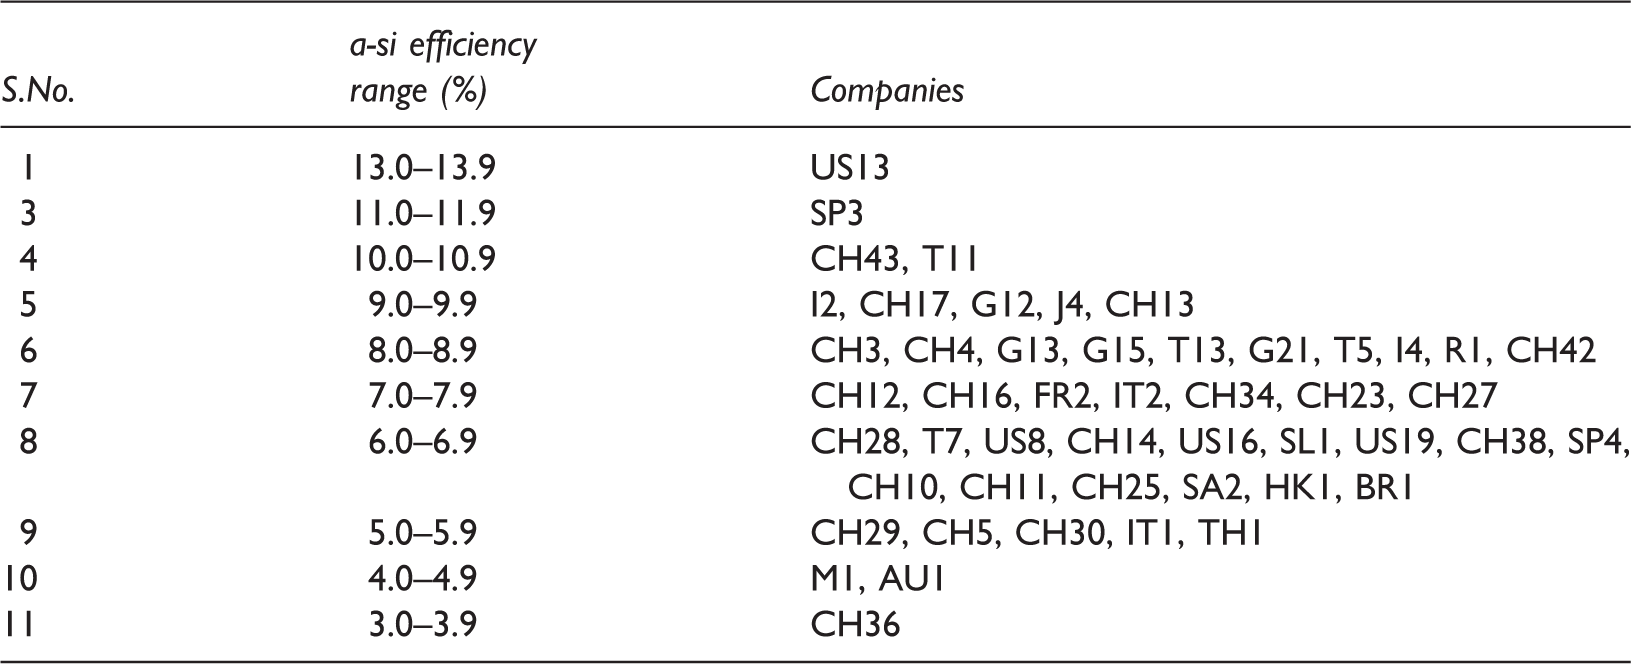
Due to random structure, a-Si has a high band gap of 1.7 eV (Boutchich et al., 2012) and hence, compared to monocrystalline silicon, it has 40 times higher rate of light absorptivity (Mah, 1998). It also holds the first position in current market amongst all thin film materials. The first amorphous thin film solar cell of ∼1 µm thick was reported with an efficiency of 2.4% by Carlson and Wronski (1976). In addition, further improvements and potential of thin film solar cell is detailed by Rech and Wagner (1999).
Efficiency of a-Si PV modules.
Cadmium telluride (CdTe)/cadmium sulphide (CdS)
Cadmium telluride solar cells are formed from cadmium and tellurium. Because of its ideal band gap of 1.45 eV, and longer stability (Boer, 2011), it is one of the promising materials in thin film technology. There are several remarkable results reported by Compaan (2004), Schock and Pfisterer (2011), Razykov et al. (2004) and an efficiency of 10.6% and 11.2% was obtained on thin film 0.55- and 1-µm-thick CdTe by Nowshad et al. (2001). In addition, CdTe on plastic foil with an efficiency of 11.4% is reported by Upadhayaya et al. (2007). In general, 15% to 16% cell efficiency has been obtained by Britt and Ferekides (1993), Aramoto et al. (1997) and Wu et al. (2001). In July 2011, First Solar (2011) company sets the world record of 17.3% cell efficiency, which was confirmed by NREL.
Copper indium gallium selenide (CIGS)/copper indium (Di) selenide (CIS)
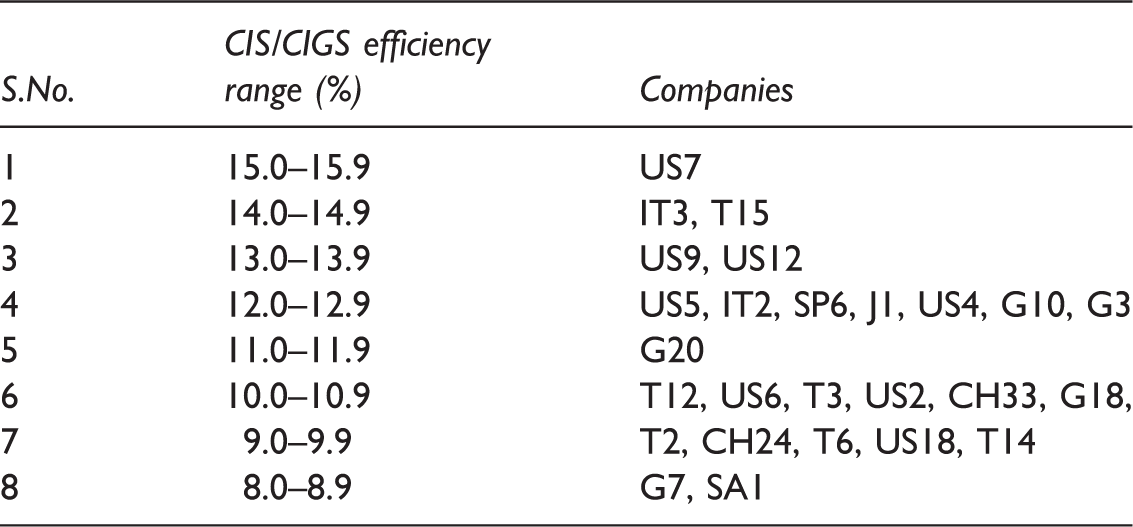
Copper indium gallium selenide is the advanced researched material, in which gallium is added to copper indium (Di) selenide (Schock and Shah, 1997). Until 2006, the best efficiency of CIGS cells was 20% (Repins et al., 2008) and about 13% for modules (Powalla, 2006). In December 2013, Siva Power has reported highest cell efficiency of 18.8%, which was confirmed by NREL (Osborne, 2014).
Table 5 lists 26 companies that manufacture CIGS/CIS modules. It is noted from Tables 2 to 4 that monocrystalline, multi-crystalline and a-Si has half of the companies are from USA and Germany, i.e. rather than China and Germany. In addition, it can be seen that most of the companies in table deal within a range of 9.0% to 12.9% module efficiency. Though, the commercial maximum efficiency of CIGS/CIS modules is 15.0%, manufactured by Mia Solé (US7) in USA. As compared to maximum efficiency of monocrystalline and multi-crystalline modules, CIGS/CIS modules lag by 5.4% and 1.9%. Though as compared to a-Si module, CIGS/CIS modules leads by 1.2%. Hence, it can be said that both a-Si and CIGS/CIS modules needs to have significant R&D to compete with mono- and multi-crystalline modules.
Gallium arsenide
Gallium arsenide (GaAs) is a compound semiconductor form of Gallium (Ga) and Arsenide (As). It has a similar structure like silicon cells with high efficiency and less thickness. In addition, it is lighter as compared to monocrystalline and multi-crystalline silicon cells (Iles, 2001). Its energy band gap is 1.43 eV (Saas, 2009; Streetman and Banerjee, 2005) which can be improved by alloying it with Aluminium (Al), Antimony (Sb), Lead (Pb), which in turn will form a multi-junction device (Satyen, 1998).
The Dutch Radboud University Nijmegen made a single junction GaAs cell that reached up to 28.8% efficiency (Yablonovitch et al., 2012) while Sharp (2011) Company has reached up to 36.9% and Spire Corporation, has manufactured the most efficient triple-junction, GaAs cell, with an efficiency of 42.3%, which was verified by NREL (Osborne, 2010). However, this technology is still under research and, hence, there are negligible commercial modules available in market.
New emerging technologies
Hybrid cell
Hybrid cell technology is based on the principle of combining crystalline silicon with non-crystalline silicon (Itoh et al., 2001), which makes its manufacturing process complex. Wu et al. (2005) found high ratio of performance to cost for hybrid cell. Based on that, Sanyo (J2) has manufactured a hybrid cell with module efficiency of 17.8% (Zipp, 2011). In April 2014, Panasonic has manufactured a hybrid cell that combines a thin crystalline silicon wafer coated with amorphous silicon giving better performance in low light and at high temperature with a record breaking highest conversion efficiency of 25.6%, which was confirmed by National Institute of Advanced Industrial Science and Technology (AIST) (Evoenergy, 2015; Panasonic, 2014).
Carbon nanotube cells
The concept of carbon nanotube (CNT) cell is a revolutionary idea in which a transparent conductor material made of CNT provides an excellent current. CNT is formed by hexagonal lattice carbon (Manna and Mahajan, 2007). Meiller (2013) researcher at University of Wisconsin-Madison believes that these cells can convert 75% of light into electricity. In November 2012, Shi et al. (2012) reported a Titanium Dioxide (TiO2)-coated CNT silicon solar cell with efficiency up to 15%.
Dye sensitised solar cells
Due to lack of efficiency, production cost and environmental issues with some solar cell materials, researchers have come up with ideas to produce new material technology call dye-sensitised solar cell (Twidell and Weir, 1986). Several researchers (Gerischer and Tributsch, 1968; Hauffe et al., 1970) investigated on sensitisation of wide bandgap semiconductor materials like Zinc Oxide (ZnO) by organic dyes for photoelectochemical (PEC) process. Deb et al. (1978) reported the first use of TiO2 in PEC process. However, these cells are still considered as under early stage of development. In July 2013, École Polytechnique Fédérale De Lausanne (EPFL) scientist has set a world record of 15% exceeding the power conversion efficiencies of conventional, amorphous silicon-based solar cells and they believe that this will open a new era for dye sensitised solar cells (DSSC) (Ayre, 2013; Papageorgiou, 2013) and soon it can be a good competitor to the existing materials available in market for solar cells (Gratzel, 2003).
Tandem cells/multi-junction solar cell
Tandem cells, just like DSSC material technology, are also one of the new immerging ideas to increase the efficiency of solar modules. The concept is, by stacking of several cells of different band gap such that the gap energy decreases from the top and each cell converts solar spectrum at its maximum efficiency, overall it will increase the efficiency of completely stacked cell. This tandem arrangement can be achieved with the different thin film materials, according to their band gaps (Goetzberger and Hoffmann, 2005). Yamaguchi et al. (2005, 2008) has reviewed efficiency and status of multi-junction solar cells. The theoretical efficiency of a single-junction cell is around 31% (Shockley and Queisser, 1961). The stabilised efficiency of single junction cell is 9.3%, for double junction 12.4%, whereas 13% is for triple junction was described by Guha (2004). The strategy of double junction of Hydrogenated amorphous silicon (a-Si:H) intrinsic layers was developed by Fuji Electric & Co. (Japan) and Phototronics (Germany) (part of RWE Schott) with a stabilised lab efficiency of ∼8.5% for cells and 5.5% for commercially available module efficiency (Diefenbach, 2005). On the basis of concept intermediate Transparent Conducting Oxides (TCO) reflector layer for light trapping, Yamamoto et al. (2004) showed the efficiency of 14.7%. Nevertheless, in June 2013, Sharp hit a world record of 44.4% triple junction solar cell, which was verified by Fraunhofer Institute (Wesoff, 2013).
Leading PV countries worldwide
By the end of year 2014, the cumulative global PV capacity has reached 177 GW (International Energy Agency, 2014), means 1% of world electricity generation is from PV. In addition, by the end of year 2014, there are 20 countries across the globe that has passed the benchmark of 1 GW cumulative PV installation (International Energy Agency, 2015a).
For the year 2014, it has been noticed that Asia ranks in first place for the second year in a row with around 60% of the global PV installations. China, one of the biggest contributors of Asia since decade, installed 10.6 GW in 2014. USA has installed 6.2 GW in 2014 with large-scale and new business models dominating the market. However, Europe has significantly declined from 22 GW of installation per year in 2011 to around 7 GW in 2014. Nevertheless, in the year 2014, PV contributes 3.5% of the electricity demand in Europe and 7% of the peak electricity demand (International Energy Agency, 2015a). UK by installing 5 GW of PV projects holds the first position in European countries for PV installation in the year 2014, followed by Germany (1.9 GW) and France (0.9 GW) (Colville, 2014).
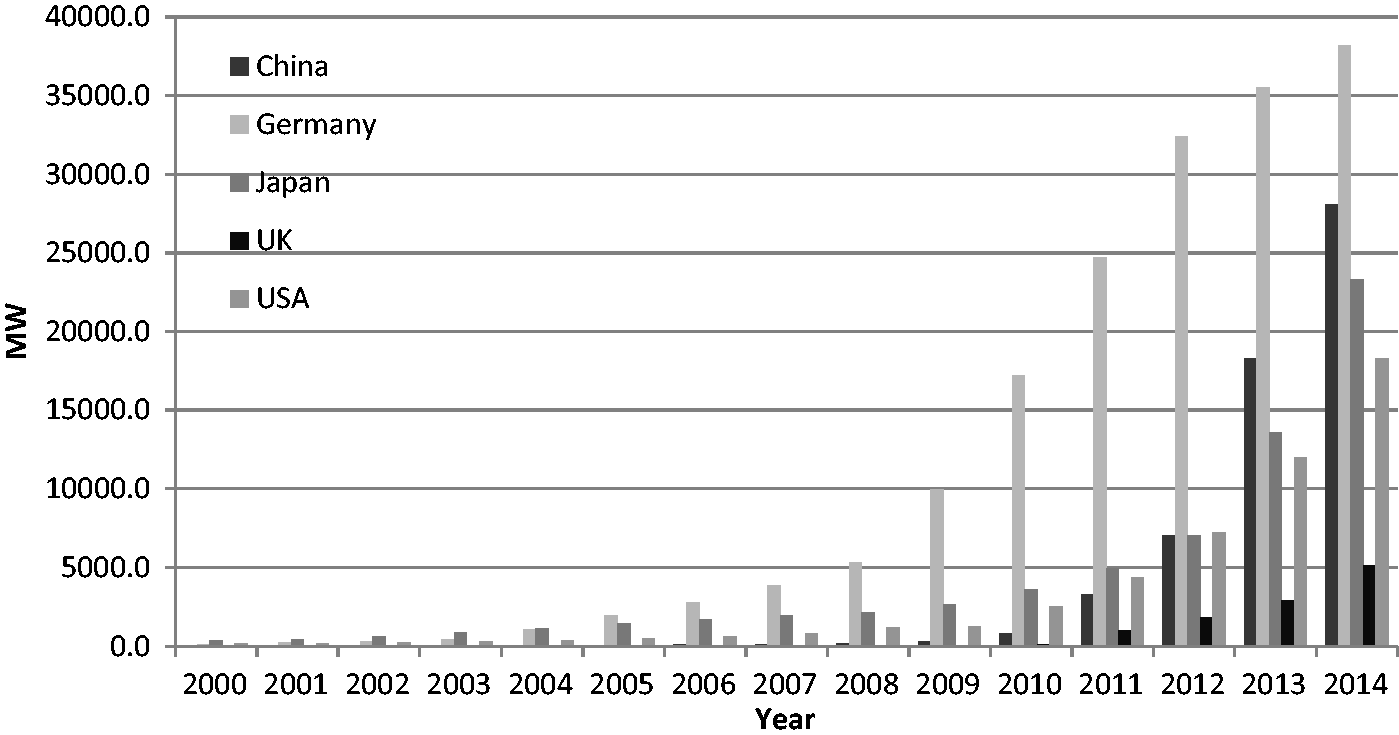
According to International Energy agency (IEA) (Snapshot of Global PV 1992-2013, 2014), the major countries in terms of installation of PV in the year 2014 were China, Japan, USA, Germany and UK. In addition, according to Renewable Energy Country Attractive Index (RECAI) and European PV Industry Association (EPIA), the high ranking countries for the year 2013 were China, Japan, USA, Germany and UK. RECAI is a report published by multinational consultancy firm Ernst & Young (EY), which ranks the countries on the basis of their potential in terms of renewable energy investment and opportunities for growth (Ryan, 2014). These five countries together accounted almost 80% of the world's PV installation in 2014 and around three quarter in the year 2013, followed by 65% in the year 2012. Figure 2 represents the PV installation in the year 2014 of these leading countries. It is worthwhile to note that China and Japan installed five times more than Germany and subsequently four times more than the UK. However, USA is sitting just above half of China's installations. Moreover, the cumulative installation of these five countries from the year 2000 to 2014 is described in Figure 3. It is worthwhile to note that, despite being the least contributor in 2014, Germany holds the first position since decade, in terms of cumulative installations. However, due to significant installations in the year 2014 (see Figure 2), Japan and China are being a tough competitor to Germany and may cross the cumulative installations figures in near future.
PV installations in the year 2014 for leading countries. Cumulative installation capacity of five leading countries from year 2000 to 2014.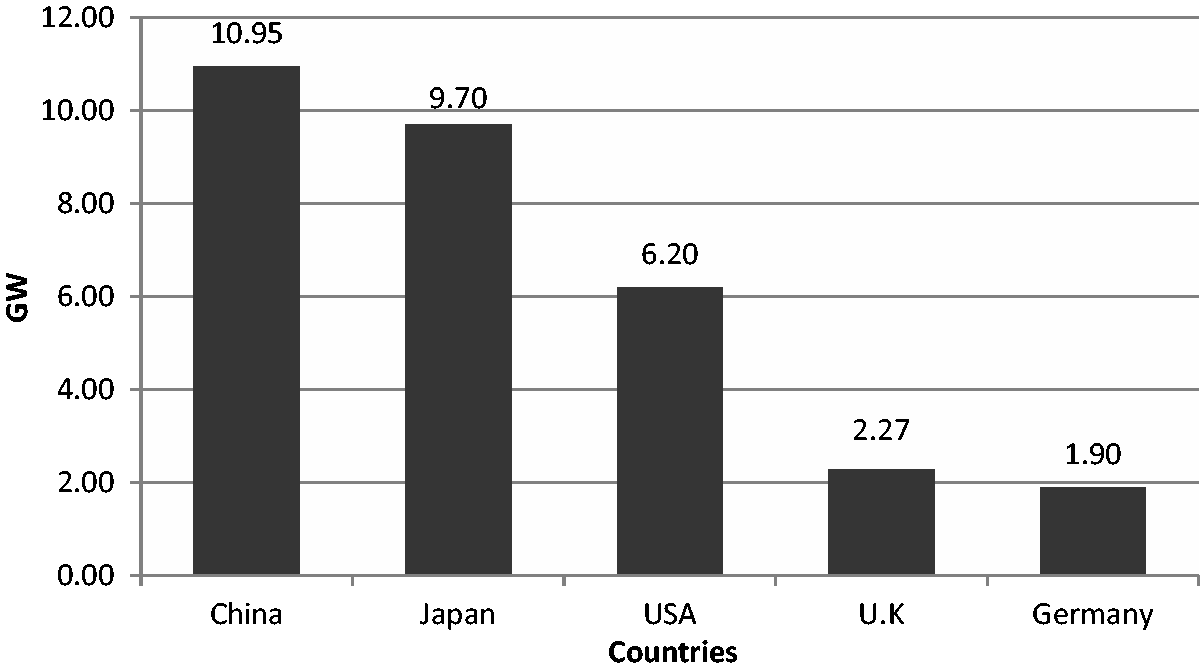
China
Driving policies
China has extremely rich solar energy resources and its PV industry is growing on a faster pace than any other country in the world (Liu et al., 2010; Wigmore et al., 2012). Such growth has been made possible due to the significant support of government incentives and policies.
The Renewable Energy Law: it was planned in 2005 by the National People Congress (NPC) (Caldés et al., 2009) and implemented in January 2006. It was based on five key mechanisms: (a) national target for development of renewable energy: it directs the investment towards all sources of renewable energies, (b) a mandatory connection and purchase policy between grid companies and renewable energy electricity generator: grid companies need to sign an agreement that they will purchase renewable electricity from all renewable electricity generators and provides the grid connection services, (c) Feed in Tariff (FiT) system and price: FiT prices are fixed and will be paid to renewable electricity generators for each kWh electricity generated, (d) cost sharing mechanism: the cost of grid connection and renewable energy generation will be divided among utilities and end users of electricity by implementing a surcharge on sold electricity and (e) the renewable energy development special funds: based on this funds will be provided to activities like research and development of renewable energy, setting up pilot projects or renewable resources assessments (Solangi et al., 2011; Sufang and Xingmei, 2012; Zang and He, 2013).
In addition, following this law, several different policies were made, such as the Tentative Management Method for Renewable Energy Development Special Fund (2006), Provisional Administrative Measure on Pricing and Cost Sharing for Renewable Energy Power Generation (2006), the Medium and Long-term Renewable Energy Development Plan (2007) and the 11th Five year Plan of Renewable Energy Development (2008).
The Brightness and Township Electrification Programme
These programmes are one of the main driving forces behind the expansion of solar PV market in China. The Brightness Programme was implemented in 1996 with an aim to use PV modules and provide electricity for daily needs to the population of china which are without grid connections (Zhang et al., 2013). After that in 2002, National Development and Reform Commission (NDRC) put forward an Township Electrification Program for remote areas and western regions of China. Under this programme, 20 MW of solar PV stations were built in 688 towns and it was the first large scale attempt by Chinese government to resolve the electricity needs for un-electrified areas. Based on the success of this attempt, government is supporting this programme more and, hence, PV modules manufacturing industry are rapidly rising (Actions taken by the Chinese Government, 2015).
Rooftop Subsidy Programme and Golden Sun Demonstration Programme
Ministry of Finance (MOF) and Ministry of Housing and Urban Rural development of China (MOHURD) initiated the Rooftop Subsidy Programme in 2009 (Ministry of Finance, 2009a). Under this programme, consumer gets a subsidy for £1.54/W (RMB 15/W) for rooftop system. The Ministry of Science and Technology (MOST) and the National Energy Administration (NEA) initiated the Golden Sun Demonstration Programme, which provides 70% of the total cost of off grid system and 50% for the on grid system (Ministry of Finance, 2009b), the only condition is that the size of pant should be more than 300 kW (Xu et al., 2011). Both the programmes in 2012, approved projects of more than 500 MW which shows the strong determinations to encourage solar PV projects in country (PJM, 2011).
The National FiT Scheme
In July 2011, the NDRC announced its first nationwide FiT scheme named as notice on perfection of policy regarding FiT of power generated by solar PV. Under this scheme, the first phase is for the projects, which were approved prior to July 2011, and those that have completed construction and have achieved commercial operation prior to 31 December 2011, are entitled to a tariff of £0.12/kWh (RMB 1.15/kWh). The second phase is for those projects which were approved after July 2011 or approved prior to that date but cannot be completed before the end of 2011 are entitled to a tariff of £0.10/kWh (RMB1/kWh) (Wigmore et al., 2012).
Free grid-connection services by the State Grid Corporation of China (SGCC)
The State Grid Corporation of China declared that from November 2012, it would provide free connection services for distributed solar PV electricity producers that are located close to customers and with installed capacities of less than 6 MW each (The Golden Sun of China, 2015).
PV R&D activities and funding
Various R&D activities are reported on crystalline silicon solar cells, thin-films, concentrated PV (CPV), balance of system (BOS) components and testing technologies. China has been conducting PV R&D under the National High-tech R&D Programme since 1986 (Thornley et al., 2011). All basic research related to PV technology is carried out under the National Basic Research Programme of China (2015) and further storage, transmission, demonstrations of PV generated electricity is held by the MOST. Under China's 12th Five Year Plan (2011–2015) of R&D, targets are to increase the conversion efficiency of crystalline silicon solar cells and amorphous thin films solar cells with a view of commercialisation of CIGS and CdTe thin-films. In 2005, NDRC funded £3.51 million (5.02 million Euro) for development and demonstration projects for PV manufacturers and R&D institutions. Similarly, from 2006 to 2010, £15.38 million (22 million Euro) was spent on basic research programme as well as high-tech programme for R&D on PV (Grau et al., 2011).
In addition, MOST created a programme to support PV manufacturing plants to high-tech small firms. The program provided about £2.06 million (RMB 20 million) to support PV projects in 2009. Apart from that further investment support available for PV manufacturing plants are refund of loan interest, refund of electricity consumption fees, refund of land transfer fee, refund of corporate income tax, refund of value added tax payment, loan guarantees and credit facilities provided by government (state banks) for manufacturers (Grau et al., 2011).
Based on policies, R&D and funding activities, Chinese government has set a target of installing 100 GWp of PV projects by 2050 (Dincer, 2011).
Japan
Driving policies
Japan policies are always in the favour of the PV technology. It has constantly noticed that either these policies are targeting the deployment of R&D on PV technology or on the climate change issue. After the oil crisis in 1973, Japan introduced its first PV industry support project named as Sunshine Project in 1974 which was established by Ministry of Economy, Trade and Industry (METI) (Lewis et al., 2009). The aim of this project was to research and develop clean energy technology. At this time, most of the budget was spent on solar thermal technology (Kurokawa and Osamu, 2001). However, New Sunshine Project was established in 1993 (Chowdhury et al., 2014) with a major focus on PV technology and its programme, residential PV system monitoring programme. This project also provided subsidies to consumers for offsetting the initial cost of residential PV system. For example, in 1994, a 3-kW PV system was half subsidised, whose actual cost was £0.03 million (5 million Yen). By the success of these programmes and subsidies, a new programme in 1997 for deploying PV on large scale was introduced, named as Residential PV System Dissemination Program. Under this programme, a net metering system was intruded, which allowed consumers to sell their excess electricity back to the government grid. In addition, a significant amount of funding was provided to national R&D labs for more research on PV technology (Osamu, 2003).
After that, Japan started declining the subsidies and it reached to an average of £319.12 (60,000 Yen) to £372.31 (70,000 Yen) per household in 2005. Finally, in year 2006, subsidies at national level were removed which caused a significant fall in solar PV technology.
On the other hand, the estimated PV target of 2020 and 2030 is 10–40 times the current level. To achieve these targets, in 2008, METI advised for reintroducing residential PV system subsidies (Takase and Suzuki, 2011), which would consequently restore Japan as the largest installer of solar PV (Negishi and Lawson, 2008). In the same year, METI, the Ministry of Education, Culture, Sport, Science and Technology, Ministry of the Environment, The Ministry of Land, Infrastructure, Transport and Tourism jointly implemented the action plan for promoting the introduction of solar power generation. Under this programme, 50% of subsidy will be provide to the cost of installing solar power generation systems at public facilities including airport, highway rest areas and railways (METI, 2008). In addition, many other subsidies will be provided by local government and its budget.
Moreover, in 2007, Japan's Prime Minister launched a new scheme named as Japan's Cool Earth Initiative (2008) (Cool Earth 50) with the aim of reducing the green house gases by 50% by 2050. It involves the development of latest 21 technologies including solar cell technology. One of the plans under this programme is to develop low cost solar cell with conversion efficiency up to 40% and generate power at £0.04/kW (7 Yen/kW) as compared to the current rate of £0.21/kW (40 yen/kW) (METI, 2008). To support cool earth initiative, Japan announced an Action Plan for Achieving a Low Carbon Society (2008), whose goal is to make Japan as world leader in solar electricity generation, halving the current price of solar electricity within three to five years and reduce a significant amount of carbon emission.
In July 2012, a FiT scheme was introduced (Muhammad-Sukki et al., 2014), which resulted more than 20.9 GW of PV projects, which were approved by the end of May 2013 (GreenPeace International, 2011).
Based on policies, R&D activities and funding, Japanese government has targeted to install 53 GW of PV projects by 2030 (Kumar and Sahu, 2015).
PV R&D activities and funding
In Japan, there are various on-going programmes R&D. The New Energy and Industrial Technology Development Organization (NEDO) is funding to programmes such as innovative solar cells and high-performance PV generation system for the Future, Development of Organic Photovoltaics toward a Low-Carbon Society and R&D on Innovative Solar Cells. Innovative solar cells and high-performance PV generation system for the future programme have its key focus on crystalline silicon, thin-film silicon, thin-film CIGS and organic thin-film solar cells. Under R&D on Innovative Solar Cells programme, there are three to five research projects going on, which are expected to be finished by the end of 2015 (Japan International Corporation Agency, 2011). While specifically for organic PV technology, University of Tokyo is running a programme, development of organic PVs toward a low-carbon society.
Other projects such as (a) Photoenergy Conversion Systems and Materials for the Next Generation Solar Cells (2009) and (b) creative research for clean energy generation using solar energy (2011) are funded by Ministry of Education, Culture, Sports, Science and Technology and Japan Science and Technology Agency (JST).
In the year 2013, NEDO initiated demonstration project for diversifying PV application programme in order to extend applications areas of PV systems, i.e. agricultural lands, tilted slopes, water surface, etc. In addition, METI put into practice demonstration project on developing power output forecasting technology of PV power generation programme to enhance power system infrastructure for the use of PV power generation. In April 2014, the National Institute of Advanced Industrial Science and Technology (AIST) established a new research centre, Fukushima Renewable Energy Institute (2014) for R&D on PV.
USA
Driving policies
The major growth of renewable energy in USA is due to energy primarily regulated at state level and not at national level, unlike other countries with companies operating at state or regional levels. Nevertheless, it is quite difficult to analyse which specific state policy is affecting the growth of solar PV. However, few major driving policies are mentioned below.
Renewable portfolio standards (RPS)
It is one of the most common methods to encourage renewable energies (Wiser et al., 2010). Washington D.C adopted this policy with other 29 states in December 2011 to stimulate the renewable energy. It covers whole spectrum of renewable energy (including PV), however its amplification varies by states.
Renewable energy certificate
In all states of USA, it is mandatory that utilities companies should require renewable energy certificate (REC), which is equivalent to MWh of energy created by a renewable resource. This REC can be compared with some European policy such as Tradable Green Certificate, which can be produced or purchased by energy producers by paying Alternative Compliance Payment (ACP) but the price of each ACP varies by region. There is a provision within RPS, that is known as Set Aside or Carve Out, in which utility companies should take in to account certain percentage of PV electricity generation, depending on their sales. For example, Ohio's RPS has a 2025 target of 12.5% renewable energy production out of which 0.5% is from solar, as per its solar set-aside terms (US Energy Information Administration, 2015).
Solar renewable energy credit
It has been implemented to nine states of USA. A solar renewable energy credit (SREC) can be generated for every MWh of solar energy produced in a given energy year. There is no concern about the usage of PV electricity, either it is auto-consumed by residential/owner or sold back to the government grid. It is essential for utilities companies to build solar production or can purchase SRECs from private solar PV energy producers or pay the Solar Alternative Compliance Payments (SACP). To generate SREC, installed PV system has to be approved by state authorities on the basis of safety and technical requirements (DSIRE, 2015). SREC registration is simple and takes around two months (PJM, 2011) which is 10 times less time consuming as compared to other Green Credit Market of USA (Dusonchet and Telaretti, 2010). In addition, tracking of SRECs generated is also quite simple; a solar PV system owner must set up an approved tracking system, which monitors the generated kWh and creates an SREC for each MWh (Burns and Kang, 2012).
Tax credit policy
This policy is based by federal government which means it implies to all the states and is known as Residential Renewable Energy Tax Credit, i.e. a non-refundable personal tax credit. However, it is only applied to residential renewable energy systems. It was established in 2006 and was going to expire in 2011 but due to extension, it is now going to end in 2016 (Verbruggen, 2004). Under this policy, a taxpayer can claim a credit of 30% of qualified expenditures for a PV system that serves a dwelling unit that is owned and used as a residence by the taxpayer (Tax Credits, Rebates & Savings, 2015).
Net metering
It is one of the most widespread mechanisms for supporting PV systems in USA (Darghouth et al., 2011). In this policy, every person holding the PV system should have a specified meter that records the electricity generated by owned PV plant and the electricity consumed from government grid. In addition, if there is excess of electricity generated by PV plant which is termed as net excess generation (NEX) then it can be returned to government grid. This complete adjustment of inflow and outflow of electricity is maintained by the specific meters. The payment of the NEX will be settled at the end of each year. Each state in USA has different price/rate of electricity, so it is quite difficult to mention it in general (DSIRE, 2015; Net Metering, 2015). Under this policy, 99% of 2012 USA PV installations were net metered (Brown, 2013).
Cash rebates
It is a kind of financial incentive scheme which helps while installing a PV system. Based on this policy, every installer of PV plant will be rewarded by a dollar per watt installed. According to Wiser et al. (2010) and Barbose et al. (2011), this is a useful scheme, as it reduces the installing cost of PV projects.
PV R&D activities and funding
In USA, Department of Energy (DOE) is accelerating complete PV research, under the program named as Solar Energy Technologies Programme (SETP). SETP funded research includes sub-programmes on applying scientific research on solar PV to improve its efficiency, progress on the new concepts of innovating new materials and manufacturing process, R&D on BOS, demonstrate the raise in installation of rooftop PV technology, etc. In February 2011, SunShot initiative was and supported by DOE, with an aim to lower down the cost of solar technologies. Their goal is to bring down the cost of solar electricity up to £0.04/kWh (0.06 USD/kWh). In addition, to achieve this, DOE is taking help and support from all sectors such as, academia, private industries and national laboratories, which in turn will result to enable the share of solar generated electricity up to 18% by 2030. According to 2014 SunShot Initiative Portfolio Book (Sunshot Initiative, 2014), the projects in the portfolio currently represent nearly £131.34 million (200 million USD) of investment, in which 66 is invested by National Laboratories, 30% by participating universities and 4% by industries.
The other funding resources/programmes which provides loans and mortgages for solar are Energy Efficient Mortgage (2015), FHA PowerSaver (2015), High Energy Cost Grants (2015), Multi-Family Housing Loans and Grants (2015) and Rural Energy for America Program (2015). These all programmes are supported by Department of Housing and Urban Development and Department of Agriculture (2015).
Germany
Driving policies
Germany holds more than 80% of solar PV installations in the whole of Europe (comprising of 27 countries). The Electricity Feed-in Act (Stromeinspeisegesetz 1991–1999/2000) was the first policy to provide incentives for PV electricity generation. The first PV-specific policy scheme to provide low interest loans for PV installation was ‘1000 Solar Roofs Initiative’, which was implemented between 1991 and 1995 and was followed further by ‘100000 Solar Roofs Initiative’ and granted by German development bank Kreditanstalt fuer Wiederaufbau Bank (KfW). A FiT scheme for PV was established in 2000 (Renewable Energy Sources Act, Ernaeuerbare-Energien-Gesetz (EEG)) and was amended few times.
EEG has a major role in expansion of renewable energy in electricity network of Germany. Since, May 2012, the FiT is has been adjusted on monthly basis and from July 2013, the residential tariff was set to £0.11/kWh (0.151 EUR/kWh) in July 2013. From November 2013 under FiT scheme, PV installations over 1 MW will receive £0.07/kWh (0.0974 Euro/kWh) and systems under 10 kW are receiving £0.10/kWh (0.1407 Euro/kWh). Due to favourable policies of Germany, there are 3500 PV companies out of which 50 of them are manufacturing PV cells, modules and other components (Technology Roadmap: Solar Photovoltaic Technology, 2014).
In addition, projects such as Waschen mit der sonne (doing laundry with the sun) is helping to increase people participation and reduce peak demand in morning and evening hours (Lichner, 2010). Under this scheme, customers will receive a call between 10 am to 1 pm stating that their PV systems are generating substantial amount, and whoever replies to this will be rewarded with £0.35/reply (Technology Roadmap: Solar Photovoltaic Technology, 2014).
PV R&D activities and funding
Under German Federal Government, Federal Ministry for the Environment, Nature Conservation and Nuclear Safety (BMU) hold the responsibility to develop and encourage renewable energy (including solar PV). R&D on different aspects of PV is supported by the BMU as well as the Federal Ministry of Education and Research (BMBF). In 2008, BMBF granted 8 PV projects for R&D by £13.63 million (19.5 million Euro). This budget was total to £37.90 million (39.9 million Euro) in 2009 shared between 130 projects (Grau et al., 2011). In addition to these, the public PV R&D budgets, industrial R&D investments totalled to £113.96 million (163 million Euro) in 2008. In the year 2010, BMU and BMBF started a joint programme to promote Innovative Alliance PV for the reduction of PV production cost. Together, they had supported this programme with £69.91 million (100 million Euro). Due to its success, in year 2011, new programme FuE for PV was made in 2013, with £34.96 million (50 million Euro) funding (Innovationsallianz Photovoltaik, 2015).
In August 2011, a new sixth programme came into action named as Research for an environmental friendly, environmental friendly, reliable and economically feasible energy supply, under which the current R&D is carried out. This programme covers almost all sectors, from the basics of PV to its application and is carried out with the help of BMU and BMBF departments (Research for an environmentally sound, reliable and affordable energy supply, 2011). However, both the departments are working on separate concepts of PV, BMU has a priority of silicon technology, thin-film technologies, systems engineering, alternative solar cell concepts and new research approaches (such as concentrator PV), as well as general issues such as building-integrated PV's and recycling while BMBF works on organic solar cells and thin-film solar cells (including nanotechnology).
In 2013, BMU funded 242 projects of cost £34.05 million (48.7 million Euro) and further detailed report is on (Bundesbericht Energieforschung, 2013). According to EuPD research, PV industry was supported by £2.45 million (300 million Euro) for R&D in 2010. In addition, German patent and Trademark office registered 290 German patents in PV technology in 2010 (Grigoleit and Lenkeit, 2011).
In addition, Germany offers funding options as investment incentives to manufacturing plants. These incentives and support can be categorised into three major groups. The first group is grants/cash incentives (including the Joint Task program and the Investment Allowance program). These programmes under the first group reimburse direct investment costs during the investment phase of projects (before operations have started). The second group can be known as reduced interest loans (at national and state level). These loans are provided by publically owned banks to investors in Germany. Mostly, these loans have less interest rate, as compared to actual market interest rate and also provide attractive grace period. The supportive last group can be named as public guarantees (at state and combined state/federal level). In order to facilitate financing investment projects of young and innovative businesses through the capital market, companies lacking securities may apply for public guarantees (Naam, 2011).
Based on policies, R&D activities and funding, Germany has a target to reach at 51 GW by 2020. Overall, German's long-term policies and funding have a significant impact on reducing of soft cost that associated with solar installation, such as permitting, inspection, interconnection, financing, etc. (Naam, 2011).
UK
Driving policies
The UK government since long time is trying to make some valuable changes in policies and increase the awareness of PV that can attract more public interest in solar technology. The first programme named as SCOLAR was set out in 1998, as a coherent programme by British commercials and academicians to spread awareness and understanding of PV nationwide with an integral research extended to the applications of PV. This programme was valued as £2.5 million which included £1 million from Government's Foresight initiative and remainder from participating schools and colleges (Wolfe and Conibeer, 1998). Under this programme, 100 small PV projects were carried out for schools and colleges each sizing between 2 and 3 kW.
Current PV market is driven by two major policies: Fit and Renewable obligation certificates (ROCs). FiT scheme was introduced after that in 2010 (Sweetnam et al., 2013), which led to installation of 1.8 GW by the end of year 2012. This significant rise in installation was also because of fast track review on large-scale solar project by Department of Energy and Climate Change (DECC) (Feed-in Tariff Scheme, 2015; Smit, 2005; Todd and Alty, 1977; Gardiner et al., 2011) which expects that UK will install up to 20 GW by 2020 (Department of Energy and Climate Change, 2011). To be eligible for the FiT scheme, PV installations must undergo an accreditation process (a) PV installations below 50 kW are eligible under (Microgeneration Certification Scheme (2015)) MCS-FiT (2015) accreditation process and (b) PV installations higher than 50 kW are eligible under the ROO-FiT (2015) process. Ofgem (2015) website publishes the rates that PV system owners receive under the FiT scheme (2015).
In 2002, Renewable Obligation (2015) (RO) came into effect in England, Wales and Scotland, followed by Northern Ireland in 2005. Its aim is to place an obligation on UK electricity suppliers to source an increasing proportion of the electricity they supply from renewable sources. ROCs are green certificate issued to operators of accredited renewable generating stations for the eligible renewable electricity they generate. Operators can trade ROCs with other parties. ROCs are ultimately used by suppliers to demonstrate that they have met their obligation. Where suppliers do not present a sufficient number of ROCs to meet their obligation, they must pay an equivalent amount into a buy-out fund. However, the amendment (referred to as the RO Closure Order 2015) closes the RO and the Renewable Obligation (Scotland) (ROS) schemes for large-scale solar PV systems on 1 April 2015. The report by Office of Gas and Electricity Markets (Ofgem) (Chowdhury et al., 2014) explains the details of closure.
In October 2012, UK government launched a new policy ‘Green Deal’ which was operational in January 2013. The mechanism of Green Deal is to allow householders to apply for loans for energy efficiency and renewable energy technologies (including solar PV) helping them with the upfront cost and this money is paid back in instalments through their energy bills. The repayments are arranged in such a way that the money householders are paying back is about equal to the savings they are making as a result of the installation (Nicholson, 2015). This scheme can be merged with FiT to increase the net savings. For example, a typical 3.5 kW domestic solar PV system installation under FiTs, over the whole 20-year duration will generate the net savings of £5835 to the homeowner (Green Deal: Energy Saving for Your Home, 2015). The Green Deal (2013) was thought to ‘revolutionize the energy efficiency of British properties’, but was pulled in July 2015 due to low uptake (Fawcett and Killip, 2014). The current UK situation is that the deployment of renewables schemes under the FiT scheme have exceeded expectations, to the point where spending has breached the limits of the government's Levy Control Framework, which itself sets limits on the amount of money that can be added to consumer bills to support low carbon electricity generation. The DECC proposed at the end of August 2015 a range of reductions, including a cut to the FiT paid for electricity generated by solar rooftop panels from £0.12 to £0.1 from January 2016 (Energy Institute, 2015).
PV R&D activities and funding
From the year 2000 to 2006, PV Field Trials Programme was introduced with the funding of £9.4 million and 1.5 MW of PV plants were installed under this programme. In the same years, Major Photovoltaic's Demonstration Programme was also implemented with £31 million from 8 MW projects. Then from 2006 to 2010, Low Carbon Building Programme was introduced with £13.4 million for 4428 PV projects.
Currently, most of R&D funding is provided by Engineering and Physical Sciences Research Council (EPSRC). The UK Energy Research Centre (UKERC, 2015) Research Atlas provides details of publicly funded, past and ongoing research activities in the solar sector. Research is mainly carried out at academic institutions and by few companies, especially those who have collaboration with academic institutions. Overall in 2008, EPSRC provided funding of £8.6 million to 82 PV and PV-related research. Out of this total funding, £6.3 million was invested on new PV materials for the 21st Century (PV-21) programme, which was in collaboration with eight universities and nine industrial partners, aiming to make solar energy economically reasonable. Earlier to that, by 2004, Woking Borough Council invested in PV projects and had installed 10% of the UK's solar PV (Allen et al., 2008) and has also proved that a typical solar PV system can provide 51% of electricity demand (DTI, 2006).
In 2012, Research Council UK (RCUK) research portfolio is of £40 million for solar PV which encourages and support UK PV manufacturing industry through innovation of both existing product and new products. In 2013, UK National Solar Centre (NSC) was inaugurated, which is in collaboration with Building Research Establishment (BRE) with a goal to grow PV industry. In addition, at Intersolar (2013), the UK government announced that it will provide £7.6 billion per year by 2020 of targeted subsidy to support the deployment of renewable energy technologies (including PV) in Britain (UK Solar Photovoltaic Roadmap, 2013).
PV electricity production in leading countries
PV technology is rapidly growing and its contribution to electricity demand is significantly rising. Around 177 GW of PV is installed by March 2015 across the world, which is at least 10 times higher than in 2008 (International Energy Agency, 2015a). It was calculated that globally, at least 160 TWh PV electricity was generated in the 2014, i.e. which accounts for 0.85% of electricity demand of whole world and it will reach up to 200 TWh (120 billion kWh) by the end of 2015, i.e. which means 1% of global electricity demand.
It is quite easy to measure the electricity production of an individual PV plant, but much more complicated to compile it for the whole country. In addition, it is difficult to compare the installed PV system on date with the production of electricity. For example, PV system installed in December will only produce a small fraction of its regular annual production, while the issue may exist where the weather condition of the same year may not be good for typical long-term average. The other issues can be like optimum orientation or partial shading for Building Integrated PV Systems (BIPV) can also impact the output of PV systems. For these reasons, the PV electricity production calculation is theoretical and is based on cumulative PV capacity of the specific countries. Figure 4 (International Energy Agency, 2015a) shows the theoretical PV electricity production that is close to optimum siting, orientation and average weather condition (Snapshot of Global PV 1992-2013, 2014). It can be seen that Germany is holding first position and that is due to its target to increase the share of electricity demands by solar PV by 10% in 2020 and by 20% in 2030 (German Solar Industry Association, 2015).
Theoretical percentage share of PV electricity production in 2014 of five leading countries.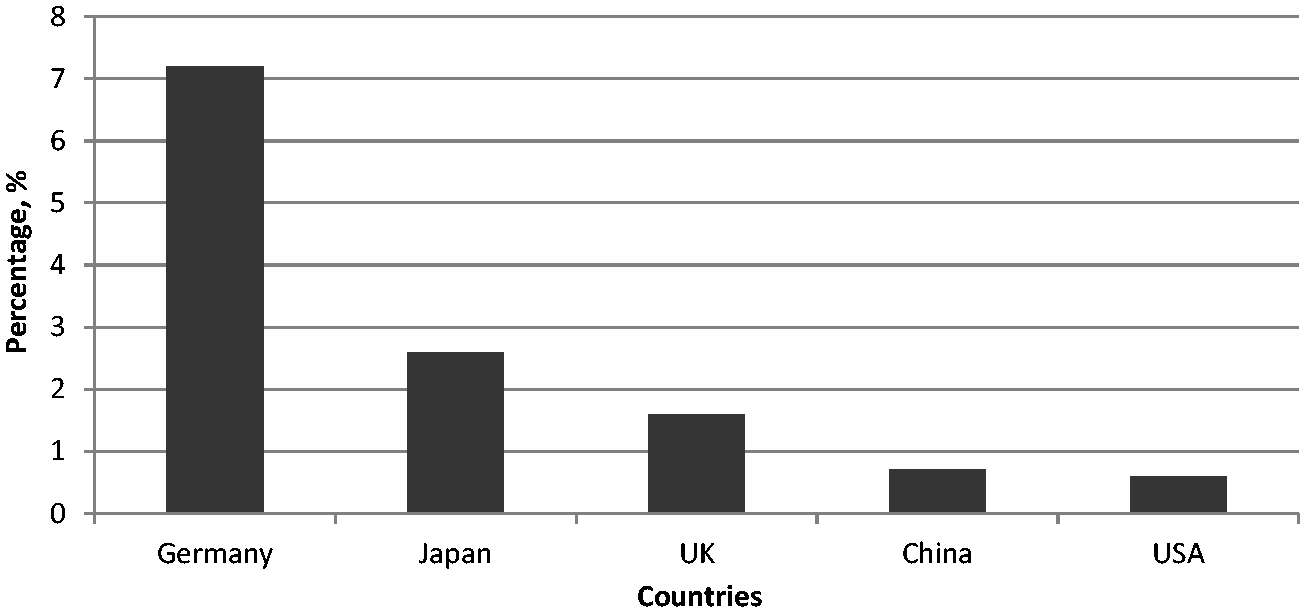
In addition to these leading countries, there are 19 other countries around the world whose PV electricity contribution to total electricity demand is has reached over 1% (International Energy Agency, 2015a). It is noticed that 5% of Europe electricity demand is fulfilled from PV and Italy is at 7.92%, i.e. which is even more than any of the major leading countries mentioned above. However, it can be noticed from Figures 2–4 that China and USA are leading the market in terms of yearly installation as well as cumulative installed capacity, but they are far behind in terms of generation of PV electricity as compared to their actual demand.
PV cost analysis
It is observed that, for decades, the prices of solar modules have decreased significantly. The decline in prices has been due to the factors such as (a) innovations in material technology, (b) increases in the amount of production, (c) improvements in the efficiency by innovative technology, (d) increasing lifespan of PV system and (e) favourable policies for solar technology (GreenPeace International, 2011). From Figure 5 (Cost of Solar, 2013; Feldman et al., 2014; German Solar Industry Association, 2015; Growth of photovoltaics, 2015; GreenPeace International, 2011; Naam, 2011; SolarBuzz, 2015; UK Solar Photovoltaic Roadmap, 2013), it can be noticed that the price of PV cells has drastically reduced from £15.18/W (23 USD/W) in 1980 to £0.79/W (1.2 USD/W) in 2014, and in June 2015, it has reached to £0.20/W (0.30 USD/W), which is more than 75 times, in almost 35 years.
Solar PV cells price trend.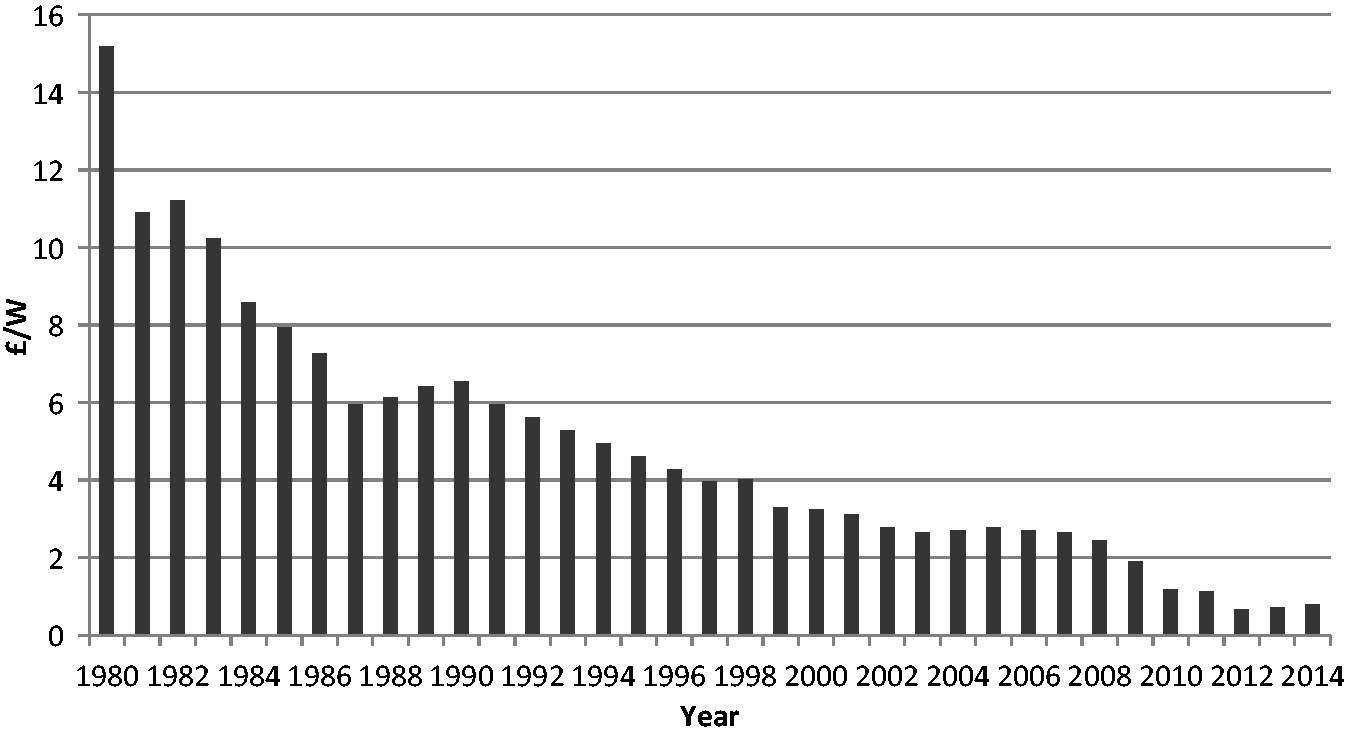
A complete PV system combines PV modules with set of additional application dependent system components like mounting structure, inverter, charge controller, electrical components, etc. which are known as BOS to form a complete PV system. Similarly like PV modules and BOS components are also decreasing and its trend can be seen from an example of USA market. There are several reasons to take USA as an example such as government investment, market diversity, climate diversity and high labour cost. Figure 6 shows the BOS system cost from 2010 to 2013 for 10 MW fixed tilt blended c-Si projects. It is seen that BOS cost is almost reduced by 20 times since 1980 and is approximately declined by £0.18/W (0.29 USD/W) from 2010 to 2013 (Aboudi, 2011; GreenTech Media, 2013).
BOS price trend from 2010 to 2013 for 10 MW fixed-tilt blended c-Si projects in USA.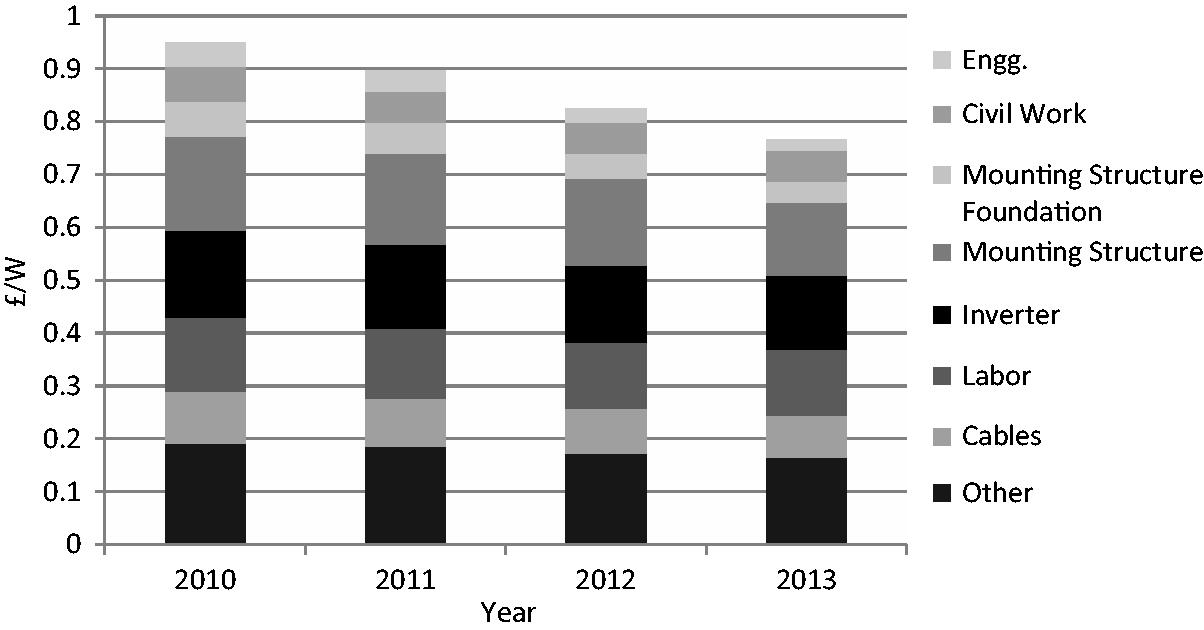
According to Greentech Media (GTM) Research report Solar PV BOS Market: Technologies, Cost and leading companies, 2013–2016, in 2011, the ratio of BOS to module was 68:32 and in the year 2012, it reached sharply to 50:50 (Greentech Solar, 2012), which clearly indicated that not only the price of modules are decreasing but BOS cost are also rapidly decreasing. This significant fall in both module price and BOS price has gained much attention of investors and, as a result, there are several new projects building all over the world.
Efficiency of CIGS/CIS PV modules.
Size and cost of PV projects.

Discussion and recommendations
Solar PV technology has enormous potential and benefits for society. Currently, several materials are emerging in the PV market. Nevertheless, efficiency improvement is one of the key factors for establishment of PV technology in the market. Due to ease in availability of silicon as a raw material and its simple manufacturing process, multicrystalline efficiency has reached up to 20.4% and it holds 80% (Razykov et al., 2011) of the PV market. However, to achieve main objective of making PV a major player in the power sector, efficiency of other type of materials should increase with no compromise in cost (Powalla and Bonnet, 2007). It is believed that under all scenarios solar PV will continue to increase its share of the energy mix in Europe and around the world.
Comparison and comments on all PV materials and their development.

After analysing the policies of five leading countries in ‘Leading PV countries worldwide’ section and various other European countries (Dusonchet and Telaretti, 2015), it can be noted that the PV market still remains as a policy-driven market and the right decisions of creating smart and sustainable support schemes for PV with a valuable amount of funding for R&D activities can influence the overall market. So far, FiTs are the most widespread support mechanism adopted all over the world, with a market share equal to approximately 60% in 2012 (IEA-PVPS, 2015). Direct subsidies and tax rebates are in second place, with a share of 20%, followed by self-consumption (12%) (Dusonchet and Telaretti, 2015), RPS (4%) and net-metering (2%). However, ‘Policy recommendations’ section recommends a few changes that can be made in policies for deployment of PV system. These recommendations can be applied globally, including five leading countries.
Policy recommendations
To achieve the high deployment goal, a complete PV analysis from raw material, module technologies and BOS components to product development, demonstration and deployment, need to have some changes. This section presents a set of key actions required to create an effective policy framework, which will directly or indirectly support solar PV to be successful in the market (Technology Roadmap: Solar Photovoltaic Technology, 2015).
Incentive and framework
Financial incentive scheme and regulatory framework
To gain more interest of investors for high capital investment for PV installations and PV modules manufacturing industry, it is essential to have clear, long term, effective and predictive financial incentives schemes like FiT, portfolio standards and investment subsidies with a framework like access to grids. Governments should implement such long-term schemes and energy policies for PV deployment. In addition, framework should continue to the actual market where net metering system is involved with an economic incentive schemes for PV electricity generators and users.
Providing only economic support is not enough, there should be proper regulations for non-economic hurdles which can hinder the effectiveness of polices and supportive schemes. There are administrative problems like planning delays, lack of coordination between authorities, long time for approval and connectivity with grids. There should be some time schedule for each legal steps and procedure with a good coordination between all the departments and authorities.
Majority of PV incentive schemes are made for grid connected systems and stand alone systems are hardly ever supported, despite the fact that they can offer an efficient and effective solution (replacing diesel generators with PV systems).
Regulatory framework for PV grid integration
The major issues with a PV system are its interconnection with the grid and load management. This will require more smart ways of generating and distributing electricity which is simple, safe and reliable. One of the measures that can be taken to resolve this issue is by better transmission and management technologies, which include smart grid and metering and improved energy storage system.
Hence, for enhanced grid integration, governments should initiate long-term planning for system flexibility and grid management. For example, regions with high amount of irradiation can be connected with high number of grid connected PV projects with proper distribution management system, with time dependent electricity tariffs.
Market transformation
Globally accepted standards and codes
With an aim to have high-scale PV deployment IEA has identified that there should be internationally accepted standards, codes and certificates of PV products (International Energy Agency, 2015b). It will not only help in safety and quality but will also avoid the administrative barriers. This set of standards, codes and certificate should include energy and performance of PV modules, quality assurance, reuse and recycling and for gird interconnections. Overall, this world wide accepted standard and codes will enhance the deployment of wide variety of PV technologies.
Promote new investment and business models
It is a well known fact that PV needs initial high investment cost but has a low operating cost (Dusonchet and Telaretti, 2015). In current scenario, most of the incentives schemes are for large-scale grid tie projects. However, high-capital investment is a major hurdle for residential and small commercial customers with off grid application. One of the options to resolve this issue is to support Energy Service Companies (ESCOs), which will own the system and provide the energy to end user for a periodic fee. The user will never be the owner of the system and are not responsible for any maintenance. Governments should provide some financial support to PV ESCOs for grid tie and stand alone PV systems.
According to IEA PVPS (Photovoltaic Power System Programme), 2008 there should be some sort of financing mechanism options like direct cash sales, credit sales or lease purchase (Léna, 2013).
Skilled PV workforce
From research to installation and maintenance, PV market needs skilled workers. A highly skilled trained people are required for technology development, customer's confidence in quality of installation, reliability and cost reduction. To ensure all these factors, there should be some educational institutes and training programmes for specific target professional groups such as government planners, architectures and home builders (Solar Powering America Home, 2015).
Development of technology and R&D
Assured long-term R&D funding
PV sector comprises several materials (see ‘PV materials and efficiency’ section) and technologies, which needs potential improvements. Appropriate long-term high amount of funding assurance is required to develop and improve system technology and bring novel concepts to industrialisation.
It is noticed that R&D funding for PV is increasing in recent years; however, it need to be increased more in upcoming years to achieve the targets like BLUE MAP, to reduce the carbon emission by 50% till 2050 (Global Gaps in Clean Energy RD&D, 2010).
Develop smart grids and energy storage technologies
As mentioned in ‘Regulatory framework for PV grid integration’ section, the need of smart grid technology will significantly increase as the PV systems will increase. It provides a wide range facility to both generator and end user, for monitoring bidirectional flow of electricity. This technology can keep a control over conventional generation with a variable PV electricity generation and storage. It can maintain the proper flow of electricity in the time of peak demand, from the storage to the end user with an accurate calculation of generated electricity from both conventional sources and PV. It can also process a real time meteorological data evaluation to predict the PV electricity generation. An advanced metering system which is an integrated part of smart grid can deploy the PV systems because it will provide a better operational characteristic understanding of consumption of grid electricity and generated PV electricity, i.e. if the user has installed its own PV plant.
As targeted by IEA vision, PV electricity will share 5% of global electricity after the year 2030. At that stage, there will be need of superior storage technologies, which will provide flexibility to the system and minimise the impact of variable PV generation. Various R&D activities are going on redox flow batteries, compressed air energy storage, electric double layer capacitors, flywheel systems, Li-ion batteries and superconducting magnetic energy storage.
International expansion and collaborations
Expand R&D internationally
It is necessary to have R&D activities, taking place internally, hence, both important short-term and long-term issues will be addressed by each country and existing infrastructure facilities will be availed for improvement of PV materials and BOS components. One of the examples of such international collaborations is PVPS by IEA between 21 expert countries of EPIA.
International aid
Since 1993, World Bank (WB) and Global Environmental Facility (GEF) are providing funds and support for renewable energy technologies to developing countries. From the year 1997 to 2007, WB and GEF supported China with 40 million USD in form of grants and loans. Due to that support, within those 10 years, China became one of the top manufacturers globally, for solar modules and BOS components. Similar example is of German state owned bank KfW (see ‘Driving policies’ section of Germany), that financed £160.80 million (230 million EUR) for renewable energy products in 2008. Hence, this sort of funding facility for PV sector should be increased.
Conclusion
Every year, the global energy consumption is increasing and several different technologies are used to meet the energy demand. One of the emerging technologies, solar PV is reviewed in this article. Since past decade, it has been noticed that solar PV technology is rapidly growing and is becoming a mainstream player within the power system. Several countries are installing significant amount of solar PV plants every year (see ‘Leading PV countries worldwide’ section), which proves its importance. This progressive growth of PV was put in perspective with the development of renewable power sources in several countries in 2014.
This concepts which are explored in this article are (a) ongoing and emerging PV materials and efficiency – it was found that monocrystalline modules have the highest efficiency of 22.5% and other emerging materials such as CNT is still under lab R&D and will take some time to be commercial. Overall, the common concept of R&D on all the materials is to increase efficiency, develop new methods of manufacturing and cost optimisation. (b) Leading countries – this section looked into driving policies, R&D activities and funding of five major countries China, USA, Japan, Germany and UK. Based on this review, it can be said that PV is still a police driven market and rest of the world should take into account the policies of the leading countries to participate into PV deployment. (c) PV electricity production – it is quite difficult to analyse the exact amount of PV electricity generated in each country. However, it was analysed that 1% of global electricity demand will be fulfilled by PV electricity by the end of year 2015. (d) PV cost analysis – since more than a decade, the PV materials price and BOS components system prices are declining. Consequently, the overall PV project cost has declined to £0.32/W (0.48 USD/W).
In conclusion, looking all at the major aspects covered in this article, it is difficult to extract exact global pattern. Though, it can be said that PV has not reached to a widespread development and still is driven by few countries. PV technology has gained significant attention of policymakers in numerous countries and hence, plans for PV development have increased all over the world. However, this has not contributed drastically to the PV market and its deployment till the year 2014 was less than 40 countries. Hence, all the concepts covered in this article would be useful for the solar PV system installers, academicians and researchers.
Footnotes
Declaration of conflicting interests
The author(s) declared no potential conflicts of interest with respect to the research, authorship, and/or publication of this article.
Funding
The author(s) received no financial support for the research, authorship, and/or publication of this article.