
Abstract
This study builds upon the research progress in the theories of CBM desorption, diffusion, and seepage flow to explore the production mechanisms of deep coalbed methane (CBM) in the Daing-Jixian block, aiming to achieve scientific and reasonable control of gas wells. Theoretical analysis suggests that CBM adsorption belongs to liquid–solid interfacial adsorption, encompassing four stages: liquid phase adsorption—liquid phase desorption—composite desorption—gas phase desorption. Most of the desorbed gas is driven by a pressure differential in a Darcy's flow process. By calculating the Knudsen number (Kn) under various temperature, pressure, and fracture diameter conditions, the flow state can be identified. Whole-diameter CT scanning reveals a multi-scale pore-fracture system ranging from millimeters to micrometers to nanometers. Calculations show that during the gas well drainage and depressurization process, fractures of millimeter scale and larger exhibit Darcy's flow, while micron-scale fractures maintain Darcy's flow status above a reservoir pressure of 5 MPa; other scales primarily exhibit non-Darcy flow without significant macroscopic movement. In summary, starting from the fundamental mechanisms of the original multiscale tri-level pore-permeability system of the coal reservoir, through the post-fracturing transformation forming three diversion zones of high, medium, and low conductive regions, and transitioning from primarily free gas to desorbed gas in three production stages, an ideal comprehensive production model schematic for the study area has been established, providing theoretical support for on-site production management.
Keywords
Introduction
In the typical classification of coalbed methane (CBM) storage depths, depths less than 1000 meters are considered shallow, depths between 1000 and 1500 meters are considered mid-depth, and depths between 1500 and 2000 meters are considered deep (Li et al., 2022). Currently, China's CBM resources at depths of 1500–2000 meters are estimated at 11.93 × 10¹² cubic meters, and those at depths of 2000–3000 meters are estimated at 18.47 × 10¹² cubic meters (Zhang et al., 2022). Since 2019, breakthroughs in CBM exploration at depths greater than 2000 meters in various basins, such as the eastern margin of the Ordos Basin and the eastern margin of the Junggar Basin, have challenged the previous perception of deep CBM as an “unreachable zone.” From 2019 onwards, deep CBM (referring to depths beyond 2000 meters) has exhibited characteristics distinctly different from those of shallower deposits, including high gas content, high saturation, and the presence of free gas, displaying early gas production, high initial output, and rapid decline similar to shale gas (Li et al., 2023). Ni et al. (2019) summarized the understanding of deep CBM reservoirs in the eastern part of the Junggar Basin and proposed corresponding fracturing and fluid drainage techniques, though without delving into the production mechanism. Li et al. (2020) utilized experimental simulation and mathematical analysis to study the dynamic changes in gas-water during production, focusing on static research without integrating actual production dynamics. Zhang et al. (2024) established CBM deep well classification standards and a production stage model, conducting an in-depth analysis of the production characteristics of deep wells compared to medium and shallow wells, as well as the differences between various types of deep wells. Chen et al. (2024) developed a CBM recoverability assessment system for deep reservoirs, employing a multi-criteria fuzzy evaluation method to quantitatively assess the recoverability of deep CBM. Li et al. (2023) proposed that a dual adsorption mode was more suitable for fitting the excess adsorption isotherms, suggesting that due to the nano-confined effect and low water saturation, deep CBM contains abundant free gas. Wang et al. (2023) introduced AI technology to the exploration and development of deep CBM, establishing an innovative integrated CBM geology engineering intelligent decision-making system based on big data analysis algorithms, and achieved rapid prediction of single well production and analysis of controlling factors driven by big data. Targeting the eastern margin of the Ordos Basin, Yang et al. (2022) conducted research on the structural features of deep coal rock pores and fractures. Li et al. (2022) investigated the characteristics of deep CBM reservoir formation and favorable area evaluation. Deng et al. (2024) conducted an analysis of pore and fracture systems in deep coal reservoirs using various pore characterization methods. Their experiments demonstrate that micropores provide numerous adsorption sites, offering a locus for the adsorption and storage of deep CBM, while microfractures provide extensive storage space, facilitating the enrichment of deep CBM. Liu et al. (2022) carried out acid fracturing tests and analyzed factors affecting gas production based on these studies. Nie et al. (2022) explored favorable area selection and supporting drilling and pressurization development techniques based on production patterns. Zeng et al. (2022) proposed an integrated production and extraction process for the entire lifecycle after analyzing factors affecting the continuity of drainage and extraction. All these studies involved the characteristics of gas-water production, believed that production initially starts with free gas, gradually transitioning to desorbed gas, and categorized the extraction stages from their respective focal points, yet they did not explain the fundamental production mechanism.
This article builds on the latest research findings on CBM and shale gas desorption and seepage theories since 2000, focusing on the eastern margin of the Ordos Basin. It analyzes the macro-to-micro full-scale pore-fracture development characteristics of deep coal reservoirs, combined with the dynamic performance of actual production, to elucidate the desorption and permeation processes of deep CBM from a micro to macro scale. The study proposed that there are three flow areas with varying permeability capabilities (high, medium, low) extending from the wellbore, corresponding to three primary production stages dominated by free gas, a mix of free and desorbed gas, and predominantly desorbed gas. A comprehensive theoretical model of deep CBM production mechanisms has been established, providing a theoretical basis for subsequent scientific and rational control, optimization of production systems, and maximization of Estimated Ultimate Recovery (EUR).
Basic overview
The study area is located at the southern end of the Jinxi fold belt in the eastern Ordos Basin, characterized by a large monocline structure trending northeast and dipping northwest (Figure 1). The exploration and development of deep CBM primarily target the Benxi Formation's No. 8 coal seam, deposited in tidal-flat to lagoon peat swamp environments. The structural configuration of the study area features lower elevations in the northwest and higher elevations in the southeast, divided into three structural zones and six development units: the nose-shaped uplift and steep slope zones in the east, the sloping and uplifted zones in the southern slope belt, the low concave and gentle areas in the northern flat belt (Figure 1(b)). The dip angle is less than 3°, and faults are not prevalent. Depths are generally beyond 2000 m with an average thickness of 7.8 m. The coal type is predominantly bright and semi-bright coal, with vitrinite as the main maceral component, accounting for 69.4–81.8% of the composition, and an average vitrinite reflectance of 2.47%. Permeability ranges from 0.053 to 0.054 × 10⁻³μm2, with gas content between 20 and 35m3/t. A comprehensive comparison of geological parameters between mid-shallow coal seams and deep No. 8 coal seams indicates that the deep seams have greater thickness, higher gas content and saturation, and even supersaturation phenomena, with well-developed cleats and fractures (Yan et al., 2021). The coal structure is primarily original, indicating high modifiability, but the reservoirs are ultra-low permeability and require large-scale fracturing modifications to enhance gas production. Early production wells generally exhibit early gas appearance, high initial production, and poor stabilization performance.
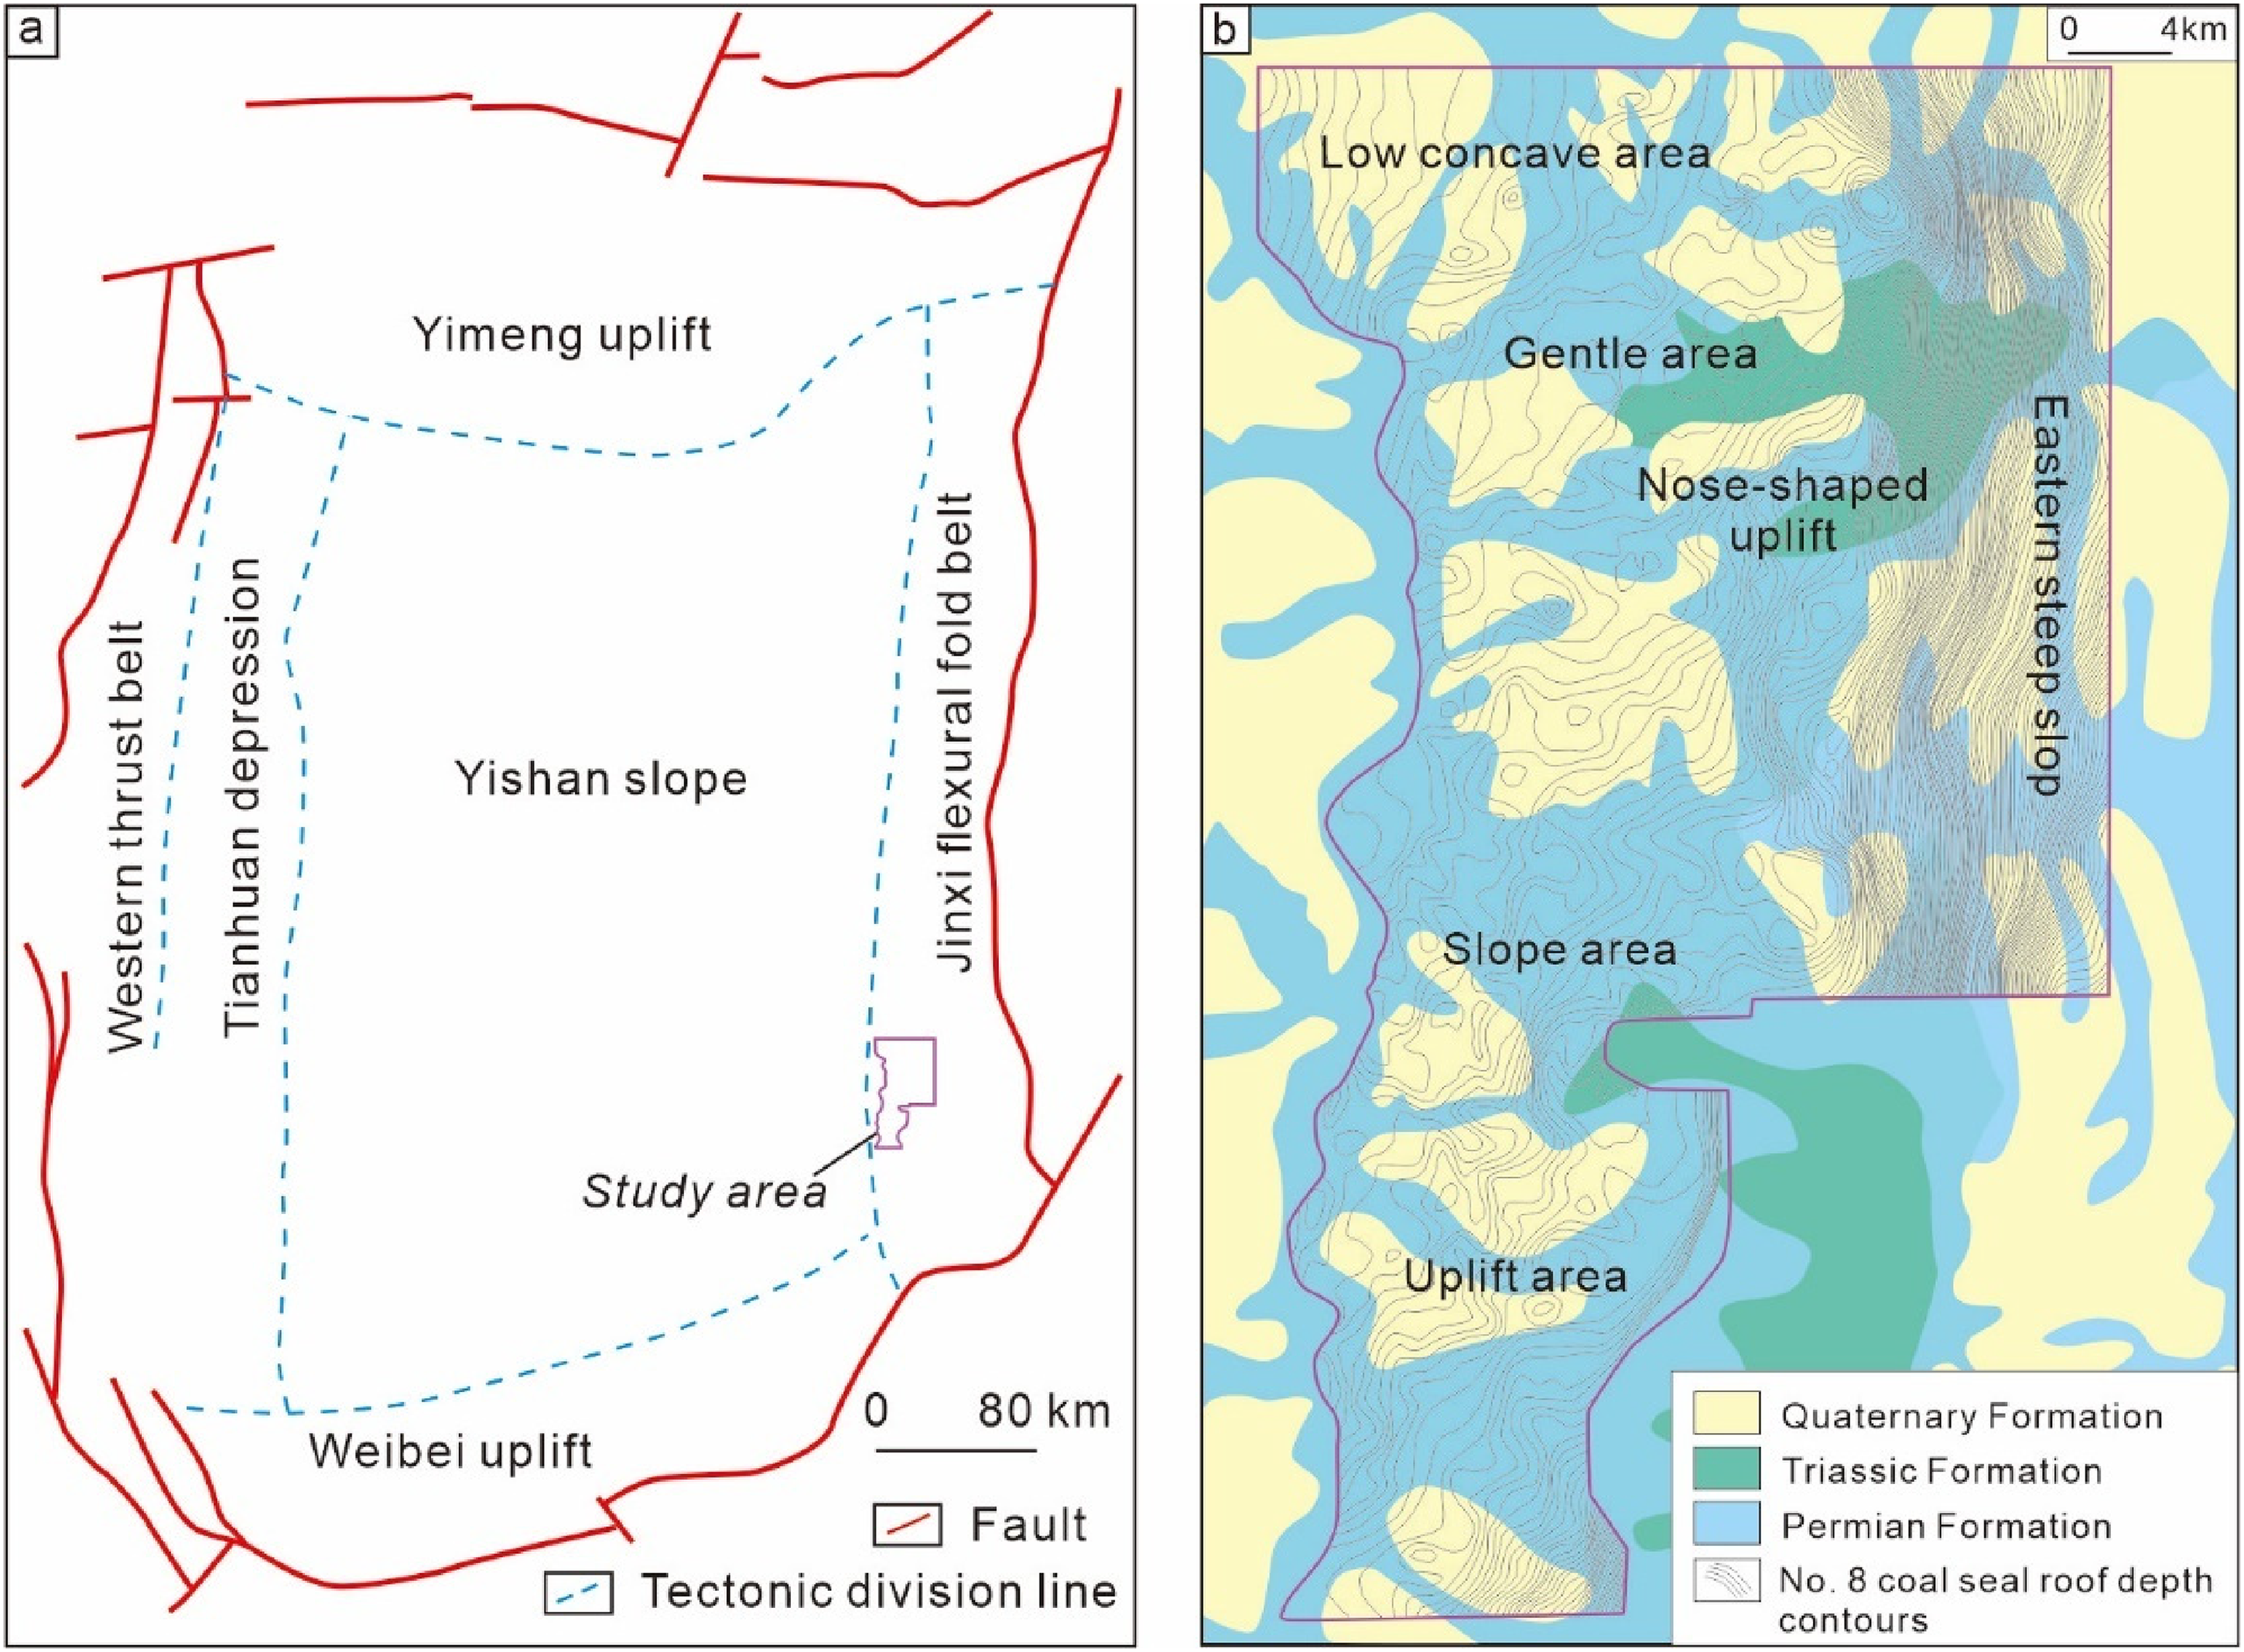
Location and tectonic units division of the study area.
Desorption and permeation theory
The majority of CBM reservoir research is still based on the traditional gas–solid phase adsorption model, following the Langmuir adsorption isotherm, which indicates that adsorption increases with reservoir pressure until it reaches equilibrium. Initially, it's generally believed that the adsorption is under-saturated, meaning that the coal cleats and fractures are saturated with formation water, and the adsorbed gas is stored in the coal matrix. During production, as water is drained and pressure is reduced, the adsorbed gas in the coal matrix first desorbs and diffuses into the cleats and fractures, then flows through them to the wellbore for production. This view aligns with the dynamic characteristics of actual development and has been widely accepted by many researchers. However, as research into CBM exploration theory and development progresses, it has been discovered that traditional desorption and permeation theories have inherent contradictions. The following sections detail the progress in research on desorption and permeation theories.
Adsorption–Desorption theory
The gas–solid phase adsorption theory was proposed by Langmuir as early as 1916 (Swenson and Stadie, 2019). Anderson et al. (1966) measured the adsorption and desorption isotherms of different gases in coal. In the 1980s, many CBM practitioners began using the Langmuir adsorption model to describe the isothermal adsorption process of CBM, but experimental findings also revealed its limitations. For example, Gregory et al. (1986) found that the amount of gas adsorbed in high-pressure water-bearing coal experiments was higher than the actual gas content in gas fields, and the measured adsorption–desorption isotherms exhibited significant hysteresis. In the 1990s, research on multi-component isothermal adsorption models began, and related research in China also started. Given that the Langmuir adsorption model essentially fits the adsorption model system of CBM wells and offers a complete set of adsorption testing methods, it was widely applied in theoretical research and practical production (Clarkson et al., 2007; Mohamed and Mehana, 2020; Pan and Wood, 2015; Zhu, 2018). Since 2000, studies have found and verified issues with the traditional Langmuir gas–solid phase adsorption model, suggesting that the liquid–solid phase adsorption model is more suitable for explaining the adsorption–desorption phenomena of CBM. The CBM desorption process is considered to be a composite desorption mode involving both gas–solid and liquid–solid phase adsorption models.
Gas–solid phase adsorption theory
The traditional gas–solid phase adsorption theory is based on the assumptions that adsorption occurs between two media, solid and gas, with gas molecules adsorbing onto the solid surface in a monolayer. This is demonstrated through isothermal adsorption experiments conducted on equilibrium moisture coal samples (Figure 2), which satisfy the Langmuir equation (Equation (1)). Comparing the actual gas content measurements of coal samples from mines to the theoretical adsorption capacity at corresponding pressures, if the actual gas content is higher, the initial point A1 lies above the adsorption curve, indicating an adsorption supersaturated state. In this scenario, maintaining initial pressure constant allows for the production of free gas until the adsorption quantity decreases to point A2 on the curve, reaching adsorption saturation. Subsequently, as pressure decreases, adsorbed gas desorbs and produces free gas. Conversely, if the actual gas content is lower, the initial point A3 lies below the adsorption curve, indicating an adsorption undersaturated state. To reach the critical desorption pressure point B corresponding to the tested gas content, pressure must be reduced through dewatering, after which further pressure reduction allows for the desorption of adsorbed gas and gas production.

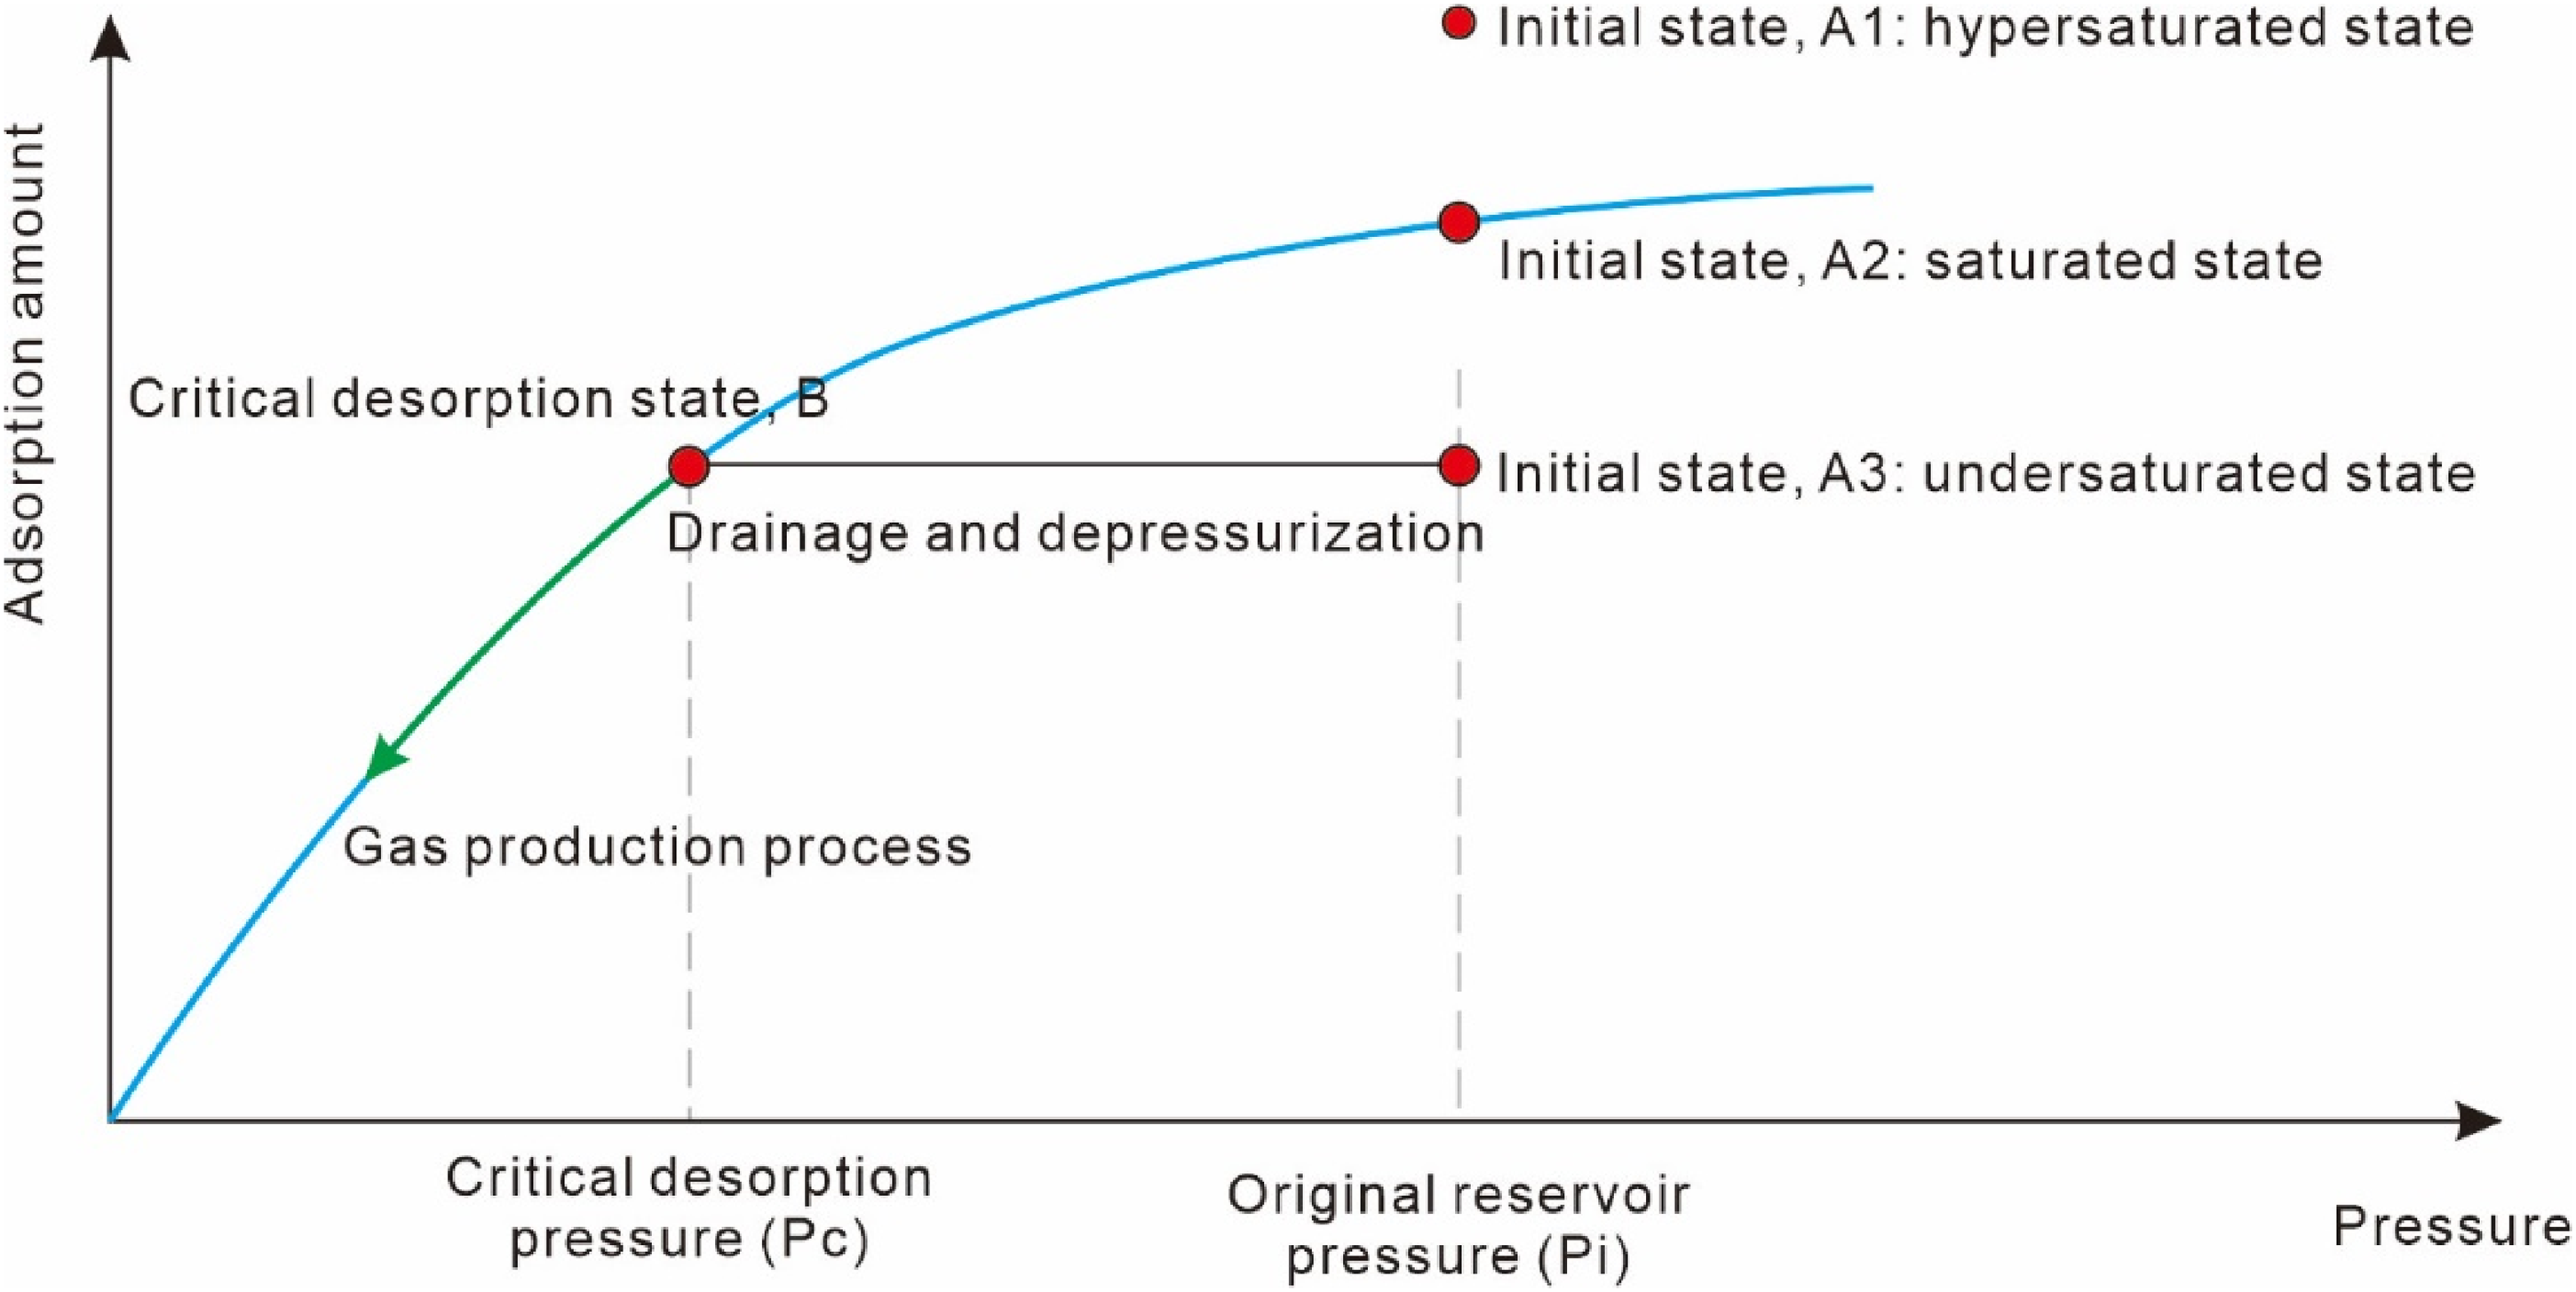
The desorption process based on gas–solid phase adsorption theory.
Where V represents the amount of methane adsorbed, in cm³/g;
According to the gas–solid phase adsorption theory, it is generally believed that most coal seams are in an undersaturated state, which aligns with the desorption characteristics during the production process involving dewatering and pressure reduction. However, the essence of adsorption is the increase in gas density near the solid surface due to the residual force field of the solid surface. When the residual force field on the solid surface balances with the internal force field of the bulk phase, the adsorbed phase and the bulk fluid are in a dynamic equilibrium state. The solid surface cannot adsorb all the single-phase fluid on its surface, meaning that in this theoretical system, free gas and adsorbed gas coexist simultaneously (Figure 3(a)). There is no “undersaturation” or “under-equilibrium” scenario where only adsorbed gas exists without free gas. Therefore, if the adsorption state point is above the adsorption curve (Figure 3(b), same as point A1 in Figure 2), desorption will occur directly upon pressure reduction without a critical desorption phenomenon, leading to inherent contradictions in the theory (Li et al., 2015; Zhu et al., 2017). In summary, the undersaturated state does not conform to the physical adsorption laws of gas adsorption. Furthermore, the presence of water in coal reservoir cleats and fractures under reservoir conditions and after hydraulic fracturing does not align with the assumptions of a gas–solid two-phase medium. Therefore, the gas-phase adsorption theory cannot be directly applied to study the adsorption–desorption process of CBM (Li et al., 2017).
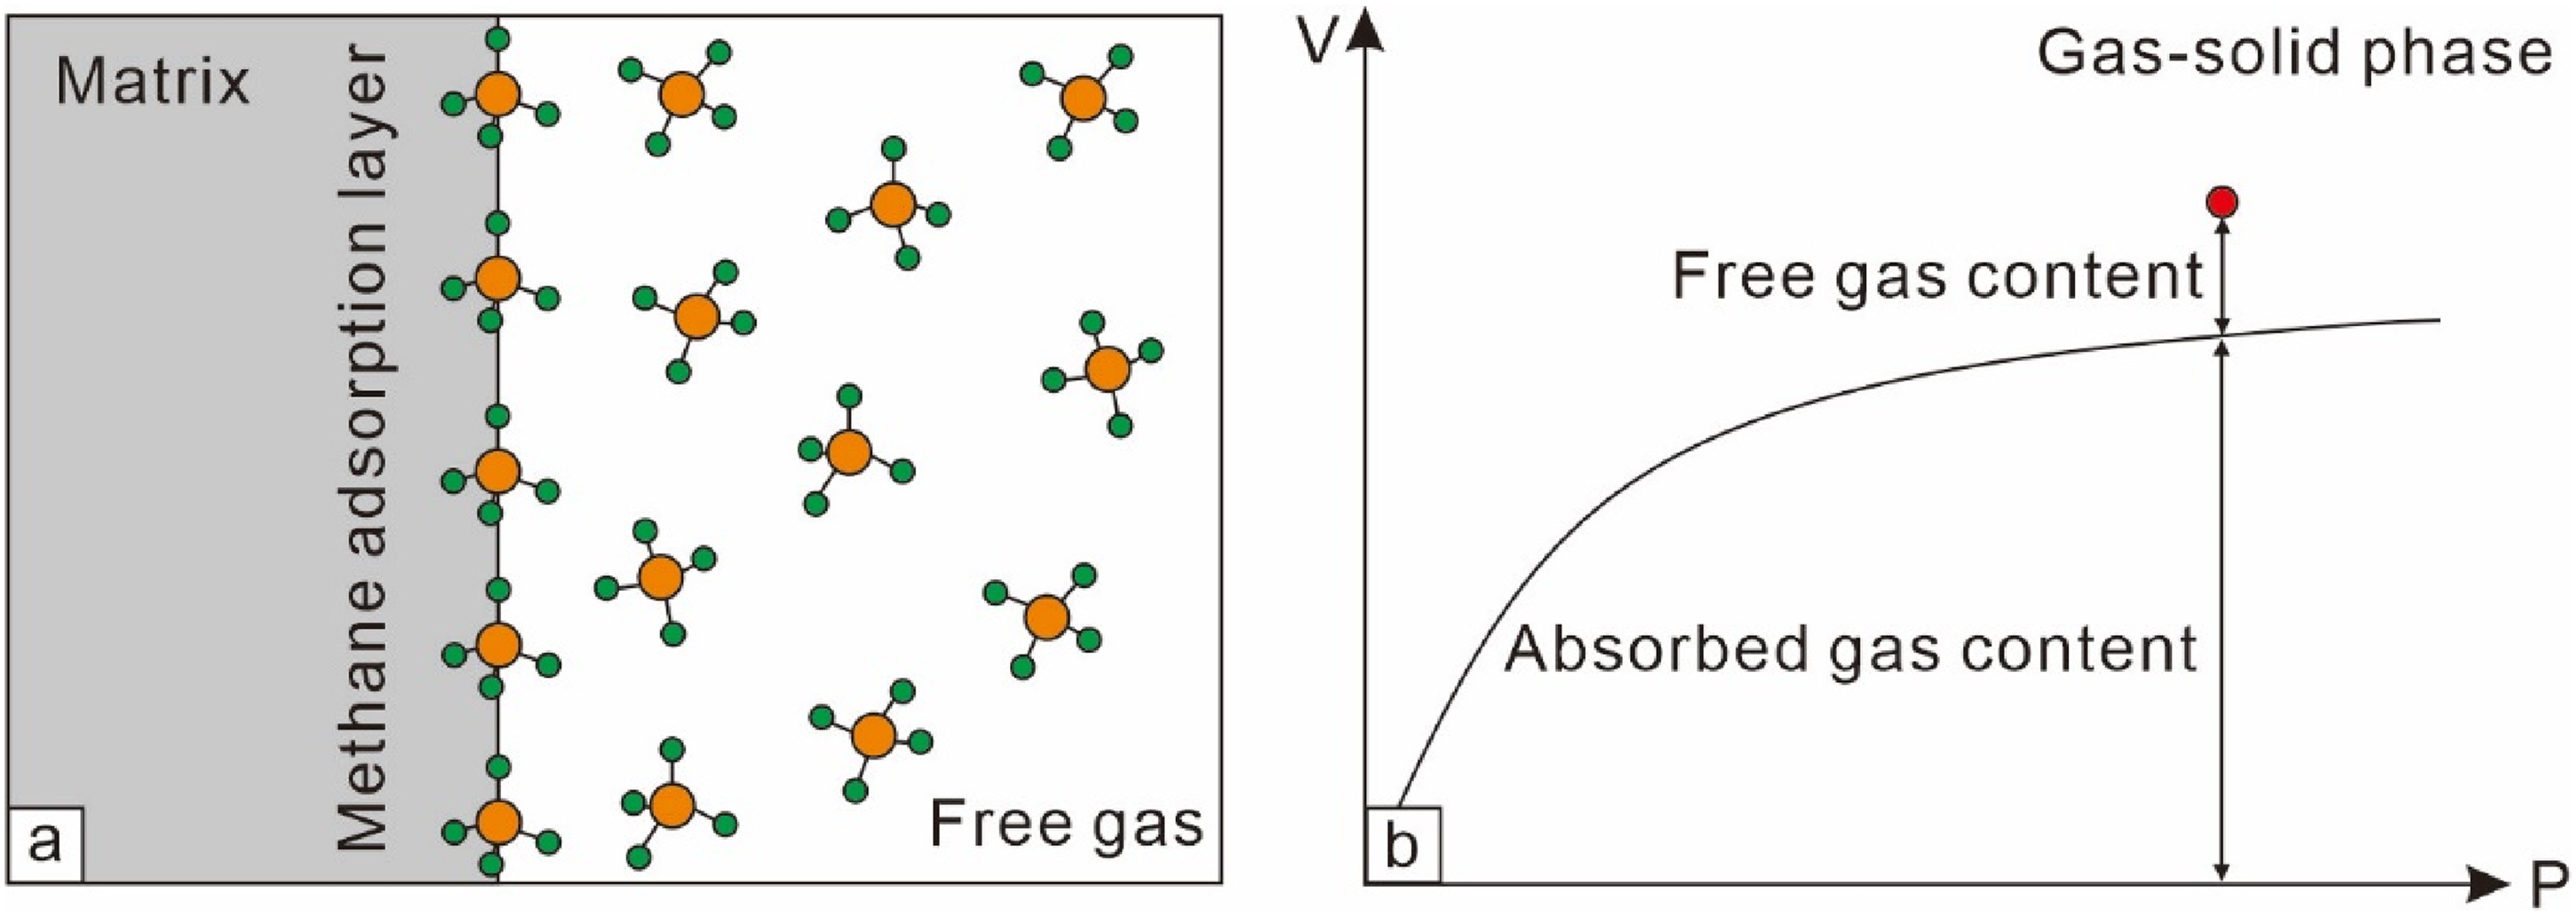
Gas–solid phase adsorption equilibrium sketch map (a) and gas–solid adsorption curve (b).
Liquid–solid phase adsorption theory
In recent years, as the understanding of the impact of water presence in coal reservoirs on CBM adsorption deepened, the gas–solid adsorption theory has been questioned. According to the gas–solid adsorption theory, water molecules entering coal pores or fractures occupy methane transport channels and act as competitive adsorbents, which should reduce the coal's adsorption capacity for methane molecules (Crosdale et al., 2008; Fitzgerald et al., 2005; Kim et al., 2011; Nishino, 2001). However, experimental results have shown the opposite. Sang et al. (2005) conducted isothermal adsorption experiments comparing water-injected coal samples, equilibrium moisture coal samples, and dry coal samples, showing that the adsorption capacity for water-injected samples > dry samples > equilibrium moisture samples. This suggests that liquid water can enhance the coal matrix's ability to adsorb gases. Similarly, Xiao et al. (2011) tested the adsorption of different particle sizes of water-injected coal samples from Yangquan Mining area No. 3 and obtained the same results. Li and Peng (2011) first proposed the theory of liquid phase adsorption of CBM and completed the analysis of the gas production process under this theory. Li et al. (2014), from the comparative study of coalification and shale gas accumulation processes, argued that the adsorption of CBM and shale gas belongs to liquid–solid phase adsorption. Zhu et al. (2015) further proposed that the CBM desorption process is a composite desorption mode of liquid and gas phases.
Extensive experiments have also validated the presence of liquid-phase adsorption theory. The competitive adsorption of methane and water molecules on the surface of coal rock pores is dependent on their wettability, which is controlled by changing the capillary forces to dictate the diffusion and migration of methane and water in coal pores. Murata (1992) proposed that the hydrophilicity of coal rocks tends to weaken with increasing coal rank. However, more and more experiments evidence on coals of different metamorphic grades shows that the wettability angles of coal rocks are generally less than 90 degrees, classifying them as water-wet rocks (Li and Li, 2016; Niu et al., 2018; Zhang et al., 2015). Even in high-rank coals, they are mostly weakly hydrophilic, and some high-rank coals even exhibit smaller wettability angles and stronger hydrophilicity. For instance, Li et al. (2014) determined through dynamic contact angle methods that the contact angles for medium and high-rank coals from Hancheng range from 53 to 68 degrees, and Li et al. (2016) experimentally evaluated the contact angles of high-rank coals from Shanxi Jincheng to be between 94.8 and 105.5 degrees. Based on experimental results, Li et al. (2020) further analyze and demonstrate that the binding force between highly polar water molecules and the minority polar functional groups of coal rock pore solids is much greater than that between methane and the organic matter of the pores, hence leading to a tendency for coal rocks to be water-wet. Zhu et al. (2022) designed an adsorption chamber to verify that water-saturated coal samples could adsorb a significant amount of dissolved methane gas. The upper part of the chamber contained free methane, the bottom part contained a water-saturated coal sample, and the middle part used water to separate the methane from the coal sample. Experiments using coal samples from the Hancheng mining area showed that after loading, free methane dissolved in the water and diffused downward to be adsorbed in the coal sample. Measuring the volume and pressure changes of the free gas and deducting the methane dissolved in water provided the coal sample's liquid-phase adsorption quantity. The results indicated a linear relationship between methane solubility in distilled water from 0 to 10 MPa, and the obtained liquid-phase adsorption curves matched the gas content measurements under reservoir temperature and pressure conditions of dissolution saturation, confirming the validity of the liquid-phase adsorption theory.
The liquid–solid phase adsorption theory refers to the phenomenon where, under coal seam conditions, CBM dissolves in formation water to form a solution, and the coal adsorbs the dissolved CBM from the water onto the matrix surface (Wang et al., 2023). In this theory, the coal's fractures and matrix pores are saturated with formation water, and CBM adsorption is controlled by both dissolution and adsorption, reaching equilibrium between the dissolved and adsorbed states, satisfying the liquid–solid Langmuir equation (Equation (2), Figure 4). Methane's solubility in water is approximately linear with pressure (Equation (3), Figure 4) (Jager and Sloan, 2001; Zhu et al., 2017).


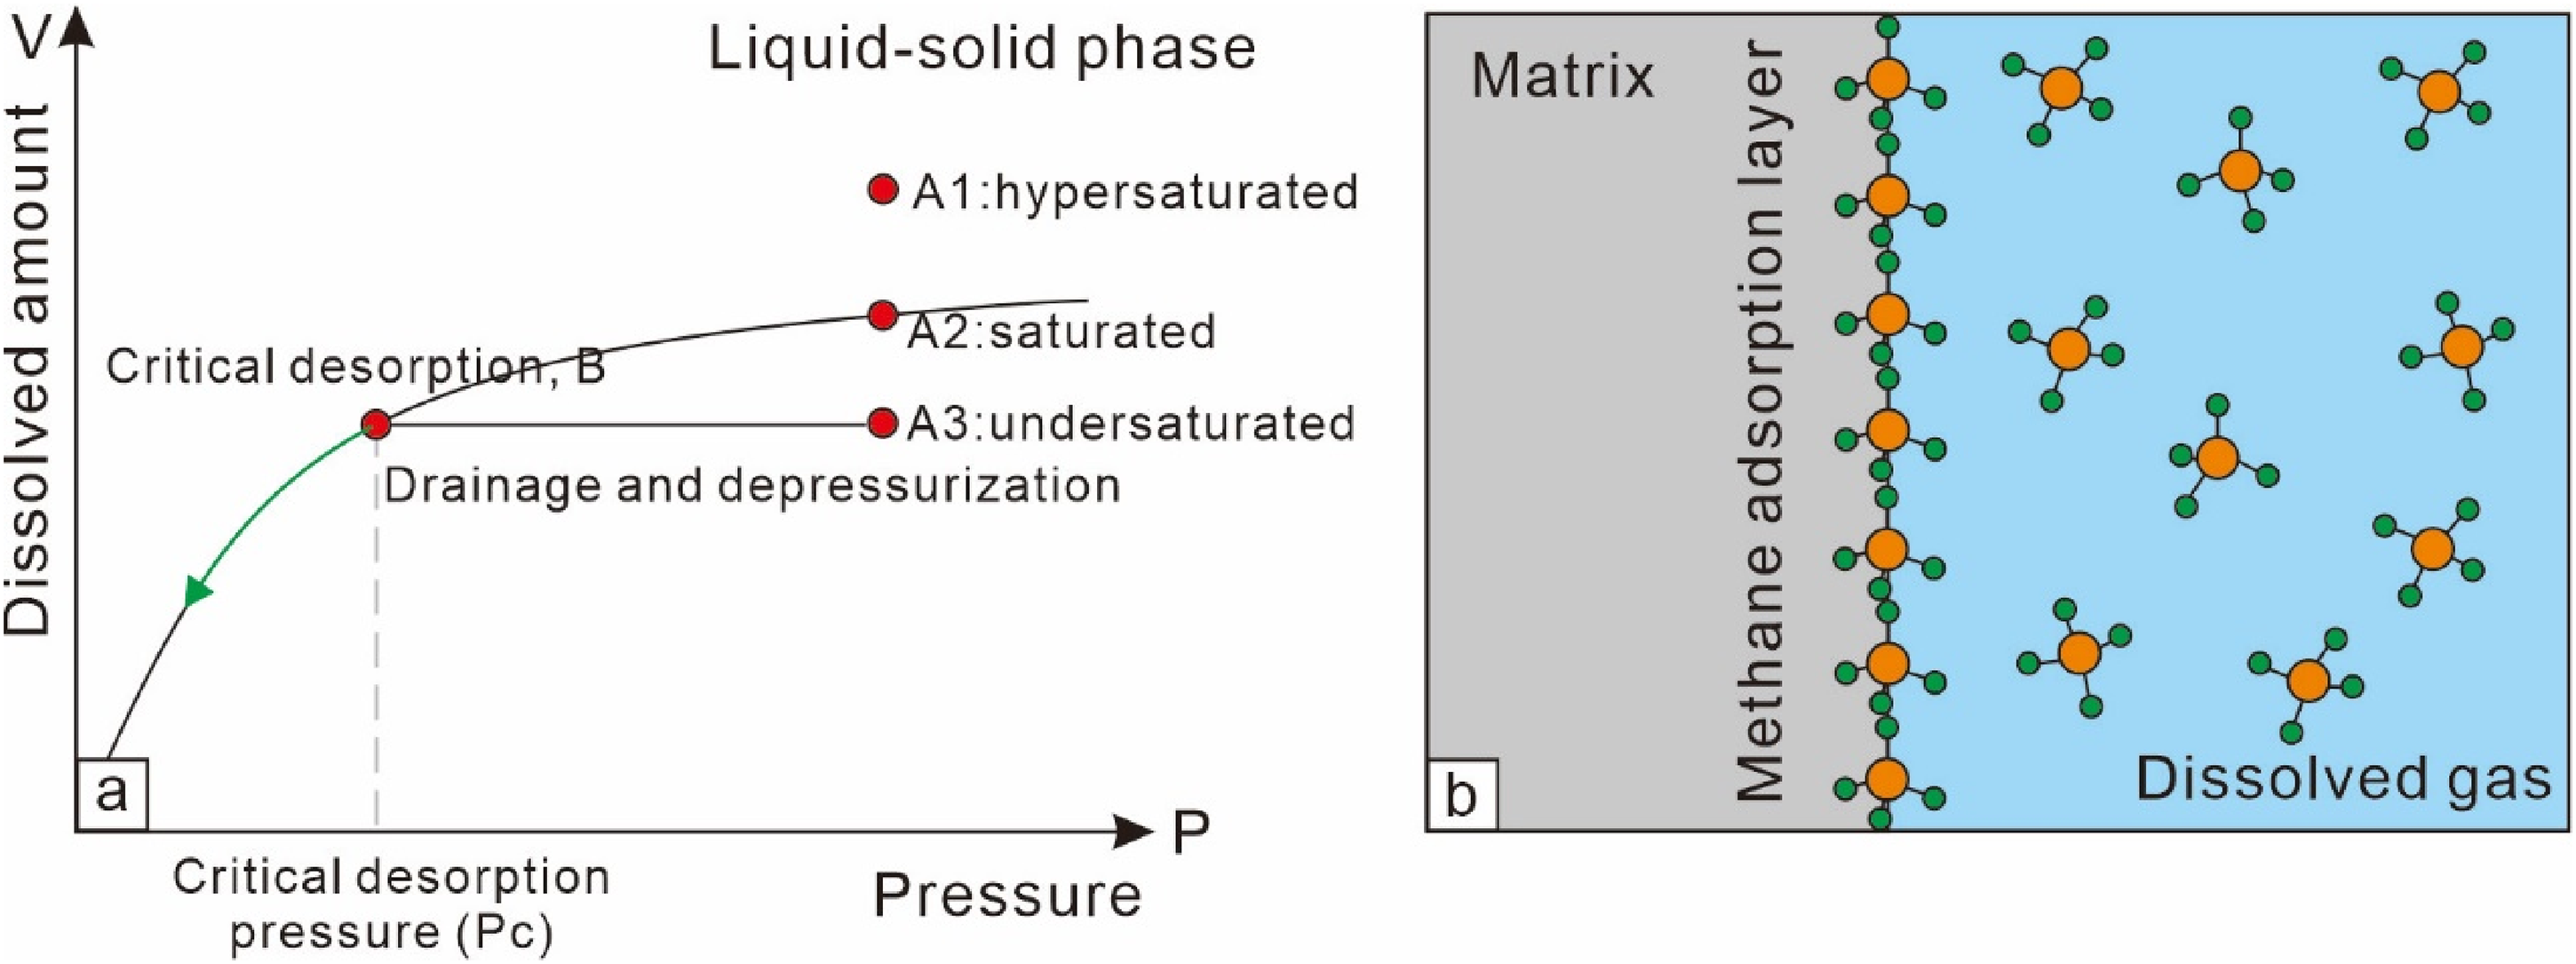
Liquid–solid phase adsorption model. (a). Liquid–solid adsorption curve; (b). Adsorption equilibrium sketch map.
Where
While physical adsorption is characterized by equilibrium adsorption, precluding the existence of an undersaturated state, initial conditions allow for CBM in formation water to exhibit supersaturated (point A1), saturated (point A2), and undersaturated (point A3) states. In an undersaturated state (A3), dewatering and pressure reduction can reach a critical desorption point (B) corresponding to the pressure of saturation concentration, where the concentration remains unchanged. Following this, as pressure drops, the concentration decreases (Figure 4(a)), and dissolved gas starts degassing from the water, which is the critical desorption characteristic required in most actual production scenarios through dewatering and pressure reduction to produce gas. Similarly, in a supersaturated state (A1) where free gas exists, degassing and desorption begin when reaching the saturated dissolution state (A2). Regardless of the dissolution state, throughout the process, liquid-phase adsorption remains in equilibrium, adhering to the laws of physical adsorption. Moreover, in the gas-phase adsorption theory, the adsorption layer and the gas phase both consist of methane molecules, which are nonpolar and attract each other, leading to a loosely arranged methane layer in the adsorption phase (Figure 3(a)). In contrast, the liquid-phase adsorption theory involves methane molecules in the adsorption layer differing significantly in polarity from water molecules. Water molecules tend to repel methane molecules, resulting in a tightly arranged methane adsorption layer (Figure 4(b)) (He et al., 2022). This better explains the experimental results where water-injected coal samples exhibit a higher maximum adsorption capacity than dry coal samples (Sang et al., 2005; Xiao et al., 2011).
The composite desorption model
In practical production, the desorption of CBM remains a dynamic process involving dewatering and pressure reduction. Building on the theories of gas–solid and liquid–solid adsorption, Zhu et al. (2015) proposed the composite desorption model. This model divides CBM desorption into four stages: formation water degassing, liquid-phase desorption of CBM, gas-phase desorption, and transition desorption. It is considered more rational to include the following four processes:
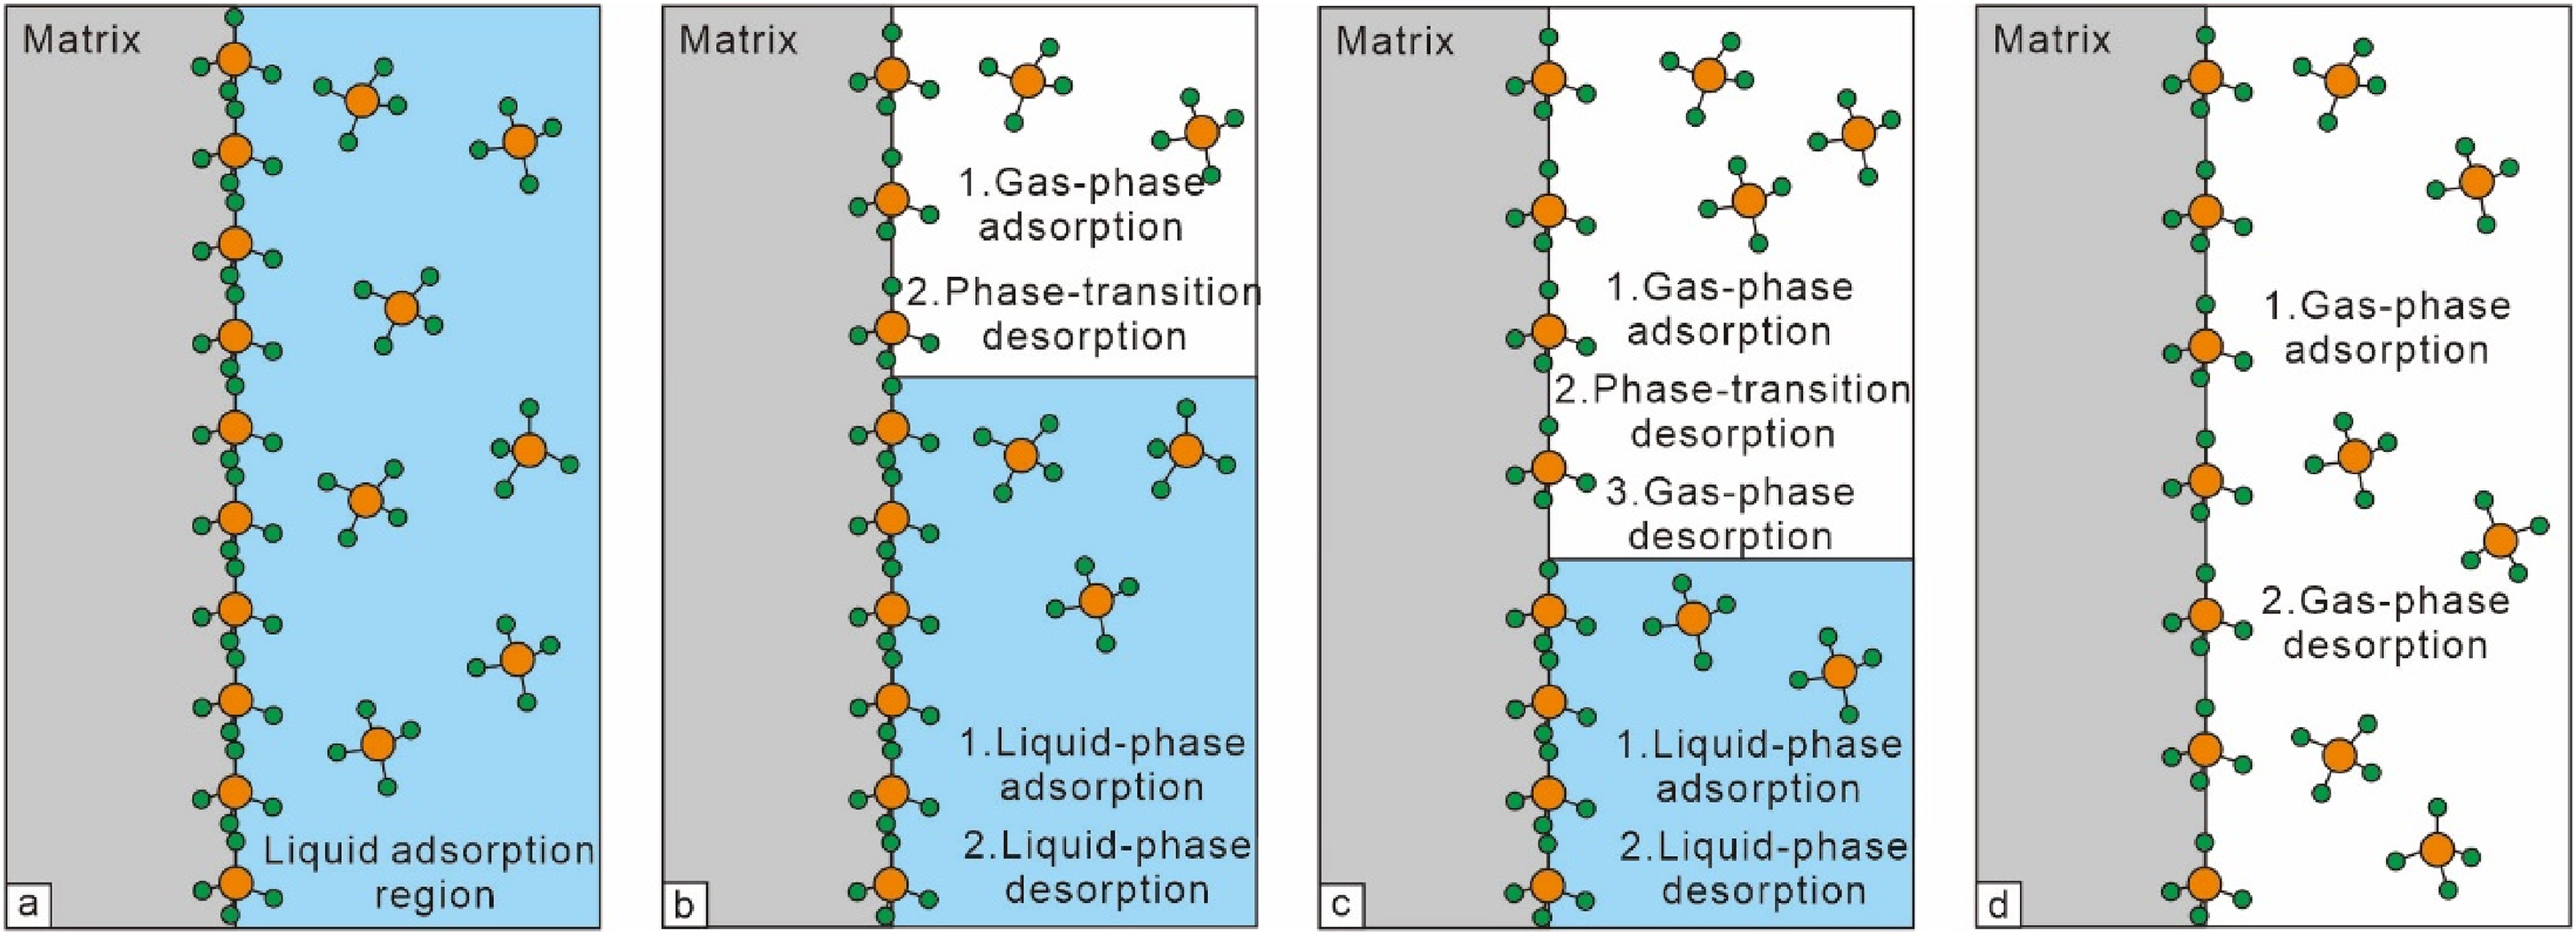
Dynamic change sketch map of the composite desorption model (modified from Zhu et al., 2015).
In summary, the desorption process is jointly controlled by gas-phase adsorption–desorption and liquid-phase adsorption–desorption. Theoretically, it can be divided into four stages: liquid-phase adsorption (including dissolution and adsorption)—liquid-phase desorption (including desorption and degassing)—composite desorption (including liquid-phase desorption, gas-phase adsorption, phase transition desorption, and gas-phase desorption)—gas-phase desorption. Model calculations show that the dynamic curve of composite desorption lies between the curves of gas-phase and liquid-phase desorption, approaching the liquid-phase desorption curve at high pressures and the gas-phase desorption curve at low pressures. The dynamic curve of composite desorption still satisfies the Langmuir equation (Wu et al., 2021; Zhu et al., 2015).
Migration mechanism
The consensus among most CBM practitioners is that CBM production involves three processes: desorption, diffusion, and seepage (Liu et al., 2011; Li et al., 2015, 2017). CBM migration includes diffusion and seepage: it's generally accepted that the diffusion of methane from the matrix micropores to the cleats and fractures follows Fick's law (Sun et al., 2022), driven primarily by concentration gradients, while the flow of free gas is driven by pressure differences; the seepage to the wellbore follows Darcy's law (Sun et al., 2018; Shi et al., 2019). The production process is broadly divided into three stages (Figure 6): (1) Single-phase Flow Stage: The pressure is above the critical desorption pressure, with no desorbed gas present, only water flows in a single phase. (2) Unsaturated Single-phase Flow Stage: With pressure dropping to the critical desorption pressure, adsorbed gas desorbs from the coal matrix, diffuses through micropores to dissolve in water, the water remains unsaturated with gas, continuing to flow in a water phase, but water phase permeability decreases. (3) Saturated Two-phase Flow Stage: As pressure continues to decrease, more desorbed gas saturates the water, forming a continuous gas flow, with gas and water flowing to the wellbore through cleats and fractures in a two-phase flow. This theoretical framework has been widely applied due to its alignment with actual production characteristics. However, the introduction of liquid–solid adsorption and other new theories raises questions about the occurrence of diffusion driven by concentration gradients and describes the seepage process in relatively macroscopic terms, focusing on phase flow changes. In reality, coal seams exhibit various seepage states from microscopic to macroscopic scales across multiple pore sizes.
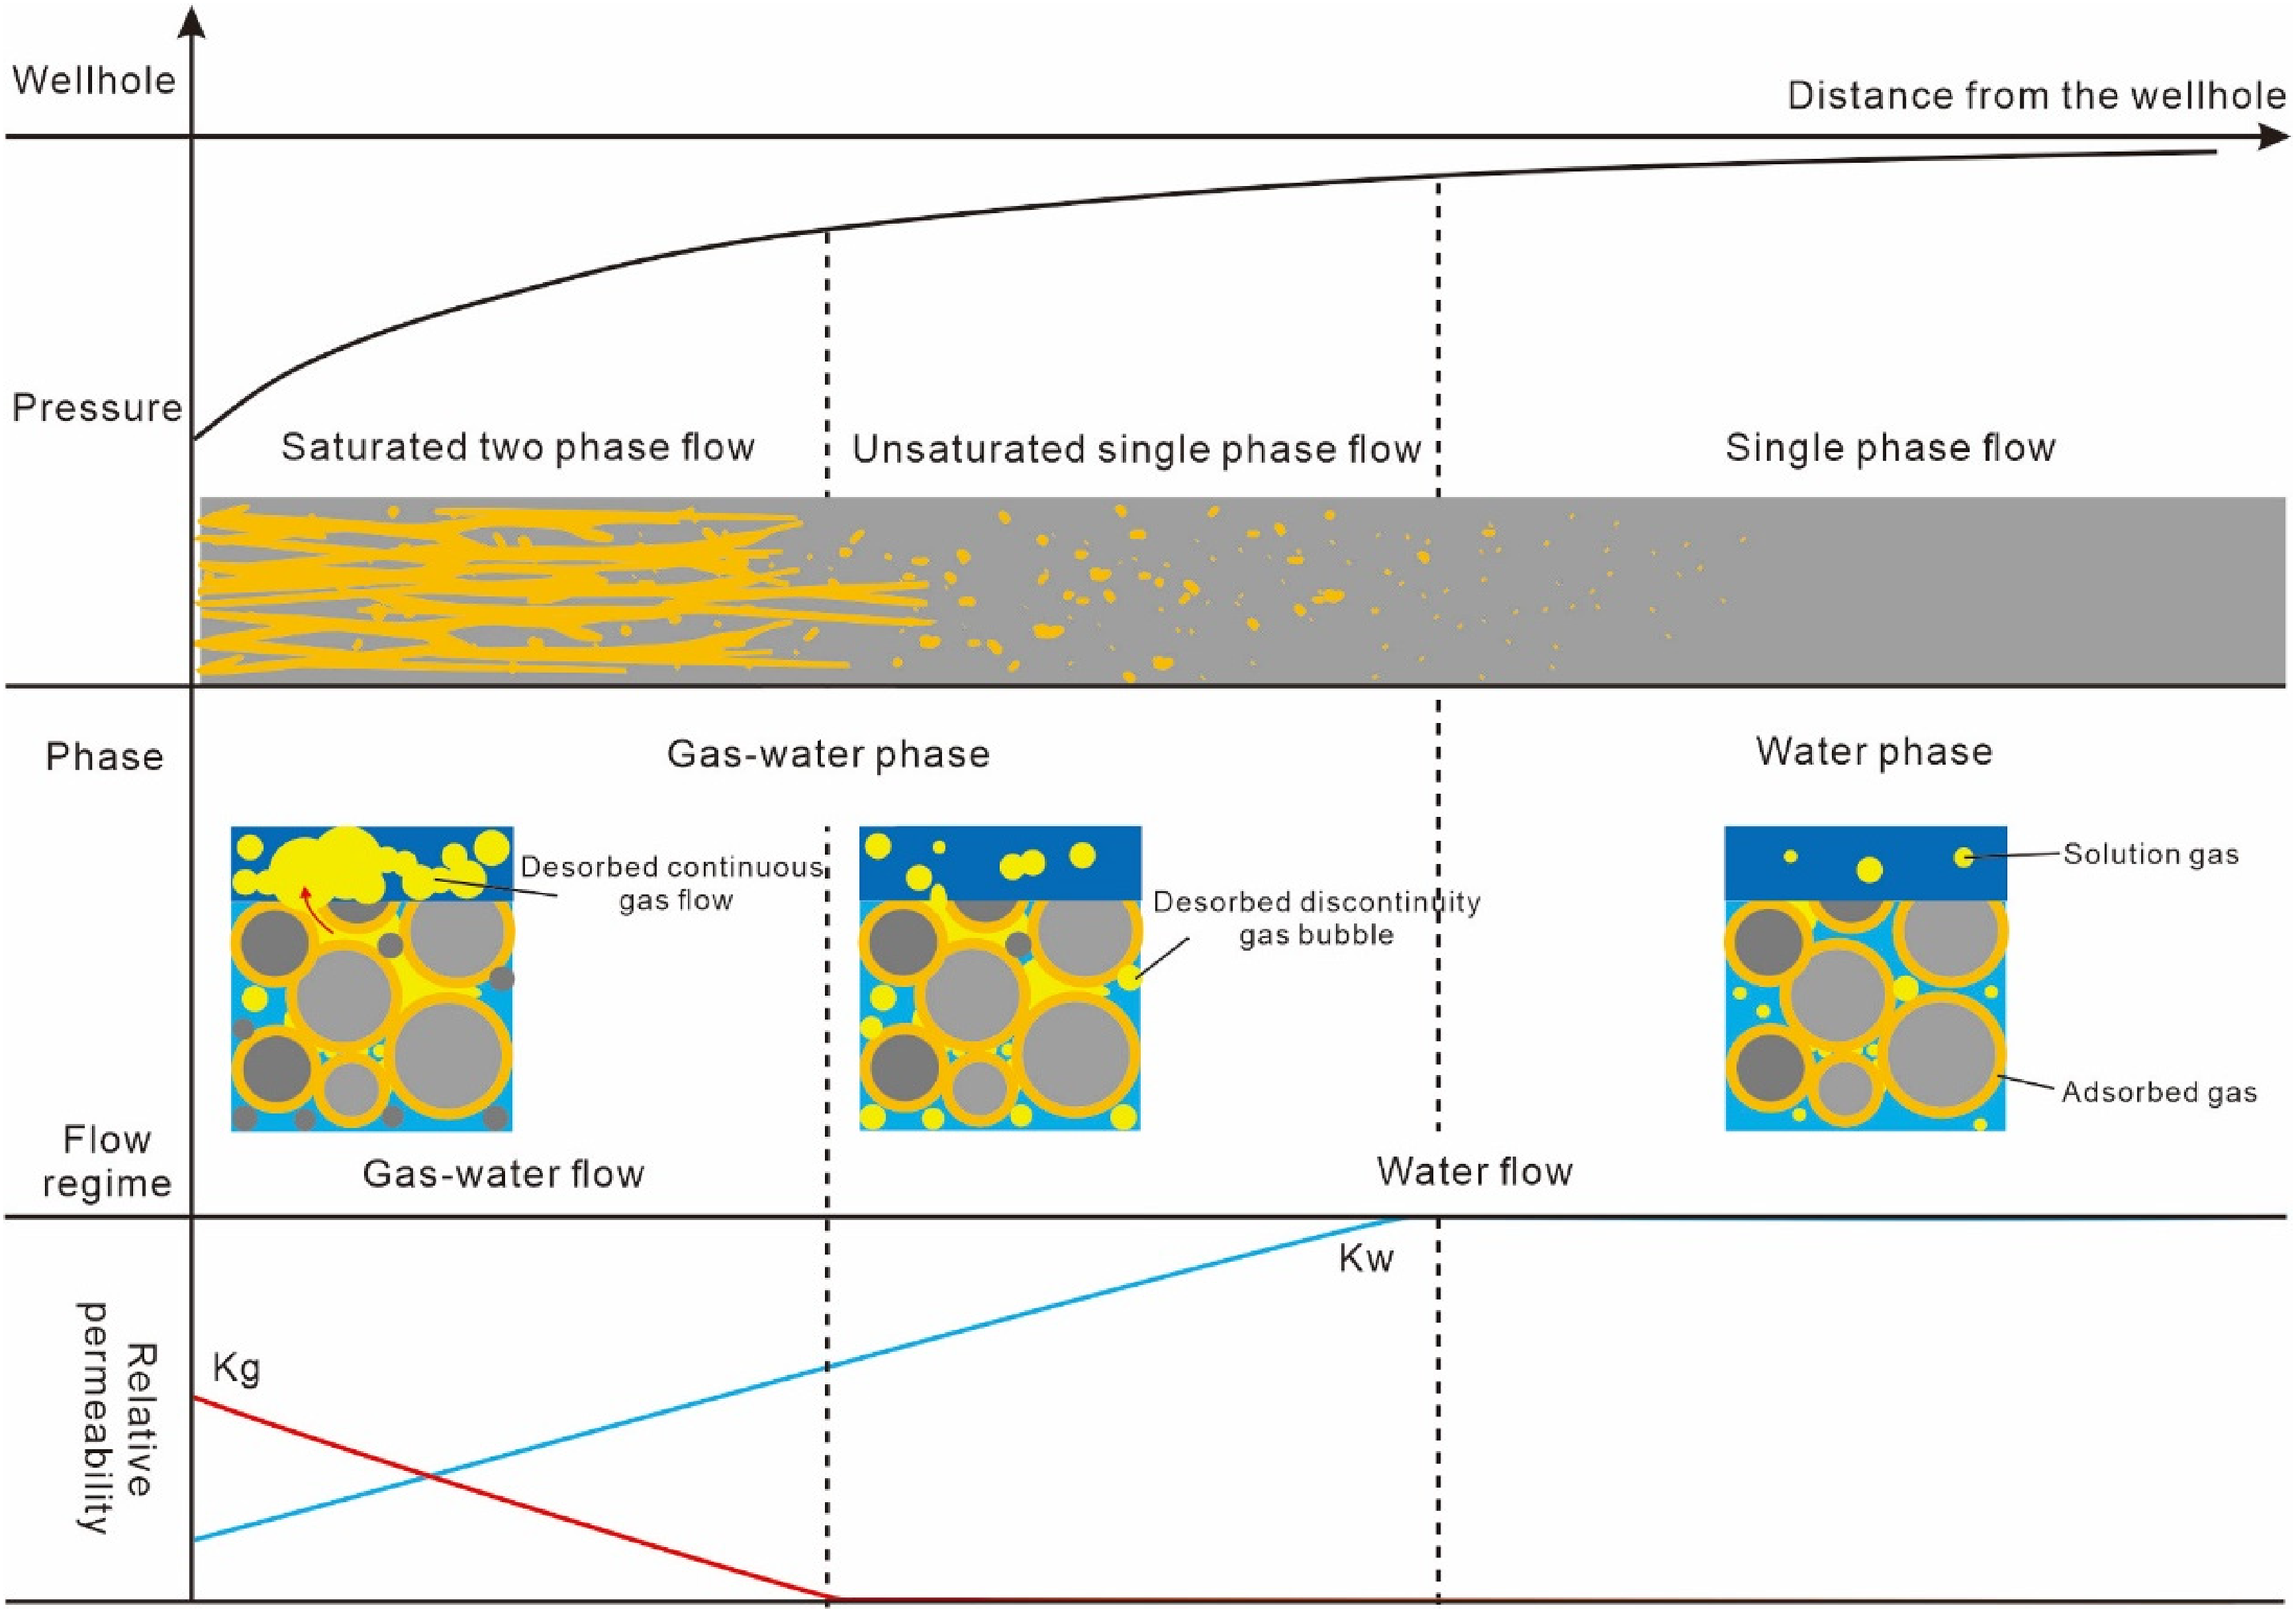
Traditional CBM production model.
Diffusion mechanism
Based on the principles of mass transfer and flow in gas-liquid two-phase fluids, diffusion driven by concentration gradients can only occur within the same phase. Some scholars have questioned whether the conditions for diffusion are met following CBM desorption (Li and Peng, 2011; Liu et al., 2020; Li et al., 2013; Shi et al., 2013). Firstly, from the analysis of the coal reservoir formation process, formation water is present in the matrix pores, indicating the presence of gas-water phases, thus not meeting the single-phase application conditions. Diffusion and convection driven by concentration gradients are only feasible in single-phase fluids or mutually soluble gas-liquid phases. In immiscible or slightly miscible gas-liquid phases, flow is driven by pressure differences (Liu et al., 2020; Shi et al., 2013). Secondly, disregarding the presence of water under the traditional gas–solid adsorption theory, CBM methane content is generally above 95%, with other gases like nitrogen being negligible, essentially negating the presence of a concentration gradient for single-phase gas diffusion. Lastly, under the liquid–solid adsorption theory, during pressure reduction, adsorbed gas desorbs from the matrix pores, increasing methane concentration in the formation water to saturation. It diffuses from high-pressure, high-saturation areas to low-pressure, low-saturation areas as dissolved gas. However, with further pressure reduction, desorbed gas no longer dissolves, and formation water remains in a supersaturated state without further liquid-phase diffusion. As solubility decreases with pressure reduction, degassed gas flows in a gas phase driven by pressure differences. Given methane's low solubility in formation water, theoretically, only a small amount of desorbed gas moves by dissolved-phase diffusion, with the primary migration mode being gas-liquid phase seepage, which can be characterized by Fick's first law (Chen et al., 2023; Shi et al., 2013; Si et al., 2022).
Flow regime
The transportation mechanism within coal reservoirs is complex, involving multi-scale porosities from micro-nano to macro-millimeter levels, including pores, cleats, and fractures (Du et al., 2019; Laubach et al., 1998; Liu et al., 2018; Liu et al., 2015). CBM is primarily adsorbed gas, and during the dewatering and pressure reduction process, it exhibits various flow states including dissolution diffusion and degassing seepage (Li et al., 2022; Wang et al., 2021).
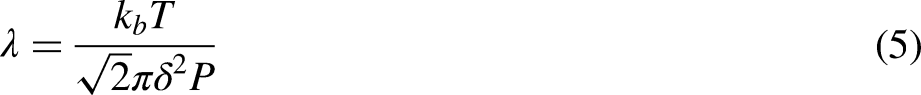
The flow behavior of gases or liquids in porous media is typically classified using the Knudsen number (Kn), which can be described as follows (Equation (4)) (Wei et al., 2011; Yan et al., 2008). This study focuses on the flow and production mechanisms of CBM without considering crystal diffusion. Based on the analysis, dividing the flow into the following four categories is deemed reasonable (Li, 2020; Wei et al., 2011):
Darcy flow: Fick diffusion: Transition flow: Knudsen flow:
Where

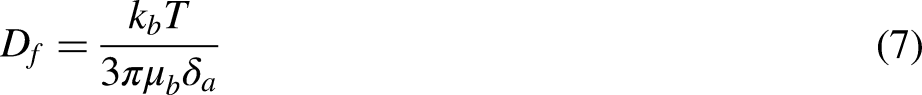
Apart from Darcy flow, which is a macroscopic scale flow conforming to Darcy's law, Knudsen flow, transition flow, and Fick diffusion represent microscopic scale flows in increasingly larger pore diameters and do not conform to Darcy's law. These are considered molecular diffusion movements. After dividing the flow regions according to the Kn number, the diffusion coefficients D for each region can be calculated using the corresponding theoretical equations:
Knudsen diffusion coefficient Fick diffusion coefficient Transition diffusion coefficient
Where D is the diffusion coefficient

Discussion on production mechanism
Building upon the theoretical analyses and incorporating the actual pore-fracture structures, desorption patterns, and gas-water production characteristics of the deep coal reservoirs in the eastern margin of the Ordos Basin, we delve deeper into the mechanisms of desorption, diffusion, and seepage leading to the production of deep CBM.
Pore and fracture structure characteristics
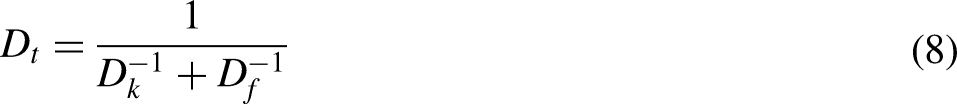
Employing a variety of experimental techniques such as whole-diameter CT scanning, micro-CT scanning, Focused ion beam - scanning electron microscope (FIB-SEM), and Argon ion polishing emission - scanning electron microscope (Ar-SEM), multi-scale digital core technologies were used for scanning and analyzing coal rock samples. Observations of deep coal rock cores within the study area identified coal types as bright and semi-bright coal, with native coal body structures. Cleats and irregular fractures were notably developed, with face cleats ranging from 6 to 10 per 10 cm, end cleats from 3 to 11 per 10 cm, and irregular fractures from 2 to 3 per cm². whole-diameter CT scanning revealed the development of macroscopic millimeter-level cleats and fractures, predominantly consisting of low-to-high angle fractures, with fracture widths between 0.85 and 2.41 mm (average 1.4 mm), and fracture apertures ranging from 4.38 to 266 μm (average 77.20 μm). Some fractures were filled, resulting in an effective fracture porosity of 3.01%. Cleat widths varied from 0.81 mm to 1.95 mm, averaging 1.36 mm (Figure 7). Various methods, including Micro-CT scanning, and scanning electron microscope, showcased micro-scale coal matrix pores at micro and nano scales, with micropores primarily around 2–2.5 μm and nanopores mainly between 10 and 100 nm, with throat radii predominantly between 1.5 and 2 μm (Figure 7). According to mercury intrusion data, gas flow requires overcoming capillary forces ranging from 0.14 to 0.37 MPa with production pressure differences. NMR under ambient temperature and pressure conditions, before and after centrifugation using T2 spectra, indicated that movable fluid porosity yield was merely 27.9%.
The typical pore-fracture structure images. (a) Whole-dimeter CT scanning. (b) Micro-CT scanning. (c) Focused ion beam-scanning electron microscope (FIB-SEM). (d) Argon ion polishing emission - scanning electron microscope (Ar-SEM).
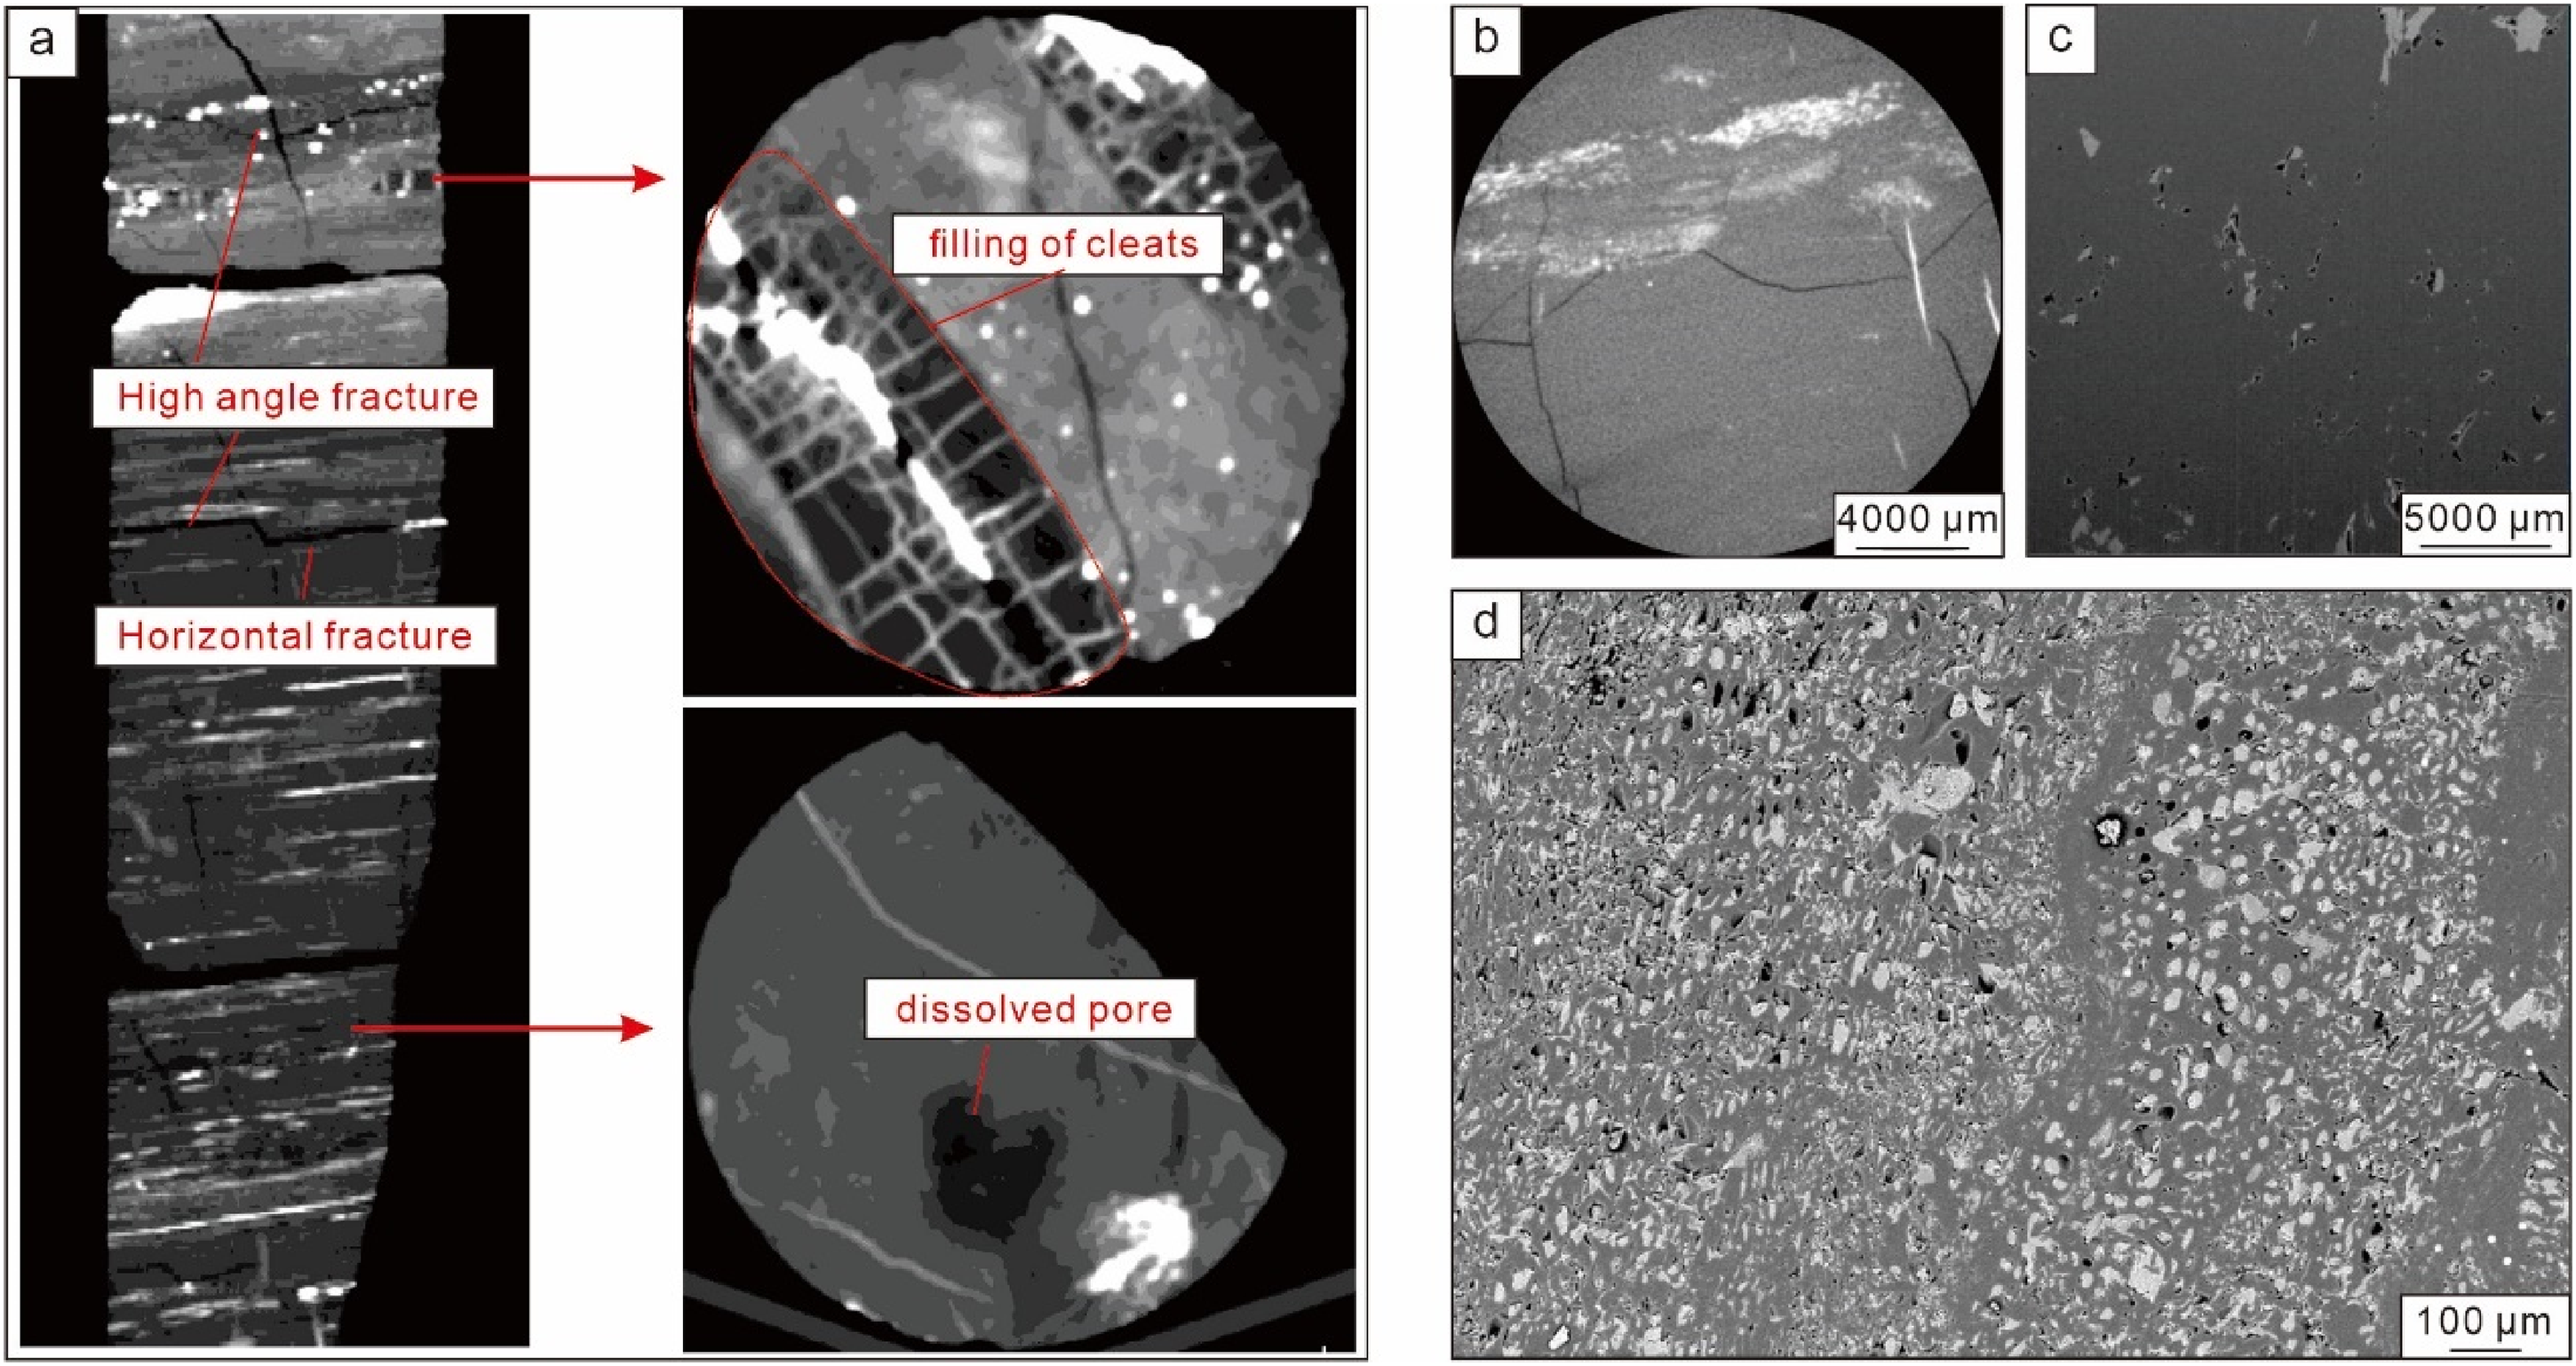
Adhering to the Chinese industry standard NB/T 14008-2021 for determining the full pore size distribution in shale using the mercury intrusion-porosimetry and adsorption combined method, the pore size distribution segments for multi-scale stitching were identified: CO2 adsorption for pores smaller than 2 nm, N2 adsorption for 2–50 nm, high-pressure Hg injection for 50–2000 nm, and micro-CT scanning for sizes above 2000 nm. The results regarding pore volume and specific surface area distribution indicated that the adsorptive contribution of deep coal rock is primarily from micropores below 2 nm, accounting for over 99% of the total, while larger pores above 50 nm serve as the primary storage and migration space for desorbed free gas (Figure 8).
Full scale pore diameter splicing diagram.
Discussion on desorption mechanism
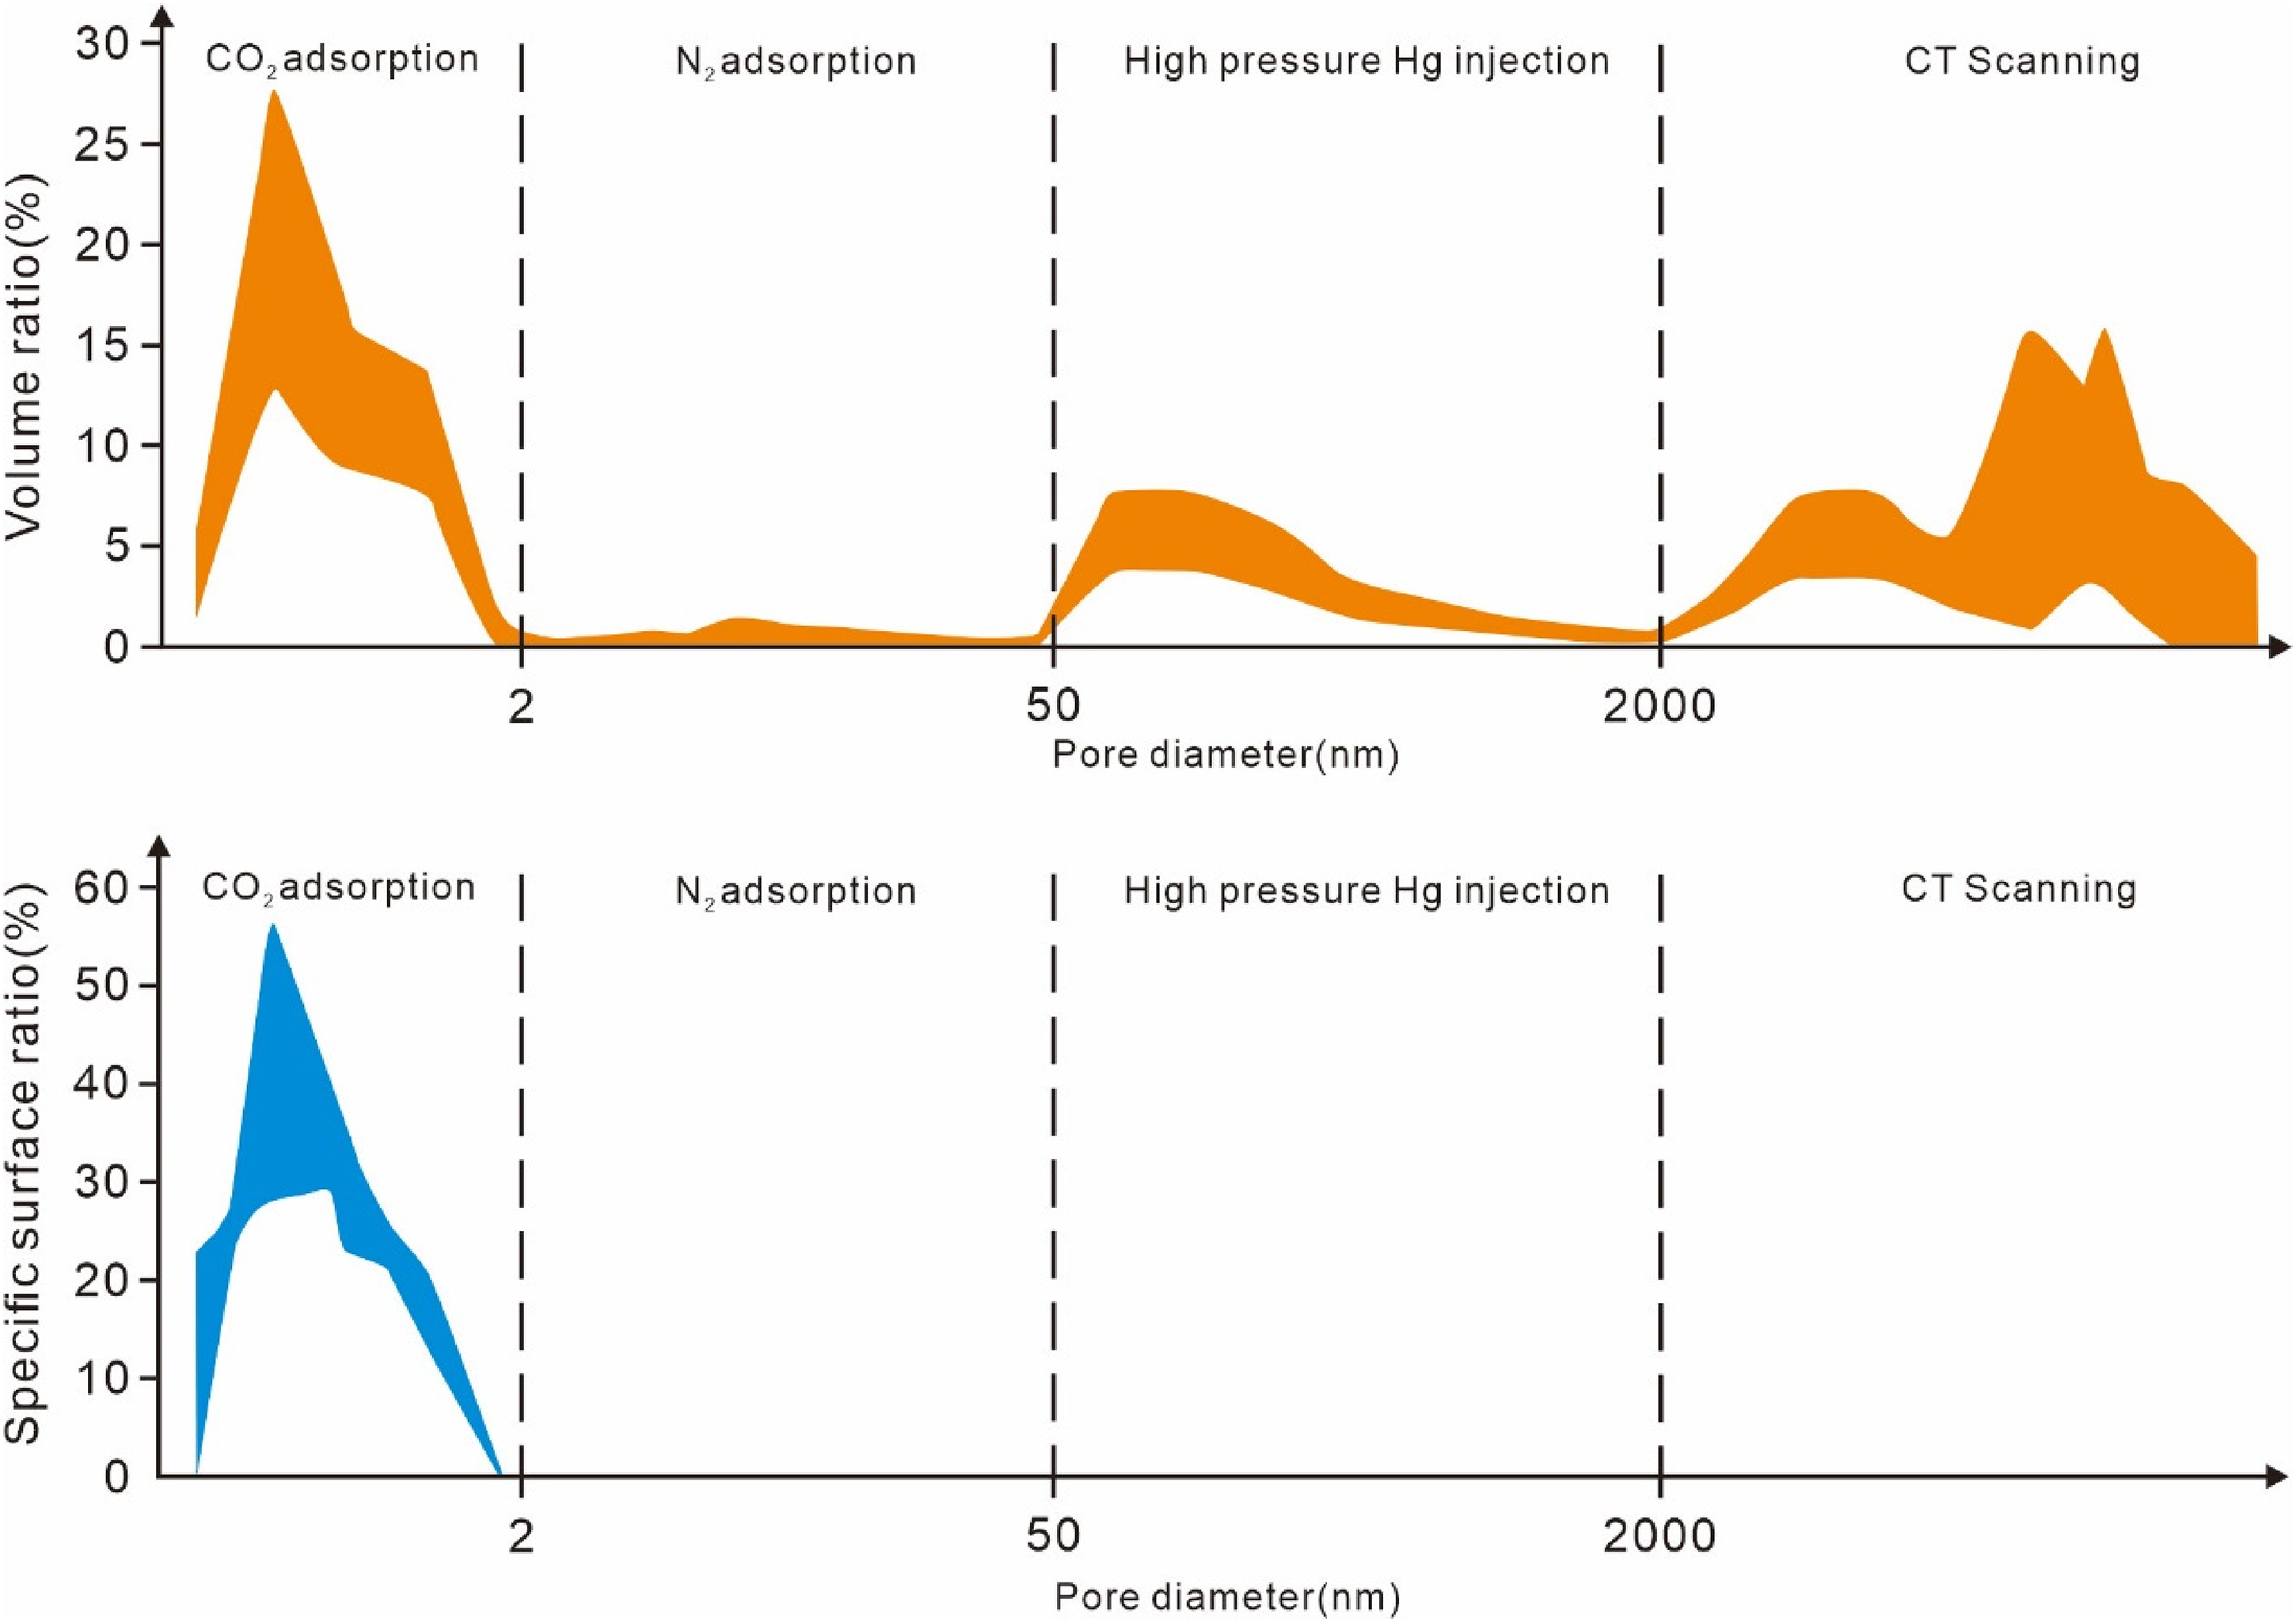
In the study area, two significantly different fracturing techniques were employed, each showcasing distinct desorption characteristics. Under conventional fracturing conditions (flow rate of 10 m³/min, fluid volume of 1500 m³, and sand volume below 50 m³), the actual desorption pressure linearly correlates with structural elevation (Figure 9(a), blue circles). However, the inclination of layers shallower than 2000 meters (indicated by the blue solid line in Figure 9(a)) is noticeably higher than that of the deeper layers below 2000 meters (indicated by the blue dashed line in Figure 9(a)). In planar terms, lower structural positions in the low concave and gentle areas in the northern flat belt exhibited immediate casing pressure upon production (Figure 9(b)). With large-scale fracturing (flow rate of 15 m³/min, fluid volume of 3000 m³, and sand volume above 200 m³), gentle and depressed areas in lower structural positions also showed immediate casing pressure upon production. Similarly, higher structural positions in slope and uplifted areas exhibited this characteristic, with the actual desorption pressure of other wells increasing by 2–5 MPa compared to adjacent conventional fracturing wells. Some vertical cluster wells and all horizontal wells achieved self-spraying production. The actual desorption pressure shows a weak correlation with the structural configuration (indicated by red circles in Figure 9(a)).
Scatter diagram between desorption pressure and 8# coal seam roof buried depth (a) and desorption pressure plane contour map (b).
Currently, the liquid–solid adsorption desorption theory involves complex mechanisms with limited related research, primarily theoretical with no mature experimental data available for reference. Existing isothermal adsorption experiments in the area are still based on the gas–solid adsorption theory. Combining previous studies for comprehensive speculative analysis, Fan et al. (2011) proposed that methane solubility undergoes a three-stage evolution process with temperature: a slow decrease from 0 to 80 °C, a rapid increase from 80 °C to 150 °C, and a slow increase above 150 °C. With pressure, solubility continuously rises but gradually levels off, indicating that theoretically, methane solubility with temperature and pressure changes has an upper limit, deviating from the near-linear relationship described by Equation (3). Wang et al. (2016) discussed the impact of mineralization on methane solubility under different pressure conditions, noting a continuous decline in solubility within a mineralization range of 0.25–15 × 104 mg/L.
In the study area, the deep No. 8 coal seam has a pressure range of 19.5 to 22.5 Mpa and a temperature range of 65 to 73 °C. The mineralization linearly correlates with the structure, with the planar and desorption pressure change patterns being essentially consistent. The southeastern uplift area has the lowest mineralization at only 5 × 10⁴ mg/L, while the northwestern depression area reaches up to 30 × 104 mg/L. Under the original temperature and pressure conditions of the No. 8 coal seam in this area, the highest methane solubility is about 2m³/m³, decreasing with increasing mineralization and also showing a declining trend with decreasing pressure (Fan et al., 2011; Wang et al., 2016). Based on the theory of liquid–solid adsorption desorption, it is believed that in flat and depressed areas with high mineralization and extremely low methane solubility (Wang et al., 2016), free gas may exist under high temperature and pressure conditions, resulting in immediate casing pressure seen upon production near conventional fracturing wells. In slope and uplift areas with lower mineralization and slightly higher methane solubility, conventional fracturing did not show casing pressure, but large-scale fracturing caused a significant pressure drop over a wide area by breaking the pressure dissolution and adsorption equilibrium, leading to the phenomenon of immediate casing pressure upon production.
Given the primary reference to methane solubility and degassing in the process of liquid–solid adsorption desorption, there is currently no practical composite desorption curve for reference. It is generally believed to still conform to the Langmuir equation. Here, combining existing traditional isothermal adsorption curves for further quantitative analysis is considered, but it's noted that due to the competitive adsorption of water vapor molecules in gas–solid adsorption equilibrium coal samples, theoretically, the test isothermal adsorption curves are lower than actual liquid–solid adsorption curves, thus the calculated values serve only as a reference. Zhang et al. (2013) and Meng et al. (2014) proposed a method to quantify the desorption stages based on changes in the curvature of the isothermal adsorption curve, using mathematical methods to solve for one stationary point of the first derivative of curvature and two inflection points of the second derivative to identify three key pressure points: start-up pressure, inflection pressure, and sensitive pressure. This approach divides the desorption curve into four stages: inefficient desorption, slow desorption, fast desorption, and sensitive desorption, which has been widely applied in recent years and aligns with actual desorption patterns, providing valuable production guidance (Yu et al., 2018).
In the study area, the deep No. 8 coal seam's three key pressure points are 8.74, 5.67, and 2.26 MPa, respectively (Figure 10). The production process forms pressure drop funnels at different locations corresponding to different desorption states, dynamically changing with pressure reduction. Calculations of the proportion of desorbed gas in different desorption stages at various reservoir pressures revealed a gradation corresponding to the distance from the wellbore and varying from low to high pressure: Near the wellbore, where the pressure is lowest, almost all the pressure drops to or below the sensitive pressure, dominated by sensitive desorption, accounting for over 92.37%. Between the sensitive and start-up pressures, at the inflection pressure, the proportion of sensitive desorption drops to 69.55% and fast desorption increases to 30.01%. Reaching the start-up pressure, sensitive desorption drops to 61.94%, fast desorption to 26.73%, and slow desorption increases to 11.33%. At the far end near the pressure drop funnel boundary, only the area reaching the strat-up pressure has adsorbed gas that can be desorbed, with only inefficient desorption at a maximum of 9.90%. Hence, most desorbed gas is produced after reaching the inflection pressure, with the highest proportion of sensitive desorption due to the largest production pressure difference, always above 60%. This suggests that rapid pressure reduction near the wellbore can quickly desorb gas into free gas, leading to immediate casing pressure upon production. However, if the pressure drop is not effectively expanded, insufficient desorbed gas supply may not ensure stable production. Therefore, to achieve long-term stable production, it is essential to maximally expand the pressure drop funnel so that most areas reach below the inflection and sensitive pressures, thereby maximizing the ultimate EUR of gas wells.
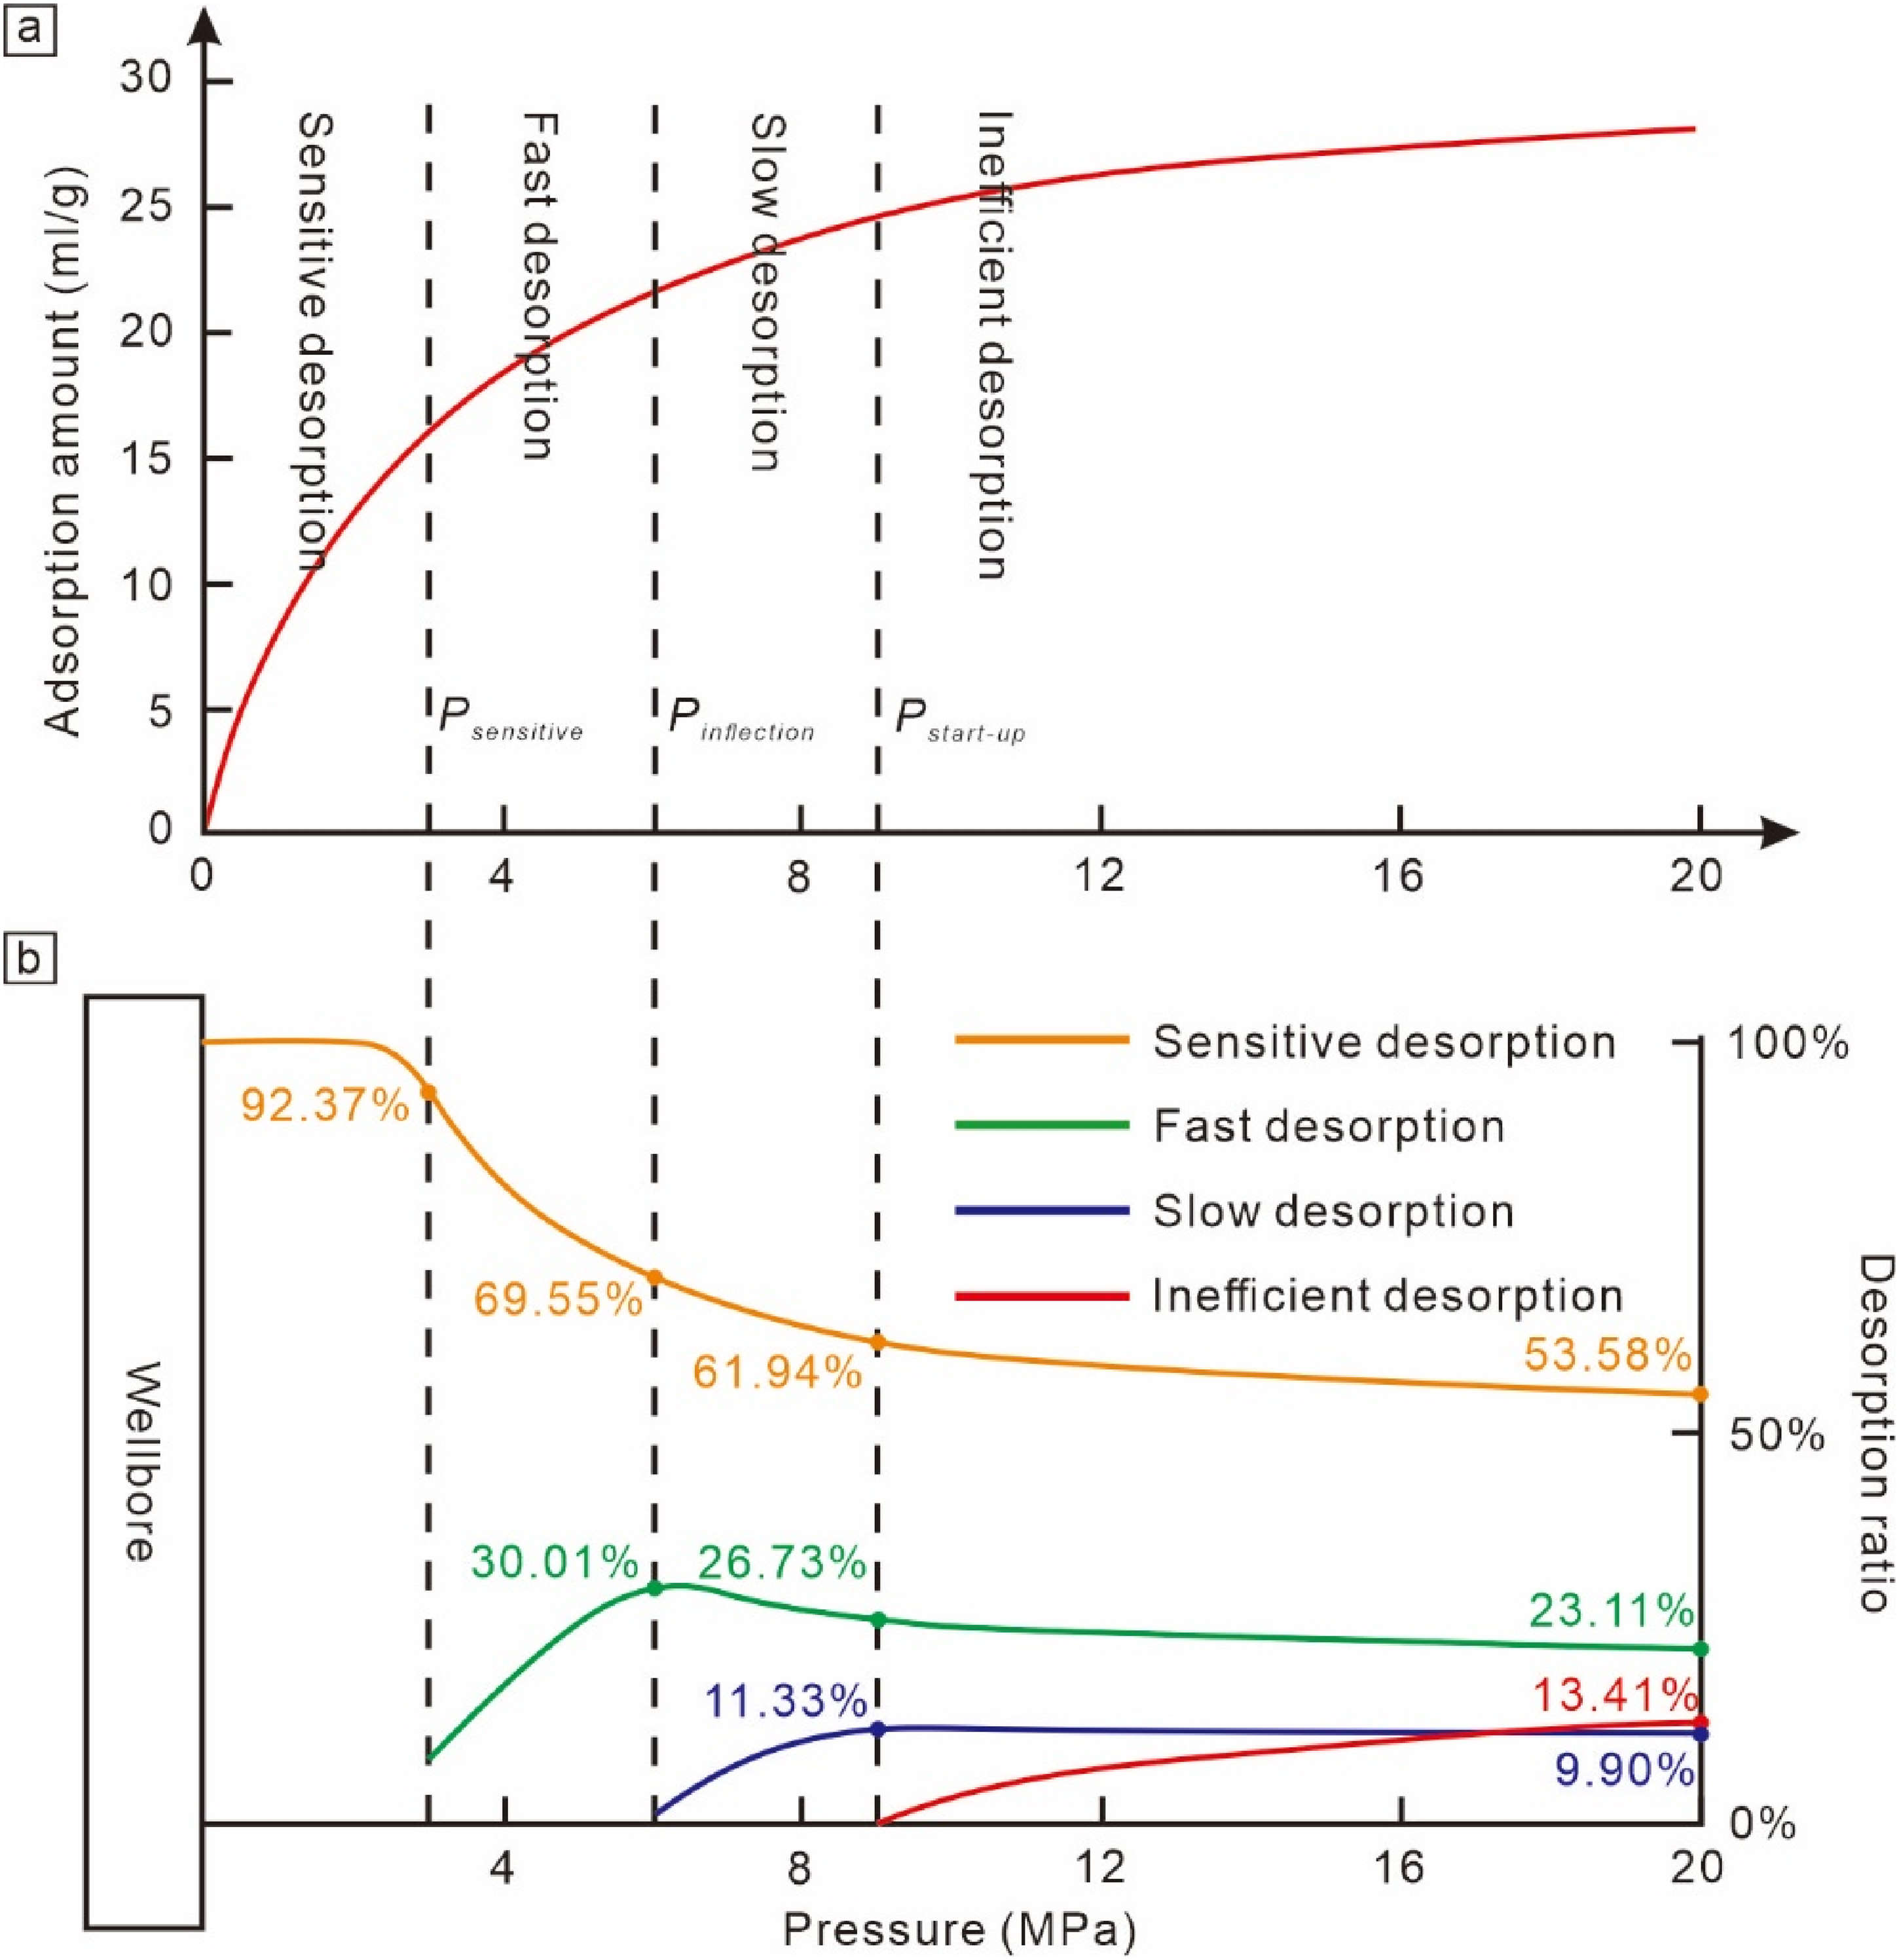
Division of desorption stages in isothermal adsorption curves (a). The proportion of desorption gas in different stages under different reservoir pressure conditions (b).
Discussion on migration mechanism
The discussion on the transport mechanisms within coal reservoirs, particularly focusing on the multi-scale porosity seepage, is a current research hot spot. Many experiments have verified the theory of serial multi-scale seepage mechanisms for coalbed gas, indicating that gas first flows out from larger pores and fractures, gradually from smaller pores, down to nano-scale pores (Du et al., 2020; Hu et al., 2023; Jing et al., 2020; Liu et al., 2021; Li et al., 2023; Zhu et al., 2017). In the deep No. 8 coal seam of the study area, a full-scale distribution of pores and fractures exists, with cleats and fractures on the micro-to-millimeter scale and pores primarily on the nano-to-micro scale. The flow state of gas molecules within these pores, cleats, and fractures is determined by the ratio of the methane molecule's mean free path to the pore diameter, or the Kn (Baek and Akkutlu, 2019; Chen et al., 2018; Jin and Firoozabadi, 2015).
Firstly, the mean free path of methane molecules is related to the reservoir's temperature and pressure changes (Schloemer and Krooss, 2004; Sun et al., 2023; Figure 11). Using Equation (5), the mean free path of methane molecules under conditions of 20 MPa pressure and 70 °C temperature was calculated, showing a linear but slow increase with temperature, with a mean free path of about 0.5 nm between 60 °C and 70 °C. The increase in the mean free path is significantly greater with decreasing pressure, dominating the effect, with a mean free path of about 2.07 nm at a drop to 3 MPa, followed by a sharp rise. Theoretically, with both methane and water molecules present in the pores, gas seepage requires a certain number of methane molecules to form gas nuclei (minimum diameter 10 nm) or bubbles. For 50 nm pores, the number of methane molecules is about 1/50th that of water molecules, suggesting that methane gas in such pores is unlikely to participate in seepage (Liu et al., 2020).
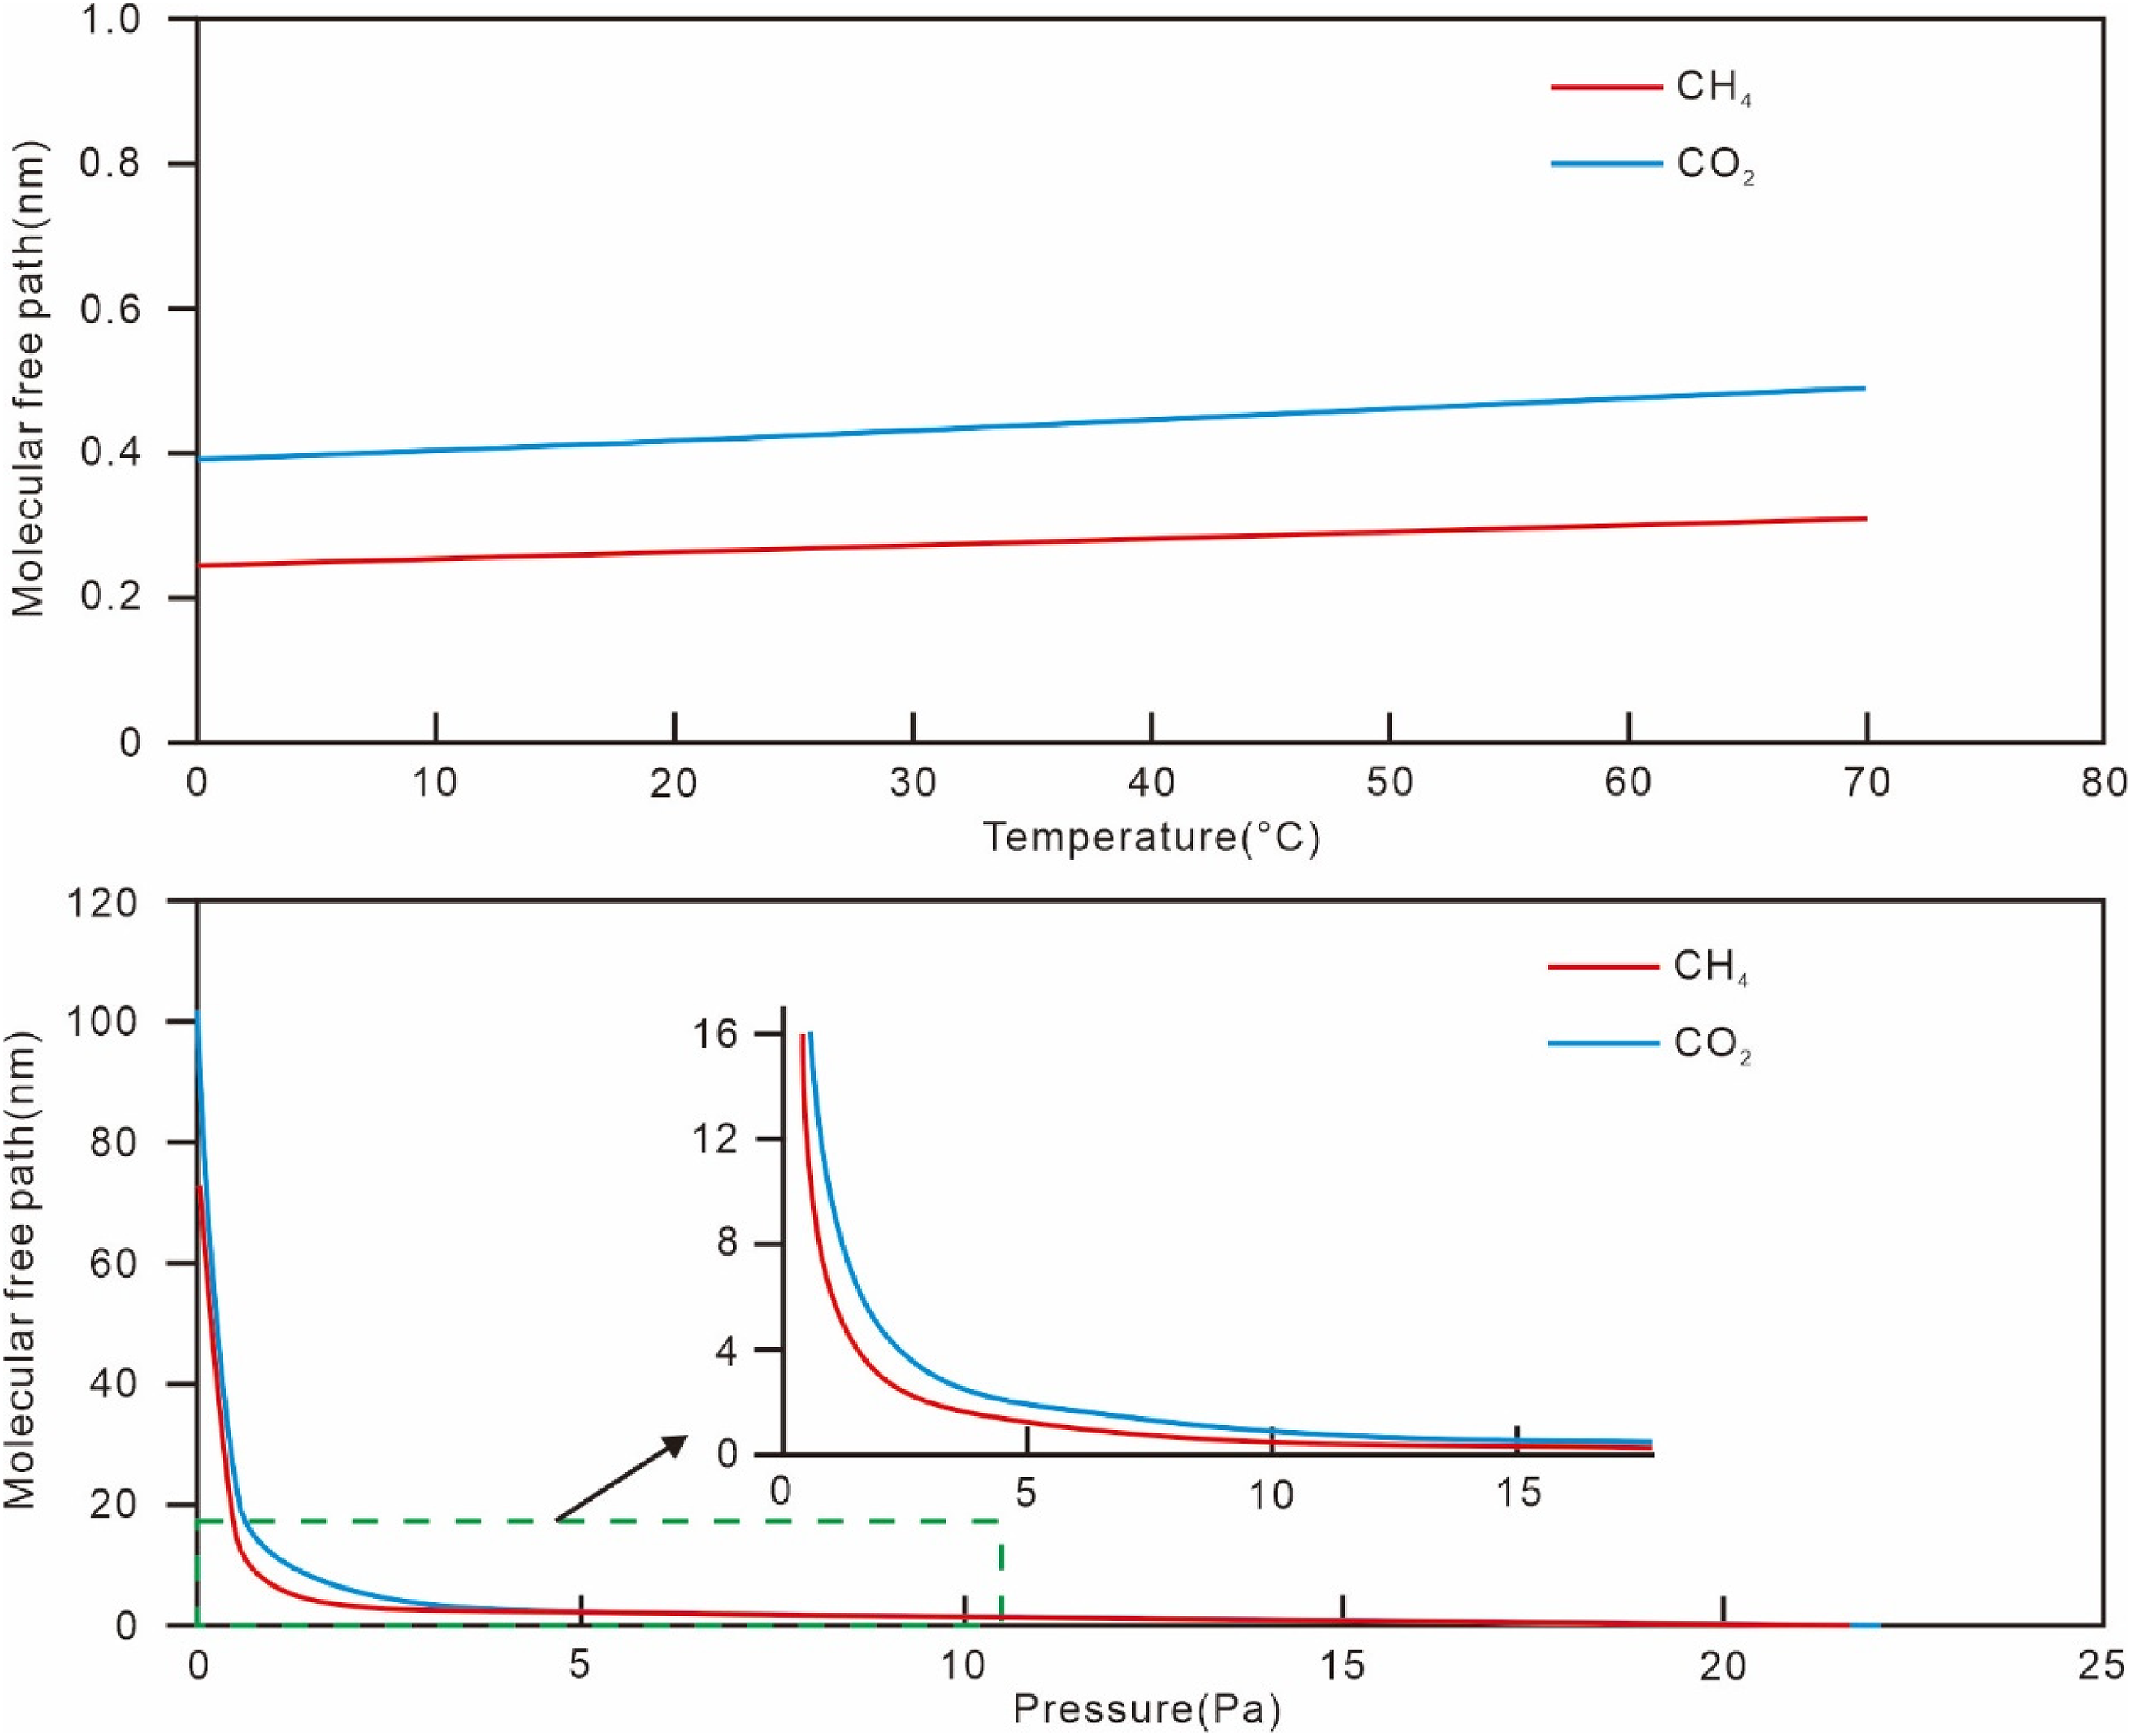
Molecular free path variation curves of CH4 and CO2 under different temperature and pressure.
Secondly, combining the actual pore and fracture diameter distribution characteristics of the deep No. 8 coal seam, values of 1 nm, 10 nm, 100 nm, 1μm, and 1 mm were taken to calculate the corresponding Kn numbers under different pressure conditions using Equations (4 to 8). The dashed lines in the figure represent the boundaries dividing the four flow regions (Figure 12). Results indicate that pores and fractures enter the Darcy flow region at pressures above 5 MPa for micro-scale and millimeter-scale and larger, with the rest being dominated by non-Darcy flow such as liquid-phase Fick diffusion, transition flow, and Knudsen flow without actual macroscopic movement.
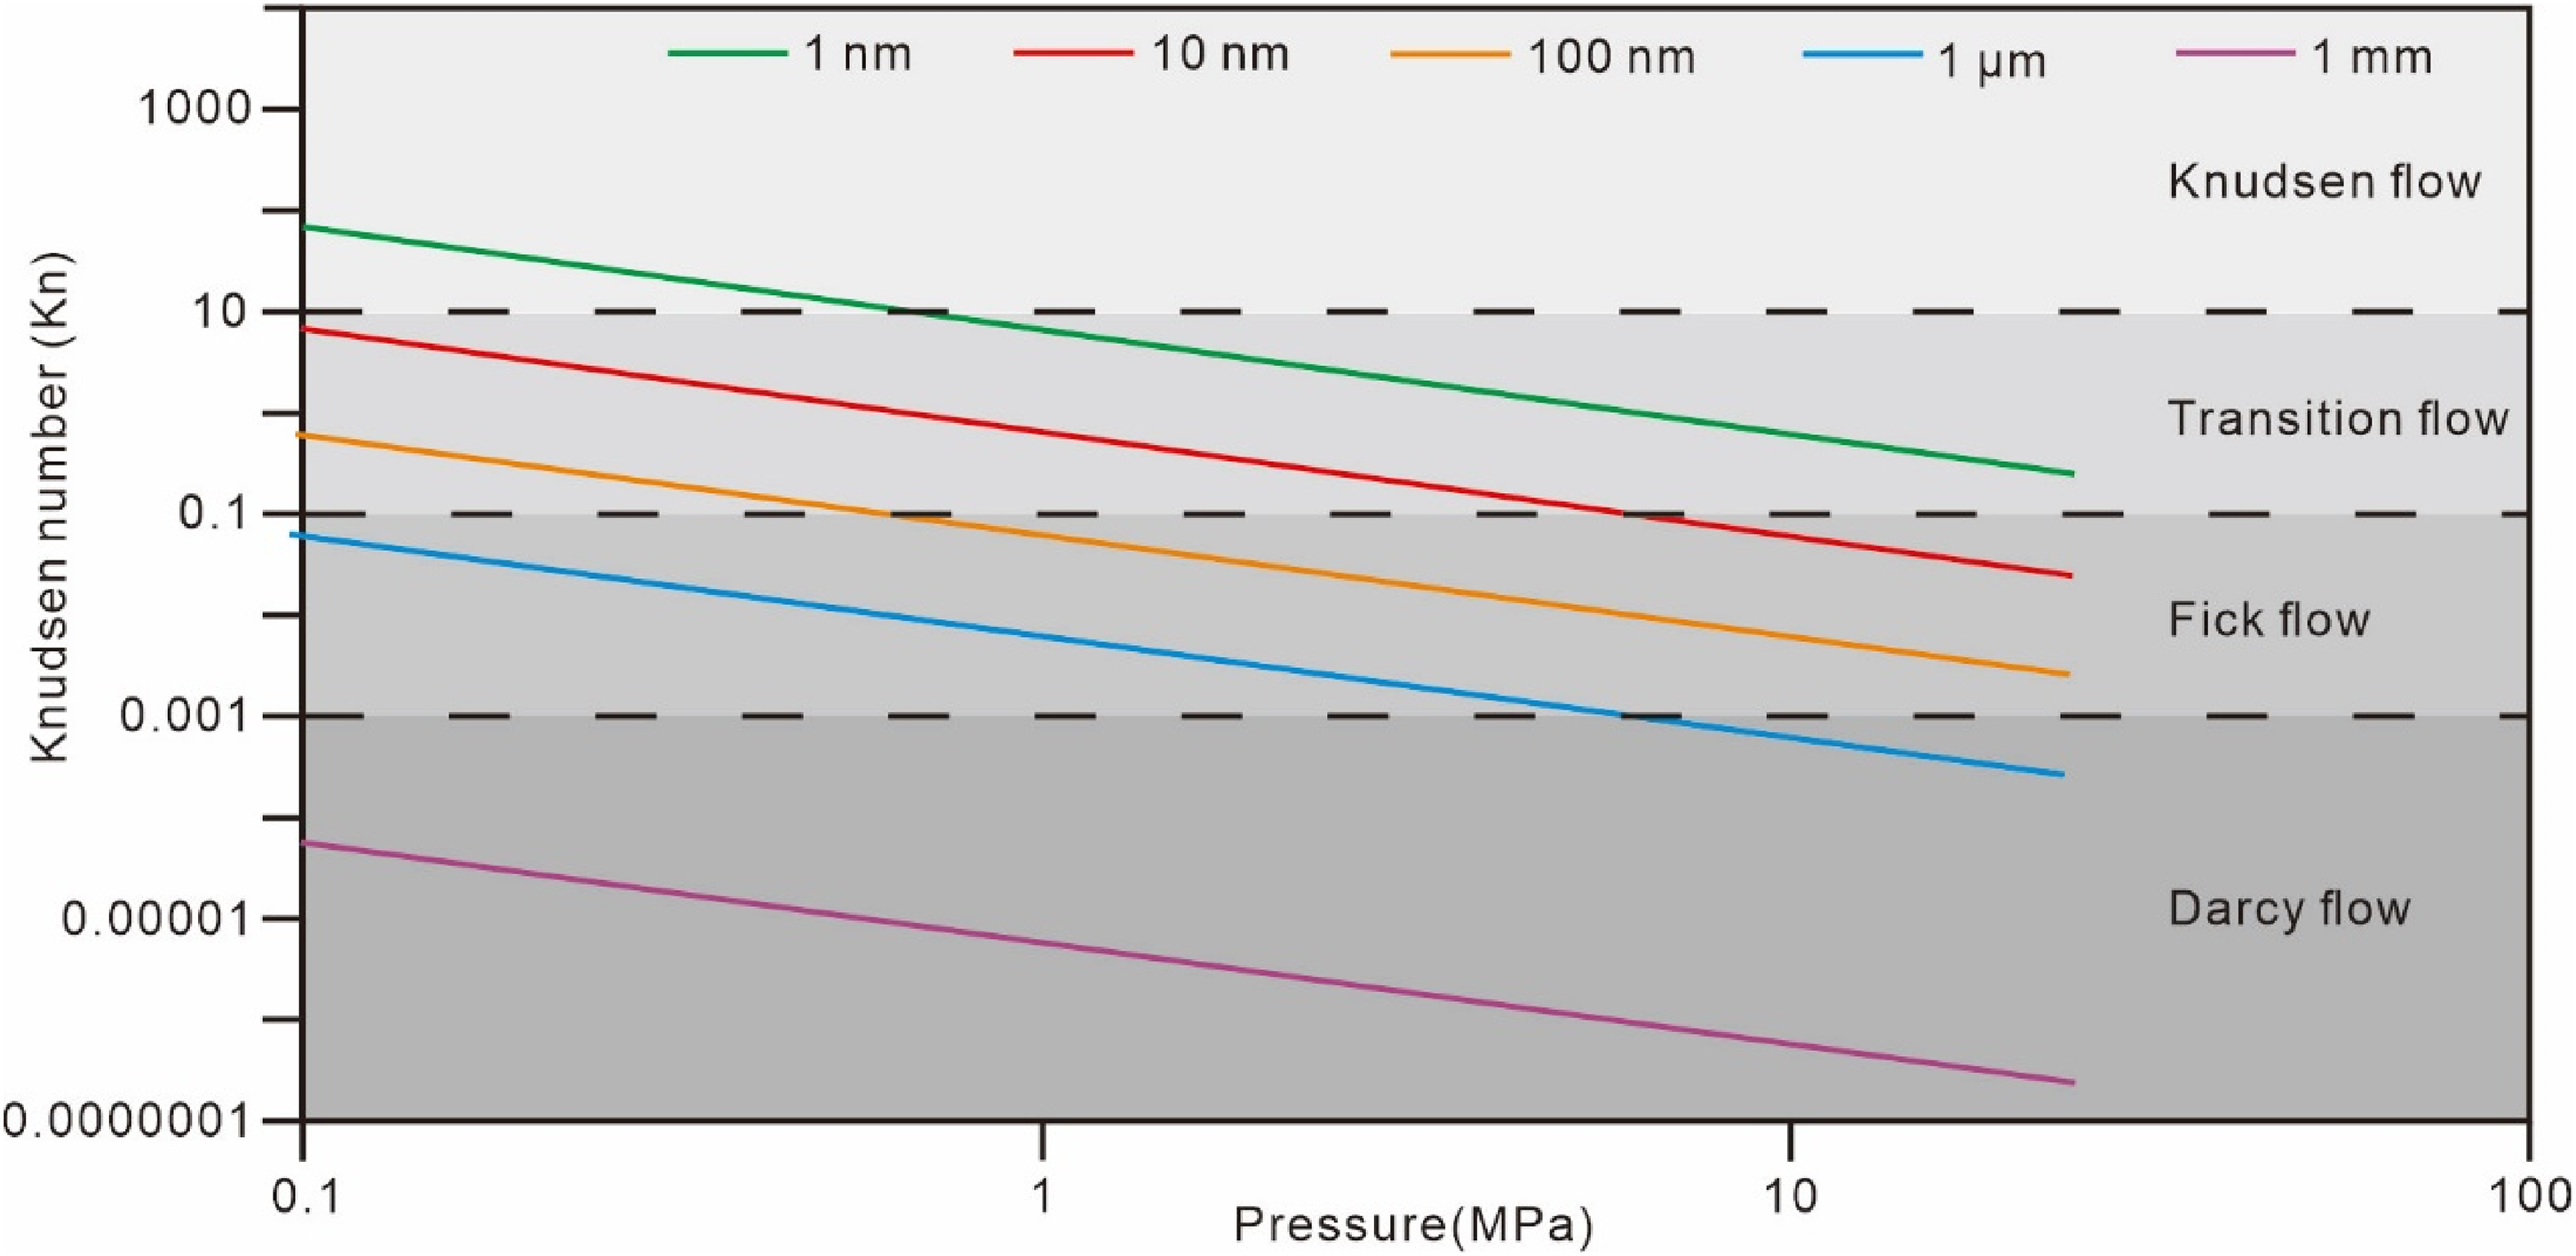
Variation of the Kn number of methane with pressure in different diameters.
In summary, considering the current status of fractured gas wells, it's believed that there exists a three-tier reservoir pore permeability system extending from the wellbore to the far end: primarily macro-scale meter-to-millimeter scale primary and secondary fracture networks, natural fractures and cleats on the macro millimeter-to-micro scale, and matrix pores on the micro-to-nano scale. Correspondingly, there are three seepage regions: high-conductivity Darcy flow, medium-conductivity transition from Darcy to non-Darcy flow, and low-conductivity non-Darcy flow. This layered understanding of flow dynamics provides a comprehensive view of the complex transport mechanisms within coal reservoirs, essential for optimizing extraction and enhancing production efficiency.
Production model of CBM in the eastern margin of the Ordos Basin
Based on the analysis of desorption, diffusion, and seepage mechanisms, and incorporating the pore-fracture structure, desorption and seepage patterns, as well as gas extraction and production characteristics of the deep No. 8 coal seam in the eastern margin of the Ordos Basin, a comprehensive production model is constructed (Figure 13). This model takes into account the macro-to-micro multi-scale three-tier pore permeability system, the formation of high, medium, and low conductivity regions through large-scale fracturing modifications, and the transition from predominantly free gas to desorbed gas in three fundamental production stages. An ideal schematic of the comprehensive production model for this region is established, encompassing roughly five extraction phases:
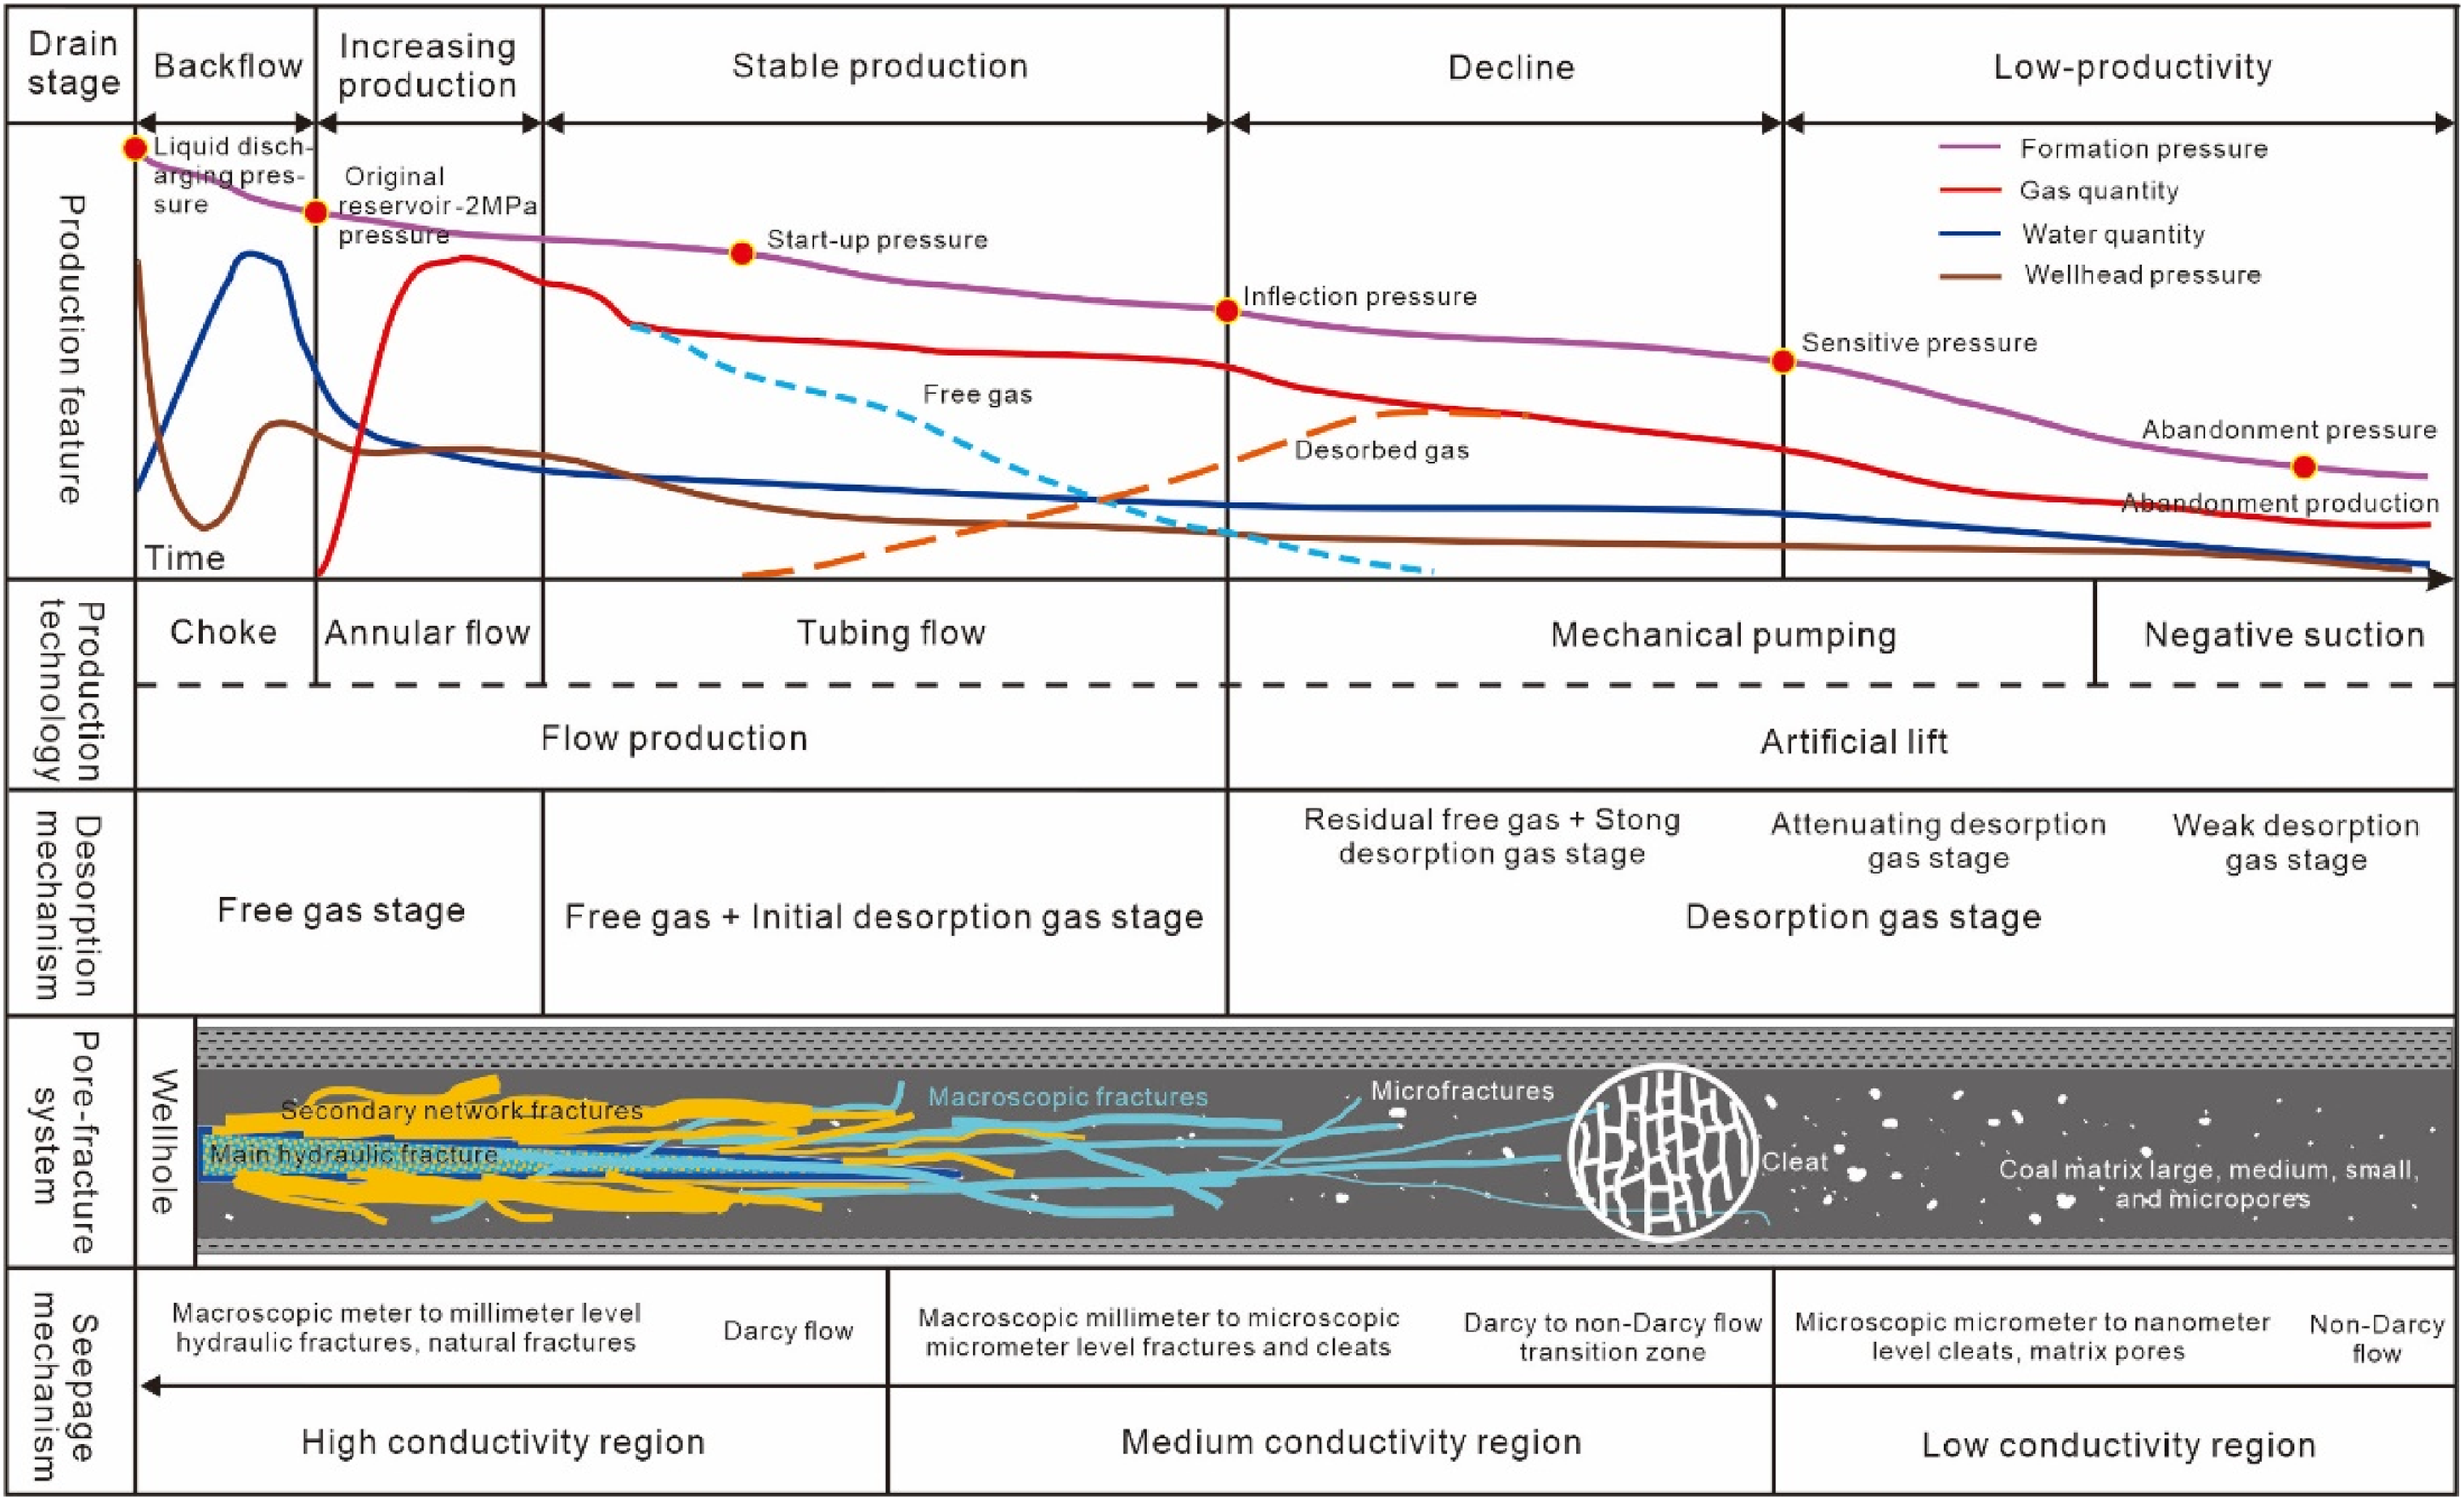
Theoretical comprehensive production model of deep coalbed methane.
This comprehensive production model provides a theoretical and practical framework for understanding and optimizing CBM extraction in deep coal seams. It emphasizes the importance of managing formation pressure and energy throughout the production lifecycle, from initial flowback to eventual decline and low production stages, ensuring the maximization of gas recovery and economic benefits.
Conclusions
The comprehensive analysis of CBM desorption, diffusion, and seepage theories underscores significant insights into the mechanisms underlying CBM recovery. CBM adsorption is categorized as a liquid–solid phase interface adsorption,, encompassing both dissolution and adsorption processes. Desorption includes four distinct stages: degassing of formation water, liquid-phase desorption of CBM, gas-phase desorption, and transition desorption. These stages can be theoretically categorized into liquid-phase adsorption (including dissolution and adsorption), liquid-phase desorption (including desorption and degassing), composite desorption (encompassing liquid-phase desorption, gas-phase adsorption, phase transition desorption, and gas-phase desorption), and finally, gas-phase desorption. In terms of diffusion and percolation transport theories, the concept of gas-phase diffusion driven by concentration differences is theoretically non-existent, with only a small amount of methane gas moving through non-Darcy flow driven by concentration differences in the dissolved phase. The majority of gas movement is facilitated through gas-phase Darcy flow, driven by pressure differences.
Focusing on the deep No. 8 coal seam in the Daning-Jixian block, research on the reservoir reveals that first, the desorption patterns largely align with the liquid–solid adsorption desorption theory. Secondly, under original temperature and pressure conditions, a multi-scale pore-fracture system exists, ranging from millimeters to micros to nanometers. Cleats and fractures are primarily in the micron to millimeter macro scale, while pores are mainly in the nano-to-micro scale. Analysis using the Kn indicates a transition from macro-scale Darcy flow to micro-scale non-Darcy flow within these pore structures. Finally, combining micro-mechanical logic with macro-scale production characteristics, an ideal comprehensive production model schematic for deep CBM has been established, offering significant guidance for on-site production management.
Footnotes
Author contributions
Conceptualization: L.Z.; methodology: L.Z.; validation: D.M., X. and X.F.; formal analysis: J.T.; investigation: L.Z. and J.T.; data curation: X.L. and L.Z.; writing—original draft preparation: L.Z. and M.; writing—review and editing: J.T.; visualization: L.Z. and J.T. All authors have read and agreed to the published version of the manuscript.
Declaration of conflicting interests
The authors declared no potential conflicts of interest with respect to the research, authorship, and/or publication of this article.
Funding
The authors received no financial support for the research, authorship, and/or publication of this article.