
Abstract
Two indirect parameters influencing coalbed methane (CBM) drainage performances are proposed in this paper, which are effective desorption radius and difference between reservoir pressure and critical desorption pressure (DRPCDP). Variations of the two parameters during CBM drainage are investigated, which shows that they have a linear relationship. By using formula derivations, a theoretical model for gas production prediction is built. It suggests that the cumulative gas production is a product of square of effective desorption radius with DRPCDP, and there is also a cubic polynomial relationship between cumulative gas production and linear average DRPCDP. Furthermore, well PM01 located at southern Qinshui basin of China is selected as a case, and a commercial software is adopted to predict the gas production. Compared with the simulated and modeled cumulative gas productions, the simulated data match well with the modeled data, which indicates that the model has a good accuracy.
Keywords
Introduction
As an unconventional gas reservoir, a coalbed methane (CBM) reservoir serves as both reservoir rock and source rock for methane (Bustin and Clarkson, 1998; Crosdale et al., 1998). During CBM drainage, reservoir varies as a series of processes including dewatering, pressure decline and gas desorption (Ding et al., 2011; Wei et al., 2007a; Zou et al., 2014). In these processes, water and gas drainages act as key roles, leading to the declines of reservoir pressure and gas content and the variations of pore system (Danesh et al., 2016; Gentzis et al., 2008; Rightmire, 1984; Young, 1998).
Researches mainly focus on two aspects regarding reservoir variations during CBM drainage. The first aspect refers to the declines of reservoir pressure and gas content, and the second is the variations of porosity and permeability (Connell and Detournay, 2009; Wei et al., 2007b).
For the first aspect, Reis (1998) and Samaniego and Villalobos (2003) presented a new model to simulate the transient and decline of reservoir pressure under the influence of fracturing. Zhang et al. (2008) used fractal dimension theory to analysis the transmission of pressure. Wei and Zhang (2010) simulated a fluid-flow process during CBM recovery with a triple porosity/dual permeability model, and modeled the dynamic changes of reservoir pressure. Thararoop et al. (2012) amended Langmuir equations and developed a CBM modeling software, and used it to simulate the recovery performance of a well. Zou et al. (2013a, 2013b) used the COMET3 software to predict pressure transmission during CBM drainage for both single well and well net group, and adopted an improved model to accurately simulate pressure transmission and gas content decline (Zou et al., 2015). Ren et al. (2017) developed a binary model for gas transport in both coal matrix and cleat, and simulated reductions of gas content during drainage processes under different conditions.
While for the second aspect, a lot of models for porosity and permeability variations have been proposed, which can be divided into three types. The first type is obtained by mathematical derivations, such as Levine model (Levine, 1996), PM model (Palmer, 2009; Palmer and Mansoori, 1996), ARI model (Pekot and Reeves, 2003), and others (Sun et al., 2018a; Xu et al., 2014). The second type is gained by using fittings on experimental data, including RC model (Robertson and Christiansen, 2006). The third type refers to empirical models, containing Gray model (Gray, 1987) and HZ model (Harpalani and Zhao, 1989). Two main effects resulting in pore variations have been considered for all the three types of models; one is the positive effect caused by the coal matrix shrinkage, and the other is the negative effect resulted from the increase of effective pressure (Liu et al., 2017; Shi and Durucan, 2004, 2005).
There are now enough methods used to analyze above conventional parameters, of which variations have been investigated clearly during gas drainage processes (Sun et al., 2017a, 2018b; Wu et al., 2015). Based on conventional parameters, this paper proposes another two indirect parameters, which are effective desorption radius and difference between reservoir pressure and critical desorption pressure (DRPCDP). The two parameters are variable in different drainage time and places. By using mathematical analyses, this paper investigates their variations, and adopts them to build a gas prediction model. Because the proposed model in this research contains nearly all direct influential factors, the model turnouts to be powerful in the application. Furthermore, this work can lay the theoretical basis for the next generation of numerical simulators for CBM reservoirs.
Theoretical model
Influence radius
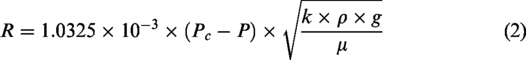
Influence radius refers to the distance from well bore to the place where reservoir pressure starts to decease. The Sihardt equation is always used to calculate influence radius during CBM drainage as expressed follows (Shi, 2002; Xue, 1986),

Combined with Darcy’s law, equation (1) is reformulated as,
Theoretically, there are always two stages during CBM drainage, which are stages of free gas drainage and desorbed gas drainage (Zou et al., 2014). Free gas drainage stage refers to the process when reservoir pressure is above the critical desorption pressure. Because gas production is always undulate and relatively low in this stage, it is really hard to simulate. For this reason, simulators usually assume that there is no free gas in the reservoir (Wei and Zhang, 2010; Young, 1998; Zou et al., 2013a, 2014). The assumption also exists in this study. Then, for equation (2), we only discuss the second stage-desorbed gas drainage stage, in which the reservoir pressure decreases down to the critical desorption pressure. As a result, Pc−P in this equation will be always positive.
In equation (2), Pc−P is the DRPCDP as discussed above, marked as △P, which is used to measure the decline degree of reservoir pressure. Permeability is another key parameter in this equation. Studies have revealed that permeability is a dynamic property for coal, and it suffers influences of stress dependence and matrix shrinkage (Harpalani and Zhao, 1989; Levine, 1996; Sun et al., 2018c; Zhang et al., 2018). Nevertheless, many studies show that the dynamic degree of permeability is quite limited during CBM drainage (Wei and Zhang, 2010; Zou et al., 2014, 2015). For a convenient solution, it is assumed that permeability is constant during CBM drainage in this study. Then, equation (2) can be rewritten as,

It means that there is a linear relationship between influence radius and DRPCDP.
Effective desorption radius
Effective desorption radius is the distance from well bore to the place where reservoir pressure starts to decline down to the critical desorption pressure, which is influenced by influence radius, as detailedly defined and explained in Zou et al. (2013a) and Sun et al. (2017b, 2018d). During CBM drainage processes, drainages of water and gas lead to the increases of influence radius and effective desorption radius, as described in Figure 1. In the figure, lines AC and BD represent the distributions of reservoir pressure at time a and b, respectively; OA and OB are the corresponding influence radii; and oa and ob are the corresponding effective desorption radii. Based on previous results (Zou et al., 2013b, 2015), it can be realized that the shape of pressure distribution at each time is similar, Bb and Aa are then parallel, and ∠Bbb′ is equal to ∠Aaa′. Because bb′=aa′, then Bb′=Aa′. It means that differences between influence radius and effective desorption radius at any drainage time are all the same. Therefore, the following equation can be realized,

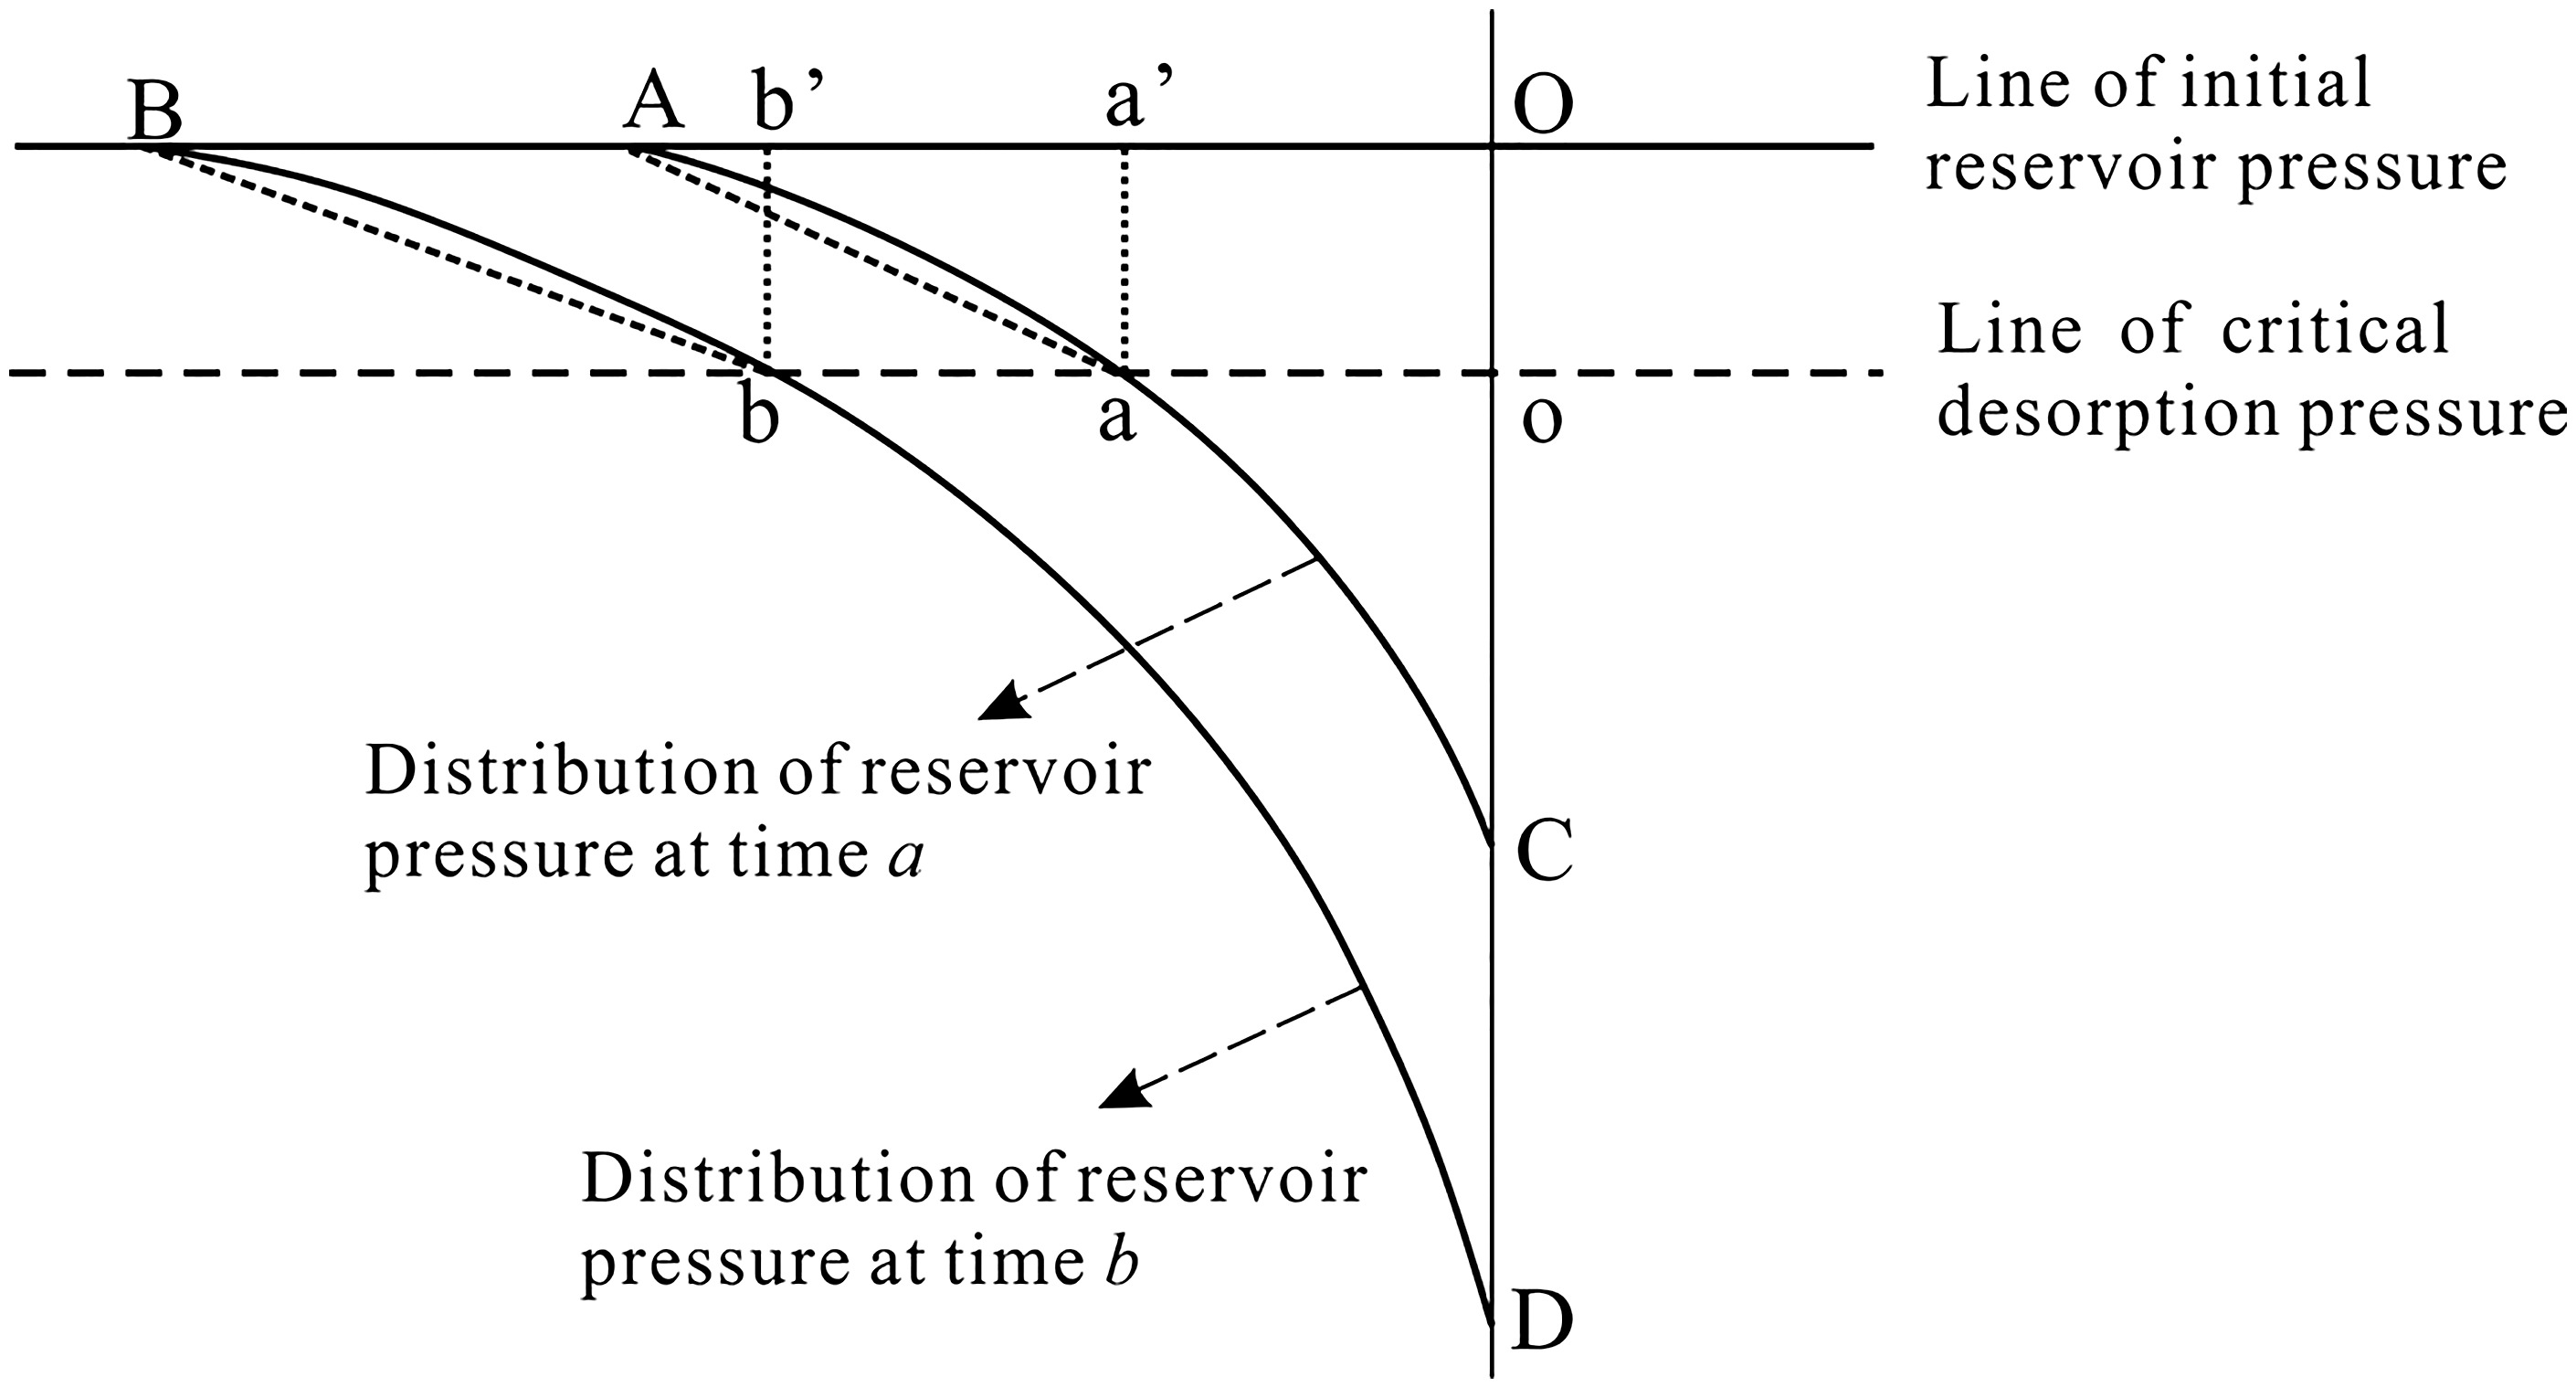
Schematic diagram for pressure variations during CBM drainage.
Substituting equation (3) into equation (4) gives,

Therefore, there is also a linear relationship between effective desorption radius and DRPCDP.
Gas production modeling
DRPCDP is a measure of gas content decline, which will be proved in the later section. As this difference varies with both positions and drainage time, the entire provenance is then equally divided into n parts. Define effective desorption radius at day t is rt. DRPCDP in each part is sequentially marked as
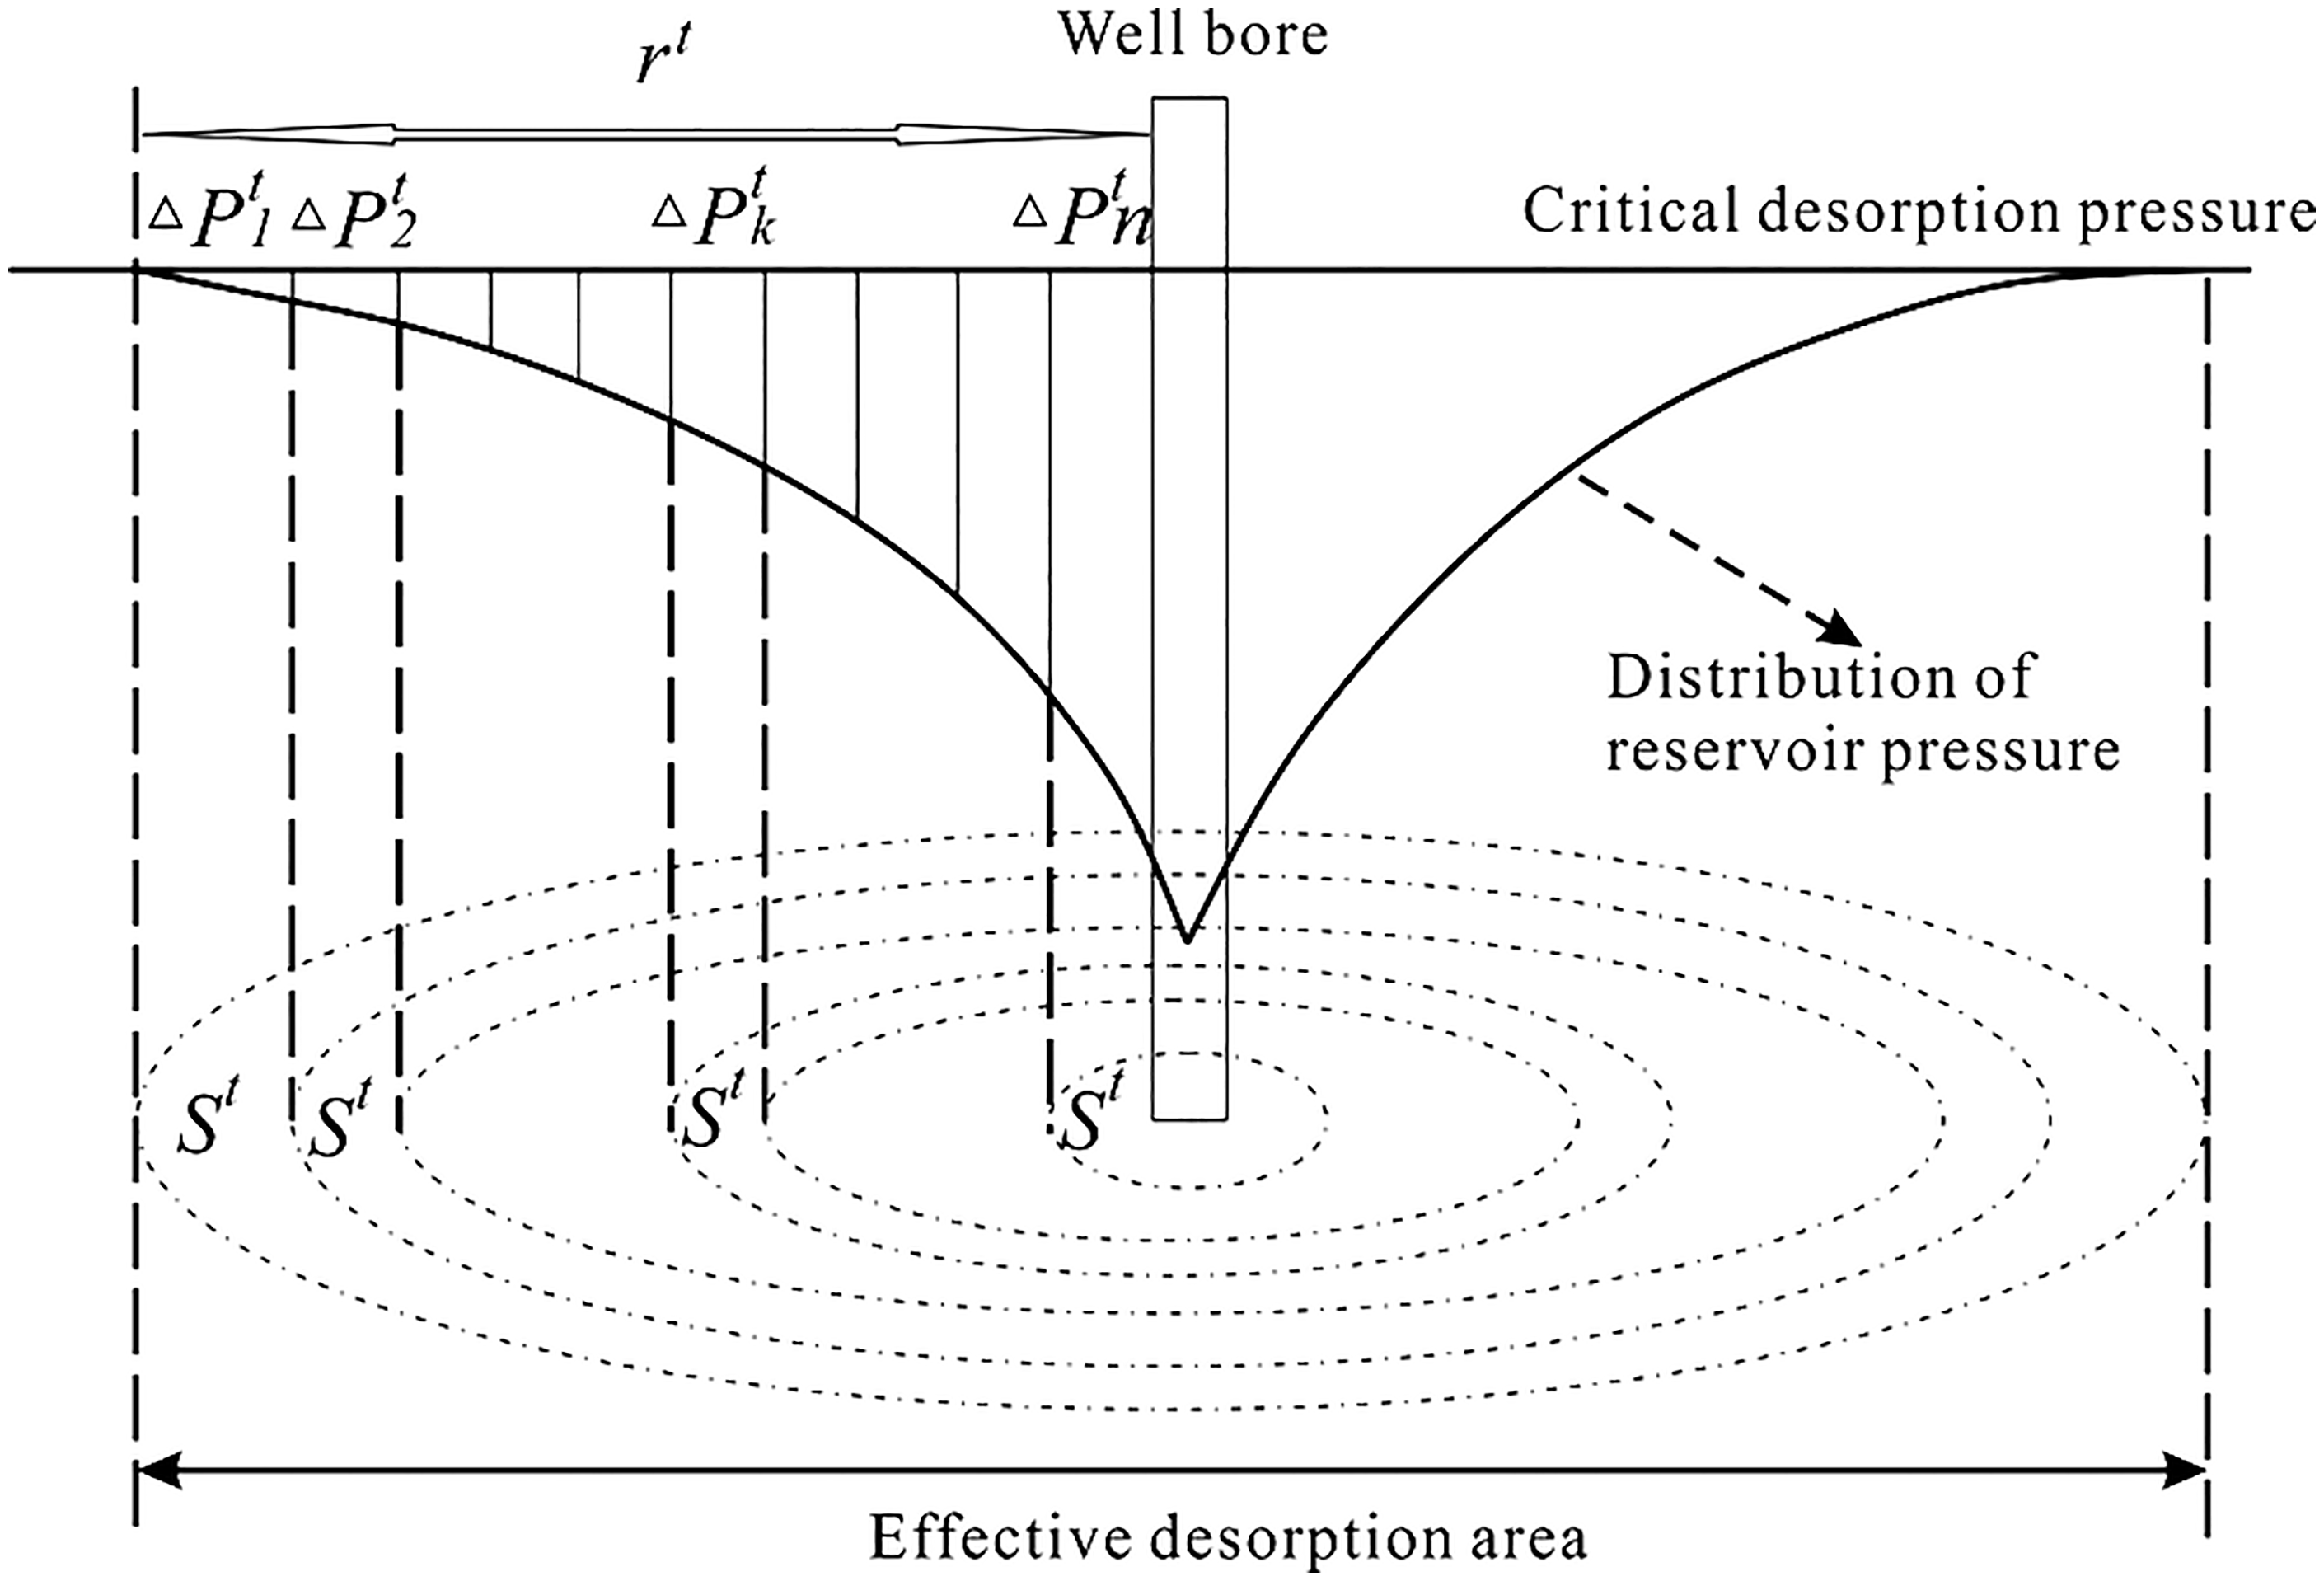
Subdivision for the effective desorption area.
Similarly as DRPCDP, corresponding gas content decline in each part is thereby marked as
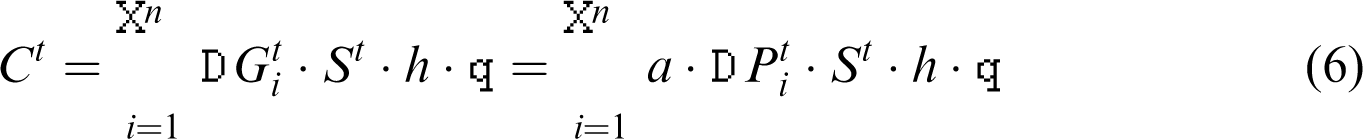
Suppose that there is an average DRPCDP for the effective desorption area at each drainage time, equation (6) can be thereby simplified as,
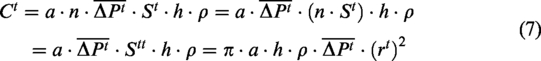
Two cases will be discussed here for the average DRPCDP in equation (7). If the shape of pressure distribution is a straight line, the average DRPCDP is then a linear average value, which is equal to a half value of the difference between bottom hole pressure and critical desorption pressure (DBHPCDP). If the shape of pressure distribution is a curve, there should be an adjustment coefficient between the average value and linear average value. As discussed above, shapes of pressure distributions at any time are similar, and it can be interpreted that the adjustment coefficients at any time are equal. As a result, equation (7) can be rewritten as,

Substituting equation (5) into equation (8) gives,
Equation (9) is the final description for predicting CBM production. For any CBM well, if values of bottom hole pressure and cumulative gas production are collected sufficiently, a three regression analysis can be used to match them combined with some basic laboratory and field experiments, and all undetermined coefficients in equation (9) can be thereby obtained. Finally, gas productions for further drainage processes can be predicted.
A case study
Descriptions for wells and reservoir parameters
A case well named well PM01 is selected from southern Qinshui basin of China. The target coal seam is No. 3 of Shanxi formation, and the fracture fluid used is active water and sands.
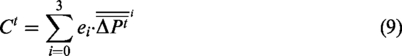
Basic parameters of the reservoir are listed in Table 1. Rock mechanics is a measure of deformation and strength, which can be obtained by conducting experiments of tension, compressibility and swelling induced by filling in CH4 under dry, fully water-saturated and fully water/gas-saturated conditions, of which procedures and values can be found in Fu and Qin (2003). The coal seam domain can be gained from well drilling and well testing. For parameters of pore system, gas content is a summation of desorbed gas, residual gas and lost gas. The detailed experimental methods are described in GB/T 19559-2004. Sorption time and Langmuir parameters can be acquired through isothermal adsorption tests under reservoir temperature, as explained in GB/T 19560-2004. Because routine laboratory tests on porosity and permeability cannot acquire actual values of the reservoir, their values in Table 1 are thereby obtained by the later historical matching.
Reservoir parameters for well PM01.
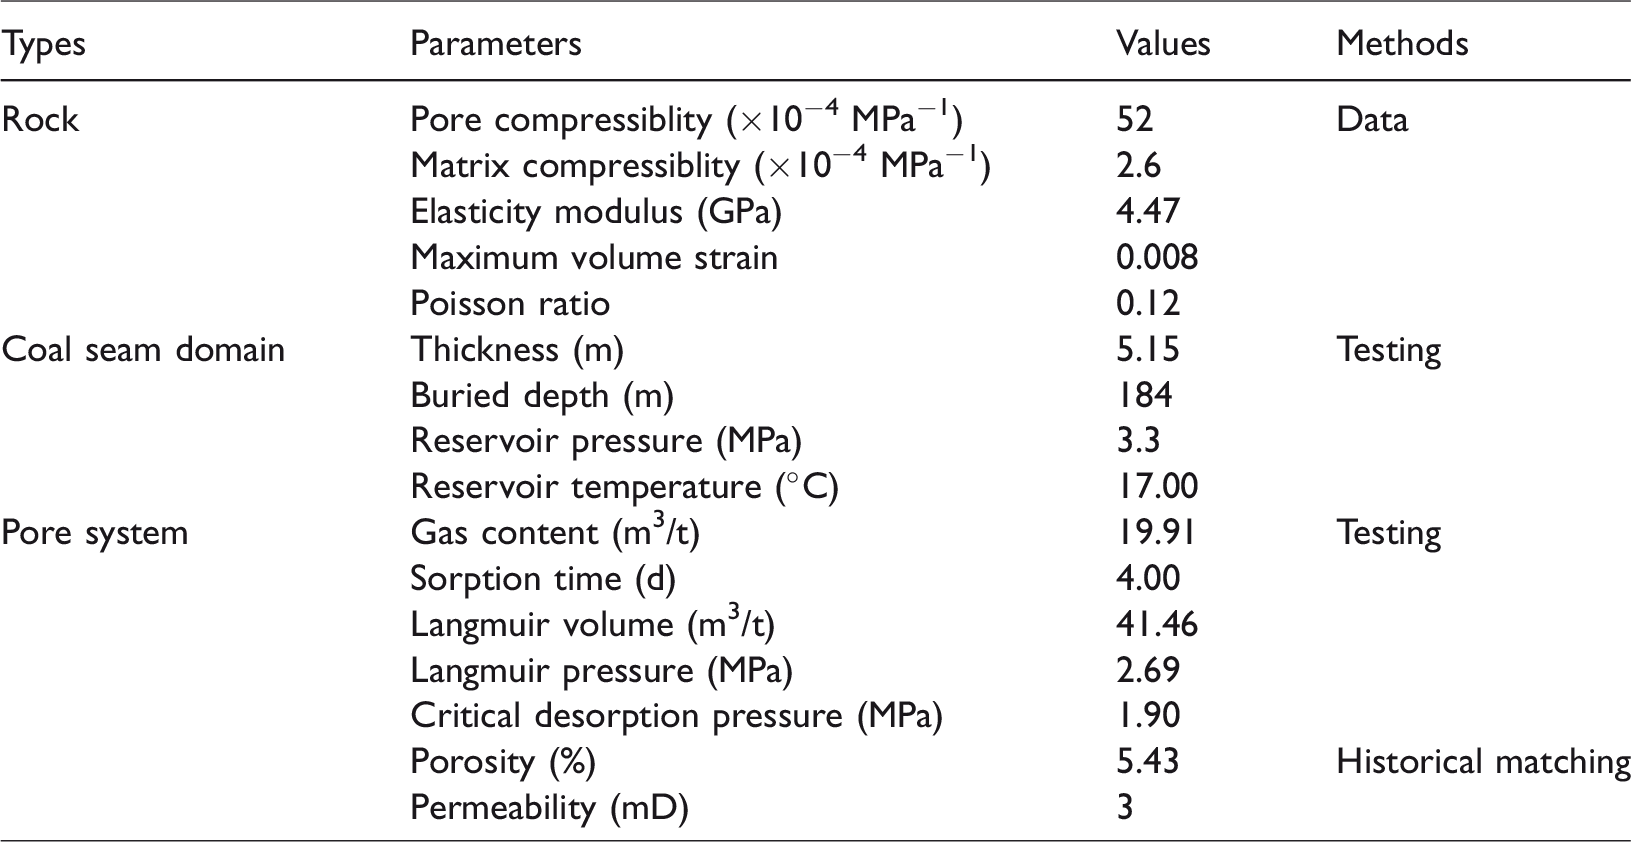
Figure 3 shows the 636 days’ drainage history of well PM01, which can be divided into three stages. The first stage ends at day 120, corresponding to the free gas drainage stage. In this stage, there is no gas production, the water production increases from 1.8 to 8.3 m3/d, and the bottom hole pressure decreases from 3.5 to 1.58 MPa. The second stage lasts from day 121 to day 360, which is an unstable drainage stage. During this stage, the gas production changes undulately, with a highest value of 6343 m3/d; the water production changes from 5 to 1.5 m3/d; and the bottom hole pressure keeps quite stable at 0.65 MPa. The remaining time is the third stage, and it is a stable drainage stage. In this stage, the gas production is about 4000 m3/d; the water production is between 1 m3/d and 5 m3/d; and the bottom hole pressure is about 0.65 MPa. Additionally, the second and third stages both belong to the desorbed gas drainage stage.
Drainage history of well PM01.
Model application
For well PM01, the half value of bottom hole pressure at day t subtracted by critical desorption pressure (1.2 MPa) equals to the linear average DRPCDP in equation (9). Then, a three regression analysis is adopted to match the cumulative gas production and linear average DRPCDP, and four undetermined coefficients are all obtained, as shown in Figure 4. The fitting degree reaches 0.9554, which indicates that there is a strong cubic polynomial relationship between the linear average DRPCDP and cumulative gas production.
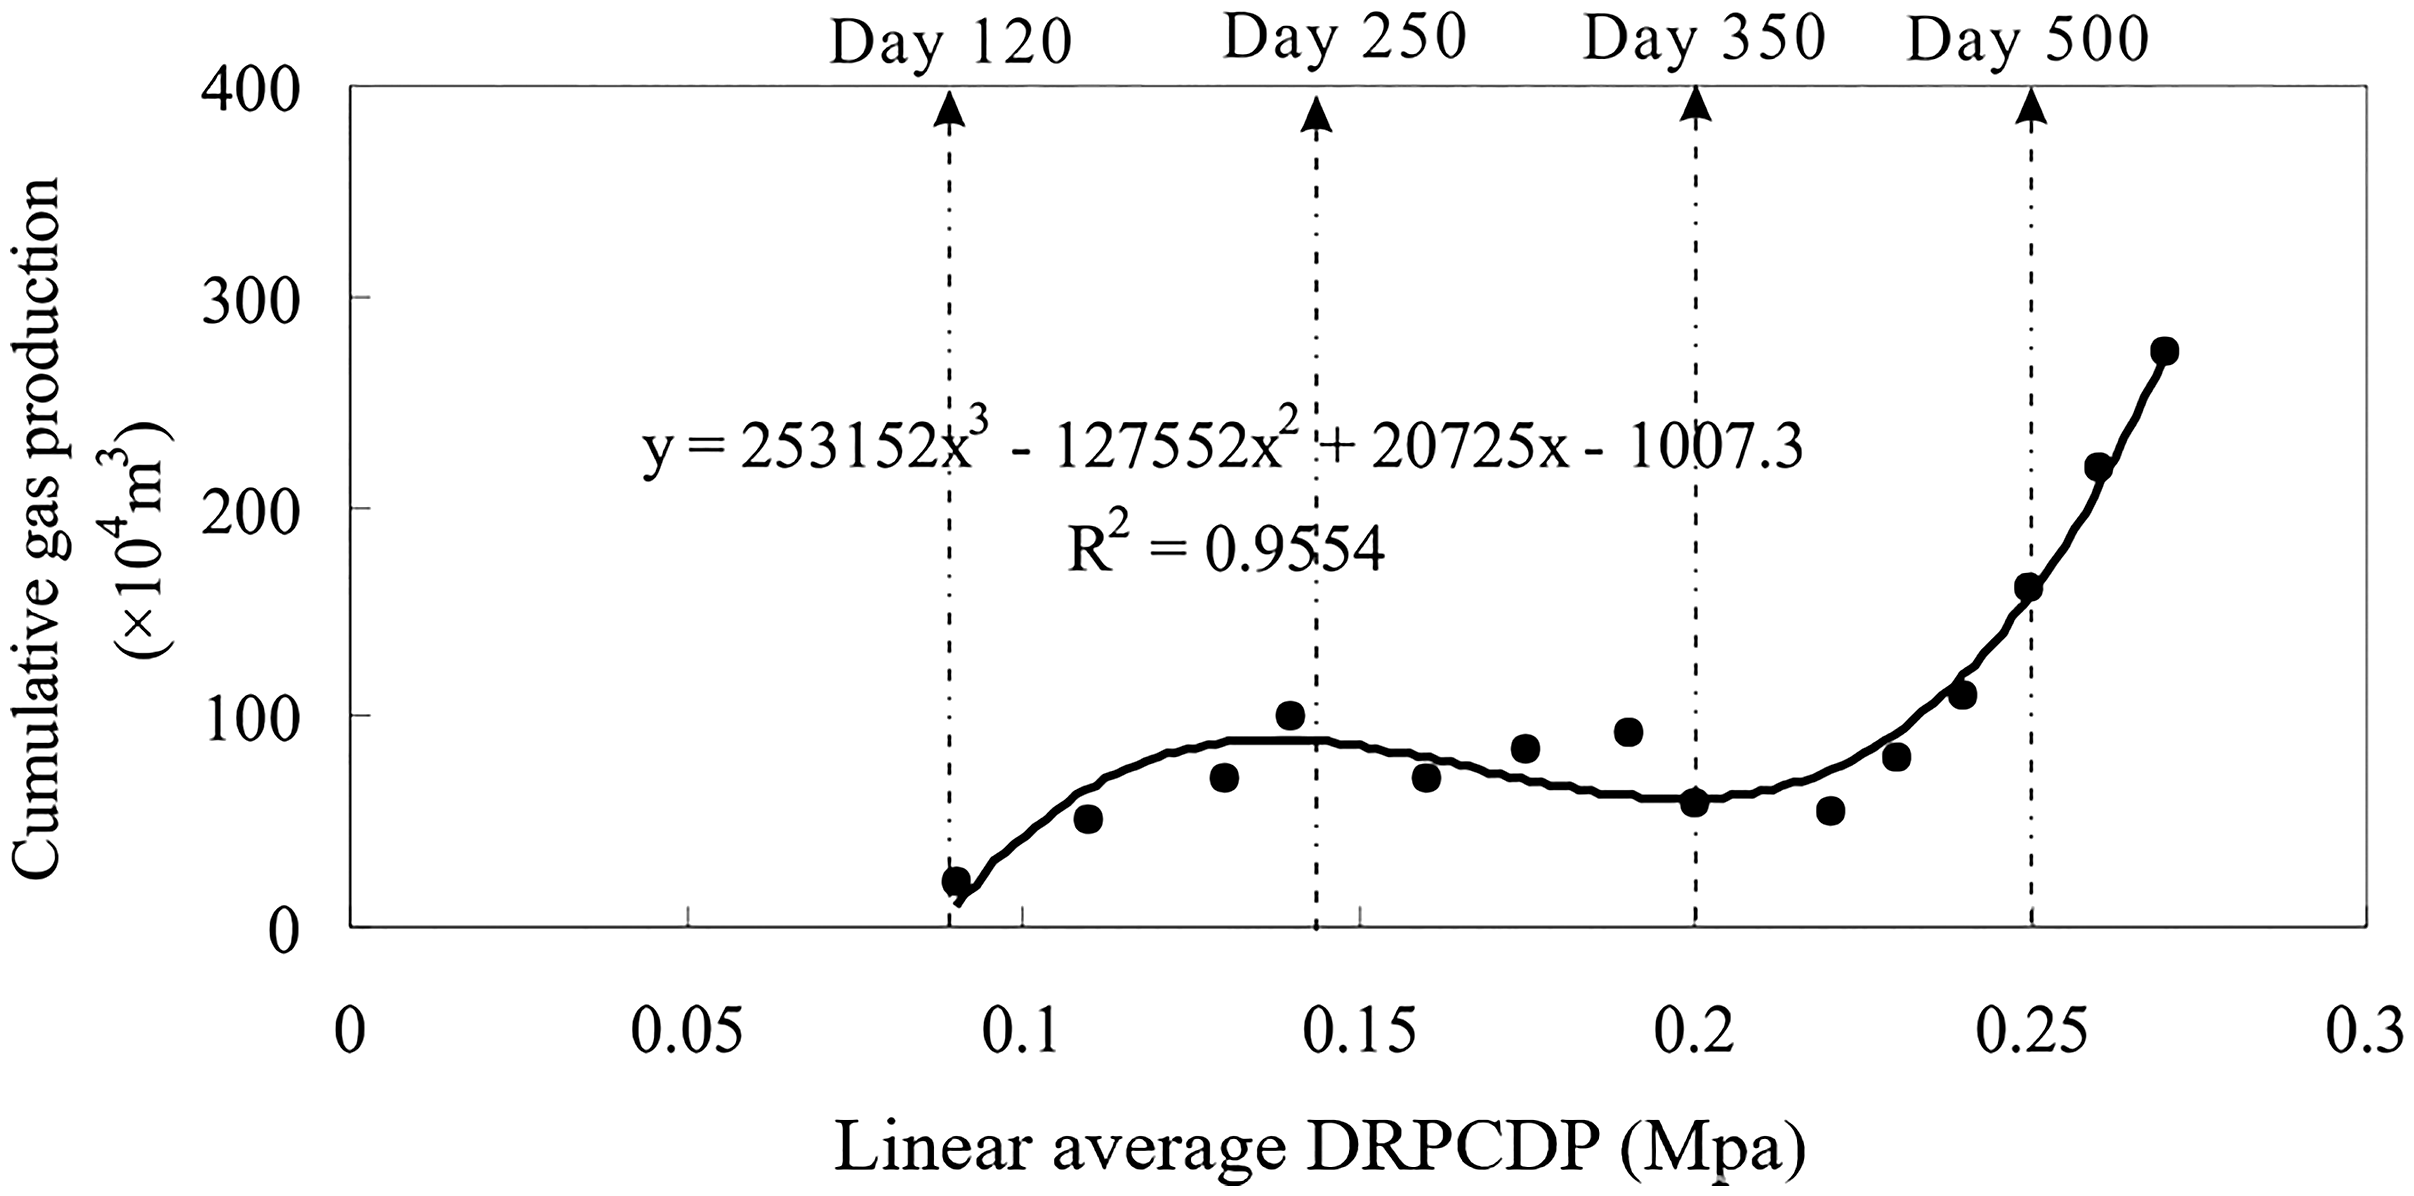
Fitting diagram between cumulative gas production and linear average DRPCDP.
By using the relationship, gas production for future drainage time can be predicted, which is shown as the gray dots in Figure 5. It shows that the modeled cumulative gas production for fifteen years (4950 days) is about 1293 × 104 m3, and indicates that well PM01 has a good gas performance.
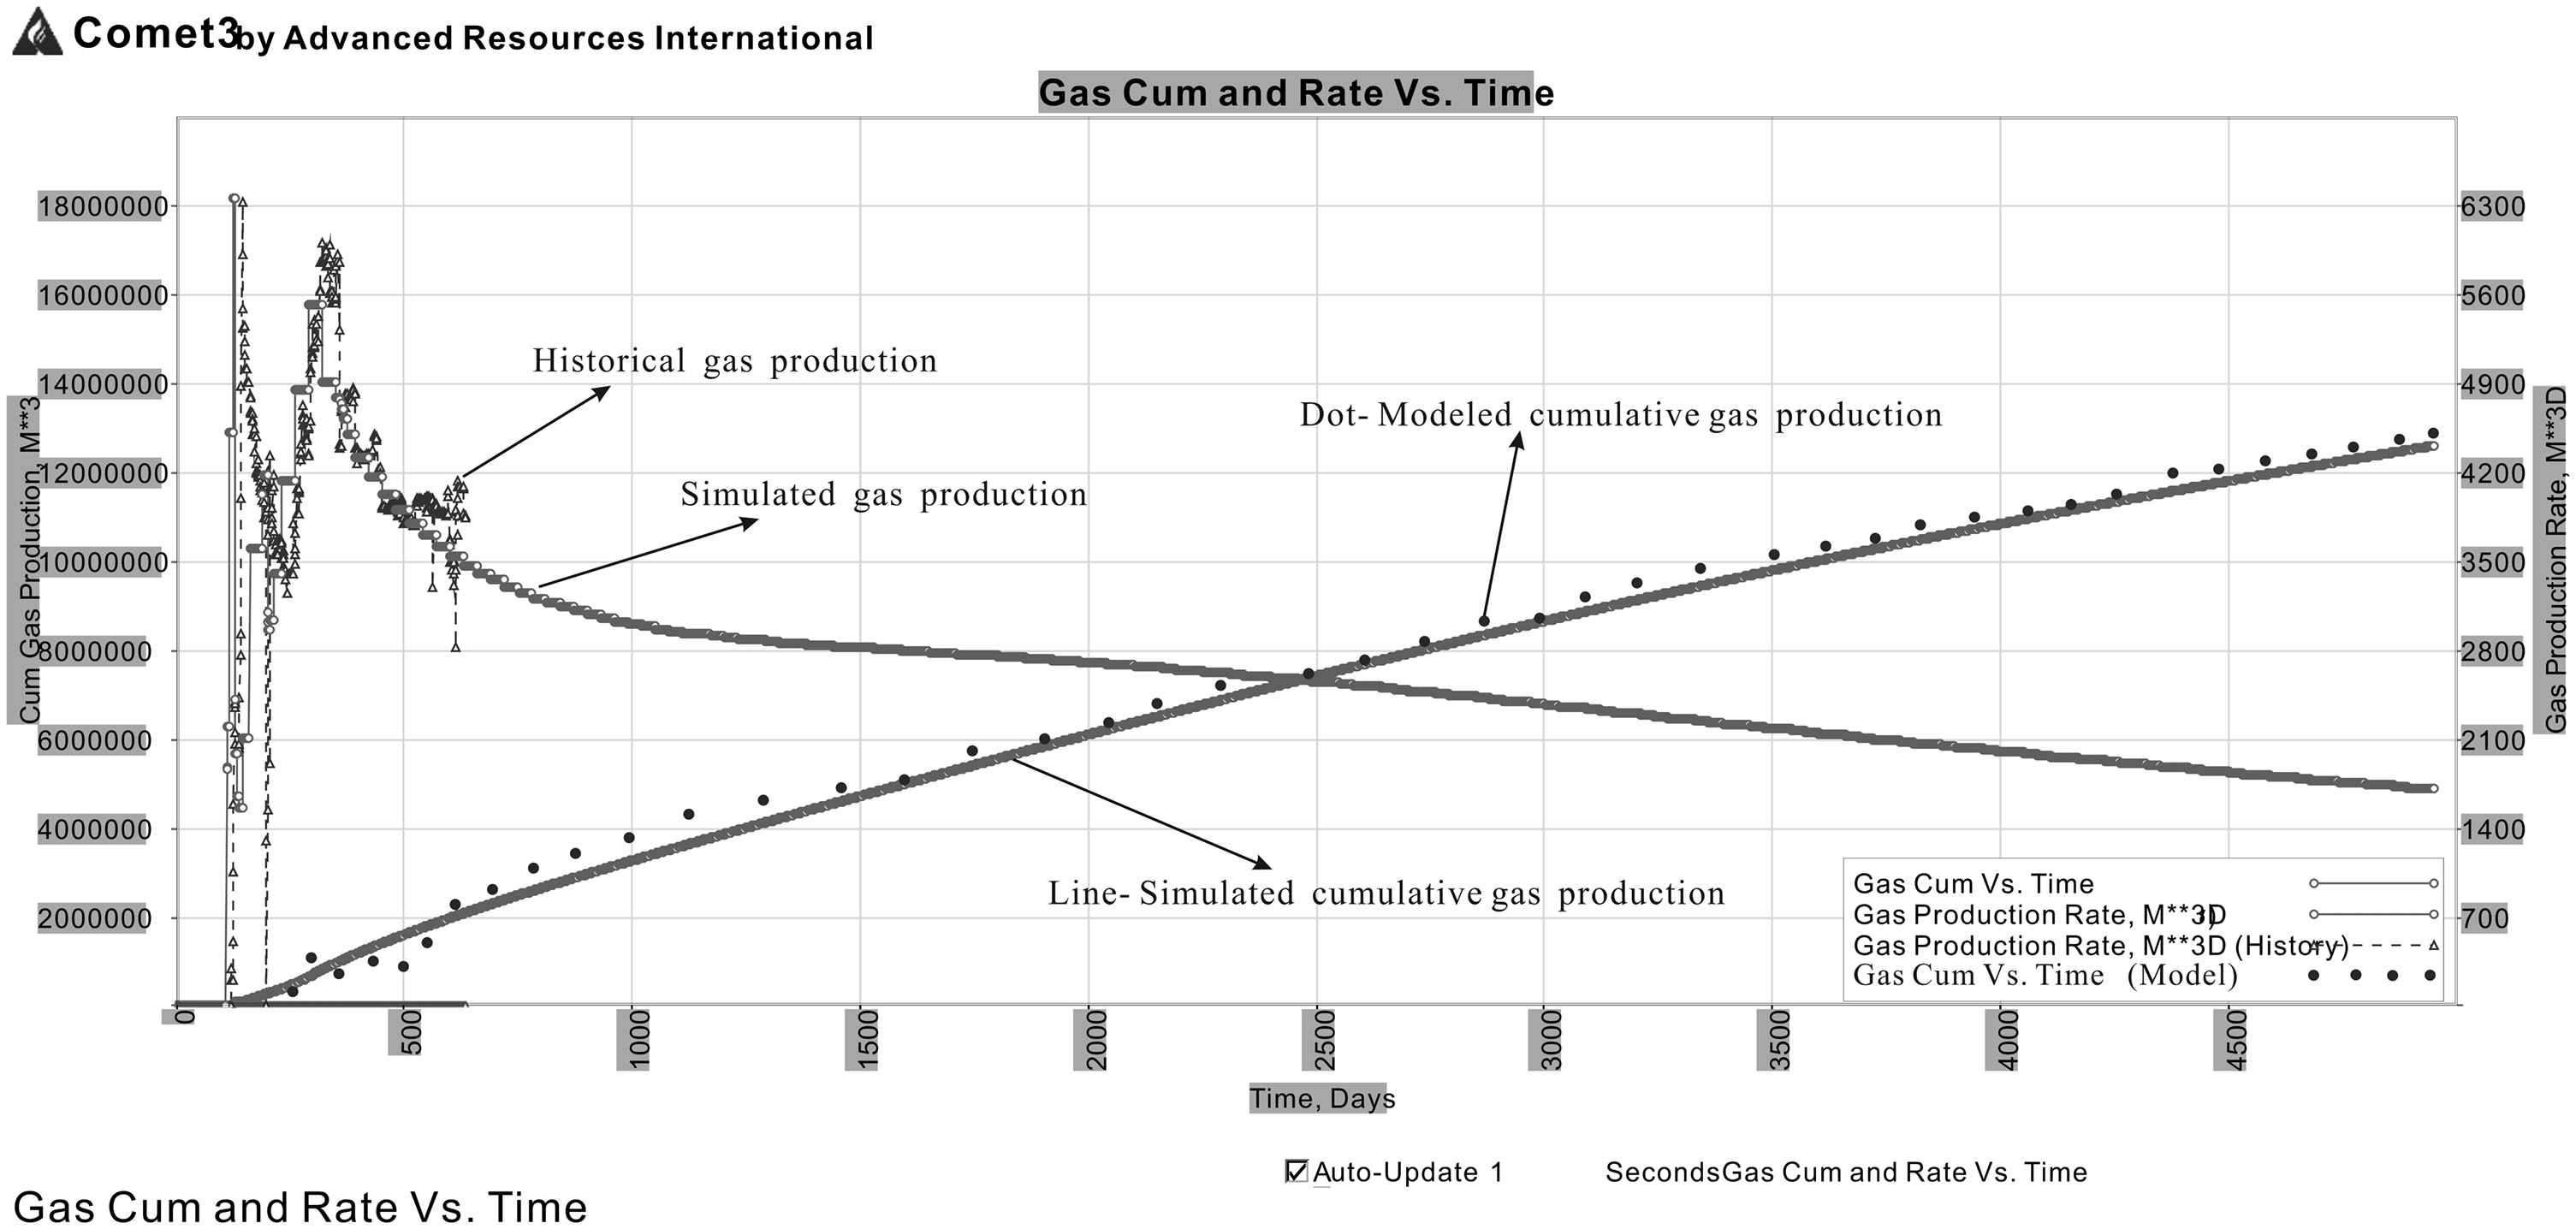
Gas production predicted by using the COMET3 simulator.
Discussions
Production verification
To verify the accuracy of the model, the commercial CBM reservoir simulation software-COMET3 is used to simulate the gas performance of well PM01, and the results are shown in Figure 5. Before simulation, historical matching is conducted to acquire the permeability and porosity in Table 1 by matching the simulated and actual gas productions, as shown in Figure 5. The two productions match well, which also indicates that the software can be used to simulate the well performance. Then, the daily and cumulative gas productions for fifteen years are both predicted. Compared with the simulated and modeled cumulative gas productions, two data are 1261 × 104 m3 and 1293 × 104 m3, respectively, which shows that the simulated data match well with the modeled data, indicating that the model has a good accuracy.
Variations of parameters
Declines of reservoir pressure and gas content
During simulation, reservoir pressure and gas content for each grid node are recorded. Then, declines of reservoir pressure and gas content are plotted, as shown in Figures 6 and 7. In Figure 6, it should be noted that the thick horizontal dash line represents the critical desorption pressure. During drainage processes, gas content and reservoir pressure both decrease, and they two have a similar decreasing manner. Gas content declines as reservoir pressure decreasing, especially when reservoir pressure drops below critical desorption pressure.
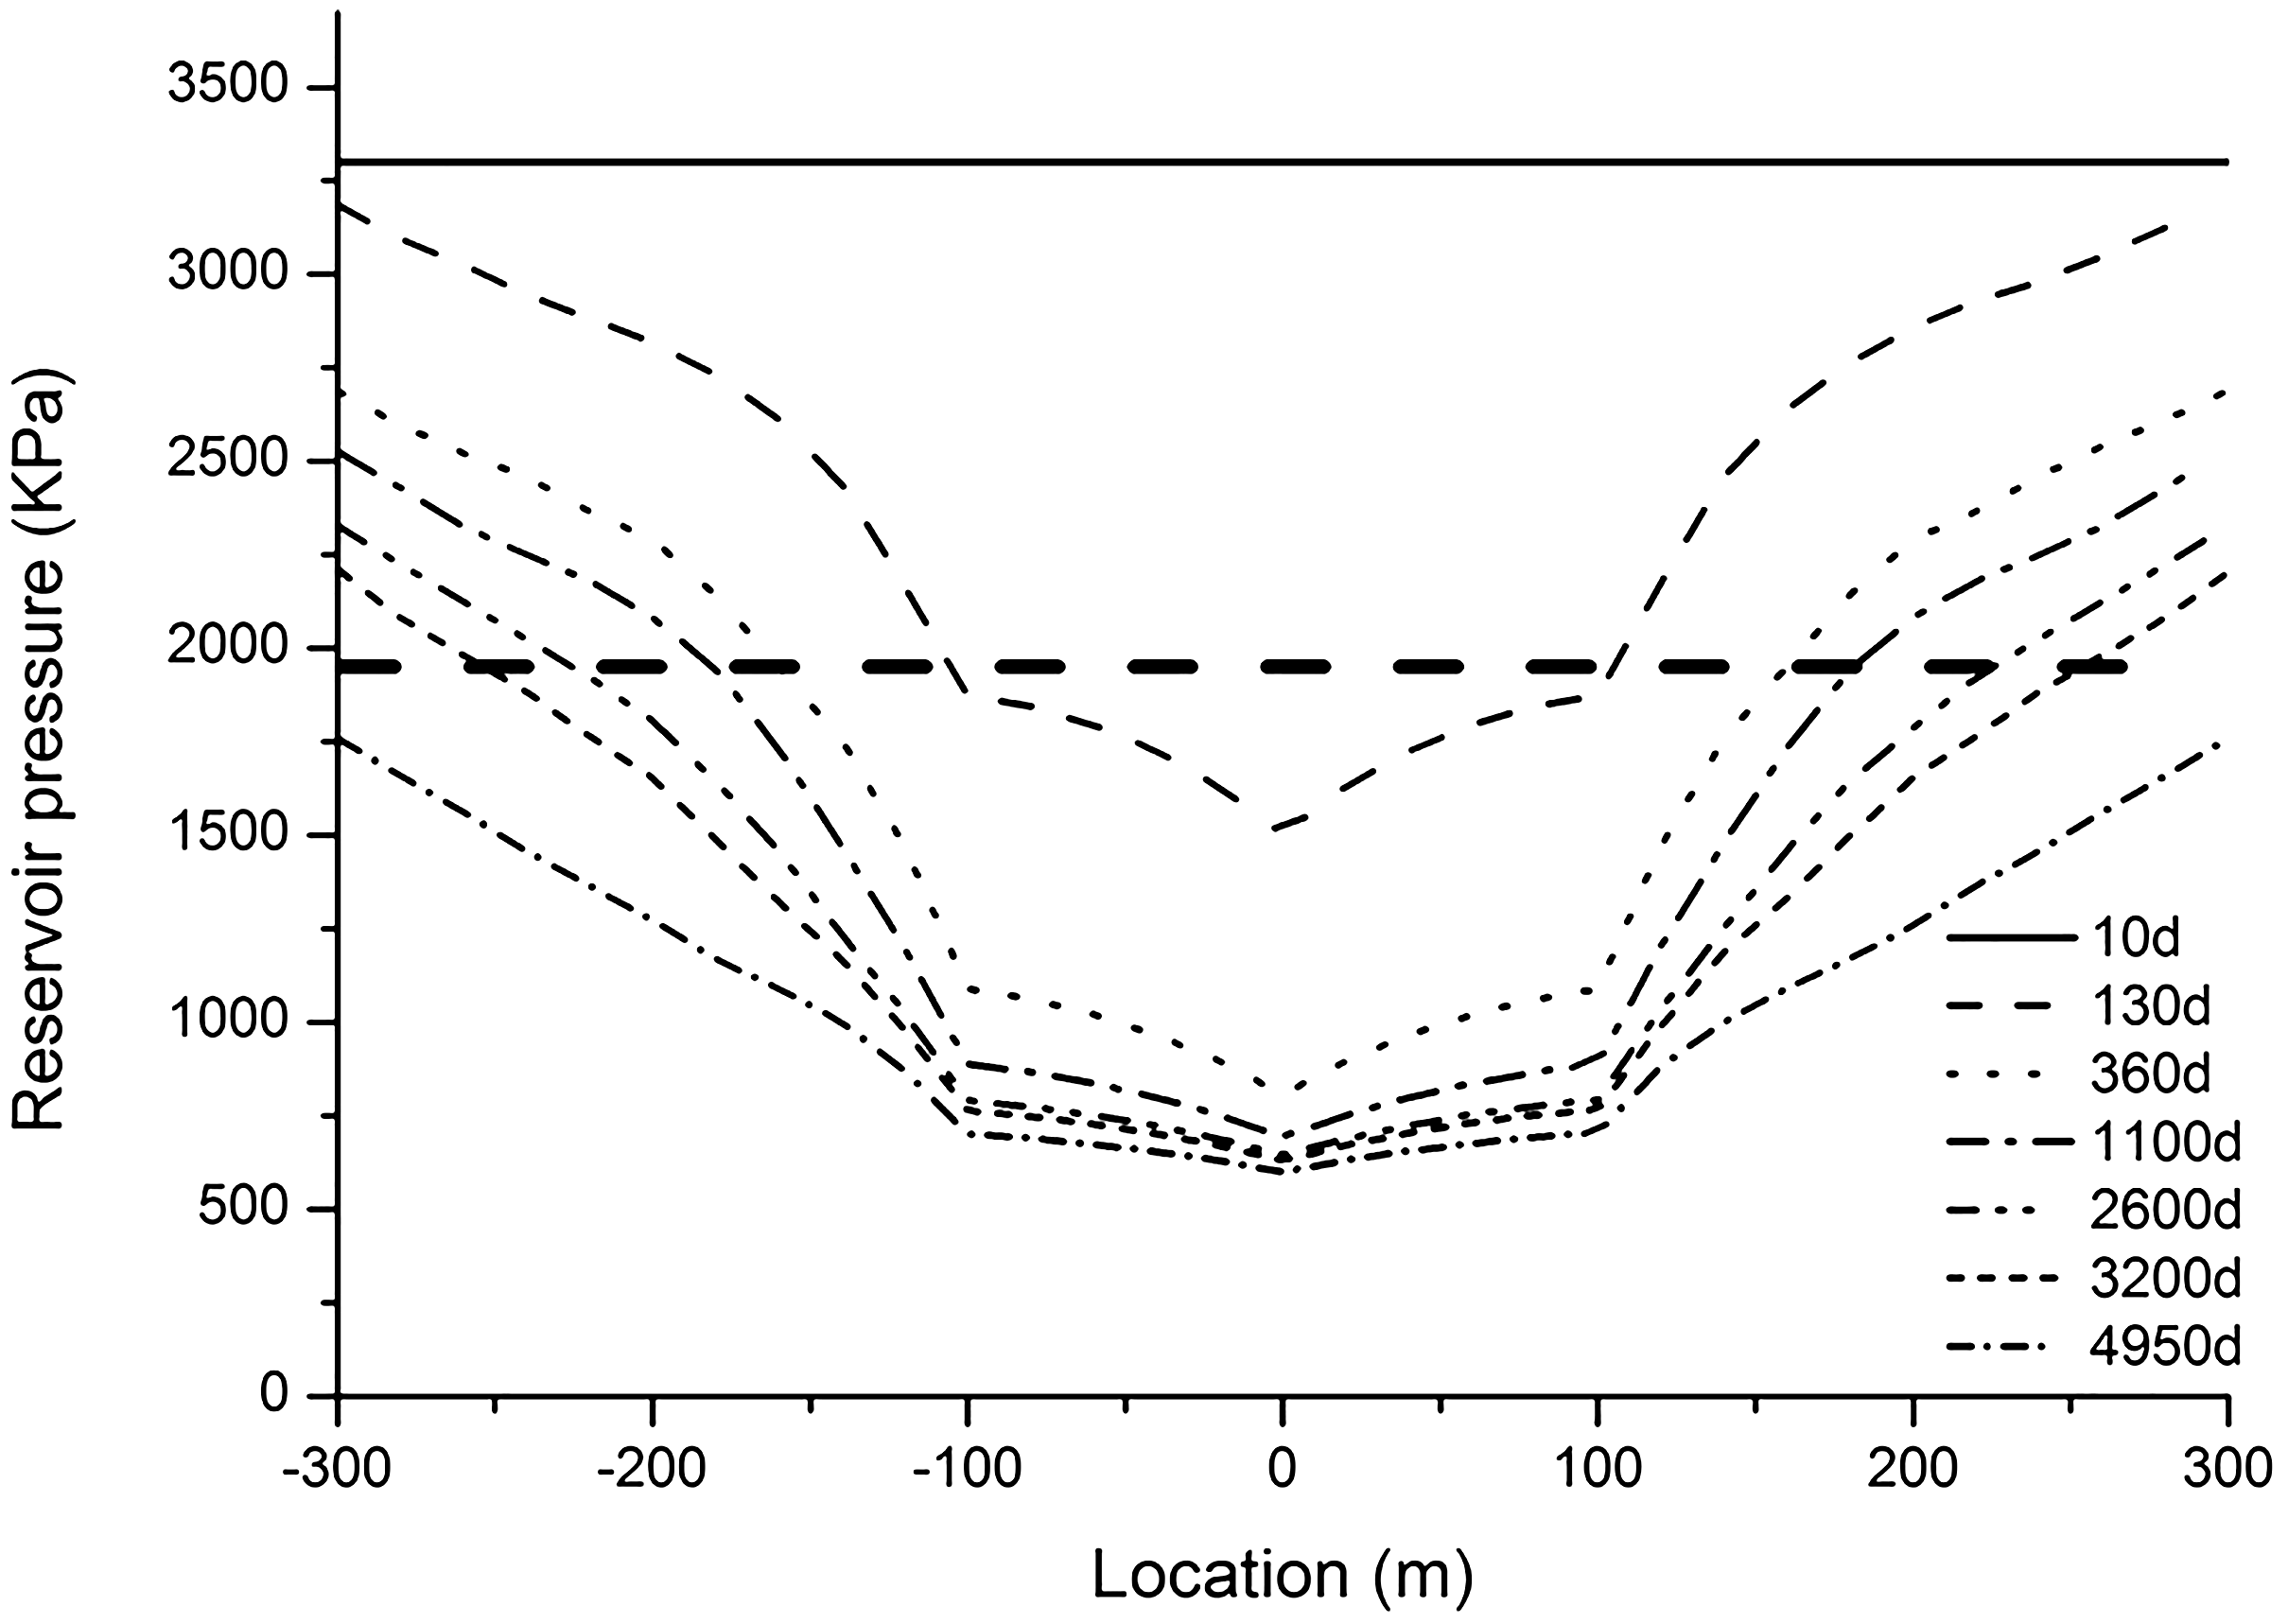
Decline of reservoir pressure during drainage process.
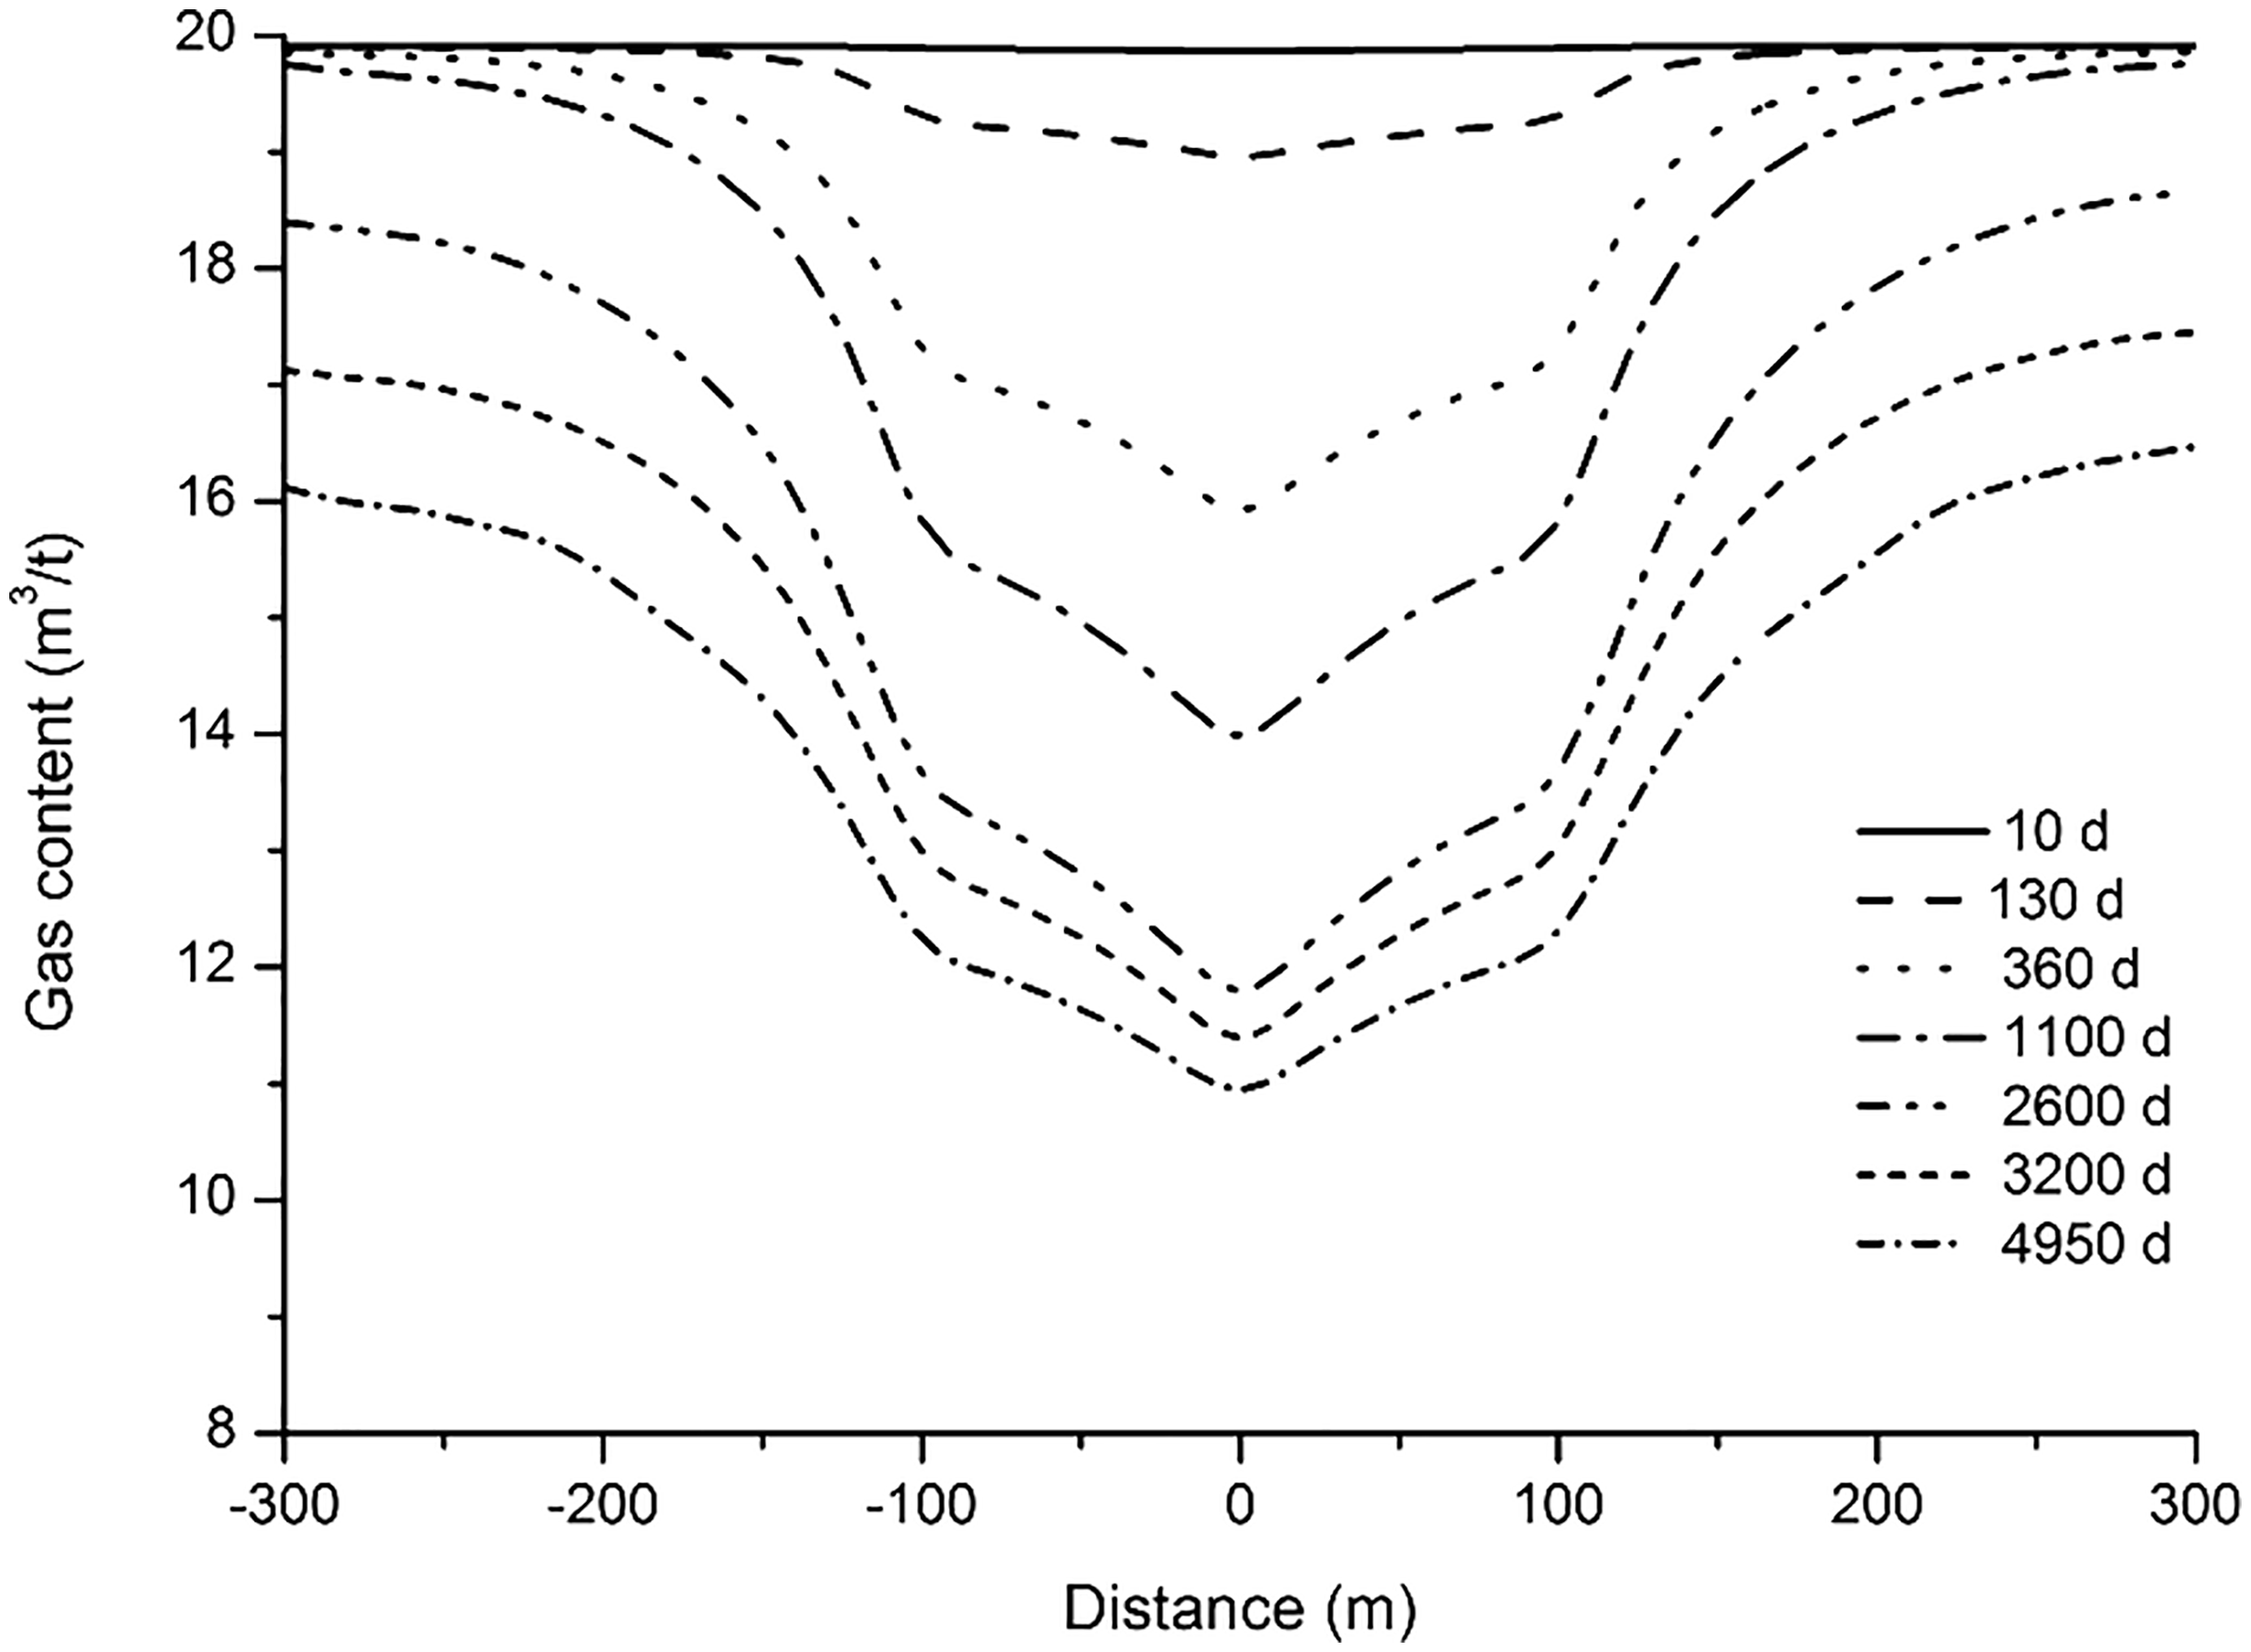
Decline of gas content during drainage process.
Evolution of effective desorption radius
According to data of reservoir pressure at each grid node, a time evolution of effective desorption radius is drawn, as shown in Figure 8. It can be seen that the evolution of effective desorption radius can be divided into two stages within the desorbed gas drainage time. Stage I lasts about 3800 days, and the effective desorption radius increases linearly as time processing in this stage, with a highest value of about 370 m. The remaining time is stage II, and the effective desorption radius keeps quite stable in this stage, with a value of about 380 m.
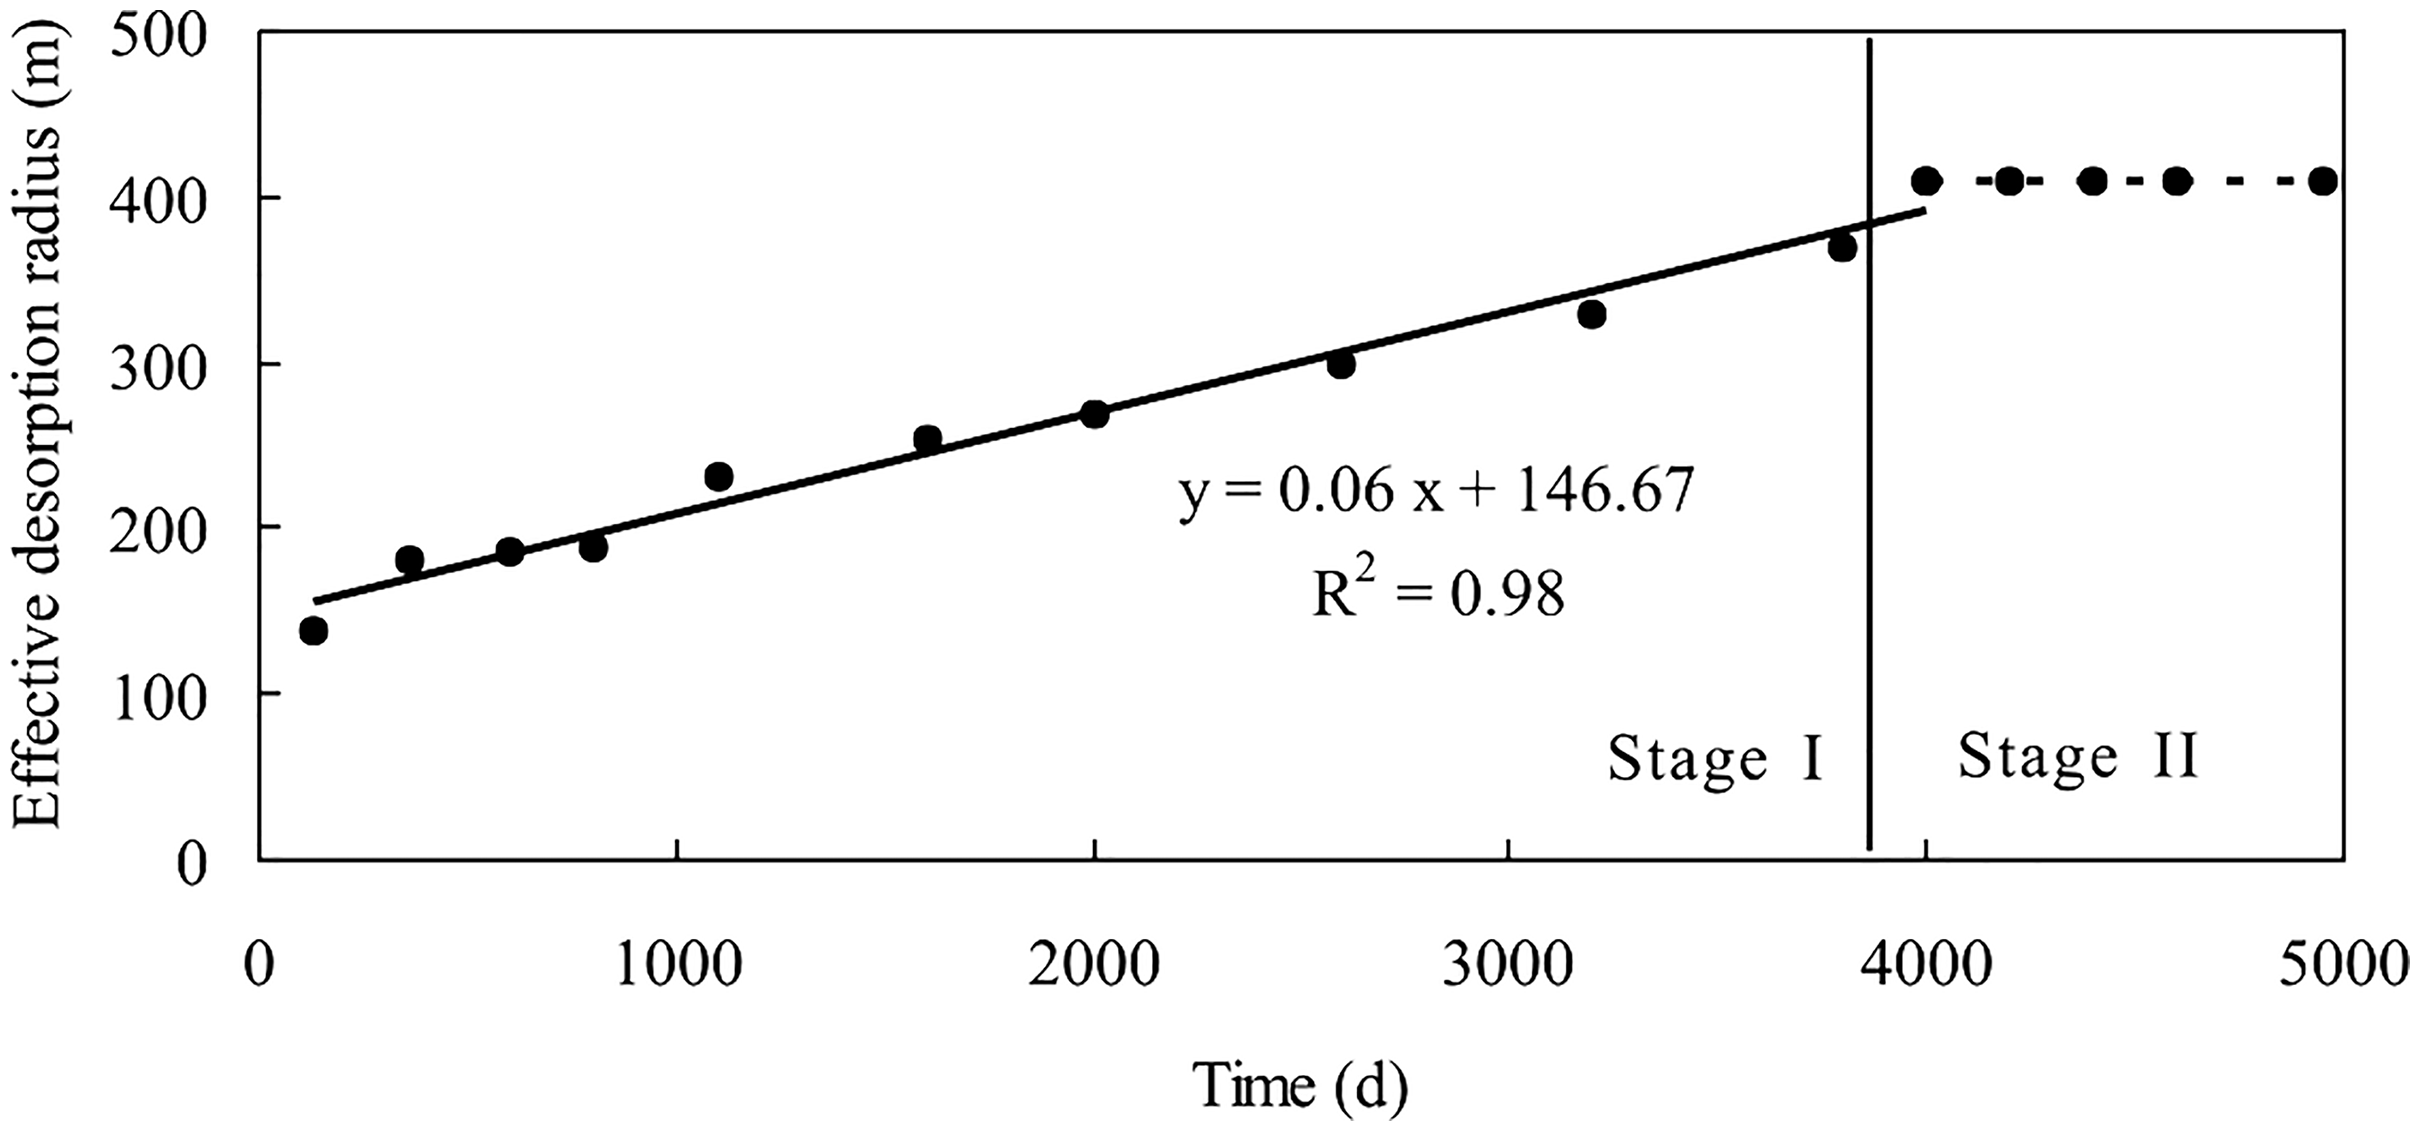
Evolution of the effective desorption radius.
Variations of DRPCDP and gas content decline
Based on simulation results, both variations of DRPCDP and gas content decline can be obtained. Taking the place of well bore as an example, the two variations are plotted as shown in Figure 9. It can be seen that the two parameters change with a similar manner, and they both increase dramatically first and keep stable afterwards.
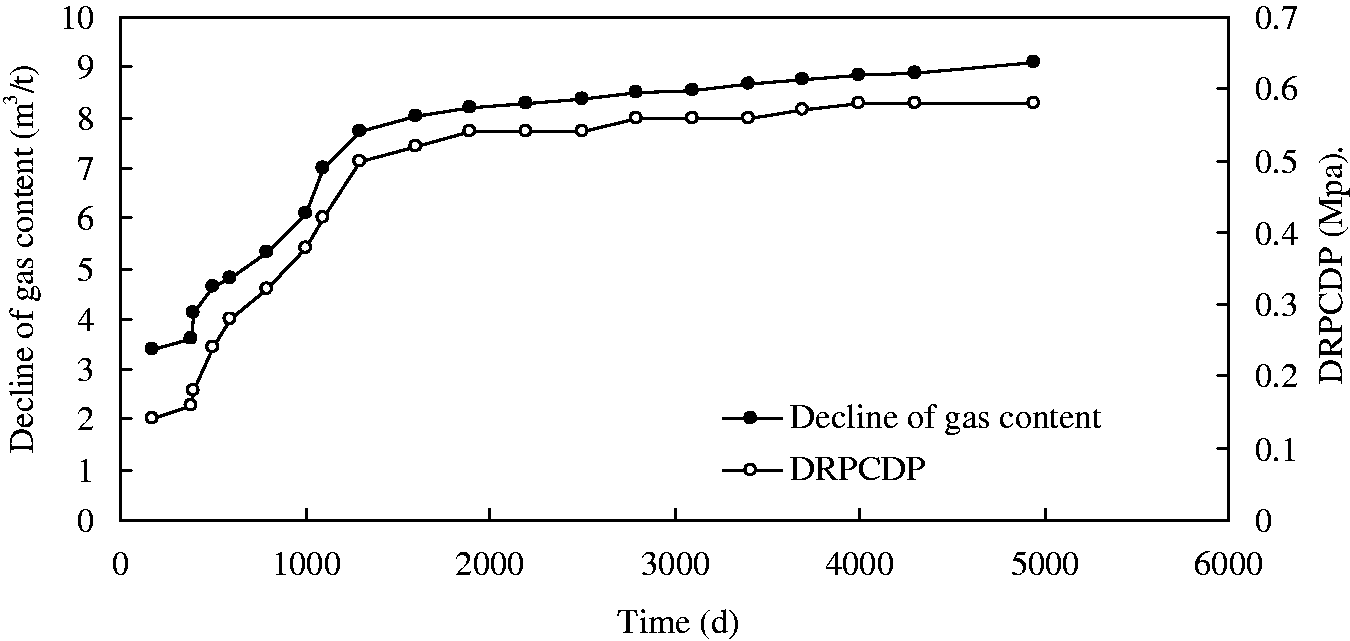
Variations of the decline of gas content and the DRPCDP.
In section ‘Gas production modeling’, it is supposed that DRPCDP is a measure of gas content decline. To prove it, the relationship between DRPCDP and gas content decline at well bore is plotted as shown in Figure 10. It shows that there is indeed a strong linear relationship between them, with a high fitting degree of 0.9951. Therefore, the supposition holds.
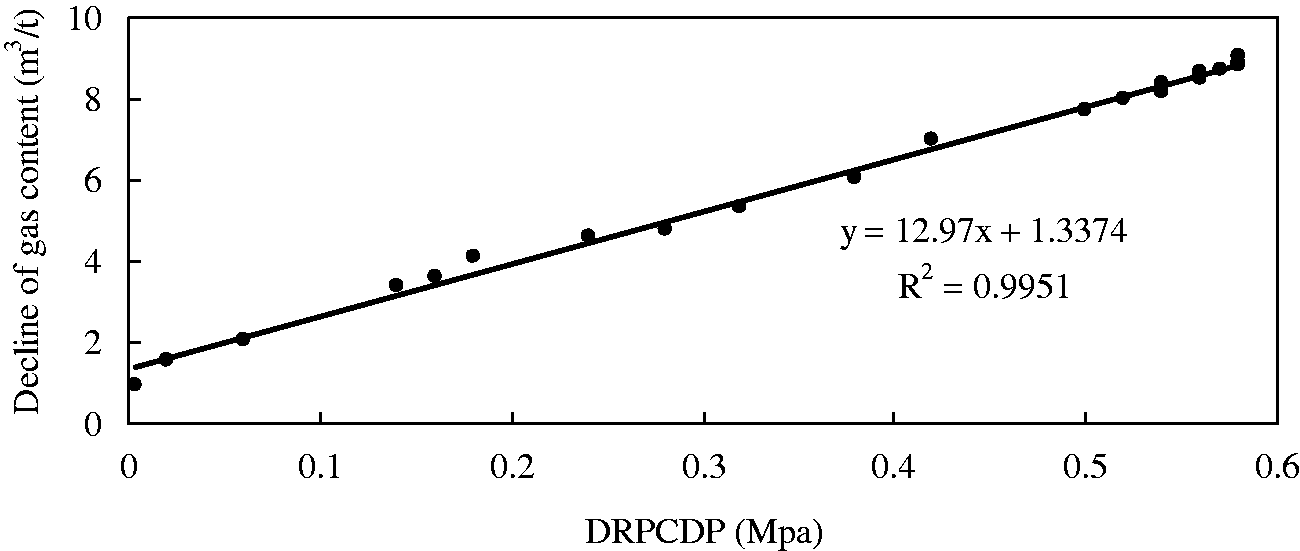
Relationship between DRPCDP and decline of gas content at well bore.
Model evaluation
Following cognitions can be obtained from the established models of equations (8) and (9). First, the cumulative gas production depends on both effective desorption radius and DRPCDP. Second, if there is enough gas resource in the drainage area, a slow decrease of reservoir pressure and a continuous expansion of effective desorption radius can lead to an incessant desorption, permeation and output of the CBM resource.
Reservoir parameters influencing CBM productions can be divided into two types. The first type reveals the potential gas resources, containing coal thickness, gas content, etc. They influence both the potential resource and desorption quantity. The second type refers to migration parameters, including porosity, permeability, etc. Parameters of this type control both the migration condition within pore systems and the area where migration occurs. Equation (9) is derived from equation (7), of which parameters are bottom hole pressure, critical desorption pressure, effective desorption radius and coal thickness. Effective desorption area is the place where desorption occurs, and its radius is strongly influenced by migration parameters. Bottom hole pressure decreases when gas and water migrate from pore system to well bore and then pump out, and therefore it is also controlled by migration parameters. Critical desorption pressure corresponds to the pressure, below which gas starts to be desorbed. Higher critical desorption pressure reflects a higher gas content, so it is a measure of gas content. As a result, equation (9) contains all reservoir parameters influencing gas productions, and it can be theoretically and practically used to predict gas productions for a CBM well.
Conclusions
Based on effective desorption radius and DRPCDP, this paper builds a prediction model for CBM production. The model suggests that the cumulative gas production is a product of square of effective desorption radius with DRPCDP, and there is also a cubic polynomial relationship between cumulative gas production and linear average DRPCDP. A typical CBM well named well PM01 located at southern Qinshui basin of China is selected as a case, and the commercial CBM reservoir simulation software-COMET3 is used to simulate the gas performance. The simulated and modeled cumulative gas productions are 1261 × 104 m3 and 1293 × 104 m3, respectively, which indicates that the simulated data match well with the modeled data and the model has a good accuracy. For a CBM well, combined with data of gas production, bottom hole pressure and some basic laboratory experiments, this model can be used to predict gas performance conveniently and accurately.
Footnotes
Declaration of conflicting interests
The author(s) declared no potential conflicts of interest with respect to the research, authorship, and/or publication of this article.
Funding
The author(s) disclosed receipt of the following financial support for the research, authorship, and/or publication of this article: The authors wish to acknowledge financial supports of this study by the National Natural Science Foundation of China under Grant Nos. 41702168, U1704243 and 51408222, the Start Project of High Level Researchers of North China University of Water Resources and Electric Power (No. 40439), and the Innovative Science Support for Junior Researchers of North China University of Water Resources and Electric Power (No. 70466).