
Abstract
The lithospheric thermal structure has a profound indicative significance for the potential evaluation and exploration of geothermal resources. The Linyi geothermal field, located in the southern section of the Yishu fault in Shandong Province, boasts abundant geothermal resources. However, its origin is still unclear. This study analyzed the characteristics of terrestrial heat flow using the temperature logging of geothermal wells and measurements of thermal conductivity and heat production. Combined with the geophysical information of the Xiangshui (Jiangsu Province)-Mandula (Nei Mongol) geoscience transect and the lithology revealed by the geothermal wells, this study built a conceptual model of the lithospheric thermal structure using the one-dimensional steady-state heat conduction equation. Based on this model, the heat flow is 64.9 mW/m2, indicating a high geothermal setting in the study area. Furthermore, the ratio of crustal to mantle heat flow is < 1 (0.67), implying that surface heat flow originates predominantly from the mantle. The Yishu fault probably acts as a pathway for heat transfer from the mantle. The temperature of the Moho boundary in the study area was estimated to be 614.8 °C. The Curie depth was calculated to be 29.5 km (585 °C), which is consistent with the depth estimated using the aeromagnetic data. In sum, the Linyi geothermal field has a high geothermal setting, which contributes to the formation of geothermal resources.
Introduction
Geothermal resources are valuable sources of renewable and clean energy (Liao et al., 2022a, 2022b, 2022c; Liu et al., 2020; Ma et al., 2022; Xi et al., 2021; Yue et al., 2019). The lithospheric thermal structure is an important geophysical parameter for analyzing the formation and evaluating the potential of geothermal resources (Liu et al., 2021; Zhang et al., 2018). It is constrained by crustal and mantle heat flow, thermal conductivity, and the heat production rate of rocks (Prol-Ledesma and Moran-Zenteno, 2019; Tang et al., 2018; Xu et al., 2011). Terrestrial heat flow density (heat flow), one of the most important parameters of the lithospheric thermal structure, denotes the heat flux per unit time per unit area from the Earth's interior to the surface (Wang et al., 2015). Heat flow plays a key role in the calculation of the lithospheric temperature, which is crucial for understanding the genetic mechanism of geothermal energy.
Previous study results of heat flow in Shandong Province are shown in Table 1 and Figure 1 (Gong et al., 2005; Jiang et al., 2019; Jiang et al., 2016; Zhang et al., 1982). Most of the heat flow is distributed in the North China depression. Specifically, three peak values (about 80 mW/m2) fall on the heat flow contour line to the north of Heze, Binzhou, and Dongying cities. In comparison, all the heat flow values in the Luxi terrane are relatively low, mostly below 71 mW/m2. One low-amplitude anomaly (48.1–71 mW/m2) is visible in the center of Luxi terrane (Laiwu City). However, most of the high heat flow values in the Luxi terrane are distributed along the Yishu fault, including the maximum heat flow value of 70.1 mW/m2 (Gong et al., 2005). In terms of the Jiaobei terrane, multiple heat flow values are visible only on the northern margin. Two anomalous areas have been delineated based on these values: (1) a high-amplitude anomaly with heat flow values ranging from 71.8 to 98.7 mW/m2, and (2) a low-amplitude anomaly with heat flow values of 46.5−61.1 mW/m2. It is noteworthy that the high-amplitude anomaly is closer to the Yishu fault than the low-amplitude anomaly. The Yishu fault is also known as the Tanlu fault (Tancheng-Lujiang) in Shandong Province. The Tanlu fault is a deep-seated, NNE-trending fault in eastern China, with a length of > 3000 km (Deng et al., 2013). This fault has undergone multistage structural deformations since the Mesozoic. In particular, the extensional deformation during the Cretaceous promoted the upwelling of mantle materials and the formation of igneous rocks (Tao and Liu, 2000). Therefore, the Yishu fault is spatially associated with the high-amplitude anomaly of regional heat flow. However, the genetic relationship between the Yishu fault and the geothermal resource around it is still unclear.
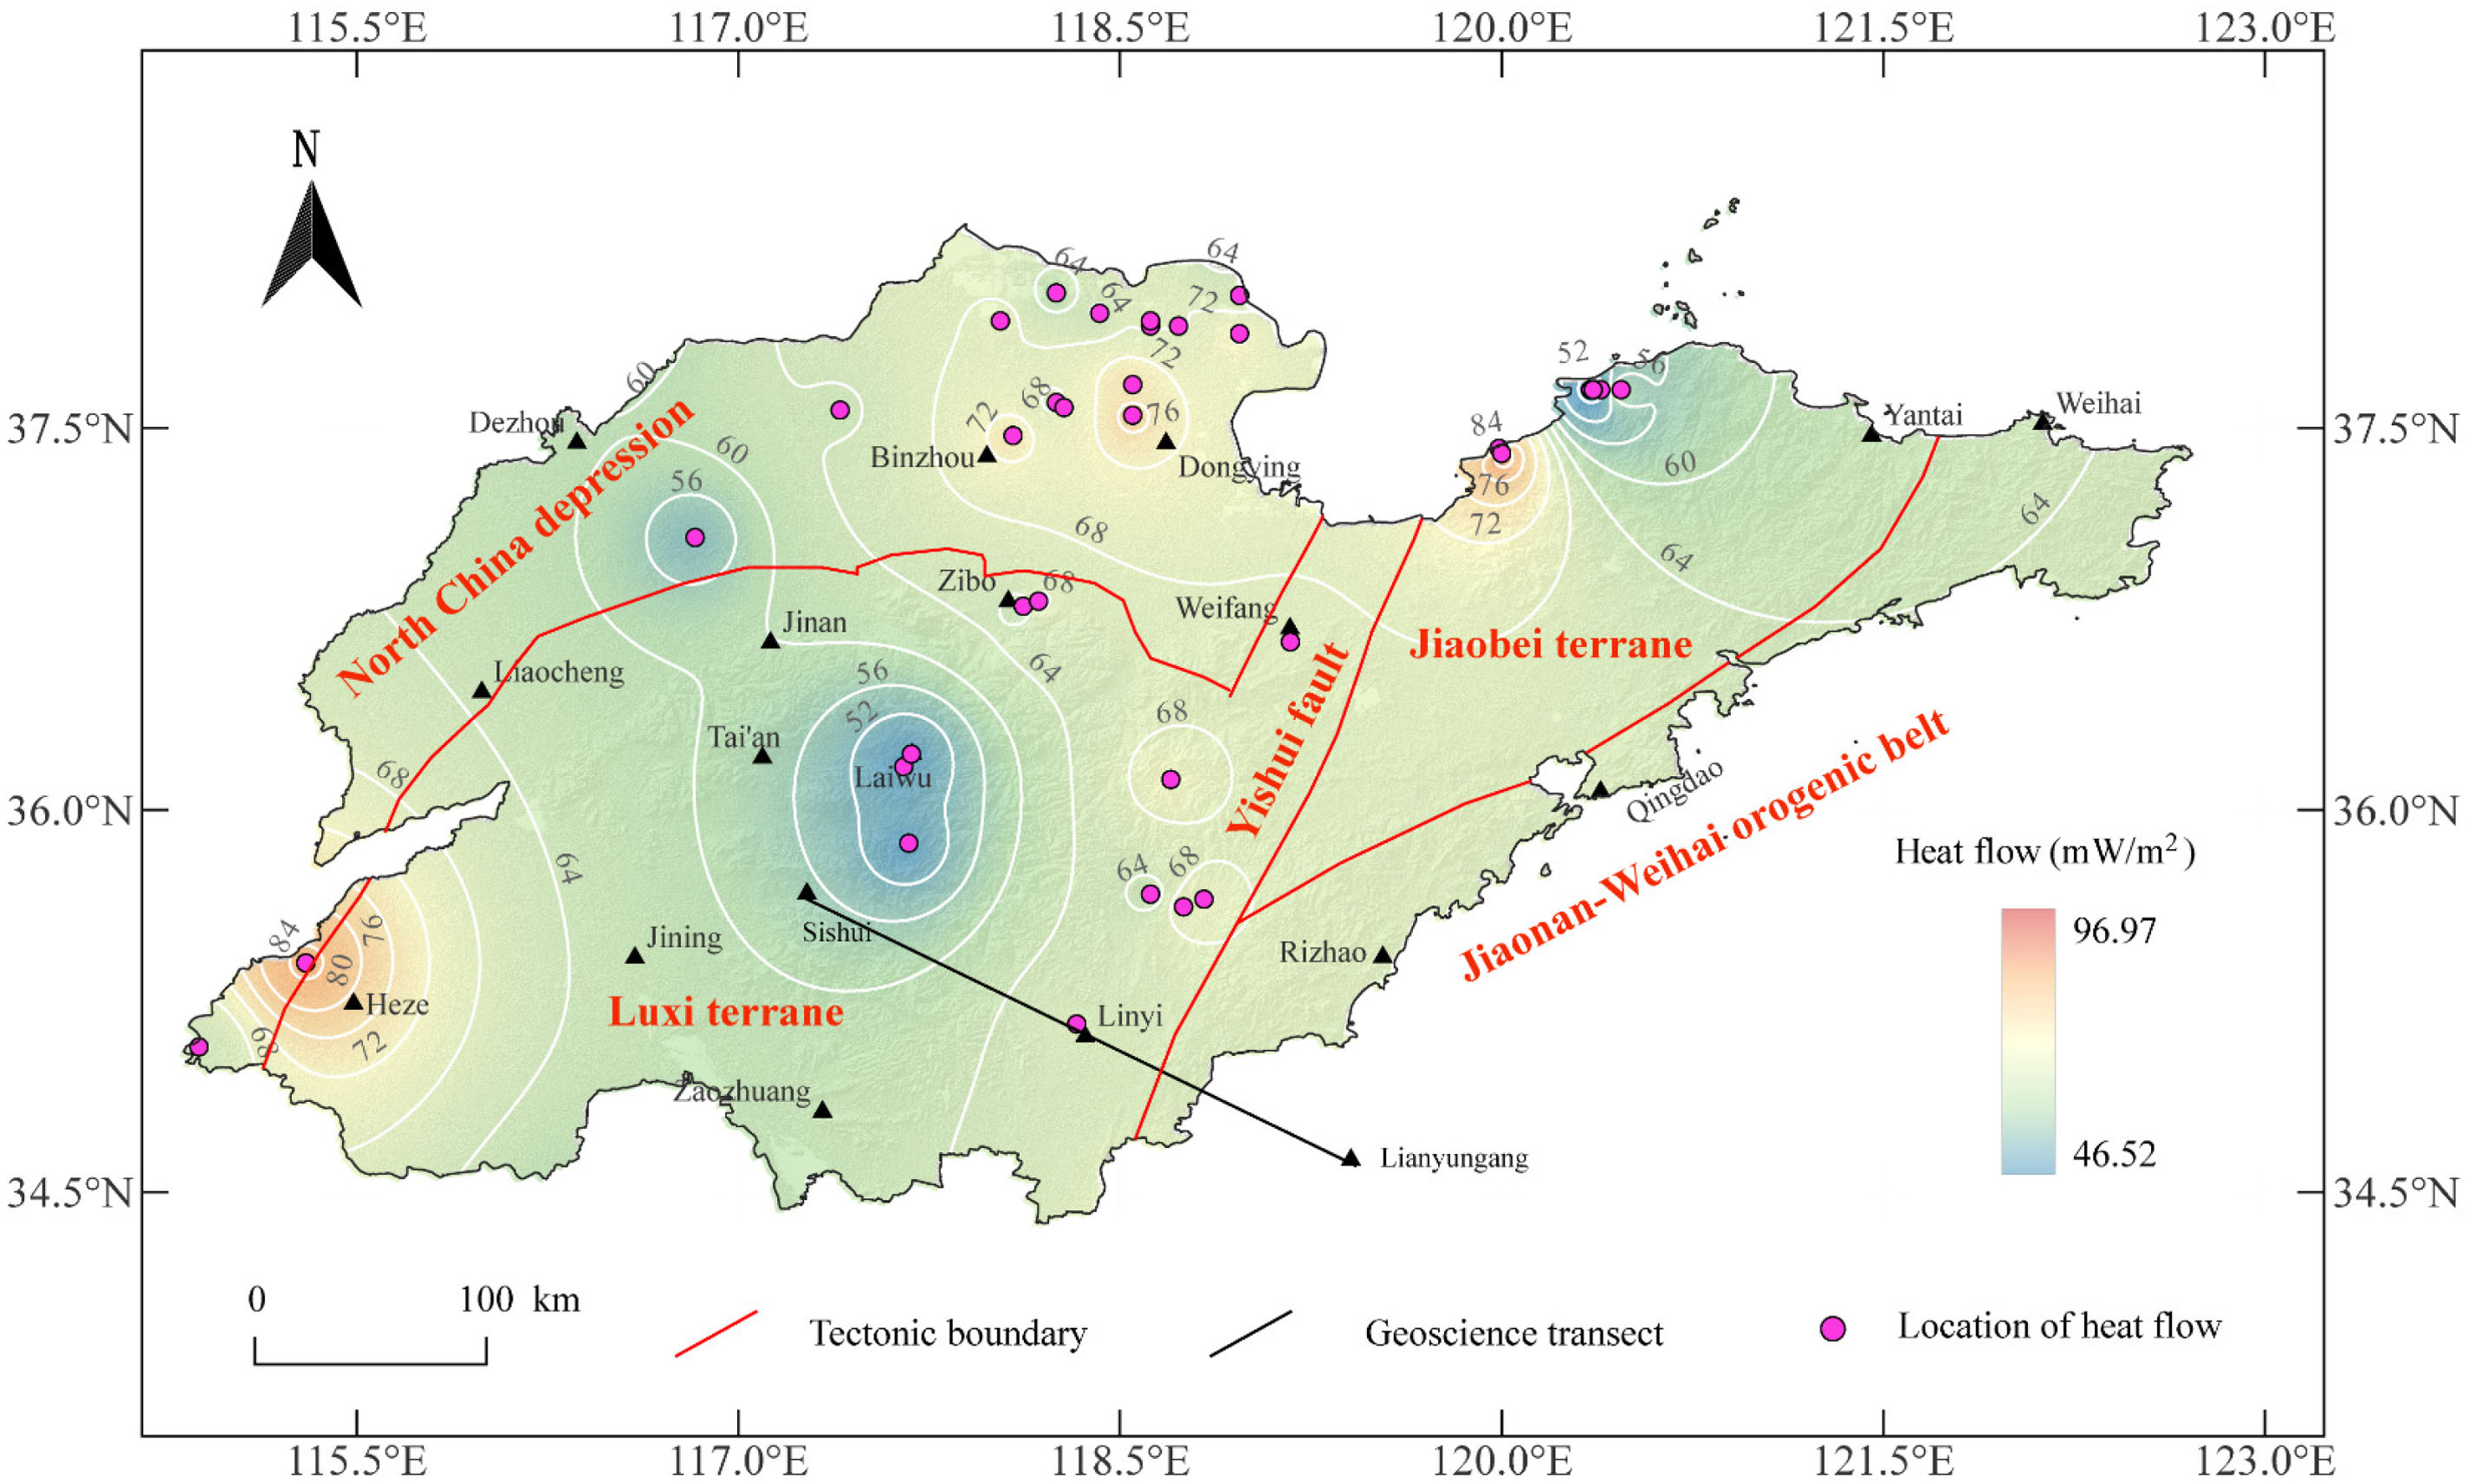
Terrestrial heat flow distribution and geotectonic map of Shandong province (modified after Fang (2006)).
Previous terrestrial heat flow in Shandong province.
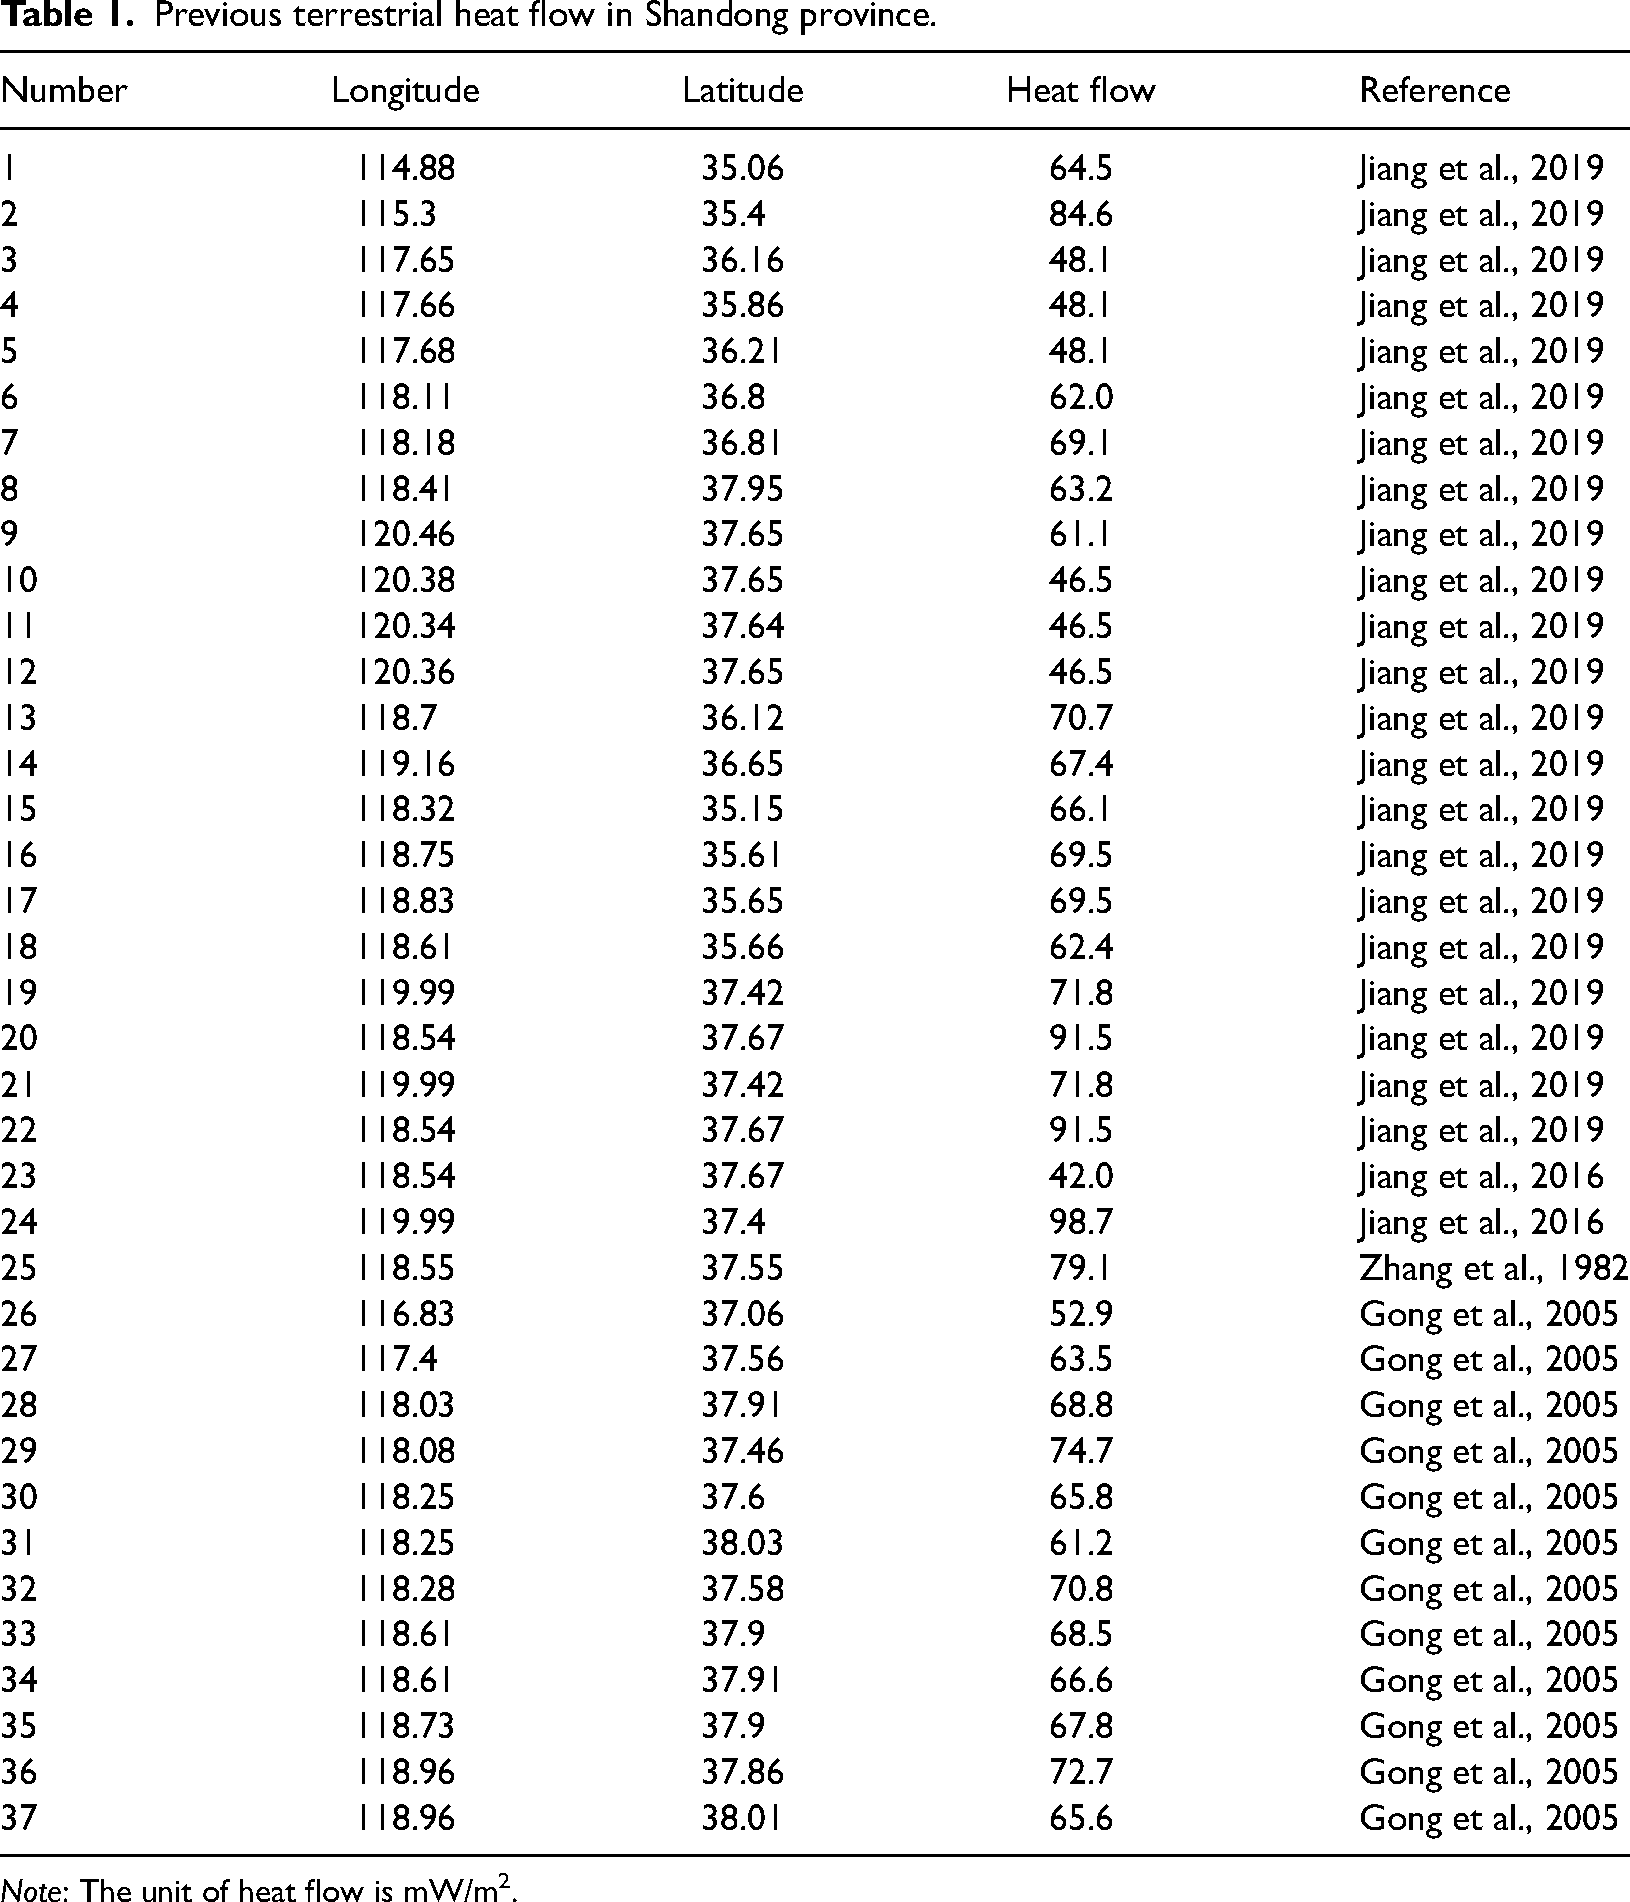
Note: The unit of heat flow is mW/m2.
This study focuses on the heat flow and the lithospheric thermal structure of the Linyi geothermal field located along the southern section of the Yishu fault (Figures 1 to 3). The geothermal water there is moderate- to low-temperature (28−75 °C) and has hydrochemical of Cl-Na·Ca, Cl·SO4-Na, and Cl·HCO3-Na·Ca. Geothermal water has high fluorine and metasilicate concentrations. Its total dissolved solids (TDS) and pH are 0.6−3.8 g/L and 7−8.5, respectively. Many geothermal wells have been drilled in this field for geothermal exploration (Figure 3), including wells in Liuhangtou (LHT-ZK1), Guantang (GT-ZK1), Xinxingcun (XXC-ZK1), Qianhanyancun (QHYC-ZK1), Xvjiahu, Tongjing, Songshan, Zhichunhu, Tangtou, Baita, Tangyafang, Baishabu, Nanfang, and Luozhuang. Four typical geothermal wells (LHT-ZK1, GT-ZK1, XXC-ZK1, and QHYC-ZK1) were selected to investigate the heat flow characteristics of the Linyi geothermal field. The heat flow in the study area was obtained through temperature logging, conductivity measurement, and heat production rate analysis of the rock samples. By utilizing the lithospheric structure derived from geoscience transects in the study area, the lithospheric thermal structure was constructed to analyze the geothermal setting of the Linyi geothermal field and its genetic relationship with the Yishu fault. Furthermore, this study promotes the understanding of the genetic mechanism of fracture-controlled geothermal resources genetically.
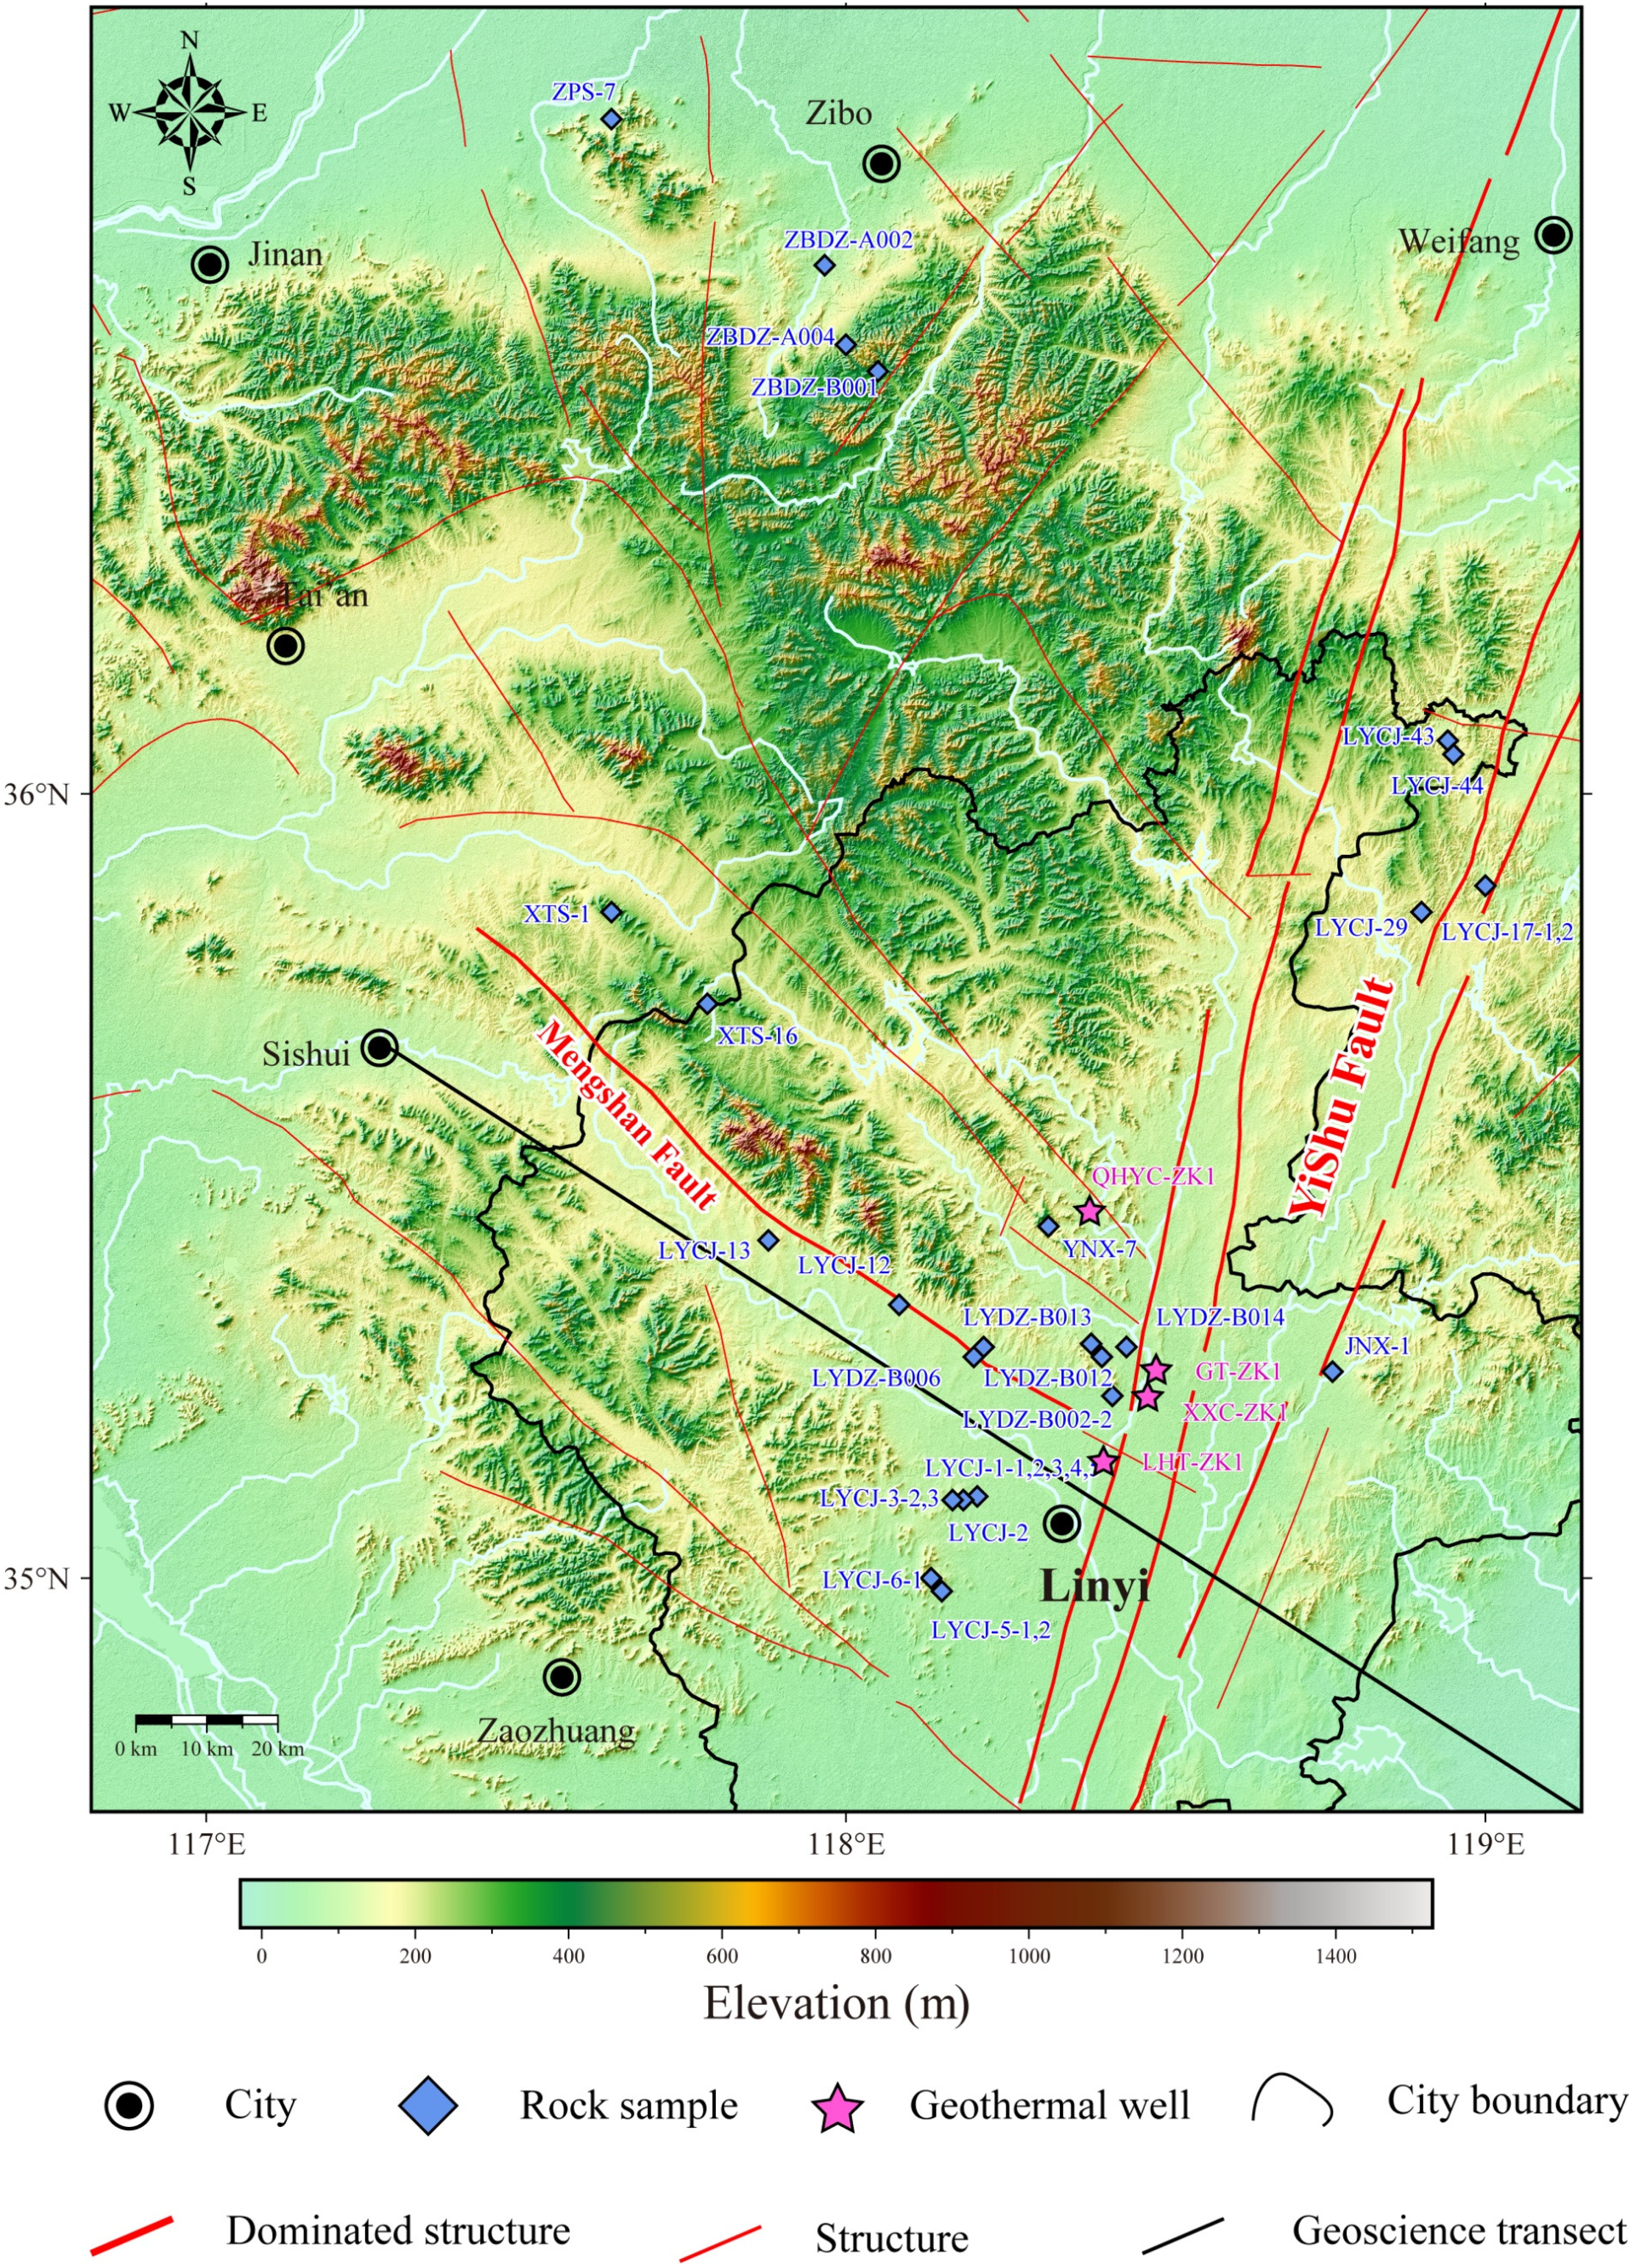
The location of the geothermal well and rock samples in the study area.
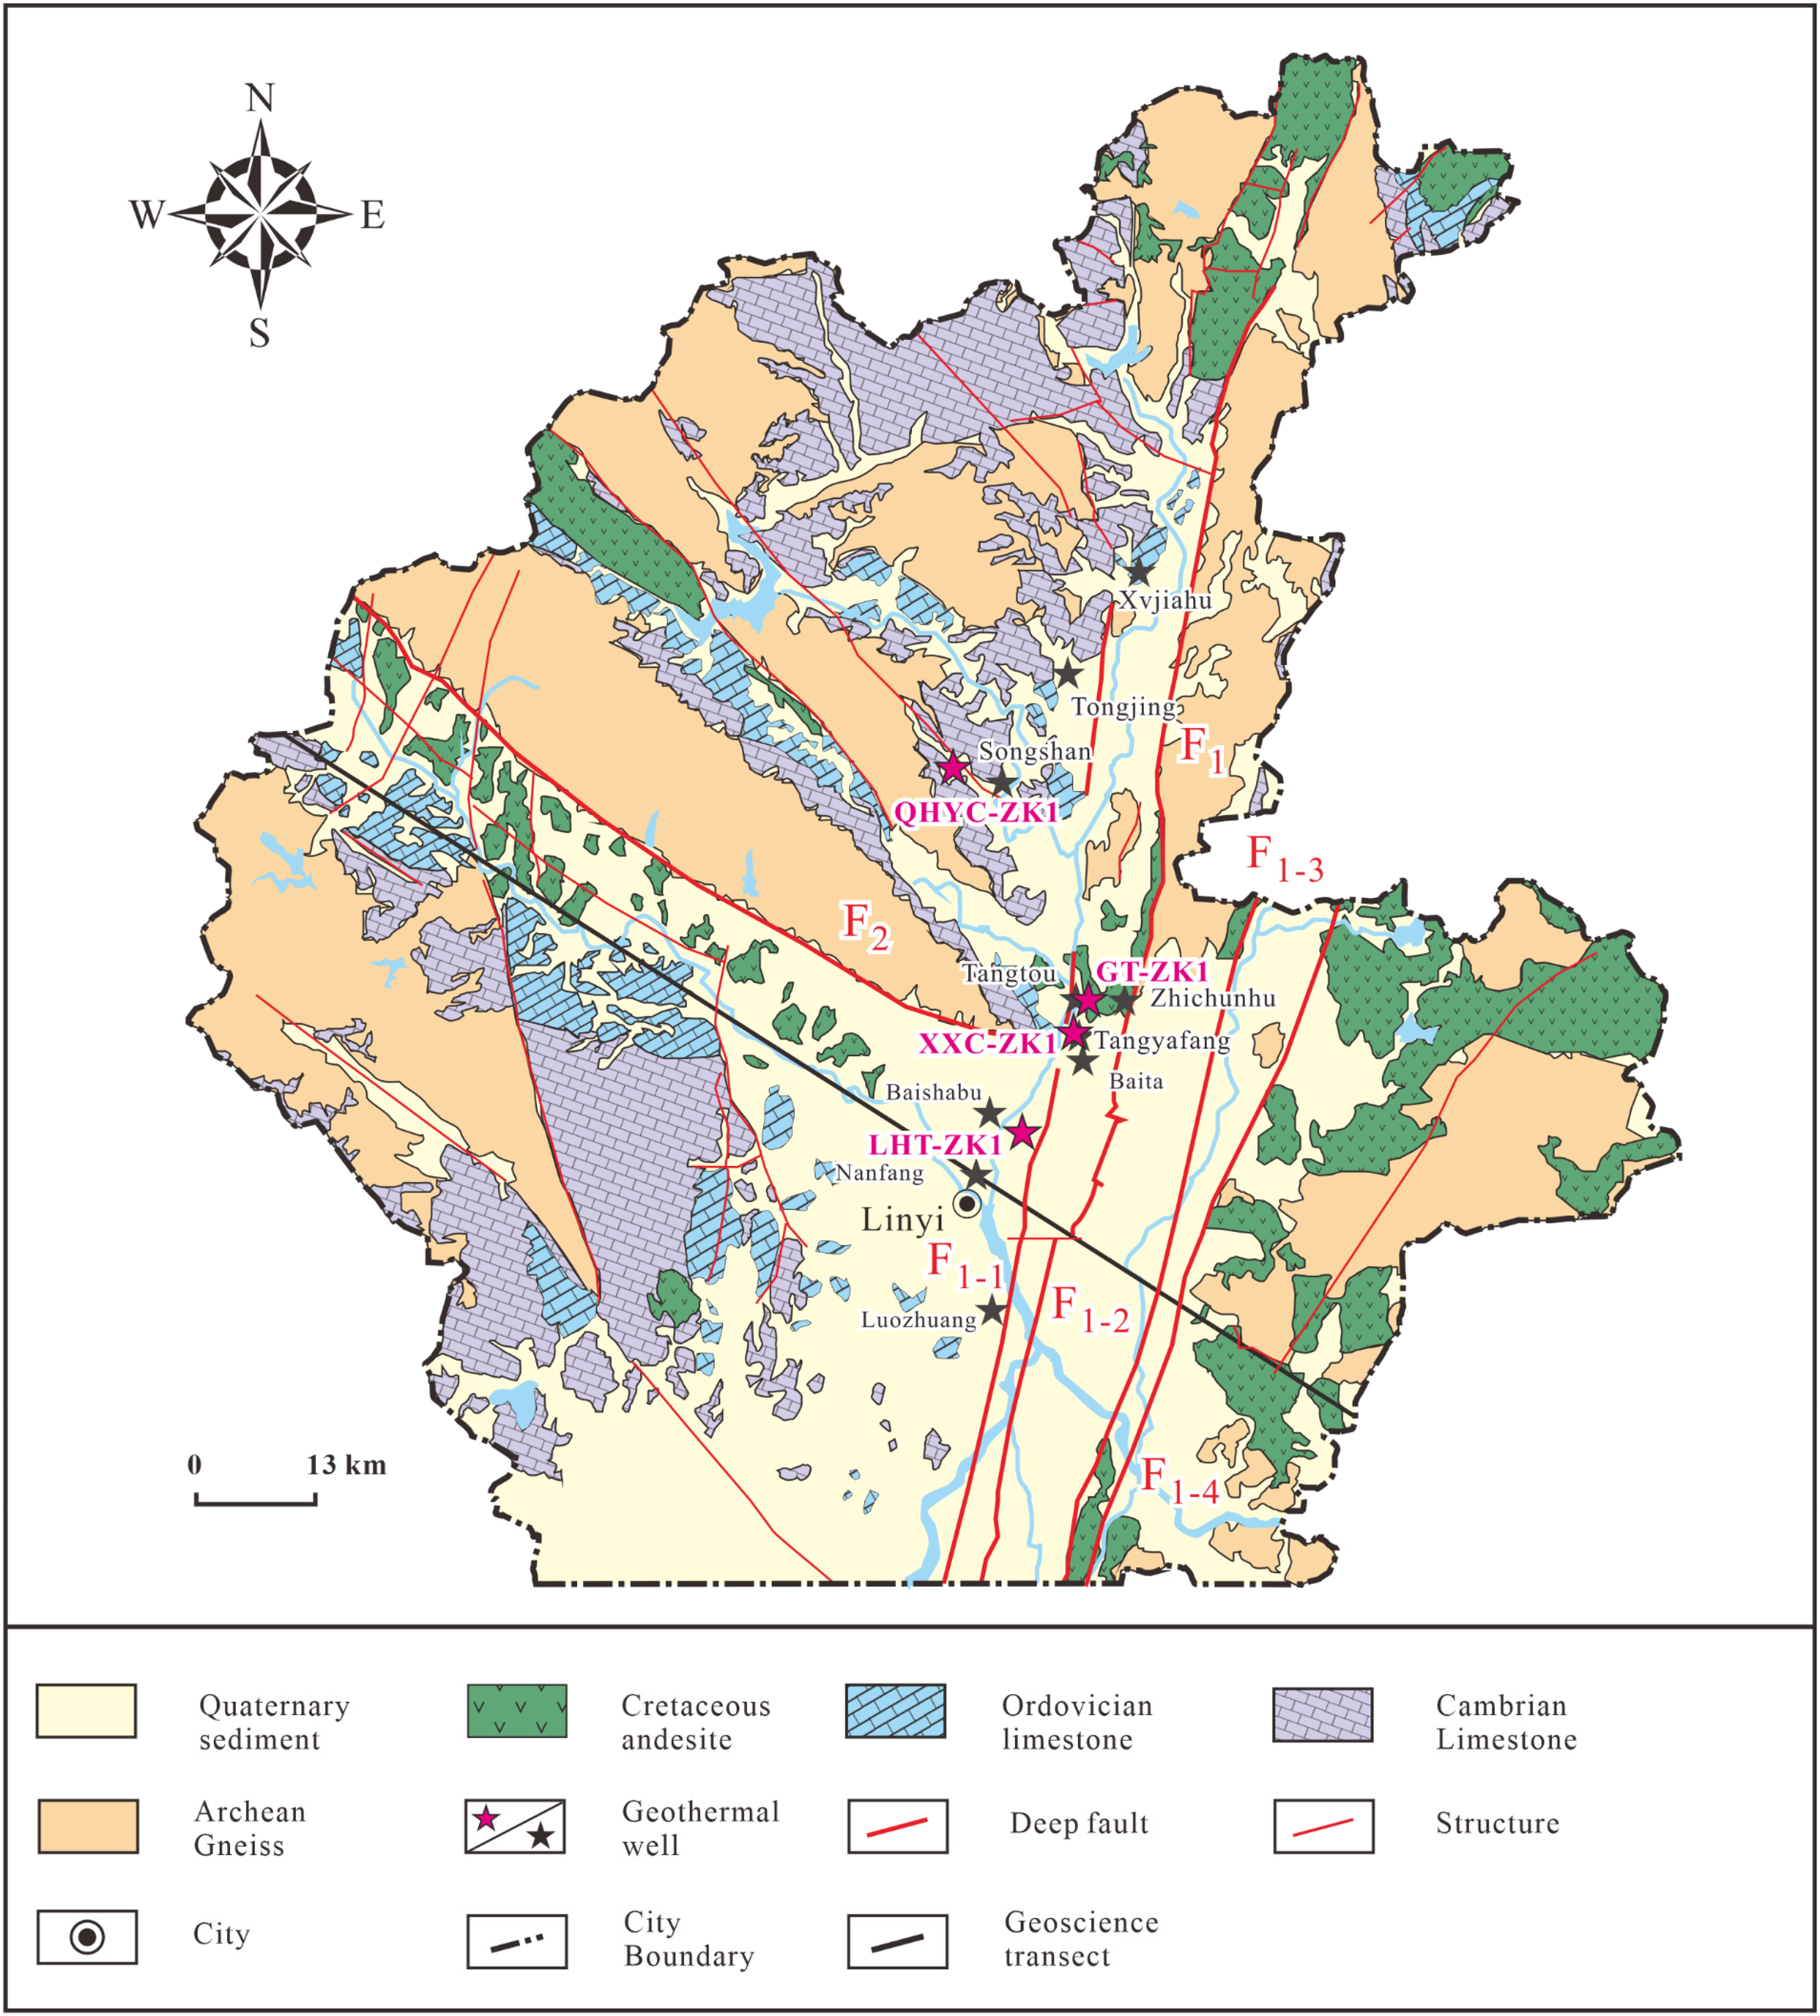
Schematic geological map of Linyi geothermal field (modified after Wang and Zhu (2018)).
Geological setting
Shandong Province is located in the southeast of the North China Plate and consists of four tectonic units, namely the North China depression, the Luxi terrane, the Jiaobei block, and the Jiaonan-Weihai orogenic belt (Figure 1). The Linyi geothermal field is distributed in southern Shandong Province (Figures 1 to 3), and the Yishu and Mengshan faults are the dominant structures in this geothermal field. As shown in Figures. 2 and 3, the Yishu fault zone runs in the NNE direction (10°−25°) from Tancheng in the south to Bohai in the north (Fang, 2006; Li, 2010), with a length of 330 km and a width of 20−60 km. This fault consists of four secondary faults: the Tangwu-Gegou fault (F1-1), the Yishui-Tangtou fault (F1-2), the Anqiu-Juxian fault (F1−3), and the Changyi-Dadian fault (F1−4). As shown in Figure 3, the Tangwu-Gegou fault (F1-1) is a normal fault with a high dip angle (80°) and a dip direction of 10°–23° (Li, 2010). The Yishui-Tangtou fault (F1-2) is a sinistral compressional fault in the NNE direction (10°−25°), with a dip angle of 35°−56° (Shi, 2014), a length of 13 km, and a width of 80−460 m. The Anqiu-Juxian fault (F1−3) runs in the NNE direction (10°−20°), with a high dip angle of 60°−80° (Wang et al., 2005), and a width of 0.5−2.5 km (Li, 2010). The Changyi-Dadian fault (F1−4) is a large-scale, regional, deep-seated fault that extends to the Moho boundary. Generally, these four secondary faults of the Yishu fault form a structural framework of a graben with two wings and a horst in the center. The Mengshan fault is a normal and sinistral strike-slip active fault with an NW trend (Li et al., 2014).
In terms of the sedimentary layer (Figure 3), the Linyi geothermal field mainly comprises Quaternary sediments, Ordovician limestones/dolomites, and Cambrian limestones/dolomites. The igneous rocks in the study area are dominated by Cretaceous andesites, andesitic tuffs, agglomerates, and porphyrites (Wang et al., 2007). The Archean metamorphic rocks in the geothermal field are dominated by gneisses with a small quantity of granulites (Wang and Zhu, 2018).
Methods
Lithospheric thermal structure
Generally, the crust is divided into four layers: a sedimentary layer, and the upper, middle, and lower crustal layers. The bottom of the lithosphere, that is, the contact surface between the lower crust and the mantle, is the Moho boundary (Wang et al., 2015).
Since the primary seismic wave velocity (P-wave velocity, Vp) varies with the variation of petrophysical properties, Vp is distinct in each layer (Deng et al., 2013). The discontinuity makes Vp an important indicator of the interface of each layer (Su et al., 2016). The geophysical structure of the study area (Figure 4) was built based on the Xiangshui-Mandula P-wave velocity profile (Ma et al., 1991).
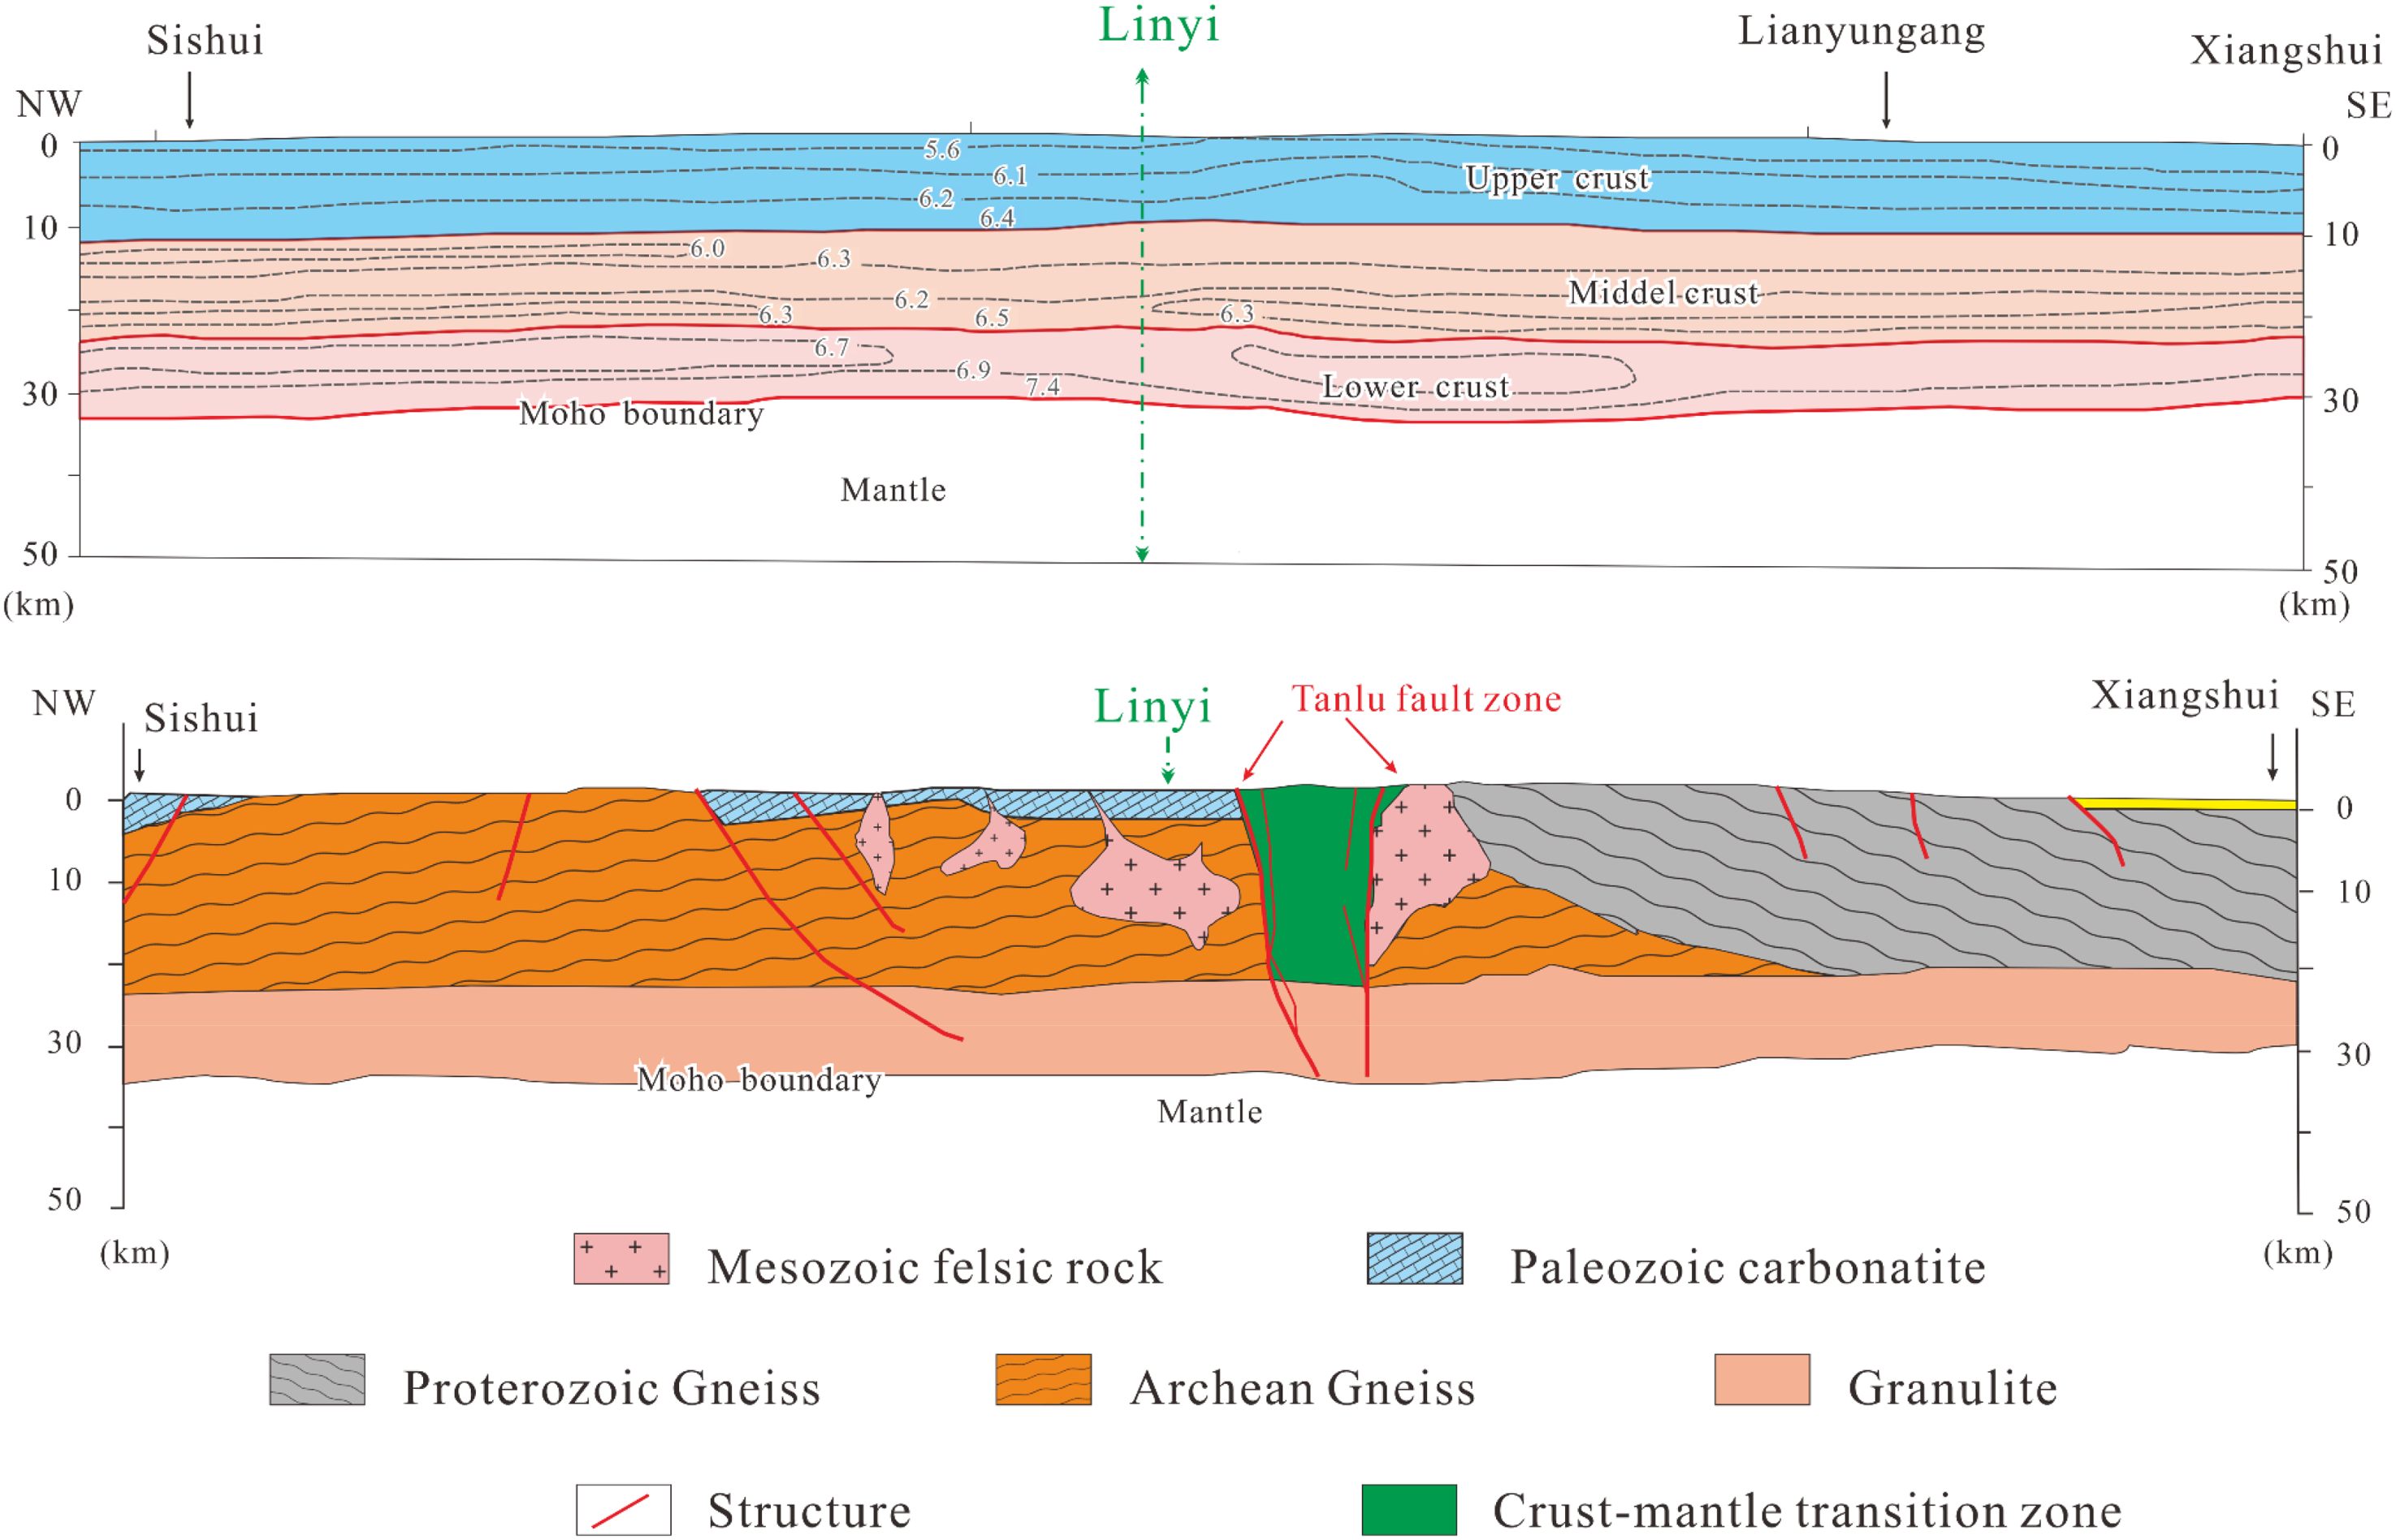
Science transect of Xiangshui (Jiangsu province)-Mandula (Nei Mongol). The section of Tanlu fault in Linyi City is named Yishu fault (modified after Ma et al. (1991)).
Measurement of the terrestrial heat flow
Generally, terrestrial heat flow is estimated as the product of the geothermal gradient and rock conductivity (Jaupart and Mareschal, 2015; Wang et al., 2015).
Temperature logging and geothermal gradient
The temperature of the geothermal wells was measured using a well temperature probe ANTS-3S, which has a measurement range of 0 °C‒150 °C and an accuracy of 0.01 °C. The temperature logging was conducted according to the Chinese industrial standard Specifications for Geophysical Logging of Coal (DZ/T0080-2010). To ensure that the surveyed well temperature was in a (quasi-) steady state, it was repeatedly logged at a time interval of 12 h after its deviation was < 0.5 °C following the completion of drilling. From top to bottom, the longitudinal profile of geothermal wells was divided into three zones (Jiang et al., 2019; Liao et al., 2022b): (1) variable-temperature zone; (2) constant-temperature zone, and (3) elevated-temperature zone. The well temperature is susceptible to the air temperature in the variable-temperature zone but is hardly affected by the air temperature in the constant temperature zone at a depth of 15–30 m mostly (Wang et al., 2015). In the zone with an elevated temperature, the temperature increases with the burial depth. The geothermal gradient can be obtained by the linear fit between the temperature and the burial depth in the zone of elevated temperature with a constant slope (ΔT/Δh; ΔT and Δh are the variations in the temperature and the burial depth, respectively) (Liao et al., 2022b; Zhang et al., 2018).
Thermal conductivity
The thermal conductivity of the rock samples was measured using a thermal conductivity scanner (Hot Disk TPS 1500) with a measurement range of 0.005‒500 W/mK and an accuracy of 3%. The measurement at room temperature (25 °C) was carried out at the Institute of Hydrogeology and Environmental Geology, Chinese Academy of Geological Sciences. Since thermal conductivity increases with a decrease in temperature (Anand et al., 1973), the measured conductivity should be corrected for in-situ temperature.
Two correction methods were applied in this study.
For rocks in the sedimentary layer, their thermal conductivity was corrected using the following empirical equations (Sass et al., 1992):

For rocks at a depth (upper-, middle-, and lower-crustal layers) that could not be obtained through drilling, their thermal conductivity was corrected based on the following equation (Cermak et al., 1990; Xu et al., 2011; Zang et al., 2002):
Vertical distribution of heat flow
The surface heat flow (q0) comprises both crustal heat flow (qc) and mantle heat flow (qm).
Crustal heat flow (qc) is the total radioactive heat from the heat-producing elements (U, Th, and K) in the crust. It is quantitatively estimated using the layer-stripping method and the following equations:

The heat production rate (A) is conventionally calculated based on the U, Th, and K concentrations in typical rock samples using the following equation (Artemieva et al., 2017; Rybach and Buntebarth, 1981):
The concentrations of heat-producing elements (U, Th, and K) were measured at the Changsha Uranium Geology Research Institute. The U and Th concentrations were determined using the LA-ICP-MS technique. The K concentration was analyzed using a flame atomic absorption spectrophotometer. The detection limits of U, Th, and K were 0.003 µg/g, 0.8 µg/g, and 0.17%, respectively.
In the case that rocks at a depth that cannot be obtained by drilling, this method is obviously not applicable since no sample is available for measuring U, Th, and K concentrations. Instead, the heat production rates of these rocks were calculated based on the functional relationship between A and Vp:
The surface heat flow (q0) is the sum of the crustal heat flow (qc) and the mantle heat flow (qm). qm is obtained by subtracting qc from q0. qm and the qc/qm ratio are important indicators of deep geodynamic processes (He et al., 2006; Liao et al., 2022b).
Deep temperature distribution
For shallow strata, the temperature distribution was determined through well logging. For deep strata, the temperatures were estimated using the following one-dimensional steady-state heat conduction equation (Lachenbruch, 1970; Wang et al., 2015):
Results and discussion
Terrestrial heat flow
The temperature logging results of geothermal wells LHT-ZK1, GT-ZK1, XXC-ZK1, and QHYC-ZK1 are presented in Figure 5. The geothermal gradients of these wells were obtained using the linear least squares regression method. The geothermal gradients of wells LHT-ZK1 and GT-ZK1 were quite close to each other and were 29.5 °C/km and 31 °C/km, respectively. In comparison, the geothermal gradients of wells XXC-ZK1 and QHYC-ZK1 were higher, reaching 36 °C/km‒37.8 °C/km. The lithology, temperature logging, and geothermal gradients of these four geothermal wells are shown in Figures 6 to 9. In Well LHT-ZK1, the geothermal gradients of both the Paleogene and Cretaceous sandstones increased with depth to about 24 °C/km, and the Cretaceous andesites had a relatively high geothermal gradient of 25 °C/km‒39 °C/km. In Well GT-ZK1, the Cretaceous andesites had a wide geothermal gradient range of 8.2 °C/km‒42.3 °C/km. In Well XXC-ZK, the maximum and minimum geothermal gradients were 42.9 °C/km and 25.7 °C/km, respectively. Well QHYC witnessed the maximum geothermal gradient of 49.1 °C/km.
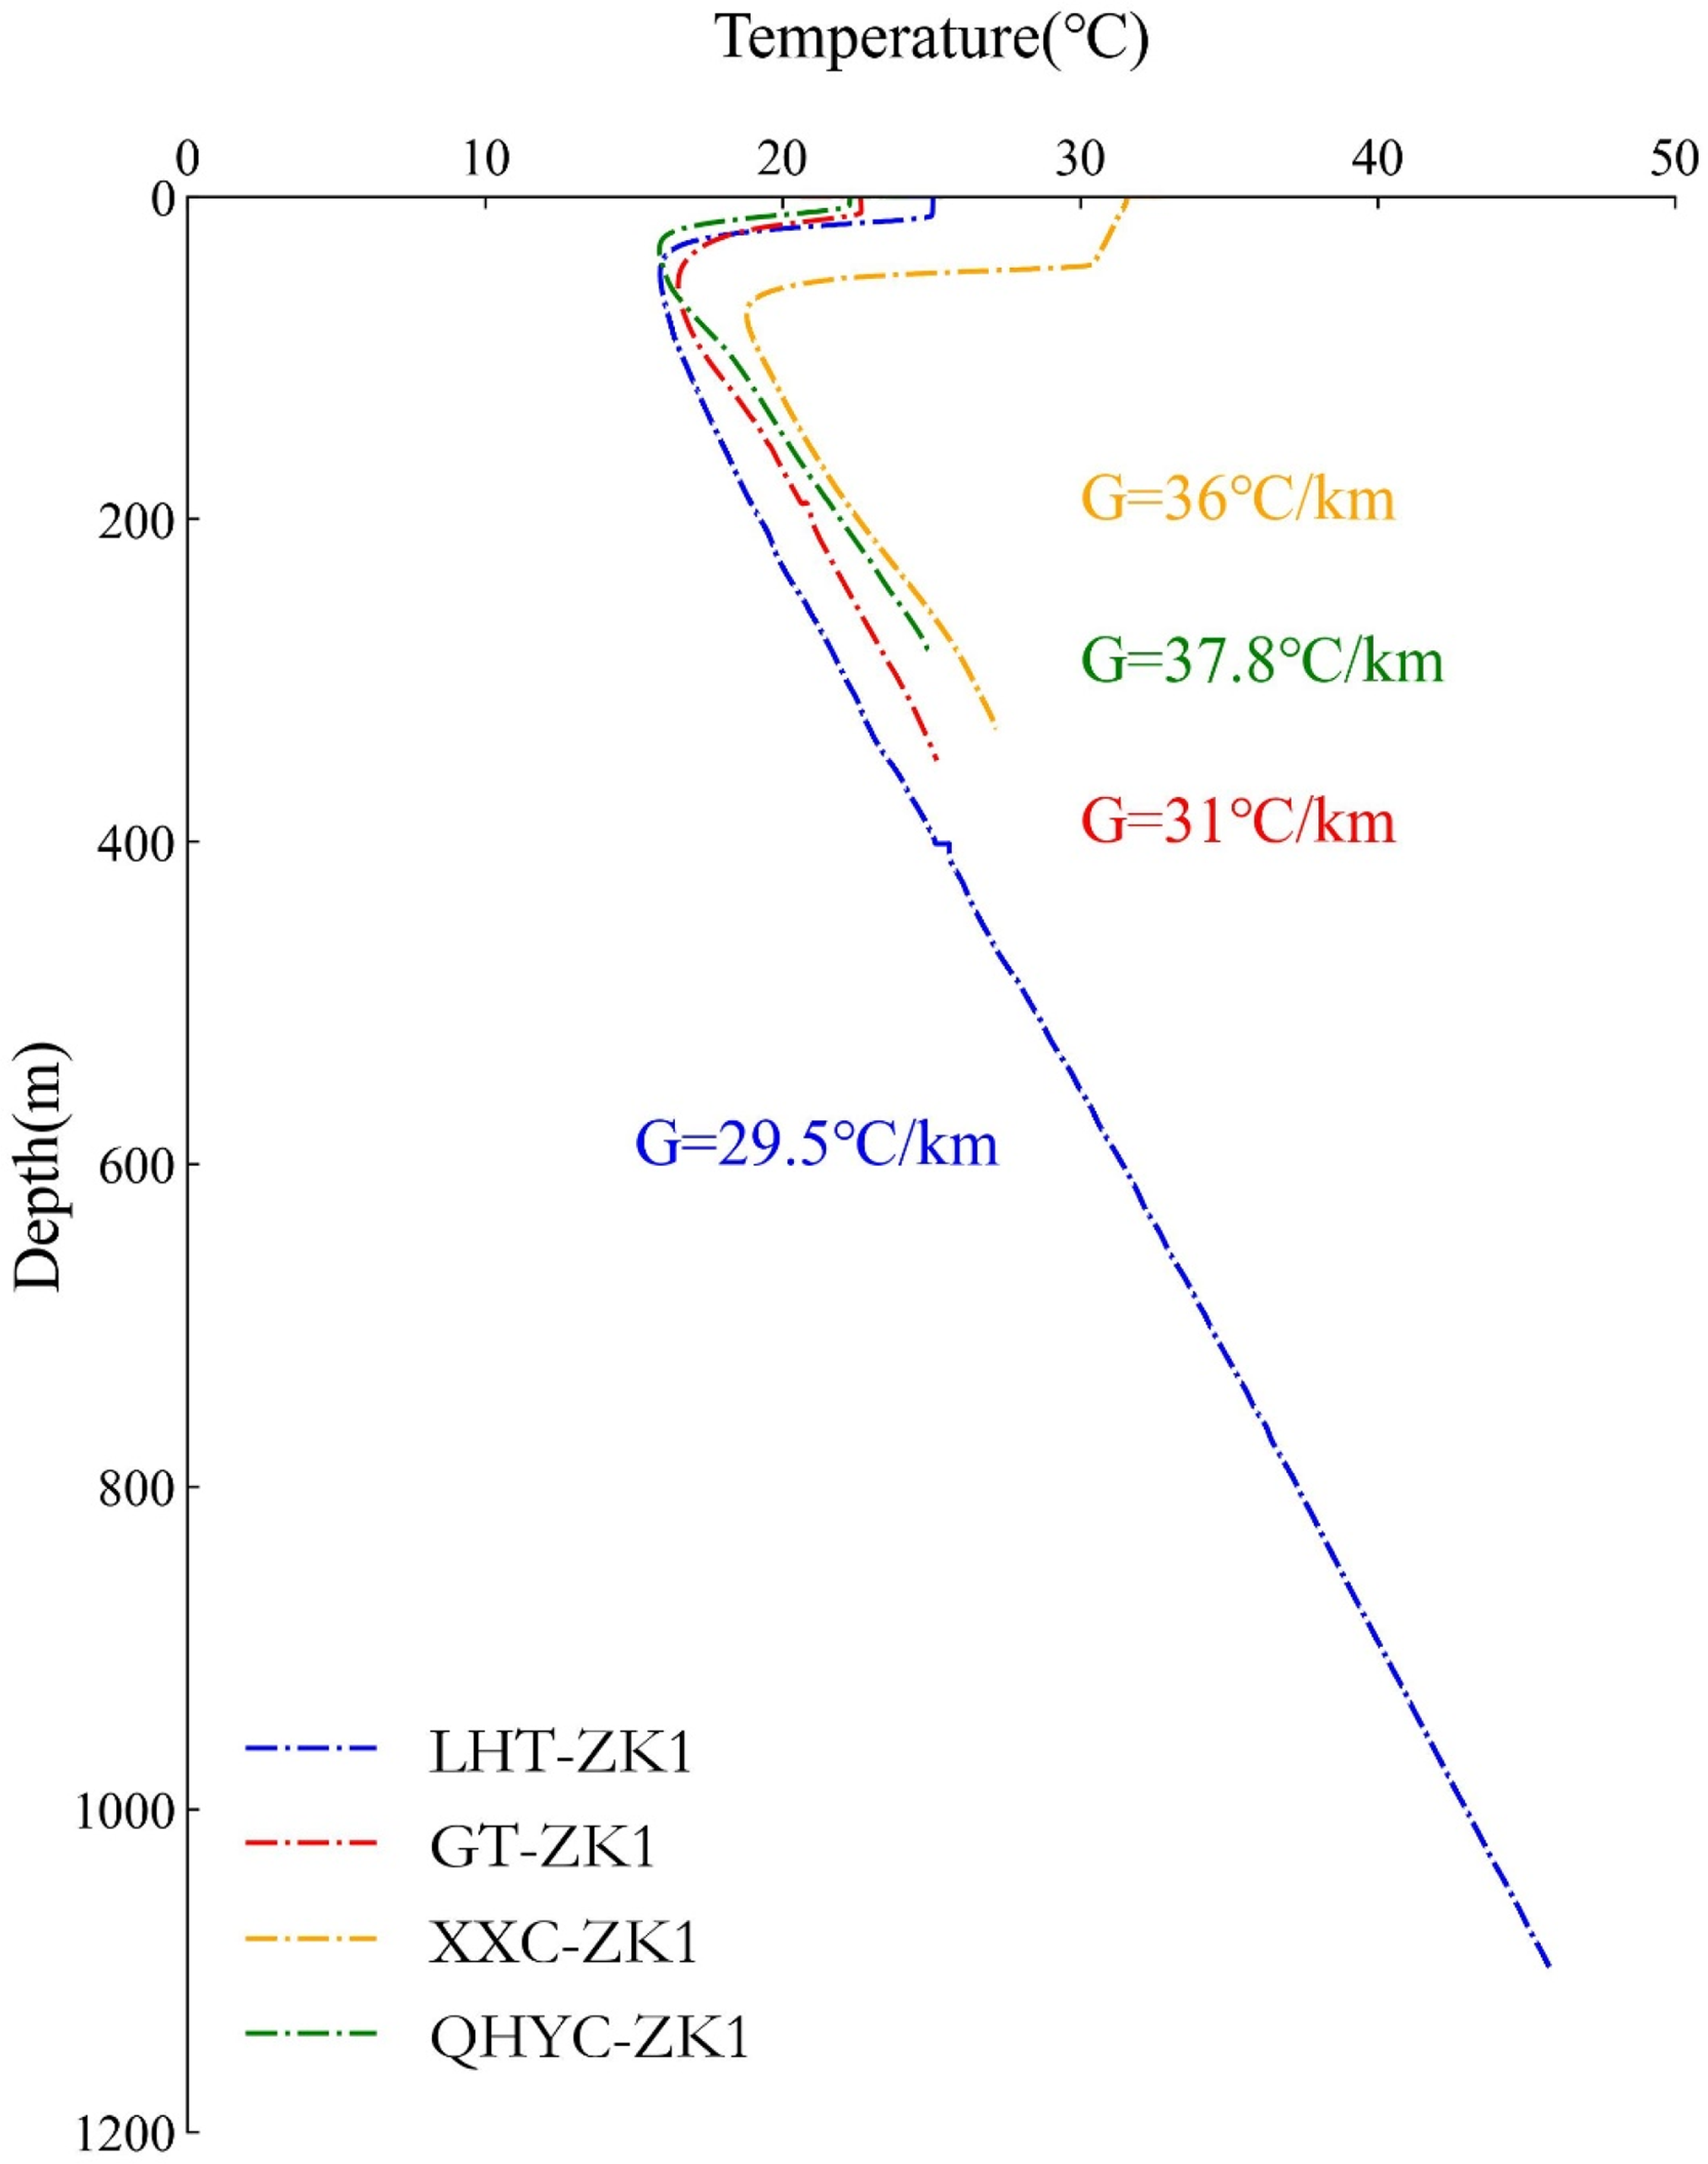
Temperature logging of the geothermal well in the study area. G represents the geothermal gradient.
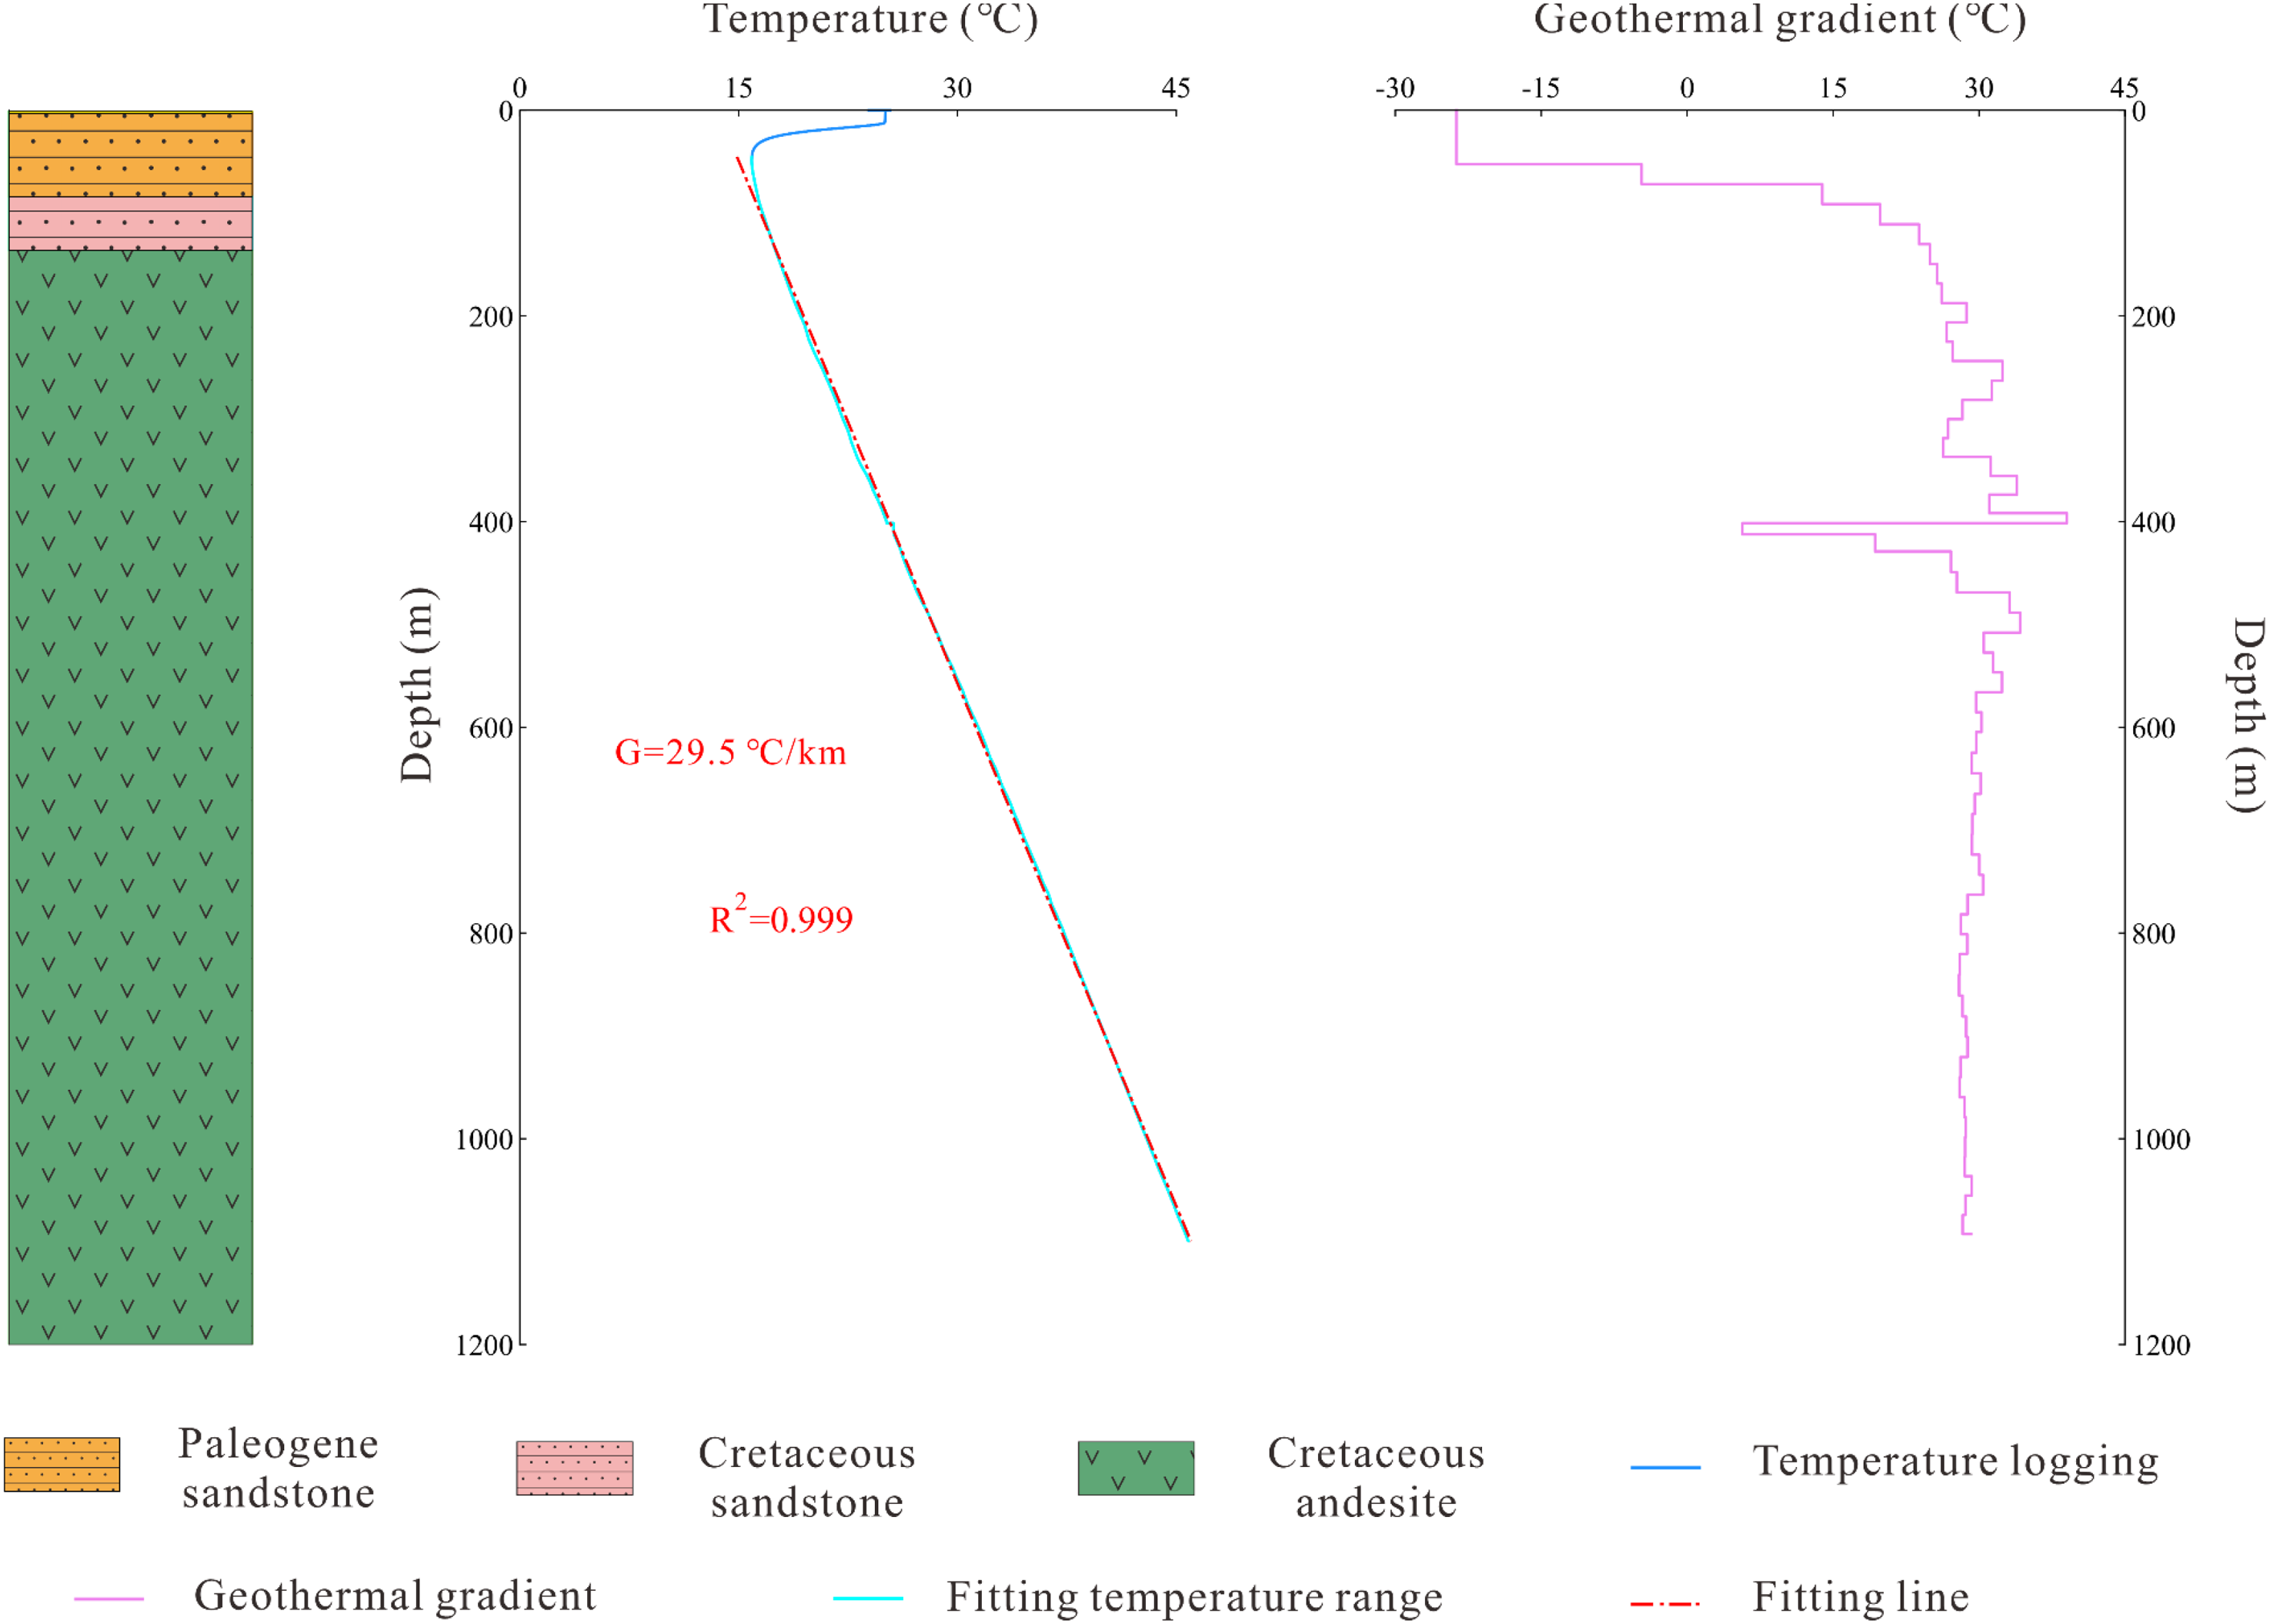
Temperature logging and geothermal gradient of LHT-ZK1. Quaternary sedimentary at the top of the well is neglected due to the low thickness (3 m).
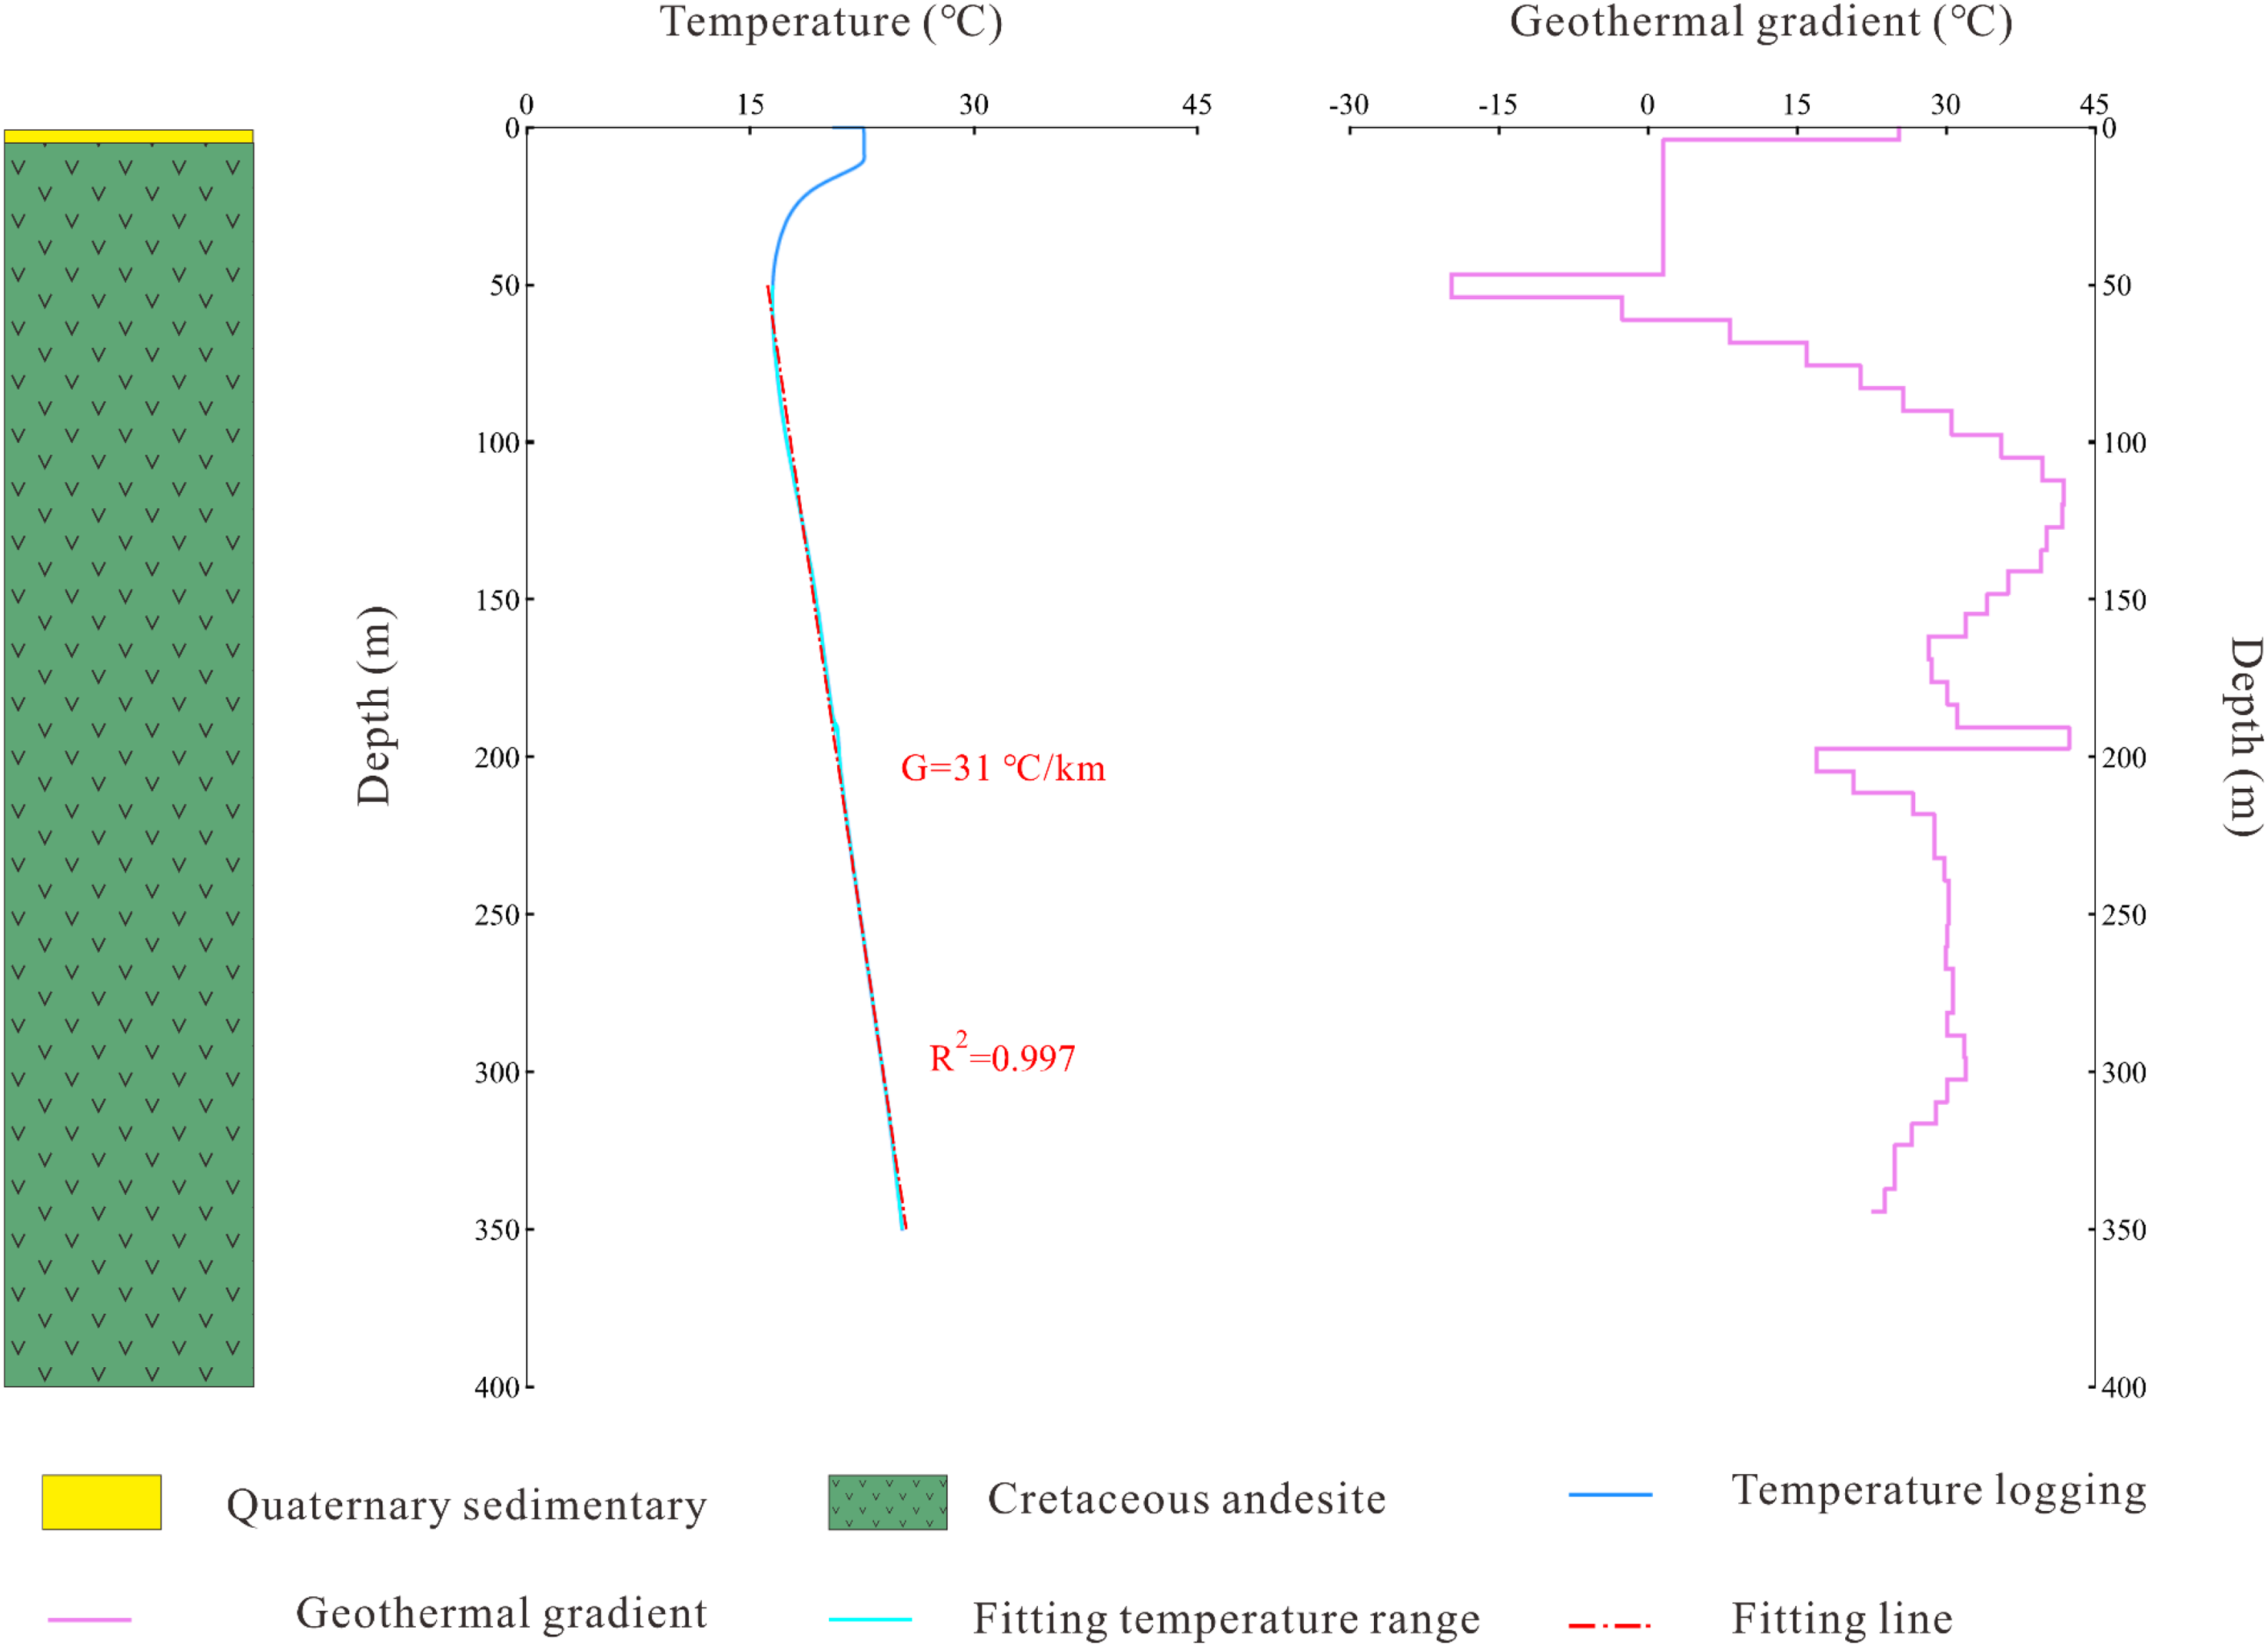
Temperature logging and geothermal gradient of GT-ZK1.
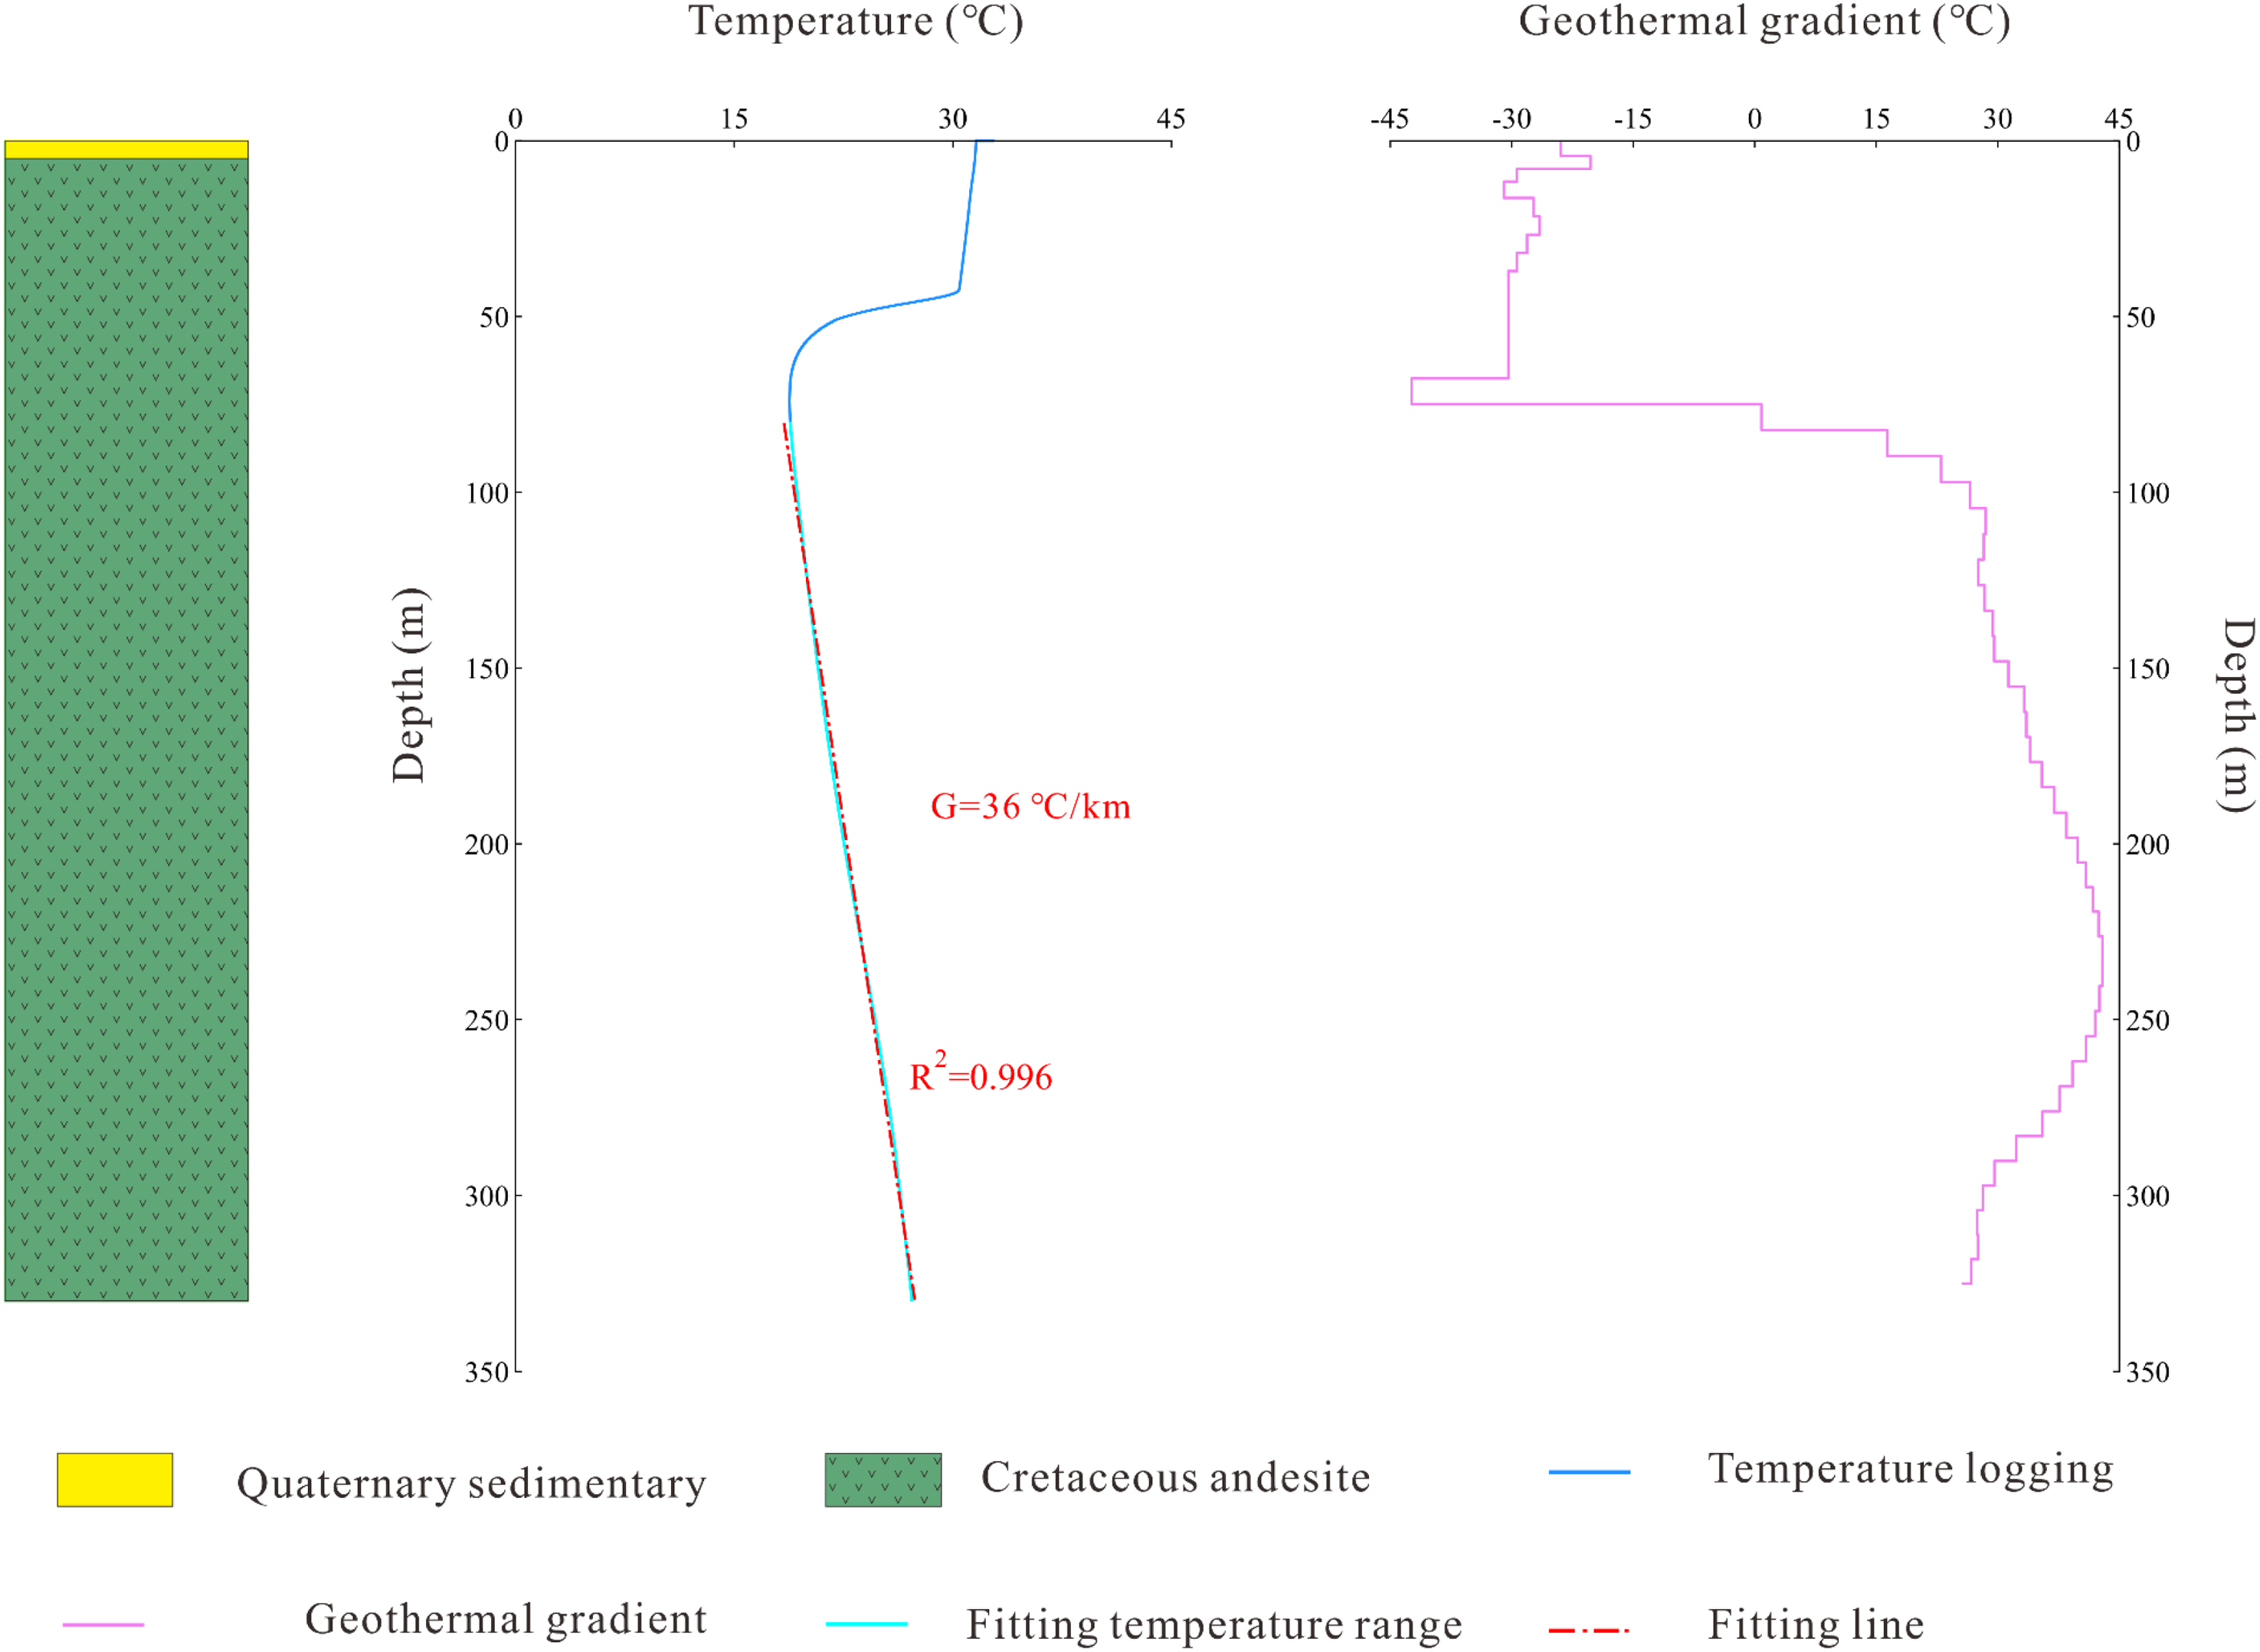
Temperature logging and geothermal gradient of XXC-ZK1.
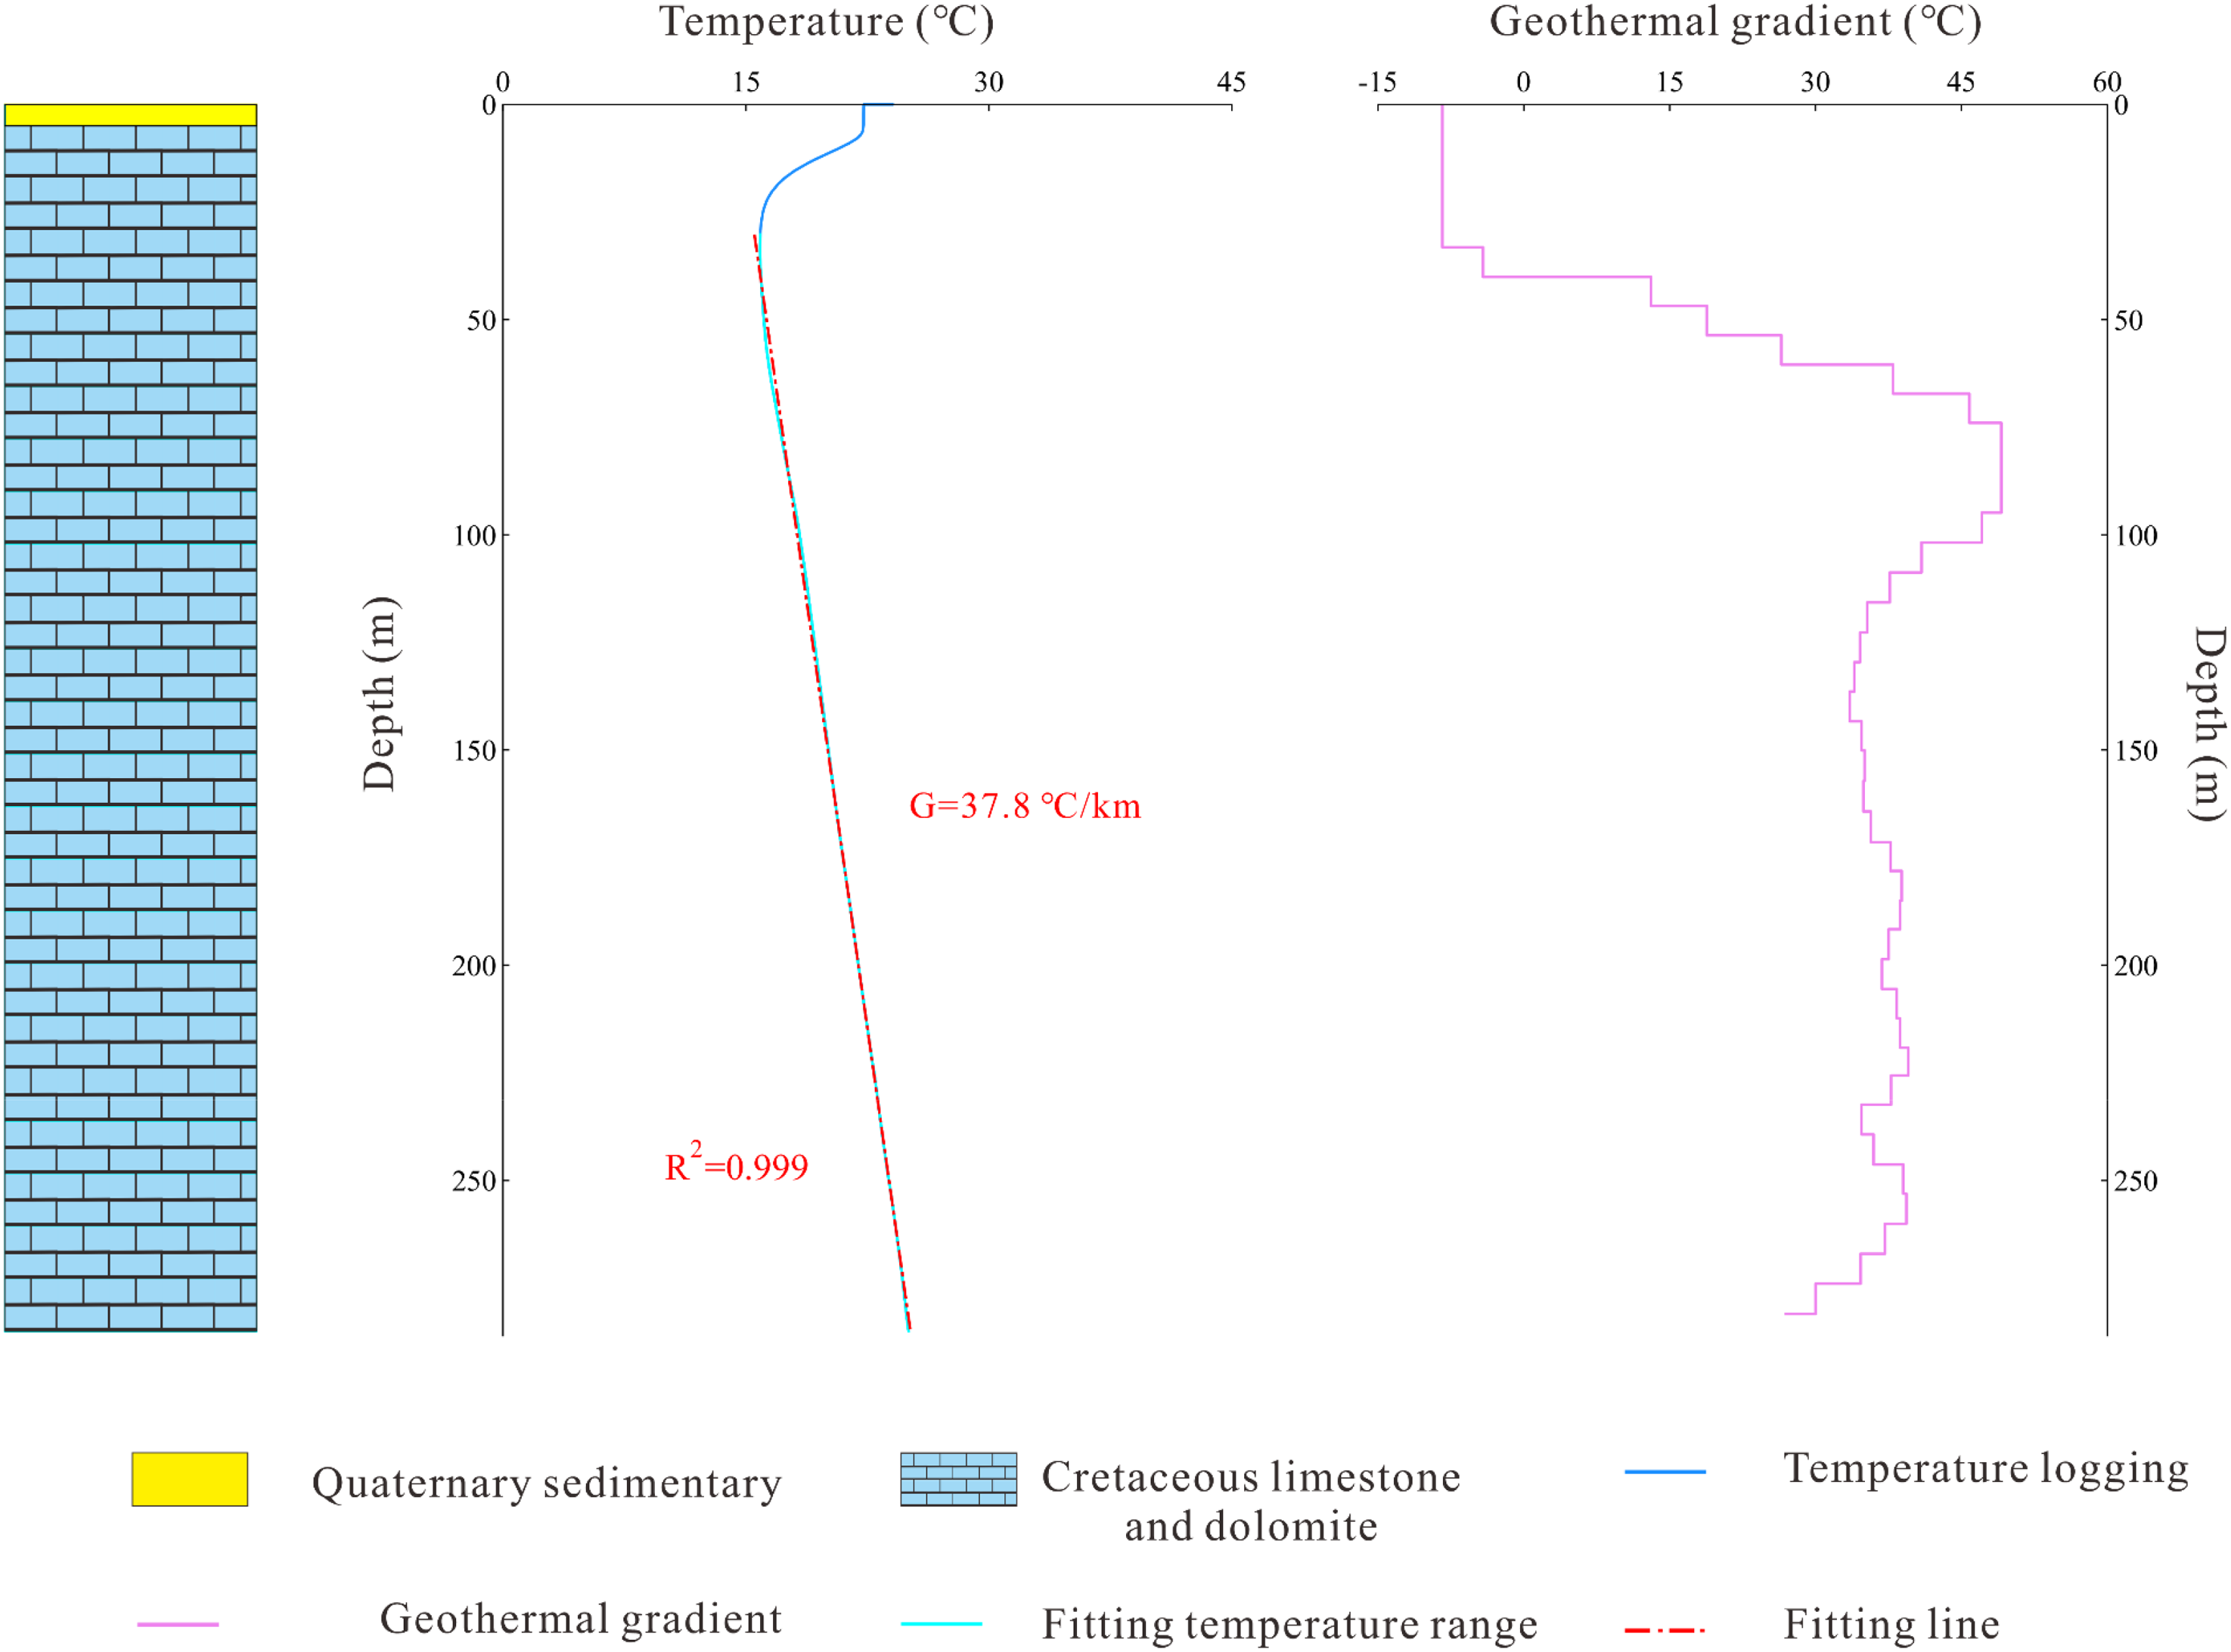
Temperature logging and geothermal gradient of QHYC-ZK1.
Thermal conductivity
According to the lithology revealed by the geothermal wells (Tables 2 and 3; Figures. 6 to 9), 28 rock samples were collected to measure thermal conductivity. These rock samples included Quaternary sedimentary rocks, Paleogene sandstones, Cretaceous andesites and sandstones, Ordovician limestones and tectonic breccias, and Cambrian limestones and dolomites. The samples of Cretaceous andesites, which are the main host rocks in the geothermal reservoirs, had an average thermal conductivity of 2.17 W/(m·K). The Ordovician dolomite and limestone samples had the highest average thermal conductivity of 4.07 and 3.96 W/(m·K), respectively. The Cambrian limestone samples had a slightly lower thermal conductivity of 3.52 W/(m·K). In contrast, the Cambrian dolomite samples had the lowest average thermal conductivity at 1.45 W/(m·K). The samples of Paleogene sandstones, Cretaceous sandstones, and Ordovician tectonic breccias had a similar average thermal conductivity of 2.51, 2.61, and 2.72 W/(m·K), respectively. The thermal conductivity of Quaternary sedimentary rocks was 3.02 W/(m·K).
The conductivity of samples in the study area.
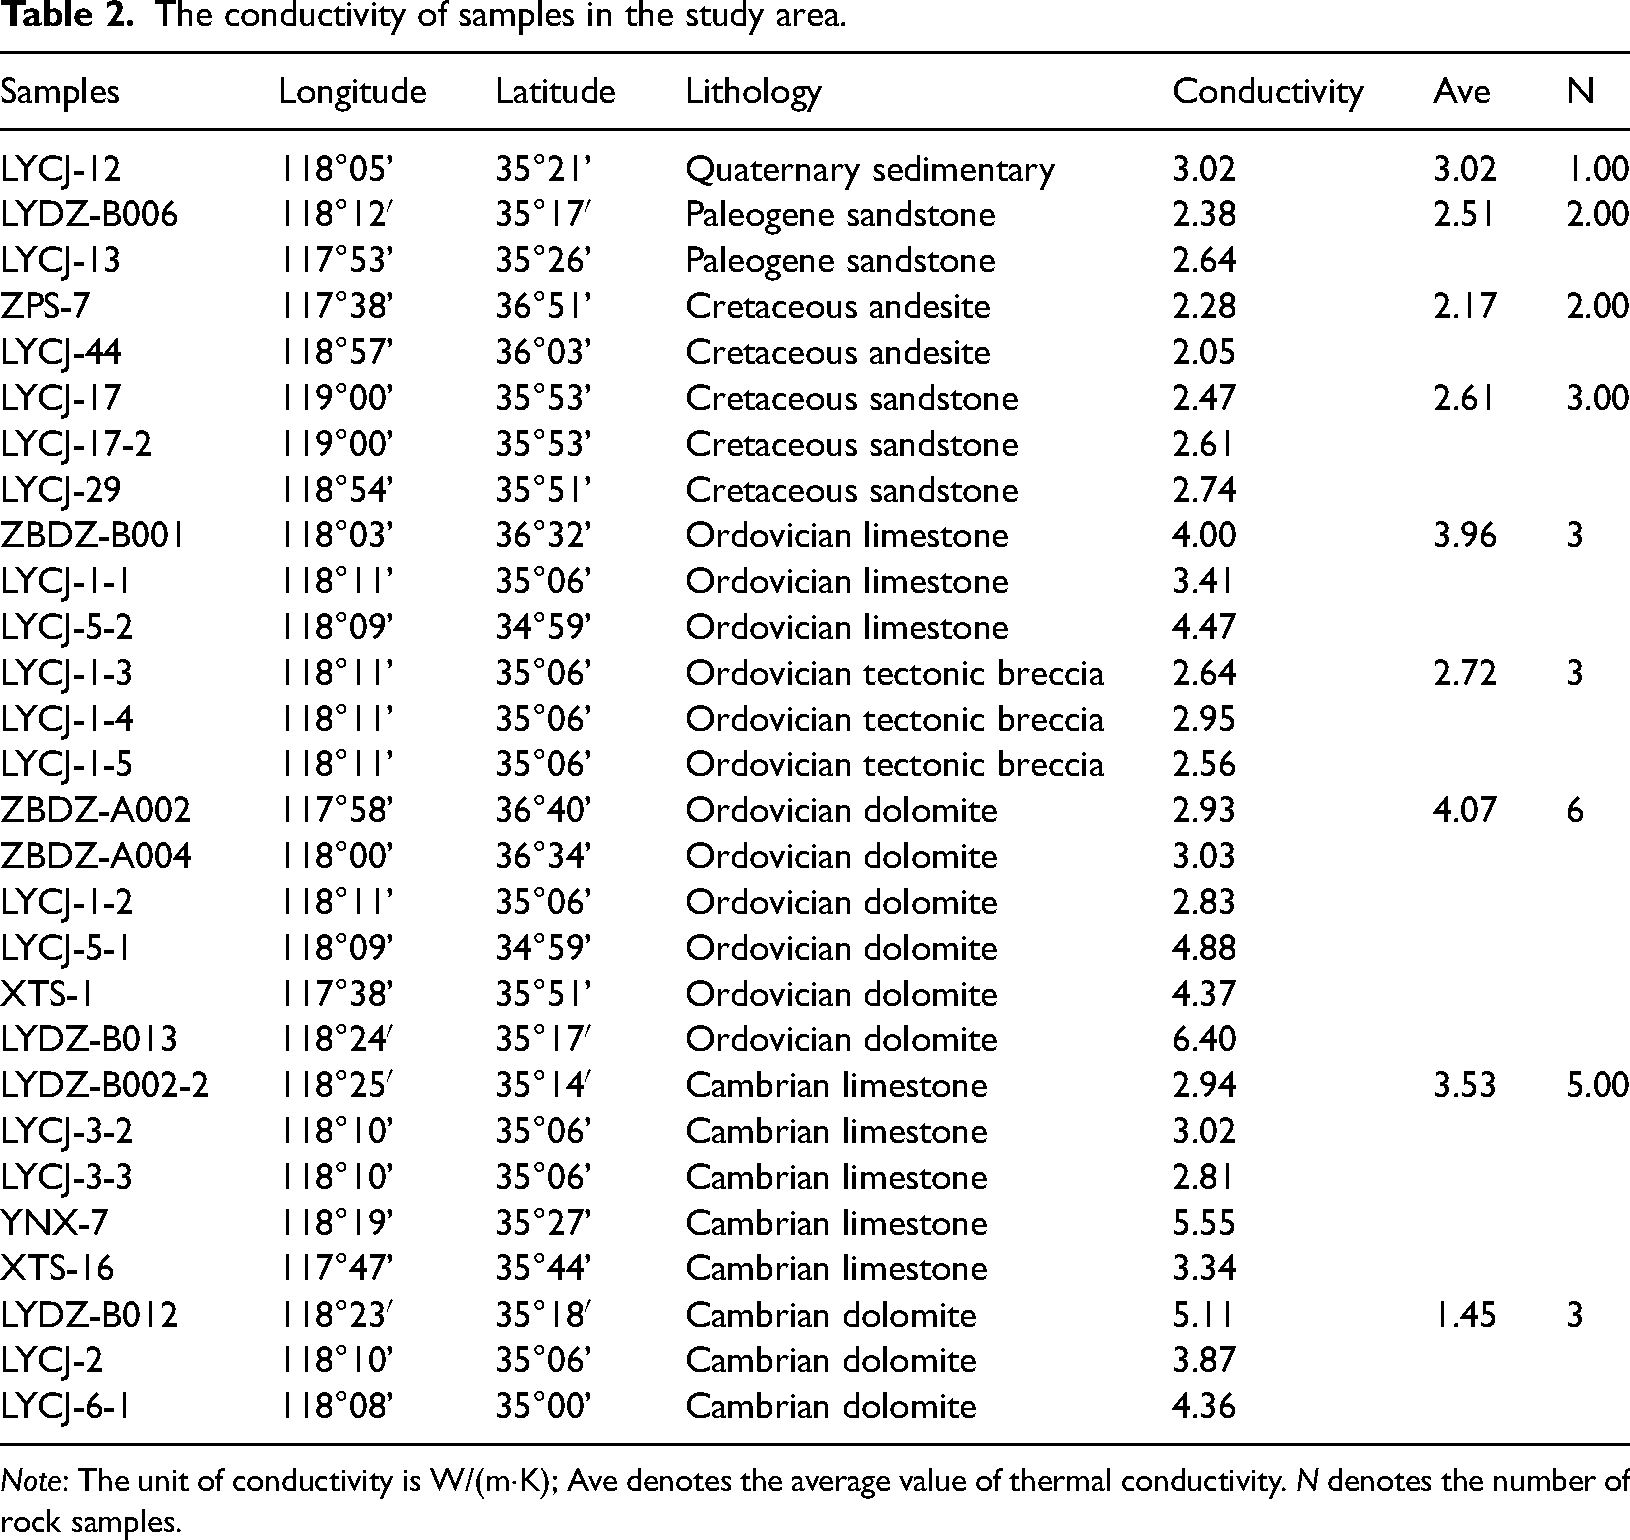
Note: The unit of conductivity is W/(m·K); Ave denotes the average value of thermal conductivity. N denotes the number of rock samples.
The lithology of geothermal well in the study area.
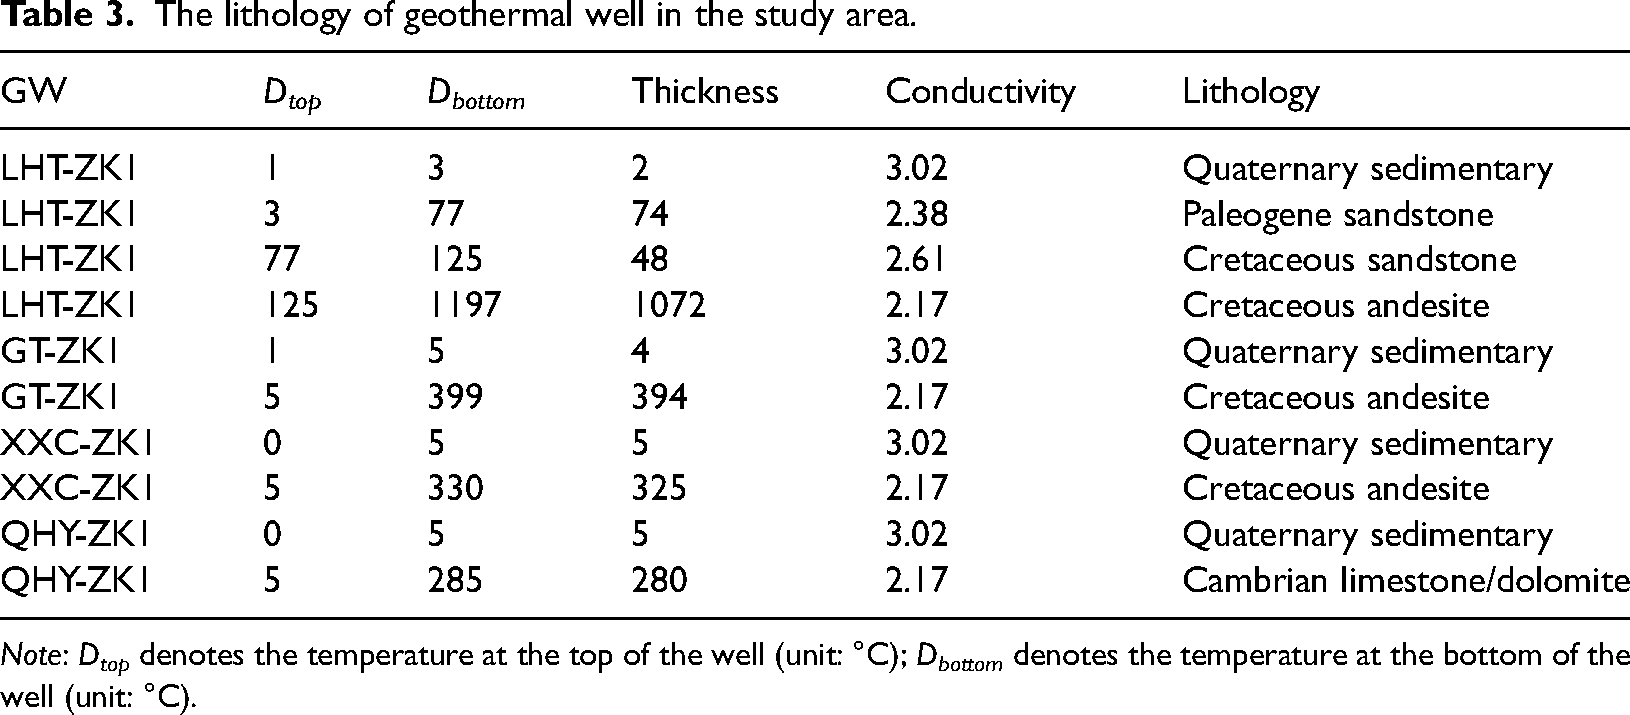
Note: Dtop denotes the temperature at the top of the well (unit: °C); Dbottom denotes the temperature at the bottom of the well (unit: °C).
Surface heat flow
Based on the geothermal gradients and the thermal conductivity, the heat flow of four typical rocks was calculated (Table 4). Wells LHT-ZK1 and GT-ZK1 had heat fluxes of 64.9 and 67.27 mW/m2, respectively. Well XXC-ZK had a slightly higher heat flux of 78.12 mW/m2. In contrast, Well QHYC-ZK had an extremely high heat flux of 150.82 mW/m2. This is likely due to the upwelling of geothermal water through convection (Wang et al., 2015; Wisian, 2000). With the measurement depth of up to 1100 m, the geothermal gradient at Well LHT-ZK1 was steady at depths of up to 200 m, indicating the conductive heat transfer of heat flux. In comparison, within a relatively shallow temperature measurement depth of 285‒350 m, the temperature at wells GT-ZK, XXC-ZK1, and QHYC-ZK1 was susceptible to the impact of the surface interface at a depth of < 500 m (Wisian, 2000). In sum, the heat flux at Well LHT-ZK1 (64.9 mW/m2) had the most representative heat flow characteristics of the study area. It was higher than 60.4 ± 12.3 mW/m2, indicating a high geothermal setting. This also implies that the deep-seated Yishu fault probably serves as a pathway for heat transfer from the heat source at depth to the Linyi geothermal field (Deng et al., 2013; Tao and Liu, 2000; Wang and Zhu, 2018). Moreover, Well LHT-ZK1 was selected for the study of the lithospheric structure.
Heat flux of geothermal well in the study area.
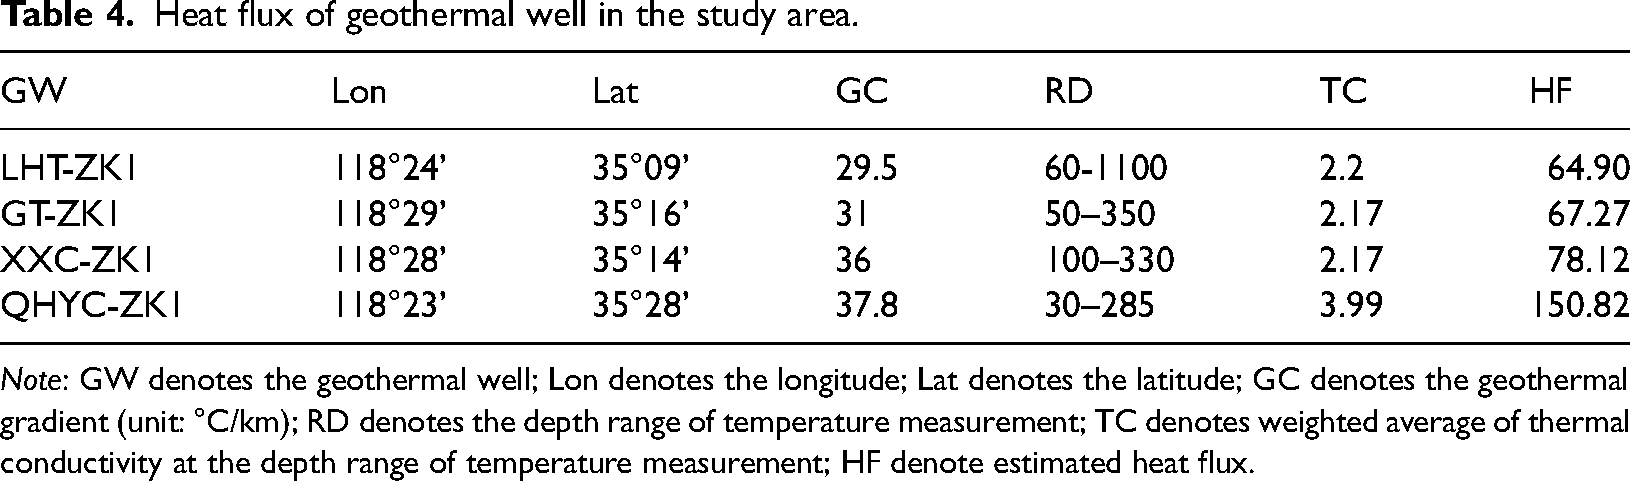
Note: GW denotes the geothermal well; Lon denotes the longitude; Lat denotes the latitude; GC denotes the geothermal gradient (unit: °C/km); RD denotes the depth range of temperature measurement; TC denotes weighted average of thermal conductivity at the depth range of temperature measurement; HF denote estimated heat flux.
Lithospheric thermal structure
Crustal and mantle heat flow
As shown in Table 5, the lithospheric thermal structure is divided into four layers: a sedimentary layer, an upper crustal layer, a middle crustal layer, and a lower crustal layer (Figure 10). The depth of the sedimentary layer was determined based on the depth of Well LHT-ZK1, and the other three layers are divided according to the Xiangshui (Jiangsu province)-Mandula (Nei Mongol) geoscience transect. The sedimentary layer was subdivided into eight sublayers according to the lithology revealed by Well LHT-ZK1, and the other layers were subdivided into eight layers based on the isolines of P-wave velocity (Vp; Figure 4). Vp-layer denotes the average velocity of the top and bottom isolines of Vp (Table 6).
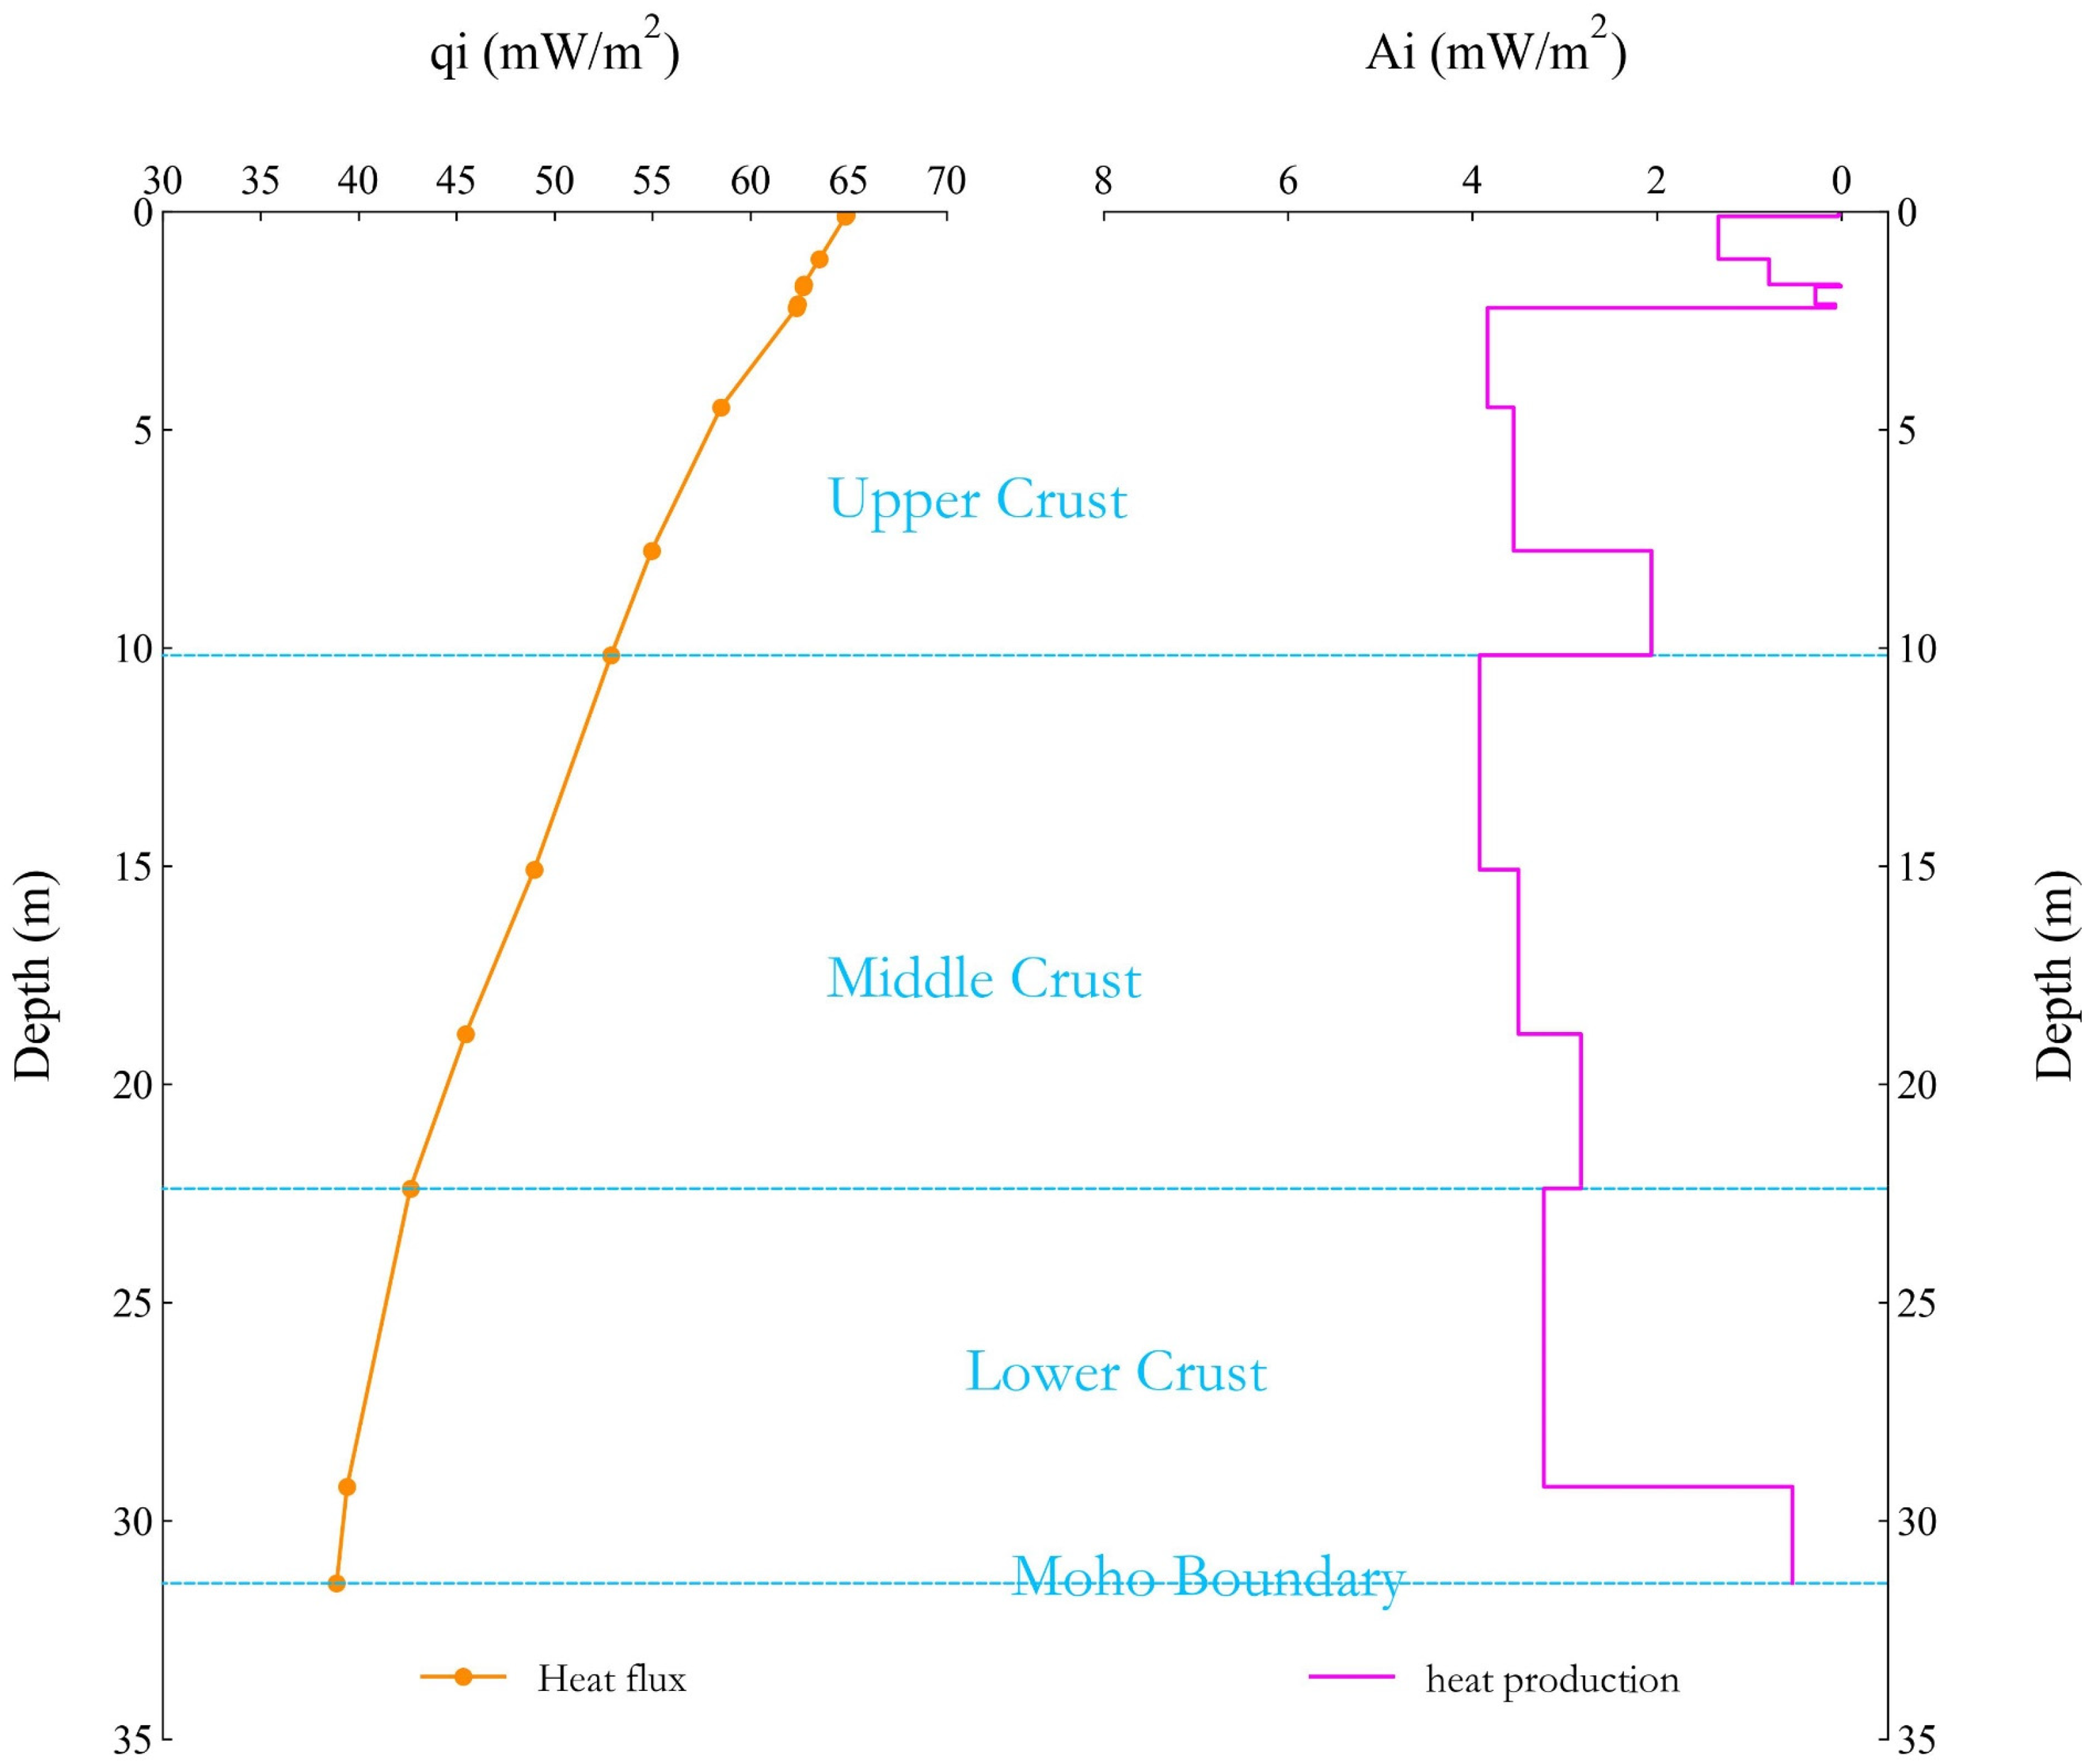
Conceptual model constructed for the lithospheric thermal structure in the study area.
Thermal structure of the Linyi geothermal field.
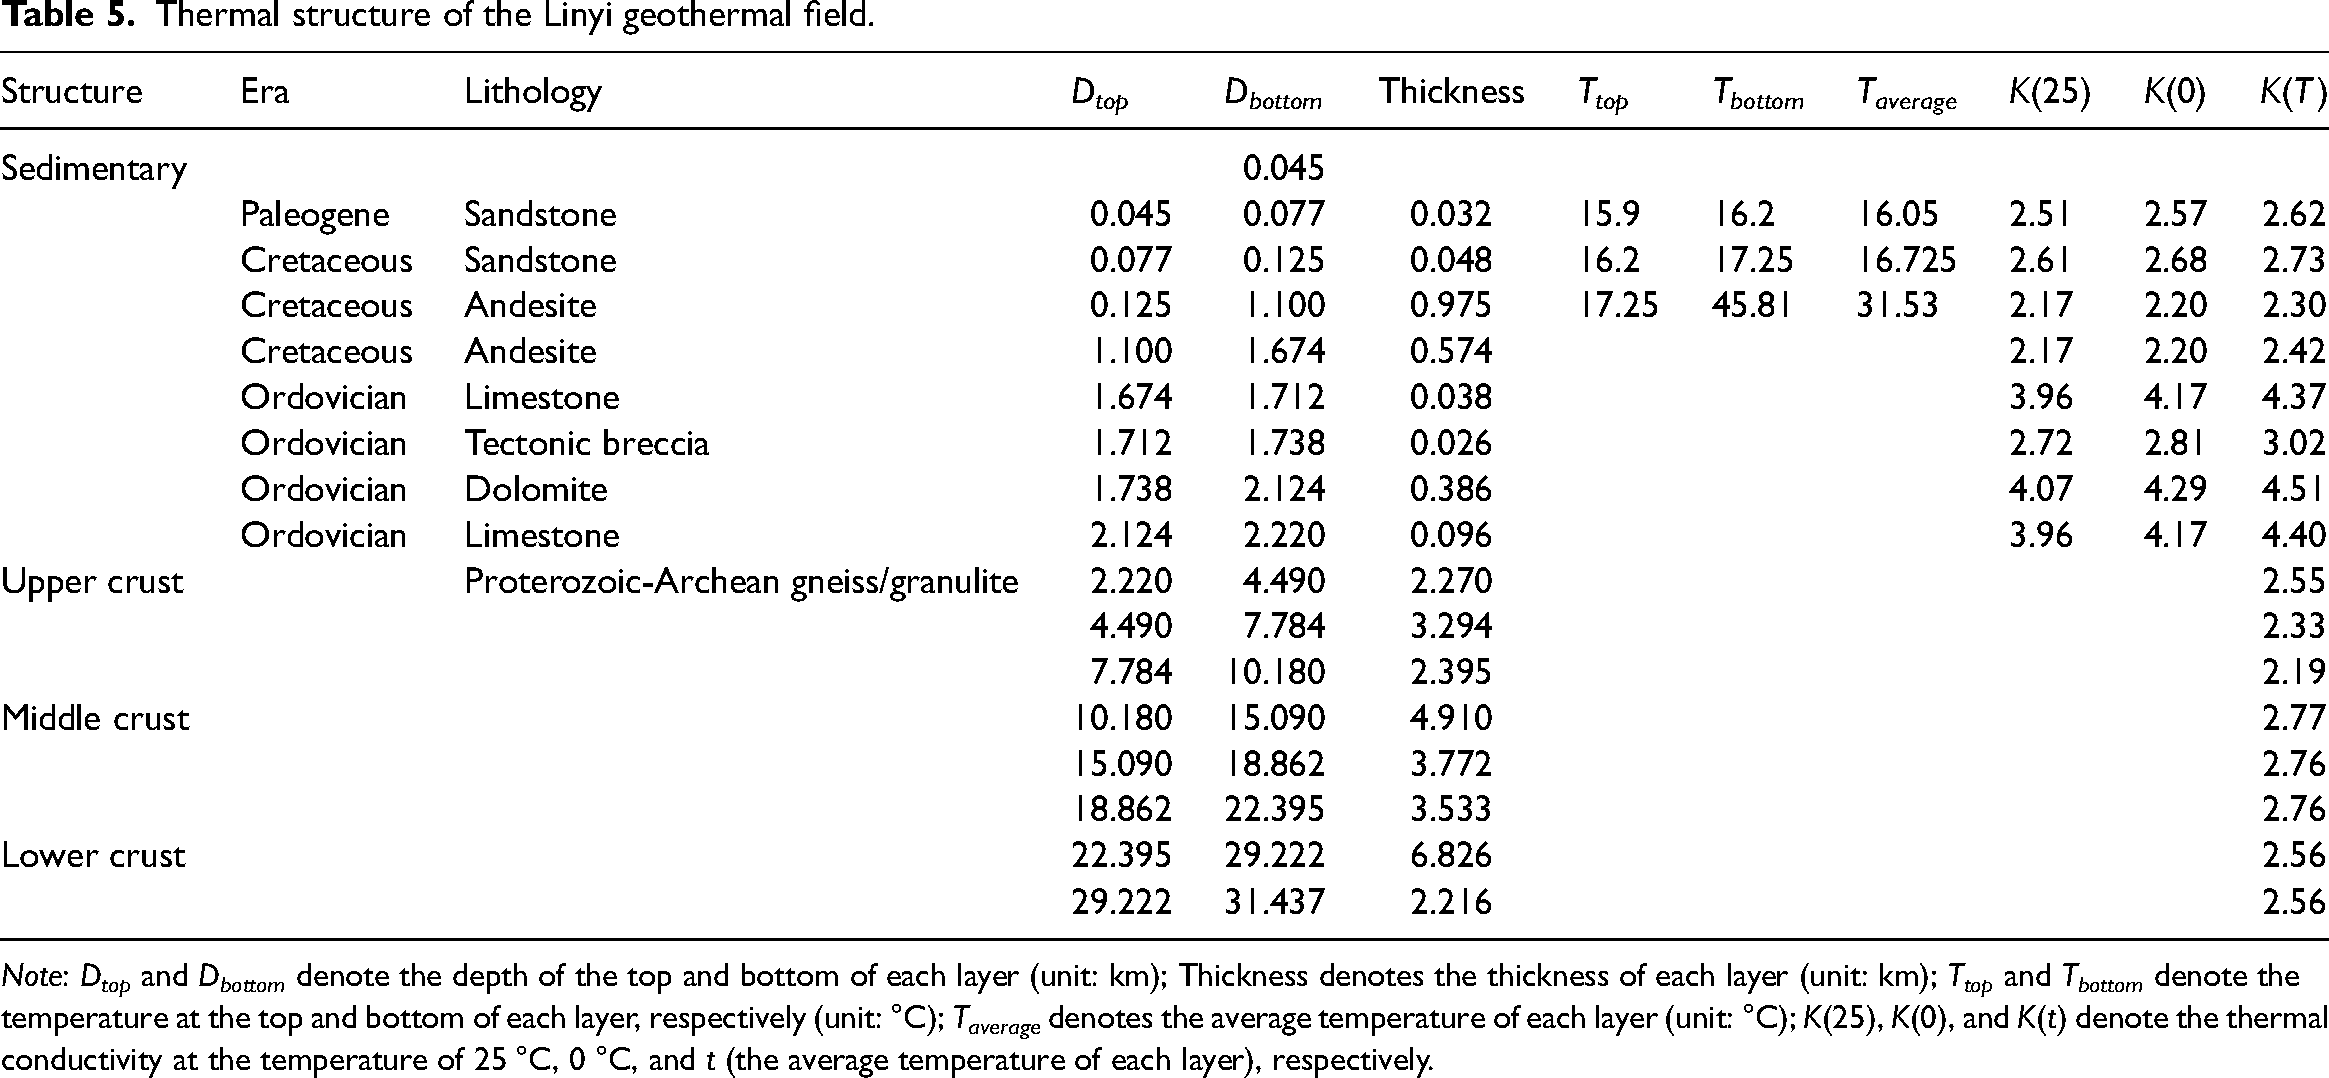
Note: Dtop and Dbottom denote the depth of the top and bottom of each layer (unit: km); Thickness denotes the thickness of each layer (unit: km); Ttop and Tbottom denote the temperature at the top and bottom of each layer, respectively (unit: °C); Taverage denotes the average temperature of each layer (unit: °C); K(25), K(0), and K(t) denote the thermal conductivity at the temperature of 25 °C, 0 °C, and t (the average temperature of each layer), respectively.
Thermal structure of the Linyi geothermal field.
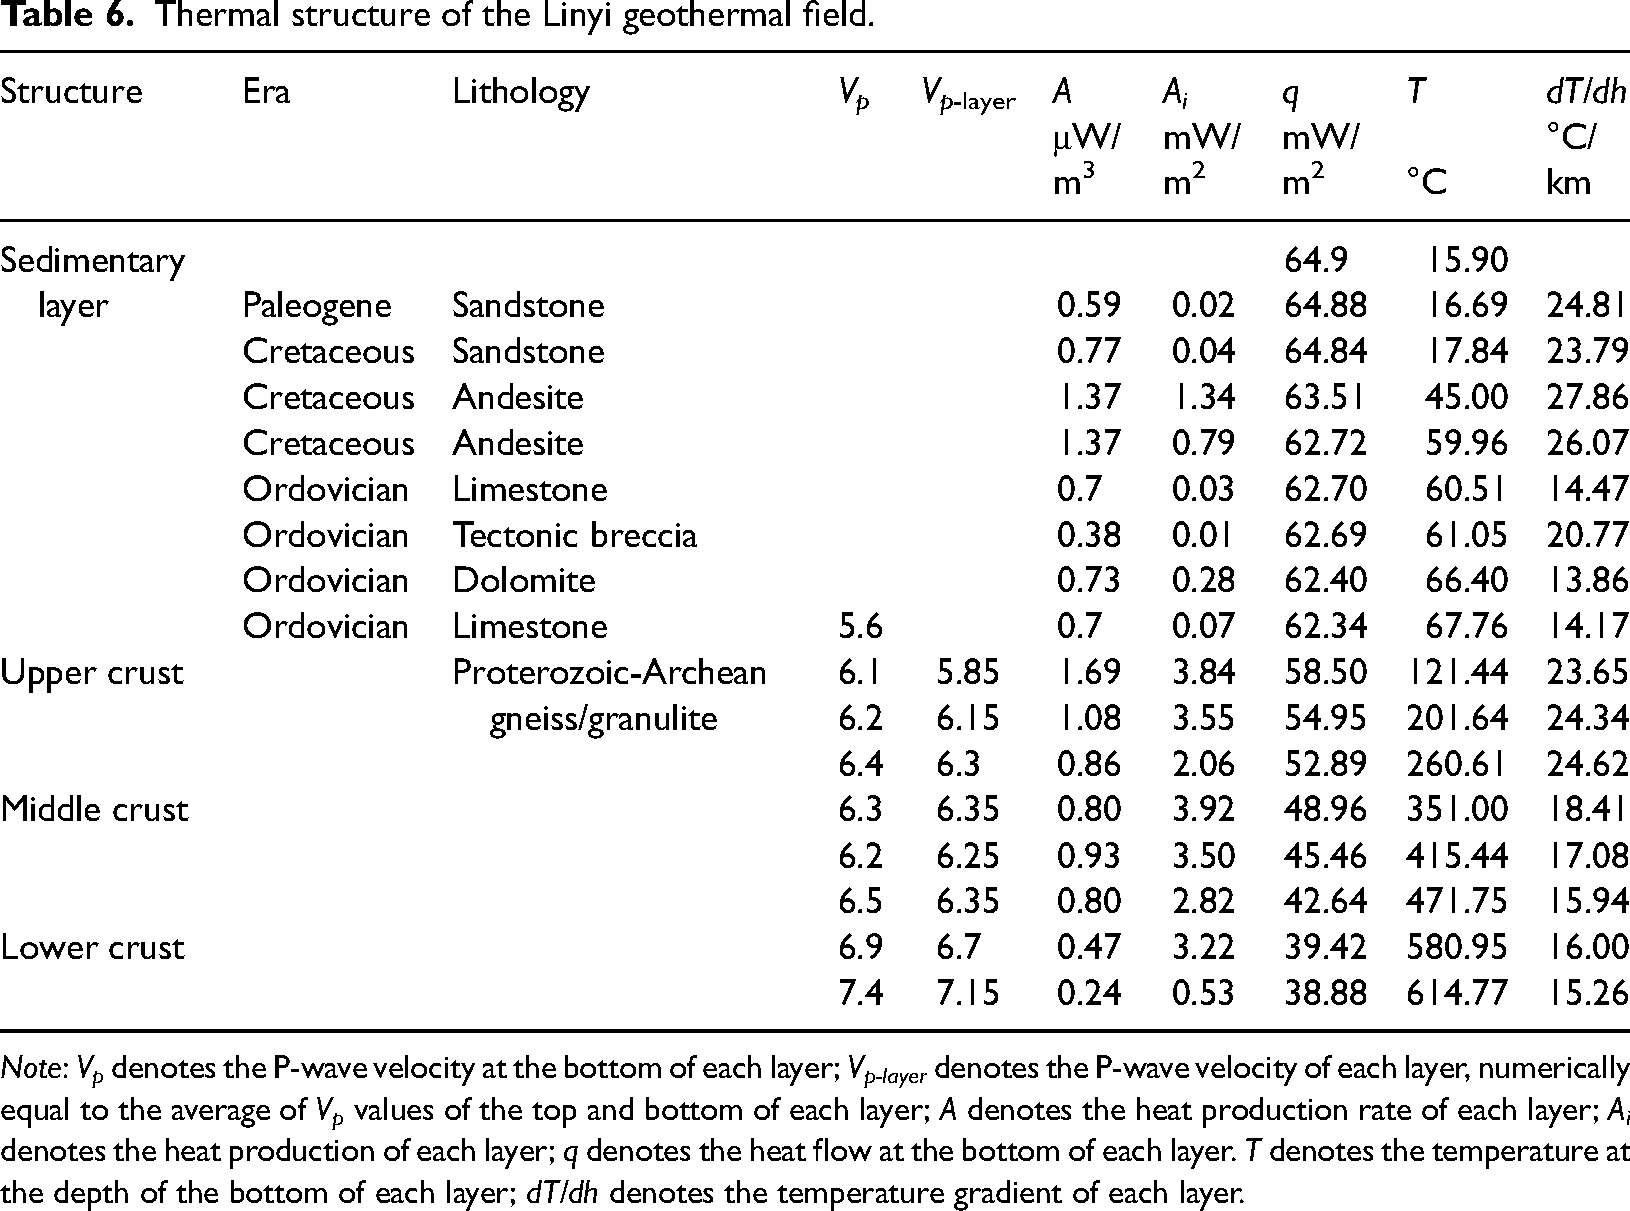
Note: Vp denotes the P-wave velocity at the bottom of each layer; Vp-layer denotes the P-wave velocity of each layer, numerically equal to the average of Vp values of the top and bottom of each layer; A denotes the heat production rate of each layer; Ai denotes the heat production of each layer; q denotes the heat flow at the bottom of each layer. T denotes the temperature at the depth of the bottom of each layer; dT/dh denotes the temperature gradient of each layer.
The heat production rate of the sedimentary layer was measured directly on the rock samples. The sedimentary layer (Tables 6 and 7) is composed of Paleogene sandstones, Cretaceous sandstones and andesites, and Ordovician limestones and dolomites, and tectonic breccias. The heat production rates of these rocks are listed in Table 7. Cretaceous andesites had the largest heat production rate of 1.37 μW/m3. The Ordovician tectonic breccias had the lowest production rate of only 0.38 μW/m3. The Cretaceous sandstones, Ordovician limestones, and dolomites had similar heat production rates of 0.77, 0.7, and 0.73 μW/m3, respectively. In comparison, the Paleogene sandstones had a slightly lower heat production rate of 0.59 μW/m3.
Heat production rate of samples in the study area.
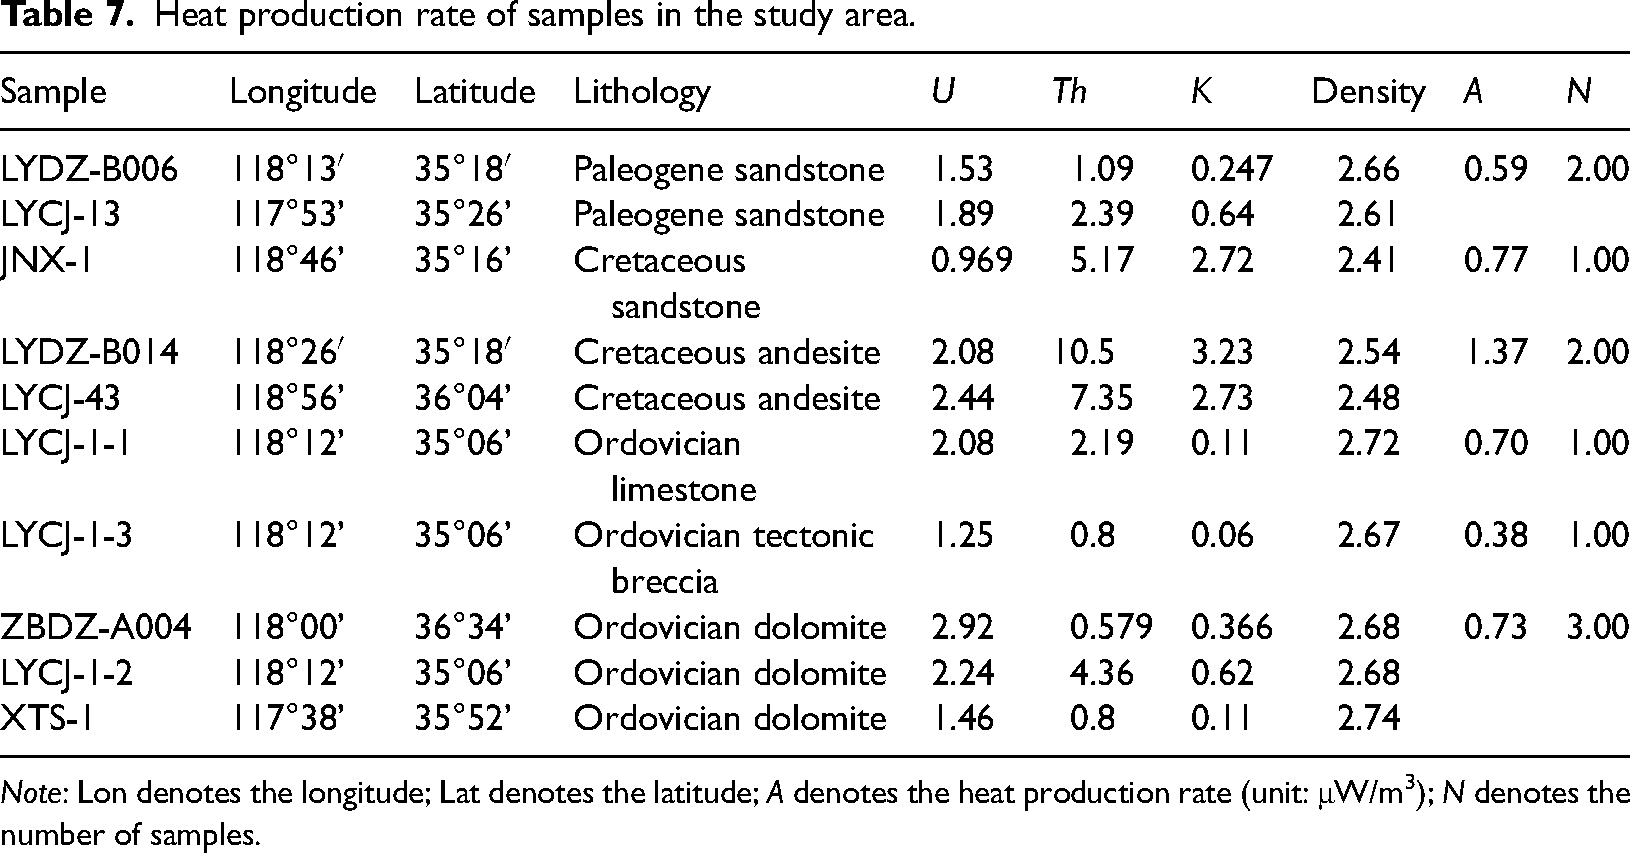
Note: Lon denotes the longitude; Lat denotes the latitude; A denotes the heat production rate (unit: μW/m3); N denotes the number of samples.
The heat production rates of the upper, middle, and lower crustal layers were calculated using equation (6). As shown in Table 6, the upper crustal layer had a relatively high heat production rate of 0.86‒1.69 μW/m3, the middle crustal layer had a narrow heat production rate range of 0.8‒0.93 μW/m3, and the lower crustal layer had a very low heat production rate of 0.24‒0.47 μW/m3.
Based on the surface heat flow and the heat production rate of each layer, the heat production of each layer was calculated using equation (7) (Table 6). Subsequently, the heat flow of the crust and mantle was estimated to be 26.02 and 38.88 mW/m2, respectively. Therefore, the qc/qm ratio was less than 1 (0.67), indicating a hot mantle-cold crust type of lithospheric thermal structure.
Deep temperature distribution
As shown in Table 6, the temperature of each layer at depth was calculated using equation (8). A conceptual model was built for the lithospheric structure in the study area (Figure 10). The temperature of the Moho boundary was estimated to be 614.8 °C. It agrees with the temperature (602 °C‒636 °C) estimated by Gong et al. (2005) in the Jiyang depression, which lies about 300 km north of Linyi City.
As a supplement to heat flow, the Curie depth (the Curie temperature isotherm) is a key parameter for the construction of the lithospheric thermal structure. The Curie surface is the basal surface of the magnetite crust, which consists of magnetic minerals such as pyrrhotite, magnetite, and Ni–Fe-bearing minerals (Spector and Grant, 1971; Yang, 2015). The demagnetized temperature of the magnetite was 585 °C, which corresponds to the Curie depth. Based on the lithospheric thermal structure in Table 6, the Curie depth was about 29.5 km (585 °C), which is consistent with the estimates (29–30 km) made using the power spectrum method based on the aeromagnetic map data (Fang, 2006; Xiong et al., 2016). Therefore, this result confirmed the validity of the lithospheric thermal structure of the Linyi geothermal field.
Conclusions
The comprehensive study of the lithospheric thermal structure helps to further define the origin of geothermal resources in the Linyi geothermal field. Moreover, it provides evidence for the role of the Yishu fault as a heat pathway in the formation of geothermal resources in the study area. Based on the above-mentioned analysis, the following conclusions can be drawn:
(1) The heat flow of the Linyi geothermal field is 64.9 mW/m2. It is higher than the average heat flow of the land area in China (60.4 ± 12.3 mW/m2), indicating a high geothermal setting. (2) Based on the lithospheric structure of the Linyi geothermal field, the crustal and mantle heat flows are 26.02 and 38.88 mW/m2, respectively. The qc/qm ratio is < 1 (0.67), indicating a hot mantle-cold crust type of lithospheric thermal structure. (3) The NNE-trending Yishu fault—the dominant fault in the Linyi geothermal field—is a heat transfer pathway for the upwelling of heat at depth. (4) The temperature distribution at depth was obtained using the one-dimensional steady-state equation. Therein, the Moho boundary has a temperature of 614.8 °C, which is consistent with the temperature (602 °C‒636 °C) of the Moho boundary in the Jiyang depression. Moreover, the calculated Curie depth is 29.5 km, which is consistent with the depth estimated based on the aeromagnetic map data. This result confirmed the validity of the lithospheric thermal structure constructed in the study.
Footnotes
Acknowledgements
We would like to extend our sincere gratitude to Wenjing Lin for his valuable suggestions and kind assistance with the figure drawing. This work was funded by a project of the China Geological Survey (DD20221676).
Declaration of conflicting interests
The author(s) declared no potential conflicts of interest with respect to the research, authorship, and/or publication of this article.
Funding
The author(s) disclosed receipt of the following financial support for the research, authorship, and/or publication of this article: This work was supported by the project of the China Geological Survey (grant number DD20221676).