
Abstract
One of the primary things damaging the environment is the use of energy. In the Kingdom of Saudi Arabia (KSA), electricity is the main source of energy in educational buildings. To conserve the environment, significant efforts are now being made to reduce energy use in general and electricity use in particular. To be sustainable, it is also vital to research the possibilities of employing solar energy in the higher education sector since it is also accessible in the KSA. The main motives behind this study are the low prices of photovoltaic (PV) solar systems globally and the existence of a new government system to benefit from solar energy in the KSA. The utilization of PV solar energy at Sulaiman Al-Rajhi University in the Qassim region was examined in this article. Two scenarios were considered: scenario 1, in which the entire roof of the buildings is covered by a PV system, and scenario 2, for securing electricity so that it is a nearly zero-bill campus (nZBC). The yield factors calculated for scenarios 1 and 2 are 1896 and 1922 kWh/kWp, respectively, while the capacity factor is 21.6% for scenario 1 and 21.9% for scenario 2. For scenarios 1 and 2, the systems produce 2,160,181 and 10,199,253 kWh of electrical energy annually, respectively. The production in the second scenario is about 113% of the load to reach an nZBC, compared to the first scenario's coverage of about 24% of the load. The levelized cost of energy was found to be between 0.026 and 0.028 $/kWh, with a simple payback period of 10 years for scenario 1 and 8.1 years for scenario 2. Additionally, the proposed systems’ environmental benefits were noted.
Keywords
Introduction
Worldwide, especially in hot and arid regions, increased reliability and increased use of renewable energy (RE) are becoming evident. In the Kingdom of Saudi Arabia (KSA), conventional fuel is the most electricity source. To limit the use of fossil fuels in the production of power, the government of KSA unveiled a new strategy in 2016 called the 2030 Vision (Vision 2030 of KSA, 2016). In the past 10 years, the KSA's per-capita demand for electricity has grown dramatically; it is currently three times the average global per-capita demand for electricity, or 3.3 MWh.
The energy consumption in Saudi Arabia in 2020, broken down by application and source, is shown in Table 1. The results also demonstrate that consumption reached 152.1 Mtoe. However, research indicates that oil and gas were used for transportation, manufacturing, and other non-energy uses. For the reason that electric energy is used in a variety of sectors, including household, commercial, educational, agricultural, and industries. Table 1 also demonstrates that electricity ranks first in terms of use in the “other” category; the figure equaled 93.6% (Saudi Arabia Energy Consumption, 2020).
Application of KSA's domestic energy usage in 2020 (Saudi Arabia Energy Consumption, 2020).
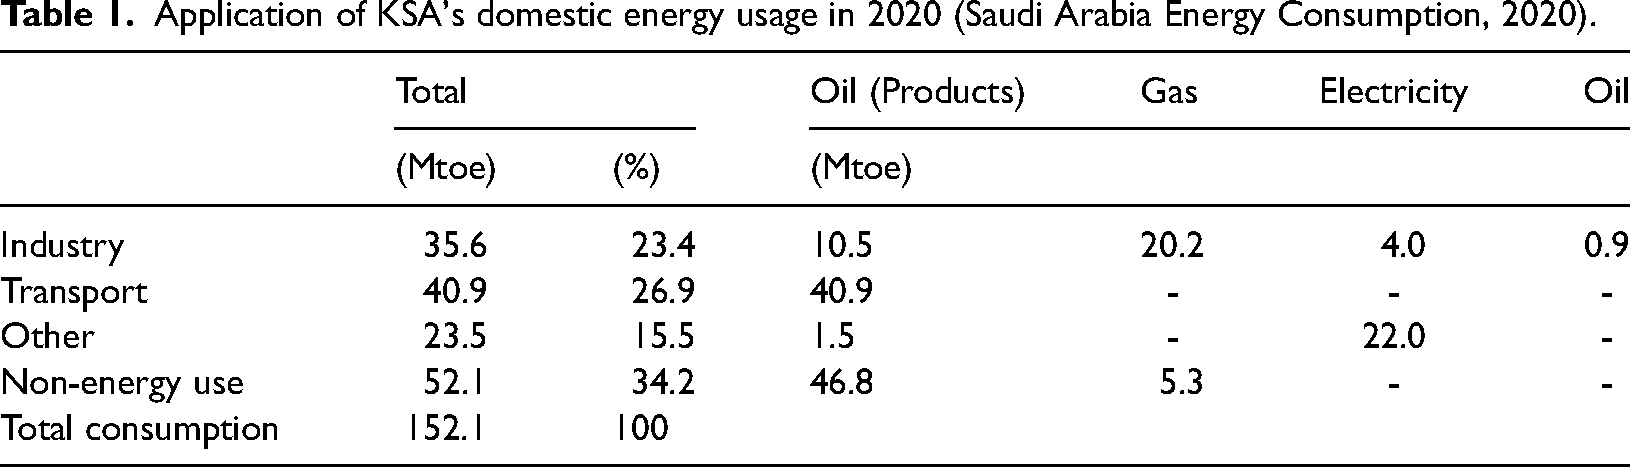
After the United States and China, the KSA is the third-largest consumer of energy for cooling. Therefore, it is now necessary to increase energy efficiency (EE) and fully utilize RE. The KSA has a temperature that is hot for most of the year and is rich in solar energy. Today, heating and cooling systems can be run on solar energy in addition to generating electricity. Saudi Arabia consumed approximately 292.2 TWh of electricity in 2021, with summer being the season with the highest load (64.2 GW) (Saudi Electric Company, 2021). Because of the enormous demand for air conditioning (AC) during the summer, when outdoor temperatures are so high, buildings in Saudi Arabia are currently an important sector in terms of development in electrical energy consumption.
Universities are seeing a rapid development of campus infrastructure as a result of the demand for additional electrical power growing at an accelerated rate due to the rising student enrollment, the addition of new courses, and the growth in research facilities. Environmental and sustainability concerns are therefore priorities in the development and operation of institutions. Universities accounted for a sizable portion of the government sector's 19.7% share of the total electrical energy consumption in 2021 (Saudi Electric Company, 2021). According to a field study on electricity consumption carried out by King Saud University, the university wastes about four million riyals worth of electricity every year, with “air conditioning,” “lighting,” and “computer devices” ranking first, second, and third, respectively, in terms of energy consumption (REPORT, 2022).
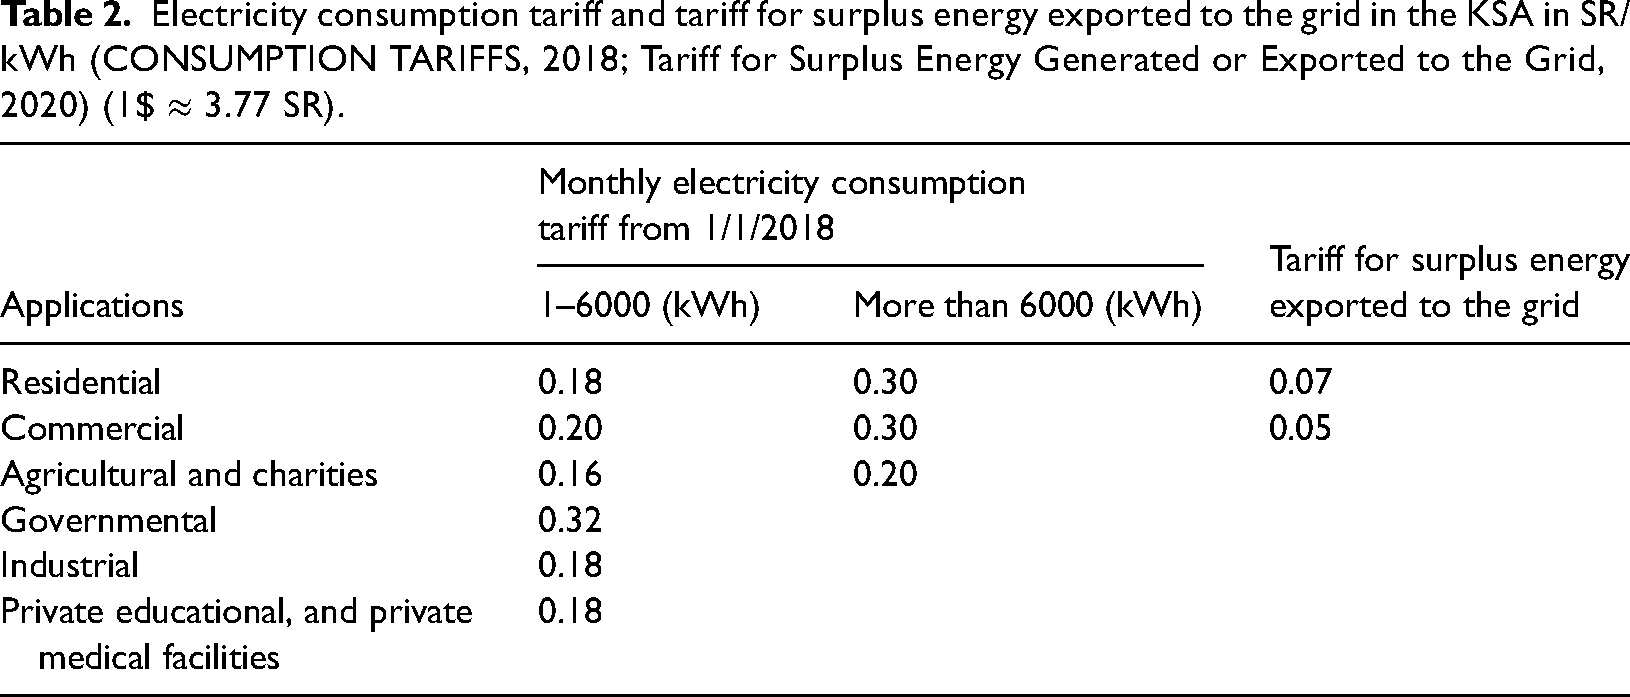
The main motives behind this study are the constant decline in prices of photovoltaic (PV) solar systems globally and the existence of a new government system to benefit from solar energy in the KSA (Tariff for Surplus Energy Generated or Exported to the Grid, 2020). Table 2 includes electricity prices from 1 January 2018, onward, and tariffs for surplus energy produced from PV systems and exported to the grid from 9 September 2020, in KSA. The Electricity and Co-generation Regulatory Authority determined the conditions and tariffs for surplus energy generated and exported to the grid according to application sectors. It is noted from the comparison between the electricity tariff consumed from the grid and exported to the grid that there is a big difference. It is recognized that the price of energy consumed from the grid is 0.18 SR/kWh, while the price sent to the grid is 0.05 SR/kWh in the case of private universities. It was also found that there is a reluctance on the part of citizens and investors to benefit from this system. Therefore, this study helps find a solution to benefit from PV solar energy in university buildings. Of course, among the key motivations to gain from such investigations are environmental preservation and safe energy security.
Electricity consumption tariff and tariff for surplus energy exported to the grid in the KSA in SR/kWh (CONSUMPTION TARIFFS, 2018; Tariff for Surplus Energy Generated or Exported to the Grid, 2020) (1$ ≈ 3.77 SR).
The study's main goal is to investigate the use of PV solar systems at Sulaiman Al-Rajhi University (SRU) as a case study. The work includes the following paragraphs after the introduction:
An in-depth literature review on energy and EE, PV solar energy use, and hybrid systems in university buildings, Methodology, which includes propositions, conditions, and governing equations, Results from the technical, economic, and environmental aspects, and Conclusions and recommendations.
Literature review
Numerous nations have conducted studies on energy use, EE, and RE in university buildings. This literature review was divided into three sections: energy use and conservation opportunities, solar energy systems, and finally hybrid systems. Energy is needed for heating, ventilation, air conditioning (HVAC), lighting, and other services in higher education buildings. ASHRAE Standard 90.1-2019 identified baseline values for energy use in university buildings of 403 kWh/m2 for electricity and 733 kWh/m2 for gas (ANSI/ASHRAE/IES, 2019). Khoshbakht et al. (2018) studied the energy use of 80 university campus buildings in Australia. They reported that buildings utilized mostly for research had the greatest annual energy use intensity (EUI) value, coming in at 216 kWh/m2, while academic office buildings had the lowest value, coming in at 137 kWh/m2. Mohd Shukri et al. (2022) researched energy use at Universiti Tun Hussein Onn Malaysia to generate an EE standard for higher education structures. The standard practicable range, according to statistical research, was between 72.5 and 141.0 kWh/m2/year. The most energy-efficient buildings are those with energy use intensities below 72.5 kWh/m2/year, while those above 141.0 kWh/m2/year are regarded as being inefficient.
Amaral et al. (2020) and (2021) identify the reasons why campuses are not sustainable: technical, economic, climatic, and behavioral. As a result, there are design flaws, poor maintenance, low returns on investment, and inconsistencies between protocols and the local climate. They also read up on strategies used to make campuses more sustainable in the literature. They suggested developing an integrated framework to communicate impact, track the viability of important activities, and advance the objective of energy resource conservation at campus locations. To help reduce energy consumption and sustain energy, Hasim et al. (2019) discussed several approaches put forth at some colleges. Launching energy awareness campaigns, utilizing energy-efficient equipment and appliances, load control, and putting in place a prepaid metering system were the tactics most frequently put into practice. According to the report, all parties involved in achieving a sustainable campus at universities must be committed to doing so. Emil and Diab (2021) reported on the results of implementing energy conservation measures (ECMs) at the Department of Mechanical Engineering building at Ain Shams University, Egypt. With a simple payback period of 4 to 5 years, the authors sized a solar PV system to provide these rationalized energy requirements using less than half the energy used before ECMs. A theoretical techno-economic analysis of the effect of changes made to the architecture of educational buildings on energy consumption was conducted in Dammam, KSA, by Hamida et al. (2021). Following the implementation of all ECMs, there would be an annual energy savings of 22.7% with a 2.7-year payback period. According to the authors, almost 73% of all electricity was used for AC. Sait (2013) examined the electricity use of an educational building located in Rabigh, KSA. He suggested several ECMs for a 35.3% reduction in electricity use, with a payback period of roughly 2.7 years.
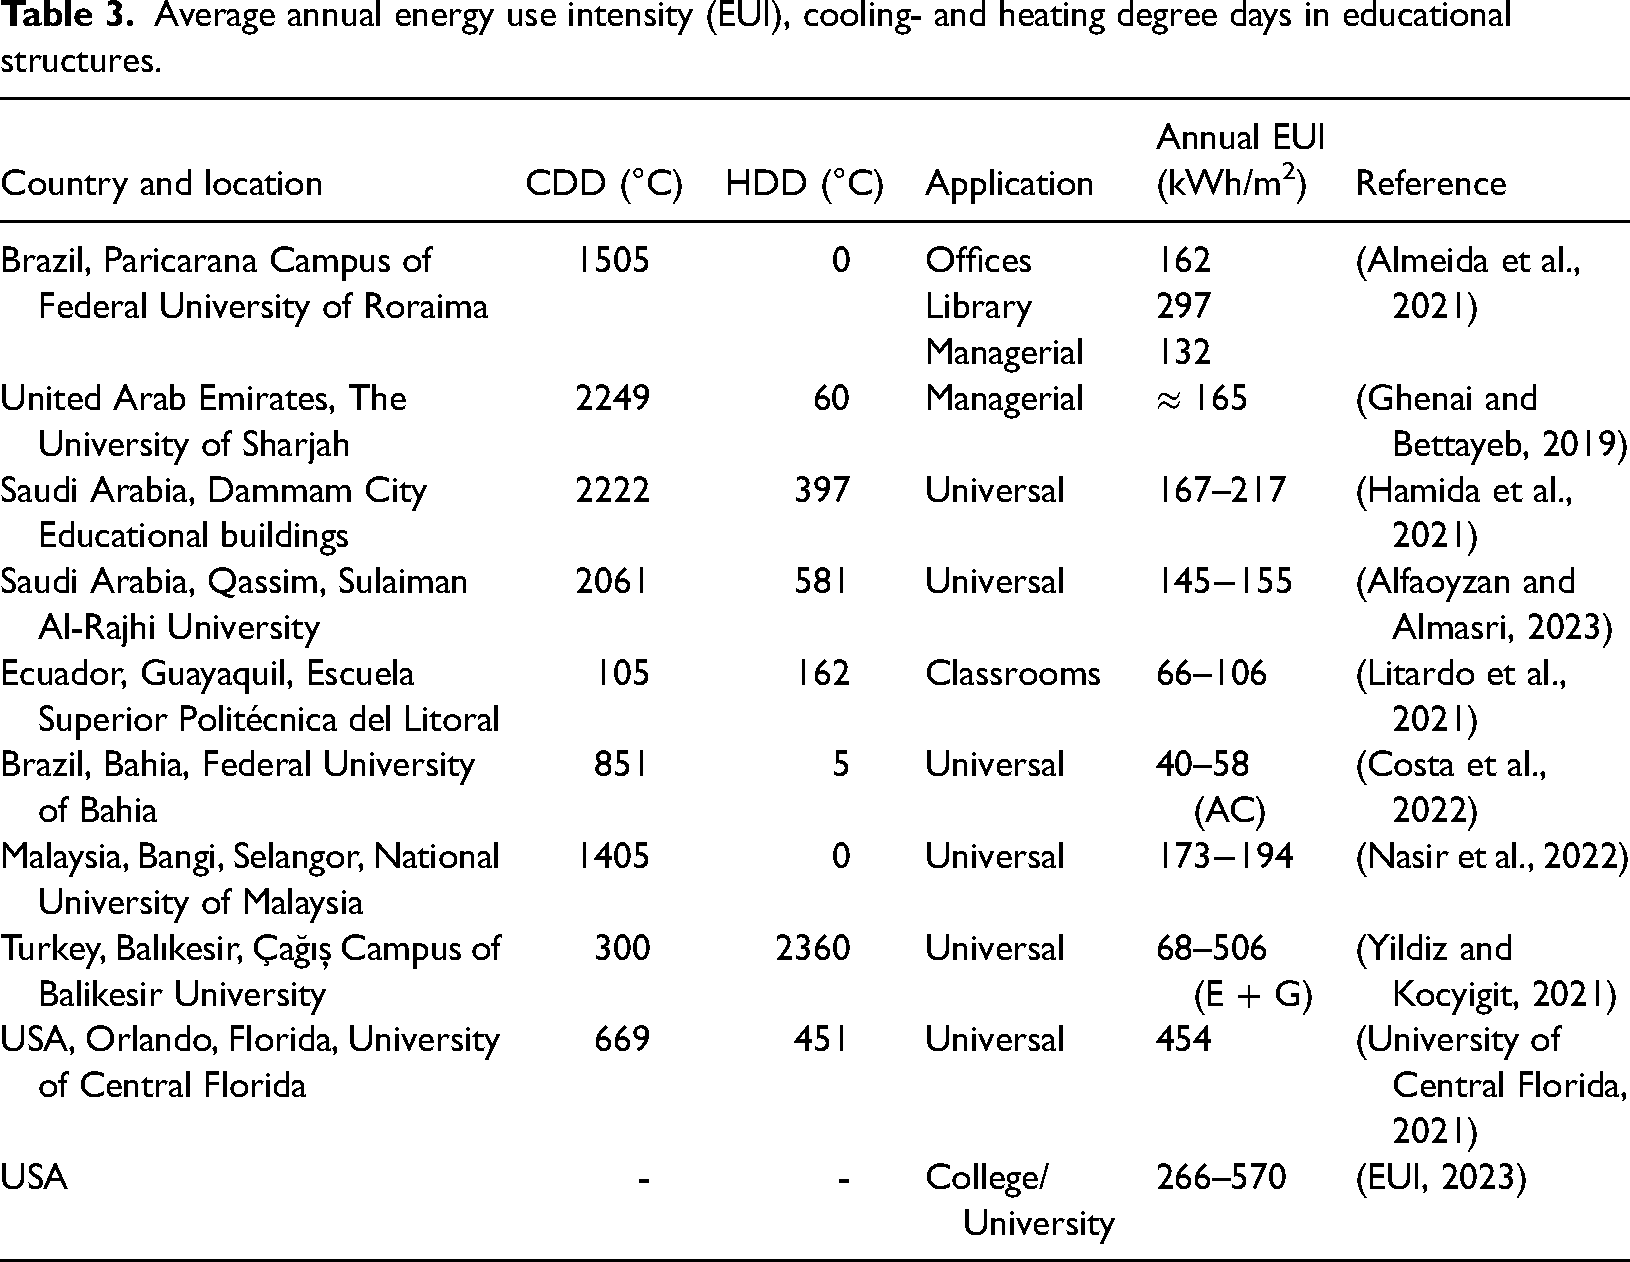
Table 3 lists the average EUI, heating-degree days (HDD), and cooling-degree days (CDD) in hot climates. Utilizing (Degree Days, 2022), the CDD and HDD were found using a base temperature of 24 °C and 20 °C and a 5-year average (inclusive of 2017–2021), respectively. Additionally, Table 3 demonstrates that there is generally no consistency among the final EUI values provided. The university type, the type of energy used, the nature, construction, and use of the facilities, climatic conditions, as well as user behavior, could all be factors.
Average annual energy use intensity (EUI), cooling- and heating degree days in educational structures.
Leal Filho et al. (2019) looked at a sample of 50 higher education institutes from throughout the world to see how involved they were in ECMs and to determine what kinds of RE were being used at the time. Results show that only a tiny part of energy consumption in more than half of the colleges is sourced from RE sources (1% to 20%), having solar/PV as the most prevalent source (70%). Saeed (1993) looked into the degree of thermal comfort in some of the colleges of King Saud University in Riyadh, Saudi Arabia. The findings demonstrated that the majority of the samples were able to achieve interior temperature comfort levels of 24 °C to 26 °C in the summer and 23 °C to 29 °C in the winter, which means they are compatible with standards in the summer and high in the winter.
On the roofs of mosques and other structures in Saudi Arabia, Alharbi and Alaboodi (2023) evaluated the techno-economic analysis of PV power plants and looked at earlier policy papers and existing research on the subject. To find a strategy to lower energy consumption and transform these buildings into energy-sustaining ones, Abdou et al. (2018) examined the energy usage in university buildings. They contend that new building plans should be based on an energy awareness strategy that involves creating a department in charge of regulating and monitoring energy use, promoting the use of RE sources, and adopting smart building designs. An eco-friendly model was created by Heravi et al. (2021) to determine how much more ecologically friendly it would be at the Iranian University of Tehran. According to their findings, the university's overall grades climbed by 64% between 2016 and 2020. They also discovered strategies to control cooling and heating systems and reduce energy waste to make energy consumption at the university more sustainable. A model for creating a RE microgrid for the Gwanak Campus at Seoul National University in South Korea was created by Husein and Chung (2018). According to the findings, an ideal microgrid reduced energy consumption by 42% and emissions by 15%. The optimal net present value (NPV) of a 125 kW system is 430,727$, with a payback period ranging from 7.98 to 10.2 years, a benefit-to-cost ratio between 1.2 and 1.5, and an 18% capacity factor.
A review of smart energy systems used on campuses in the UK's higher education sector was offered by Kourgiozou et al. (2021). They emphasized that the current framework in higher education facilities only refers to reducing carbon emissions and does not mention the integration of smart energy systems. A clear, uniform framework is required to realize the campus’ basic objectives. At Valencia University in Spain, Gómez-Amo et al. (2004) examined energy use while 4.7 or 14.7 kW PV systems were present. They reported that one-third of the lighting load and up to 10% of AC loads might be reduced, and there would also be positive environmental effects. They claimed that using solar energy might have a payback period of seven to nine years. According to Albatayneh et al. (2021), for Jordan's climate, solar thermal cooling systems are more expensive than PV-vapor compression AC systems. In contrast to the absorption solar chiller, which had a levelized cost of energy (LCOE) of $2.35/kWh, the coupled PV-AC system's LCOE was less than $0.05/kWh. Using data from the Portuguese market, Ferreira and Silva (2022) assessed solar thermal systems’ initial investment costs for a warm-water supply based on system size and energy demand. They stated that the type of fuel utilized is a major factor in determining the capital payback period, which was 8 years for electricity, 14.2 years for diesel, and 22.2 years for natural gas. Rehman et al. (2020) evaluated the viability and potential of solar-aided desiccant cooling systems in Saudi Arabia. This can greatly reduce the cost of cooling units, according to the economic study. It has been demonstrated that the suggested system, which has a 1-ton capacity, uses 34.6% less energy than a conventional vapor compression unit. Regarding the technological and financial viability of utility-scale solar power facilities at 10 locations in KSA, Hafez et al. (2020) offered a comparison between PV and concentrated solar power (CSP) types. The authors concluded that the lowest LCOE for PV systems and CSP with a parabolic trough, for instance, are favored candidates in the Saudi market; the lowest cost of electricity was determined to be 0.06$US/kWh. A PV system still has a higher LCOE than a solar thermal system, but maybe shortly the LCOE of PV systems will decrease. The advantages and disadvantages of Very Large Scale Photovoltaic (VLS-PV) applications in Saudi Arabia were discussed by Almarshoud and Adam (2018). The authors propose the construction of six VLS-PV power plants with a combined capacity of 9 GW and show the economic, environmental, and social consequences. Almarshoud (2016) investigated the efficiency of solar systems in 32 different Saudi Arabian sites. Investigations have been conducted on three sun tracking modes, including fixed tilt angle, 1-axis, and 2-axis tracking types. The results showed that both the northern and southern sites in Saudi Arabia have good energy productivity. The findings also showed that while the difference in generated energy between fixed mode and 1-axis tracking mode is between 28% and 33%, it is only about 3.0–4.5% between 1-axis tracking and 2-axis tracking modes. The financial effects of installing grid-connected PV systems in school buildings in Arar, Saudi Arabia, were investigated by Alfaraidy and Sulieman (2019). According to the authors, government incentives are needed to boost the economic sustainability of the systems because solar energy is likely to remain expensive.
Almasoud and Gandayh (2015) discussed the use of PV systems to generate electricity in KSA. As a result, peak savings during peak hours could be attained by utilizing grid-connected solar systems in addition to current conventional power generation systems. The authors provide evidence that, after accounting for the cost of the environmental and health consequences, PV systems will be less expensive than fossil fuel systems. Using PV*SOL simulation software in Hail City, Abdelhafez et al. (2021) looked into how PVs may be integrated onto residential structures’ rooftops. The findings showed that residential buildings in Hail City have rooftop space suitable for PV systems that is greater than 9 million square meters. The use of solar power in mosques has been studied by Elshurafa et al. (2019). A 124 kW PV system was put to the test on the roof of a mosque in Riyadh, KSA. At an investment cost of 1.18 $/W, the system can save annual energy costs by more than 50%. If specific energy-saving measures were used at the outset of the mosque's planning and construction, they discovered that the PV system might reduce the cost of power to zero. The technical and economic viability of PV systems in the hot and muggy environment of KSA was researched by Dehwah et al. (2020). With a 25-year lifespan, they discovered that the PV system's LCOE was $0.071/kWh and had a 15-year simple payback period. The government offers a 35% subsidy for the up-front expenditure to boost the possibility that solar energy would be financially effective. This lowers the LCOE of PV to 0.0447 USD per kWh and extends its simple payback period to 16 years. In the KSA, Ko et al. (2019) created the feed-in tariff (FIT) for PV systems. For all regions except the South, the system's payback was seven to eight years. Nevertheless, the KSA will need to raise the present rates of FIT to use solar energy. The FIT will need to be changed to 0.12 SR per kWh in order to achieve an approximate five-year simple payback and keep investors from losing credits if current use rates stay at 0.18 SR per kWh. According to Al-Anazi and Almasri (2023), the LCOE of PV systems is 0.024 $/kWh, and the economic indicators for PV systems are insufficient due to the KSA system's implementation. If the electricity produced by PV systems is put into the grid at a rate of 0.084 $/kWh, the simple payback time (SPBT) is 5.14 years. According to Almushaikah and Almasri (2020), if the energy produced is exported to the grid at the approved export tariff of 0.019 $/kWh, the SPBT for a planned PV system exceeds the project's life. If the energy was exported to the grid at 0.048 $/kWh, it would have taken 13.42 years. The effects of ECMs and the use of PV in Saudi Arabia's residential buildings were investigated by Almasri et al. (2021). For Riyadh, Hail, and Abha, respectively, they reported that the LCOE of electricity from PV was 0.031, 0.030, and 0.029 $/kWh.
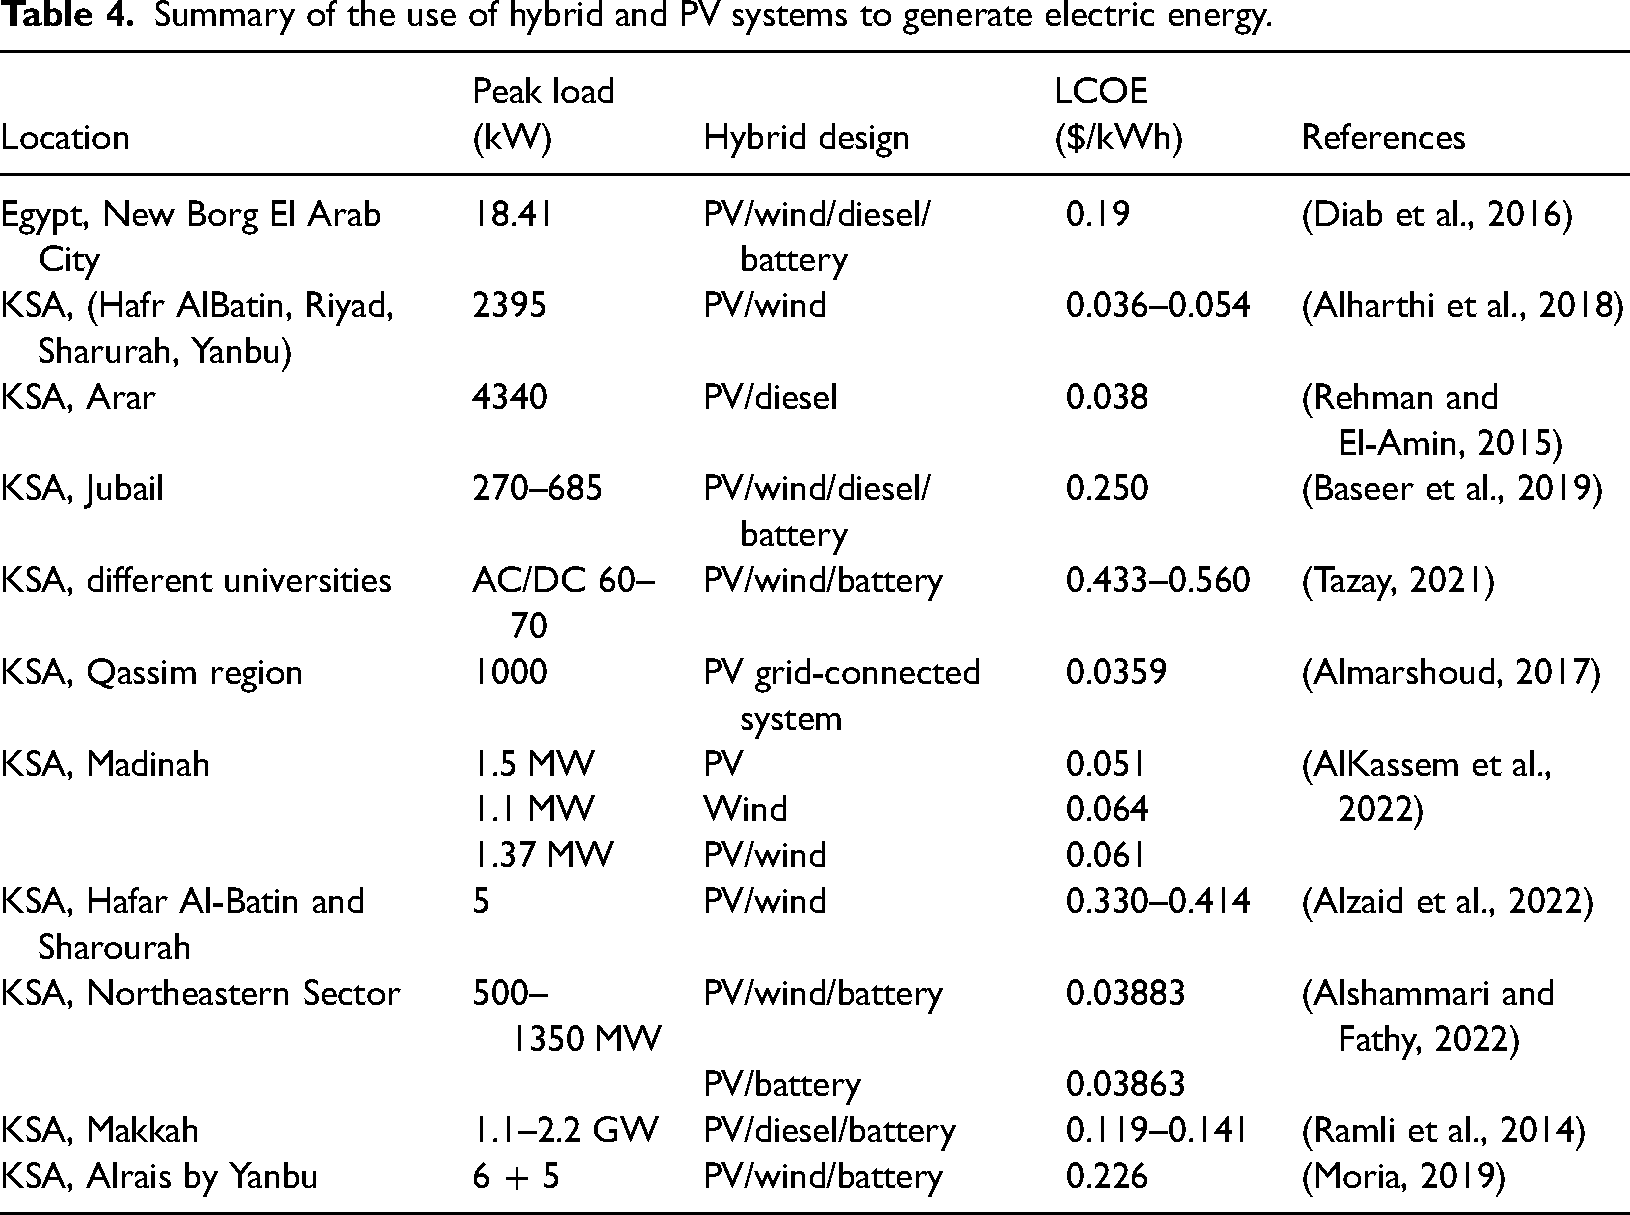
There are also several studies on the use of hybrid systems to generate electric power in university buildings and others. A smart hybrid RE system was analyzed by Eisapour et al. (2021) to meet the electrical and heating needs of Shiraz University's Eram Campus in Iran. They stated that the LCOE is 0.09 dollars per kWh. The performance of a hybrid system of PV/fuel cells/generator at the University of Sharjah administrative building, in the UAE, was examined by Ghenai and Bettayeb (2019). The results indicate that the projected solutions might provide a RE fraction of between 66.1% and 75.8%. The possibility of phasing out generators and replacing them with a hybrid system consisting of PVs/battery systems for a small university campus grid—these things were studied by Chedid et al. (2020). Their 10-year energy flow demonstrated that the capabilities of this system could lead to phasing out diesel generators. The study also showed that the proposed system could reduce the LCOE from 13.7 to 8.8 per kWh in the first year and from 14.4 to 0.10 per kWh in the tenth year, with a 6-year simple payback period. Mokhtara et al. (2021) presented a design and an analysis of a grid-connected hybrid power system with storage units. The system was designed for university buildings and transportation in Ouargla, Algeria, and the HOMER program was used for the purpose. And the results showed that the grid-connected PV with a hydrogen system will be the top solution for the future. Rehman (2020) conducted a detailed study of hybrid power systems—under different conditions—to see what is best for KSA. The researcher investigated hybrid power system technologies, sizes, efficiency, and costs and discovered that the average energy costs for PV/wind, PV/diesel, and PV/wind/diesel, were 0.458, 0.349, and 0.355 $ per kWh, respectively. Tazay (2021) evaluated the hybrid RE systems at four universities using HOMER software. The analysis found that the proposed PV-grid system is the best solution compared to alternatives and that a minimum LCOE of 0.0688 $/kWh was realized at Al Baha University, with an anticipated payback time of 17 years. The LCOE for the other institutions was as follows: Tabuk's is $0.0714; Sattam's is $0.0753; and Jeddah's is $0.0702. At the Islamic University of Madinah in KSA, AlKassem et al. (2022) examined the design of a microgrid system. For the PV system, wind system, and hybrid system, three possibilities were examined, and their technical and economic performance was evaluated. The findings show that a PV system has a straightforward payback period of 18.6 years, compared to 23.6 years for a wind system and 20.7 years for a hybrid system. The outcomes also demonstrated that, from an economic standpoint, the solar system is the best. In Hafar Al-Batin and Sharourah in Saudi Arabia, Alzaid et al. (2022) describe the construction of a hybrid wind and solar PV system with a load capacity of 5 kW/h using HOMER. The following is a summary of the key findings: In terms of lower LCOE and lesser energy excess, Sharourah is better suited for the deployment of the hybrid system than Hafar Al-Batin. For Sharourah and Hafar Al-Batin, the payback periods were 11 and 20 years, respectively. Table 4 shows data on the electrical energy systems in university buildings and others in the KSA and some neighboring countries. The difference in indicators can be attributed to climatic conditions, system composition, source fractions, capacity, economic aspects, and study time.
Summary of the use of hybrid and PV systems to generate electric energy.
According to the literature review, there aren’t many studies demonstrating the advantages of solar energy for university buildings in hot nations like KSA with strong solar radiation. The main motives behind this study are the constant low prices of PV solar systems globally and the existence of a new government system to benefit from solar energy in the KSA. It was also shown from this literature review that there is a discrepancy in the results between the studied cases in general. Therefore, this study fills up this gap and clarifies the viability of PV use on university buildings in (Al Bukayriyah) Qassim region of the KSA from a technical, environmental, and economic point of view using Helioscope software. Two PV solar system scenarios were considered: scenario 1, in which the entire roof of the buildings is covered by a PV system, and scenario 2, for securing electricity so that it is a nearly zero-bill campus (nZBC).
Methodology
In this paragraph, the method used in the study and how to secure the necessary data will be presented. It also sets out the applicable laws and conditions. This technical, economic, and environmental study aims to examine the use of PV systems on SRU buildings in (Al Bukayriyah) Qassim region of the KSA using Helioscope software.
Research framework
Transforming the campus from a typical consumer of traditional electric energy into an energy producer by utilizing the installation of a PV system to make buildings sustainable will be discussed. Two PV solar system scenarios were considered: scenario 1, in which the entire roof of the SRU buildings is covered by a PV system, and scenario 2, for securing electricity so that it is a nZBC. After the climate data was secured and built on the team's previous pilot study of energy consumption and ECMs on campus (Alfaoyzan and Almasri, 2023), the team went to study the advantages of PV solar energy. It is important to notice that the right equipment has been chosen given the technical, climatic, and financial circumstances. The utilization of PV on SRU buildings was then assessed from a technical, environmental, and economic perspective.
Meteorological condition
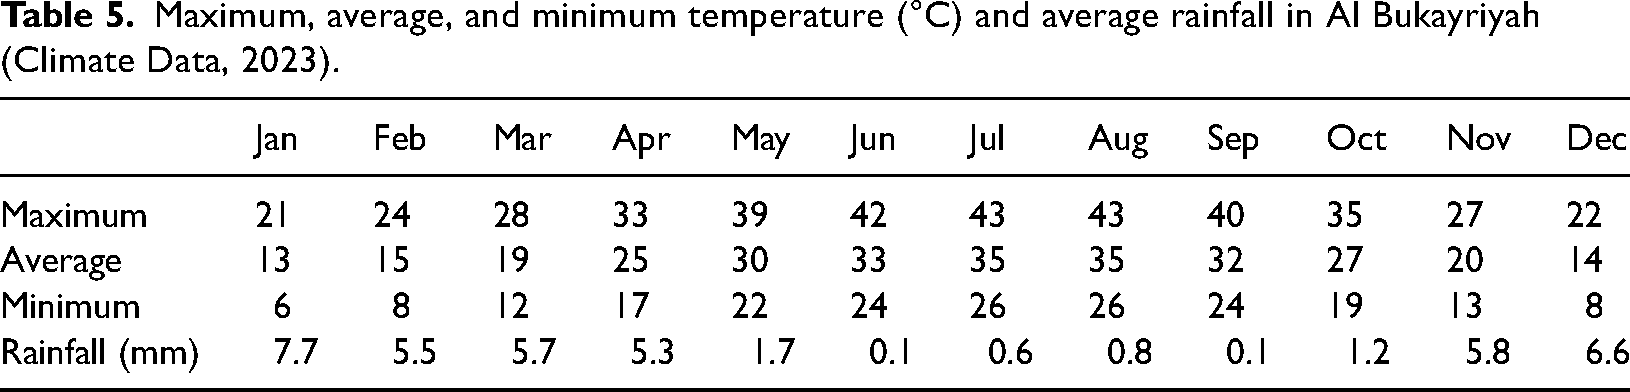
At a latitude of 26°08′26.2” N and a longitude of 43°43′54.8” E, SRU is situated in Al Bukayriyah (near Buraydah in Qassim region), in the country of Saudi Arabia's center. KSA is categorized as having a hot and dry climate. The highest, lowest, and average temperatures and average rainfall at the Al Bukayriyah site (university campus) are displayed in Table 5. The maximum solar radiation is found in Tabuk, which is located in northern KSA and has most of the planet's sunlight. In Qassim, the yearly PV power potential ranges from 1826 to 1972 kWh/kWp (see Figure 1). The annual average for solar energy varies, with the peak intensity occurring for 3.3 months from May 15 to August 25 and averaging over 7.5 kWh/m2 daily. On the other hand, the comparatively low radiation period, which runs from November 6 to February 2 and has an average daily energy of 4.9 kWh/m2, lasts for 2.9 months. For the remaining months of the year, the intensity of solar radiation ranges between these two values. Bukayriyah experiences a range of monthly precipitation, with rain typically falling in January when the average monthly amount is 8 mm. On the other side, summer months typically do not see much rain. The PV system is affected by dust and rain. The average number of rainy days per year in the Qassim region is 39 days due to the dearth of precipitation. Since the Qassim region is surrounded by desert, dust is always to be expected whenever the desert is traversed by winds that carry dry and light sand.
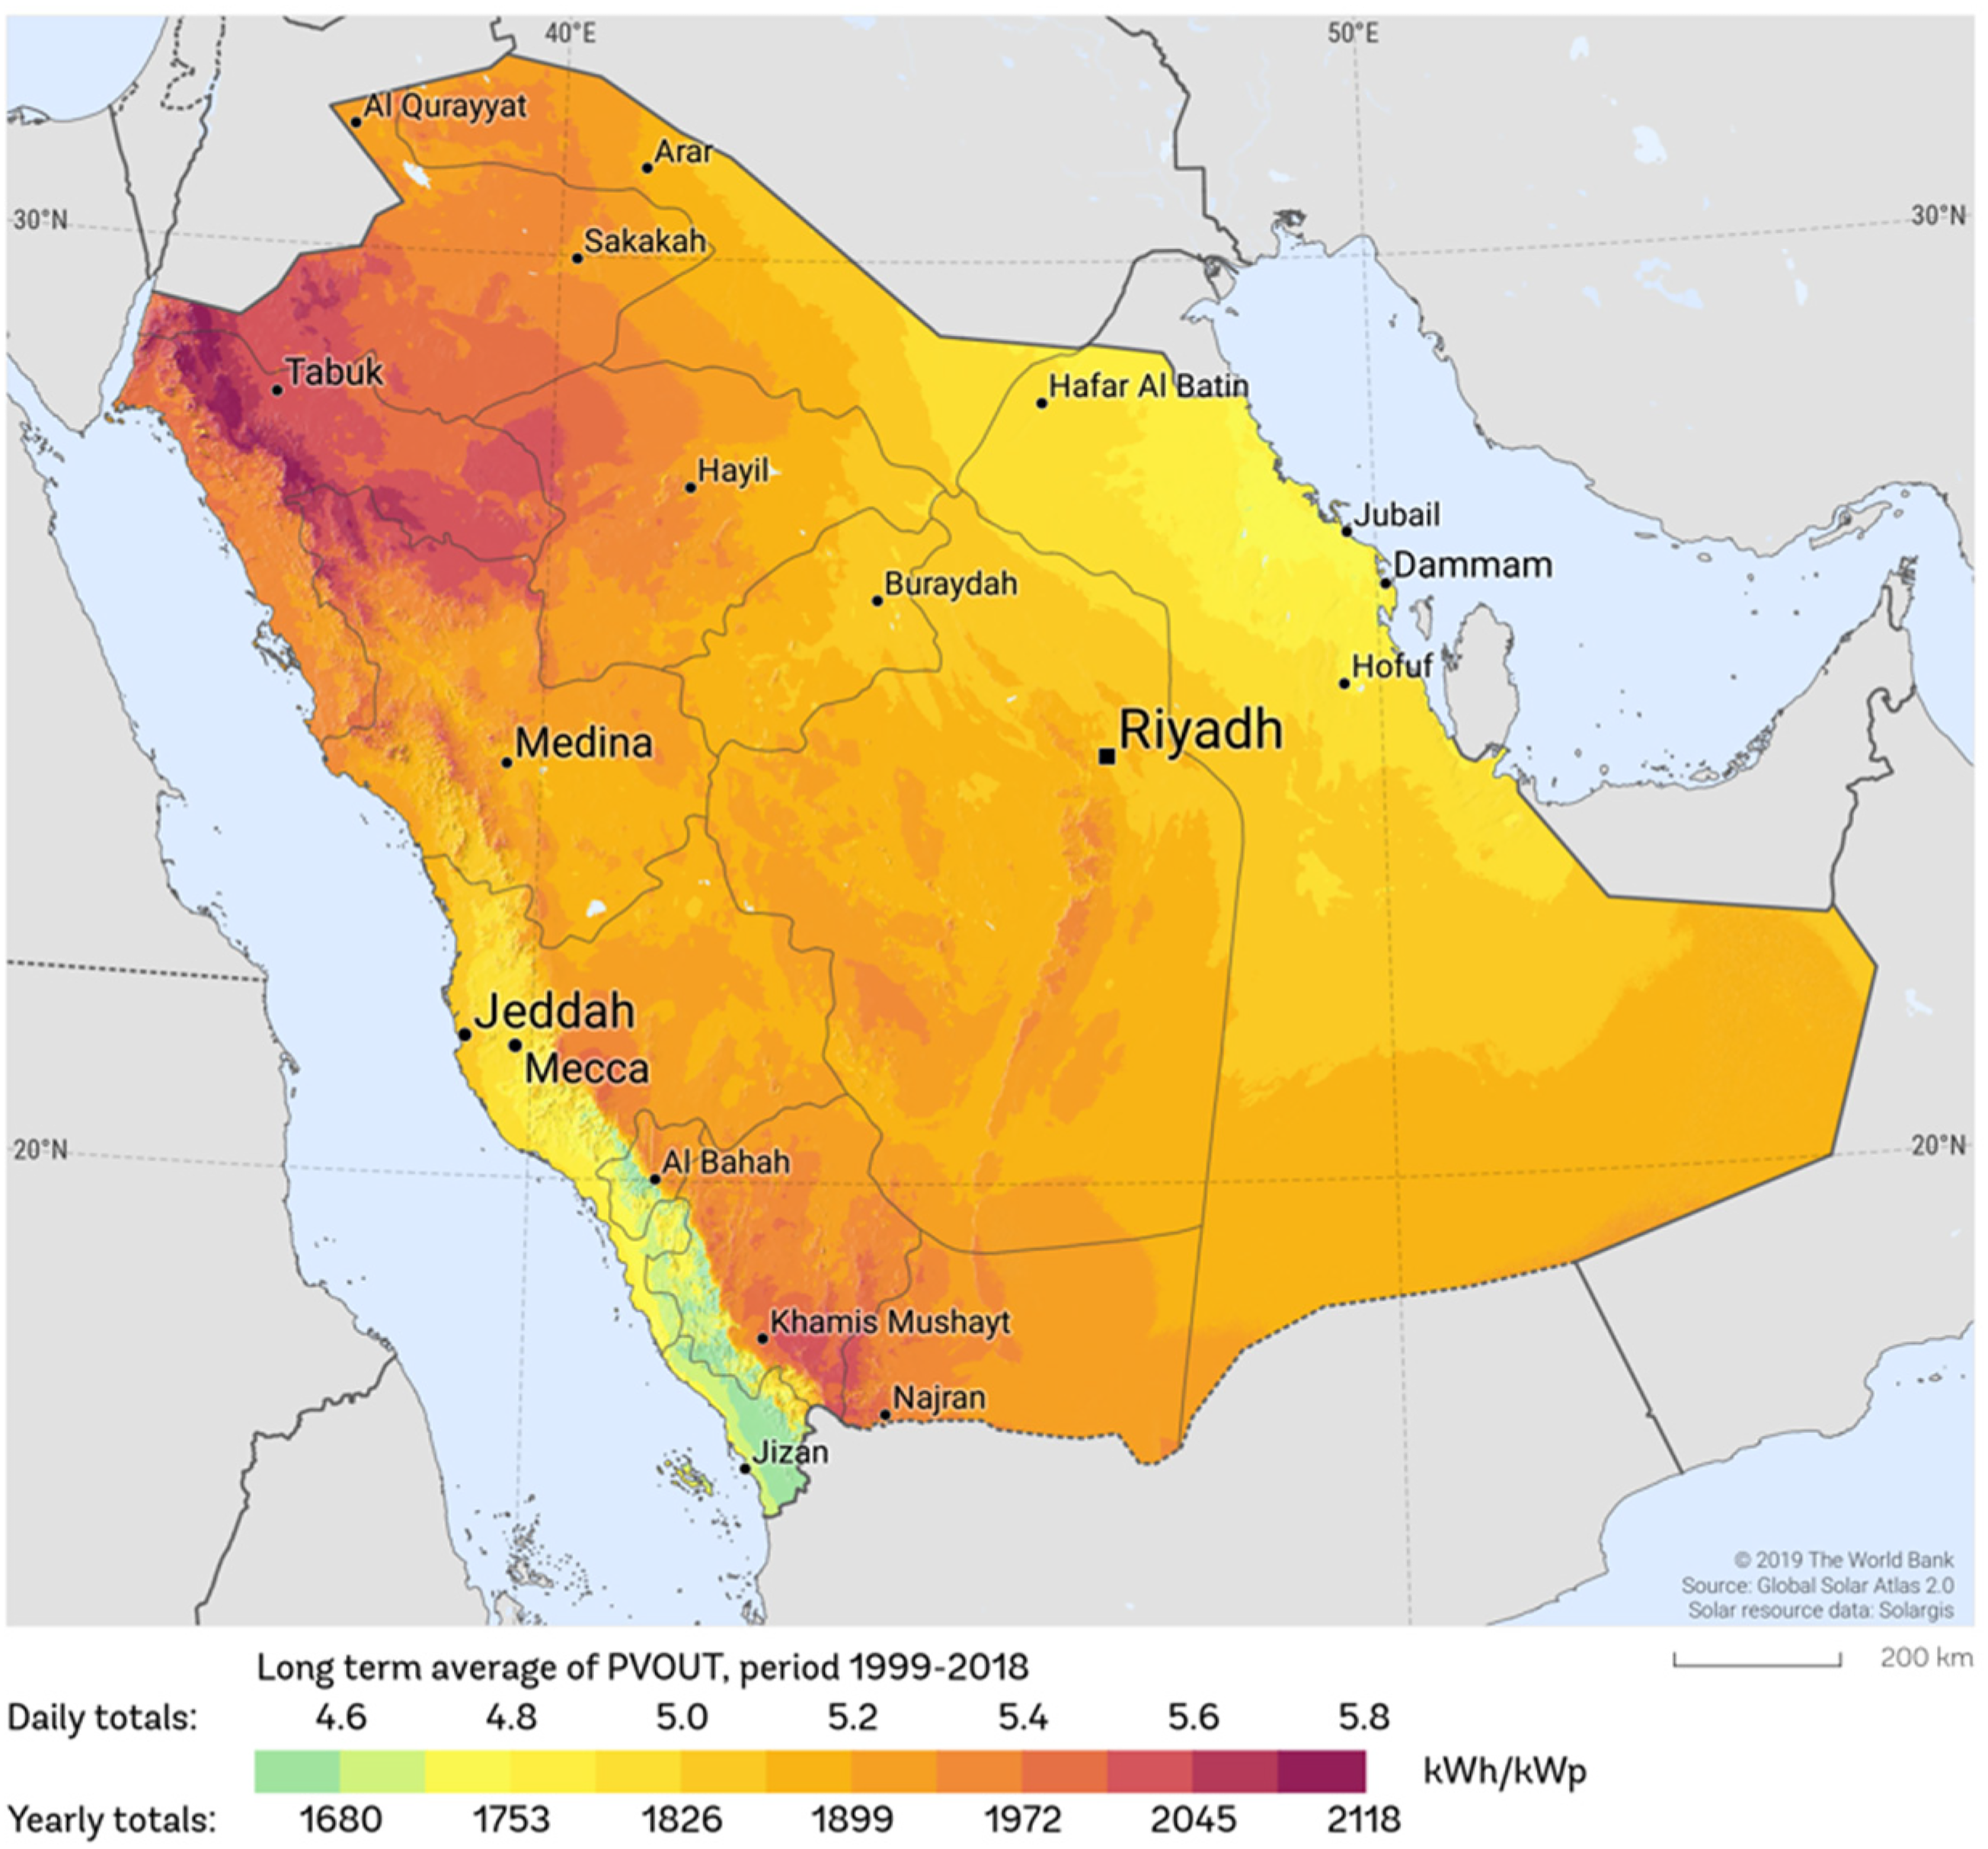
Average daily and annual PV power potential in KSA (Photovoltaic Power Potential, 2022).
Maximum, average, and minimum temperature (°C) and average rainfall in Al Bukayriyah (Climate Data, 2023).
Data Sources
In this paragraph, the case study will be presented. Five buildings and a sports facility are housed on the 981,661 m2 property. There are 89,970 m2 of conditioned space in all. The general information provided by Alfaoyzan and Almasri (2023) on university buildings includes data on their size, usage, air-conditioning system capacity, building structure, energy use, and ECMs. The majority of the required electricity was produced by diesel generators before the campus was coupled to the grid in November 2022. And it should be mentioned that the usage of solar energy for lighting the university campus’ roadways and courtyards did not take energy balance into account. Energy-saving options and solar energy use to satisfy demand were found, and the environmental impact of the proposed solutions was assessed.
Technical Analysis
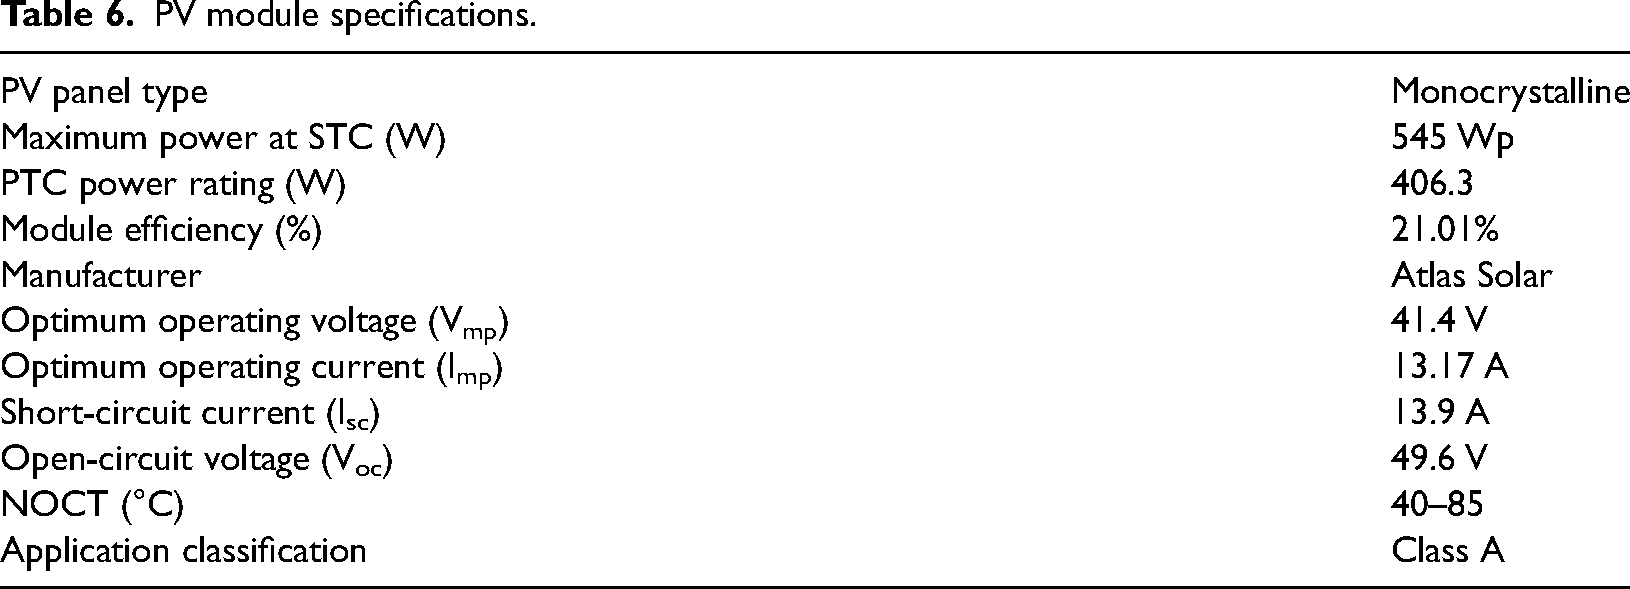
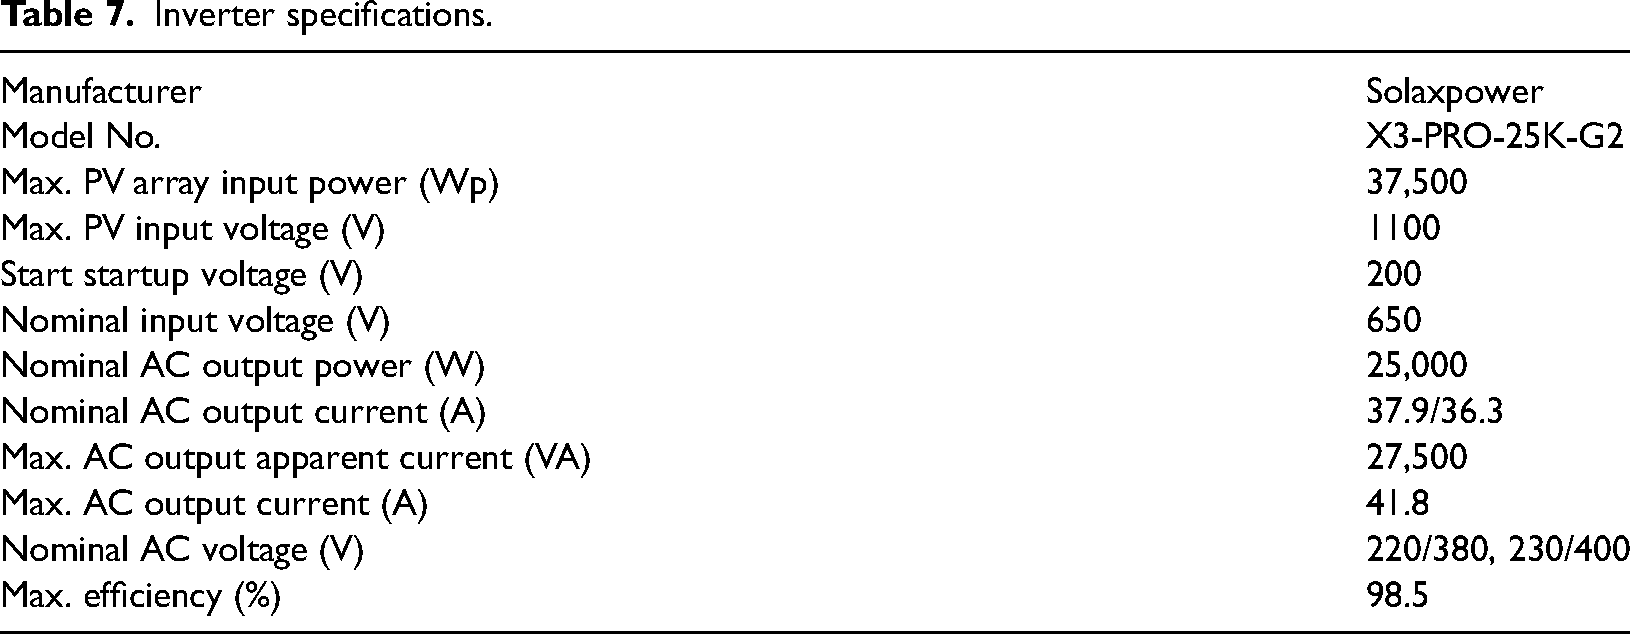
The technical information and equations used in this investigation will be described in this paragraph. With 1.2 and 5.3 MW of capacity, two scenarios (1 and 2) were designed. The PV solar systems chosen were an Atlas Solar Module PV array with 2112, 9759 panels, and 48, 220 inverter types (Solaxpower X3 PRO 25K G2). The tilt angle for the position of the PV will be 26.1° straight south, which is the Al Bukayriyah site latitude. Tables 6 and 7 exhibit the technical details of the PV module and inverter that were employed.
PV module specifications.
Inverter specifications.
Equation (1) gives the average daily electricity provided by the PV array (in kWh per m2 per day) over a slanted surface:
ηe = average efficiency of PV array,
A = area in m2,
Gt = average daily global radiation (in kWh/m2/d) over a slanted surface,
Lm and Lc = PV array losses, and power conditioning losses, which assumed Lm = 2% and Lc = 1.5%.
The annual energy that is produced from the PV systems can be calculated using equation (2).
ηinv = inverter efficiency.
After calculating the annual energy production, the performance indicators were calculated using yield factor (YF) and capacity factor (CF) as follows (Kymakis et al., 2009):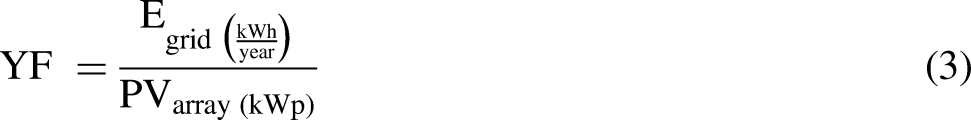

Economic Analysis
These sentences will explain the economic analysis that was used in this inquiry. Saudi Electricity Company (SEC) has approved an export price of 0.05 SAR (0.013$) per kWh for surplus energy generated by PV systems in the non-residential sector, whereas the power tariff in the government sector and private education sector per kWh is 0.32 SR (0.0847$) per kWh and 0.18 SR (0.048$), respectively. The export tariff was modified from 0.05 to 0.32 SR/kWh when simulating the projected PV systems using Helioscope.
The savings in money are determined as follows:
First case: If the consumed electricity at the SRU (Econ) is more than produced energy (Epre), then:


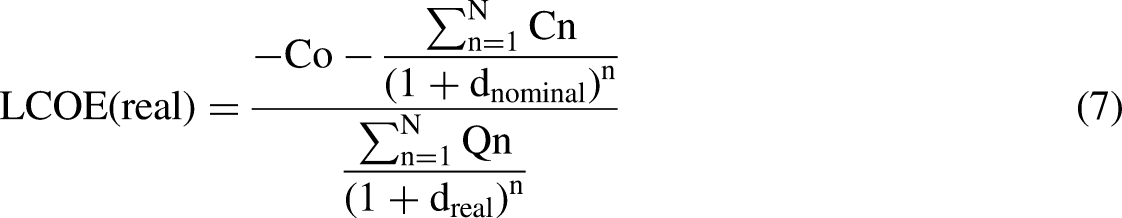
Co = the investment,
Cn = project's price in n years,
Dreal = real discount rate (RDR) in percentages,
Dnominal = nominal discount rate (NDR) in percentages (i.e., the discount rate with inflation rate (IR)), which can be calculated using equation (8),
N = the analysis period in years,
Qn = the amount of electricity generated by the plant in a year (kWh).

Costs and revenue are combined to calculate a project's NPV. The NPV can be calculated using equation (9). If a project's NPV is positive rather than negative, it is said to be economically viable as opposed to unviable.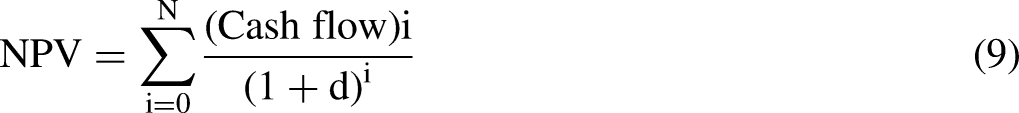
d = discount rate if the fuel escalation rate, the installation's lifespan is represented by the i.
The internal rate of return (IRR) is an important factor to take into account when determining an investment's profitability, according to Helioscope.
The inflation rate is 2.5%, while the interest rate is 2.4%, according to the Saudi Arabian Monetary Agency (SAMA). The discount rate in the KSA, however, is anticipated to be 4.5%. There would be no debt included in the project's capital expenses, and the project would last the 25 years required by the life cycle of a PV module. Inverters have a 15-year lifespan and a 30% cost of ownership salvage value. The cost of PV systems in local markets and the energy exchange tariff in 2021 are used to determine the SPBT, which is achieved as follows: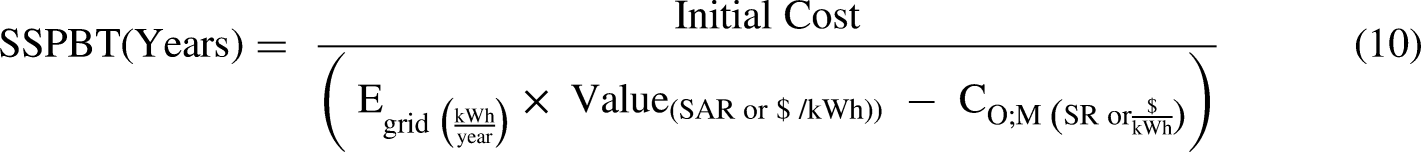
Environmental Analysis
The environmental analysis that was used in this investigation will be described in these sentences. Any amount of energy conservation aids in ecosystem preservation. Solar energy usage results in a reduction of GHG emissions. To calculate the annual rate of gas emissions savings, apply the formula below:
EF = Emissions Factor (kg of gas/kWh)
EC = Electricity production (kWh)
The EF for KSA was projected at 703 g/kWh (CLIMATE TRANSPARENCY REPORT, 2020). Tazay (2021) detailed how many hazardous emissions are produced during the production of electricity: 1.79 gCO/kWh, 1.60 g/kWh of nitrogen oxide, and 1.47 g/kWh of sulfur dioxide.
Results and investigation
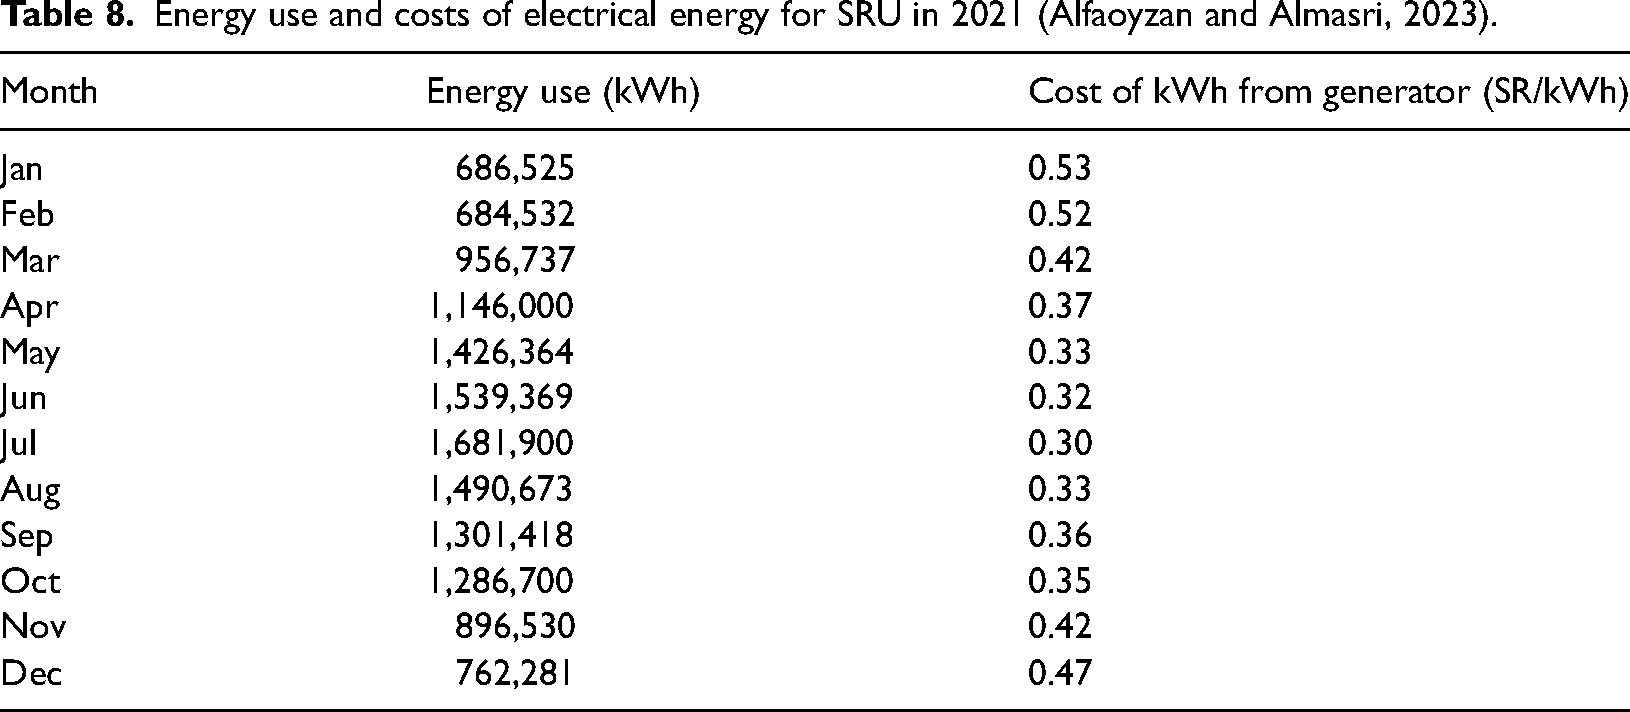
This paragraph will explain the technical results obtained in terms of securing energy and identifying indicators. Based on Alfaoyzan and Almasri’s (2023) results, campus energy balancing was presented for 2021 in Figure 2 where it can be seen that 13,859 MWh of electrical energy was used up during the year. Electricity was mostly generated by diesel-fueled generators. The lowest reported electricity consumption—684 MWh in February—and the highest—1681 MWh in July—were observed. It should be emphasized that the university also benefits from solar energy by using PV systems to illuminate the squares and walkways. The largest portion of the total electricity consumption—79% (10,946 MWh)—is used by the HVAC system. Next in line are “others,” which use 14% (1941 MWh), and lighting, which uses 7% (974 MWh).

Energy flow of university campus in 2021 (Alfaoyzan and Almasri, 2023).
The average cost of an electricity unit (kWh) produced by the institution was estimated to be around 0.39 SR, while the SEC charges 0.18 SR for educational facilities. The technical and financial factors of energy usage in 2021 are covered in full in Table 8 for university buildings. Additionally, it should be mentioned that solar systems have the advantage of being able to completely meet the load during the winter.
Energy use and costs of electrical energy for SRU in 2021 (Alfaoyzan and Almasri, 2023).
Alfaoyzan and Almasri (2023) looked at ECMs as the building envelope, employing an efficient HVAC system, utilizing an efficient lighting system, and improving the operational strategies of water heating system.
Technical analysis
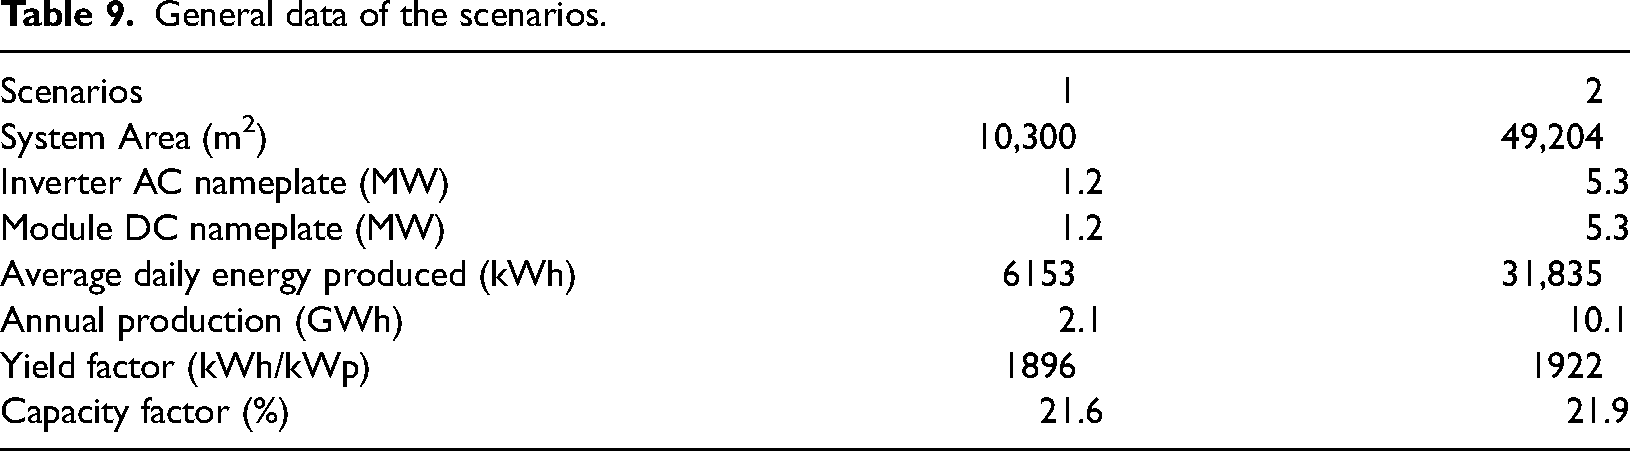
Two scenarios were designed. The first of the two scenarios made use of the full building's roof. A total of 10,300 square meters, or 94% of the total area, comprise the surface of the buildings. The system's maximum capacity was discovered to be around 1.2 MW. The second involved expanding the system to utilize the 49,204 square meters and 5.3 MW of area next to the buildings. The available space on the buildings’ roofs, as indicated in Figure 3, was taken into consideration when the design process began. Using equation (1), the daily energy production from the proposed solar systems was obtained from the first and second scenarios, 6153 and 31,835 kWh/day, respectively. The annual production was also obtained using equation (2) for the first and second scenarios, 2.1 and 10.1 GWh, respectively. Table 6 displays the technical details of the PV modules that were chosen for the PV systems, while Table 9 illustrates the technical details of the two scenarios, including the energy produced, the yield factor, and the capacity factor that were derived using equations (3) and (4), respectively.
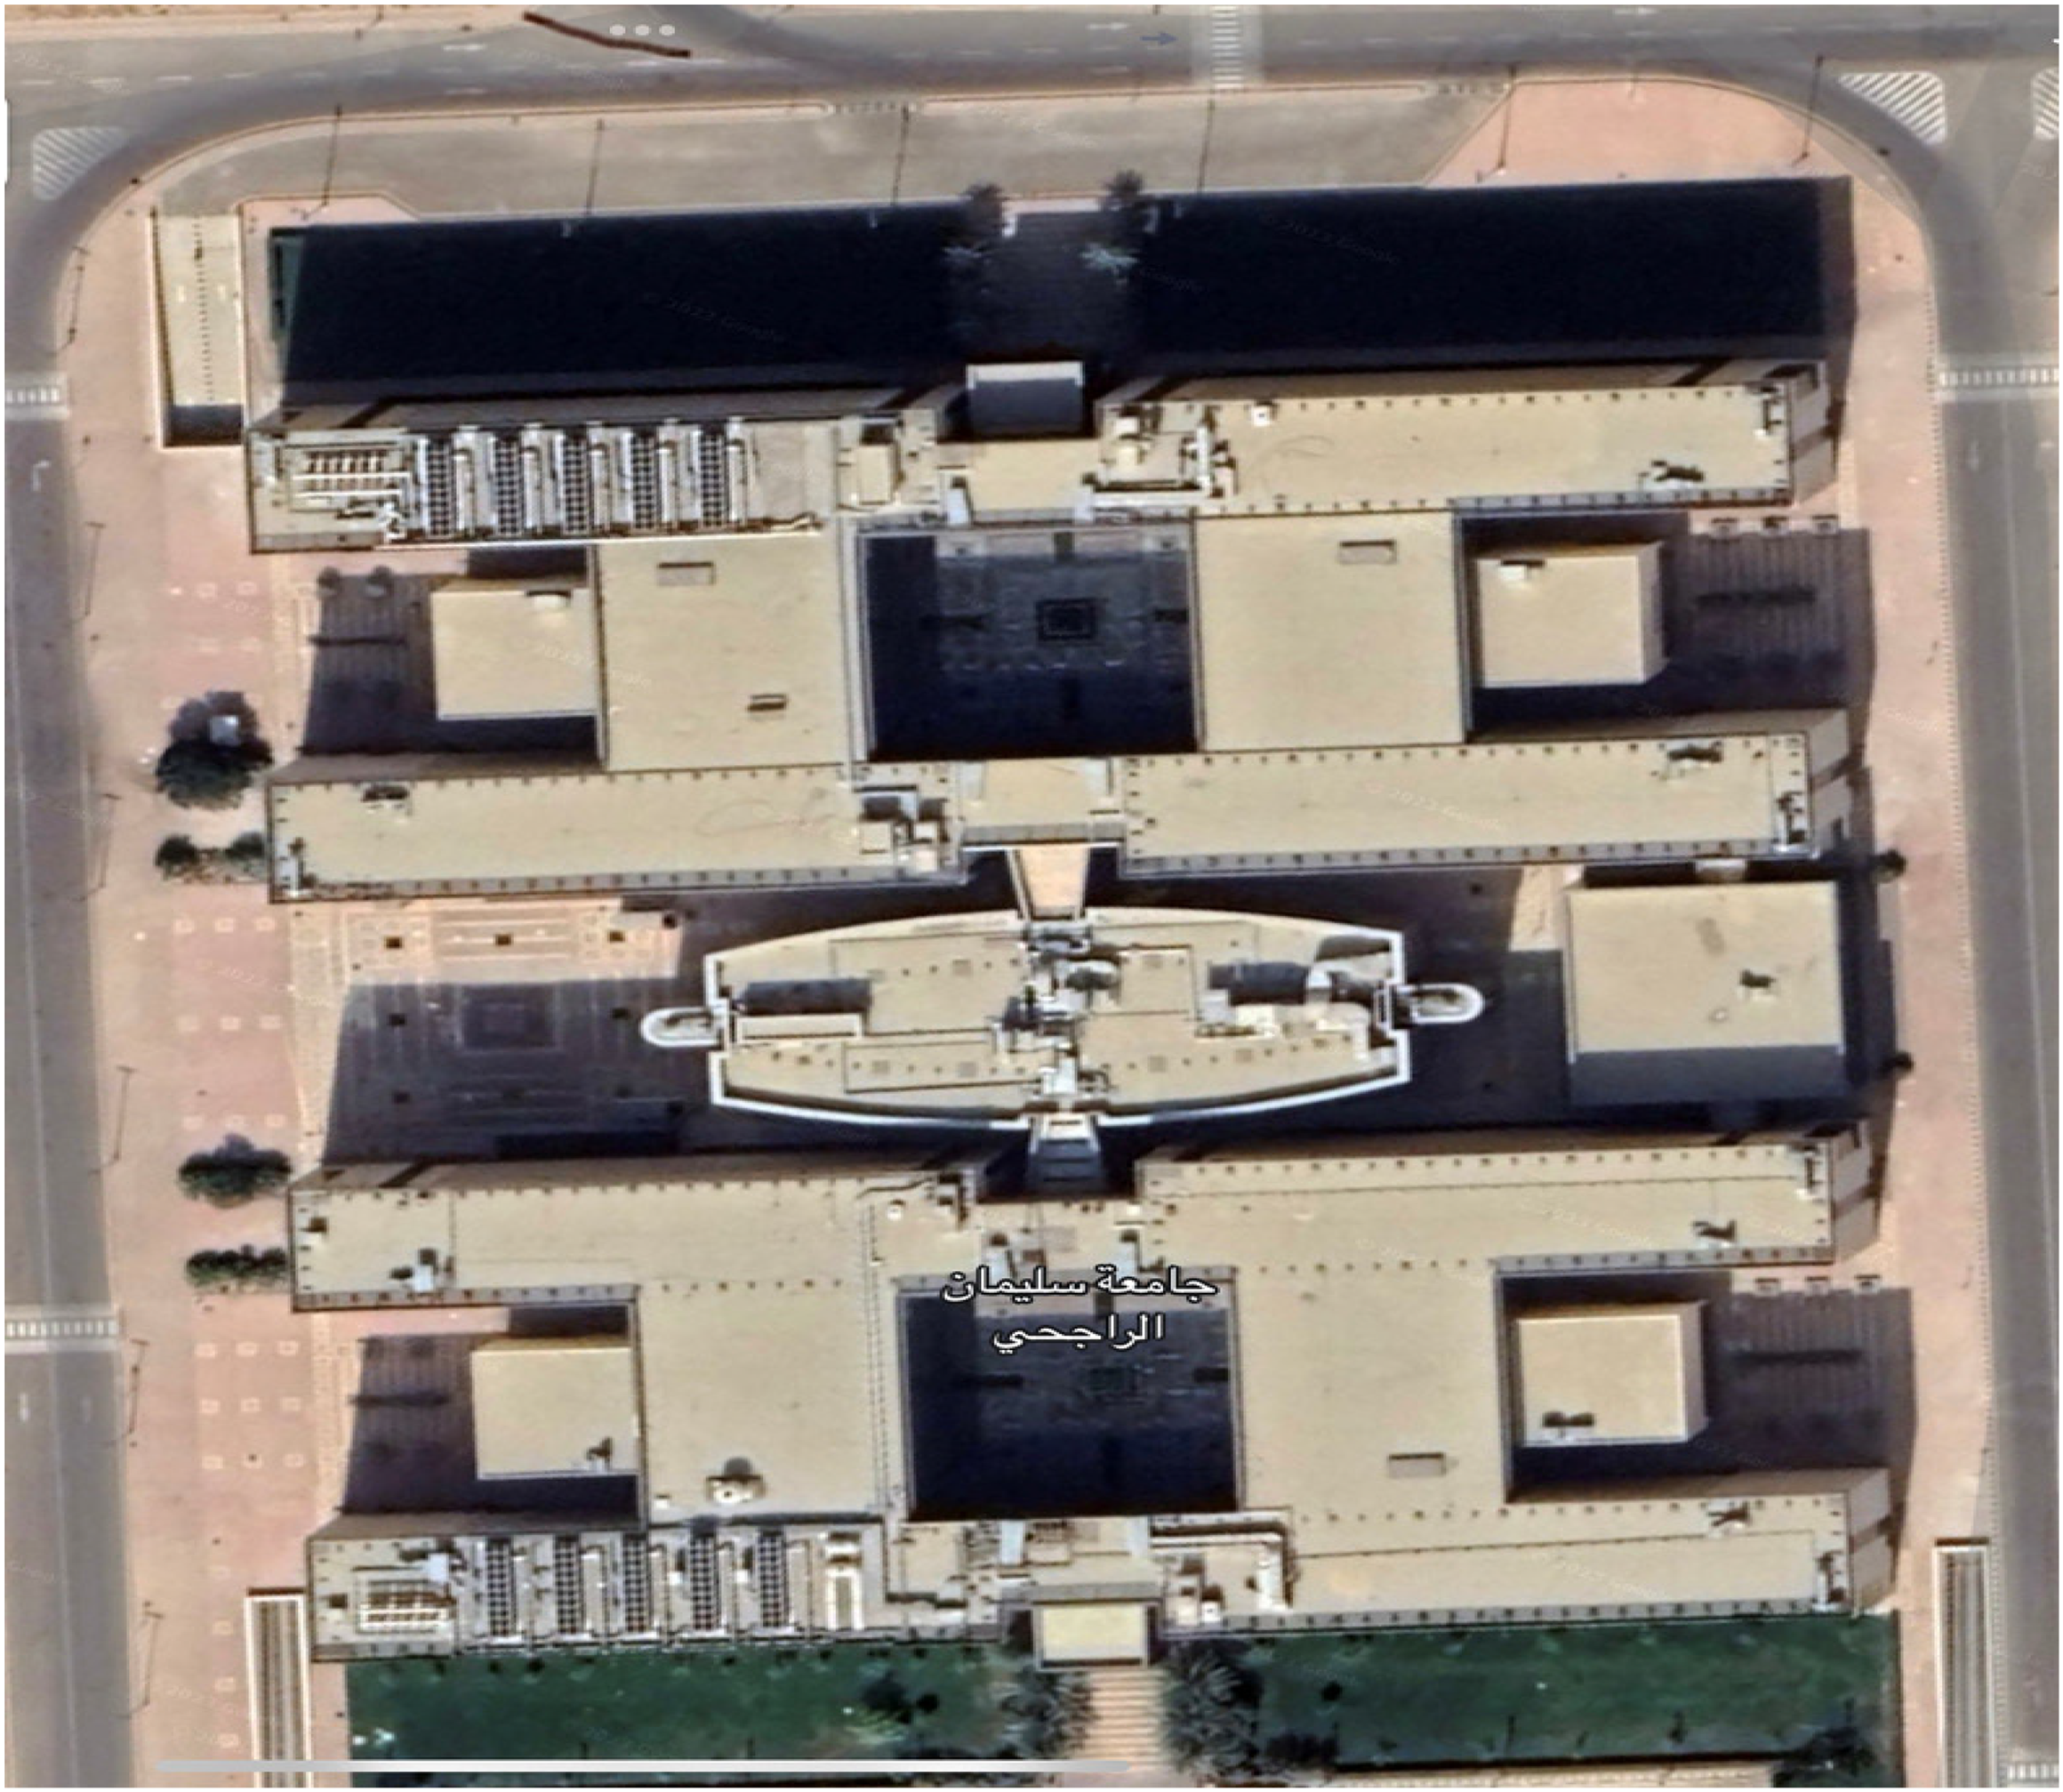
Roof area of building at SRU.
General data of the scenarios.
Balance of the system (BOS)
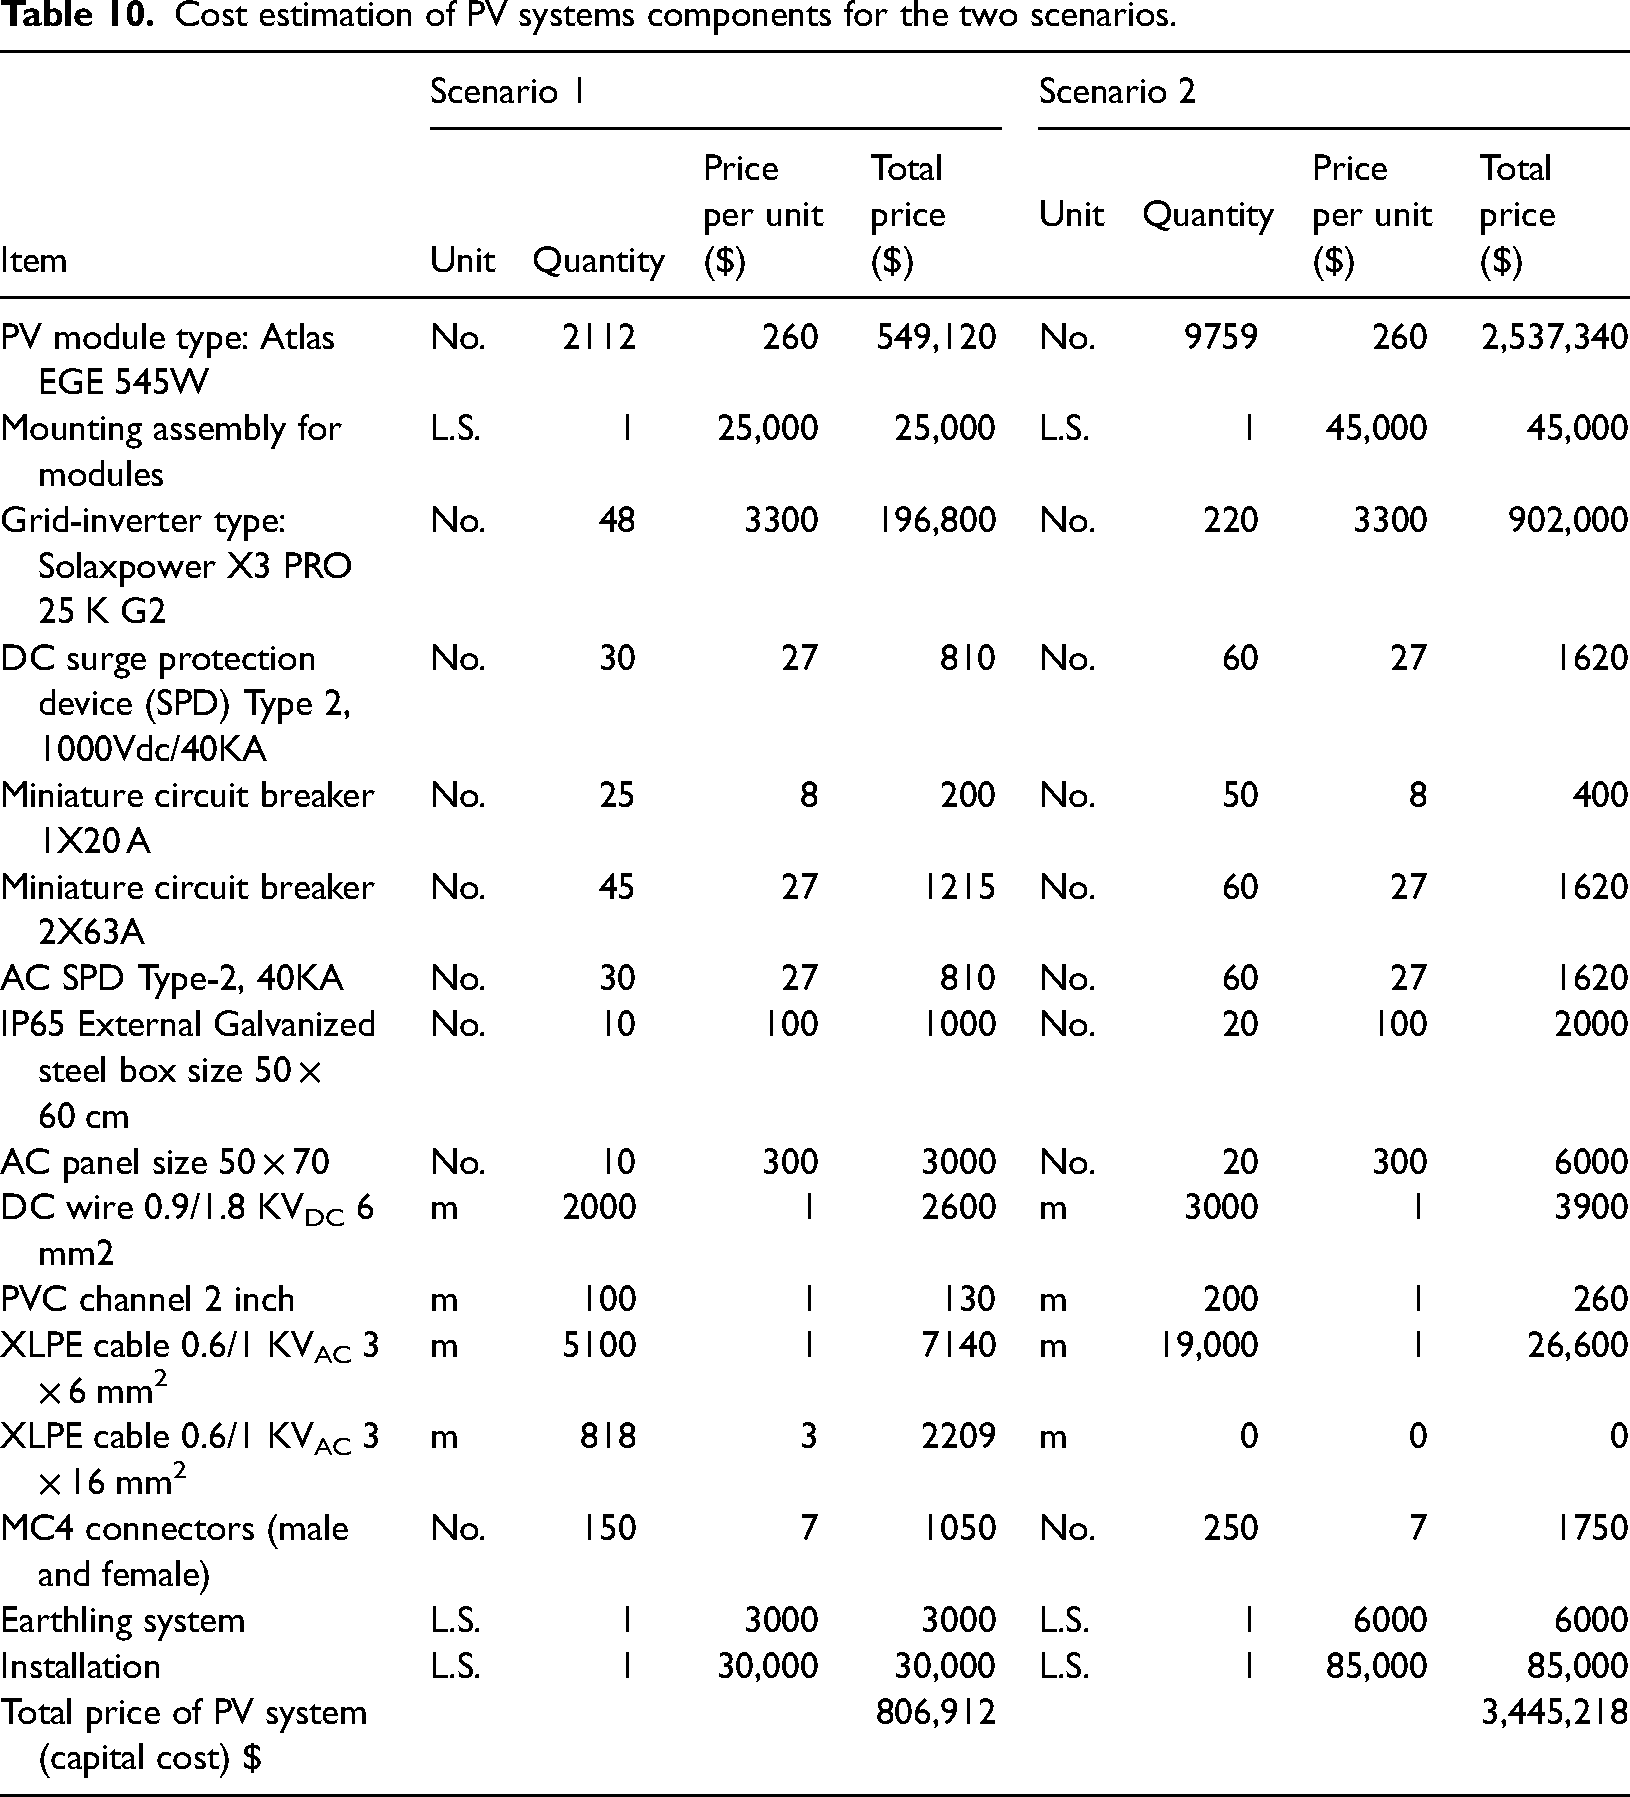
The “balance of the system” denotes all components of a PV system other than solar panels (BOS). It is necessary to install one or more solar inverters. All of the technical and engineering elements make up the BOS. Additionally, it includes expenses for engineering design, labor, shipping, installation, mounting framework, connections, and other related charges. BOS pays between 30% and 40% of the price of a PV system. Table 10 displays the cost calculations for two scenarios. For grid-connected systems, the PV array rating should match the inverter input rating to provide a secure and effective operation. Figure 4 depicts the location of PV cells for scenario 1 on the roof, and illustrates the location of PV cells for scenario 2 on the roof as well as the nearby land on the university campus.
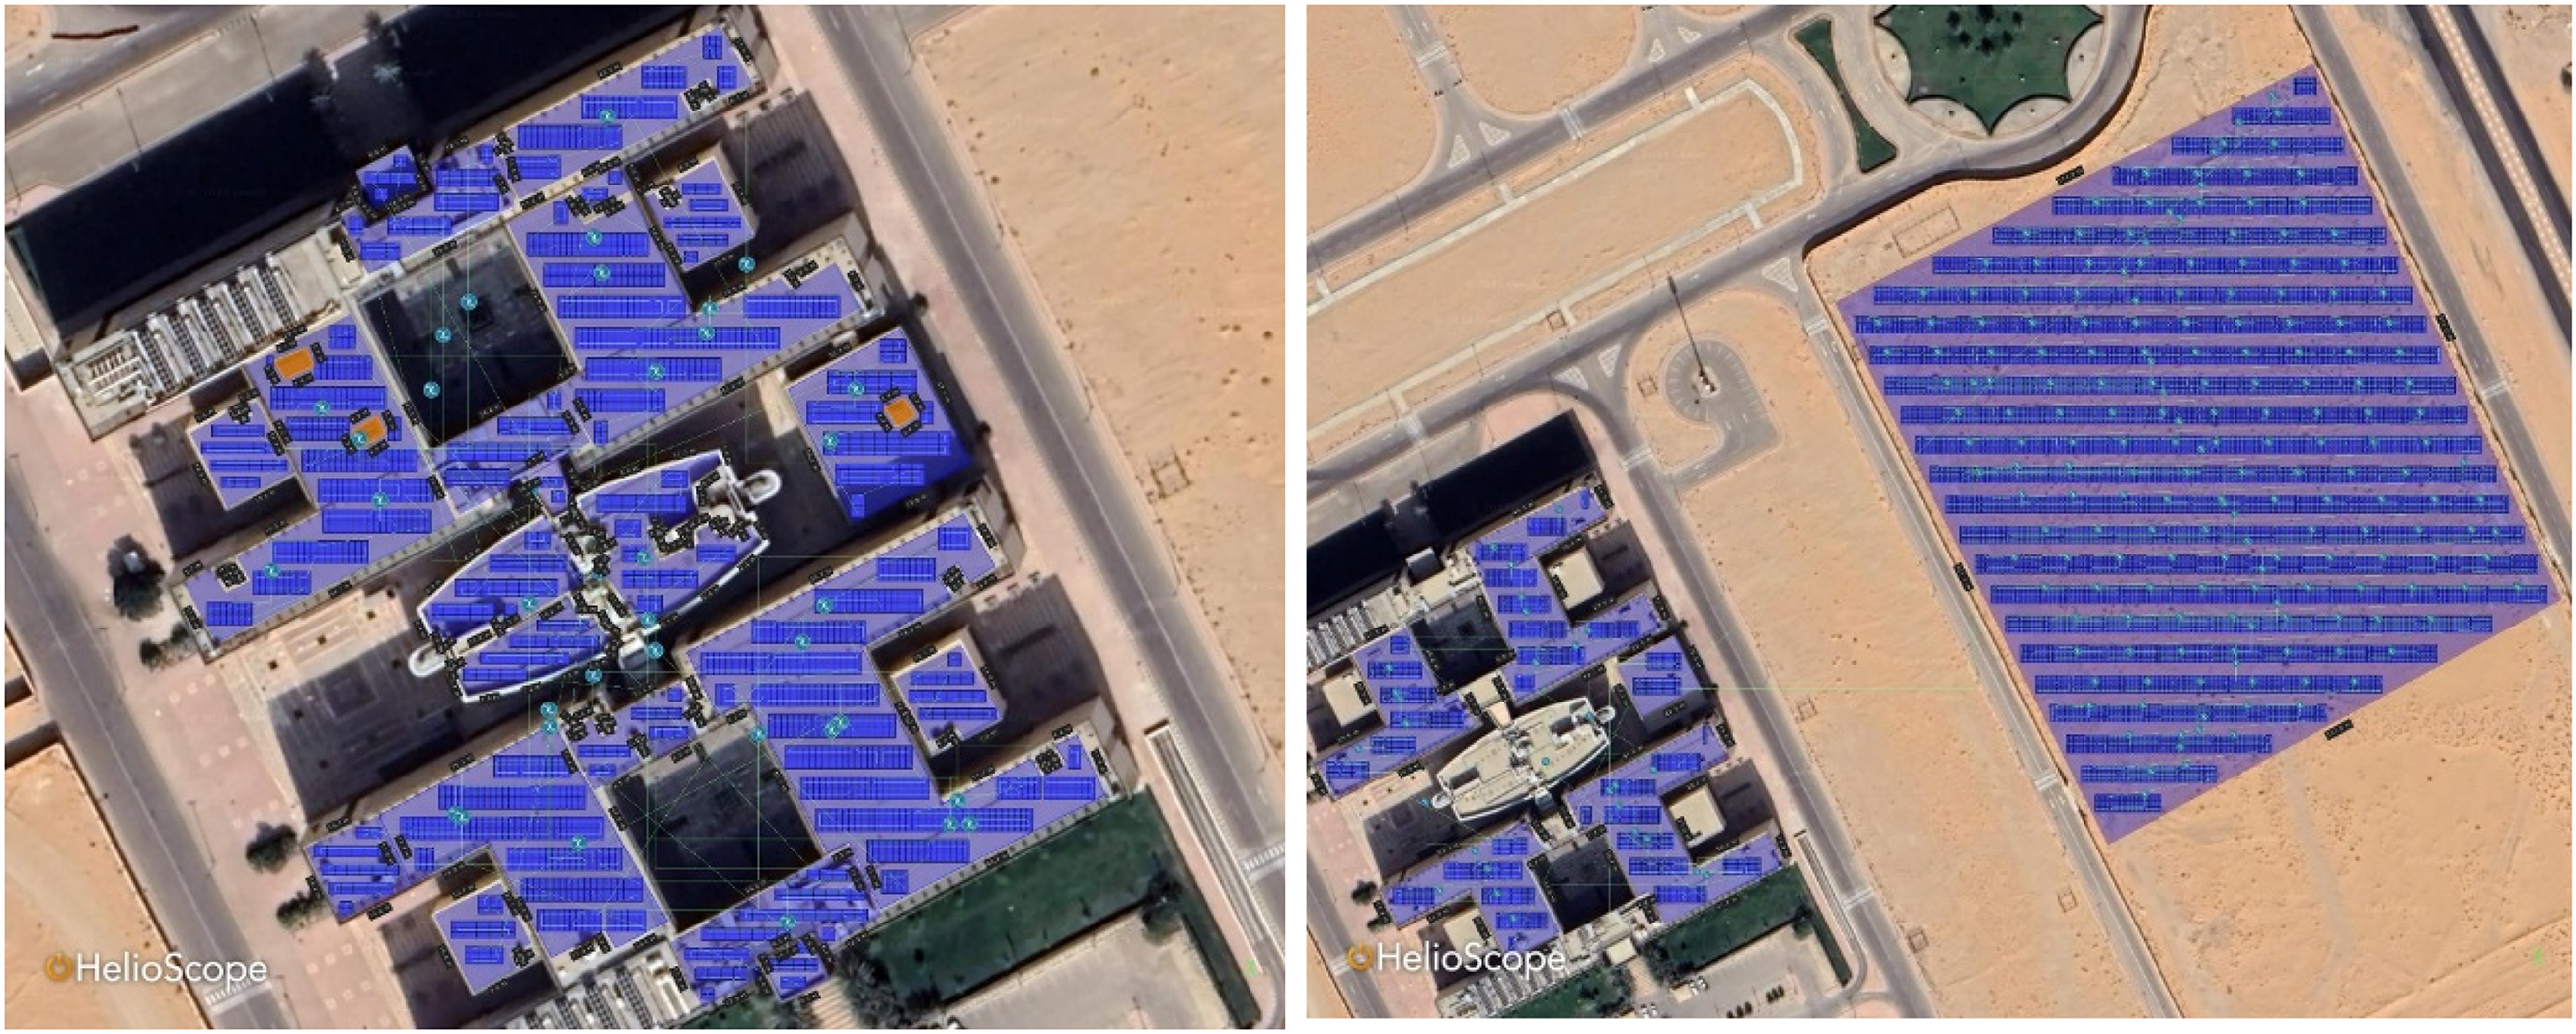
PV solar field of scenarios 1 and 2.
Cost estimation of PV systems components for the two scenarios.
The monthly consumption and the energy conservation opportunities on the university campus were listed in detail in Alfaoyzan and Almasri (2023). The monthly energy produced by the PV systems was determined using Helioscope software. Monthly load, energy production, purchased energy, and exported energy for scenarios 1 and 2 are shown in Figure 5. The study was conducted according to the required load and the monthly production of electricity. There is a fear here about achieving these conditions because solar energy is available during the day while the load is around the clock, bearing in mind that the load during the day is greater than the night, especially after the proposed ECMs (Alfaoyzan and Almasri, 2023). It is noted from the figure that the required electrical load is achieved in most months of the year, except for some summer months, and there is a surplus in the winter months in the second scenario. The result of the comparison between the load and the produced power shows the following:
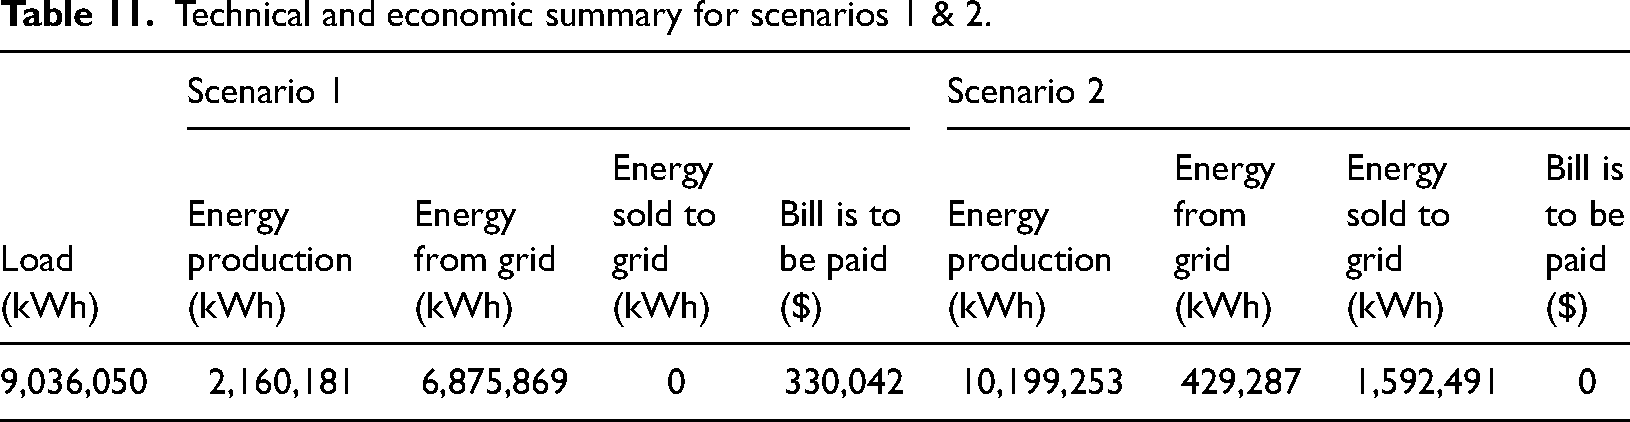
In scenario 1, there is no energy export to the grid, while in scenario 2, there is an export to the grid in 7 months; Total annual energy production from PV systems is 2,160,181 and 10,199,253 kWh for scenarios 1 and 2, respectively; Total annual energy obtained from the grid is 6,875,869 and 429,287 kWh for scenarios 1 and 2, respectively; Production in the first scenario covers approximately 24% of the load, while production in the second scenario is approximately 113% of the load.
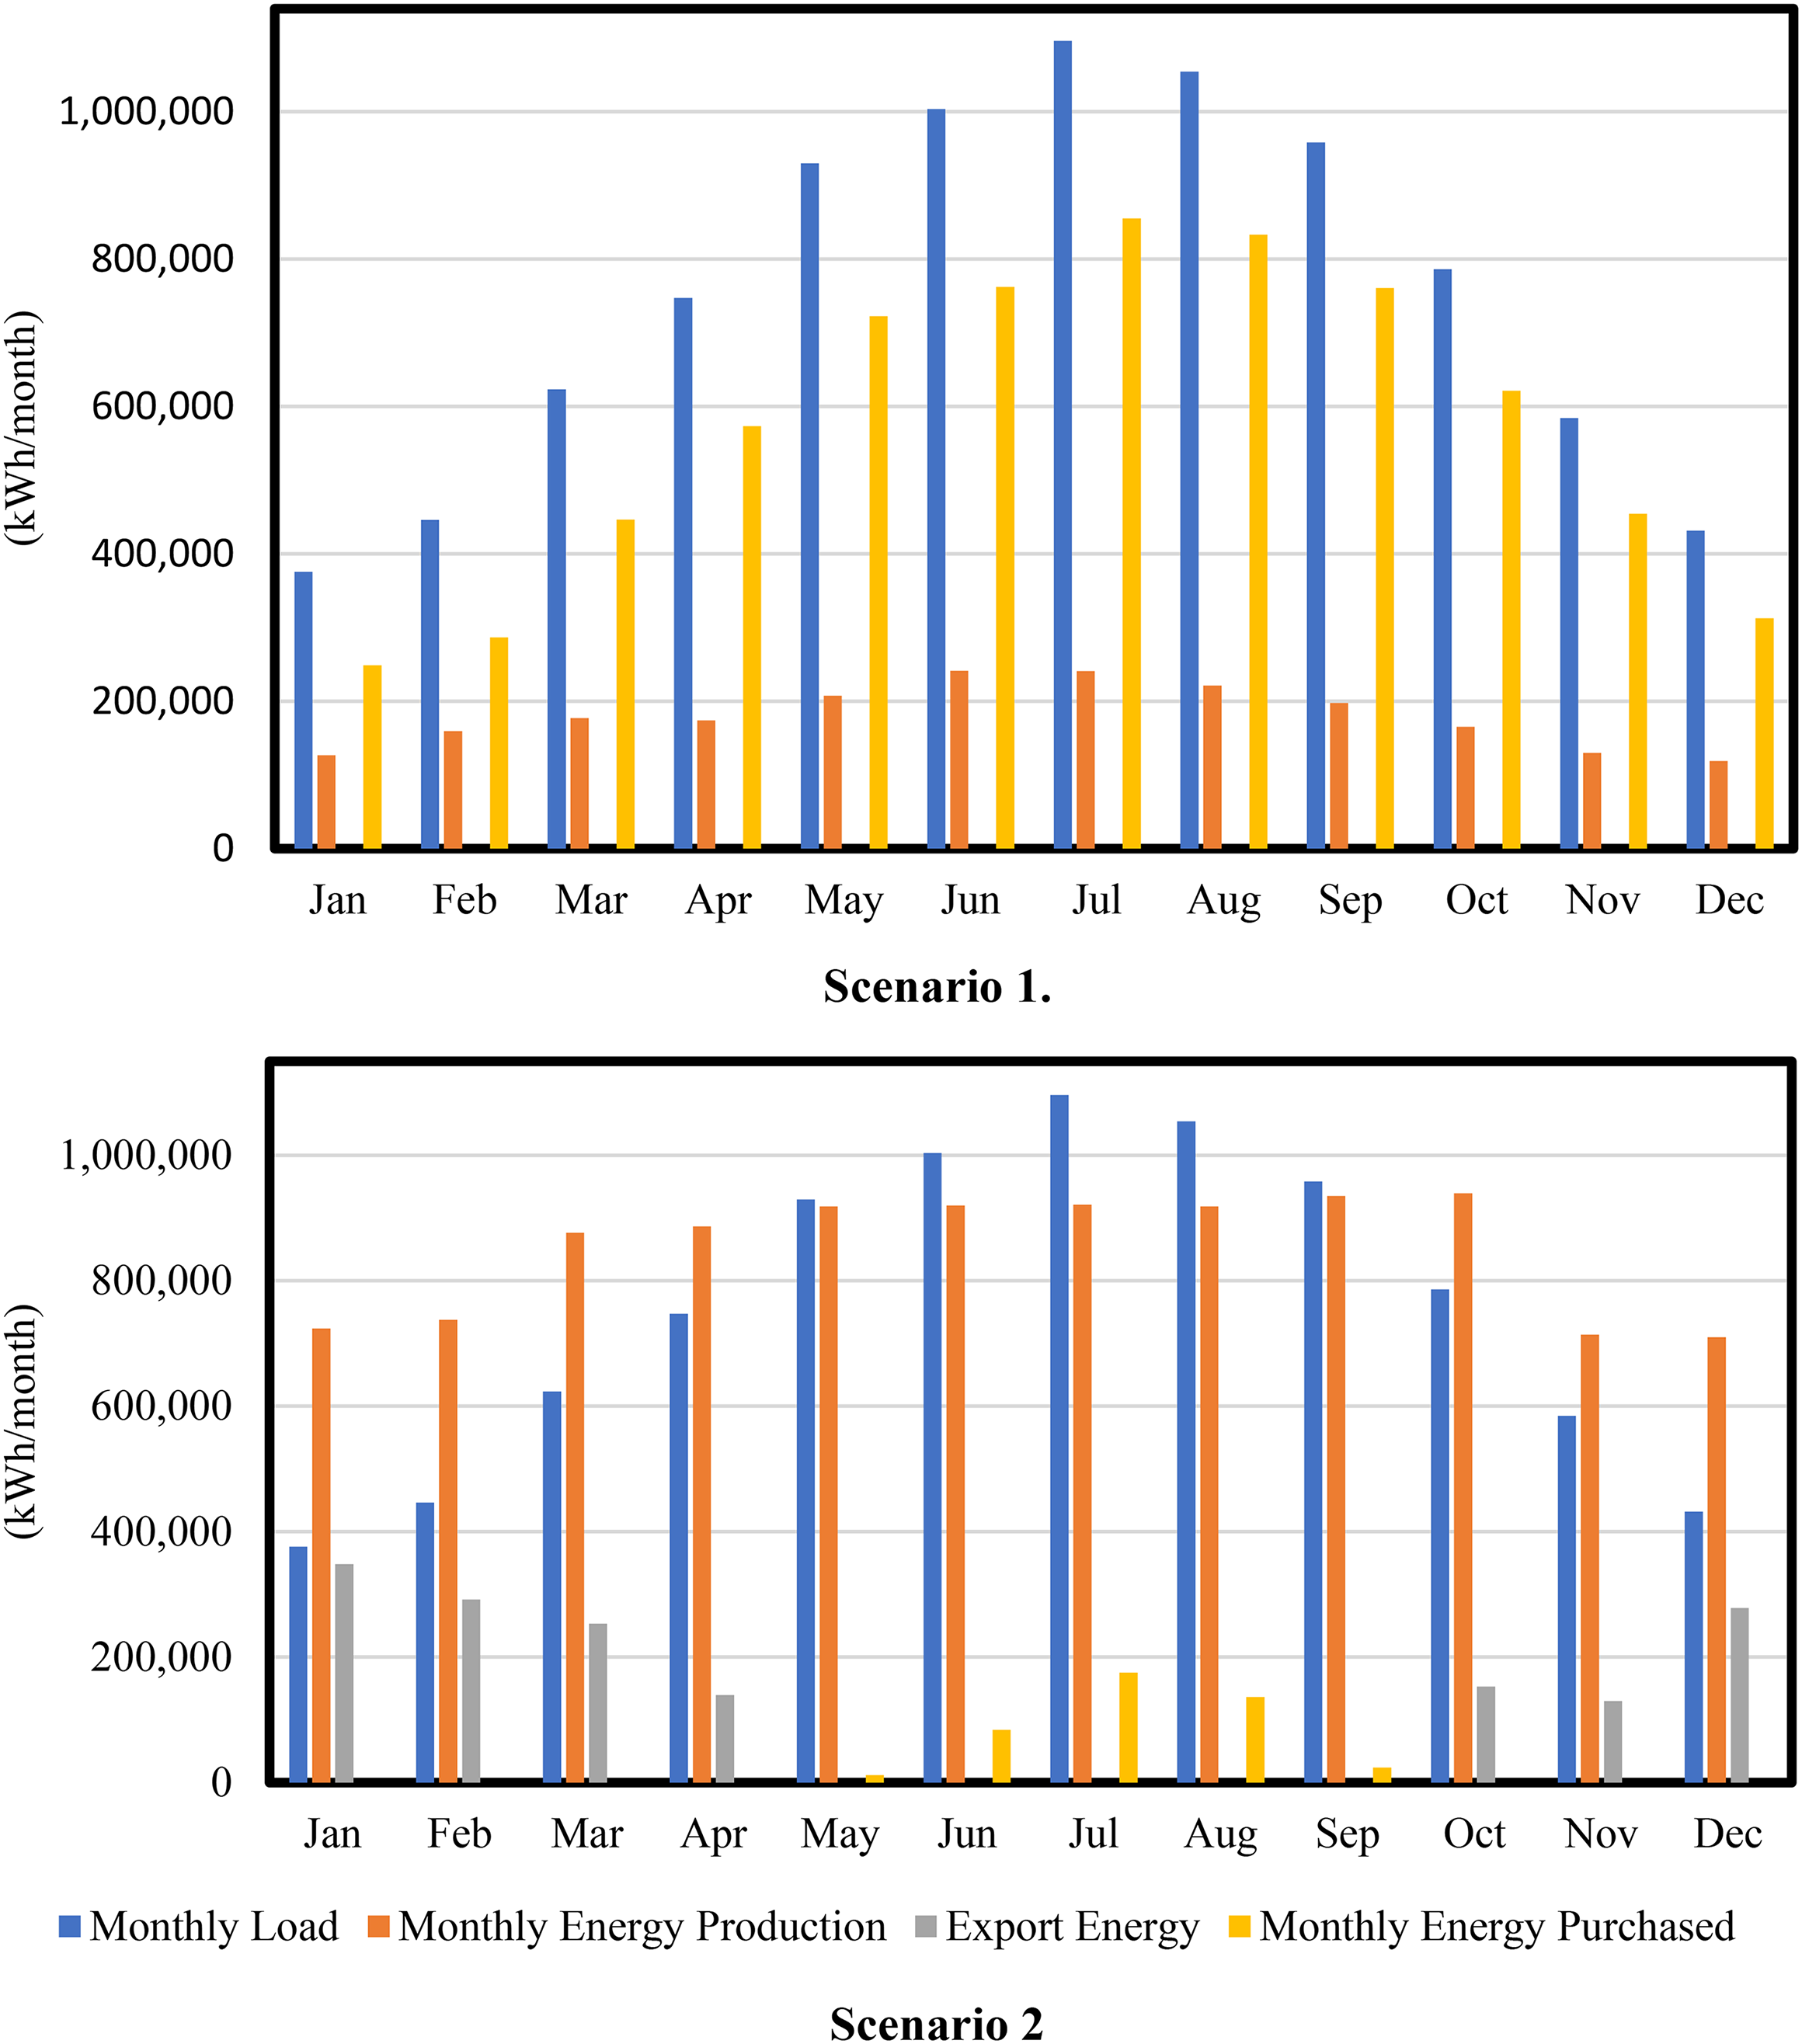
Monthly load, production, purchased, and exported energy for scenarios 1 & 2.
Economic analysis
This section discusses the results from an economic point of view. The energy required to meet the load is calculated based on the campus's load and the energy produced by PV systems. Therefore, depending on the two equations (5) and (6), the cost is determined. Figure 6 shows the monthly cost in both scenarios. The total annual cost to be paid in the first and second scenarios is 330,042 dollars and zero dollars, respectively (Table 11). Alfaoyzan and Almasri (2023) calculated the SPBT using the cost of electricity from the university's generators (0.39 SR per kWh) and the price of energy from the grid (0.18 SR per kWh), which were 4.13 years and 8.96 years, respectively. In other words, electricity generated on campus was 50% more expensive than electricity from the public grid.
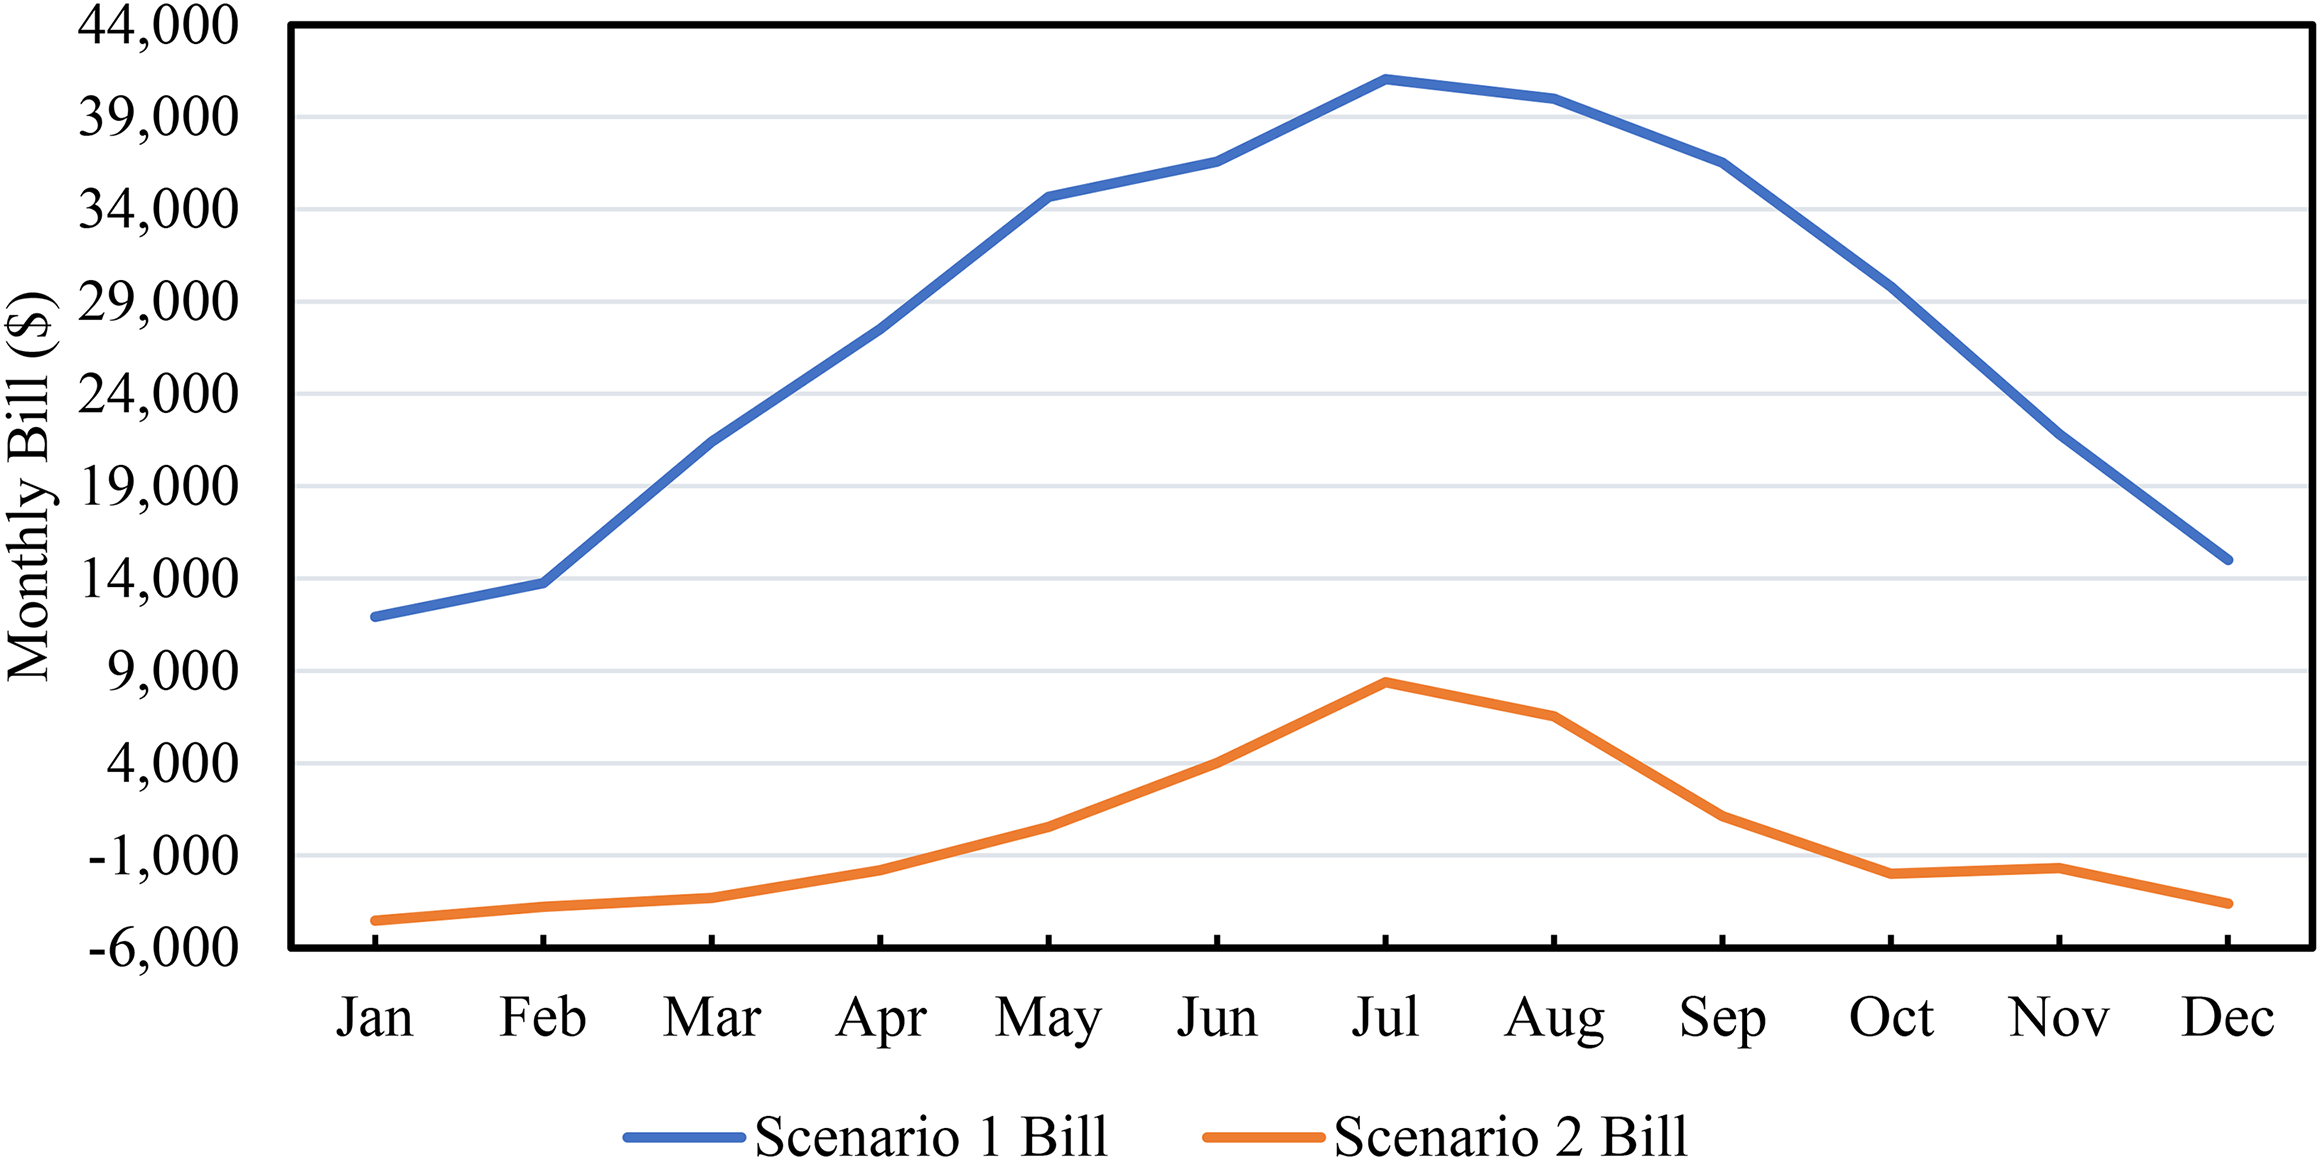
Monthly bill for scenarios 1 & 2.
Technical and economic summary for scenarios 1 & 2.
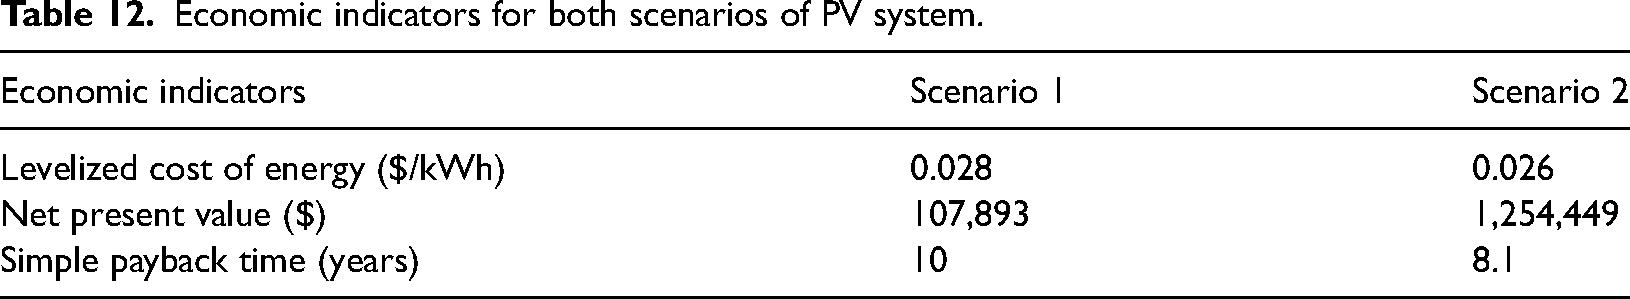
Based on the energy consumption on the university campus, the production from the PV systems, and the economic indicators in the KSA, the economic indicators of the PV systems were determined using equations (7)–(10), as shown in Table 12. It is noted from the table that the LCOE is similar in the two scenarios. On the other hand, the simple payback period decreased by about 20% in the second scenario compared to the first, which is 10 years for scenario 1 and 8.1 years for scenario 2 under the current conditions. As for the change in NPV, it is natural because it is directly related to the size of the system. The effect of the energy export price on the payback period and IRR was also studied, as shown in Figure 7. The chart shows that the payback period is around 10 years at $0.04.
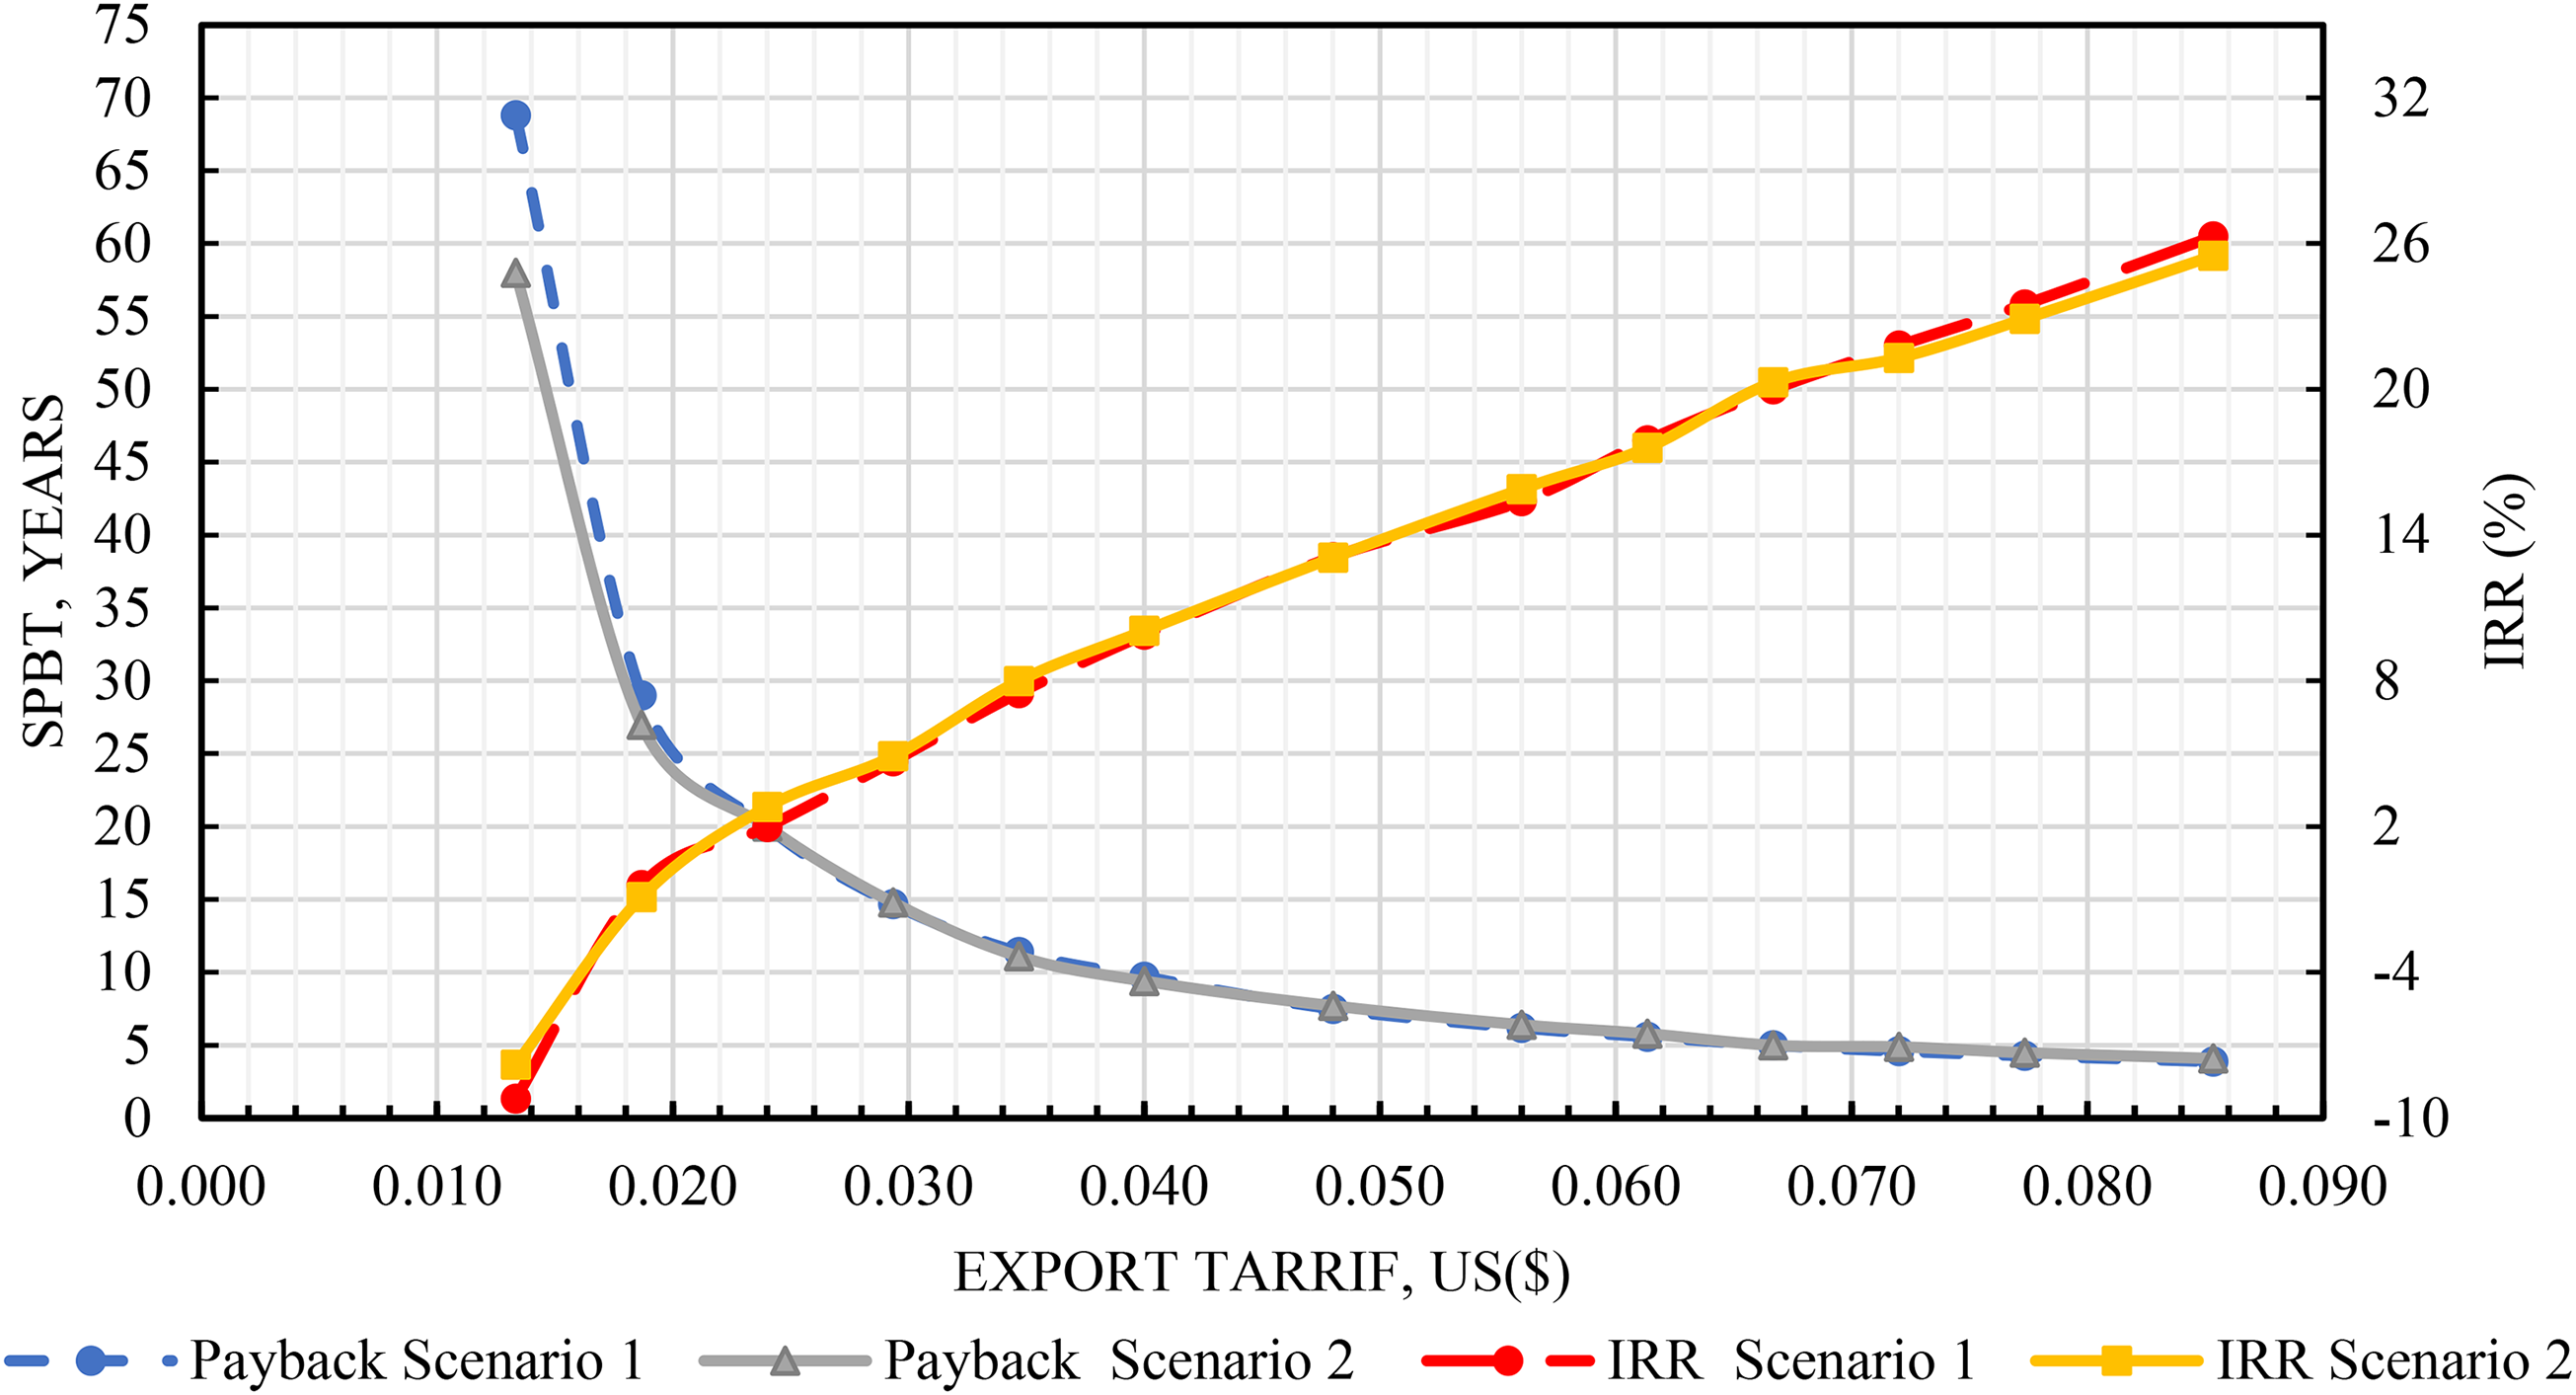
Impact of tariffs on the PV system's payback and internal rate of return for scenarios 1 & 2.
Economic indicators for both scenarios of PV system.
Environmental Benefits
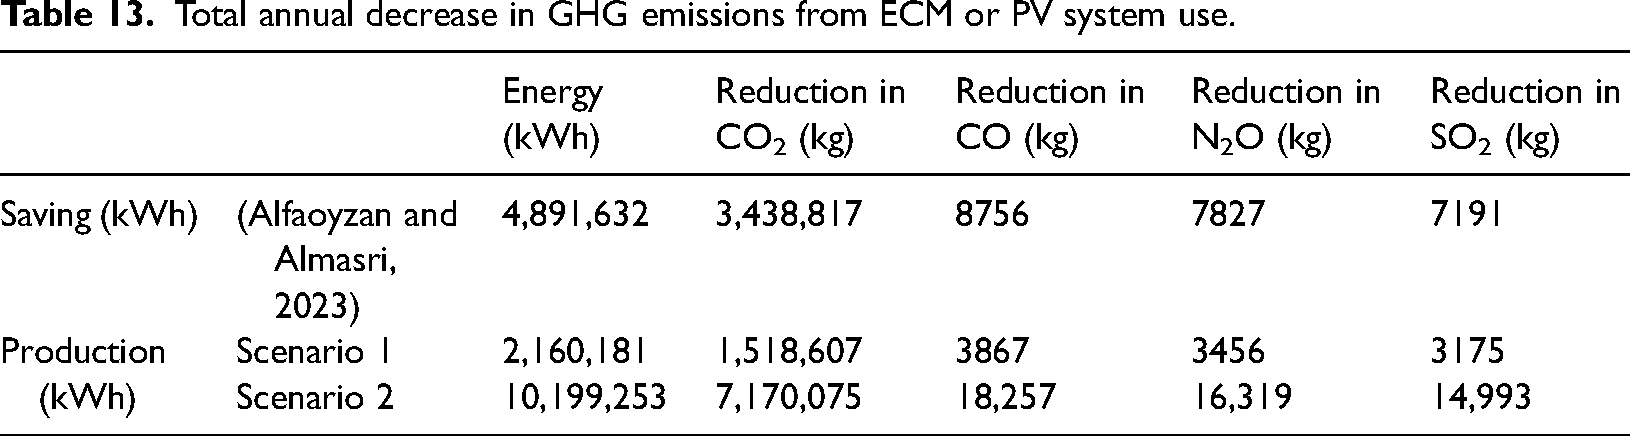
The findings are discussed in this section in terms of the environment. While other pollutants are based on data provided by Tazay (2021), CO2 emission indicators based on (CLIMATE TRANSPARENCY REPORT, 2020) are taken into consideration in the calculation. The annual decrease in GHG emissions produced by ECMs or employing PV systems is shown in Table 13 using equation (11).
Total annual decrease in GHG emissions from ECM or PV system use.
Conclusions and recommendations
Any level of energy conservation or energy production using RE helps to preserve the ecosystem. Energy demand reduction and improved EE are seen as crucial steps in the fight against climate change. The study aims to gauge and assess PV system usage at SRU. Therefore, the goal of the study is to ascertain the annual energy required to accomplish an nZBC. Additionally, the campus uses electricity for all of its operations. The study's findings led to the following conclusions:
The overall amount of electricity consumed in 2021 was 13,859 MWh, with February seeing the lowest usage at around 684 MWh and July seeing the greatest at about 1681 MWh. This load corresponds to the general load trend of the national grid. The yield factor for scenarios 1 and 2 is 1896 and 1922 kWh/kWp, respectively; while the capacity factor is 21.6% for scenario 1 and 21.9% for scenario 2. The total annual energy purchased from the grid is 6,875,869 and 429,287 kWh for scenarios 1 and 2, respectively. It is noted from the second scenario that economic and environmental benefits are much greater than in the first scenario. Production in the first scenario covers approximately 24% of the load, while production in the second scenario is approximately 113% of the load. This result is different from what is common in other studies due to the limited government support for solar energy projects. The LCOE is between 0.026 and 0.028 $/kWh for both scenarios. This means that the cost per unit of electricity produced from PV systems is almost twice the price of energy that is granted by the government system (Electricity and Co-generation Regulatory Authority). The simple payback period decreased by about 20% in the second scenario compared to the first one, which is 10 years for scenario 1 and 8.1 years for scenario 2. For scenario 2 (nZBC), the proposed PV system at SRU reduced annual emissions of CO2, CO, N2O, and SO2 by 7,170,075, 18,257, 16,319, and 14,993 kg, respectively. This result is important for the KSA from an environmental point of view, as the KSA has signed some international agreements to protect the environment. Government should encourage educational establishments to use solar energy, both financially and technically. Building pioneering projects in the field of utilizing PV and thermal solar energy. Focus on solar energy applications in AC.
Additionally, the following is recommended:
The study was conducted according to the required load and the monthly production of electricity. There is a fear here about achieving these conditions because solar energy is available during the day while the load is around the clock, bearing in mind that the load during the day is greater than the night, especially after the proposed ECMs. Technically, economically, and climatically speaking, this study was carried out in the KSA under unique circumstances. The same projects under the same circumstances can use these findings. Due to the lack of incentives to use solar energy, it should be noted that the economic conditions are frequently different from those that are currently in place in the KSA. In the end, it turns out that the topic of benefiting from PV technologies need more studies in various applications due to the different economic conditions and the load curve.
Footnotes
Abbreviations
Acknowledgements
The researchers would like to thank the Deanship of Scientific Research, Qassim University for funding the publication of this project.
Declaration of conflicting interests
The author(s) declared no potential conflicts of interest with respect to the research, authorship, and/or publication of this article.
Funding
The author(s) received no financial support for the research, authorship, and/or publication of this article.