
Abstract
Energy consumption is one of the most important variables that have an impact on the environment. One of the nations in the world with the highest per capita electrical energy usage is the Kingdom of Saudi Arabia. Many attempts are being made in Kingdom of Saudi Arabia to lower energy consumption and electricity consumption to achieve sustainability. In this work, the data on the energy consumption of two mosques in Hail City were analyzed, and the opportunities for energy conservation and the use of solar energy were studied to make mosques sustainable. Annual energy use intensity was determined to be 100 and 121 kWh/m2 for the Al-Khashil and Al-Jamil mosques, respectively. While Al-Khashil's mosque envelope is insulated, energy efficiency measures implemented to the walls, roof, and windows of Al-Jamil's mosque resulted in reductions in energy consumption of 27%, 13%, and 6%, respectively. The most effective energy efficiency option is a heating, ventilation, and air conditioning system with a high energy efficiency ratio, which can reduce cooling demand by more than 30%. If the condition of Saudi Building Code 601 is met, then it has the potential to cut energy usage by 35.4% and 63.3% for Al-Khashil and Al-Jamil, respectively. Due to coronavirus disease 2019, Al-Khashil's electricity usage was reduced by 58,737 kWh, or 39.9%, in 2020 compared to 2019. When using data from RETScreen and ATLAS, there were inconsistencies of up to 28%, but for DesignBuilder, the findings were the closest to the billing data. The mosques Al-Khashil and Al-Jamil have a combined yearly photovoltaic energy output from the suggested systems of around 135.93 MWh and 33.98 MWh, respectively. For the mosques, Al-Khashil and Al-Jamil, the yearly yield factor and capacity factor were both 1887.9 kWh/kWp/year and 21.9%, respectively. The annual greenhouse gas emission reductions from photovoltaic systems for Al-Khashil and Al-Jamil were 102.9 tCO2 and 25.72 tCO2, respectively. Concerning economics, the following results were obtained: The levelized cost of energy of photovoltaic systems is 0.0901 SR/kWh (0.024 $/kWh); the net present value and internal rate of return for photovoltaic systems are not suitable as a result of the current prices and the system applied in the Kingdom of Saudi Arabia. If the electricity produced from photovoltaic systems is injected into the grid at a rate of 0.32 SR/kWh, which is comparable to the SEC tariff for the mosque or government sector, then the simple payback time is 5.14 years.
Introduction
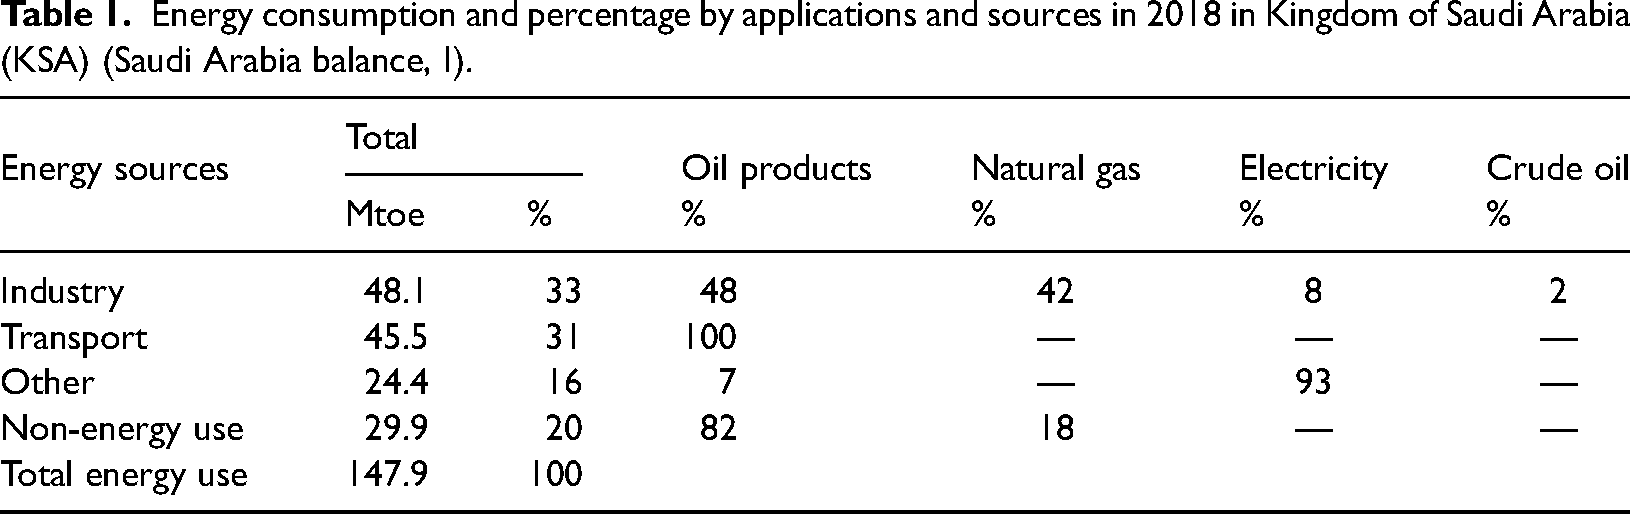
Electricity is solely produced in the Kingdom of Saudi Arabia (KSA) using conventional fuel. The Saudi government introduced a new initiative in 2016 dubbed the 2030 Vision to reduce the amount of fossil fuels used to generate electricity. Investments in renewable energy (RE) are a part of this plan (Vision 2030 of Kingdom of Saudi Arabia). Table 1 lists the sources and uses of energy in the KSA in 2018. Overall consumption in the KSA was 147.9 Mtoe from various sources, with oil products representing 66% of that total. These fuels were utilized for transportation, business, non-energy uses, and other things. The table shows that electrical energy (93%) accounts for the majority of other applications of energy because it is used in households, businesses, services, and agriculture. Mosques are undoubtedly one of these clients. In KSA, buildings have significantly increased energy needs, mostly because of the high demand for air conditioning (AC) during the summer when it is quite hot outdoors. In 2018, KSA produced 289,929 GWh of electricity. 150,600 GWh came from oil derivatives, the rest from natural gas, and only 0.2 GWh from RE.
Energy consumption and percentage by applications and sources in 2018 in Kingdom of Saudi Arabia (KSA) (Saudi Arabia balance, I).
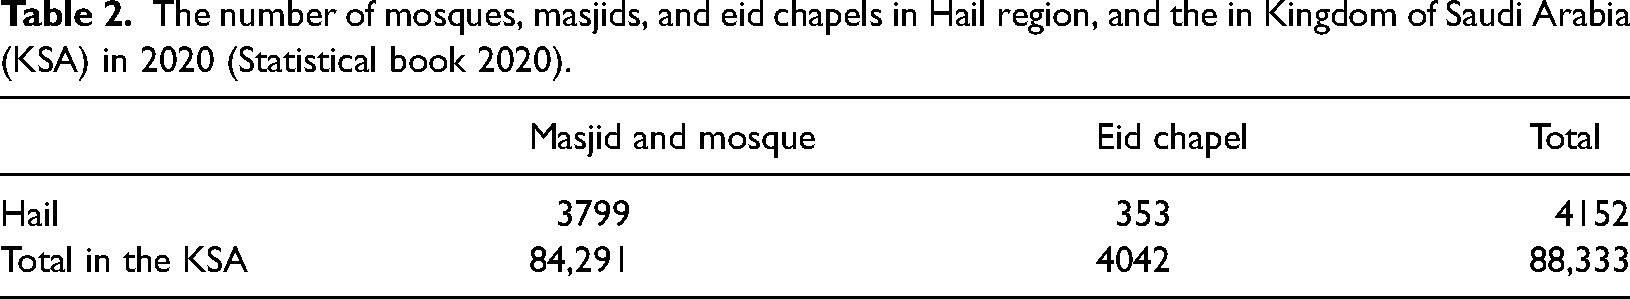
Mosques are gathering places where Muslims typically perform their daily prayers. Numerous verses in the Holy Qur’an specify that God, the Merciful, has commanded us all to preserve nature. Consequently, it is a priority that the construction and use of mosques be such that they use energy more efficiently and are environmentally friendly. Table 2 lists the number of mosques, masjids, and Eid chapels in Hail region and in the KSA in 2020. Hail region (Hail city) is located in climate zone 2. There are 84,291 mosques and masjids in the KSA, which highlights the need to study energy consumption efficiency and the sustainable use of solar energy.
The number of mosques, masjids, and eid chapels in Hail region, and the in Kingdom of Saudi Arabia (KSA) in 2020 (Statistical book 2020).
The Saudi Minister of Islamic Affairs and Guidance stated in May 2020 that the ministry has a large electricity bill that consumes about a quarter of its budget, and he stated that it will do everything possible to reduce energy consumption. Recently, laws promoting environmentally friendly mosque architecture has been created in several nations, such as the Sultanate of Oman “Amana” launches its first investment project in renewable energy and transforming mosques into green buildings (Solarabic, 2020). A five-year program launched by Jordan intends to install solar energy systems in 6000 mosques. According to the Jordan RE and Energy Efficiency Fund (JREEEF), a project to install solar cell systems for each of Aqaba's 35 mosques, costing 422,957$, has been completed, which contributes to reducing greenhouse gas (GHG) emissions by about 1647 tons of carbon dioxide equivalent annually (Solarabic, 2021). Morocco has also developed a comprehensive plan to transform 600 mosques into “greener” structures by employing solar energy to produce power, hot water, and make use of daylight. This should lead to a 40% reduction in energy use in these mosques Morocco to give 600 mosques a green makeover (The Guardian, 2016). Furthermore, Indonesia has made efforts to ensure that 1000 eco-mosques are built in the coming years Indonesia unveils plan to roll out 1,000 eco-mosques by 2020 (Reuter, 2020). In Cambridge, UK, a sustainable central mosque was inaugurated in 2019. More than 1000 worshipers will enjoy thermal comfort, natural ventilation, and daylighting thanks to this creative design Case study (Cambridge Central Mosque, 2019).
To meet the worshipers’ needs for thermal comfort, most mosques have AC systems (Al-Homoud et al., 2005). claim that up to 80% of the energy is often consumed by these systems. Most prayers are not held at suitable temperatures, despite the unusually large amounts of energy used by most mosques (Al-Homoud et al., 2009). Buildings’ poor performance uses a lot of electricity, which necessitates larger AC systems than necessary and longer running times, wasting electricity (Budaiwi et al., 2013).
Energy efficiency (EE) has been the easiest and most cost-effective issue for reducing energy use. The efficiency of energy in mosques mainly depends on end-users’ occupant behavior, energy management obligation, and operational parameters as a human-shared part, in addition to the building's architectural design as a building-nature part (Yüksel et al., 2020). In KSA, the total electric energy consumption of buildings, including mosques, was 80%, with a significant contribution to GHG and CO2 emissions (Al-Homoud et al., 2009). Reducing energy has been considered a solution to GHG emissions. Various energy solutions have been investigated, including using RE, reducing energy consumed by the mosque's AC systems, and combining two or more solutions (Alabdullatief and Omer, 2017; Al-Tamimi et al., 2020; Mushtaha and Helmy, 2017). PV systems’ cost has decreased considerably in conjunction with worldwide concerns to reduce CO2 emissions from fossil fuels (Chawla, 2018; Isik et al., 2018; Pegels and Lütkenhorst, 2014).
Literature review
To investigate and evaluate the potential for energy savings, energy consumption patterns, and the use of RE in mosques in Hail, Saudi Arabia, it was compared with previous studies in the literature (Alharbi and Mohamad Zin, 2020). studied ways to make mosques more aesthetically pleasing, energy-efficient, and sustainable. They noted a glaring dearth of studies on the utilization of energy in mosques. They emphasized that to reduce energy consumption by utilizing new EE criteria, the government must establish new regulations.
Numerous studies about mosques have looked at energy conservation. Al-Tamimi and Qahtan (2018) investigated the thermal behavior and energy use of small mosques in the hot, arid city of Najran, KSA. Due to the traditional building envelope design and inefficient use of energy-consuming devices, they discovered significant energy loss and a lack of thermal comfort. They advise using passive design techniques and a productive schedule for energy savings. Additionally, they showed that the maximum occupancy ratio of the mosque does not exceed 25% of its actual capacity and that the average yearly energy use intensity (EUI) was 150 kWh/m2, which changes the required size for tiny mosques. In the eastern region of Saudi Arabia's hot and humid environment, Budaiwi (2011) examined how envelope design and air leakage rate affected energy performance and potential energy savings. He calculated that the annual cooling need would be 131 kWh/m2, or about 88% of the total electrical energy used if the walls and roof were not insulated. Good wall and roof insulation can cut cooling demand by 25% when compared to an uninsulated environment. He advised using walls with a U-value of up to 0.7 W/m2 K and a roof with a U-value of 0.5 W/m2 K (Al-Homoud, 2009). evaluated the thermal design of several mosque envelope parameters for the best thermal performance to reduce energy use in hot, dry sites in Riyadh and hot, humid sites in Jeddah, KSA. He claimed that significant energy savings of 21% for Riyadh and 18.8% for Jeddah were achieved. Additionally, he suggested that peak cooling requirements in Jeddah and Riyadh might be decreased by 12 and 15.4%, respectively. In Istanbul, Turkey (Atmaca and Gedik, 2019), investigated the thermal comfort of mosques with different heating, ventilation, and air conditioning (HVAC) systems in humid, temperate climatic conditions. According to their findings, the mosque with a mechanical HVAC system had greater thermal comfort levels and used 16% less energy than the other mosque. Additionally, they demonstrated that the annual EUI was 93.4 kWh/m2, split almost equally between lighting and AC. According to Azmi and Kandar (2019), the four main factors of a passive design approach are “spatial layout and volume, fixed orientation of the prayer hall, occupancy pattern, user activity level, and clothing type.” Research has confirmed a sufficient benchmark for an energy-efficient and sustainable mosque design using these design criteria as a starting point.
Elshurafa et al. (2019) have investigated the use of solar energy in mosques. On the roof of a mosque in Riyadh, Saudi Arabia, they theoretically and practically tested a 124 kW PV system. With an investment cost of 1.18 $/W, the system has the potential to save more than 50% on annual energy costs. They discovered that the PV system might bring down the cost of electricity to zero if certain energy-saving measures were put in place at the early stages of the mosque's planning and construction. They claimed that both the theoretical and practical outcomes were equivalent. In the hot and humid environment of KSA (Dehwah et al., 2020), investigated the technical and economic feasibility of PV systems. With a 15-year payback period, taking into consideration the system's 25-year lifespan, they discovered that the PV system's levelized cost of energy (LCOE) was $0.071 /kWh. A 35% government subsidy is given for the initial cost to boost the possibility that solar energy will be profitable. This reduces the LCOE of PV to 0.0447 USD/kWh and gives it a 16-year payback period. The potential of these systems is increased by taking advantage of the $30/ton CO2 revenue from CO2 savings. They confirmed that the PV systems require financial incentives to increase their economic viability.
From the above literature discussion, it is clear that there is a need to study EE and solar energy use in mosques to be sustainable, which is the crucial goal of Saudi Vision 2030 of KSA (Vision 2030 of Kingdom of Saudi Arabia). The current study's objective is to examine how much energy mosques use and identify options to reduce energy use, gain from solar energy, and run sustainable mosques while maintaining the thermal comfort of worshipers. The chosen mosques are in Hail, KSA. The outcomes were then examined from an economic and environmental perspective.
Method
To study energy consumption and identify opportunities for its rationalization in mosques in hot and dry climates, as is the case in the KSA, DesignBuilder software was used and the results were compared with the actual consumption of these mosques (electricity bills for several mosques). The main search steps are as follows:
Collect climatic data from the city of Hail from different sources. Field measurements (number of prayers prayed in each mosque, electricity consumption, and end-use distributions of energy consumption) for some mosques in Hail. Energy simulation of EE measures (EEMs) using DesignBuilder and solar energy solutions using RETScreen software Evaluate EEMs and solar energy solutions through economic and environmental indicators.
The climate data
Climatic data will be displayed from different sources: RETScreen, DesignBuilder, and ATLAS data. The impact of this on the accuracy of the results will be indicated. Hail has long, hot, arid summers and cold winters. Throughout the year, the daily temperature ranges from 4 to 40 °C, with temperatures seldom falling below −1 or exceeding 42 °C. The hot season is from May to October, with an average monthly temperature of about 35 °C. Hail's warmest month is August, and the coldest month is January. Figure 1 shows the average monthly temperatures, direct daily normal irradiance, wind speed, and relative humidity in Hail City. Based on the monthly average wind speed, the wind speed variation was slight and up to 5% only, while the relative humidity is higher in January and December and lowest in July. The maximum value of direct daily normal irradiance was acquired in June, while the lowest value was obtained in January. Some differences have been noticed; however, overall curve trends are typical for all sources.
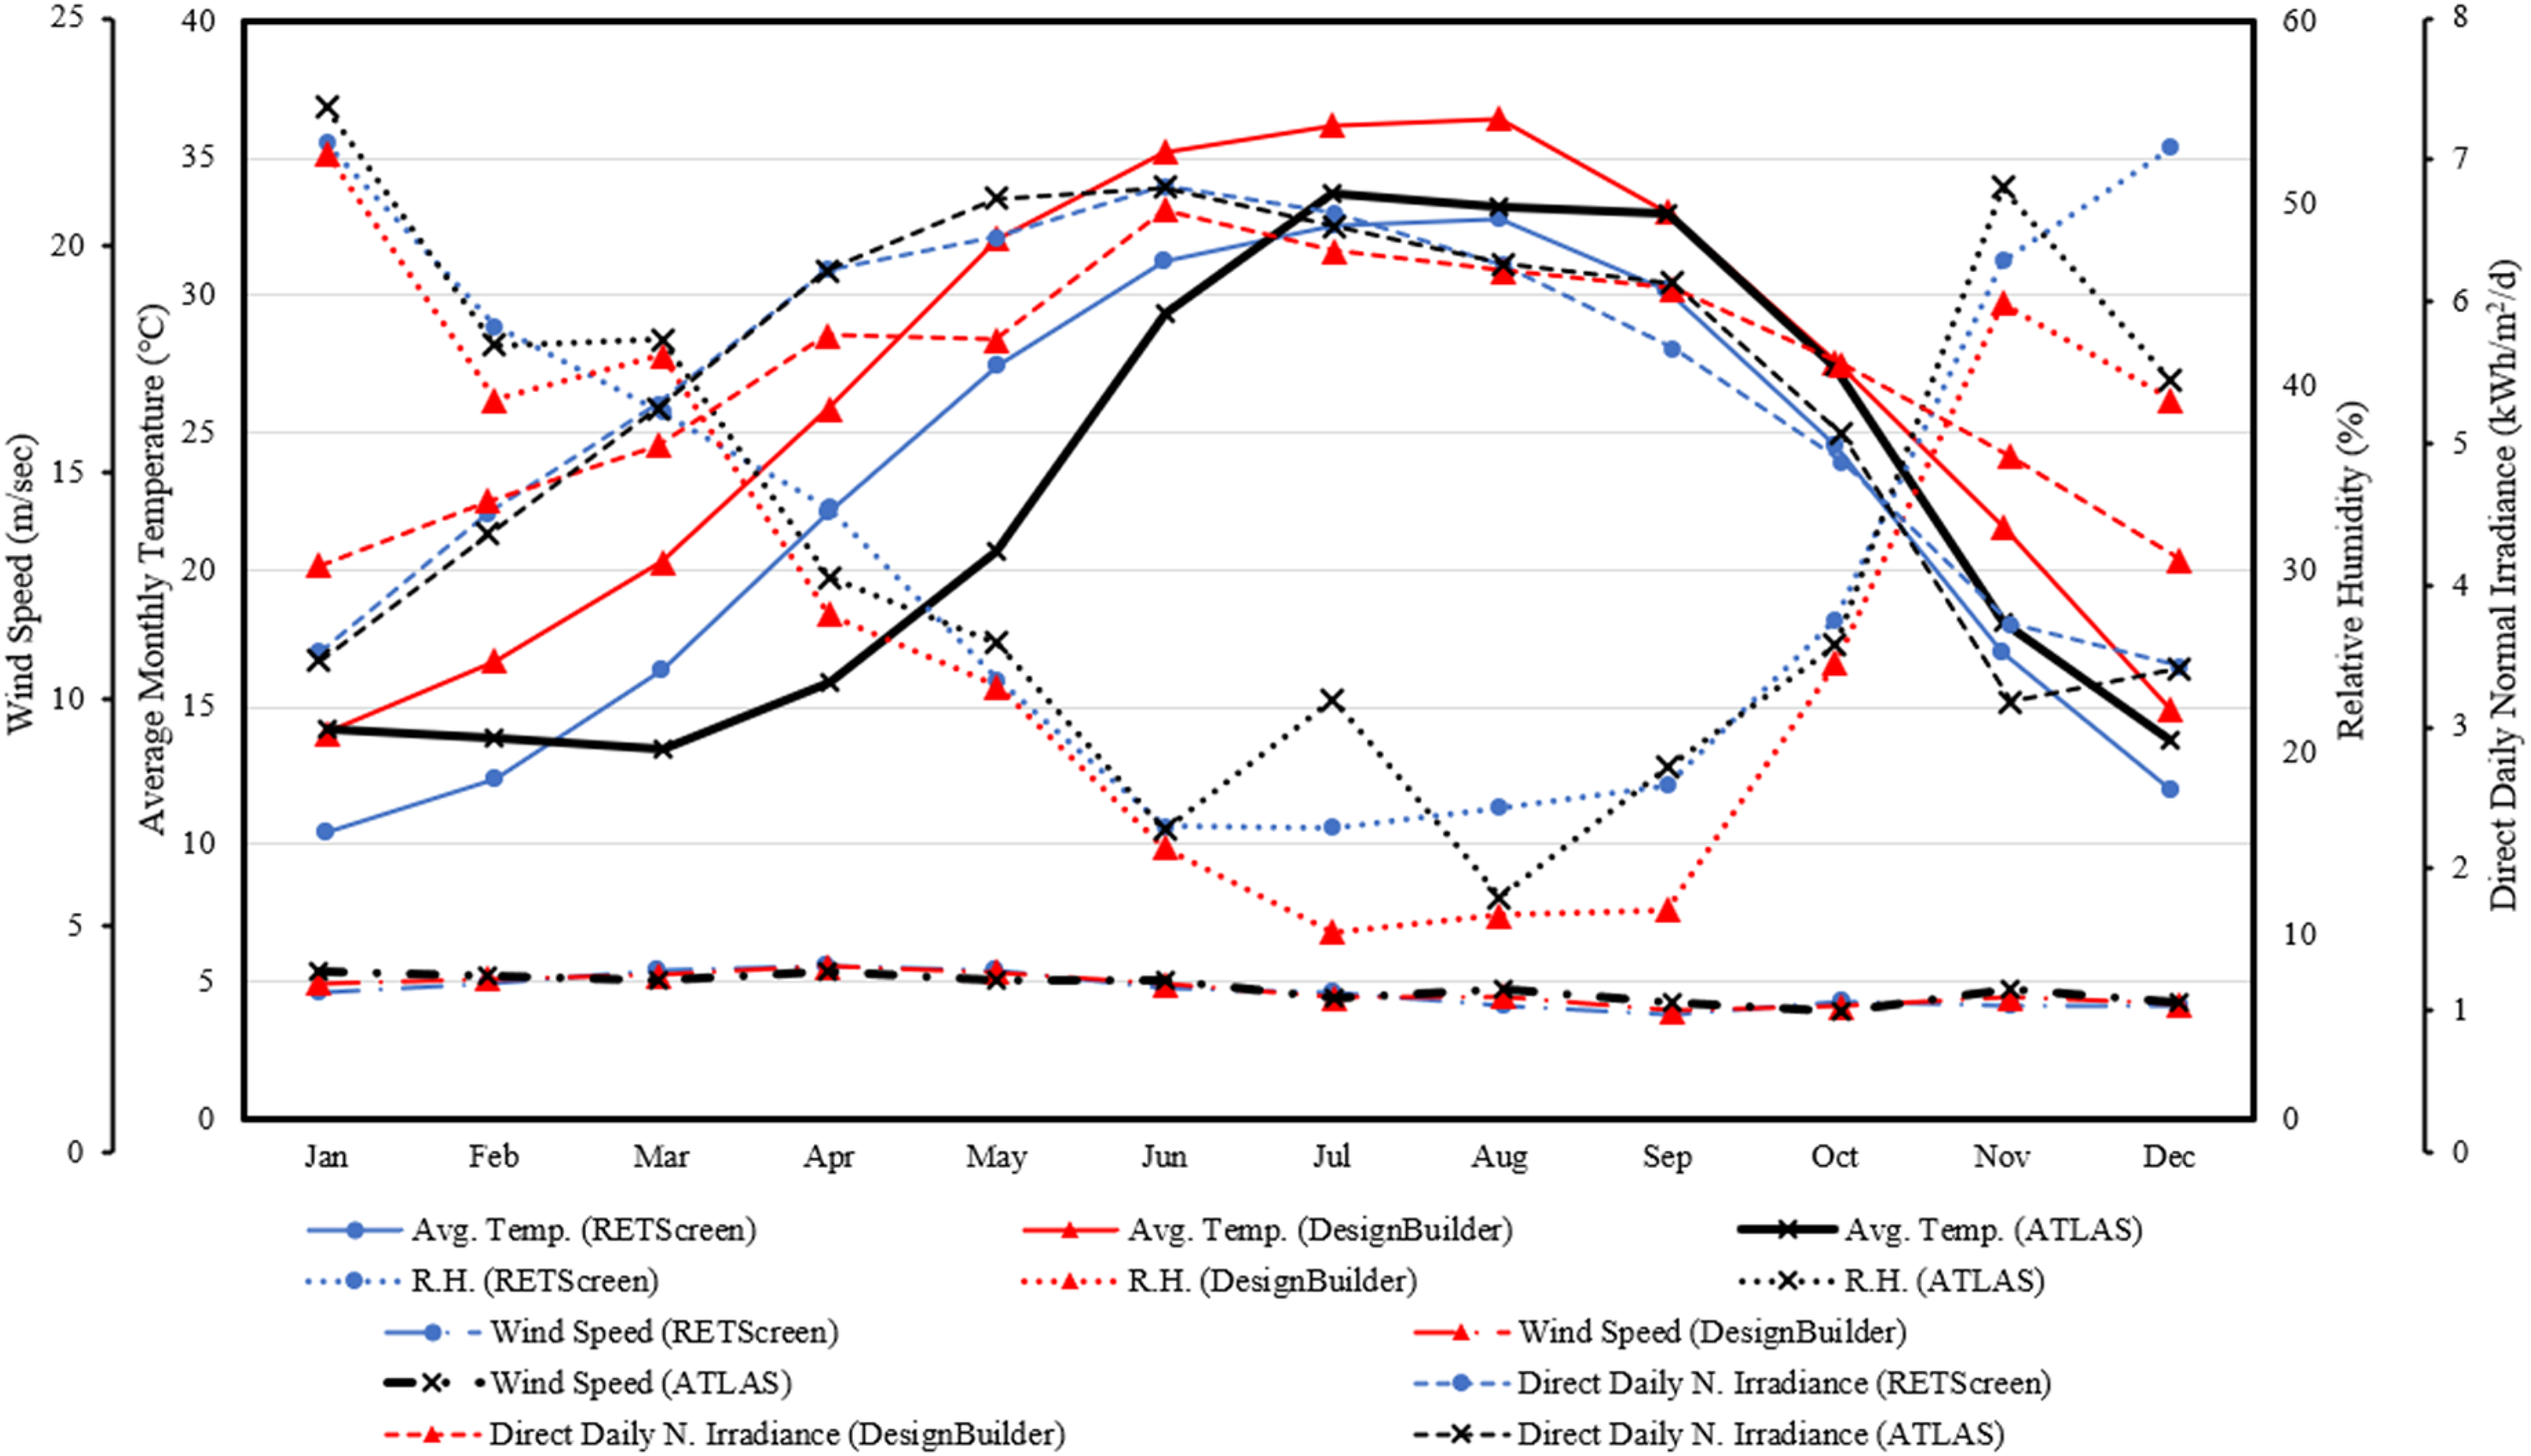
Average monthly climate data for hail from different sources.
The electrical energy consumption per year, E of fixtures, equipment, and lighting has also been calculated based on measurements using equation (1):
The EUI per floor area was calculated using Equation (2):
Environmental analysis
The decrease in GHG emissions is a benefit of EEMs and the application of solar energy technology. The following formula can be used to determine the annual rate of GHG emissions or savings:
Simulation case study
Two mosques have been chosen as case studies. The first mosque is called “Amer Al-Khashil,” which is a large mosque with 1468 m2 of area. The other mosque is a small one called “Waledt Hassan Al-Jamil,” with 318 m2 of area. Throughout the text, the names will be abbreviated as follows: Al-Khashil means Amer Al-Khashil mosque, and Al-Jamil means Waledt Hassan Al-Jamil mosque.
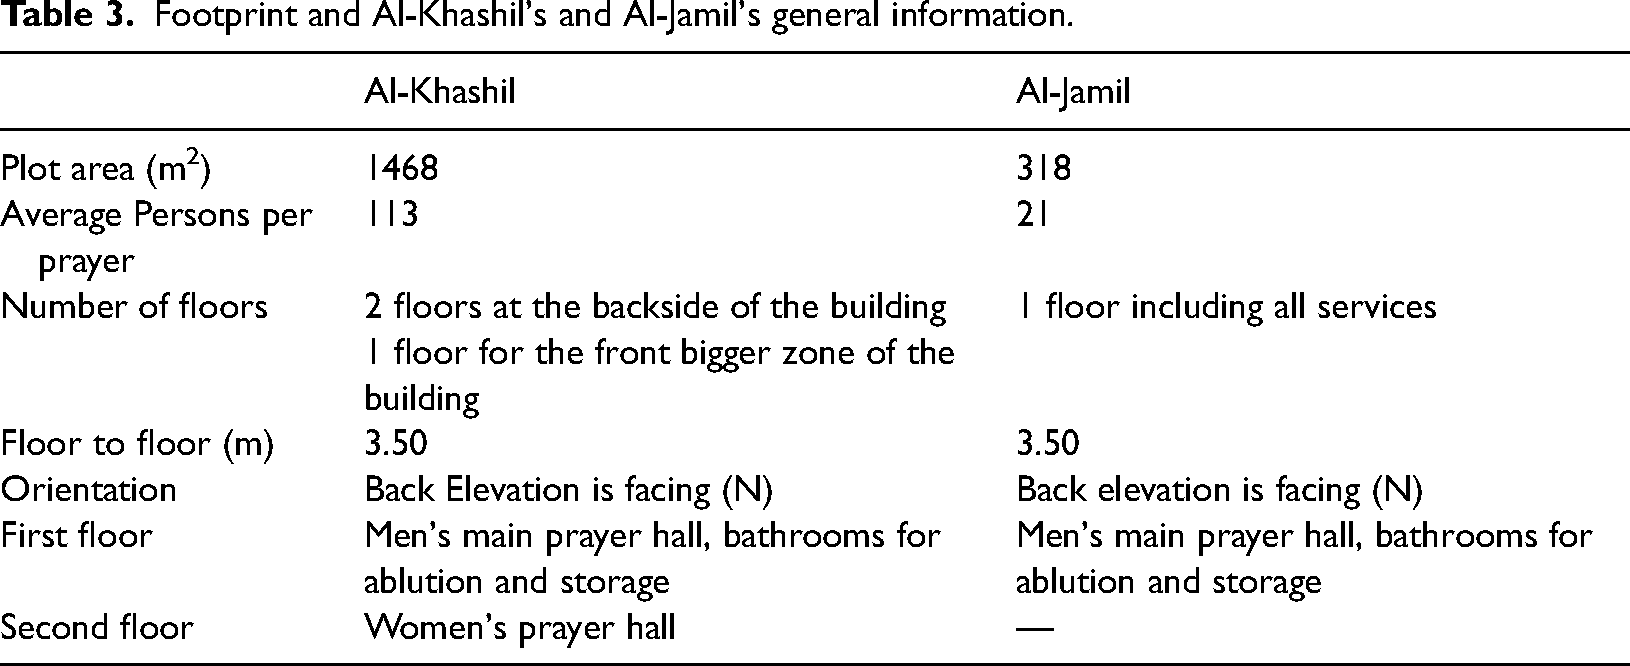
Al-Khashil is one of the biggest mosques in Hail. Table 3 shows the footprint and information about the mosques, while Figure 2 shows a three-dimensional image of the architectural model of the mosques. The simulation will be conducted for the base case and many energy-saving scenarios to evaluate effective approaches that may reduce energy usage for the operating mosques in Hail region.
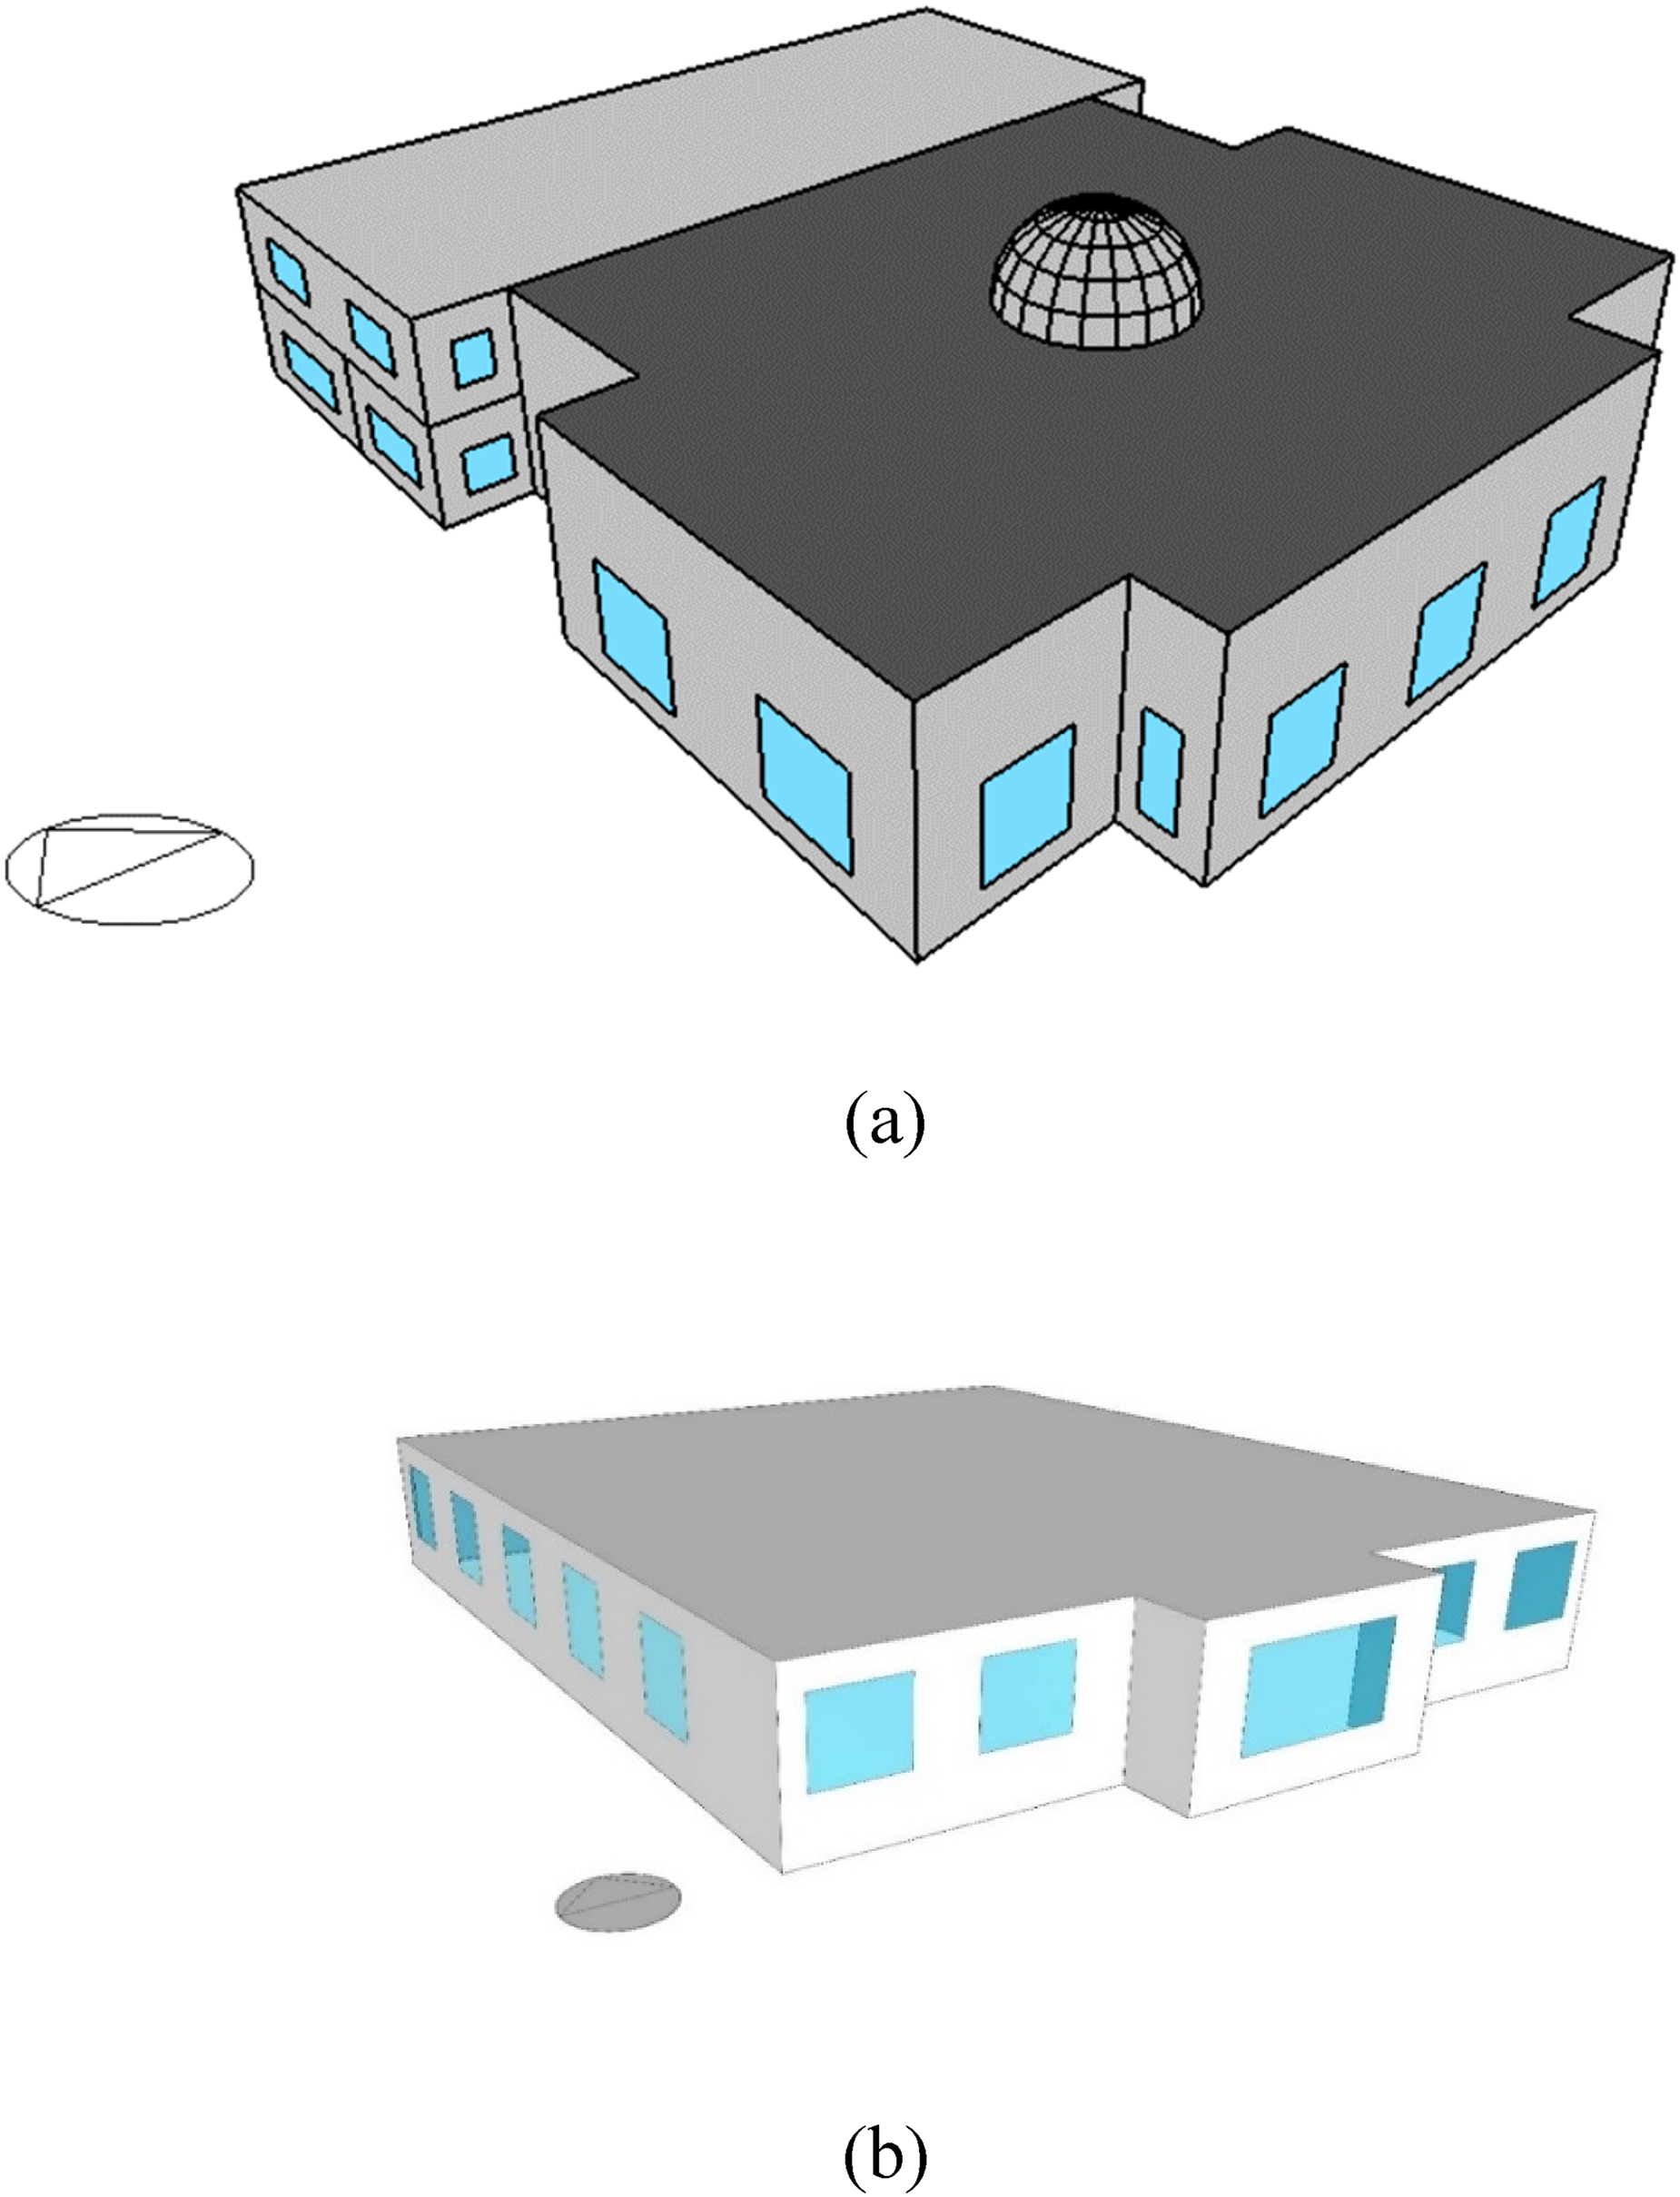
Three-dimensional (3D) view of Al-Khashil (a) and Al-Jamil (b).
Footprint and Al-Khashil's and Al-Jamil's general information.
Buildings parameters—base case
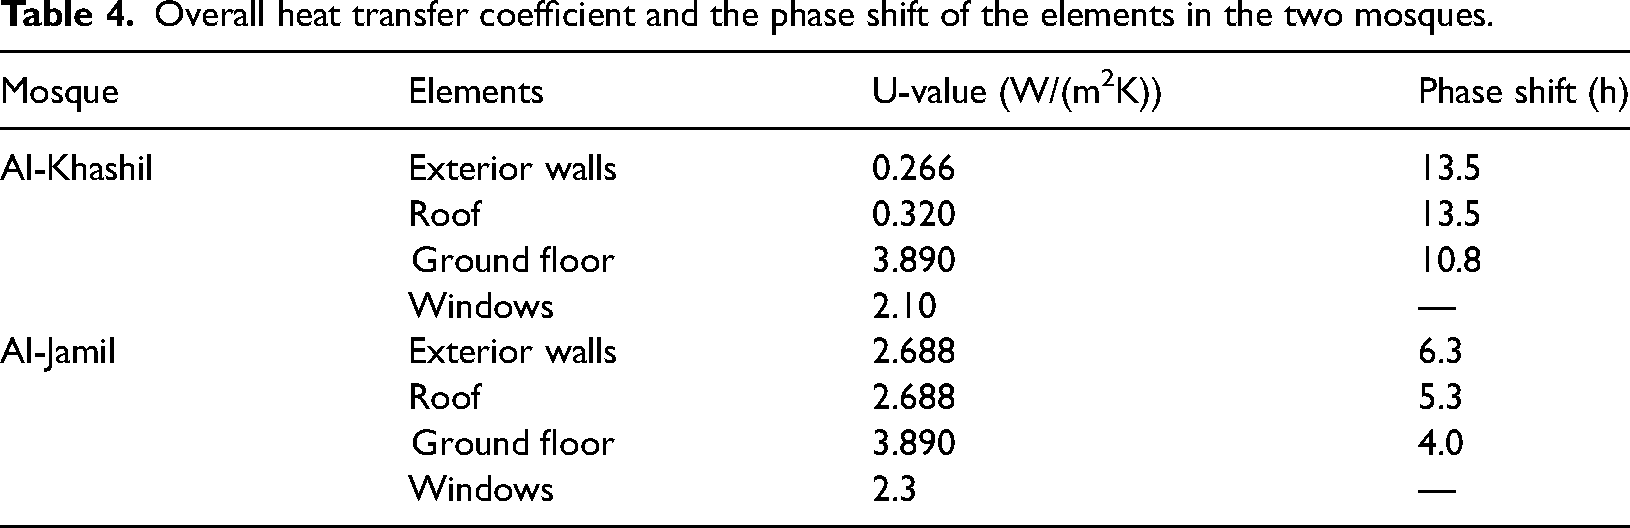
The program was used to study the thermal behavior of the building elements (outer walls, ceiling, and floor) in Al-Khashil and Al-Jamil. The composition of the external walls of Al-Khashil is shown in Figure 3. Table 4 shows the overall heat transfer coefficient and the phase shift of the building elements in the two mosques. Due to the design of building elements, the working schedule of mosques, and climate conditions, no condensation happens in all elements of the two mosques; see Figure 4. The internal and external surface temperatures of the external wall of Al-Khashil were shown in Figure 5. It is noted that the temperature of the inner surface was almost stable in the case of the insulated element, with a phase shift between the inner and outer temperature of 13.5 h, compared to 6.3 h for the uninsulated element. All windows and exterior doors in the base case buildings are double-clear 6 mm glass.
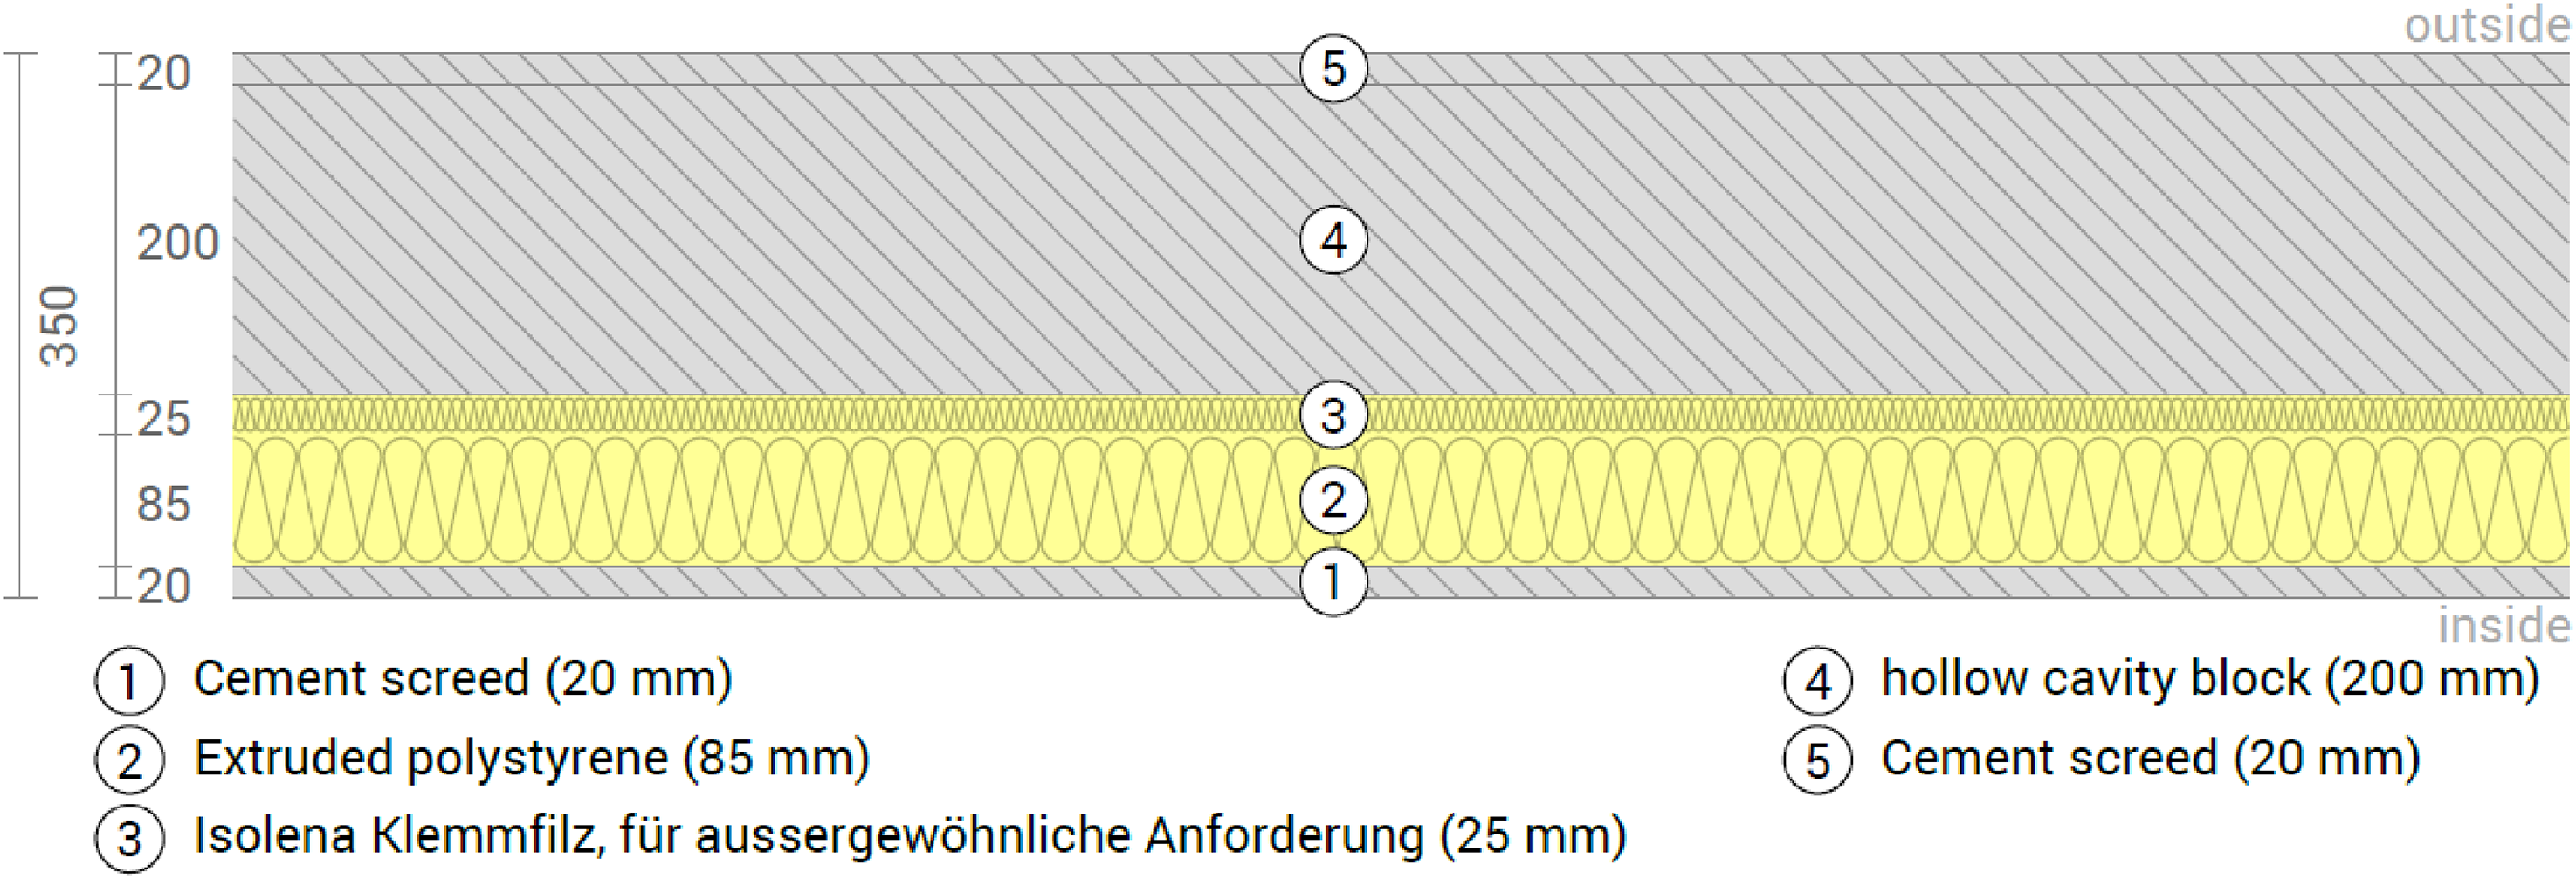
Al-Khashil construction walls details.
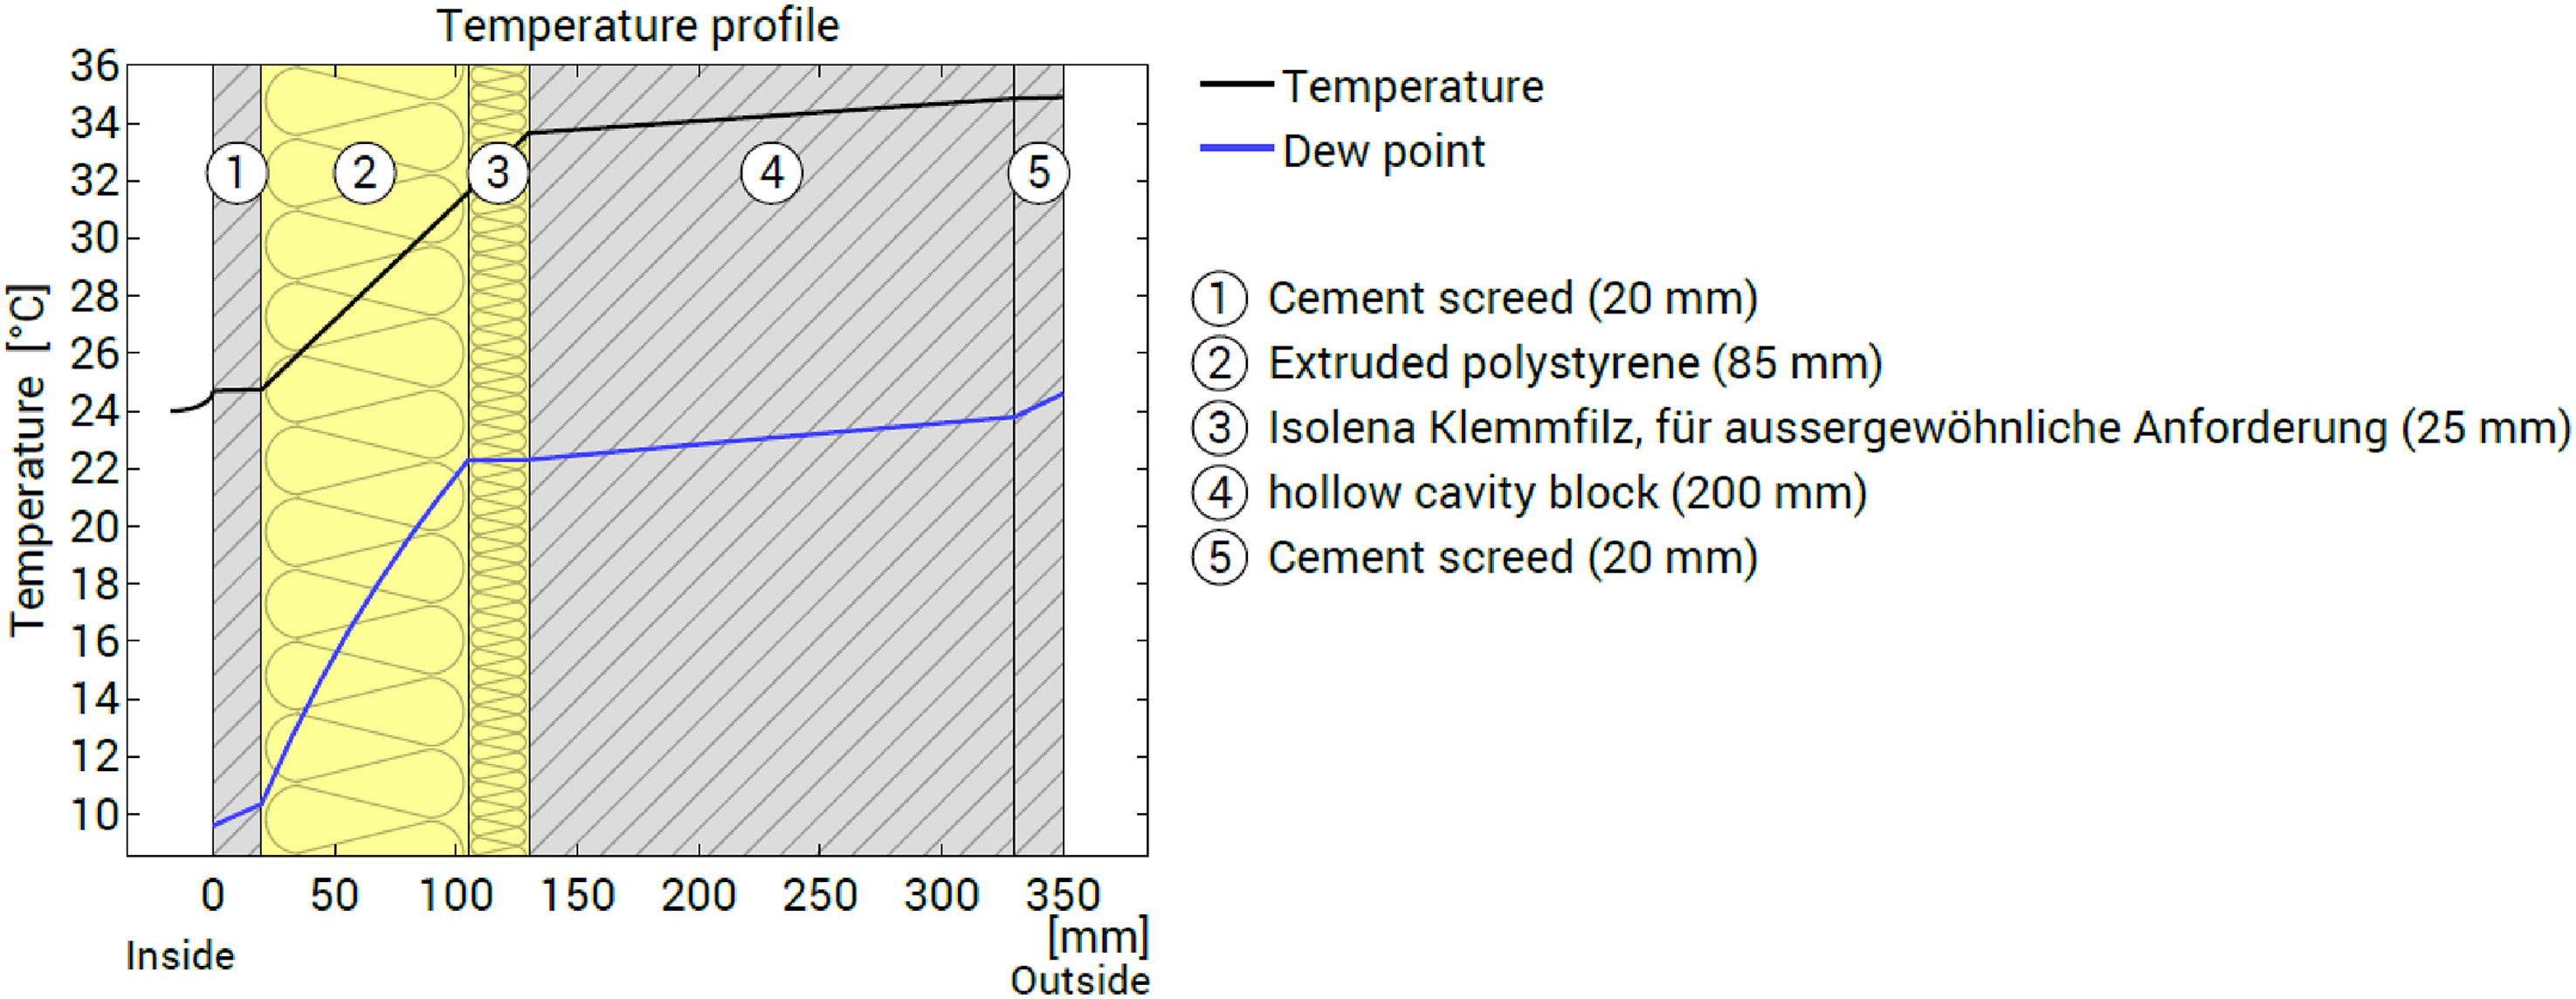
Check for condensation on Al-Khashil's external wall.
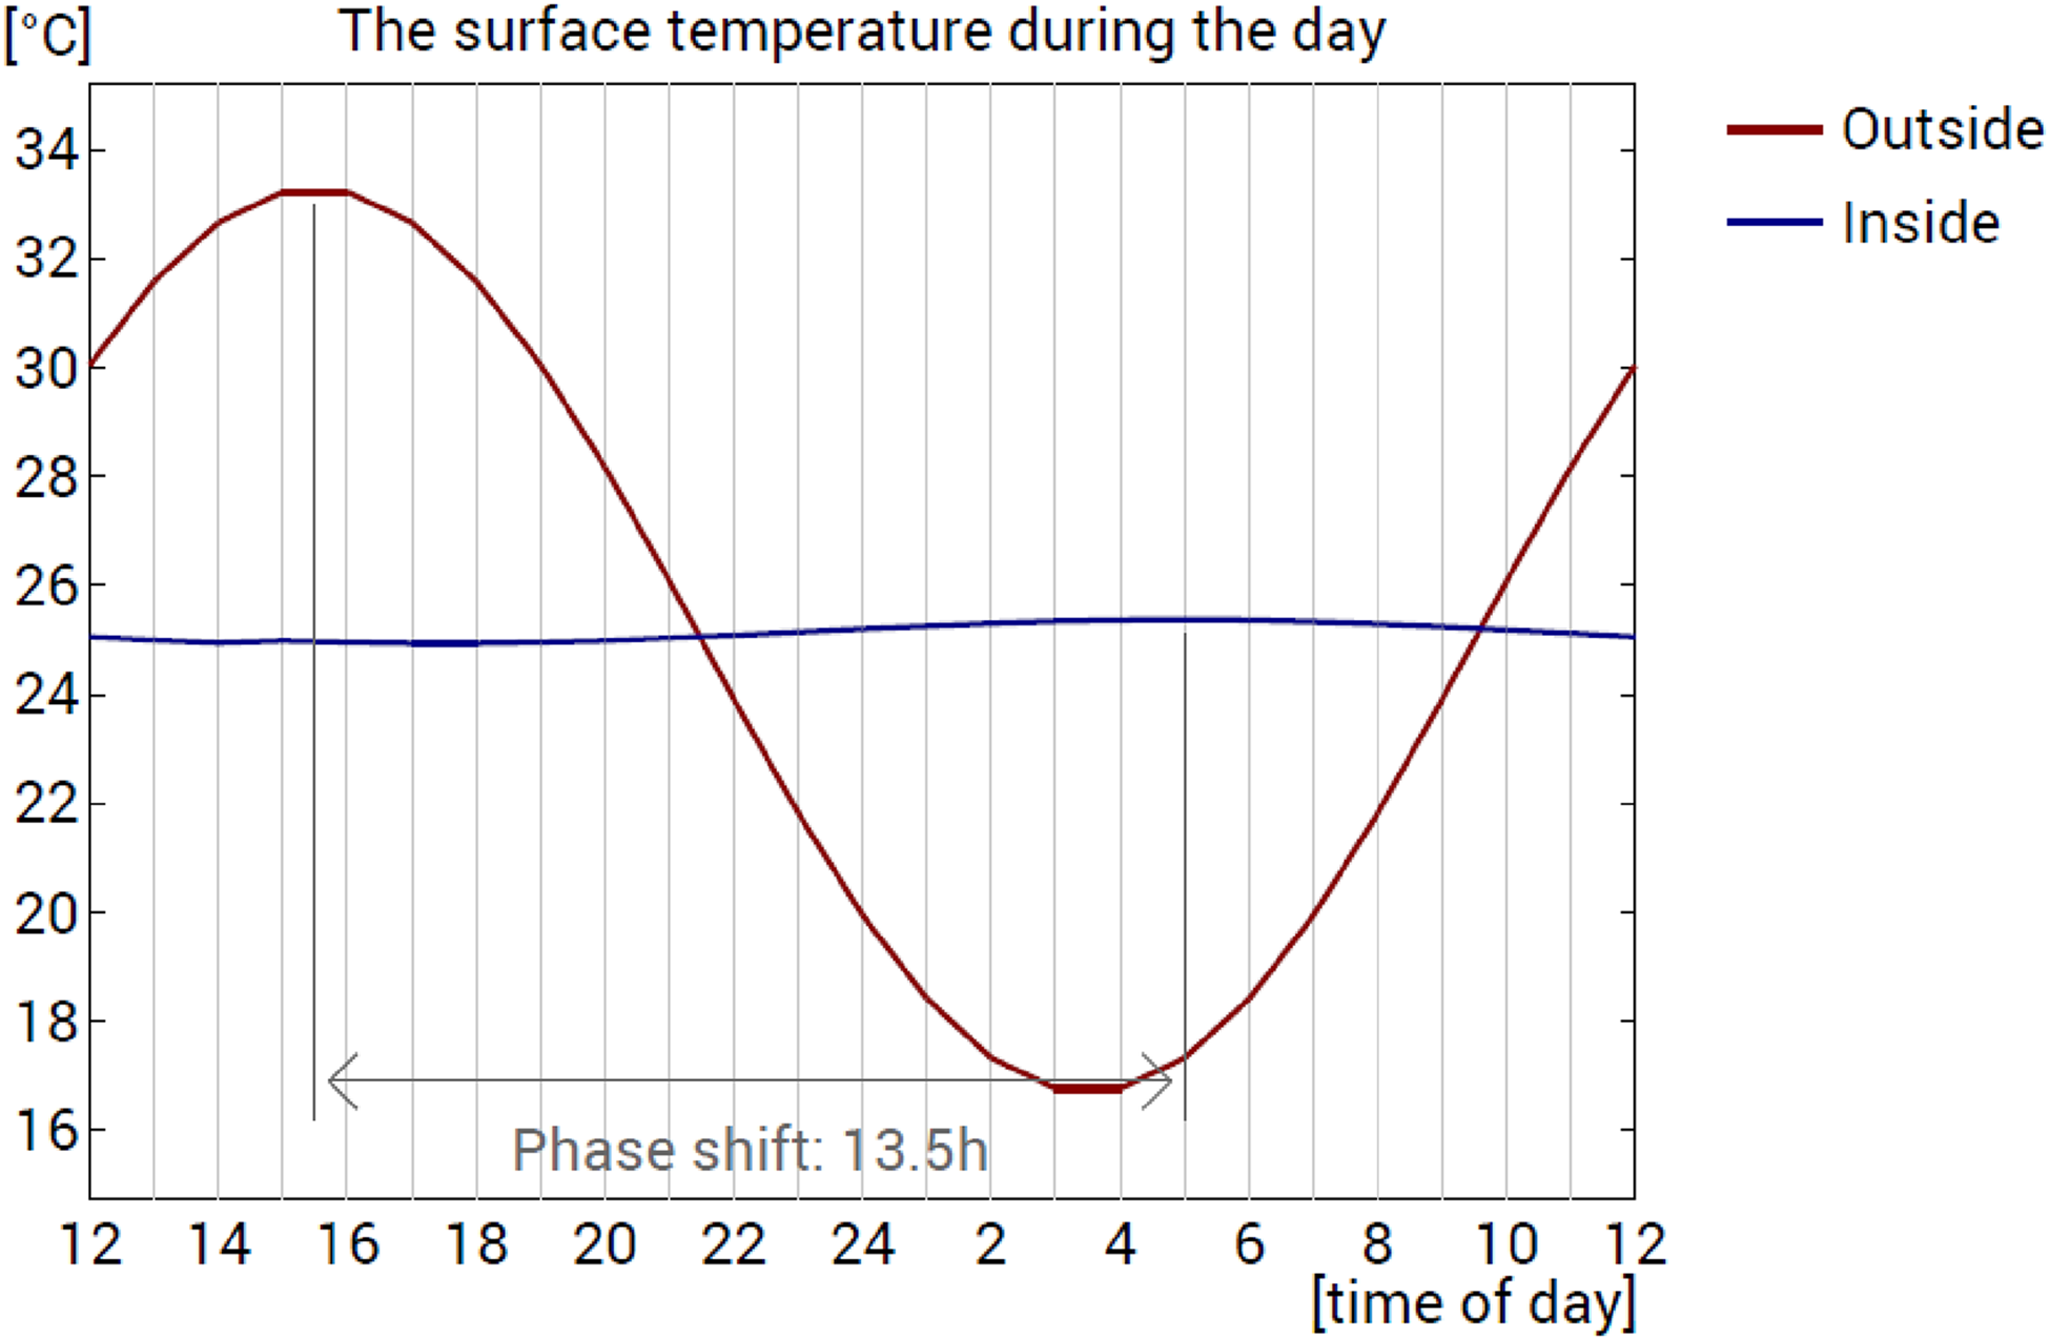
Phase shift of surface temperatures of the external wall of Al-Khashil.
Overall heat transfer coefficient and the phase shift of the elements in the two mosques.
Lighting and miscellaneous
The average peak connected power density (W/m2) of each electrical end-use system is indicated by power density. The user must indicate lights and other equipment as power density for each activity area type in DesignBuilder. In our case study, the area type is configured to a new configuration that schedules working periods according to the prayers offered. The mosque's occupation time was set at about 5 h per day, with each prayer around the hour (approximately 4 AM, noon, 3 PM, 6 PM, and 8 PM).
The actual hourly lighting power density in each space is computed by multiplying the lighting power density by the area of the space by the fractional value provided by the interior lighting hourly profile. According to ASHRAE Standard 62 (Levenhagen, 1992), DesignBuilder utilizes default settings for each activity area category.
The actual hourly miscellaneous power density in each space is computed by multiplying the miscellaneous power density by the area of the space and by the fractional value provided by the miscellaneous hourly profile. The various equipment power densities in our case are set to DesignBuilder default values, which are 5.00 W/m2.
Energy efficiency measures
The reduction of electricity use has been taken into consideration in two distinct ways because the main objective is to look into ways to make mosque buildings more sustainable. First, implementing energy-saving techniques, and then adding a PV grid that is integrated into the system. However, if it turns out that the Al-Khashil is properly insulated, very minimal reductions in consumption are anticipated. Since Al-Jamil lacks adequate insulation, various simulation techniques have been used to examine the impact of insulation on power consumption. The floor was not insulated because there is not much of a temperature difference between the inside and the soil.
Thermal insulation materials of various types will be studied. The primary thermal insulation materials’ production techniques will next be explained to explain why thermal insulation materials created from the same basic materials have various properties. Following that, the most important specifications for thermal insulation materials utilized in typical building envelopes must be provided. The variations in qualities of the thermal insulation materials will be detailed using the information from the previous sections to meet the requirements.
The Saudi Building Code (SBC) 601 and 602 (Code-Residential, S.B.E.C.) is a minimum performance guideline for the construction of energy-efficient structures. From August 2021, the required overall heat transfer coefficient for roofs and walls in zone 2 of non-residential buildings in the KSA will be 0.340 and 0.591 (W/m2 K), respectively, while for windows if the wall ratio is less than 40%, it will be 2.890 (W/m2 K) (Guidelines for thermal insulation systems and materials according to the requirements of the Saudi Building Code). Comparing the values required for zone 2 we find that both walls and roofs meet the required conditions for Al-Khashil, while for Al-Jamil there is a need for energy-saving measures. As for windows, their window wall ratio (WWR) is less than 40%, and the heat transfer coefficient is lower than the values required. This means that there is no need to improve the quality of windows in terms of thermal insulation. Table 5 includes basic condition specifications from DesignBuilder.
Basic assumption data for energy analysis.
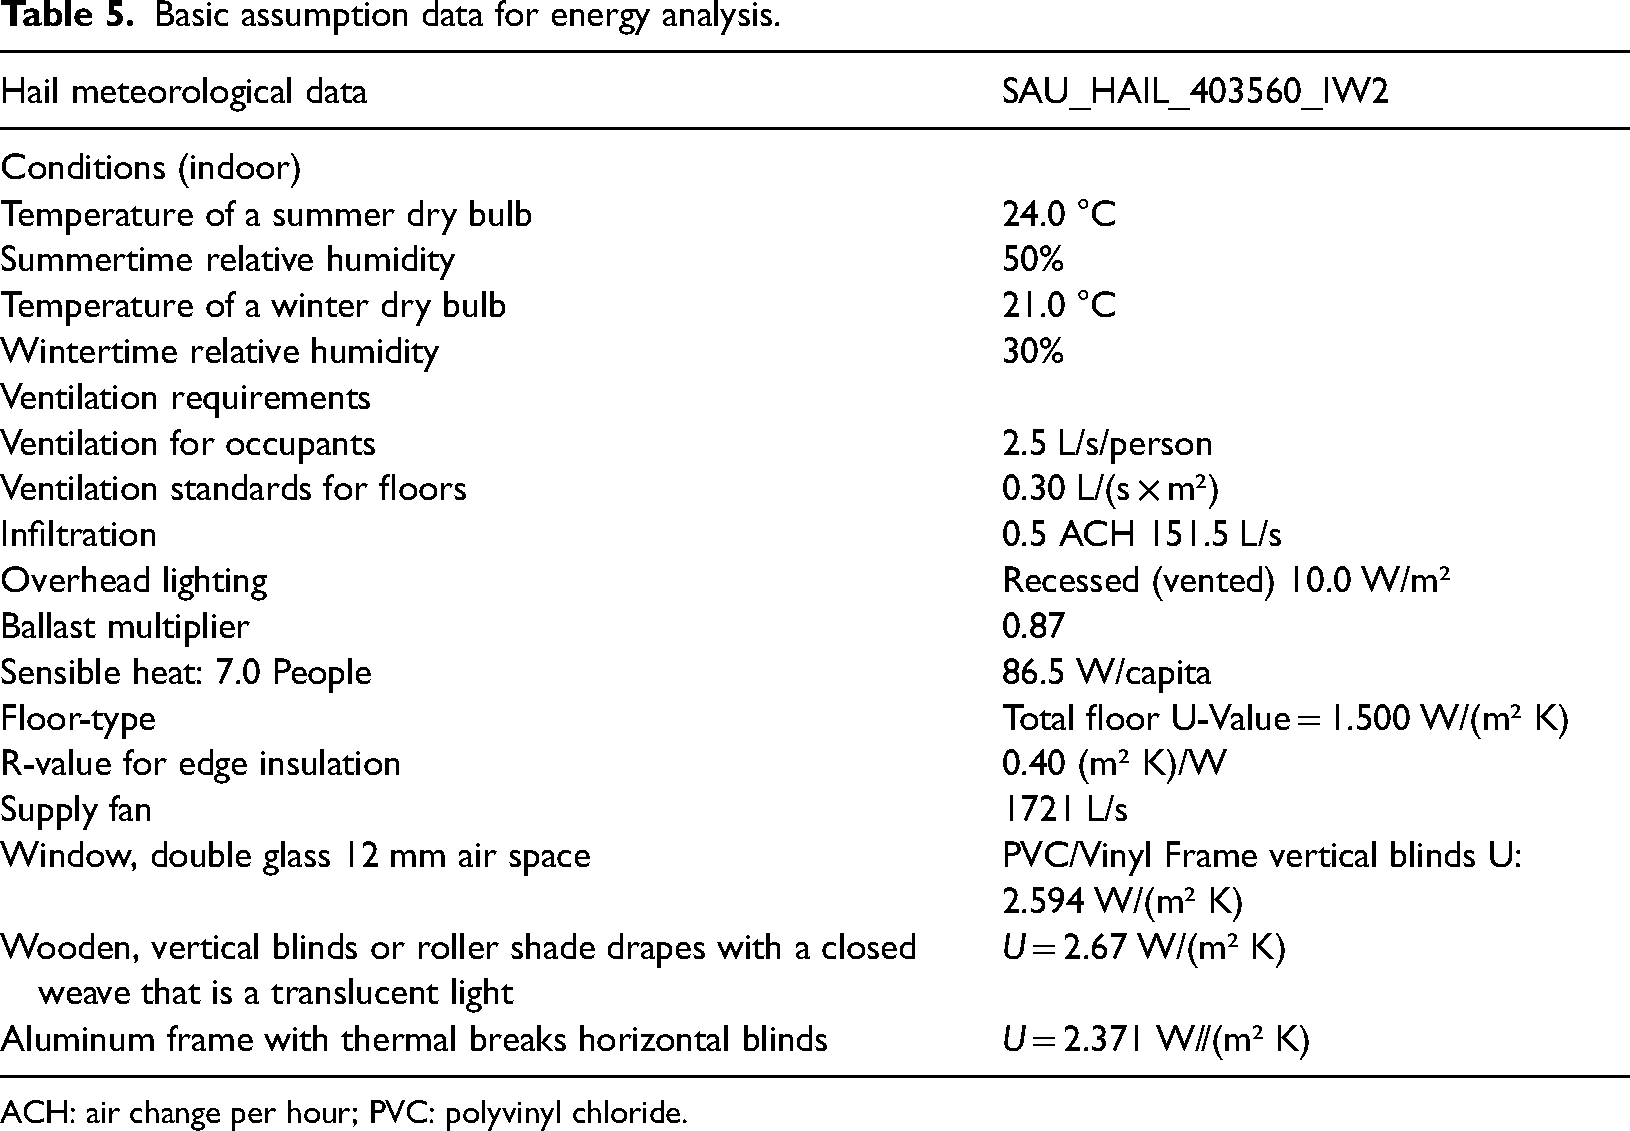
ACH: air change per hour; PVC: polyvinyl chloride.
External wall insulation
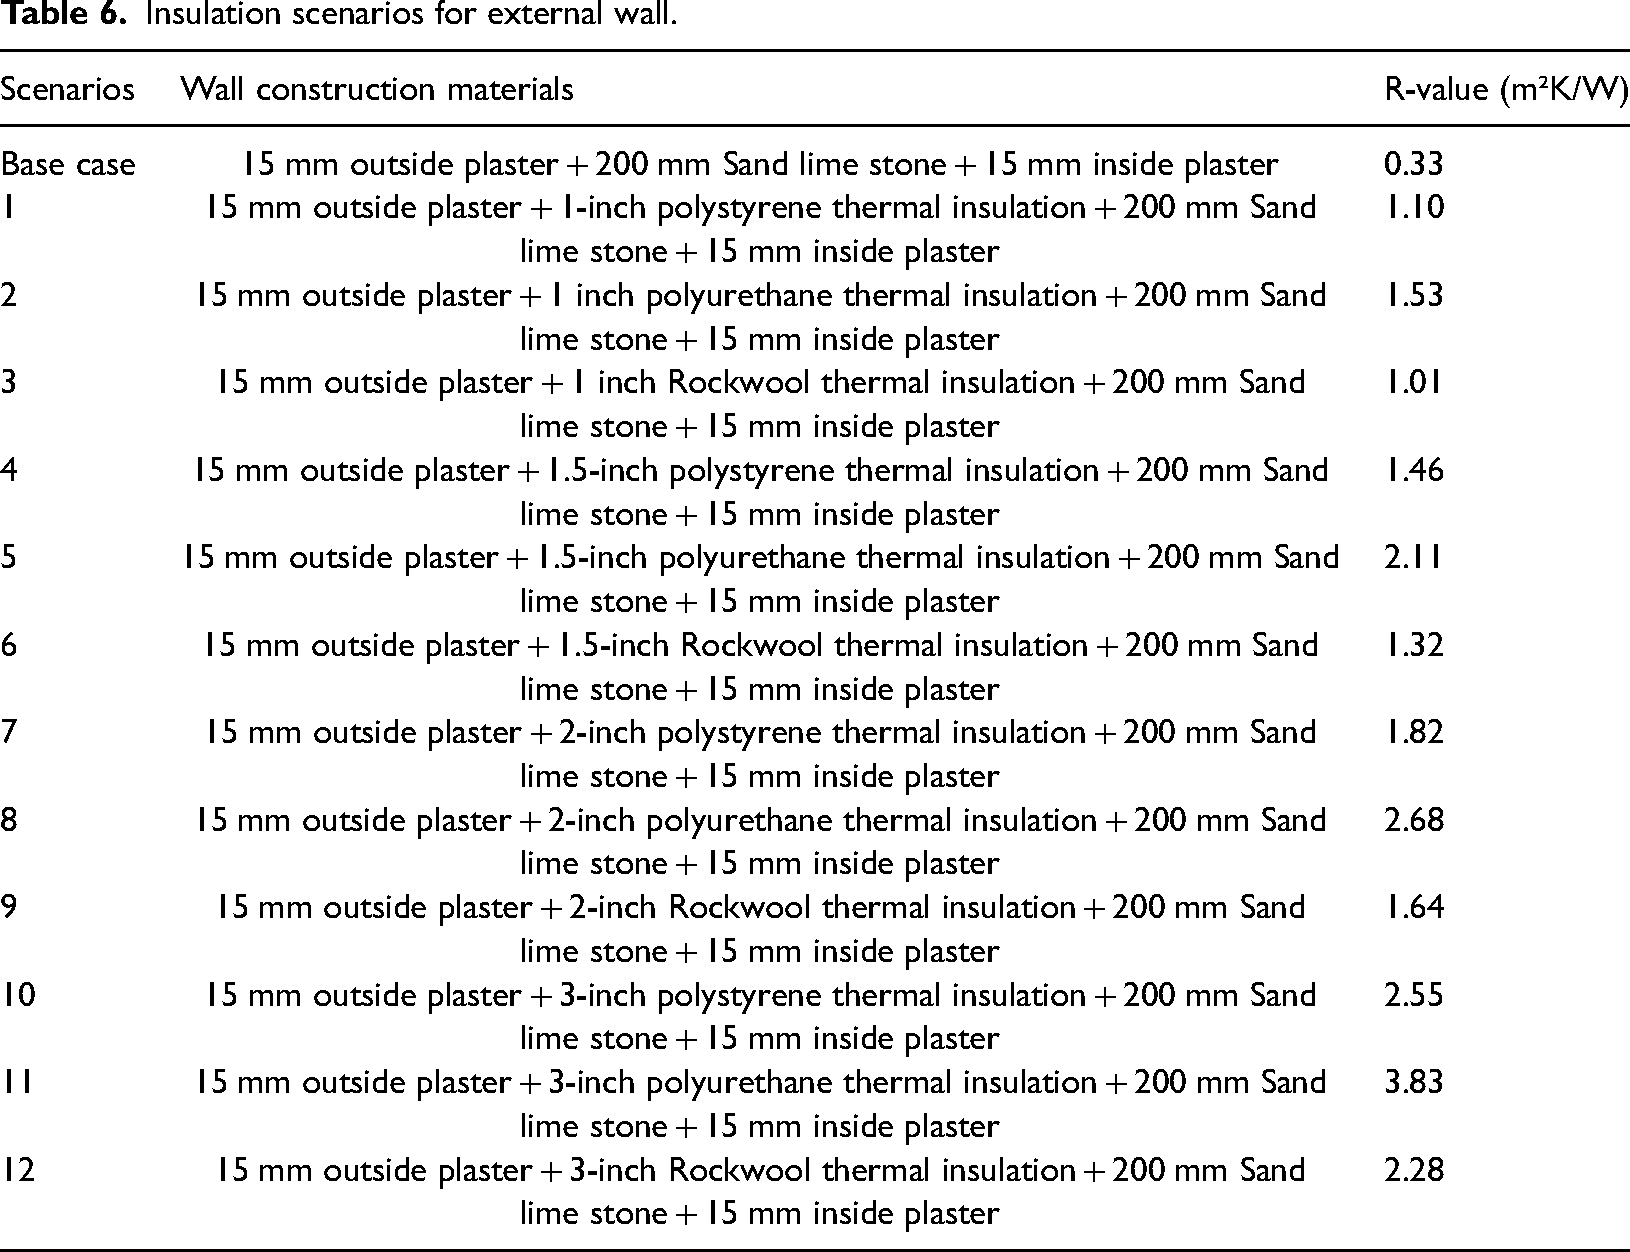
For the building's external walls and roof, several thicknesses of polystyrene, polyurethane, and rockwool exterior insulation were employed to investigate how insulation thickness and type affect the building's energy demand. Table 6 lists all of the simulated scenarios for updated external walls with various insulation kinds, thicknesses, and thermal resistance values. Because Al-Khashil was discovered to be insulated, Al-Jamil has been included in insulation scenarios; thus, applying insulation techniques has had a limited effect.
Insulation scenarios for external wall.
External roof insulation
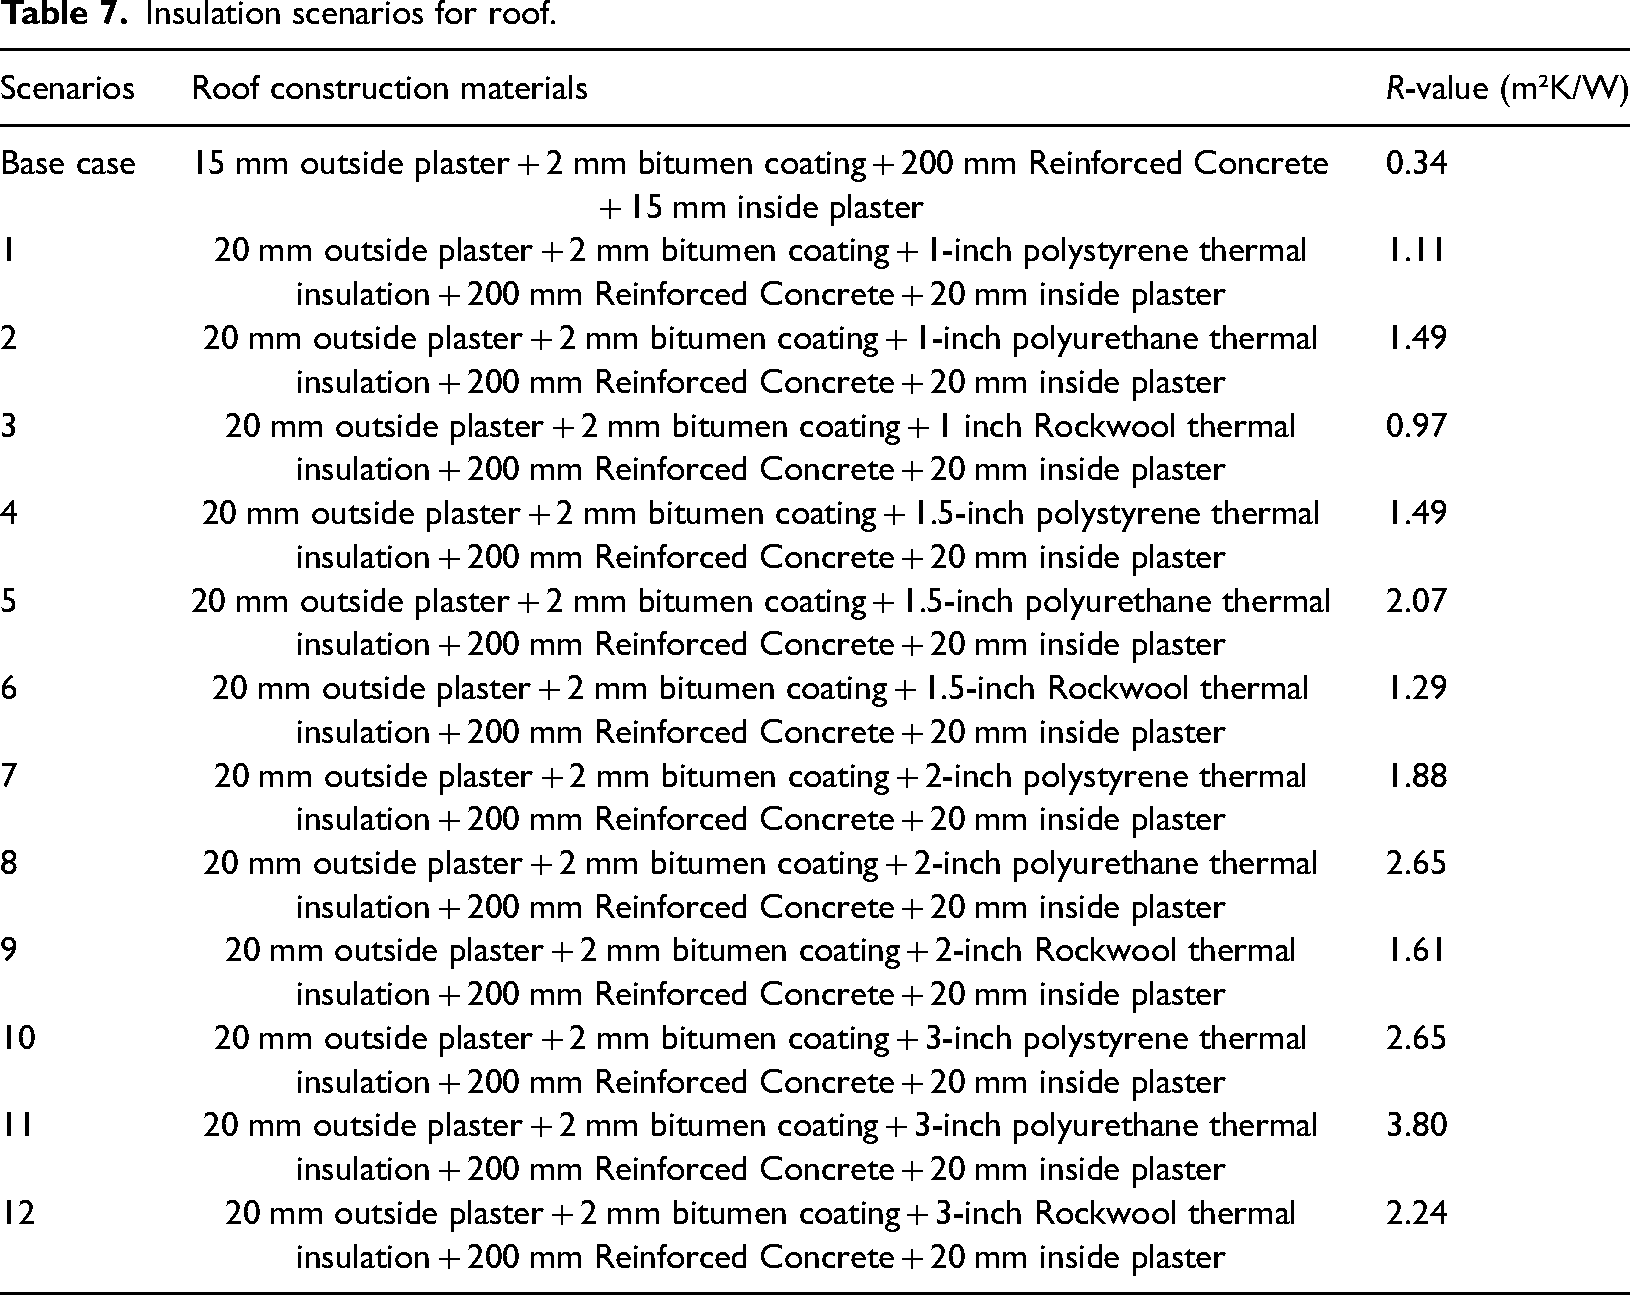
The roof was also insulated with all three types of insulation (polystyrene, polyurethane, and rockwool) at different thicknesses to see how the thickness and type of insulation used on the roof affected the building's energy consumption. Table 7 lists upgraded simulation scenarios for roofs with various insulation kinds, thicknesses, and thermal resistance values.
Insulation scenarios for roof.
Window types
Simulations are conducted for single clear, double clear air, double clear argon, double LoE clear air, double LoE clear argon, double LoE TINT air, triple clear air, and triple clear argon; this corresponds to an overall heat transfer coefficient in the field of 6.31–1.64 (W/m2 K).
Window wall ratio
To measure the effect on energy consumption, the WWR is altered in all directions. In addition to the base scenario described, WWR is simulated at 30%, 25%, 15%, 10%, 8%, 6%, 4%, and 2% in each direction.
Shading and blinds
Different lengths of external overhang shading and various types of interior blinds are simulated for the basic case building to compare the effect of providing shade to windows on energy consumption to alternative methods. Users define blinds in DesignBuilder by kind, season, and percent closed when occupied and unoccupied to construct solar and visual transmittance multiplier schedules that limit total solar energy and visible light transmission through windows and into perimeter spaces. Many types of blindness scenarios will be simulated. For all simulation scenarios, the percent closed when occupied is set to 20%, and the percent closed when unoccupied is set to 80%.
PV system
The goal of this study is to investigate the impact of installing PV systems in mosques using RETScreen software. A technical and economic environmental study to investigate the impact of these systems, more specifically in Hail, KSA, was the subject of this study. The majority of traditional Saudi Arabian mosque roofs are not used. This component of the research will look into the transition from a typical electric grid energy consumer to a solar PV energy producer, which will have a significant impact on more sustainable buildings. As a result, to fulfill the load needs and examine the economics of exporting the generated electricity to the grid, a grid-connected PV system was designed on the rooftops of the two case study mosques. The daily average GHI is approximately 5.24 kWh/m2, whereas the annual average temperature is approximately 22.5°. The PV system was installed on 1153 m2 of the Al-Khashil rooftop area and 268 m2 of the Al-Jamil rooftop area. The tilt angle for the position of the PV will be 27.4° straight south, which is Hail's site latitude.
PV array sizing and module selection
Performance, warranty, and availability in the local market, as well as the RETScreen database, were all factors in choosing the PV module type for this study. The high module efficiency of the Canadian Solar modules (Type: HiKu CS3W-400P) is a major factor in their selection (Modules, C.S.). At standard test conditions (STC), their efficiency can reach up to 18.11%. In addition, this module complies entirely with both the IEC 61215 and the IEC 61730 standards. These photovoltaic panels are ideal for KSA's dry and dusty environment. The module has a nominal maximum power output of 400 Wp under STC circumstances. Table 8 illustrates more specific information regarding the parameters and ratings of PV modules. The project was assigned the same 25-year lifespan as the modules, with 0.05%/°C.
The PV module specifications.
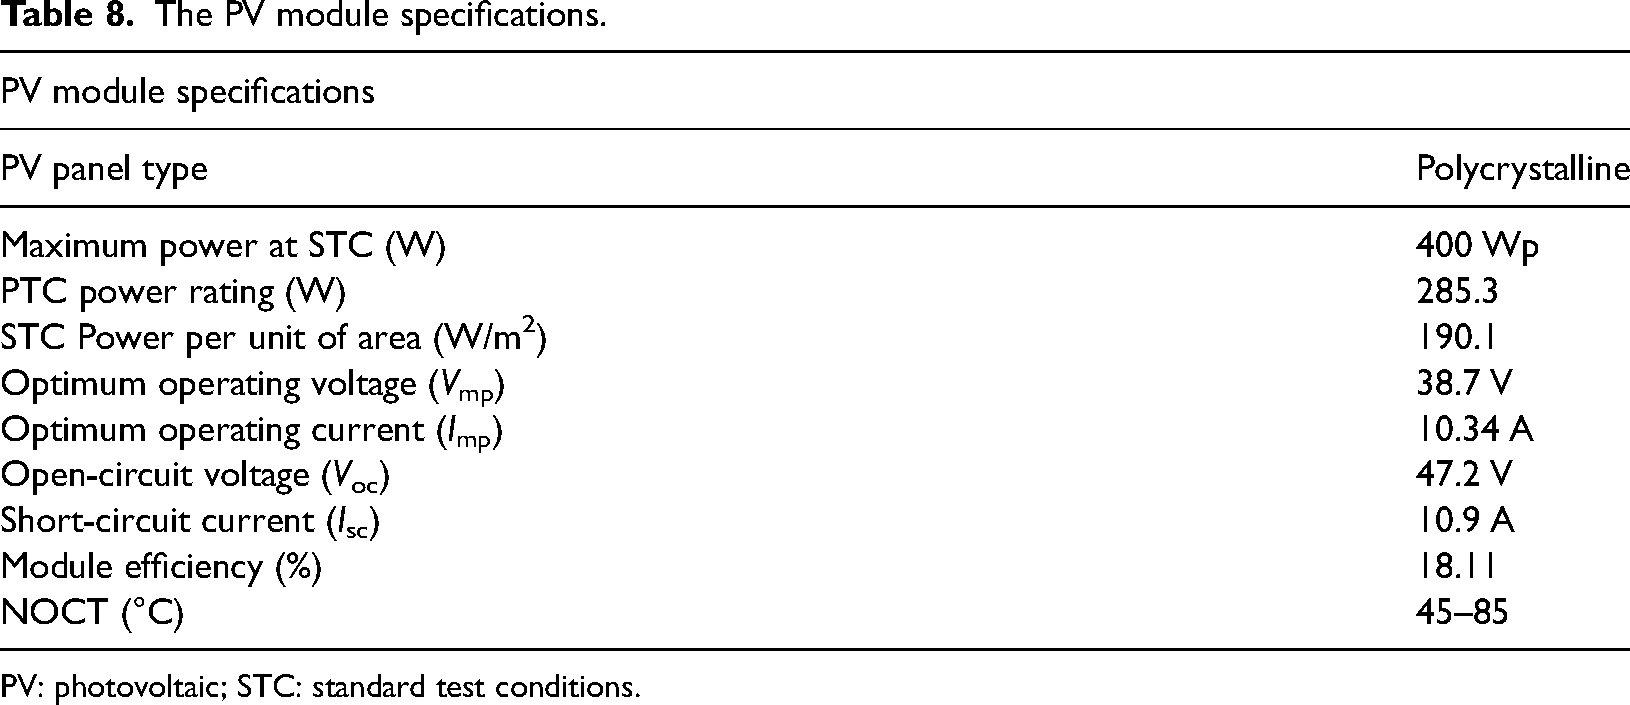
PV: photovoltaic; STC: standard test conditions.
Balance of the system
All parts of a photovoltaic system that are not solar panels are collectively referred to as the “balance of the system”. It also covers the costs of engineering planning, labor, shipment, installation, mounting structures, connections, and so on. The cost calculation for unified PV system components in 2021 is shown in Table 9.
Cost estimation of unified PV systems components.
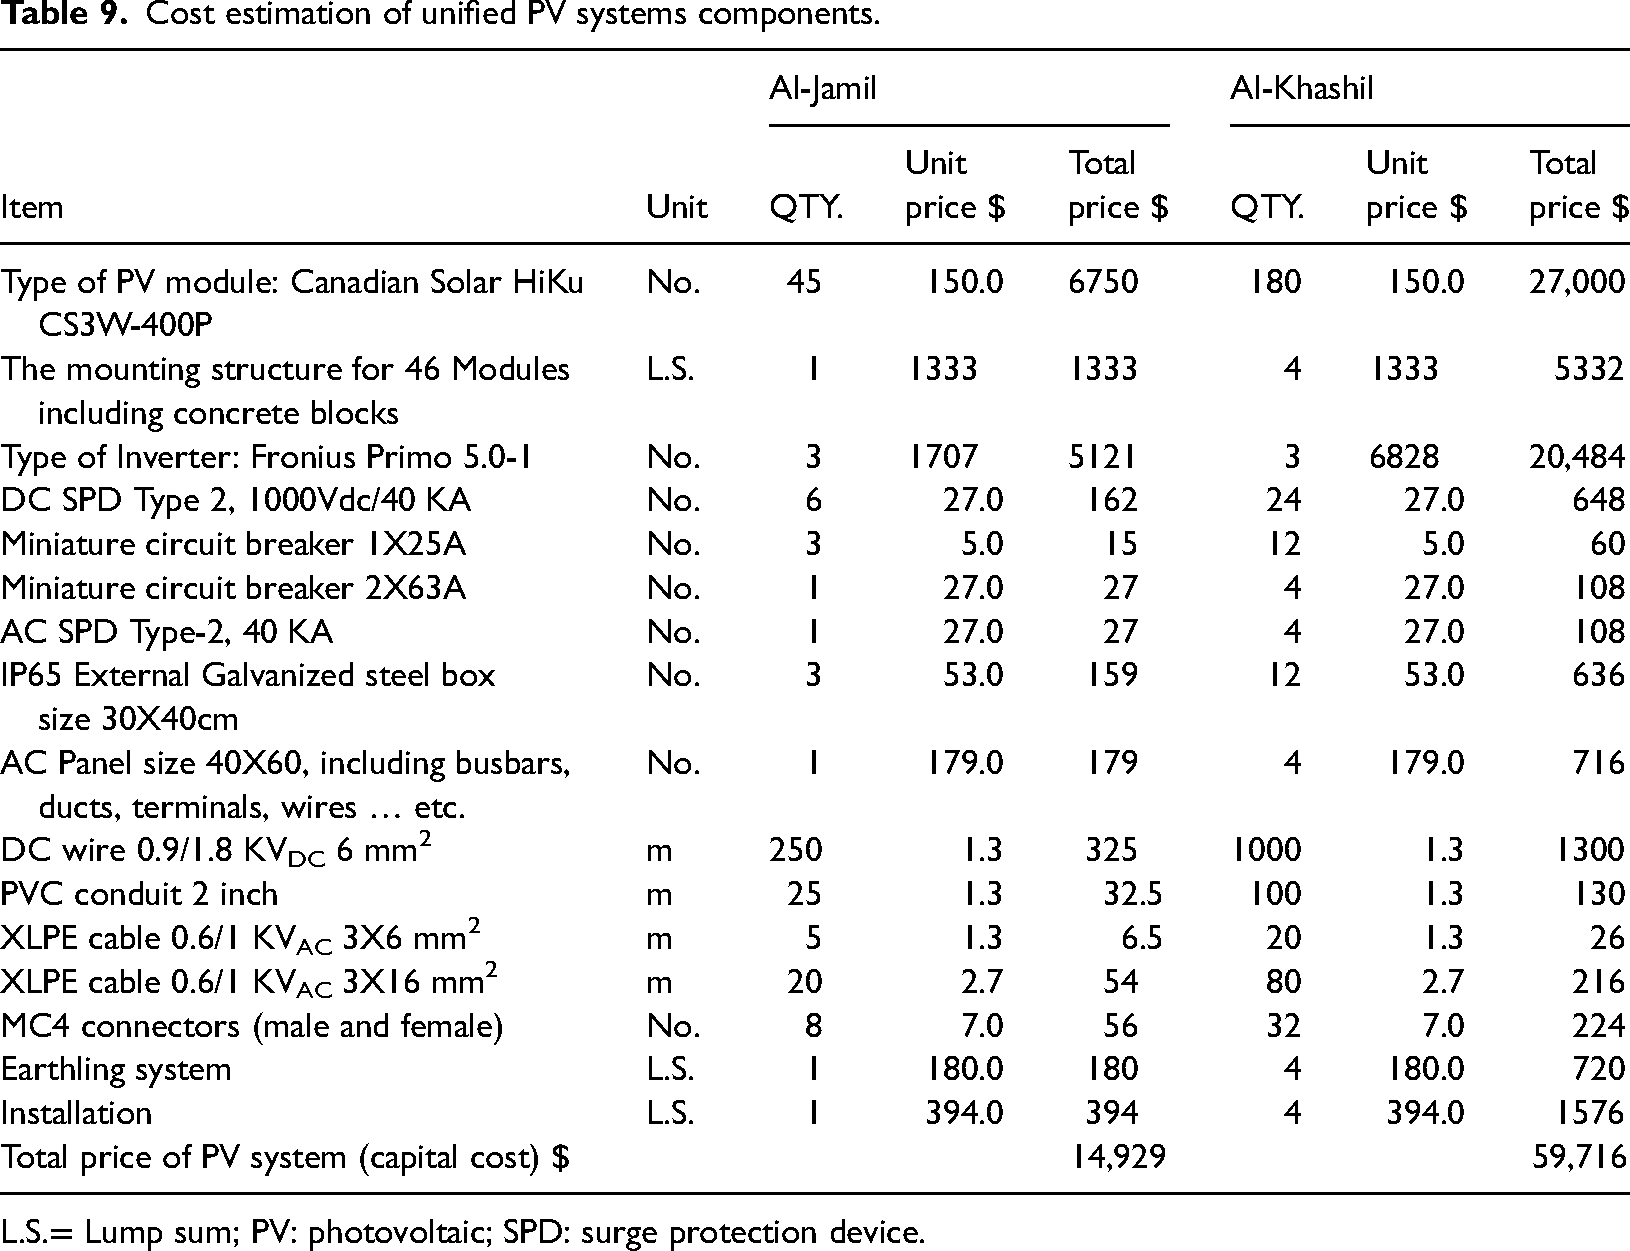
L.S.= Lump sum; PV: photovoltaic; SPD: surge protection device.
Technical and economic performance indicators
The 18 kW Canadian Solar Module PV array for the Al-Jamil features three grid-inverter types (Fronius Primo 5.0-1). Similarly, Al-Khashil has a 72 kW Canadian Solar Module PV array with 12 grid-inverter-type (Fronius Primo 5.0-1) inverters. Equation (4) gives the daily average global radiation (in kWh/m2/d) over a slanted surface:


The internal rate of return (IRR) is an important factor to take into account when determining an investment’s profitability, according to RETScreen.
According to the Saudi Arabian Monetary Agency, the IR is 2.5%, while the interest rate is 2.4%. However, the discount rate in the KSA is predicted to be 4.5%. The project would span 25 years, which is the length of the PV module life cycle, and there would be no debt included in the project's capital costs. Inverters have a 15-year lifespan and a 30% salvage value of their original cost. The simple payback time (SPBT) is calculated using the cost of PV systems in local markets and the energy exchange tariff in 2021, obtained as follows: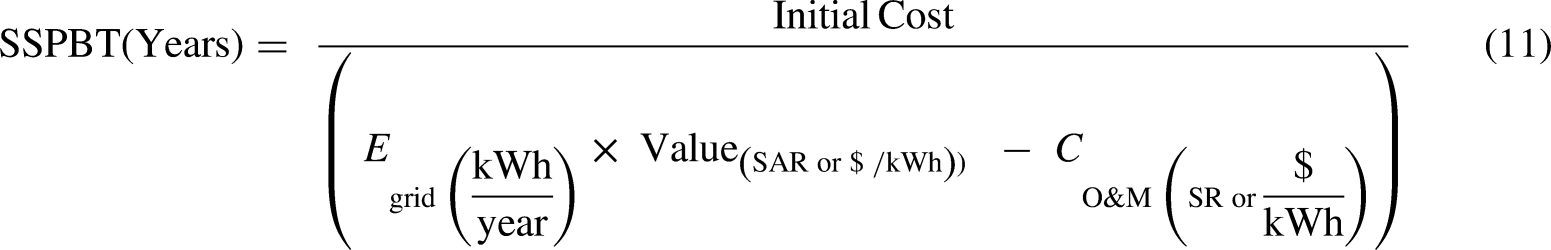
Results and analysis
Electrical consumption
Many visits to Al-Khashil and Al-Jamil have been made to investigate the operating conditions. The reason for the great energy consumption and extreme extravagance in many mosques is the lack of rationalization of their consumption. There is a waste of electrical energy in all mosques, especially the big ones (Al-Khashil), in which Friday prayers are held, as they are large. Also, in some mosques, especially those built by benefactors (Masjid Al-Jamil), there is a clear waste of lighting, even during the day when natural light is sufficient and some high-efficiency equipment is not used. In addition to electricity consumption, the results of measurement and estimation of factors affecting energy consumption in Al-Khashil and Al-Jamil are presented in Table 10. The annual consumption was obtained based on equation (1).
Annual electricity consumption by use of al-jamil and Al-Khashil.
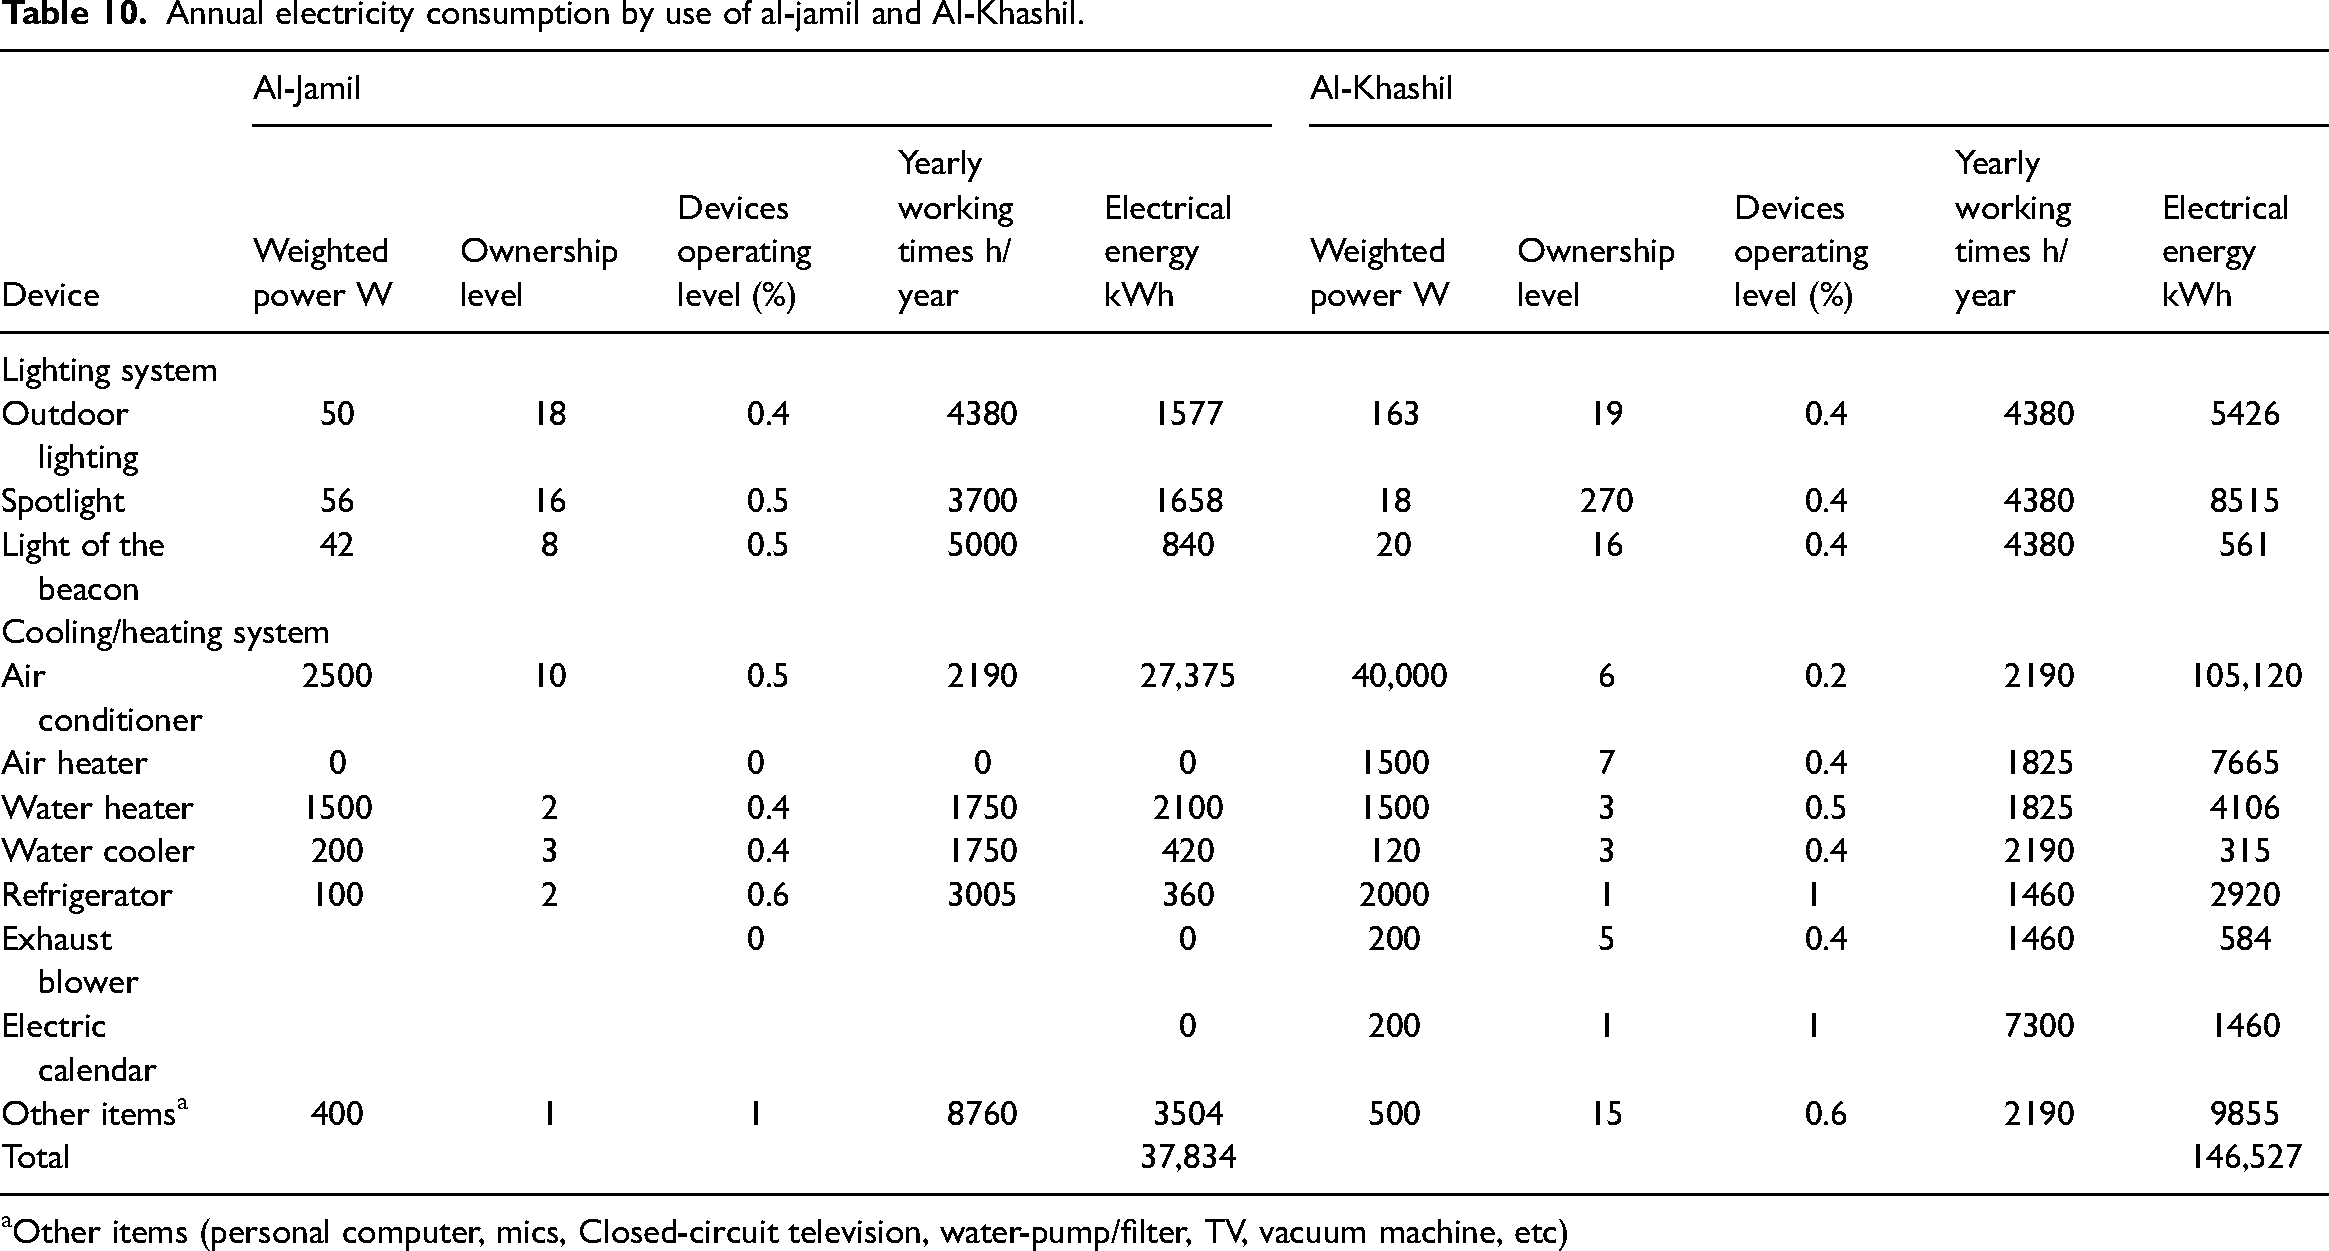
Other items (personal computer, mics, Closed-circuit television, water-pump/filter, TV, vacuum machine, etc)
All architectural drawings and building information are collected from the official designer to form the basic case for the energy simulations. Information regarding electric bills was acquired for the year 2019 to validate the building consumption. Total annual electrical energy consumption for Al-Khashil and Al-Jamil was 146.88 MWh and 38.62 MWh, respectively, corresponding to annual energy usage intensities (EUI) of 100 kWh/m2 and 121 kWh/m2, respectively. The end-use share for space cooling, space heating, hot water, fans, and area lights has been analyzed monthly. Space cooling accounted for 70.58% and 70.90% of total annual energy consumption in Al-Khashil and Al-Jamil, respectively, which corresponds to a study by (Al-Homoud et al., 2005). The end-use distributions are presented in Figure 6(a) and (b).
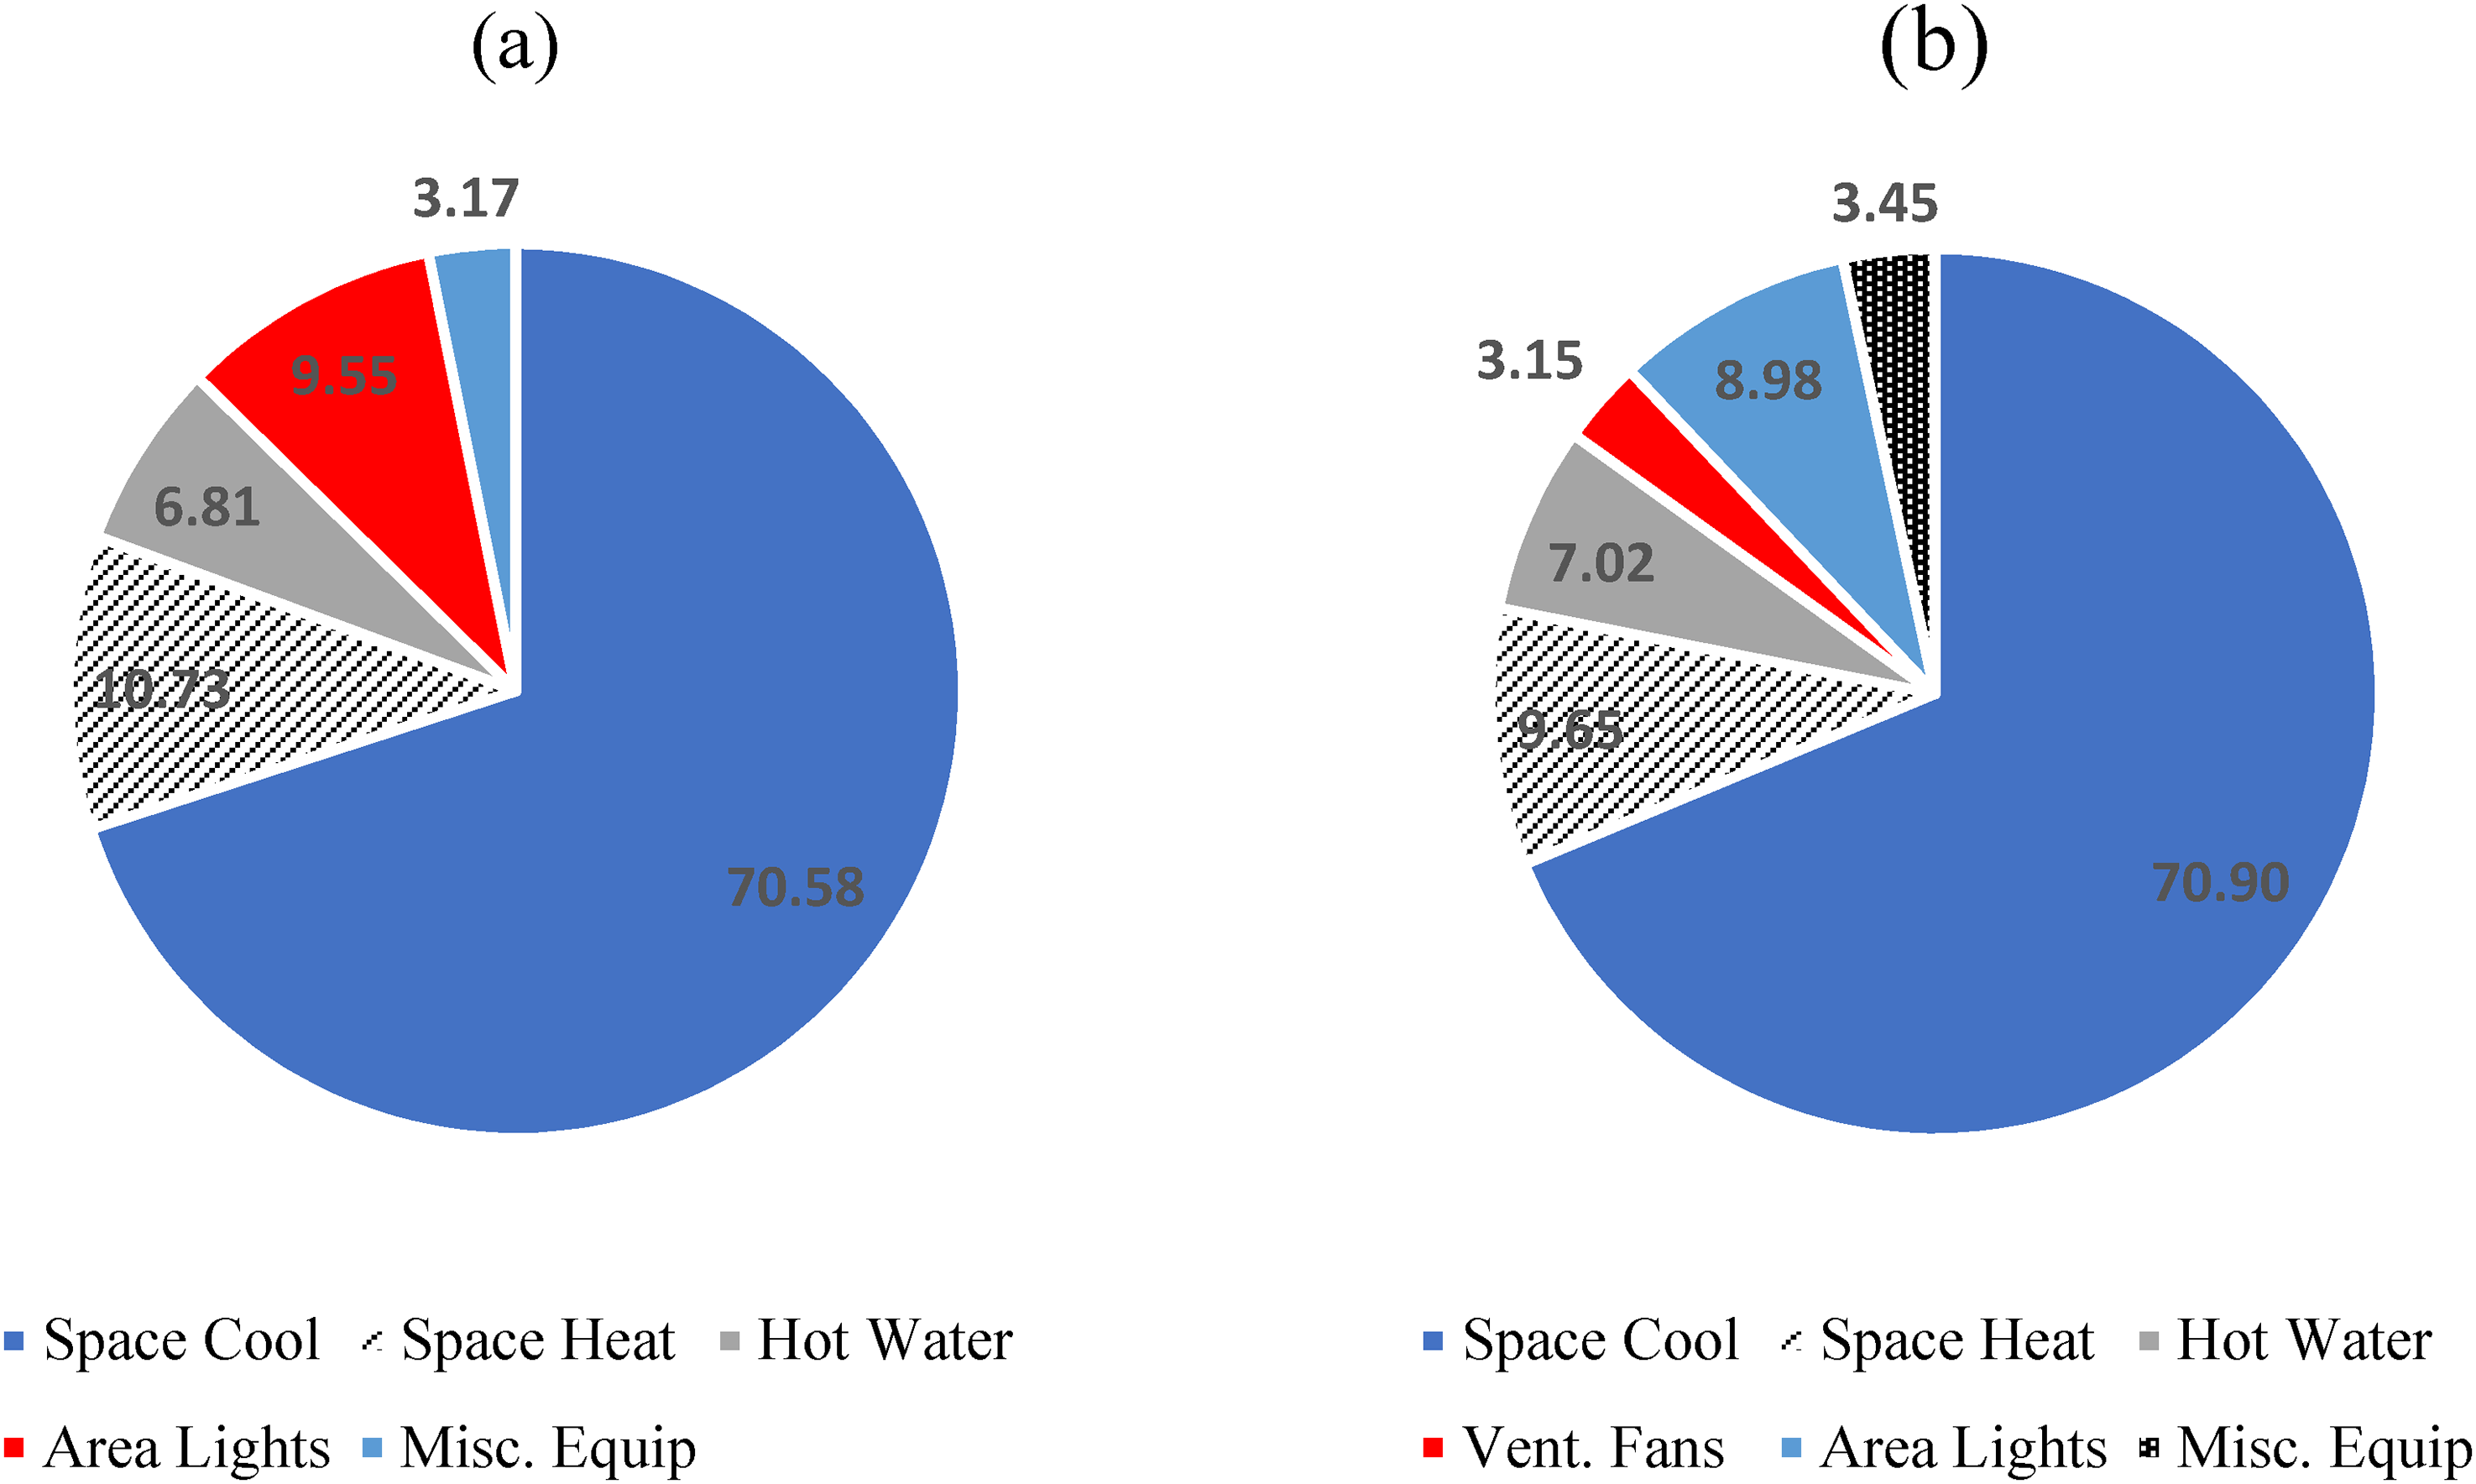
(a) Al-Khashil (b) Al-Jamil average annual energy end-use distribution.
Validation program results
The simulations were carried out using DesignBuilder software for both the base-case energy calculations and the energy calculations of energy-saving measures. Real-life electrical bills for Al-Khashil and Al-Jamil were acquired to validate the modeling results. However, it was not possible to extend the sample size due to issues with data collection and recording, and coronavirus disease 2019 (COVID-19) rendered the 2020-year findings illogical, so the 2019 year was chosen as the baseline. The electrical energy usage in 2019 was obtained from the mosque's monthly electric bills. Figure 7 shows that the trend of the modeling findings was mostly consistent with the observed energy consumption results. Annual simulation results of electricity for Al-Khashil were 161.568 and 38.408 MWh for Al-Jamil.
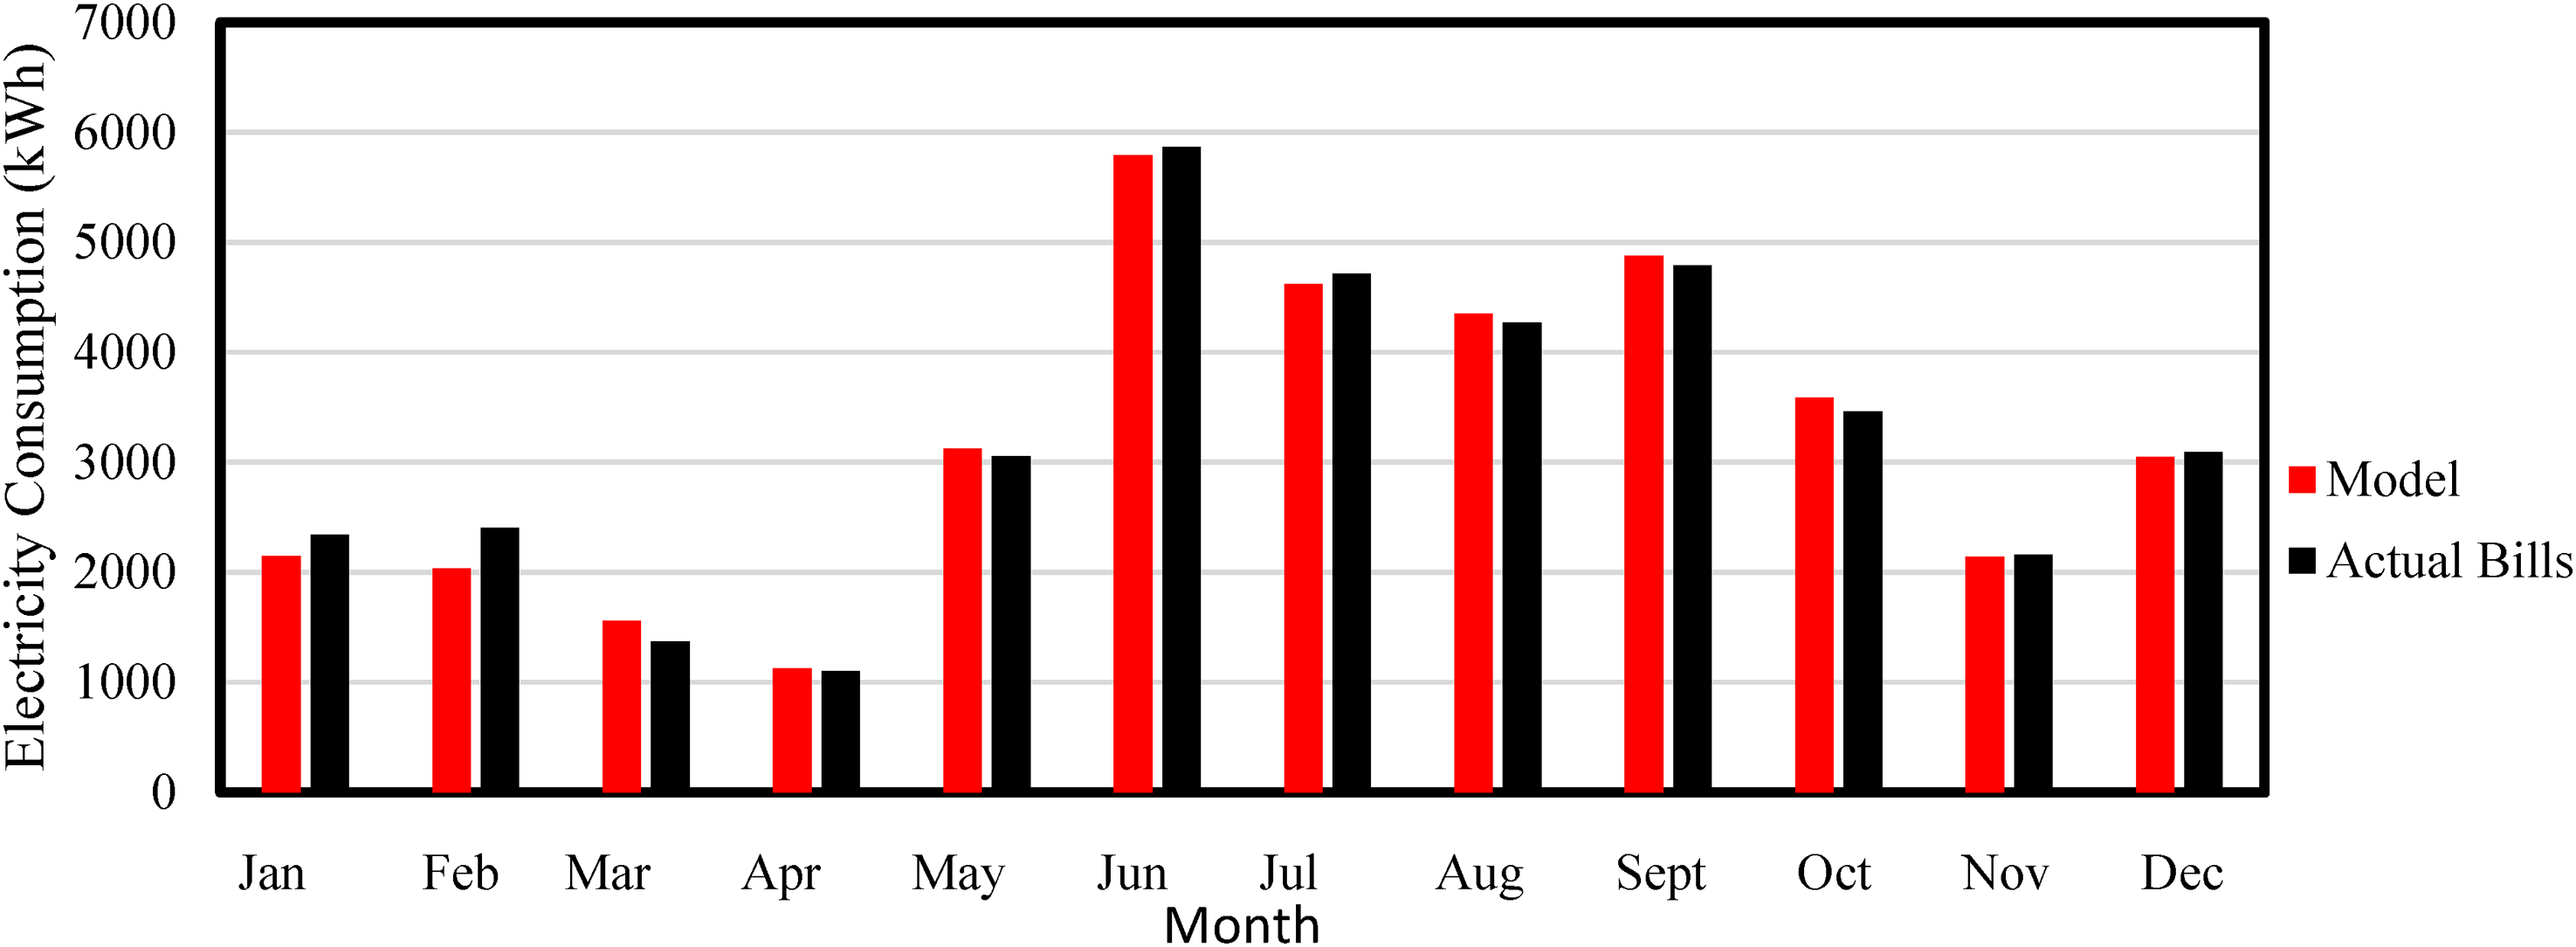
Al-Khashil numerical model vs actual bills for 2019.
Effect of COVID-19 on electricity consumption
Figure 8 shows the electricity consumption for Al-Khashil in 2019 and 2020 as COVID-19 spreading affected the number of prayers and consequently electricity consumption. Nevertheless, the maximum value has been recorded in August, while the minimum value was recorded in February. In the first months of 2020, the values were close because precautionary measures were not taken. After that, the real effect of COVID-19 has been observed in the summer months, as the maximum percentage difference between 2019 and 2020 is approximately 90% in July and 61% in August, which also describes the early fear of COVID-19. After that, the occupancy started to get higher again, reaching a minimum percentage difference of approximately 30% in November. Consumption differences have been recorded at 58,737 kWh, which is equivalent to an annual difference of 39.9%.
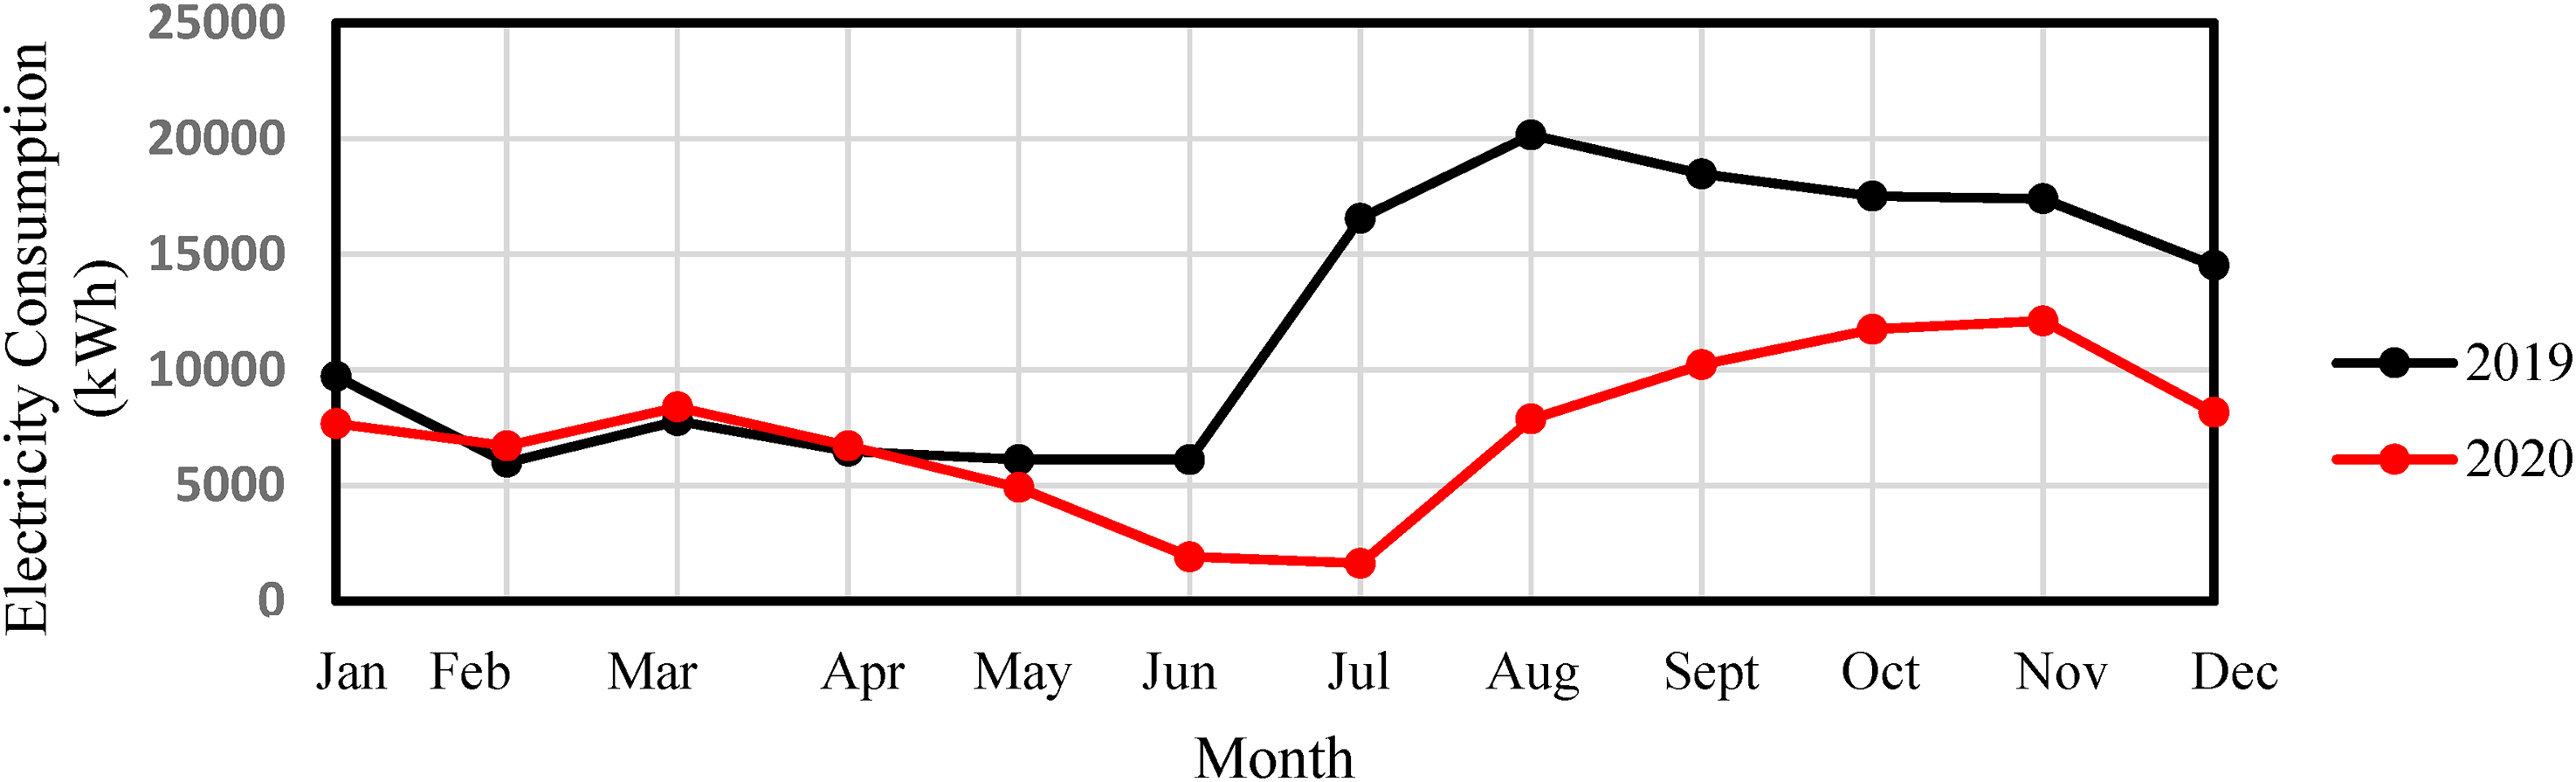
Effect of coronavirus disease 2019 (COVID-19) on electricity consumption for Al-Khashil in 2019 and 2020.
Evaluation of the effect of different meteorological data
To evaluate the effect of the difference between all presented meteorological data, a verification model of all data has been carried out, and detailed results of electricity consumption for the two mosques have been obtained. Figure 9 shows the percentage differences in energy consumption between DesignBuilder, RETScreen, ATLAS, and the average versus the actual bills for Al-Khashil. It has been noticed that for DesignBuilder, except for February and March, the maximum difference is 9.08% in January. The negative minimum difference is −12.02% in March, while the maximum positive difference is 17.93% in February, and the average difference between those two months is 2.96%. The main reason for that difference could be a human reading error, not a weather data error. Furthermore, with RETScreen data and ATLAS data, higher differences of 28.48% and 27.24% were found in April for RETScreen and ATLAS, respectively. Hence, the DesignBuilder meteorological data has been used in the main calculation to reduce the differences between the numerical model and real-life bills.
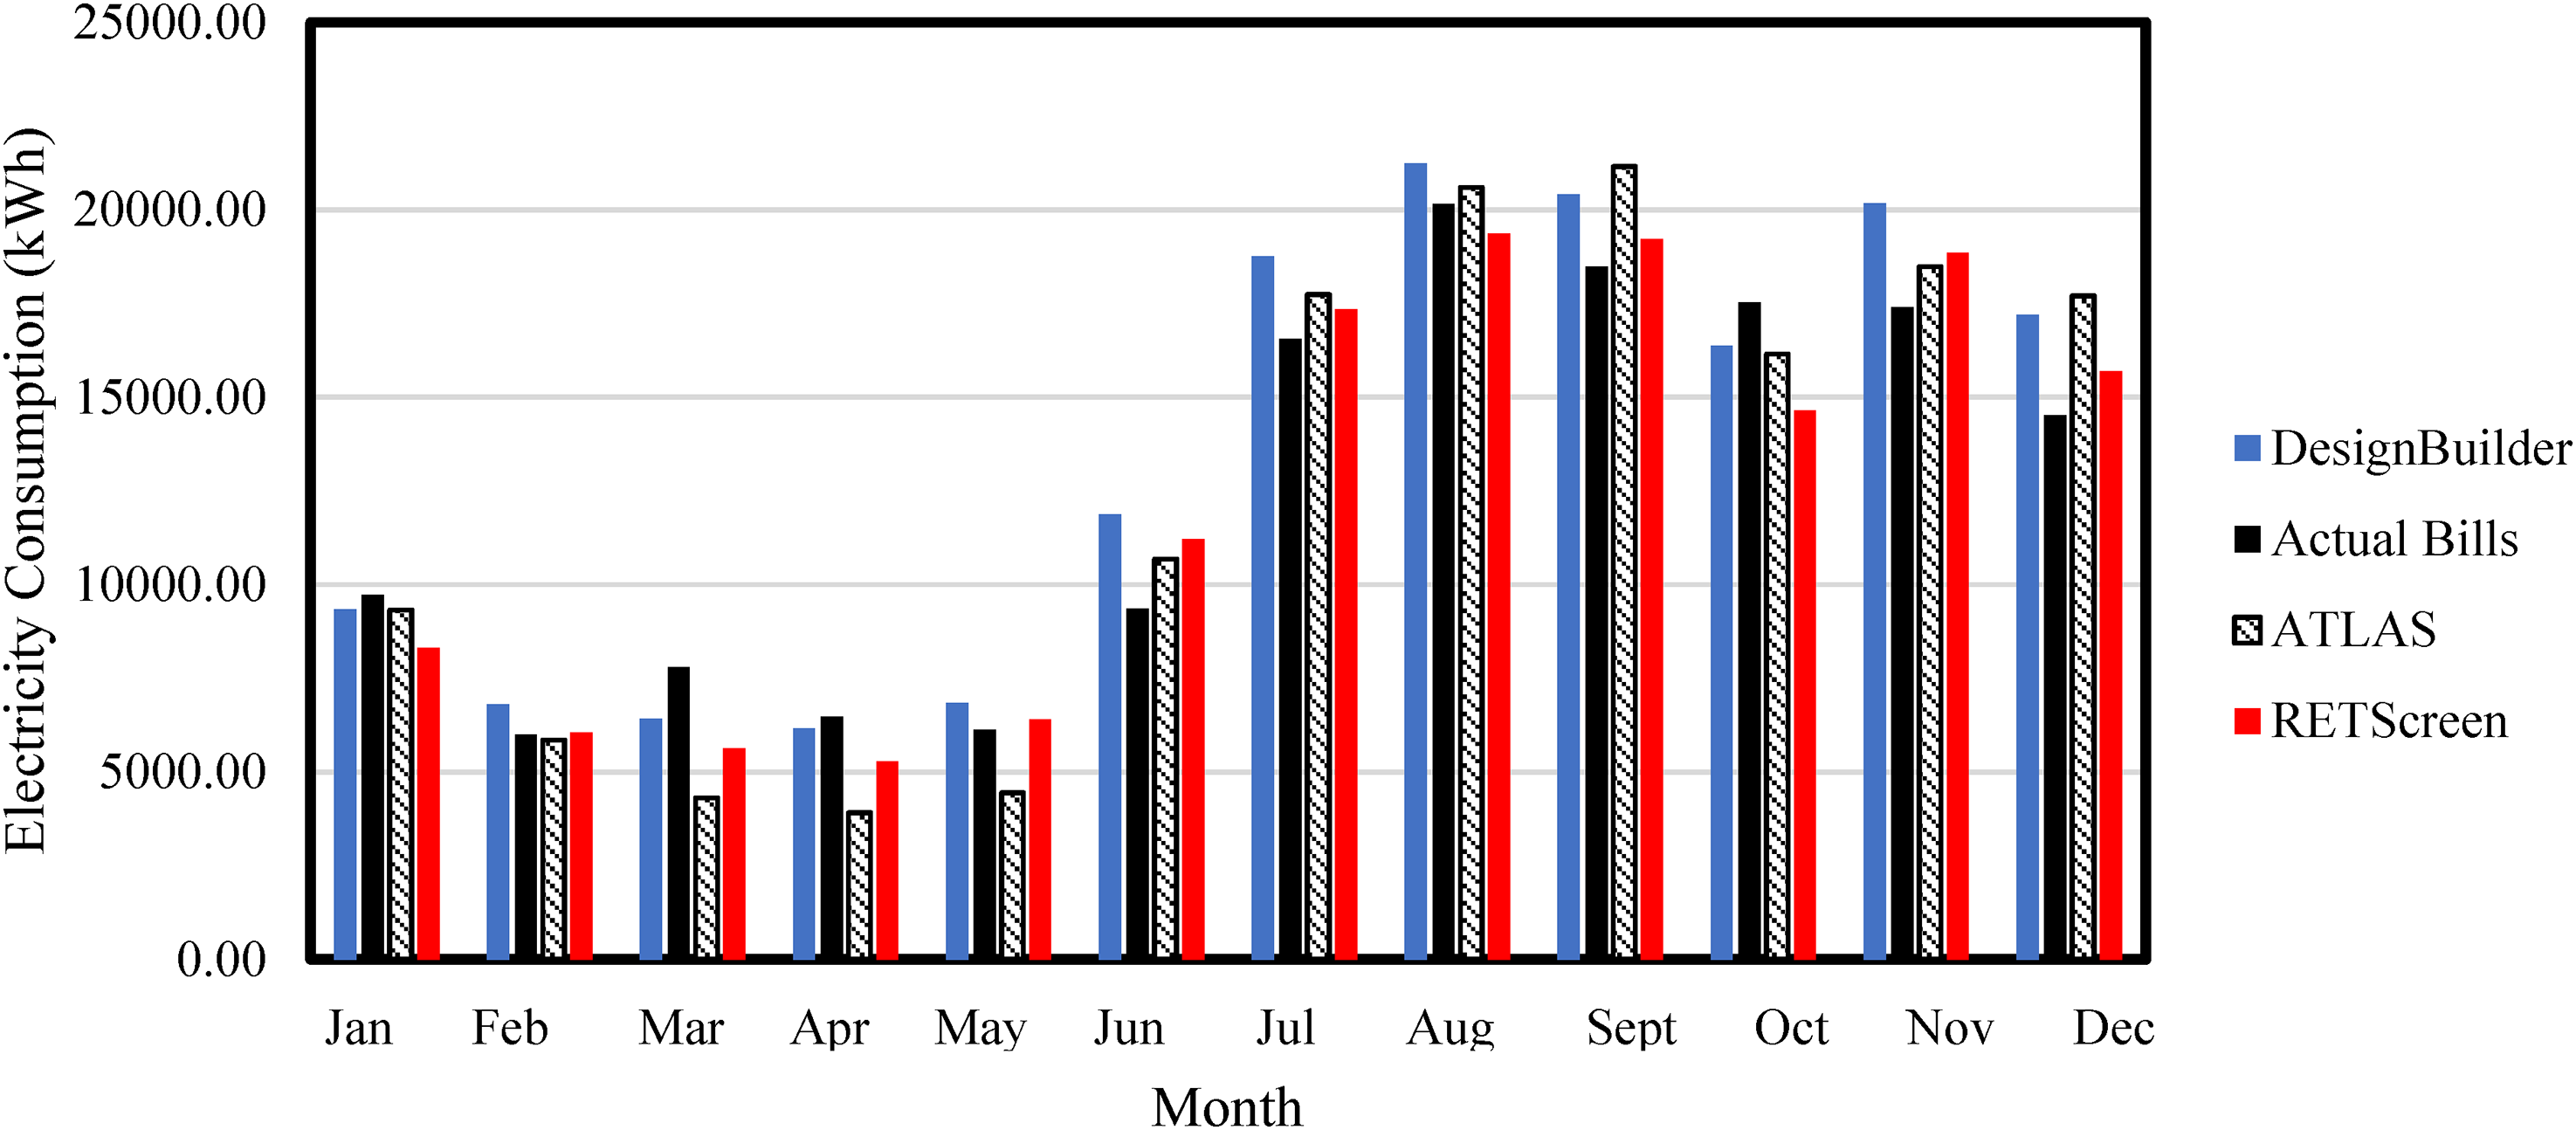
Al-Khashil electricity consumption using different meteorological data.
Energy consumption indicators
Energy use intensity
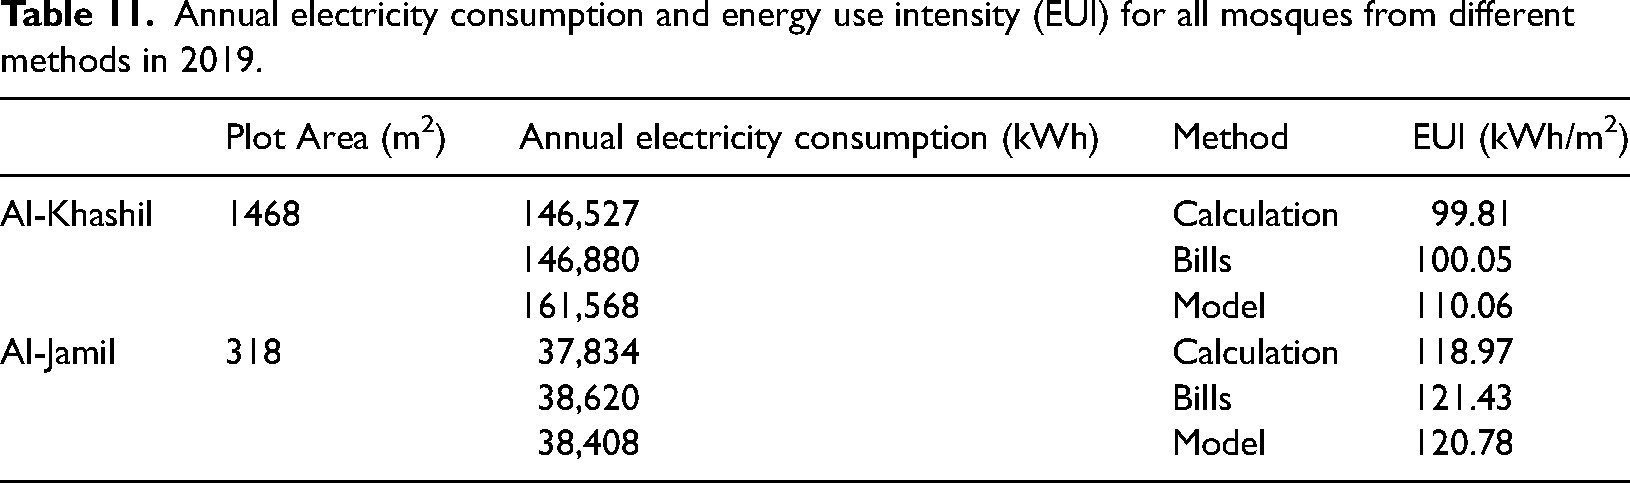
Figure 10 describes the monthly EUI for the case-study mosques using bills and model data for Al-Khashil and Al-Jamil. It is noted that the behavior of the mosques is almost identical. Table 11 shows mosque plot areas, annual total electricity consumption, and EUI for 2019 in different ways using equation (2). During the summer months, when basic electricity consumption occurs, there was a 5% variation between the actual and modeled electricity consumption figures. It is noted that the effect of the data-gaining method is completely convergent, with a difference of less than 10% for Al-Khashil and less than 2% for Al-Jamil. Worshipers’ behavior, set point temperature, and building envelope composition could be the essential reasons for the difference between readings.
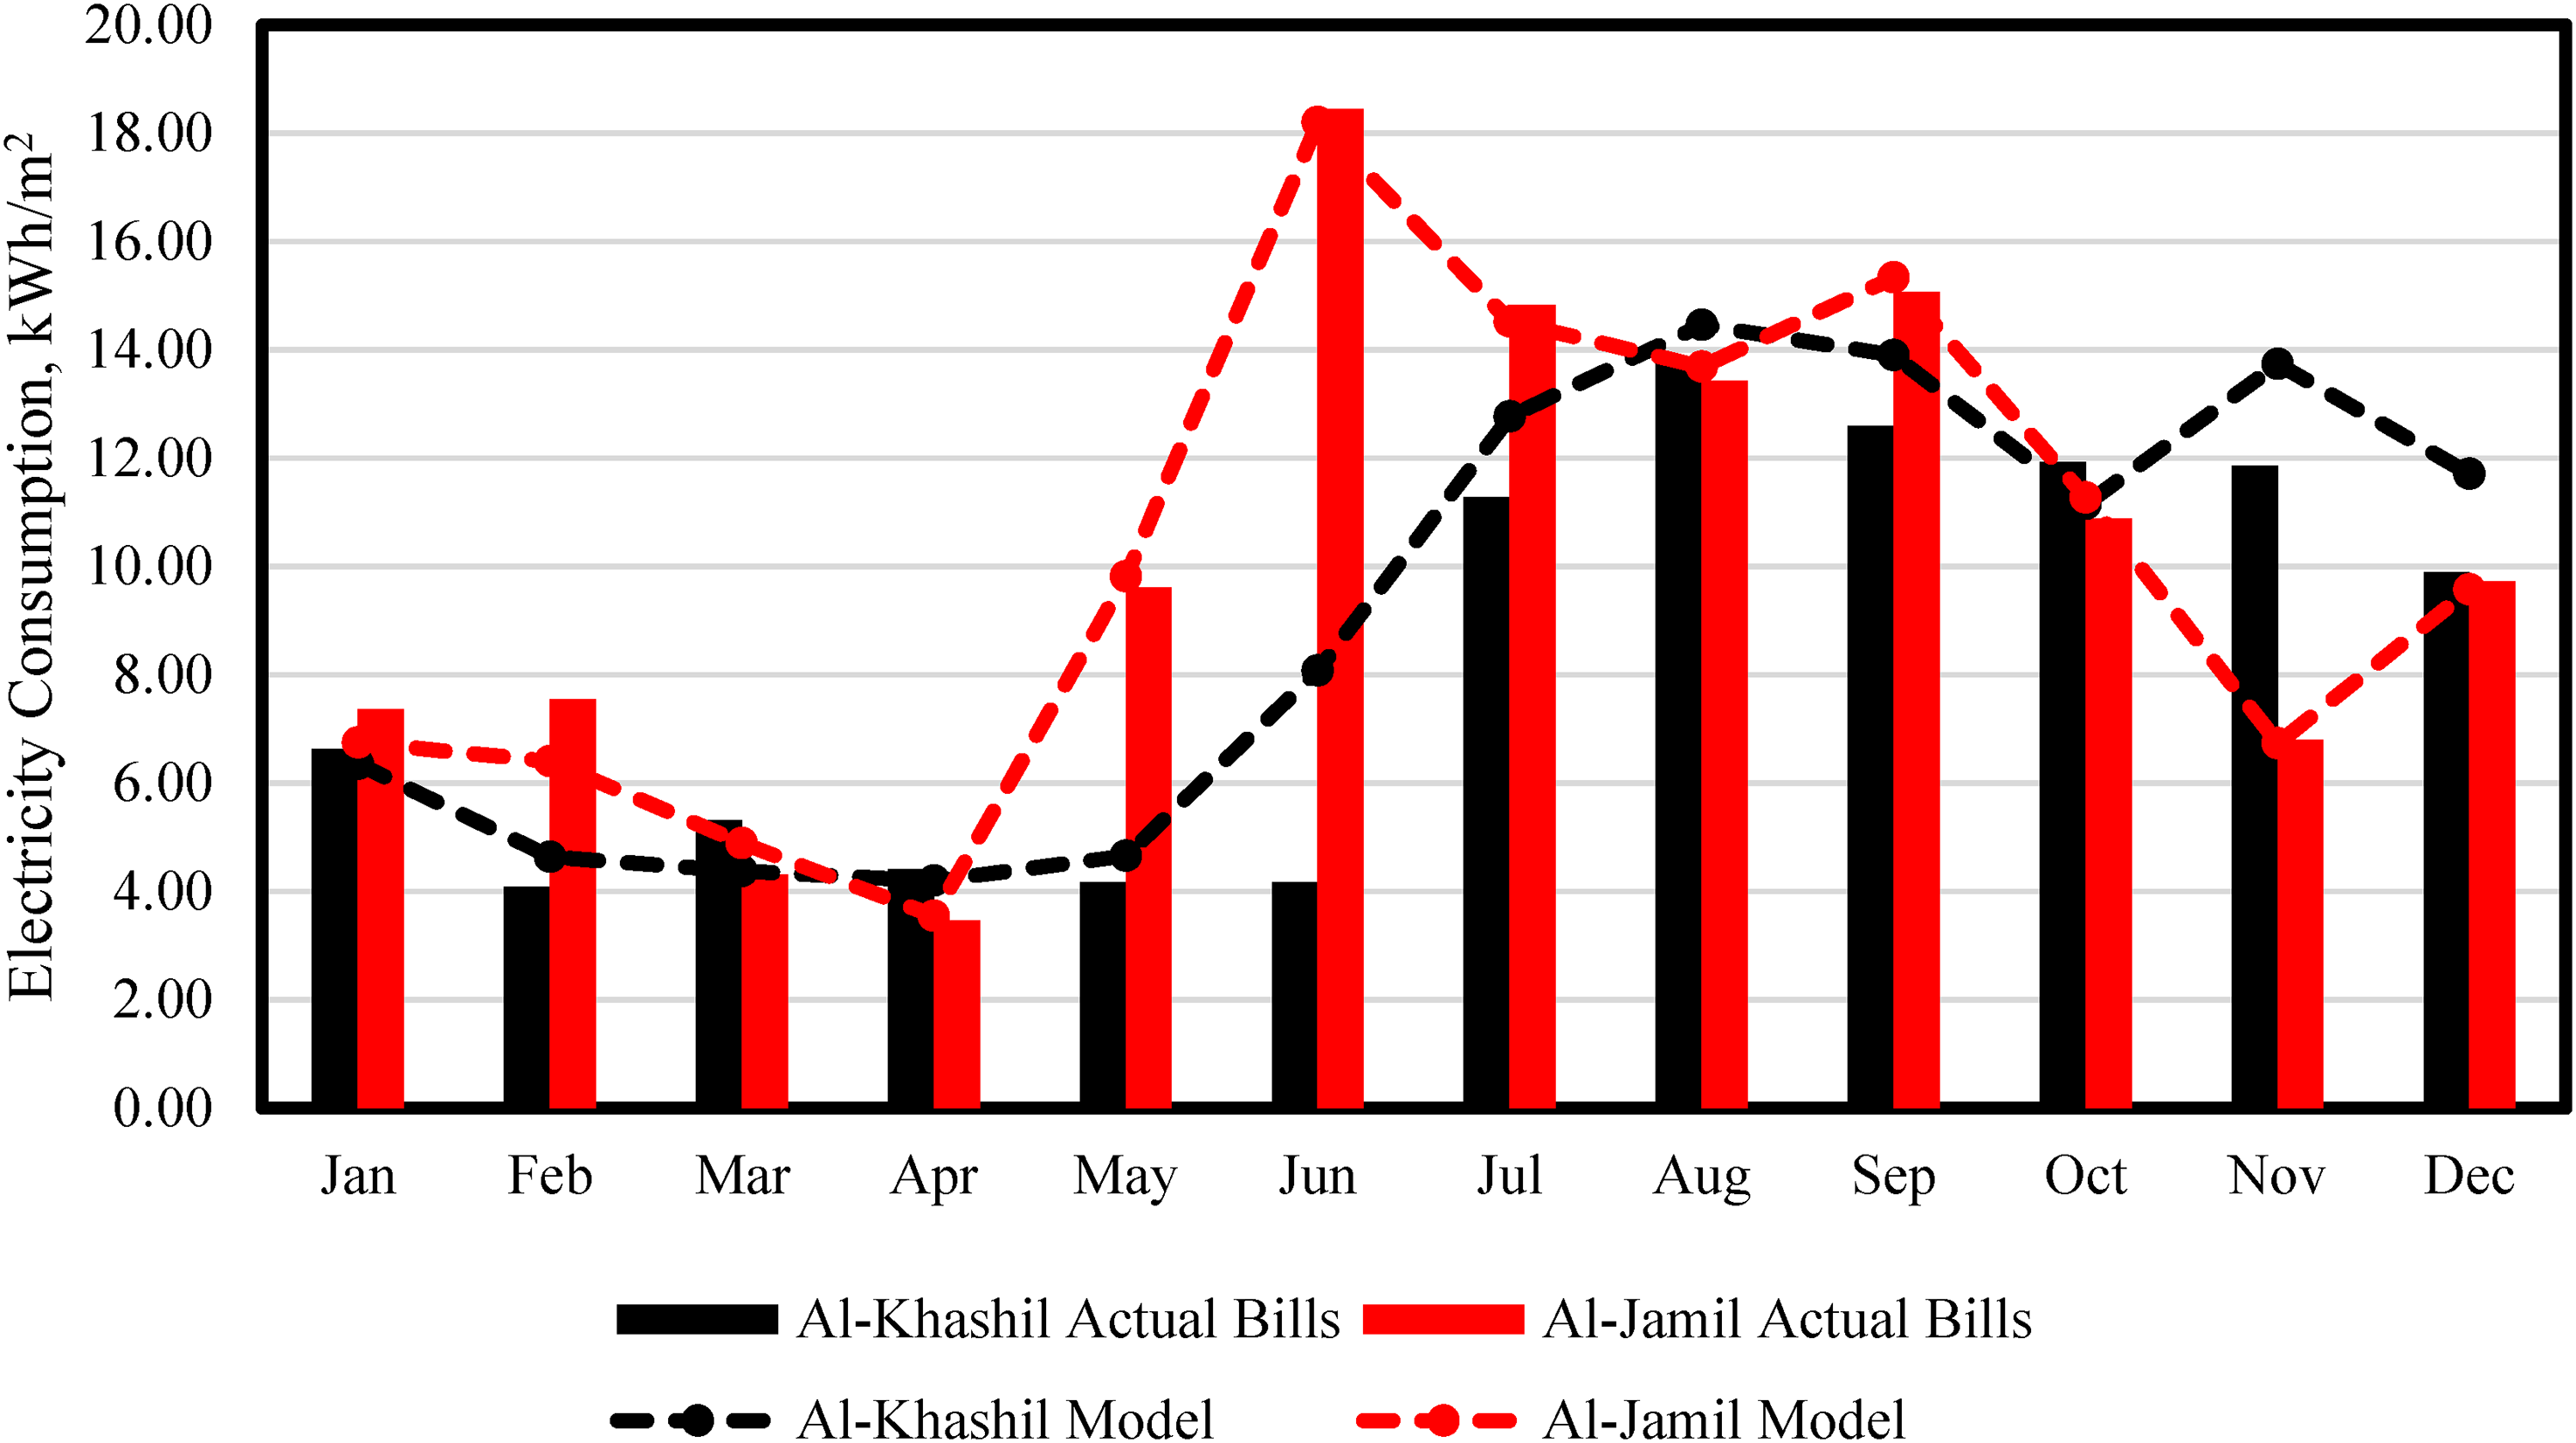
Monthly energy use intensity (EUI) for the case-study mosques using bills and model data in 2019.
Annual electricity consumption and energy use intensity (EUI) for all mosques from different methods in 2019.
As stated in Table 12, these data were then compared to earlier investigations. If the table has a range of EUI values, it is generally the consequence of implementing energy-efficient measures. It is noted that there is no agreement in the EUI values displayed; they are between 5 and 477 kWh/m2. This could be due to the following factors:
Climate conditions using heating degree days (HDD) and cooling degree days (CDD), types, forms, and sizes of mosques, the type and price of energy used, structure and age of the mosques, and users’ behavior.
HDD, CDD, and annual average EUI.
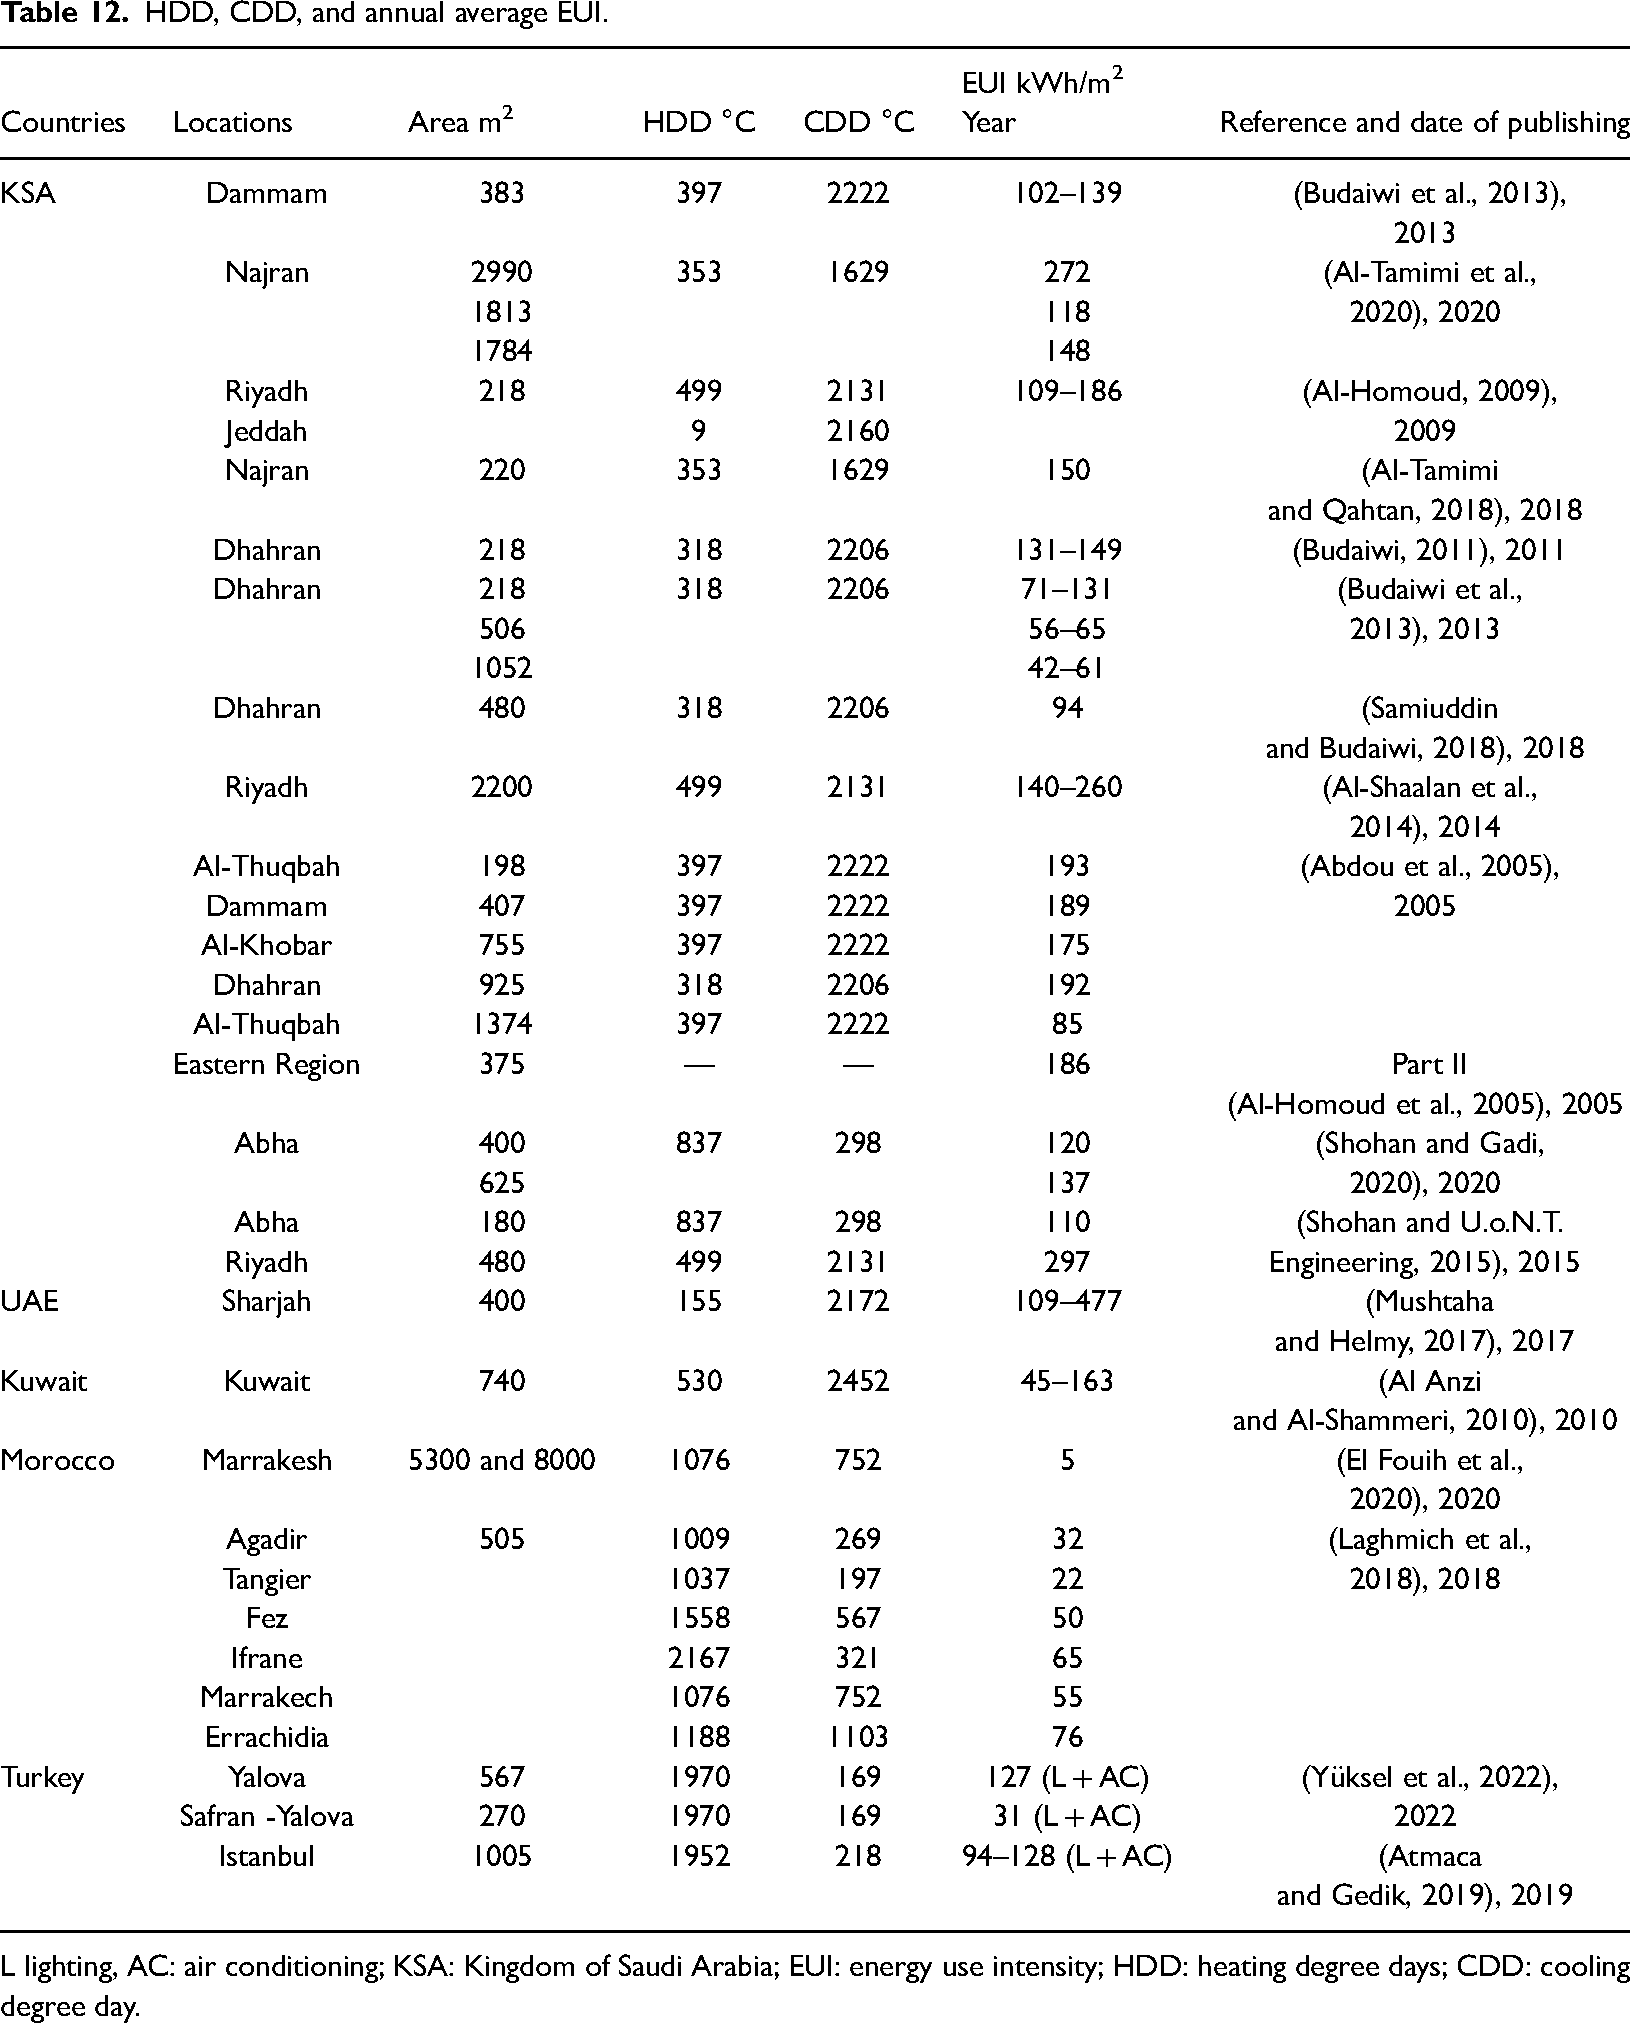
L lighting, AC: air conditioning; KSA: Kingdom of Saudi Arabia; EUI: energy use intensity; HDD: heating degree days; CDD: cooling degree day.
Based on the most recent 5-year average (2017–2021) and a base temperature of 24 and 20 °C, respectively, the HDD and CDD were estimated (Degree Days Calculated Accurately for Locations Worldwide). Based on this source, the HDD and CDD were determined for Hail at 897 and 1544 °C, respectively.
Consumption of energy per capita
Figure 11 shows a comparison of energy usage per capita between large and small mosques. It has been observed that the small mosque's electricity consumption is at its peak in June, while the large mosque's consumption is at its peak in August. Furthermore, the lowest figure for both mosques is in April, indicating that substantial power consumption occurs in summer owing to the use of the cooling system, which has a greater impact on outcomes than the heating system. Occupancy behavior, temperature, shadings, and so on could be a reason for the difference between readings, although consumption trend lines are almost the same. It has been noticed that the overall annual energy usage per capita in Al-Khashil is 1230 kWh, whereas in Al-Jamil it is 1829 kWh.
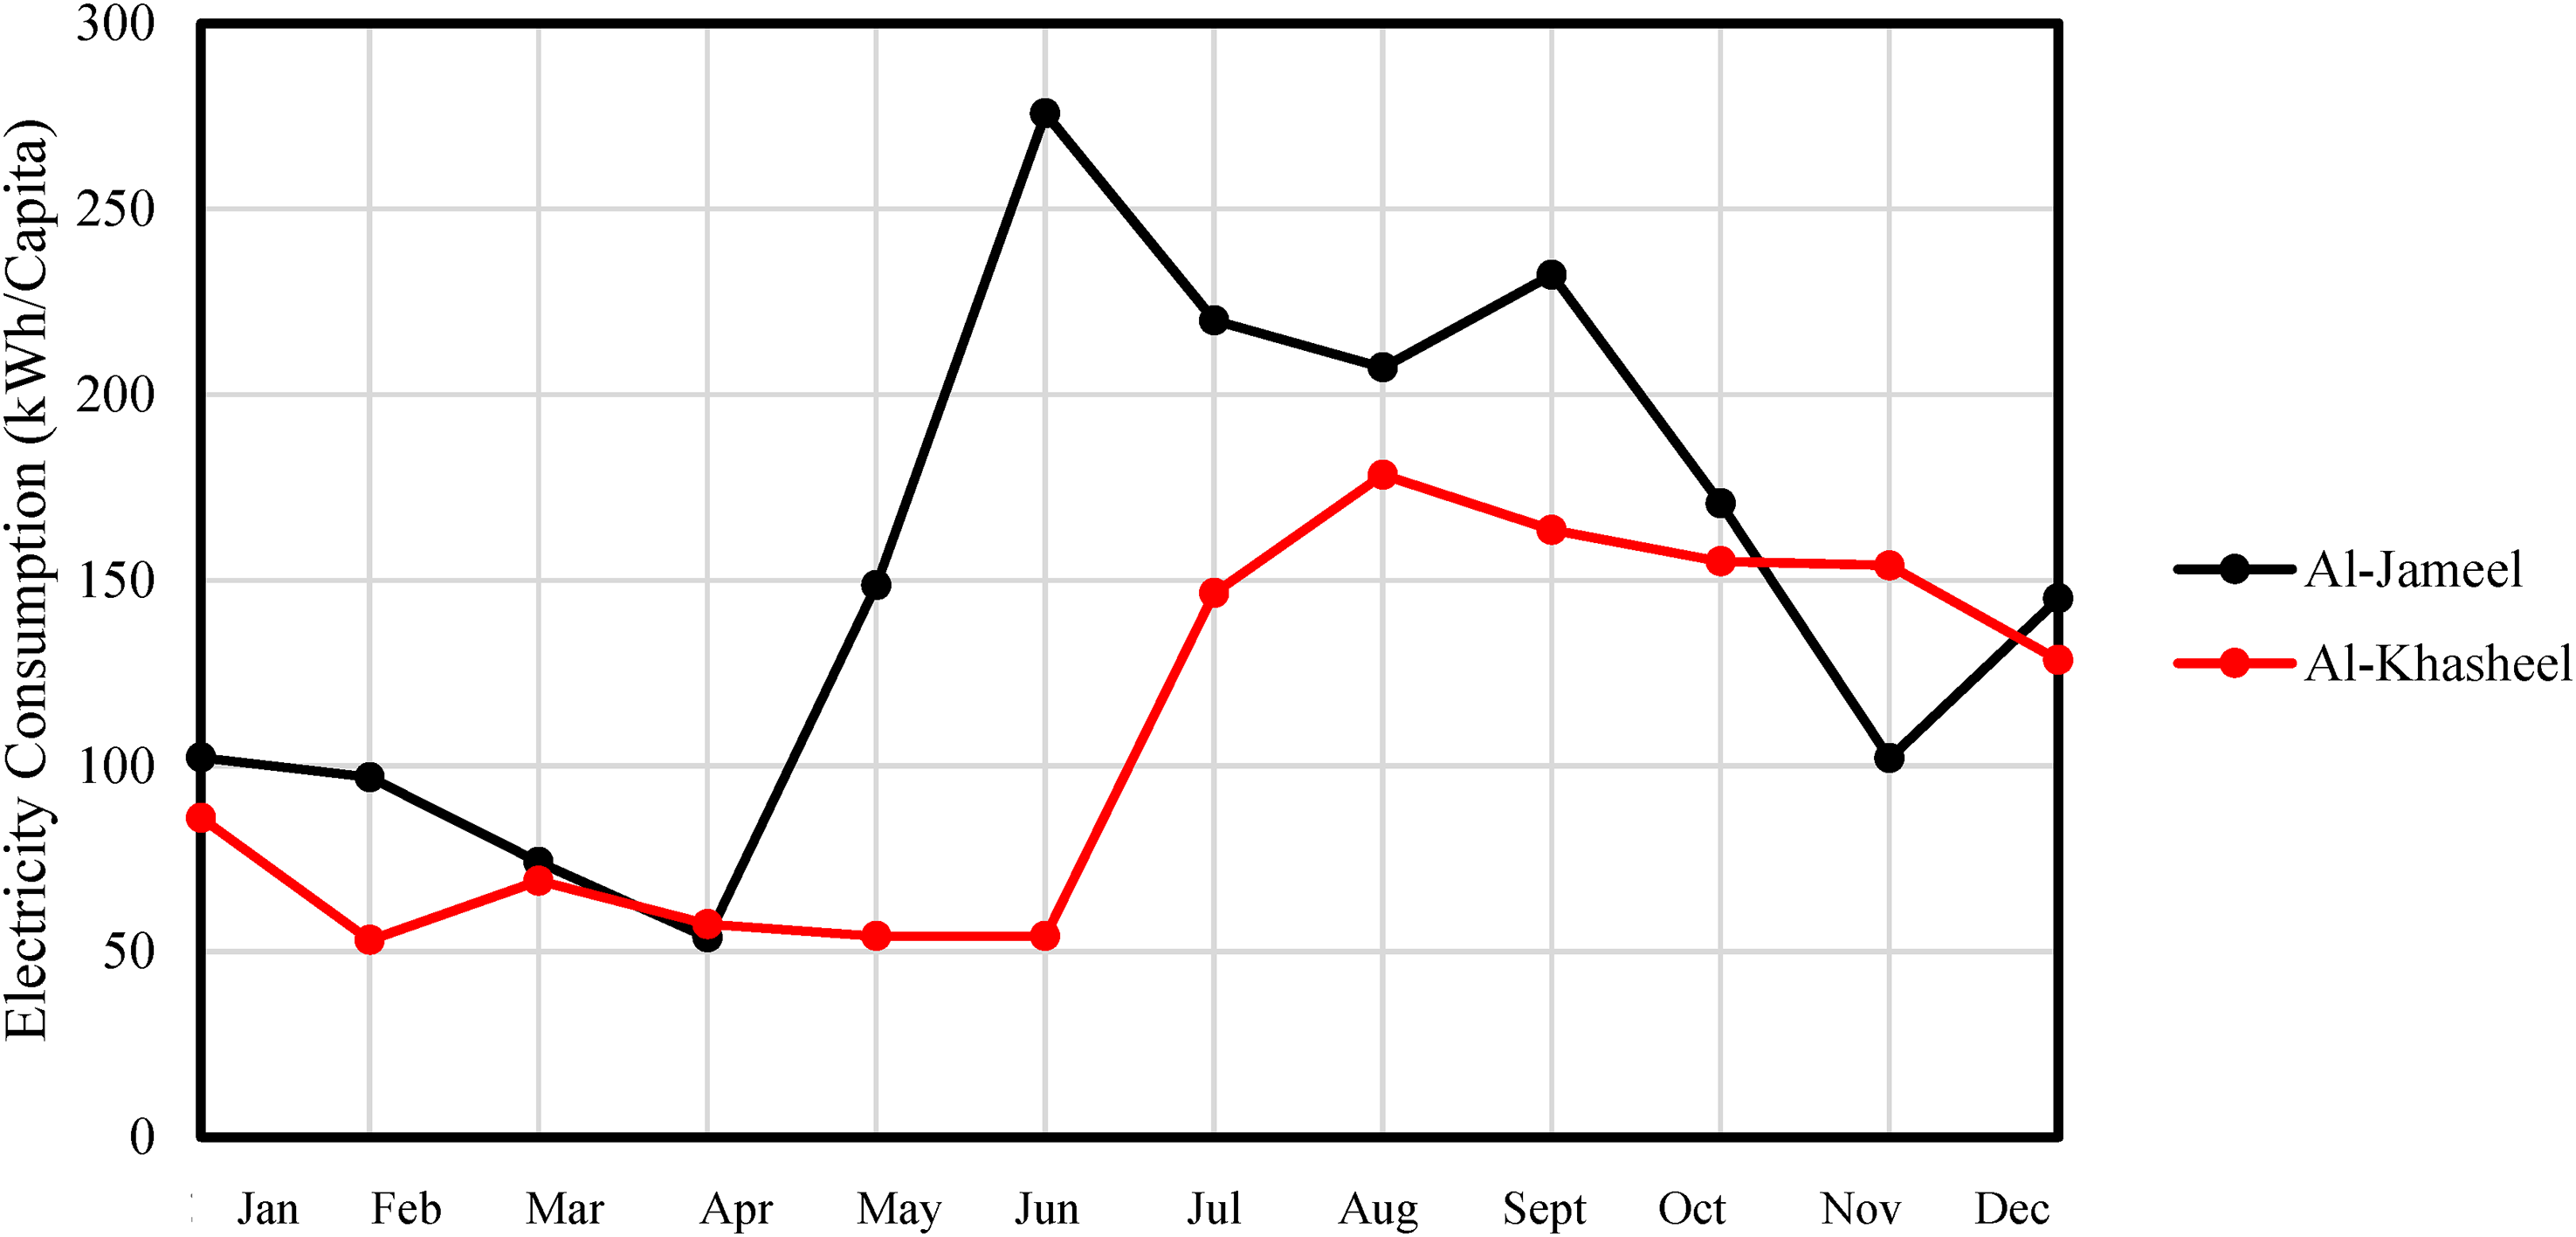
Comparison of energy consumption per capita for Al-Jamil and Al-Khashil—mosques in 2019.
Energy efficiency measures
Impact of wall insulation
For Al-Jamil, various outside wall insulation scenarios are simulated. Figure 12 depicts the result of energy savings for outside wall insulation scenarios. The results show how much energy might be saved by adjusting the exterior walls by adding different types and thicknesses of insulators while leaving the internal walls alone. Also, two insulation approaches have been simulated: the first is to insulate the wall internally, while the second is to insulate the wall outside; no effect was observed, so the study continued with internally insulated walls for the remainder of the results.
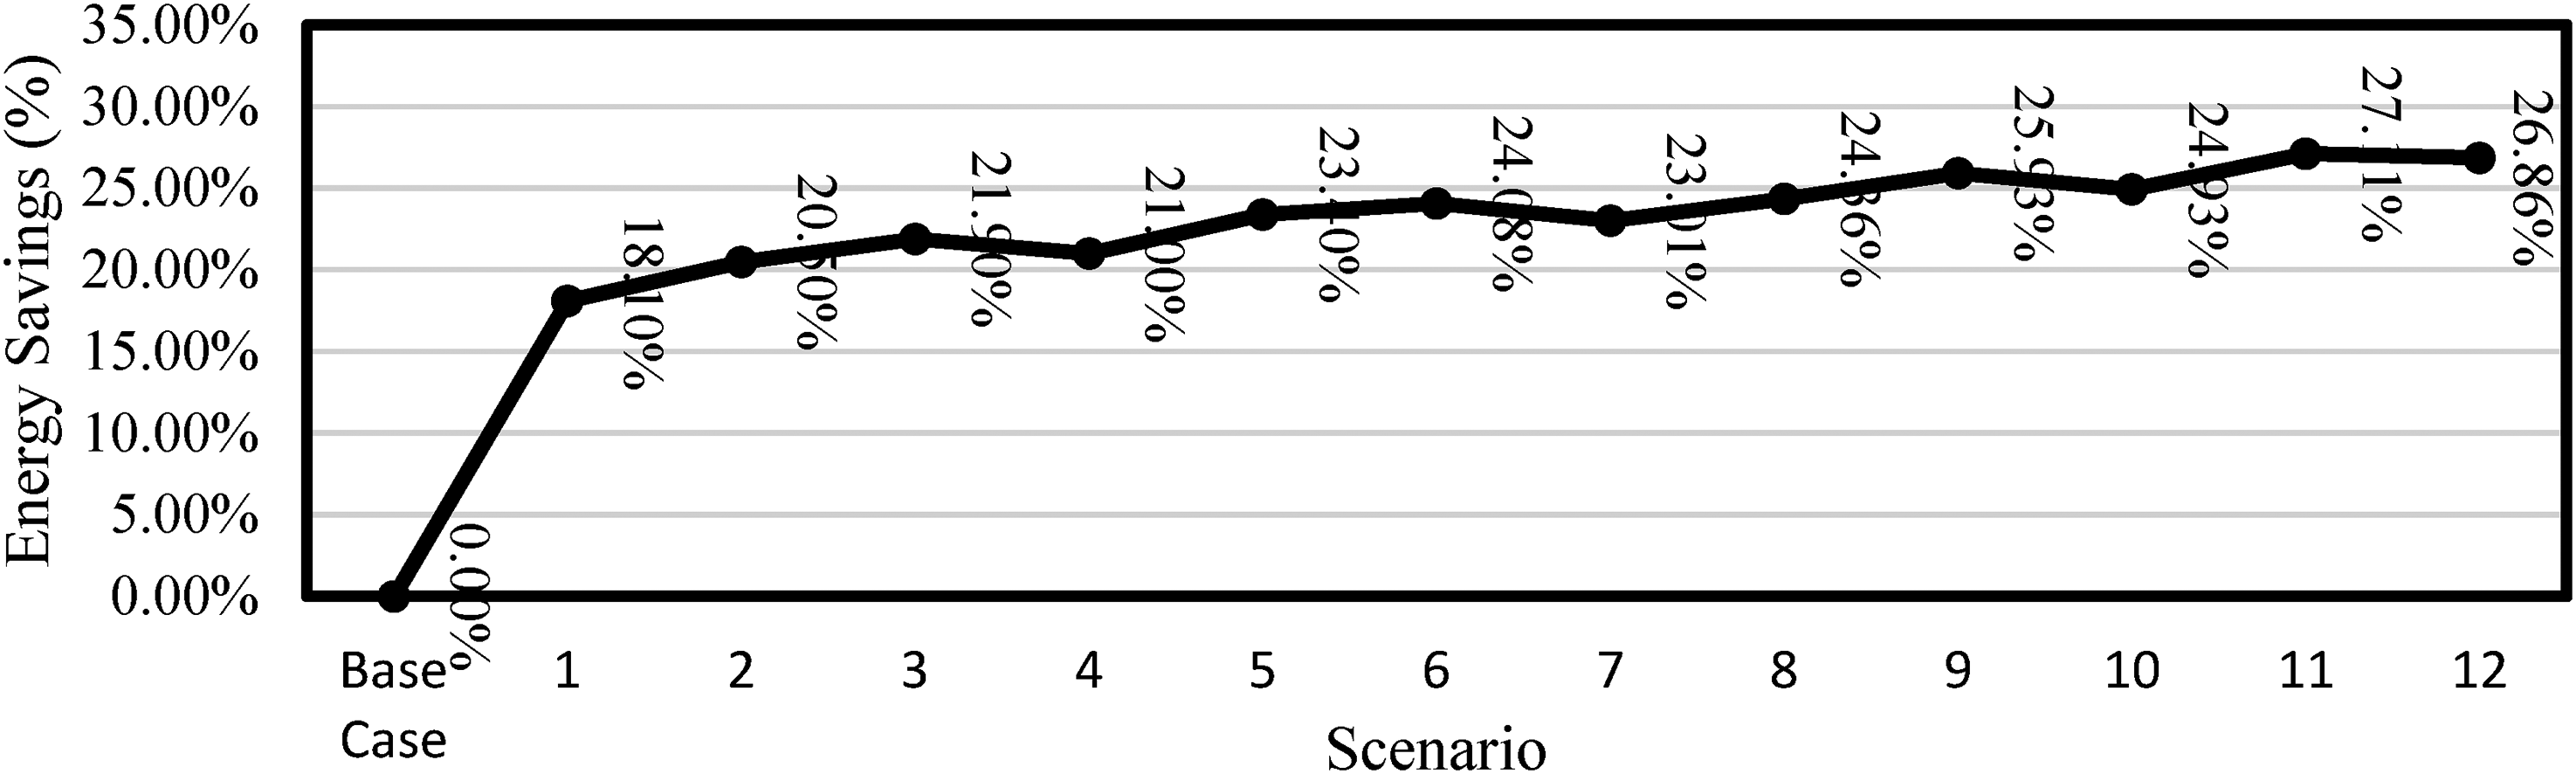
Different wall insulations’ effects on energy savings.
The wall with 3 inches of polyurethane offers the best energy savings of all the wall construction scenarios for Al-Jamil. Al-Jamil saves up to 27.11% of energy. There are minor variations for Al-Khashil that have been neglected as the mosque is already insulated. The Al-Jamil findings are congruent with the literature study, demonstrating equivalent energy savings achieved by strengthening wall thermal resistance. Because numerous characteristics may differ or not be included in these experiments, the results reveal bigger energy savings than those reported by (Alaidroos and Krarti, 2015). Scenario 9 depicts the SBC 601 specified external wall R-value, which can reduce energy consumption by 24.36% for Al-Jamil. R-values on outside walls that are higher than average do not considerably reduce energy consumption. However, the findings demonstrate a substantial and positive impact on energy savings when comparing walls with an insulation value of scenario 4 or higher to uninsulated walls for construction in the central region of the KSA.
Impact of roof insulation
For Al-Jamil, various roof insulation scenarios are simulated. Figure 13 shows the energy savings achieved by raising the thermal resistance value. Figure 13 shows the energy savings achieved when just the roof is modified by adding different types and thicknesses of insulators, while all other parameters remain constant. Al-Jamil had the greatest energy savings with scenario 11, saving 13.0%. There is a minor difference in the quantity of energy saved, as shown in Figure 13. Adding 3 inches of polyurethane to the roof structure decreases energy consumption by 13.06% in the Al-Jamil simulation, compared to 12.97% and 12.93% for polystyrene and rockwool, respectively. The roof savings are lower than those observed in studies by Alaidroos and Krarti (2015) and Wahl (2017), where Al-Jamil saves up to 13.06% when compared to an uninsulated roof. Building features such as the roof area and structure, as well as the volume of the building, have a significant effect on how much energy is conserved by installing roof insulation, which may explain the variance in energy savings. According to SBC 601, a roof must meet minimum thermal resistance norms of 5 m2 K/W. The roof in Scenario 11 is rated to have an R-value of 3.80 m2 K/W, which is just below the R-value required for roofs. Nevertheless, as previously shown, it has the potential to save up to 13.06% of energy. As a result, the minimal standardized R-value for a mosque roof is unlikely to contribute significantly to energy savings. Moreover, when Scenario-4 or above-rated insulation values are compared to uninsulated, the outcome shows a beneficial and significant effect on energy savings for mosque structures in the KSA's central area.
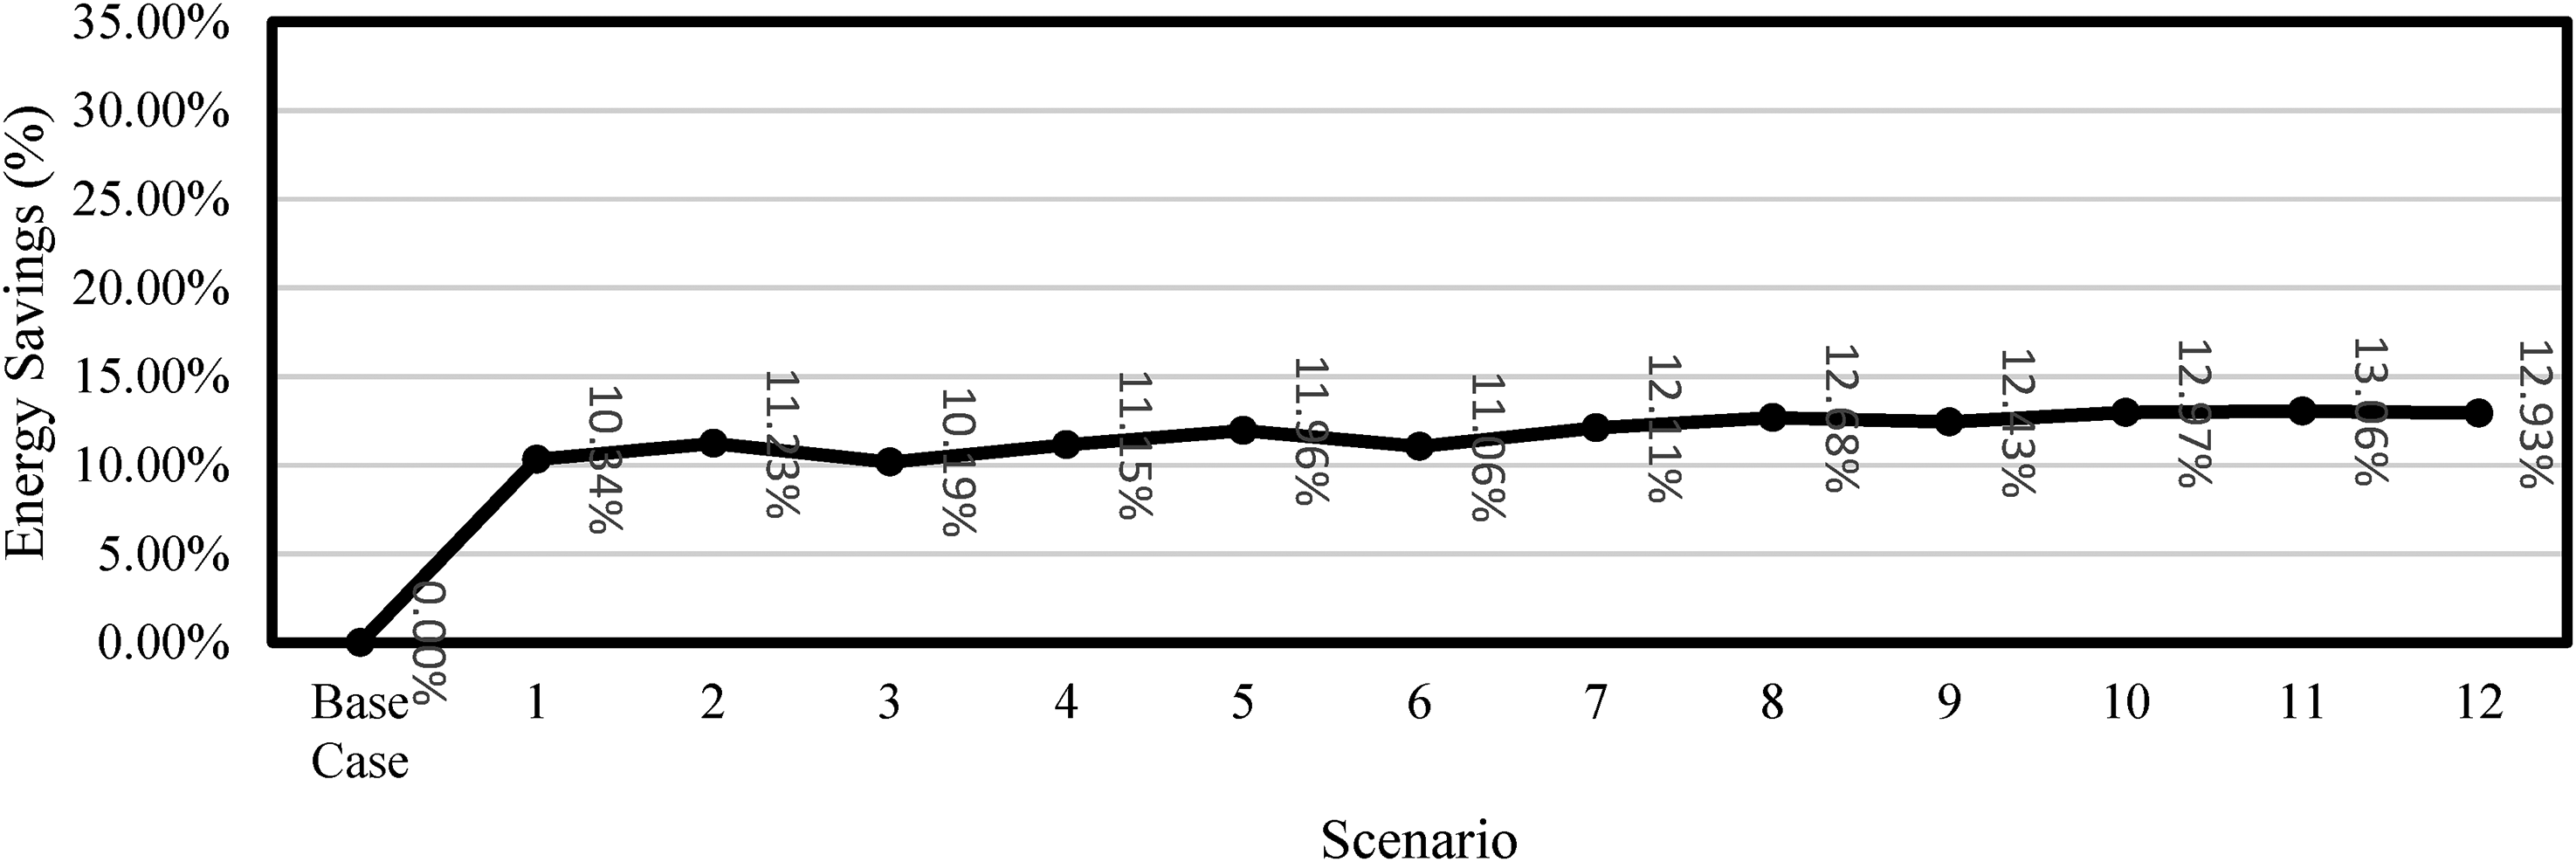
Different roof insulations’ effects on energy savings.
Window types
For triple glazing, Al-Khashil and Al-Jamil save the most money at 6.06% and 6.58%, respectively. However, these outcomes equate to energy savings from double glazing of 4.79% and 5.11% for Al-Khashil and Al-Jamil, respectively. Al- Khashil's savings are consistent with those published in Alaidroos and Krarti's (2015) study.
Window wall ratio
When planning the WWR, the amount of natural light in the building should be taken into account. The building's understudy, on the other hand, has a WWR of 14% in all directions. To study how the WWR influences energy consumption, the WWR was simulated for all facades at 30%, 25%, 15%, 10%, 8%, 6%, 4%, and 2%. The results showed that the WWR has a limited effect on energy consumption—less than 1%. These findings are comparable to those of (Ahmed et al., 2019), who found that utilizing a lower WWR had no effect. It meets with the results of (Almushaikah and Almasri, 2021), who reported 0.50%, 0.40%, 0.35%, 0.30%, and 0.20% energy savings for WWR of 2%, 4%, 6%, 8%, and 10%, respectively, for Qassim region.
Shading and blinds
The base case construction for both mosques used a variety of set window shading lengths. Energy savings arise from increased overhangs; for example, in Al-Khashil, an 80-cm overhang projection saves 3.11% of energy, while in Al-Jamil, the same overhang saves 3.83%. Because Al-Khashil and Al-Jamil have approximately identical solar radiation, this result is close. Al-Jamil and Al-Khashil showed the greatest decreases in energy use due to changes in building footprint, at a total of 4.01% and 3.14%, respectively, for an overhang projection of 100 cm. Combining darkened windows with blinds will help you save even more energy by reducing solar radiation all year. However, as previously mentioned, the amount of natural light in the construction should be considered. As a result, energy savings from shades should be evaluated against the need for daylight in the building to maintain a comfortable climate, particularly when permanent blinds are used. For both mosques, different blind types are simulated, but the other parameters remain unchanged. According to simulations of seven different types of blinds, blinds can lower energy consumption by 0.98%–1.76% for Al-Khashil and 1.33%–2.37% for Al-Jamil. When employing opaque roller blinds in medium or dark colors, you can get the greatest energy savings. The findings are in line with those published by (Almushaikah and Almasri, 2021) for horizontal blinds of light color, horizontal blinds of medium color, and roller shades of medium color, which saved approximately 0.99%, 1.39%, and 1.73%, respectively.
Exterior surface color
Since exterior surface color affects the amount of solar radiation absorbed, other steps are necessary, such as choosing a lighter-colored finishing material. In the case study, choosing a white finish color for the basic case instead of a medium-light hue lowered the energy usage by 4.94% and 6.45% for Al-Khashil and Al-Jamil, respectively. The results are consistent with those given by Wahl (2017) and Ahmed et al. (2019). It also corresponds to those reported by Almushaikah and Almasri (2021), which indicate 4.63%, 0.44%, −2.60%, and −5.70% for white, yellow, gray, and dark exterior surface color, respectively, for Qassim region near Hail.
Lighting and HVAC systems
As a measure of an efficient lighting system, the building under investigation has an incandescent lamp system of 50 W and a fluorescent lamp system of T5 36 W. However, utilizing LED-type lighting may cut overall energy consumption between 5.25% and 8.59%; see Table 13. By utilizing LED-type lighting, annual energy savings of 9640 kWh and from HVAC systems of about 1540 kWh are achieved. The whole initial investment of 1250 SR resulted in an annual savings of almost 2012 SR. The SPBT ranges from 3 to 8 months for each appliance, as shown in Table 13. Note that all prices are acquired from the local market.
Lighting upgrade summary.
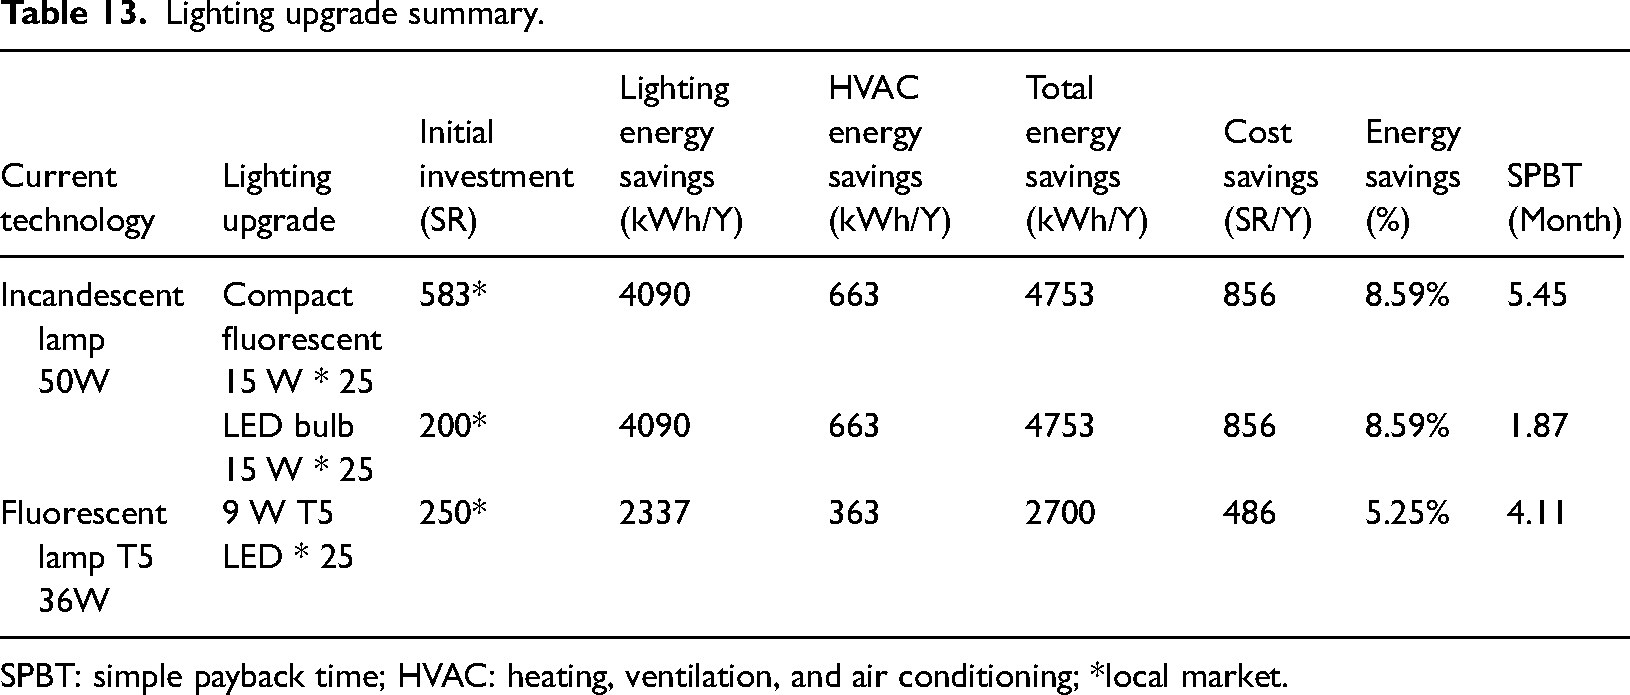
SPBT: simple payback time; HVAC: heating, ventilation, and air conditioning; *local market.
It is preferable to choose air conditioners with high efficiency to save energy consumption instead of cheap ones. In Al-Jamil, a window-type AC with a heat pump and an EER of 7.6 is utilized, whereas central AC is used in Al-Khashil. According to Table 14, for Al-Khashil and Al-Jamil, switching to a split-type AC with a higher EER decreased overall energy use by 34.41% and 31.72%, respectively. Upgrading from an EER of 5.11 to 10.23 can cut energy usage in the KSA by 35%, according to (Ahmed et al., 2019). The annual savings from switching to a high-efficiency air conditioner with a 13.20 EER can reach 3235 SR and 2836 SR for Al-Khashil and Al-Jamil, respectively. Simple payback takes six to eight years to complete.
HVAC upgrade.
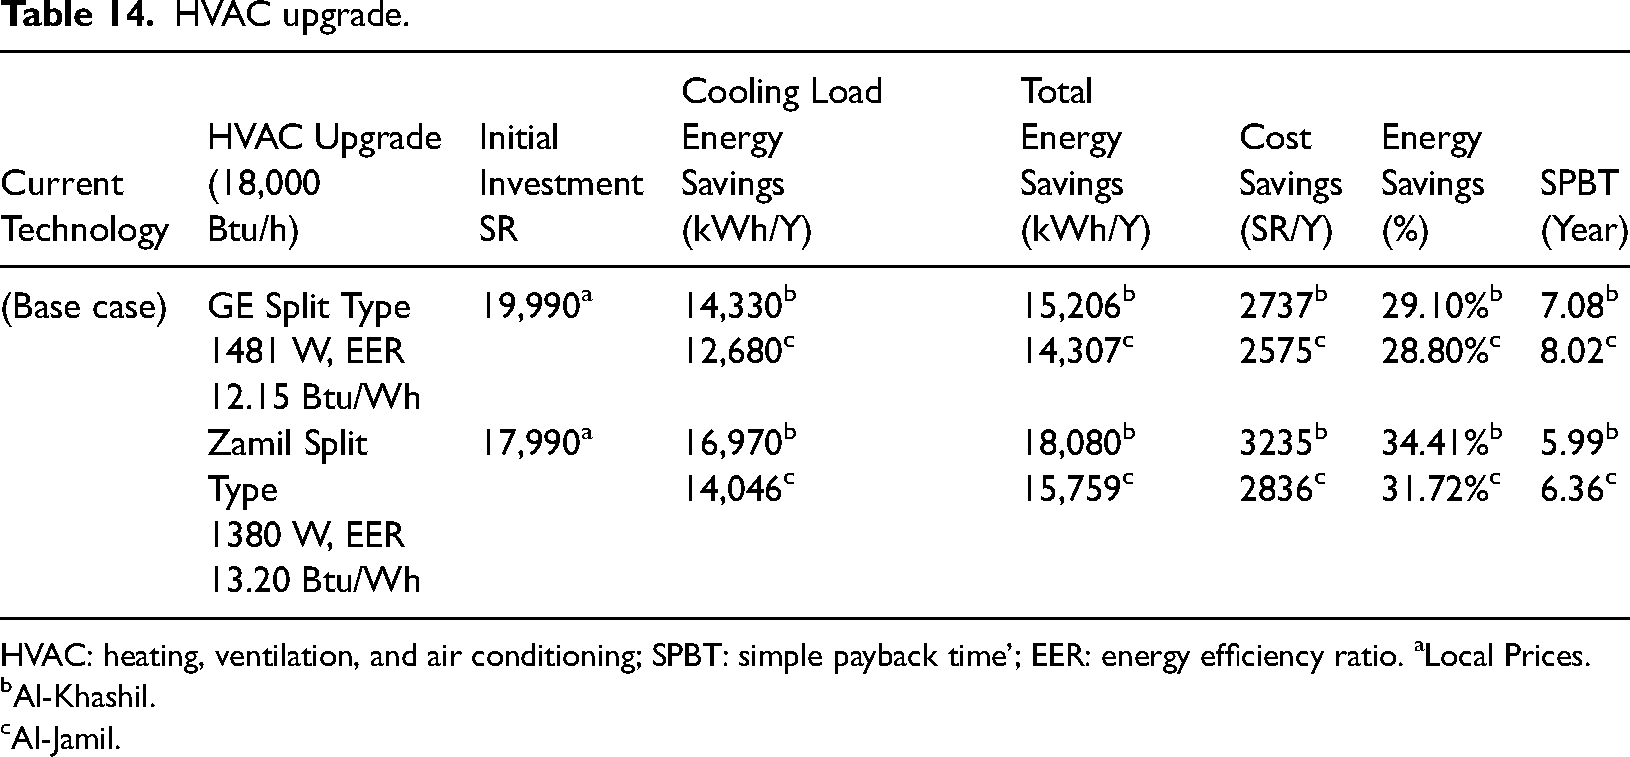
HVAC: heating, ventilation, and air conditioning; SPBT: simple payback time’; EER: energy efficiency ratio. aLocal Prices.
Al-Khashil.
Al-Jamil.
Summary of each measure and combination of all measures
The largest energy savings for each measure relative to the baseline are shown in Table 15, along with the total energy savings from all efficient measures taken together. A high EER HVAC system, scenario 11 external wall insulation, scenario 11 roof insulation, and triple LOE clear argon glazing are the most effective EE solutions, reducing energy consumption by 34.4%, 0%, and 6.06% for Al-Khashil and 31.72%, 13.06%, and 6.58% for Al-Jamil, respectively. Because the KSA gets a lot of sunshine, the most important aspect in determining the eventual energy usage is the overall envelope R-value, which is defined by the wall and roof section components as well as the glass type. It can be seen from the table that 51.25% and 91.16% of the total energy can be saved in Al-Khashil and Al-Jamil, respectively.
Summary of each measure and combination of all measures.
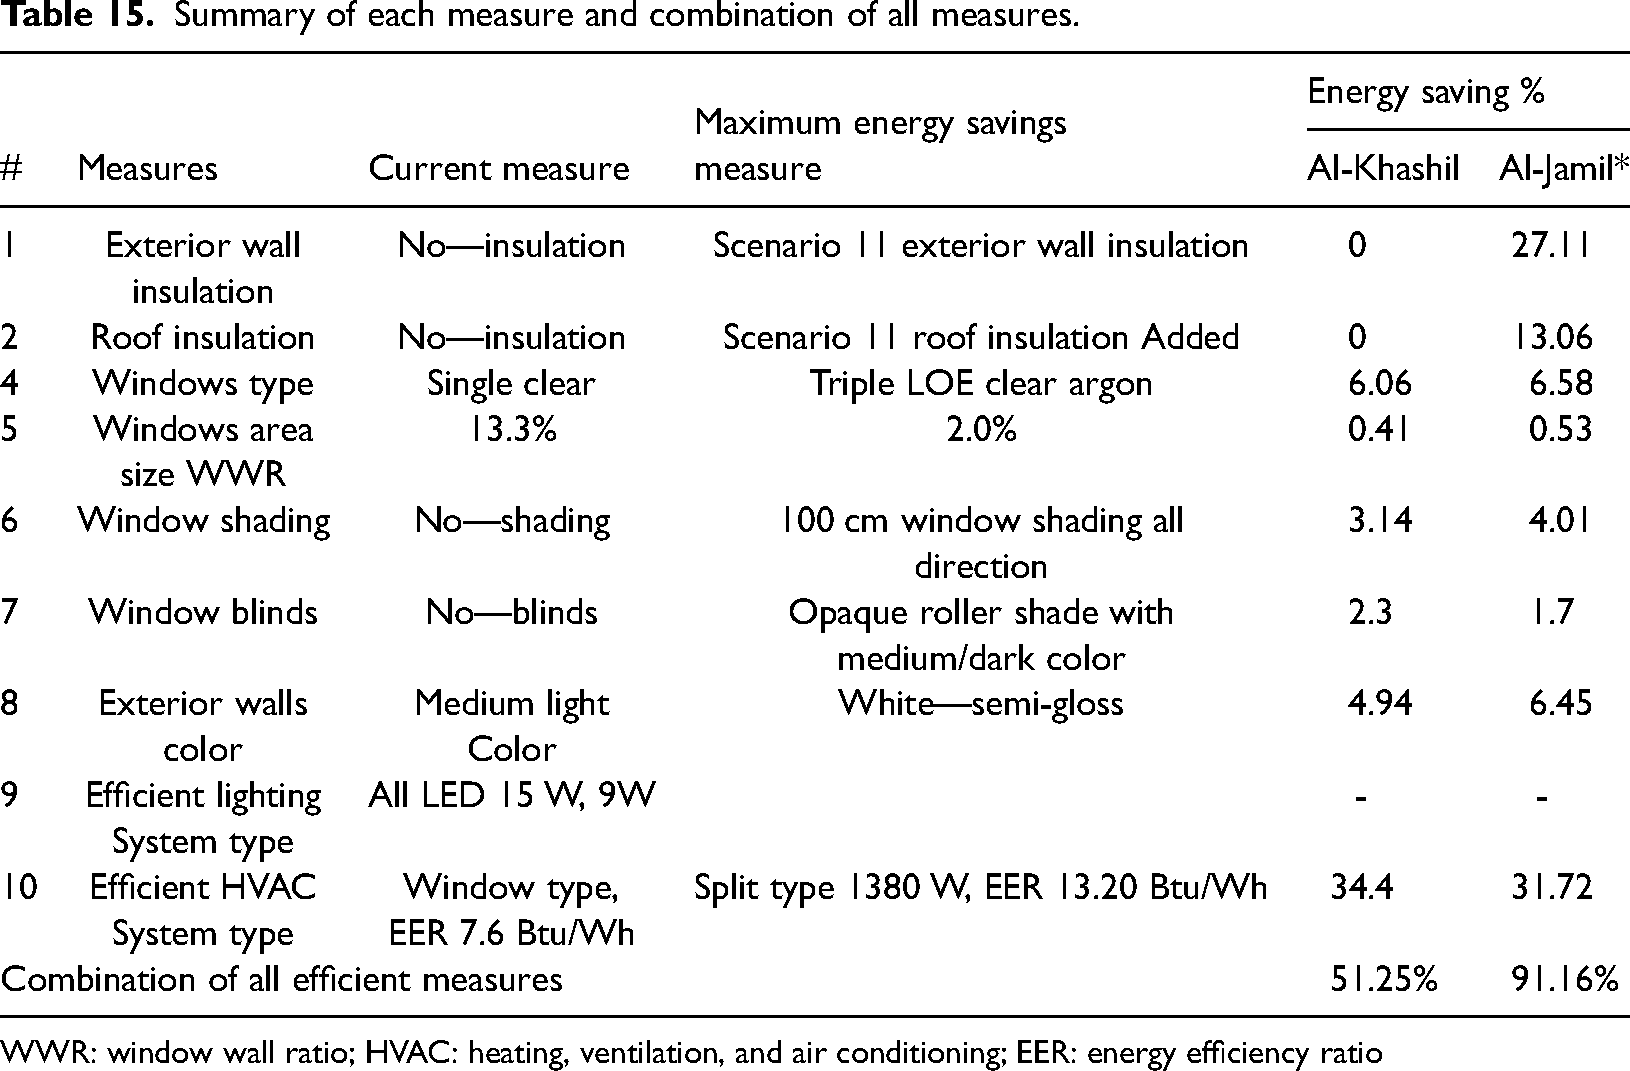
WWR: window wall ratio; HVAC: heating, ventilation, and air conditioning; EER: energy efficiency ratio
The EUI of mosques under research was 100.0 kWh/m2/year for Al-Khashil and 121.4 kWh/m2/year for Al-Jamil, indicating that the design method is obsolete and unsustainable. The simulation findings show that if the house adopts the indicated EE solutions, energy consumption can be lowered significantly. Figure 14 depicts the impact of each proposed EE solution on energy consumption when compared to the base case.
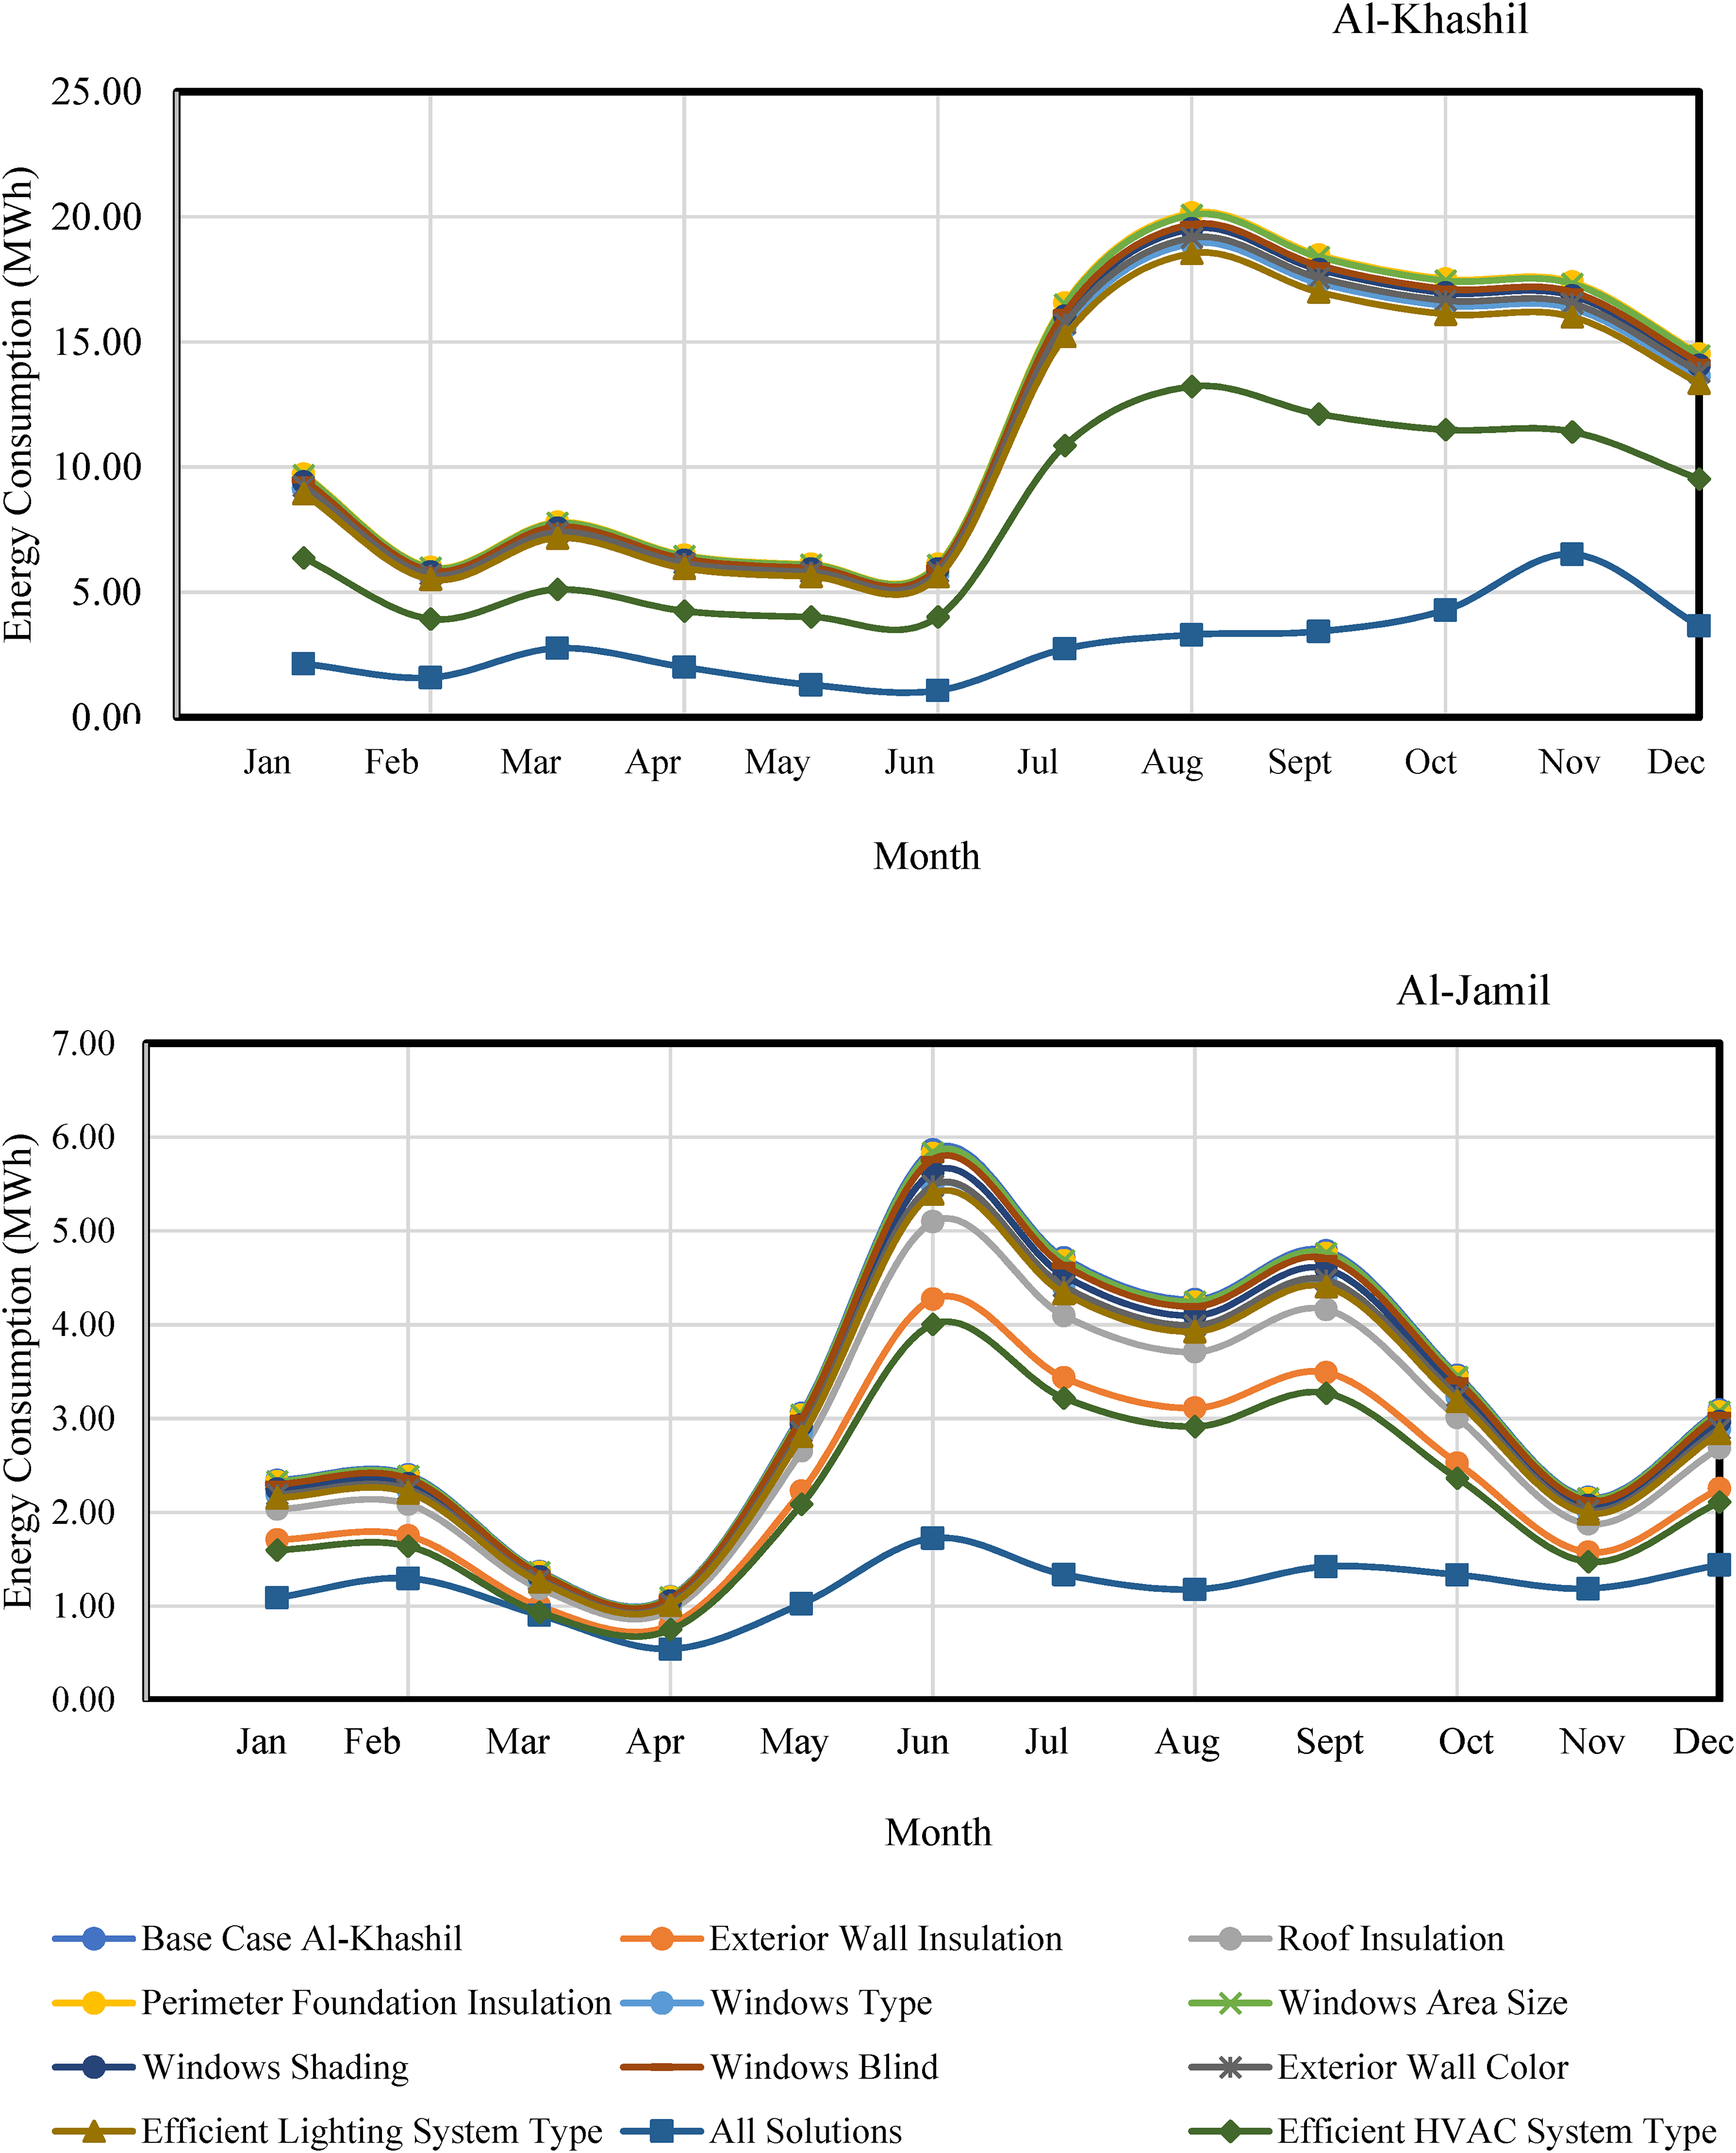
Energy consumption of the base case and each measure for both mosques.
Overall, the curves follow the same pattern, with summer consumption increasing and winter consumption falling. The overall utilization, on the other hand, varies depending on the EE solution. Seasons influence energy conservation. For example, if all of the EE solutions are implemented during the summer season (May to October), average energy savings (without an HVAC upgrade) for Al-Khashil and Al-Jamil can reach 38.6% and 67.1%, respectively. The winter months (November to April) can, on average, result in energy savings of up to 26.5% in Al-Khashil and 48.4% in Al-Jamil. This is logical given the high cooling load throughout the summer months. A significant drop in load is observed in the summer, and this is useful to reduce the peak load of the national grid.
Finally, all of the offered EE solutions were combined to create a more EE mosque structure. According to Table 15, the EUI of the EE for Al-Khashil and Al-Jamil is 64.7 and 45.7 kWh/m2/year, respectively, which is 35.4% and 62.3% less than the current conventional mosque designs for Al-Khashil and Al-Jamil, respectively. These final results are consistent with those provided by (Ahmed et al., 2019), who discovered that in the same climate location, a BPS-based EE design method may reach a EUI of 72.5 kWh/m2/year, which is 27.53% lower than a base-case conventional design for Al-Khashil and 40.27% for Al-Jamil. A more energy-efficient residential building was ultimately designed using all the suggested EE improvements.
PV system
Technical analysis
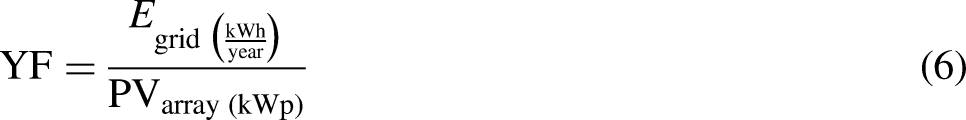
The result of the design shows the need for 45 panels for Al-Jamil and 180 panels for Al-Khashil, which means that the nominal capacities of the two systems are 18 and 72 kW at STC, respectively. The annual production of the PV systems (EA) is 96.4 kWh/day and 385.6 kWh/day for Al-Jamil and Al-Khashil, respectively. Considering 2% losses, the annual energy delivered to the grid for Al-Jamil and Al-Khashil will be 33,981 and 135,926 kWh/year, respectively, using equation (5). Solar PV system calculated parameters like average efficiency, area of PV modules, annual production to the grid (Egrid), YF, and CF are given in Table 16. Figure 15 illustrates the monthly average energy provided to the grid by the mosques Al-Khashil and Al-Jamil. The annual energy injected into the grid is 135.926 and 33.981 MWh for Al-Khashil and Al-Jamil, respectively.
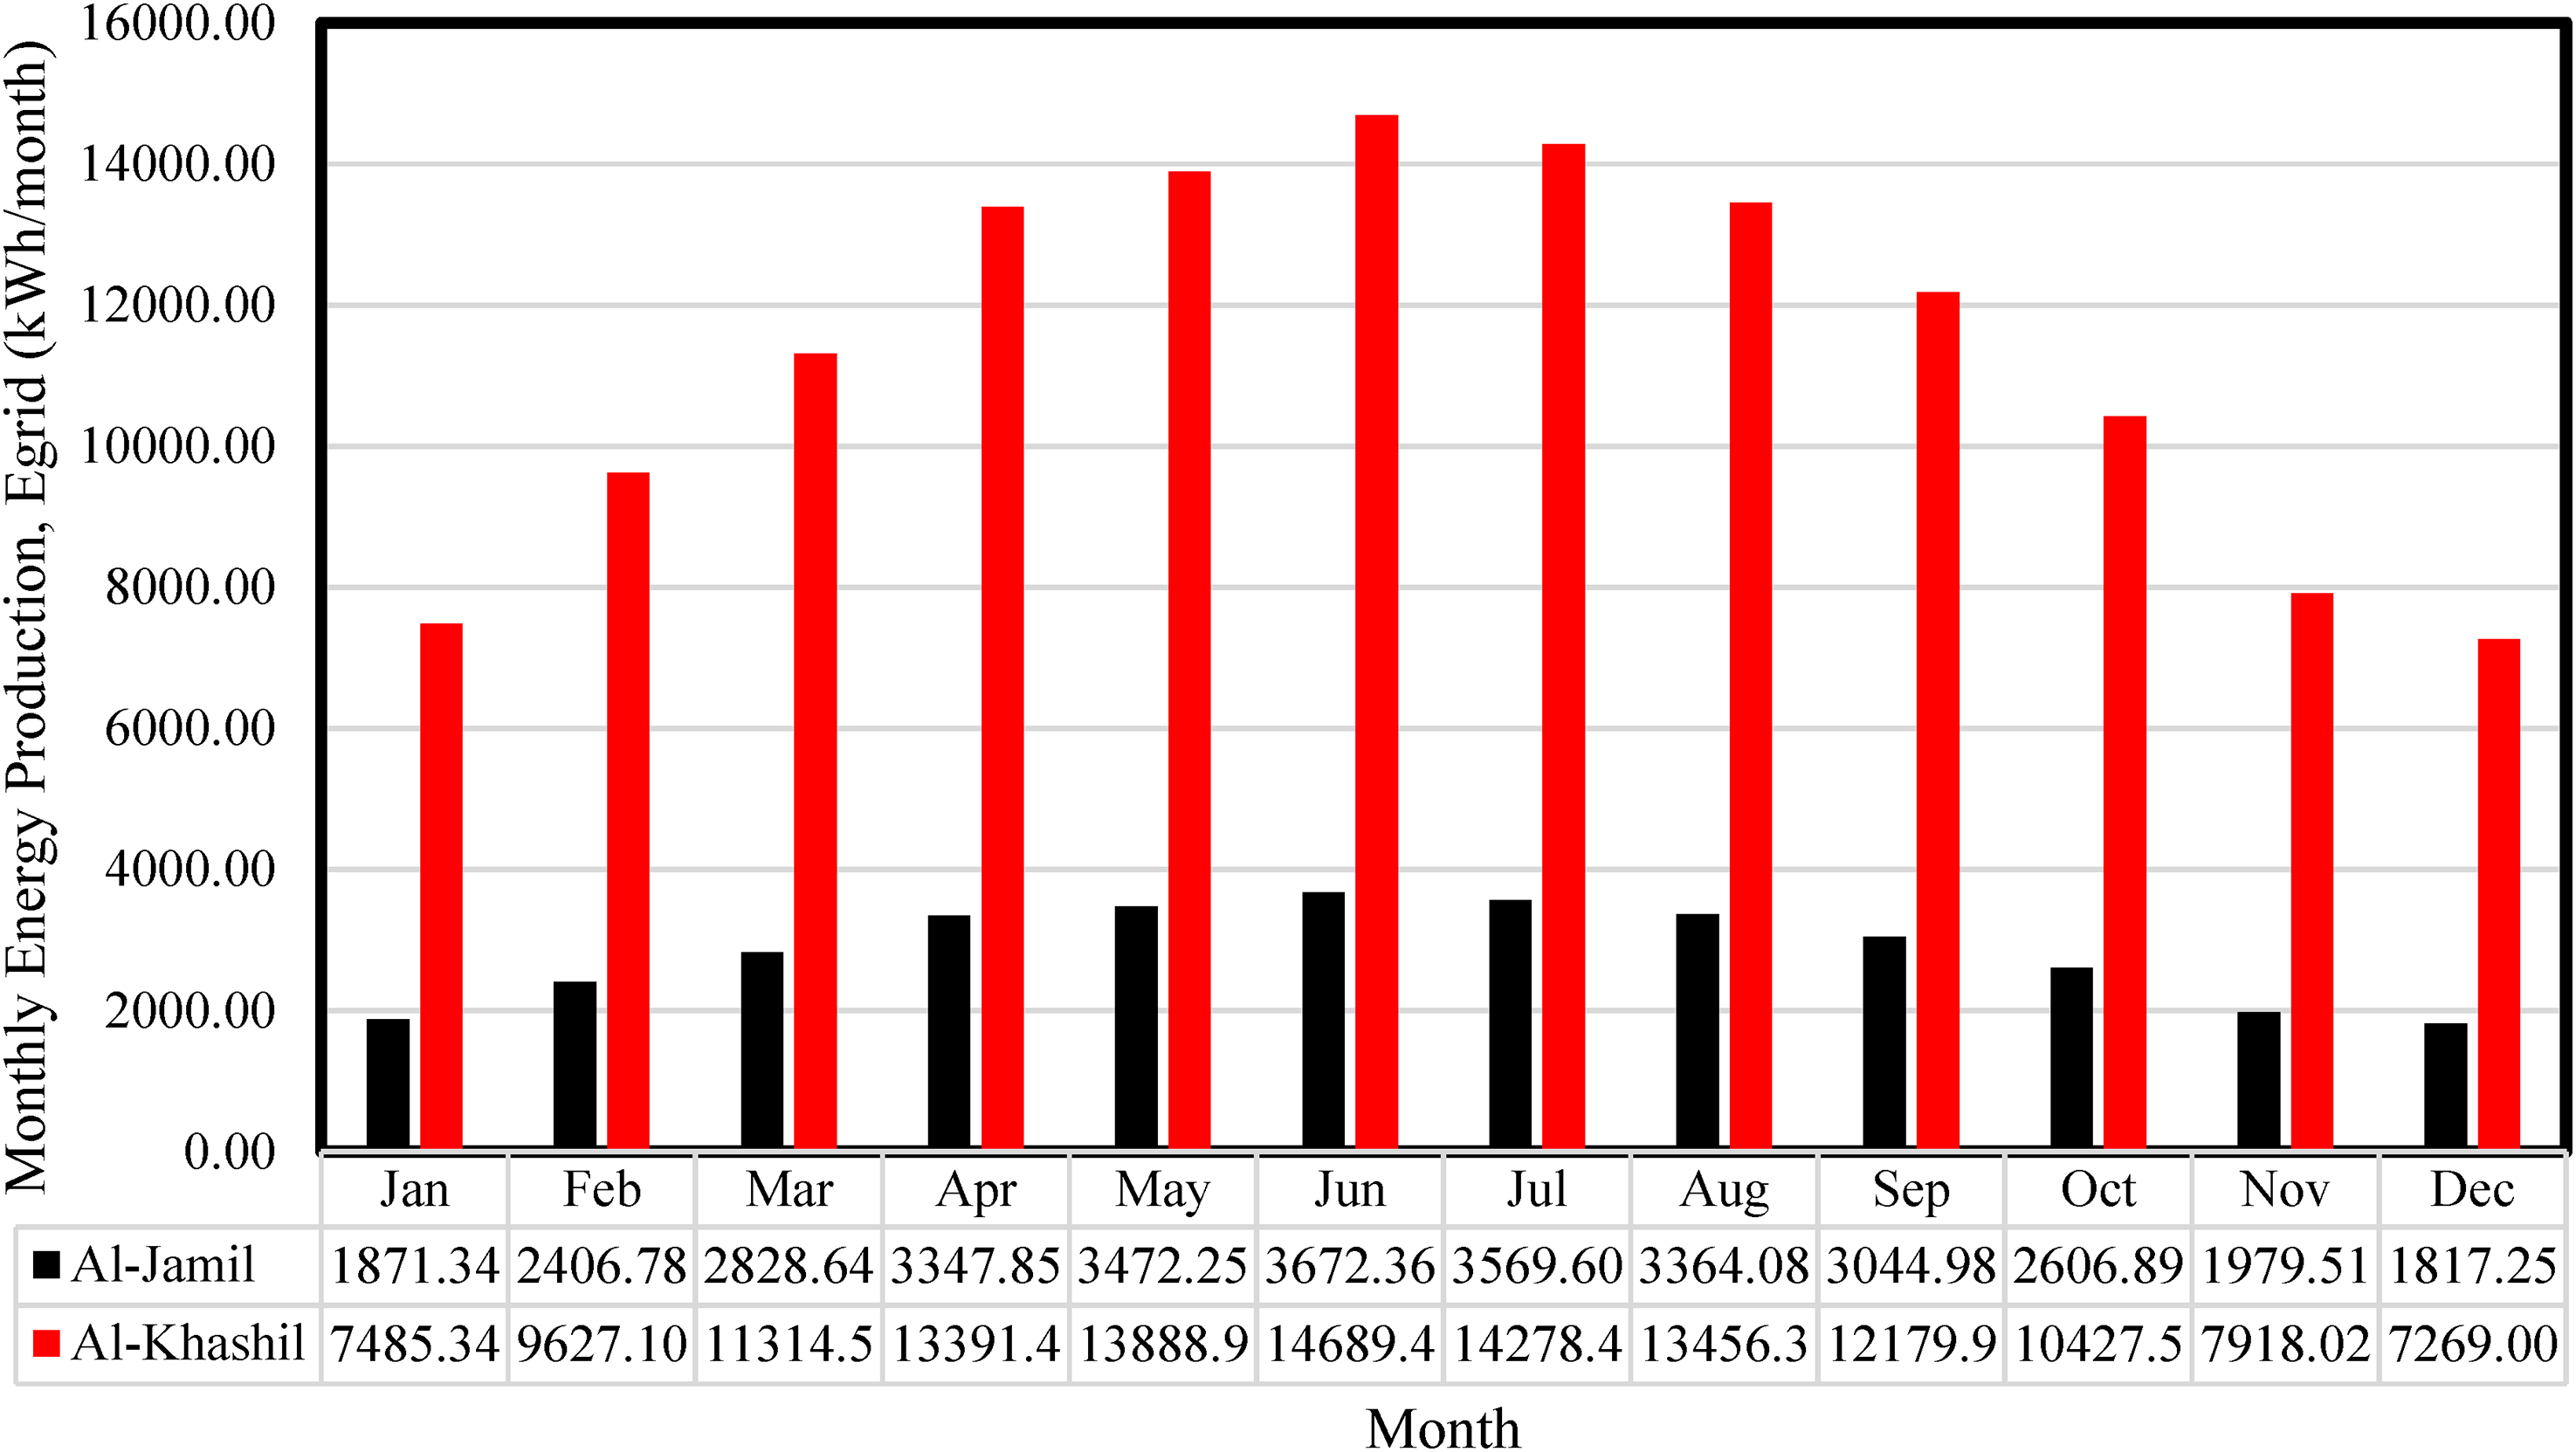
Monthly energy injection into grid.
Solar photovoltaic (PV) system calculation parameters.
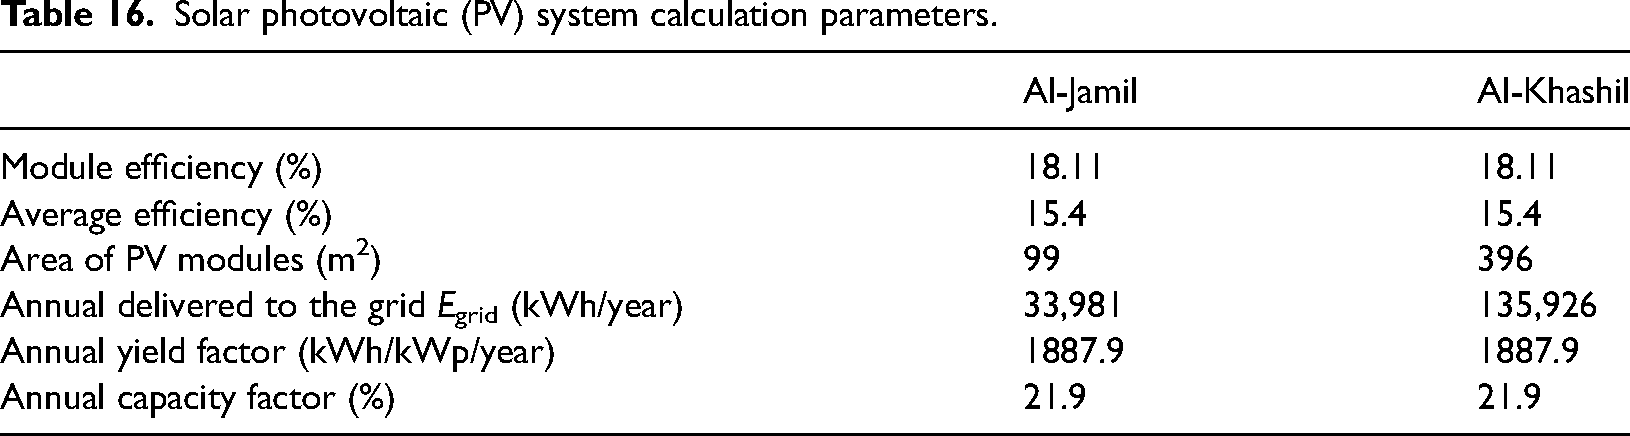
Using equations (6) and (7), the monthly YF for both mosques ranges from 100.96 to 204.02 kWh/kWp, and the annual YF and CF for Al-Khashil and Al-Jamil are the same: 1887.9 (kWh/kWp/year) and 21.9%, respectively. Almasri et al. (2021) reported that for Riyadh, Hail, and Abha, the average annual YF were 1756, 1813, and 1888 kWh/kWp, correspondingly.
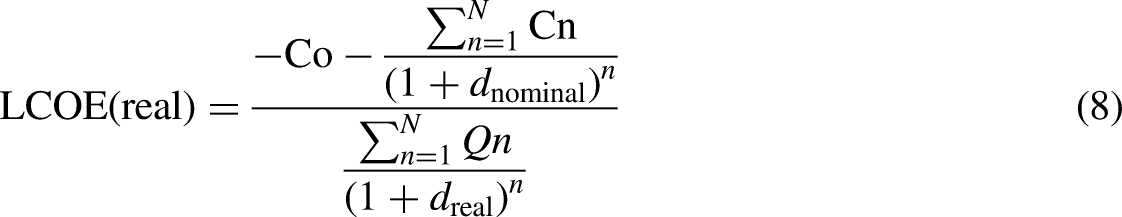
Economic analysis
The PV systems have been analyzed, and although the top roof available area for both Al-Khashil and Al-Jamil can contain a larger number, it could be costly, and SPBT will be affected. It was determined that the LCOE of the systems is 0.0901 SR/kWh (0.024 $/kWh) using equation (8). Prior studies for PV grid-connected systems in the GCC found 0.0359 $/kWh in the KSA (Almarshoud, 2017) (1 MWp), and 0.158 $/kWh in Oman (Kazem and Khatib, 2013) (1 kWp).
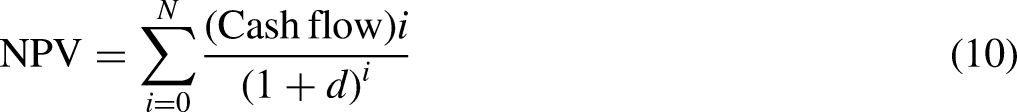
As already demonstrated in equation (11), the price of exported power to the grid, which is officially determined by ECRA (Rauf et al., 2021) for the KSA government sector, is fixed at 0.05 SR/kWh (0.019 $/kWh). As a result, Figure 16 shows that the NPV and IRR for PV systems are not suitable as a result of the current prices and the system applied in the KSA. The NPV reaches zero at an export tarrif of 0.12 SR/kWh for both Al-Khashil and Al-Jamil; meanwhile, at 0.32 SR/kWh, the NPV is 292,016 SR (77,253$) and 69,008 SR (18,256$) for Al-Khashil and Al-Jamil, respectively. These results show that the PV system with an official export tariff designed for the public-sector market is not economically feasible. The government should think about raising the export tariff as a PV incentive program, and if so, several export tariffs need to be investigated to determine how much. If the proposed PV system's power is transmitted to the grid at a rate of 0.32 SR/kWh, Figure 16 demonstrates that the SPBT is 5.14 years, which is comparable to the new SEC tariff for the mosque or government sector. These outcomes are consistent with what was discovered by (Rahman): 7.11 years at a 0.32 SR/kWh export tariff. Additionally, these results concur with the SPBT and IRR results discovered by (Almushaikah and Almasri, 2021) and (Abd-ur-Rehman et al., 2018). It is also possible to consider using the roofs of mosques to build PV systems that will help make the electric energy sector sustainable.
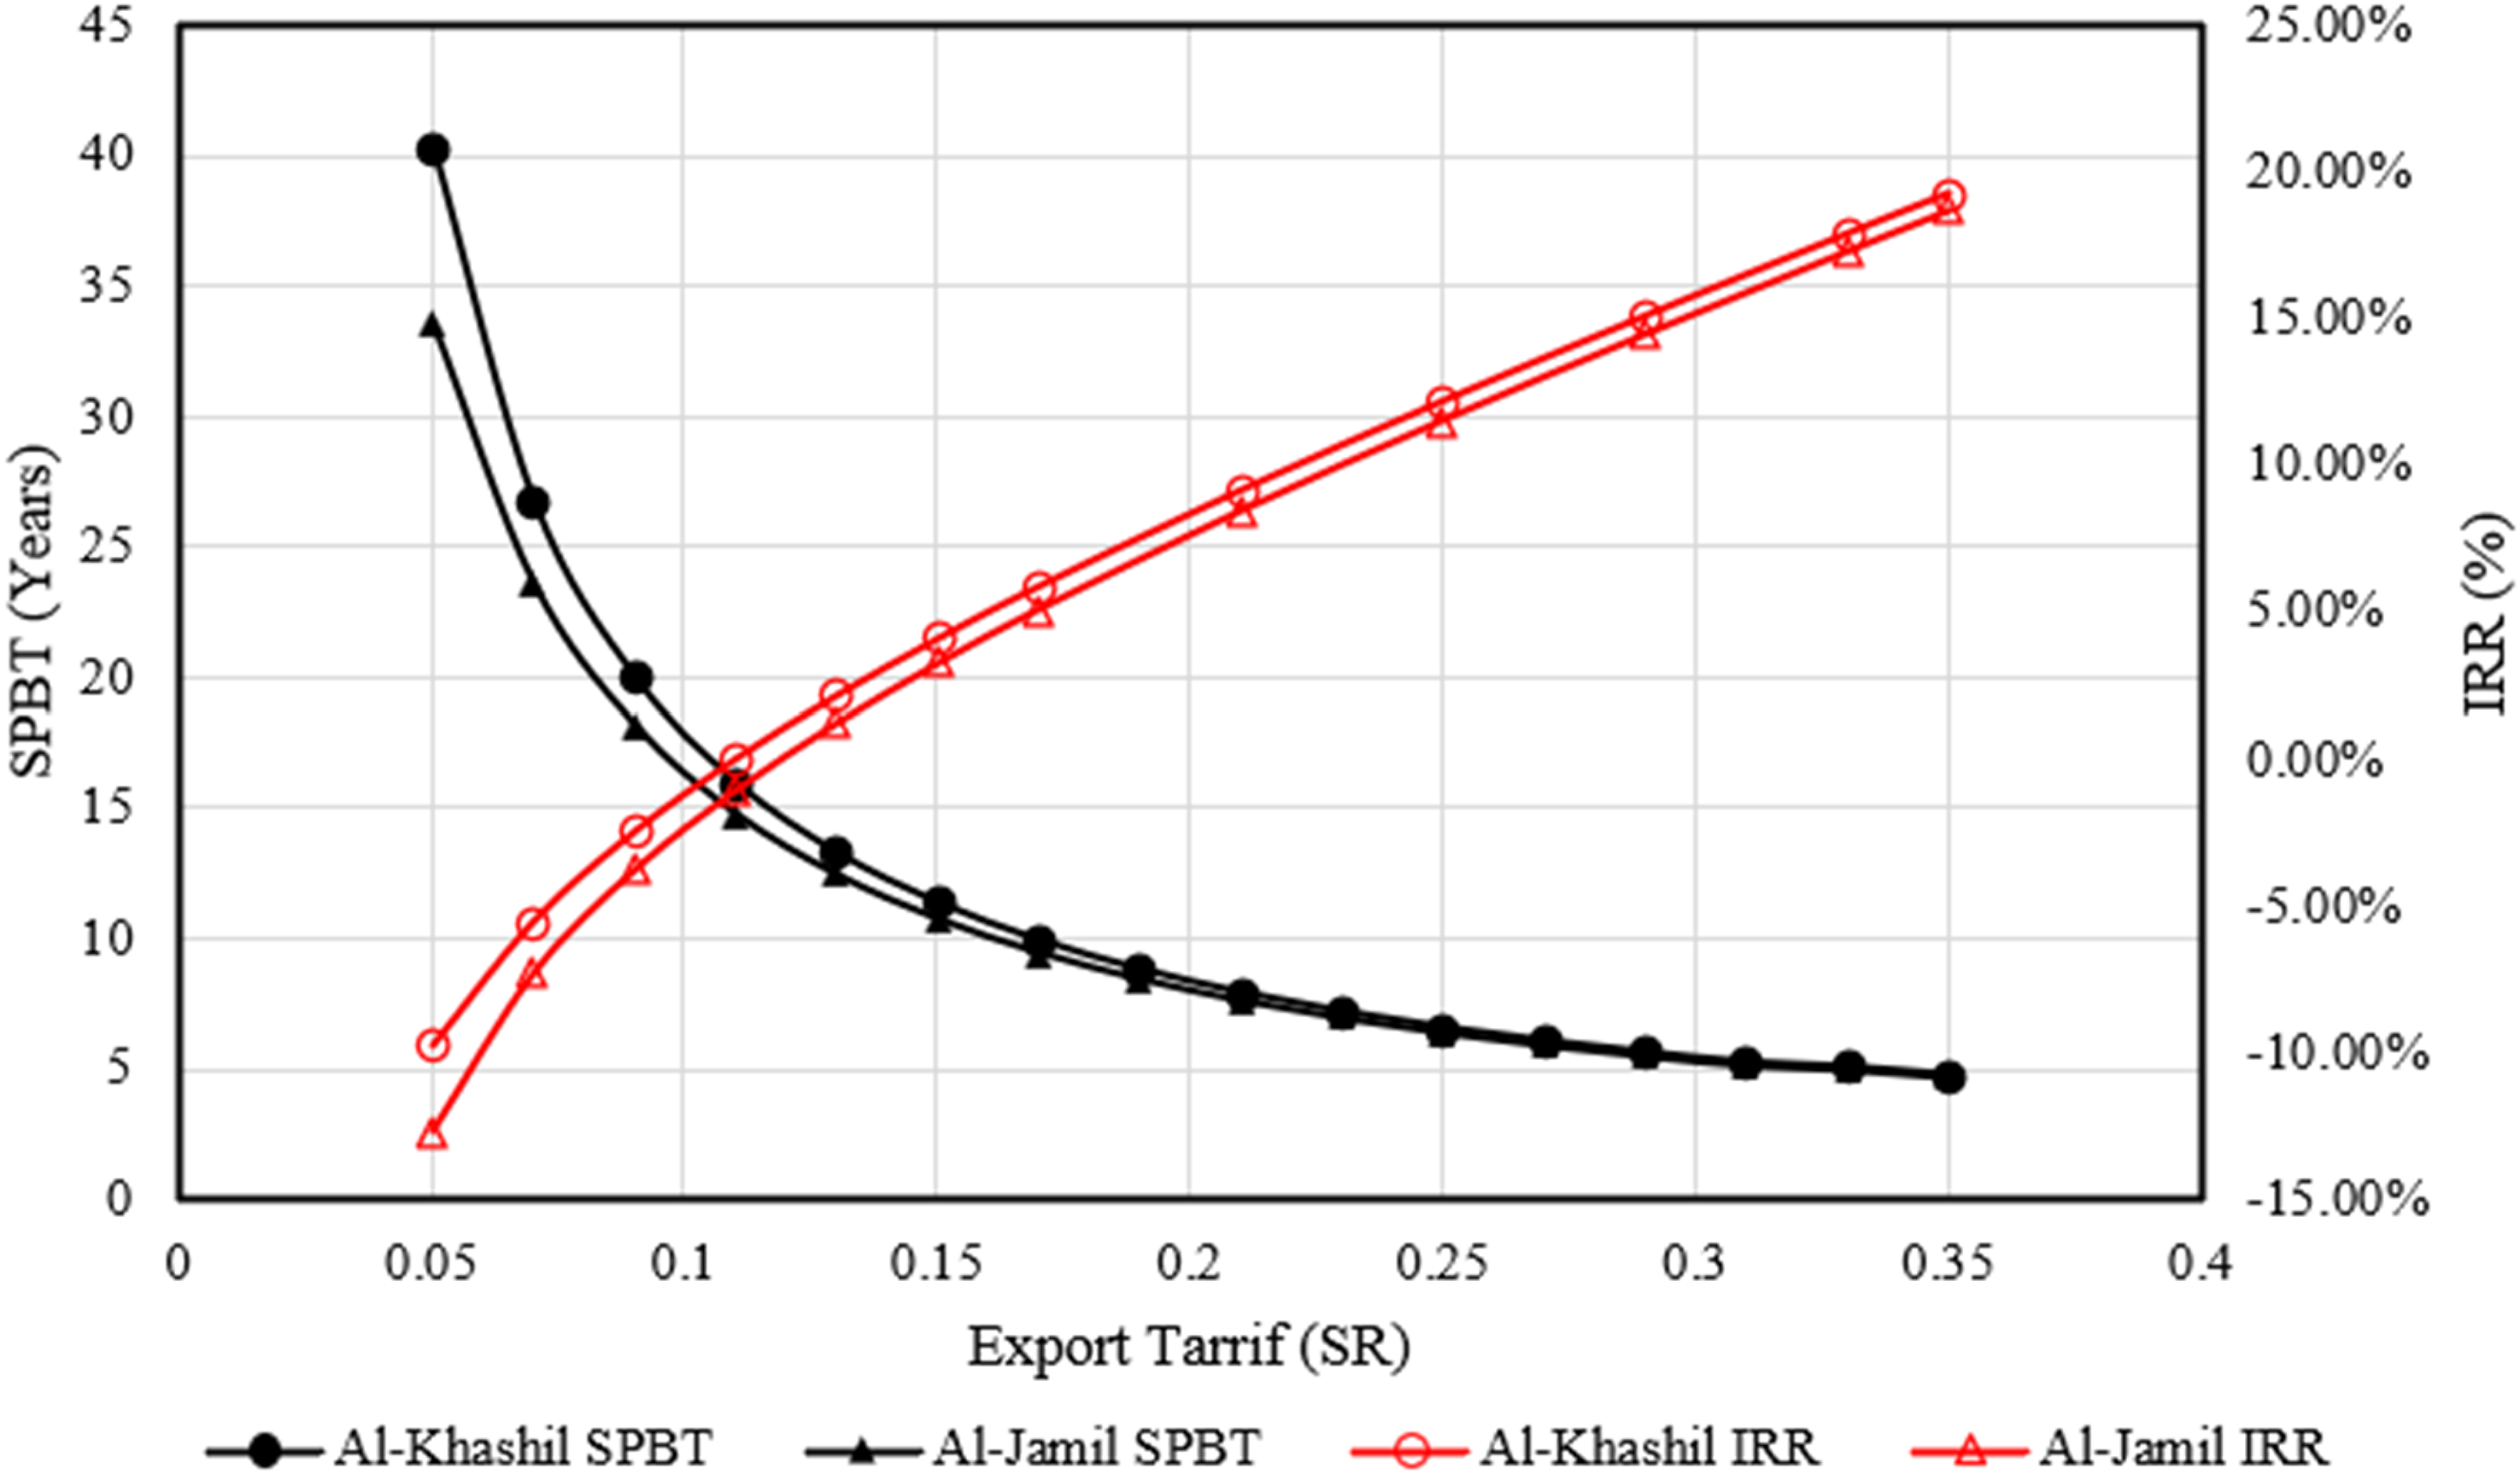
Economic impact of tariffs on the grid-connected photovoltaic (PV) system.
Environmental analysis
The use of a PV system and the use of thermal insulation will both lower GHG emissions in mosque structures in Saudi Arabia. For Al-Khashil and Al-Jamil, respectively, PV usage will produce annual electricity of around 135,926 and 33,981 kWh. According to the United States Environmental Protection Agency, the KSA is expected to emit 0.757 kg CO2/kWh of carbon dioxide when producing electricity. According to Table 17, the annual GHG emission reductions from unified PV systems for Al-Khashil and Al-Jamil were 102.9 tCO2 and 25.72 tCO2, respectively, using equation (3). The outcomes meet the results reported by Almasri et al. (Almasri et al., 2021).
Annual GHG reduction due to PV usage.
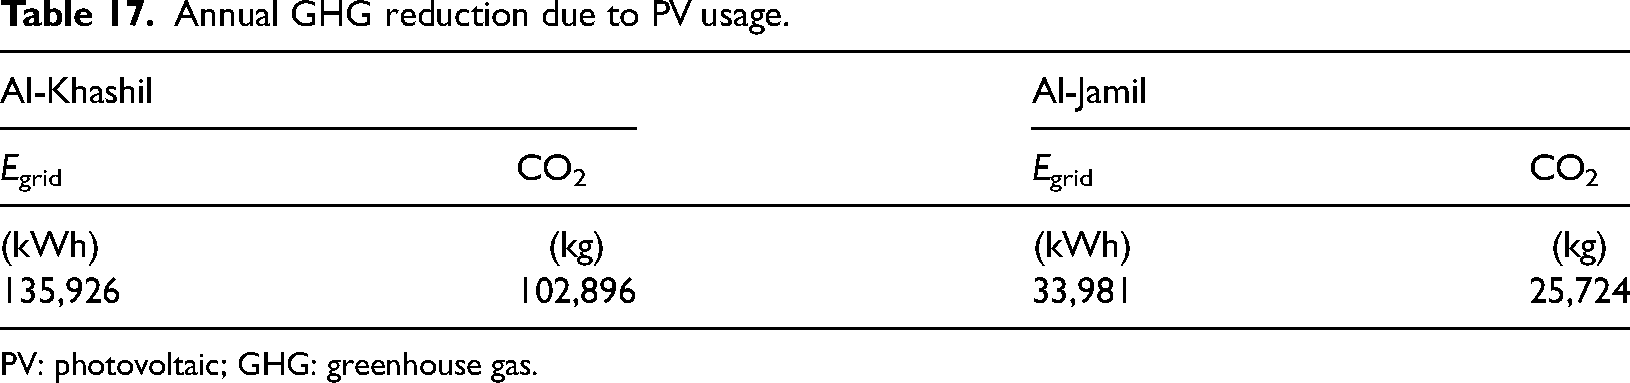
PV: photovoltaic; GHG: greenhouse gas.
Discussion and conclusion
In Saudi Arabia, the mosque industry uses a growing amount of energy. Combining EE interventions on the building exterior is essential to achieving a sector with low energy consumption. EE in mosques in the KSA also confront issues, such as the country's harsh environment, housing construction, subsidized utilities, rapid expansion, and a lack of building code enforcement and monitoring. This condition must alter, and the obstacles must be removed. In this study, energy consumption was analyzed in several mosques in the city of Hail. Opportunities to rationalize energy consumption and benefit from solar energy to secure electric energy were also studied. The simulations were carried out using DesignBuilder software for both the base-case energy calculations and the energy calculations of energy-saving measures using DesignBuilder meteorological. In this study, energy consumption was analyzed in several mosques in the city of Hail. Opportunities to rationalize energy consumption and benefit from solar energy to secure electric energy were also studied. The findings revealed that in order to integrate EE interventions on the building's exterior and benefit from solar energy, a low-energy consumption sector is required. Walls, roofs, and windows should be examined first when implementing EEMs for the building envelope in the middle area to get the most feasible energy savings. The results can be summarized as follows:
Annual EUIs for Al-Khashil and Al-Jamil mosques are 100 and 121 kWh/m2, respectively. Overall annual energy usage per capita in Al-Khashil is 1230 kWh, whereas in Al-Jamil it is 1829 kWh. Building's walls, roof, and windows should be considered when adopting EEMs for Al-Jamil since they reduce energy consumption by 27%, 13%, and 6%, respectively, while Khashil's building envelope is insulated. Choosing an HVAC system with a high EER may cut energy usage by more than 30%, and applying SBC 601 has the potential to cut energy usage by 35.4% and 63.3% for Al-Khashil and Al-Jamil, respectively. Average energy savings that can be achieved for Al-Khashil and Al-Jamil are 51.25% and 91.16%, respectively, if all EE solutions are implemented. The difference in electricity consumption for Al-Khashil due to COVID-19 was 58,737 kWh, which was 39.9% less in 2020 than in 2019. During the summer months, there was a 5% variation between the actual and modeled electricity consumption figures. The differences in energy consumption of the buildings using weather data from DesignBuilder, RETScreen, and ATLAS were analyzed and compared to the actual bills. It has been noticed that, for DesignBuilder, results were closest to the billing data, while using data from RETScreen and ATLAS showed discrepancies of up to a maximum of 28%. The annual YF and CF for Al-Khashil and Al-Jamil are the same: 1887.9 (kWh/kWp/year) and 21.9%, respectively. The total annual energy supplied to the grid from suggested PV systems in Al-Khashil and Al-Jamil is approximately 135.93 MWh and 33.98 MWh, respectively. The annual GHG emission reductions from suggested PV systems are 102.9 tCO2 and 25.72 tCO2, respectively, for Al-Khashil and Al-Jamil. The LCOE of PV systems is 0.0901 SR/kWh (0.024 $/kWh), and the NPV and IRR for PV systems are not suitable as a result of the current prices and the system applied in the KSA. If the electricity produced from PV systems is injected into the grid at a rate of 0.32 SR/kWh, which is comparable to the SEC tariff for the mosque or government sector, then the SPBT is 5.14 years.
Recommendations
To ensure energy-efficient mosques, the government should promote and enforce EE standards.
A proposal for the signing of an agreement between the Saudi Electricity Company and the Ministry of Islamic Affairs, Dawah, and Guidance to install PV systems and implement energy-saving practices in mosques.
To avoid casting a shadow over the solar systems, it is preferred to place the minaret on the northern side of mosques in the northern hemisphere.
The results show that the PV system with an official export tariff designed for the public-sector market is not economically feasible. The government should think about raising the export tariff as a PV incentive program. Emphasize the necessity for a reward system to promote solar energy utilization in mosque structures, which can increase their sustainability and enhance their energy security.
Footnotes
Acknowledgments
The authors gratefully acknowledge Qassim University, represented by the Deanship of Scientific Research, on the financial support for this research under the number (QEC-2022-1-1-J-27952) during the academic year 1444 AH/2022 AD.
Declaration of conflicting interests
The authors declared no potential conflicts of interest with respect to the research, authorship, and/or publication of this article.