
Abstract
The Fengcheng Formation (P1f) source rock, which was deposited in an alkaline water body, is one of the most significant source rocks in the Mahu sag, Junggar Basin. However, its evolution and mechanism of organic matter accumulation are still not understood. Using seismic, core, and log data, P1f is divided into 3 third-order sequences, i.e., SQ1, SQ2, and SQ3, from bottom to top. Pyrolysis data of core samples shows that SQ1 and SQ3 mainly are characterized by poor to fair source rocks, with Type III to Type II2 kerogen, while SQ2 mainly are characterized by fair to good to excellent source rocks, with Type II2 to Type I kerogen. The biomarker parameters of 40 source rock samples from different sequences suggest that the reducibility of sedimentary water is characterized by SQ2 > SQ1 > SQ3. The organic matter contribution in different sequences is obviously different. SQ1 organic matter contain more bacteria and algae than that of SQ2 and SQ3, and terrigenous higher plants may have contributed to SQ3 organic matter. Lake level changes and water salinity dominate organic matter origin, accumulation, and preservation. During SQ1 deposition, the lake level was the highest, the salinity of sedimentary water was moderate, and the organic matter contained more conventional algae sources. During SQ2 deposition, the lake level was the lowest and the salinity was the highest, and the organic matter contained special algae characterized by C29 regular steroids. The lake level of SQ3 was higher than that of SQ2, the salinity was the lowest, and terrigenous higher plants may have contributed to organic matter during this period.
Introduction
The Mahu sag, which is located in the northwestern Junggar Basin, is a hydrocarbon-rich tectonic unit. According to the fourth oil and gas resource assessment, its estimated hydrocarbon resources are more than one billion tons (Kuang et al., 2014). Previous reports on oil-source rock correlations suggest that oil mainly originated from P1f source rocks (Xiao et al., 2021). Therefore, P1f is regarded as one of the most important source rocks in this area. Deeper exploration of P1f also reveals its great potential in tight and shale oil resource potential (Zhang et al., 2019; Li et al., 2021; Tang et al., 2021a, 2021b). Although the sedimentary facies are still debated during this period (You, 1986; Liu, 1989; Liu et al., 2013), the features of high salinity and strong reducibility of the water body have been confirmed (Cao et al., 2015). The petrologic, mineralogical, paleontological, element geochemical, and organic geochemical characteristics of P1f source rocks were analyzed in detail in previous reports (Cao et al., 2015; Qin et al., 2016; Wang, 2017; Wang et al., 2018; Zhang et al., 2018). The character and origin of sodium carbonates and cherts in P1f were addressed (Yu et al., 2018; Yu et al., 2021). Special distributed alkaline minerals (Jiang et al., 2012) and biomarkers (Wang et al., 2021) were detected in P1f source rocks, which indicates that P1f was deposited in an alkaline lake (Cao et al., 2015; Cao et al., 2020).
However, the main mechanism and factors controlling organic matter enrichment in such special settings are not well understood. The relationship between the evolution of the lake and the difference in organic matter source is not clear. In the study by Wang et al. (2021), the spatiotemporal evolution of the alkaline lake was analyzed using organic and elemental approaches for the marginal, transitional and central regions in the study area. The organic character of P1f was concluded from only one well in the study area by Gao et al. (2018). On the other hand, the previous work focused on lithostratigraphic units, not isochronous stratigraphic frames.
Due to recent advances in sequence stratigraphy, which establishes a uniform isochronal stratigraphic framework for a sedimentation model, the sedimentary system is better interpreted and understood (Vail, 1987). Biomarkers extensively existing in source rocks contain valuable information about the organic matter origin and variations (oxidation, biodegradation, and transport) in a sedimentary process. Therefore, biomarkers are an important tool to reconstruct the organic matter paleoenvironment (Peters and Moldowan, 1993). Based on sequence stratigraphy integrated with organic geochemistry, sequence stratigraphic geochemistry has been applied to the study of sedimentary environments and their evolution in basins, source rock assessments, and organic matter origins (Bombardiere and Gorin, 2000; Peters et al., 2000; Fleck et al., 2002; Li and Zhou, 2003; Frimmel et al., 2004; Li et al., 2005; Lai et al., 2018; Lai et al., 2020a; Lai et al., 2020b).
Therefore, this paper focuses on difference in geochemical characteristics within an isochronal sequence stratigraphic framework. The different organic matter sources during different stages have been ignored in the previous works. Therefore, this work investigates detailed biomarkers to characterize the organic matter source and depositional environment. By integrating the sequence stratigraphic framework and sedimentation, the key factors of organic matter enrichment are proposed. The data and results of the study are significant for understanding the evolution of alkaline lakes and similar sedimentary settings. Moreover, it has guiding significance for tight oil exploration in this area.
Geologic setting
The Junggar Basin, which is the second largest petroliferous basin in Northwest China, covers an area of more than 130,000 km2. The basin is roughly triangular and is located between the Southern Tianshan Mountains and the Altai Mountains. It has been divided into four secondary tectonic units: the Eastern Uplift, Central Depression, Northwest Fault zone and Southern Margin Thrust Belt (Feng et al., 2008). In terms of structural development, the Junggar Basin has undergone six evolutionary stages (He et al., 2018). The Mahu sag, a secondary structural unit of the Central Depression, with an area of approximately 5000 km2, is located in the northwestern margin of the Junggar Basin (Figure 1(a)). The faults are distributed in the western slope belt and are oriented NNE-NE oriented in this area (Figure 1(b)). In recent years, major exploration progress has been made in the study area, with proven reserves of more than 1 billion tons. The hydrocarbons were mainly generated from Permian source rocks, and mainly accumulated in the conglomerate reservoir of Triassic Baikouquan Formation (T1b) (Figure 1(c)). With further exploration, major discoveries were made in Jurassic, Triassic and Permian strata from shallow to deep (Figure 1(c)), including bitumen, heavy oil and thin oil reservoirs. This petroleum system is referred to as the whole system (Jia, 2017; Tang et al., 2021a, 2021b).
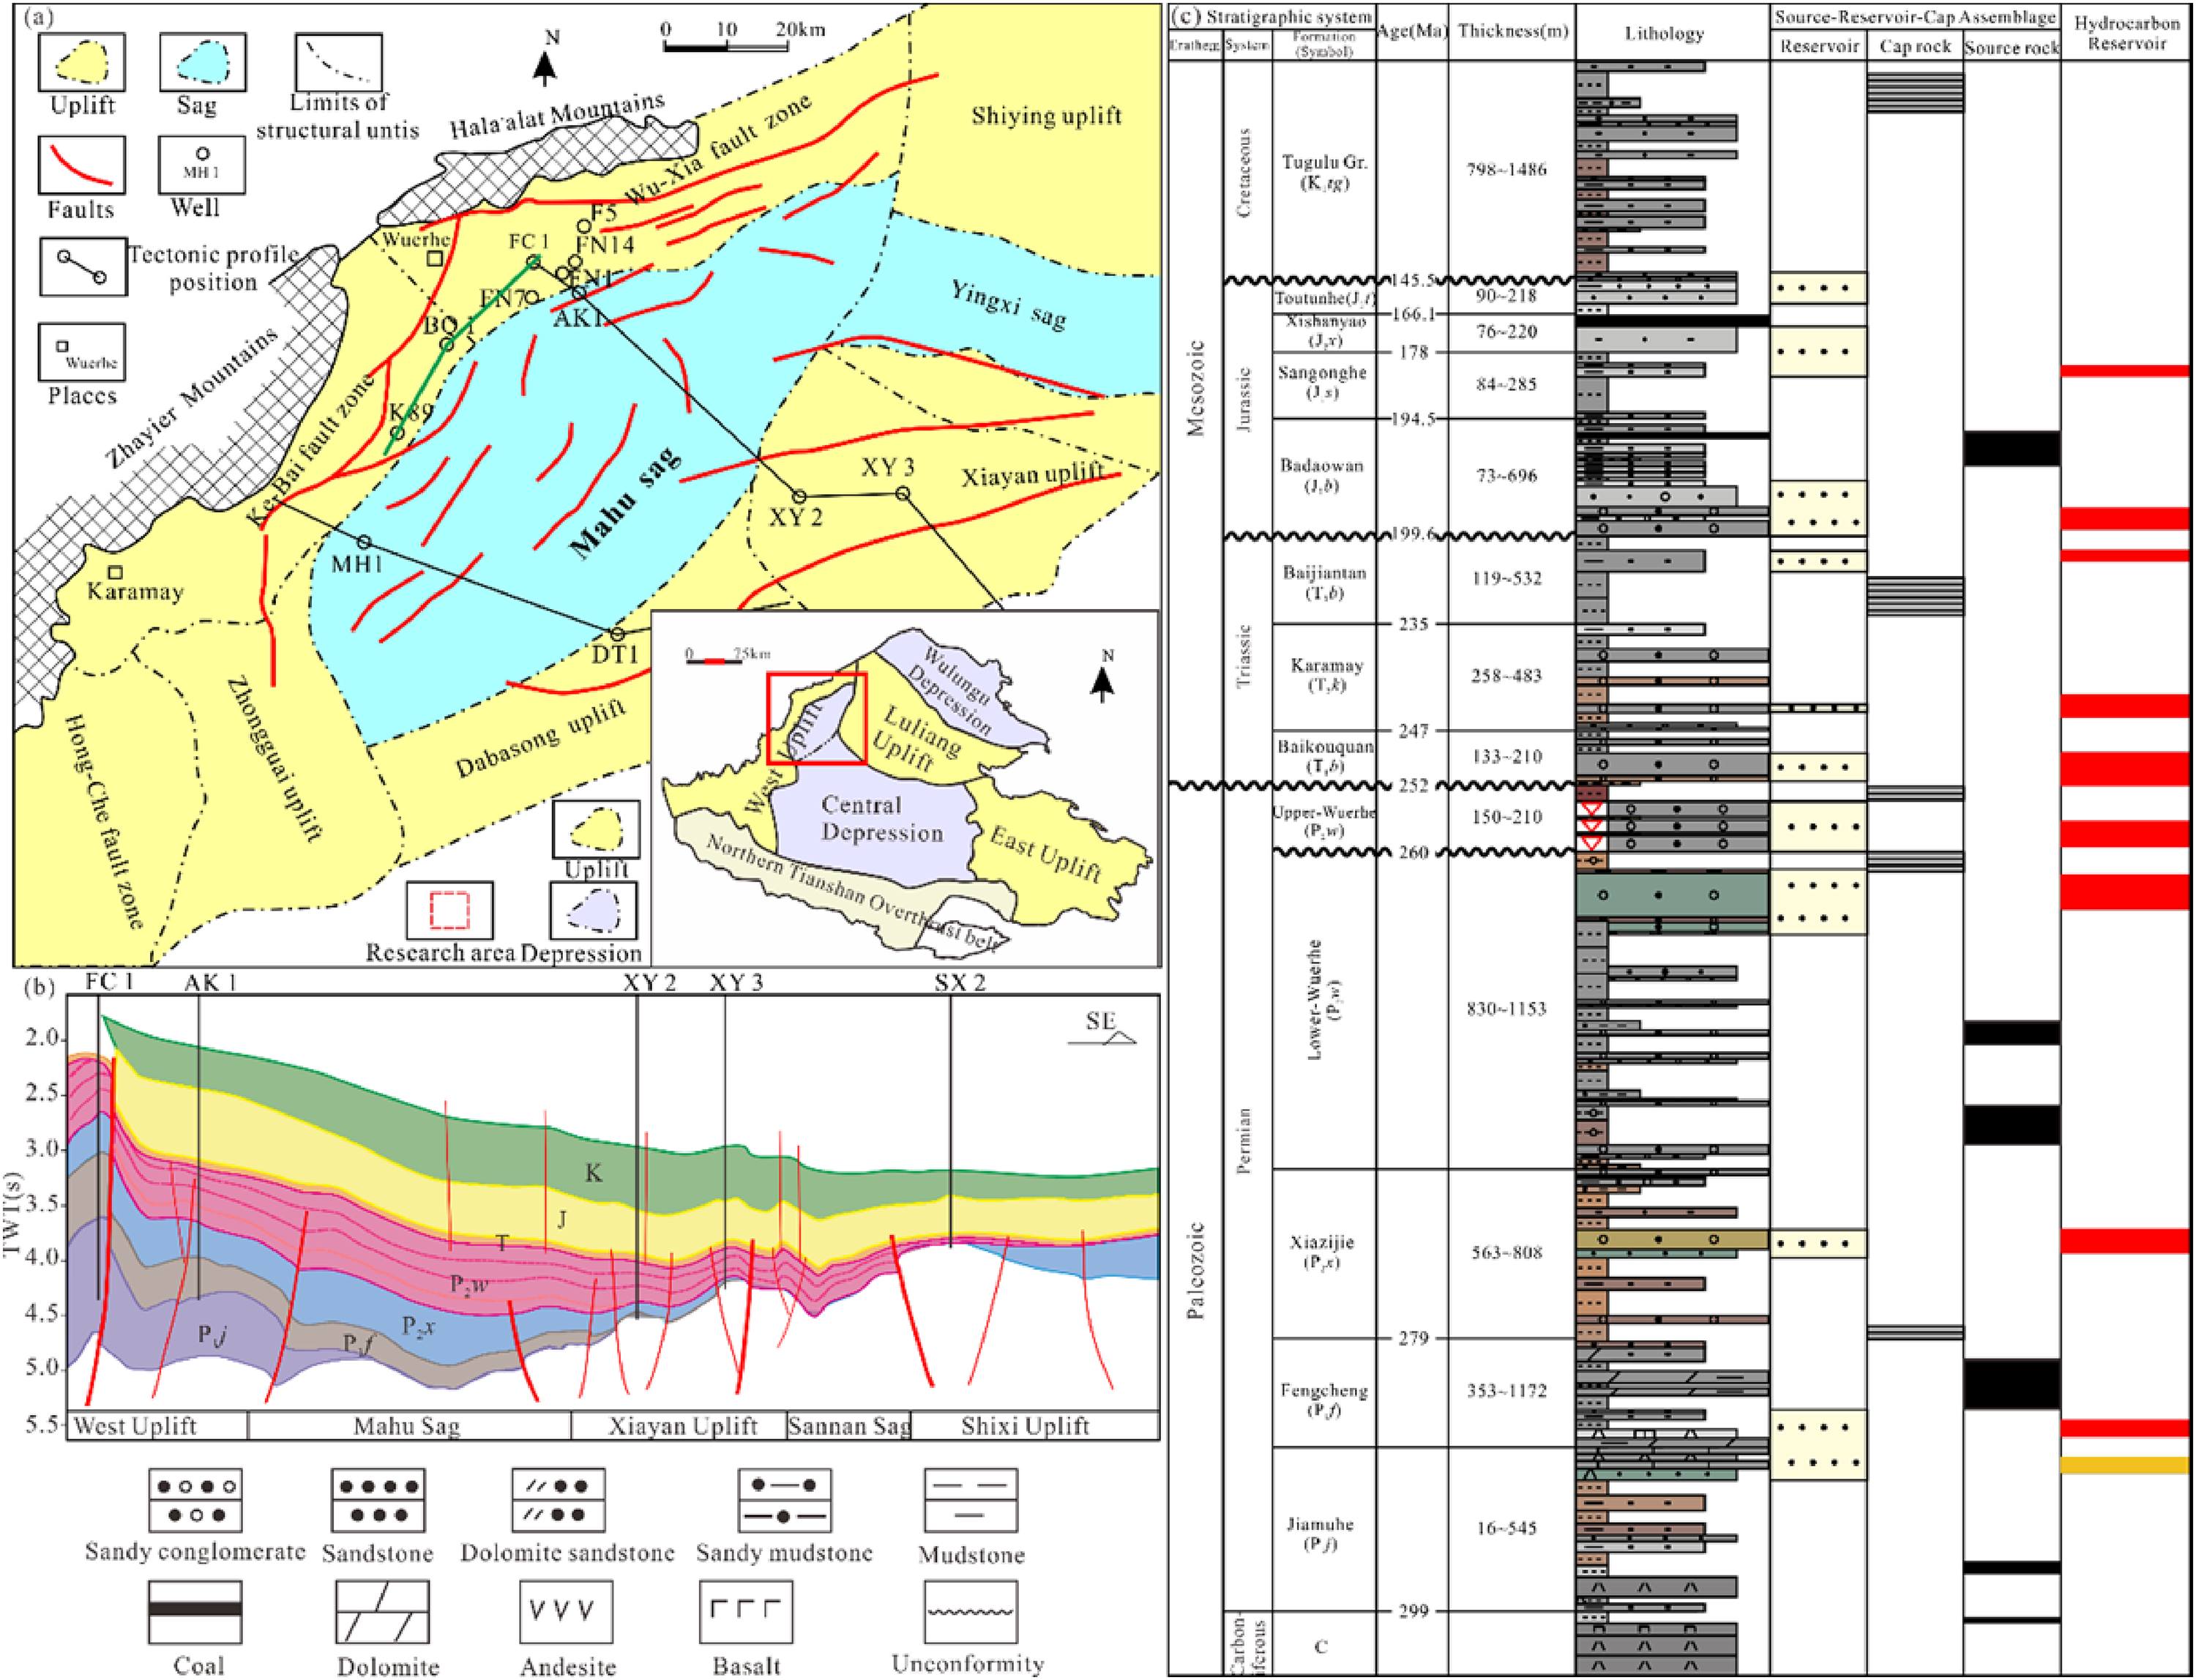
(a) geologic map, (b) stratigraphic structure and (c) comprehensive stratigraphic column of the mahu sag.
Sample and experiments
Samples
Fifty core and chip samples (including mudstone, dolomitic mudstone, silty mudstone, and argillaceous dolomite) were acquired from five wells, FN1, FN7, FN14, FC1, and F5 (see Figure 1 for well locations). Solvent extraction, total organic carbon (TOC) measurement, and pyrolysis were performed for all the samples; gas chromatography–mass spectrometry (GC–MS) was performed for mudstone, dolomitic mudstone, silty mudstone, and some argillaceous dolomite core samples to investigate biomarkers. Additional available data included log data of these wells and 10 seismic sections passing through major wells, yielding the stratigraphic subdivision.
Pyrolysis and TOC measurements
All the samples were ground to smaller than 0.2 mm in particle diameter (sifted using an 80-mesh sieve). To estimate the TOC content, inorganic carbon was removed from the samples using diluted hydrochloric acid with a concentration of 5%, and then the samples were heated to 900°C using a Leco CS-230 so that organic carbon was fully burned and converted into carbon dioxide. Pyrolysis of 100 mg source rock samples was accomplished using an OGE-II.
GC–MS analysis
Soluble organic matter in source rock samples was extracted using Soxhlet extraction with dichloromethane as the solvent. N-hexane solvent was added to soluble organic matter to fully dissolve saturated hydrocarbons, aromatic hydrocarbons, and nonhydrocarbons. Asphaltene was filtered out using a funnel. The filtrate was washed using silica gel/alumina (2:1) column chromatography to obtain saturated hydrocarbons, aromatic hydrocarbons, and nonhydrocarbons in succession, followed by GC–MS analysis of saturated hydrocarbons.
Saturated hydrocarbon fractions were tested using a gas chromatograph–mass spectrometer made by Thermo Electron Corporation with an HP-5MS elastic quartz capillary column of 60.0 m × 250 μm × 0.25 μm as the chromatographic column. An electron bombard was employed with an ionization energy of 70 eV and an ion source temperature of 230°C. The carrier gas was 99.999% helium gas at a flow rate of 1 mL/min. The temperature was raised first from the initial value of 50°C to 200°C at a heating rate of 20°C /min and then from 200°C to 250°C at a heating rate of 4°C /min. The final temperature was 300°C, which was held for 30.00 min. The tests were fulfilled using full scan and multiple ion detection.
Results and discussions
Sequence stratigraphic framework and sedimentation
Sequence stratigraphic framework
The study area evolved from a tectonic uplift to tectonic subsidence and finally tectonic uplift at the depositional stage of P1f, which resulted in lake level changes and a decline in the water surface elevation (Xia et al., 2008; Li et al., 2013). This means that tectonic activities and lake level variations dominated the sequence configuration style and sedimentary system during P1f deposition. The sequence stratigraphic framework of P1f has been discussed in previous studies (Xia et al., 2008; Li et al., 2013). P1f was identified as a second-order sequence (Feng et al., 2013). In a representative seismic section (Figure 2), the boundary surface (SB1) between SQ1 and SQ2 is in truncation contact with underlying formations (Figure 2(a)), and the interface (SB2) between SQ2 and SQ3 is the onlap of the SQ3 formation (Figure 2(b)). SB1 resulted from stratigraphic uplift and erosion caused by tectonic movement in the early stage of P1f deposition. SB2 results from stratigraphic overlap caused by the tectonic subsidence and relative lake level rise at the late stage of P1f. The results are consistent with the evolutionary process of tectonic uplift, tectonic subsidence, and tectonic uplift for P1f (Li et al., 2013).
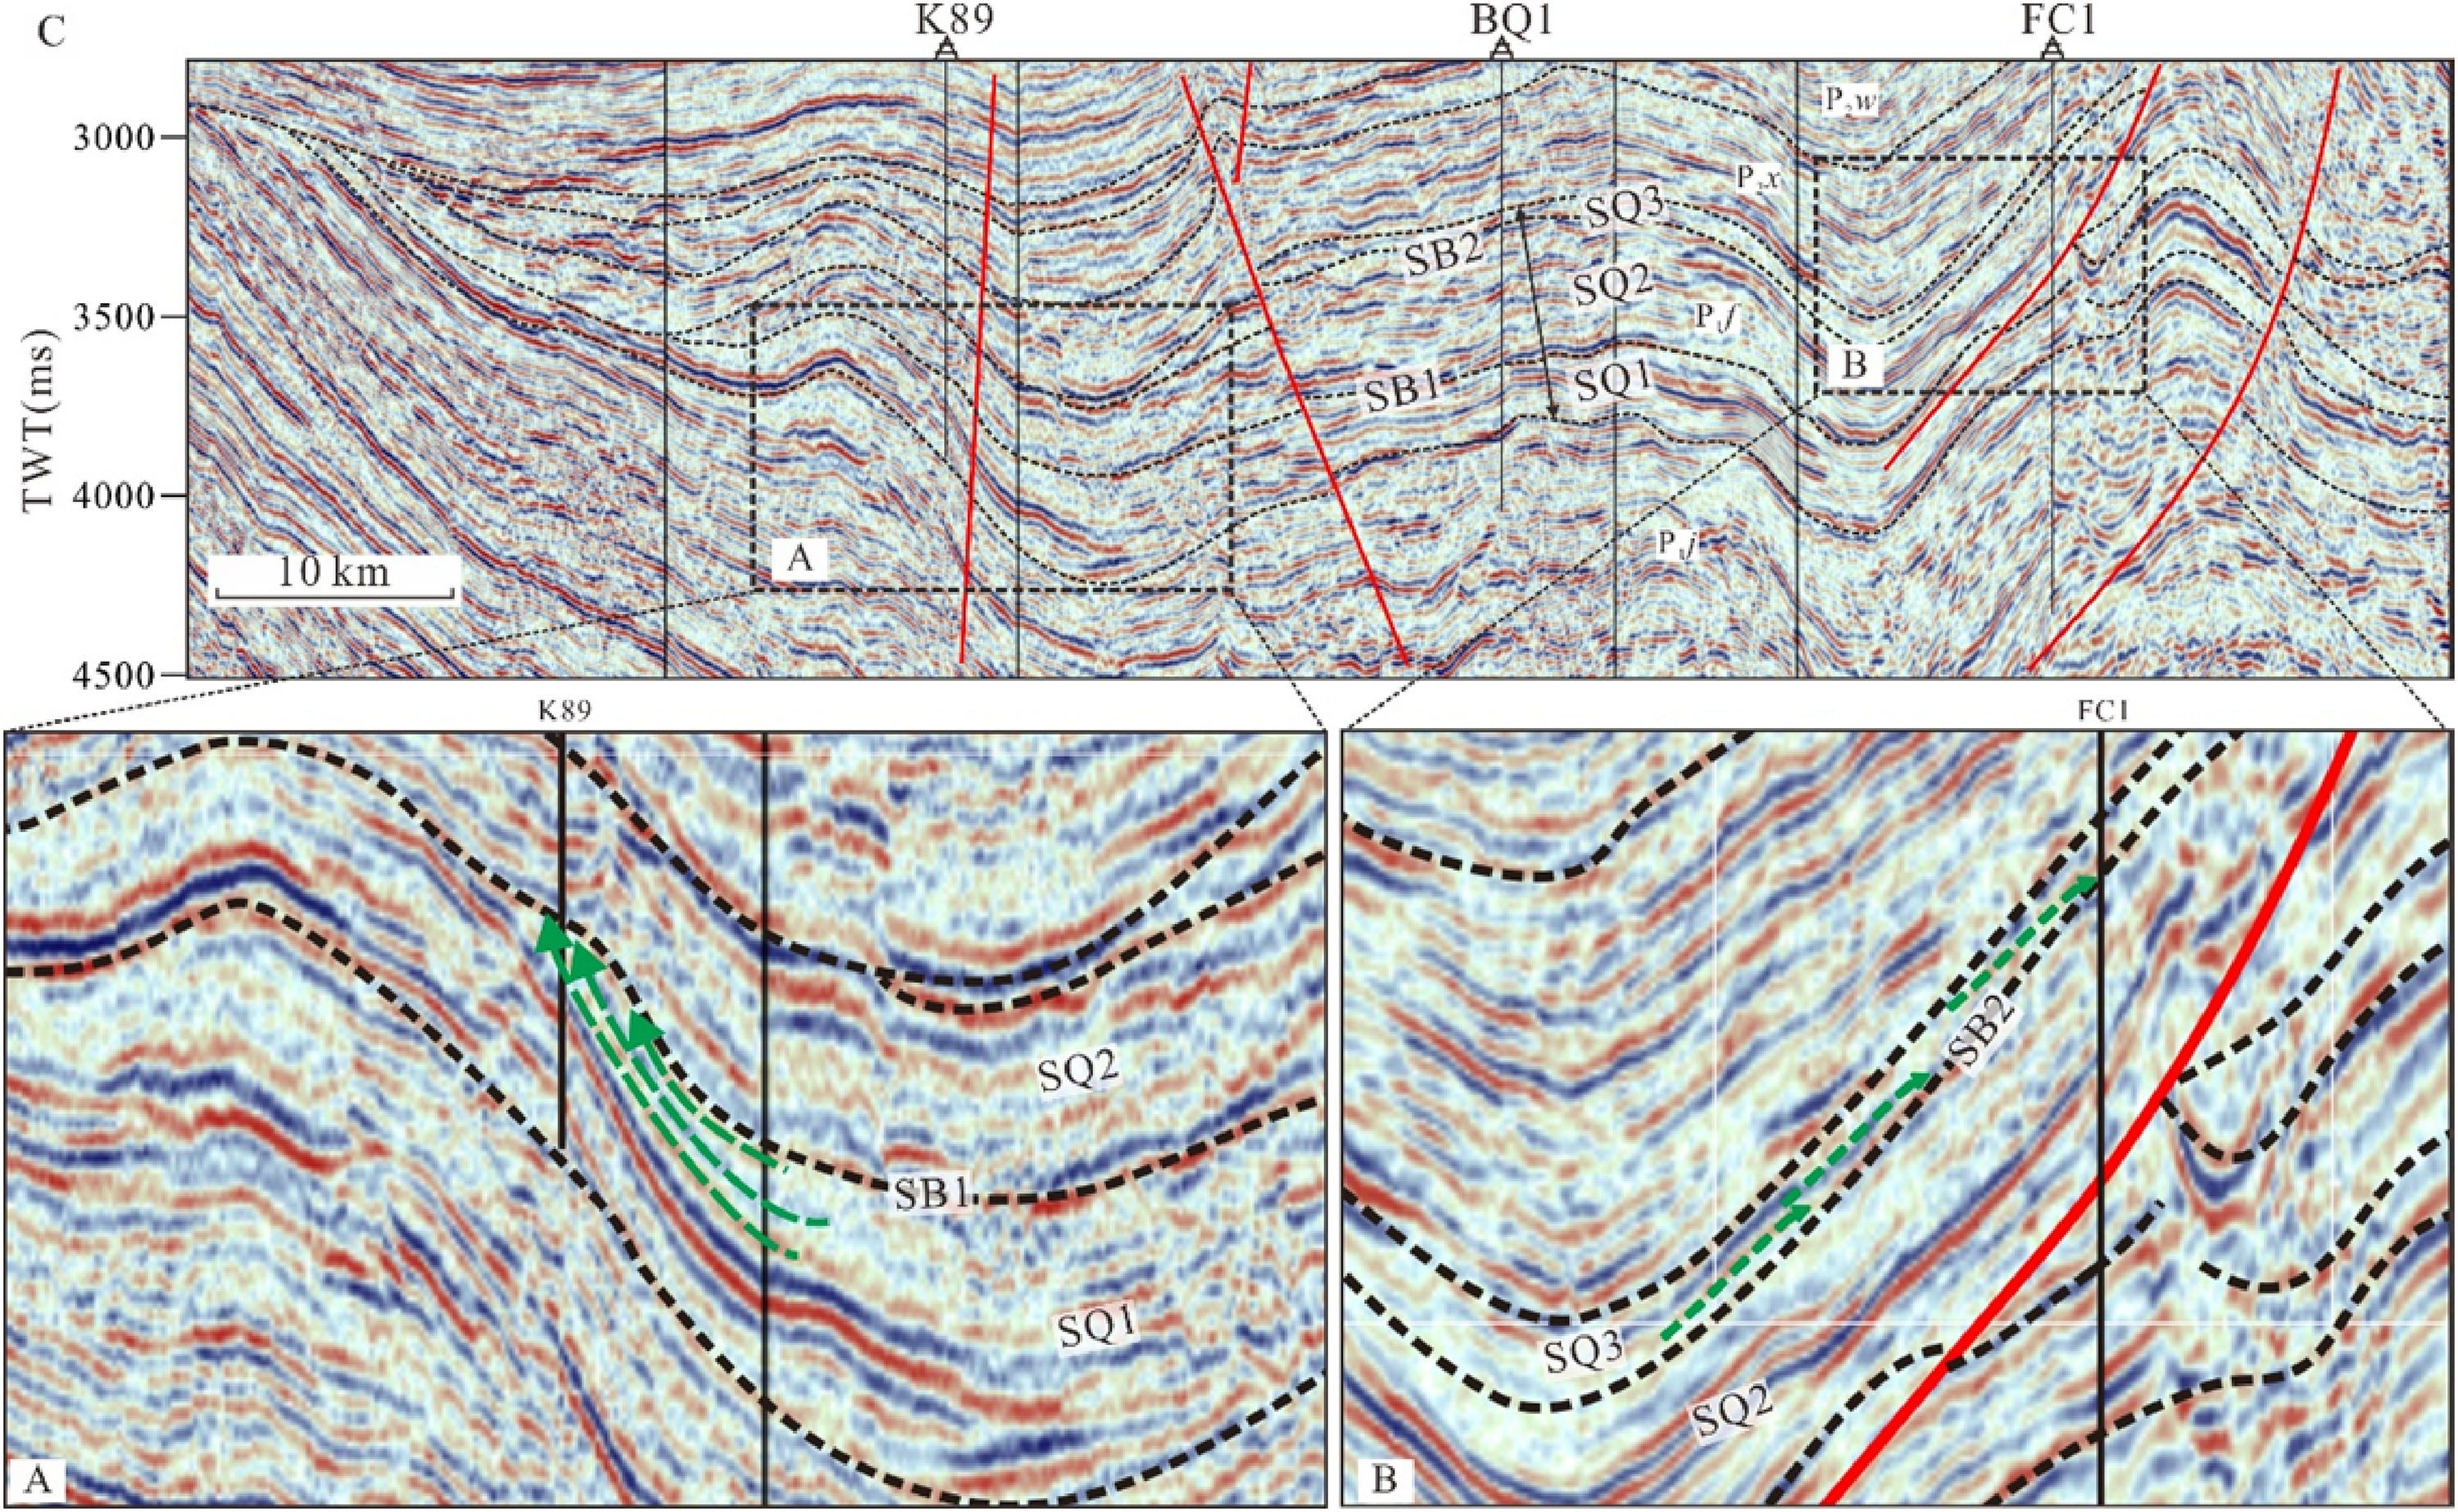
Third-order sequence subdivision in the seismic section passing through wells K89-BQ1-FC1.
A total of 2 distinct lithofacies were identified in SQ1, including dolomite (Figure 3(c) and (d)), tuff (Figure 3(b)) and other volcanic rocks (Figure 3(a)) in Figure 3, showing their main characteristics. Glutenite is instead of volcanic rocks and a lithologic plane of abrupt change occurs between them (Figure 3(f)). This would be regarded as the sequence boundary between SQ1 and SQ2 (Figures 3(f) and 4). Glutenite is mainly medium-grained, moderately rounded and poorly sorted. It has imbricated gravel that formed mainly from a gravity flow because the lake level decreased in the late part of SQ1 (Figure 3(e)). Dolomite, argillaceous dolostone, dolomitic mudstone, and other carbonate-rich rocks (Figure 3(g) to (k)) are widely found in SQ2. Although they are mainly fine-grained (Figure 3(g) to (k)), they may not be formed in deep-water environments (Wang et al., 2020). The widely distributed carbonate-rich rocks and saline minerals in this period were caused by the falling lake level, increased evaporation and increased salinity characterized by high Mn/Fe and Rb/K ratios (Zhang et al., 2018). They are normally formed in shallow to semi-deep lakes. During SQ3, sandstone, siltstone and mudstone (Figure 3(l) and (m)) developed due to terrigenous freshwater input and clastic sediment deposition.
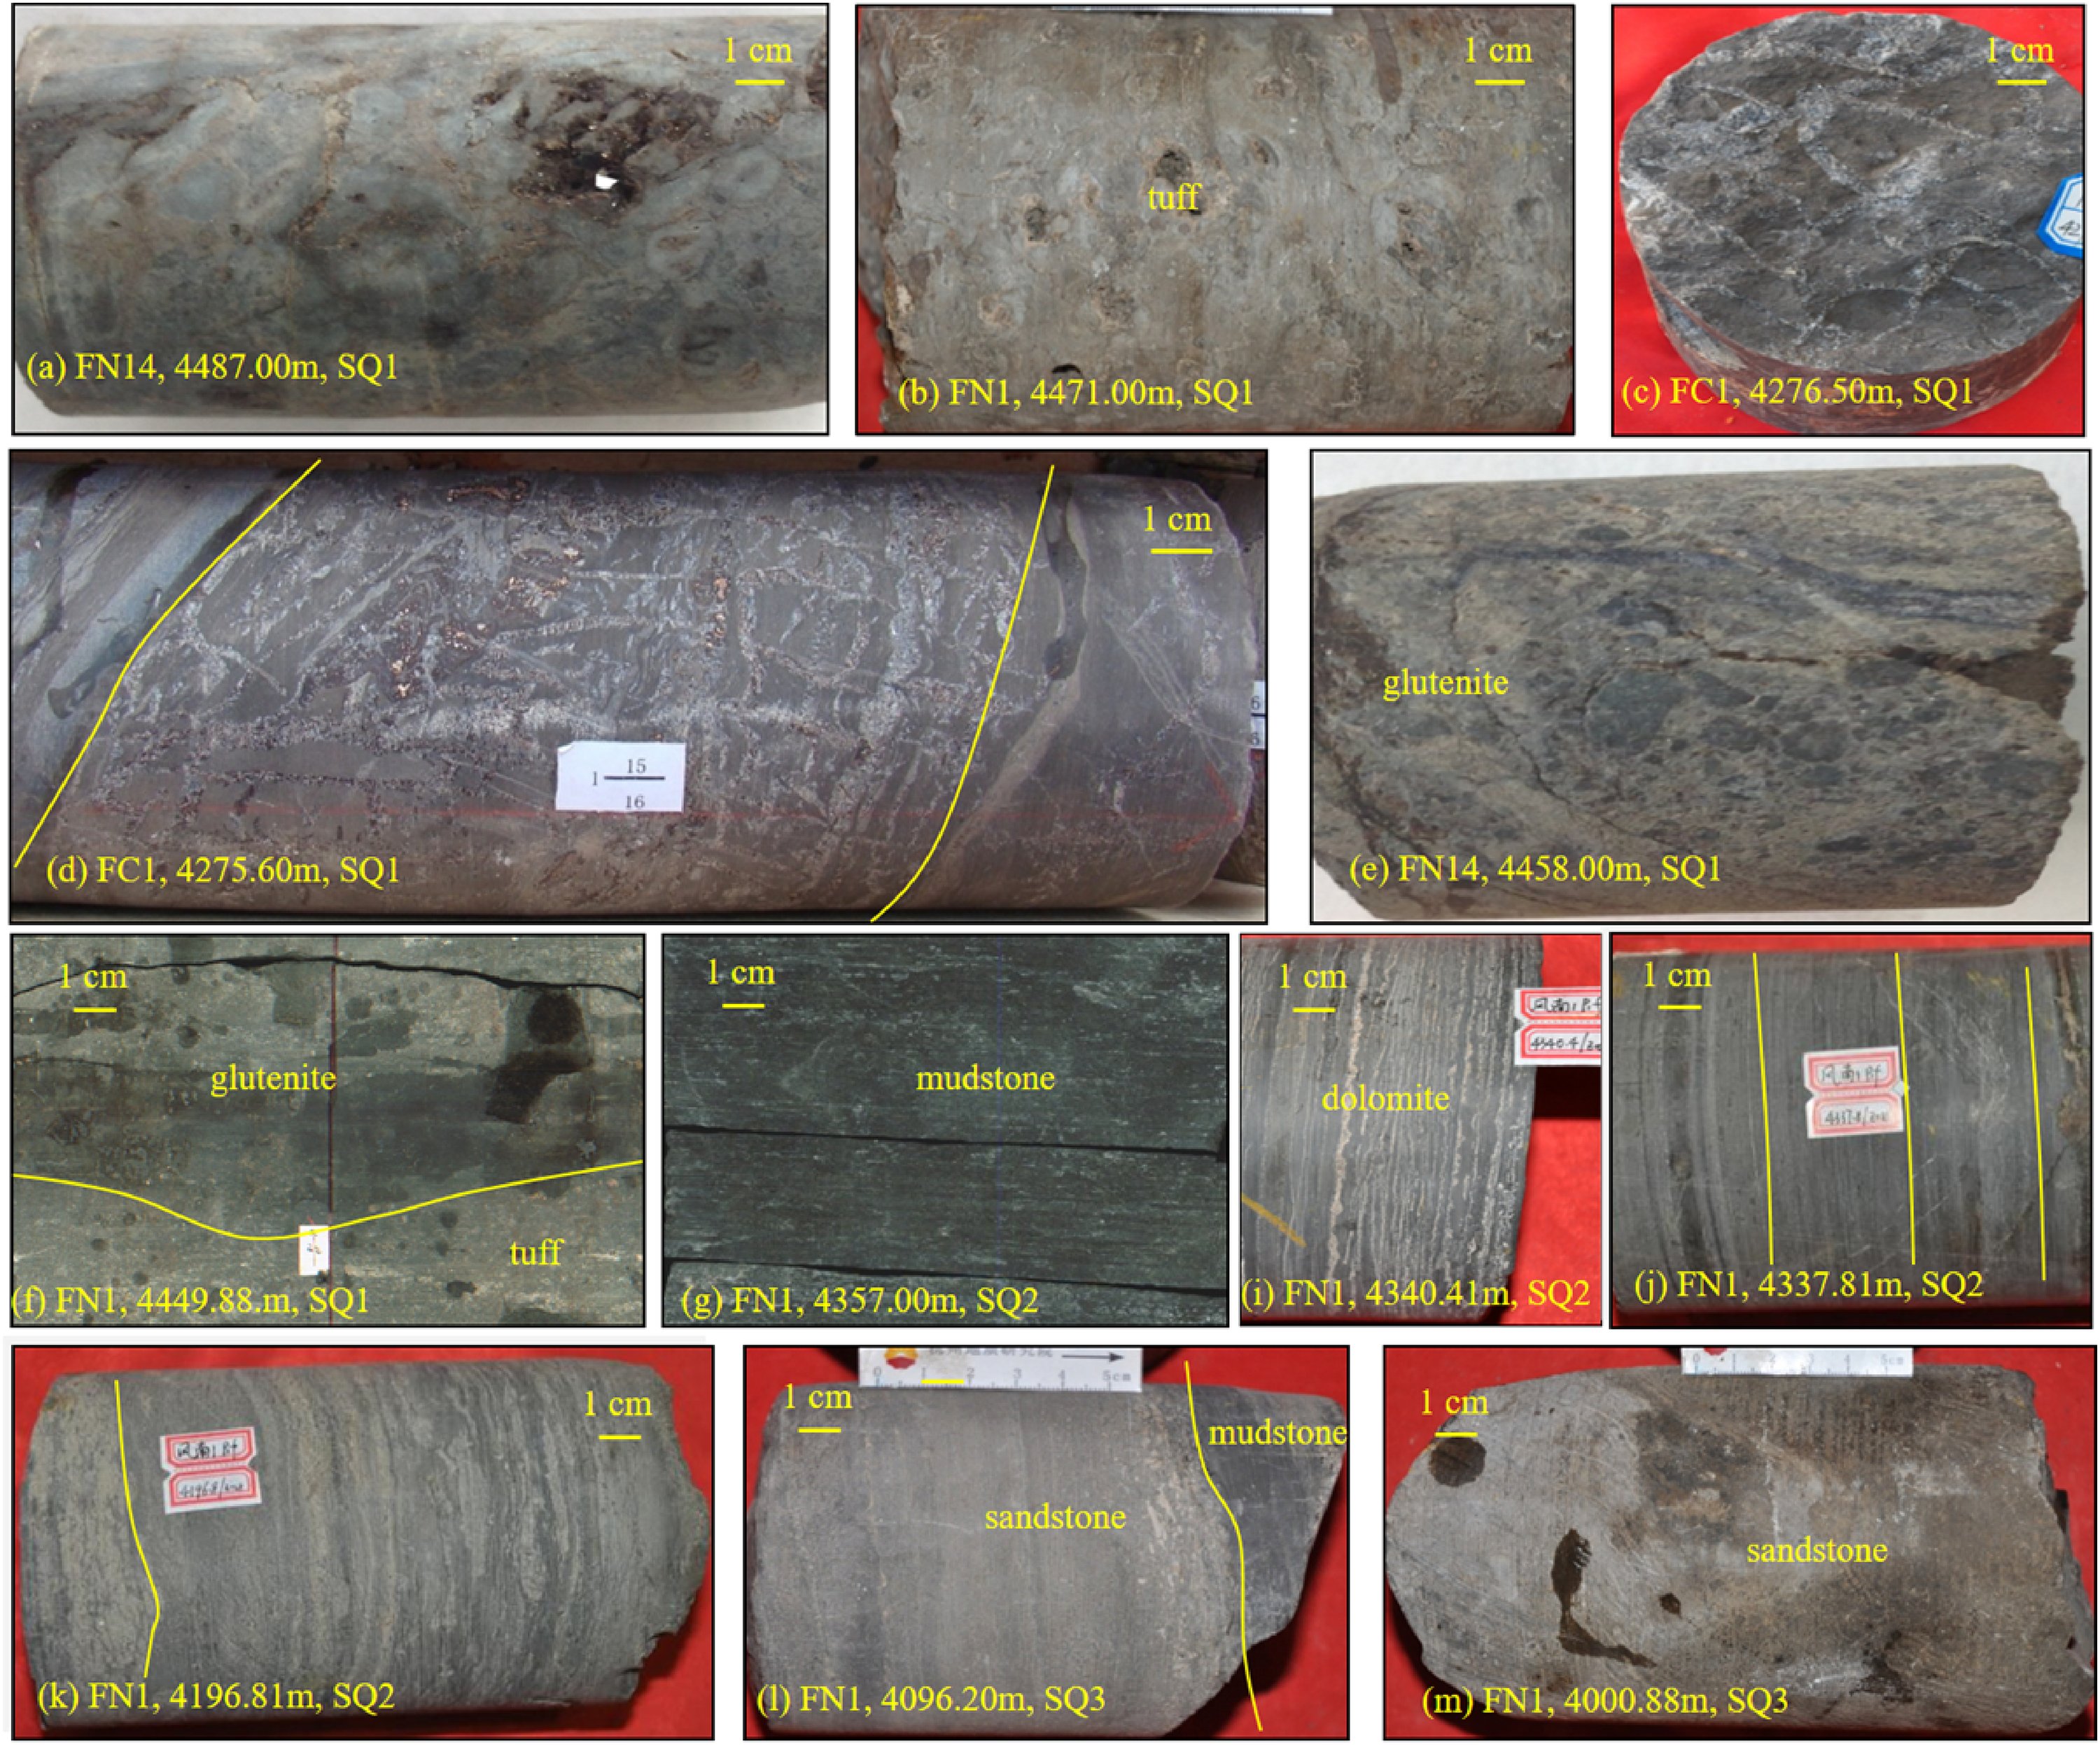
Typical photographs of cores from P1f in the study area.
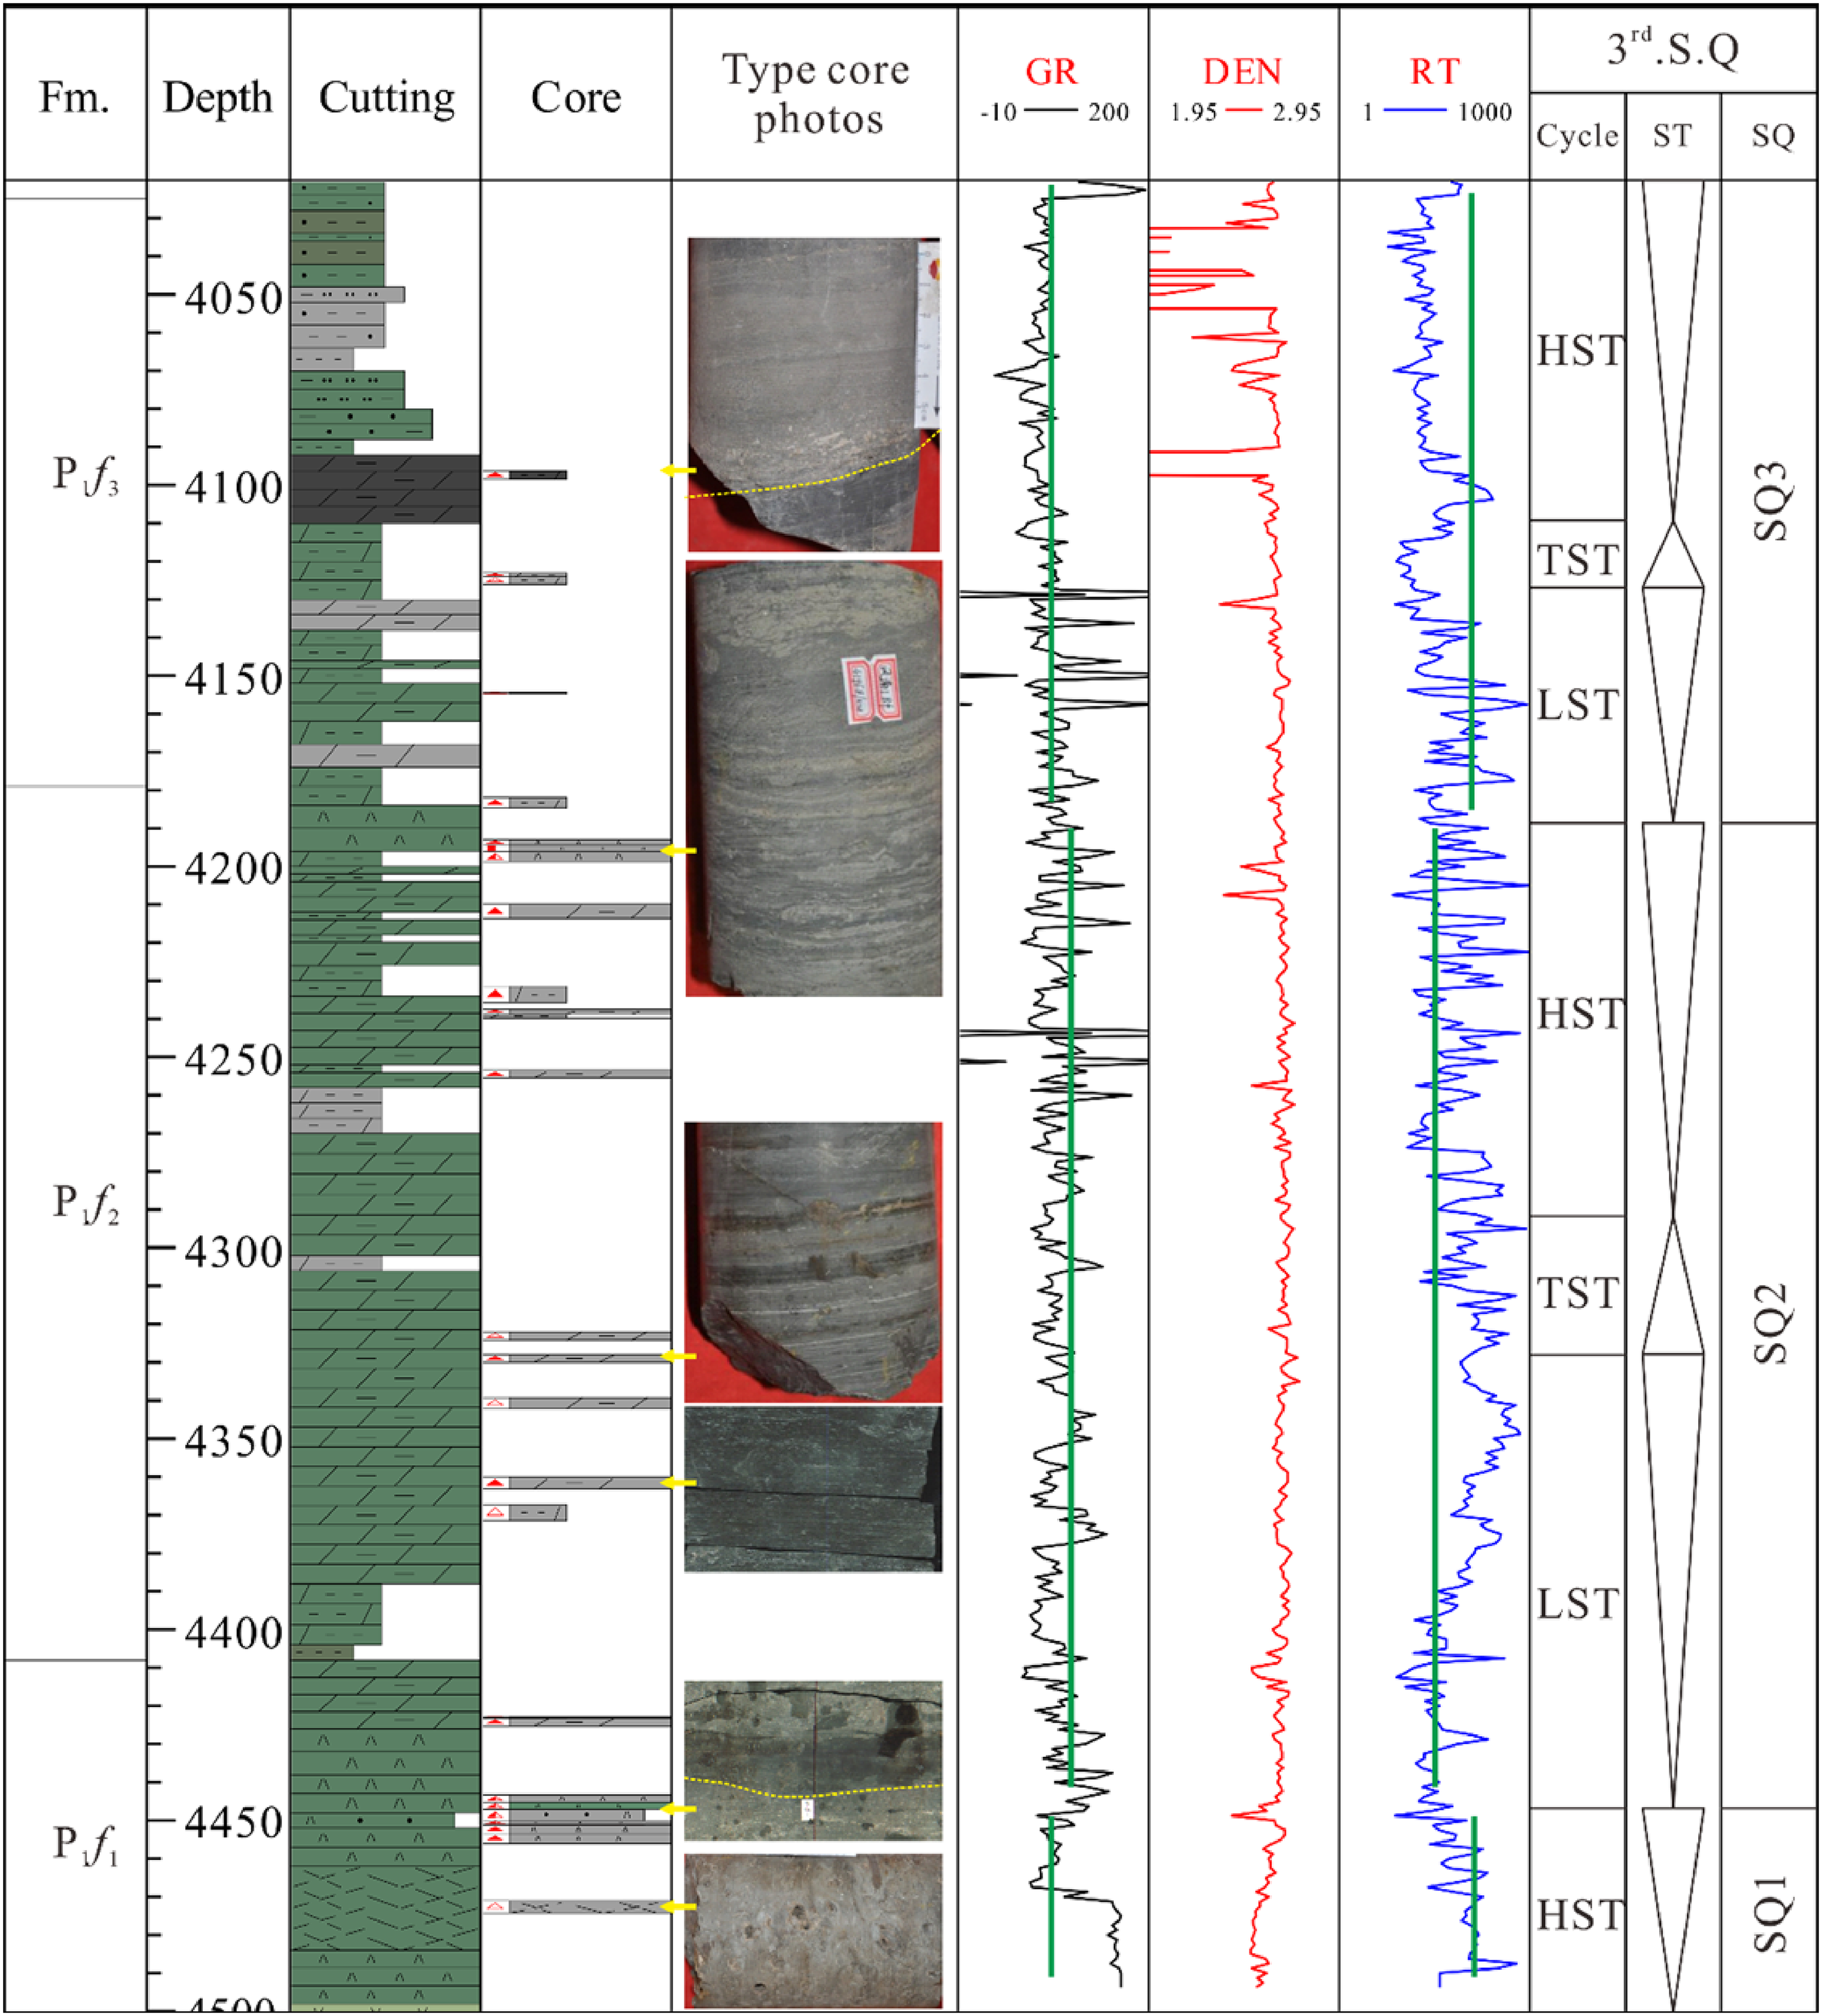
Sequence subdivision of well FN1.
In terms of the above third-order sequence classification scheme as well as cutting logging and well log responses, two sequence boundaries, SB1 and SB2, inside P1f and the corresponding three third-order sequences, SQ1, SQ2, and SQ3, were easily identified, each of which was further subdivided into 3 systems tracts (Figure 4). There is a suite of thick mudstone or silty mudstone, featuring high GR and low resistivity (RT), close to the top boundary of SQ1; SQ1 is mainly composed of shore-lacustrine and shallow lacustrine fan deltaic front mudstone and siltstone. SQ2 consists of interbedded argillaceous dolomite and dolomitic mudstone rich in alkaline minerals, which are characterized by sharp saw tooth GR and RT curves. SQ3 consists of siltstone and mudstone, at the bottom of which there is a thin mudstone layer.
In summary, the three sequences differ greatly in their log responses. SQ1 is characterized by high GR and low RT values. However, SQ2 is characterized by saw-tooth, relatively low GR and high RT. SQ3, similar with SQ1, is characterized by relatively high GR and low RT (Figures 4 and 5). Abrupt changes are easily identified between different sequences; these are marked as sequence boundaries.
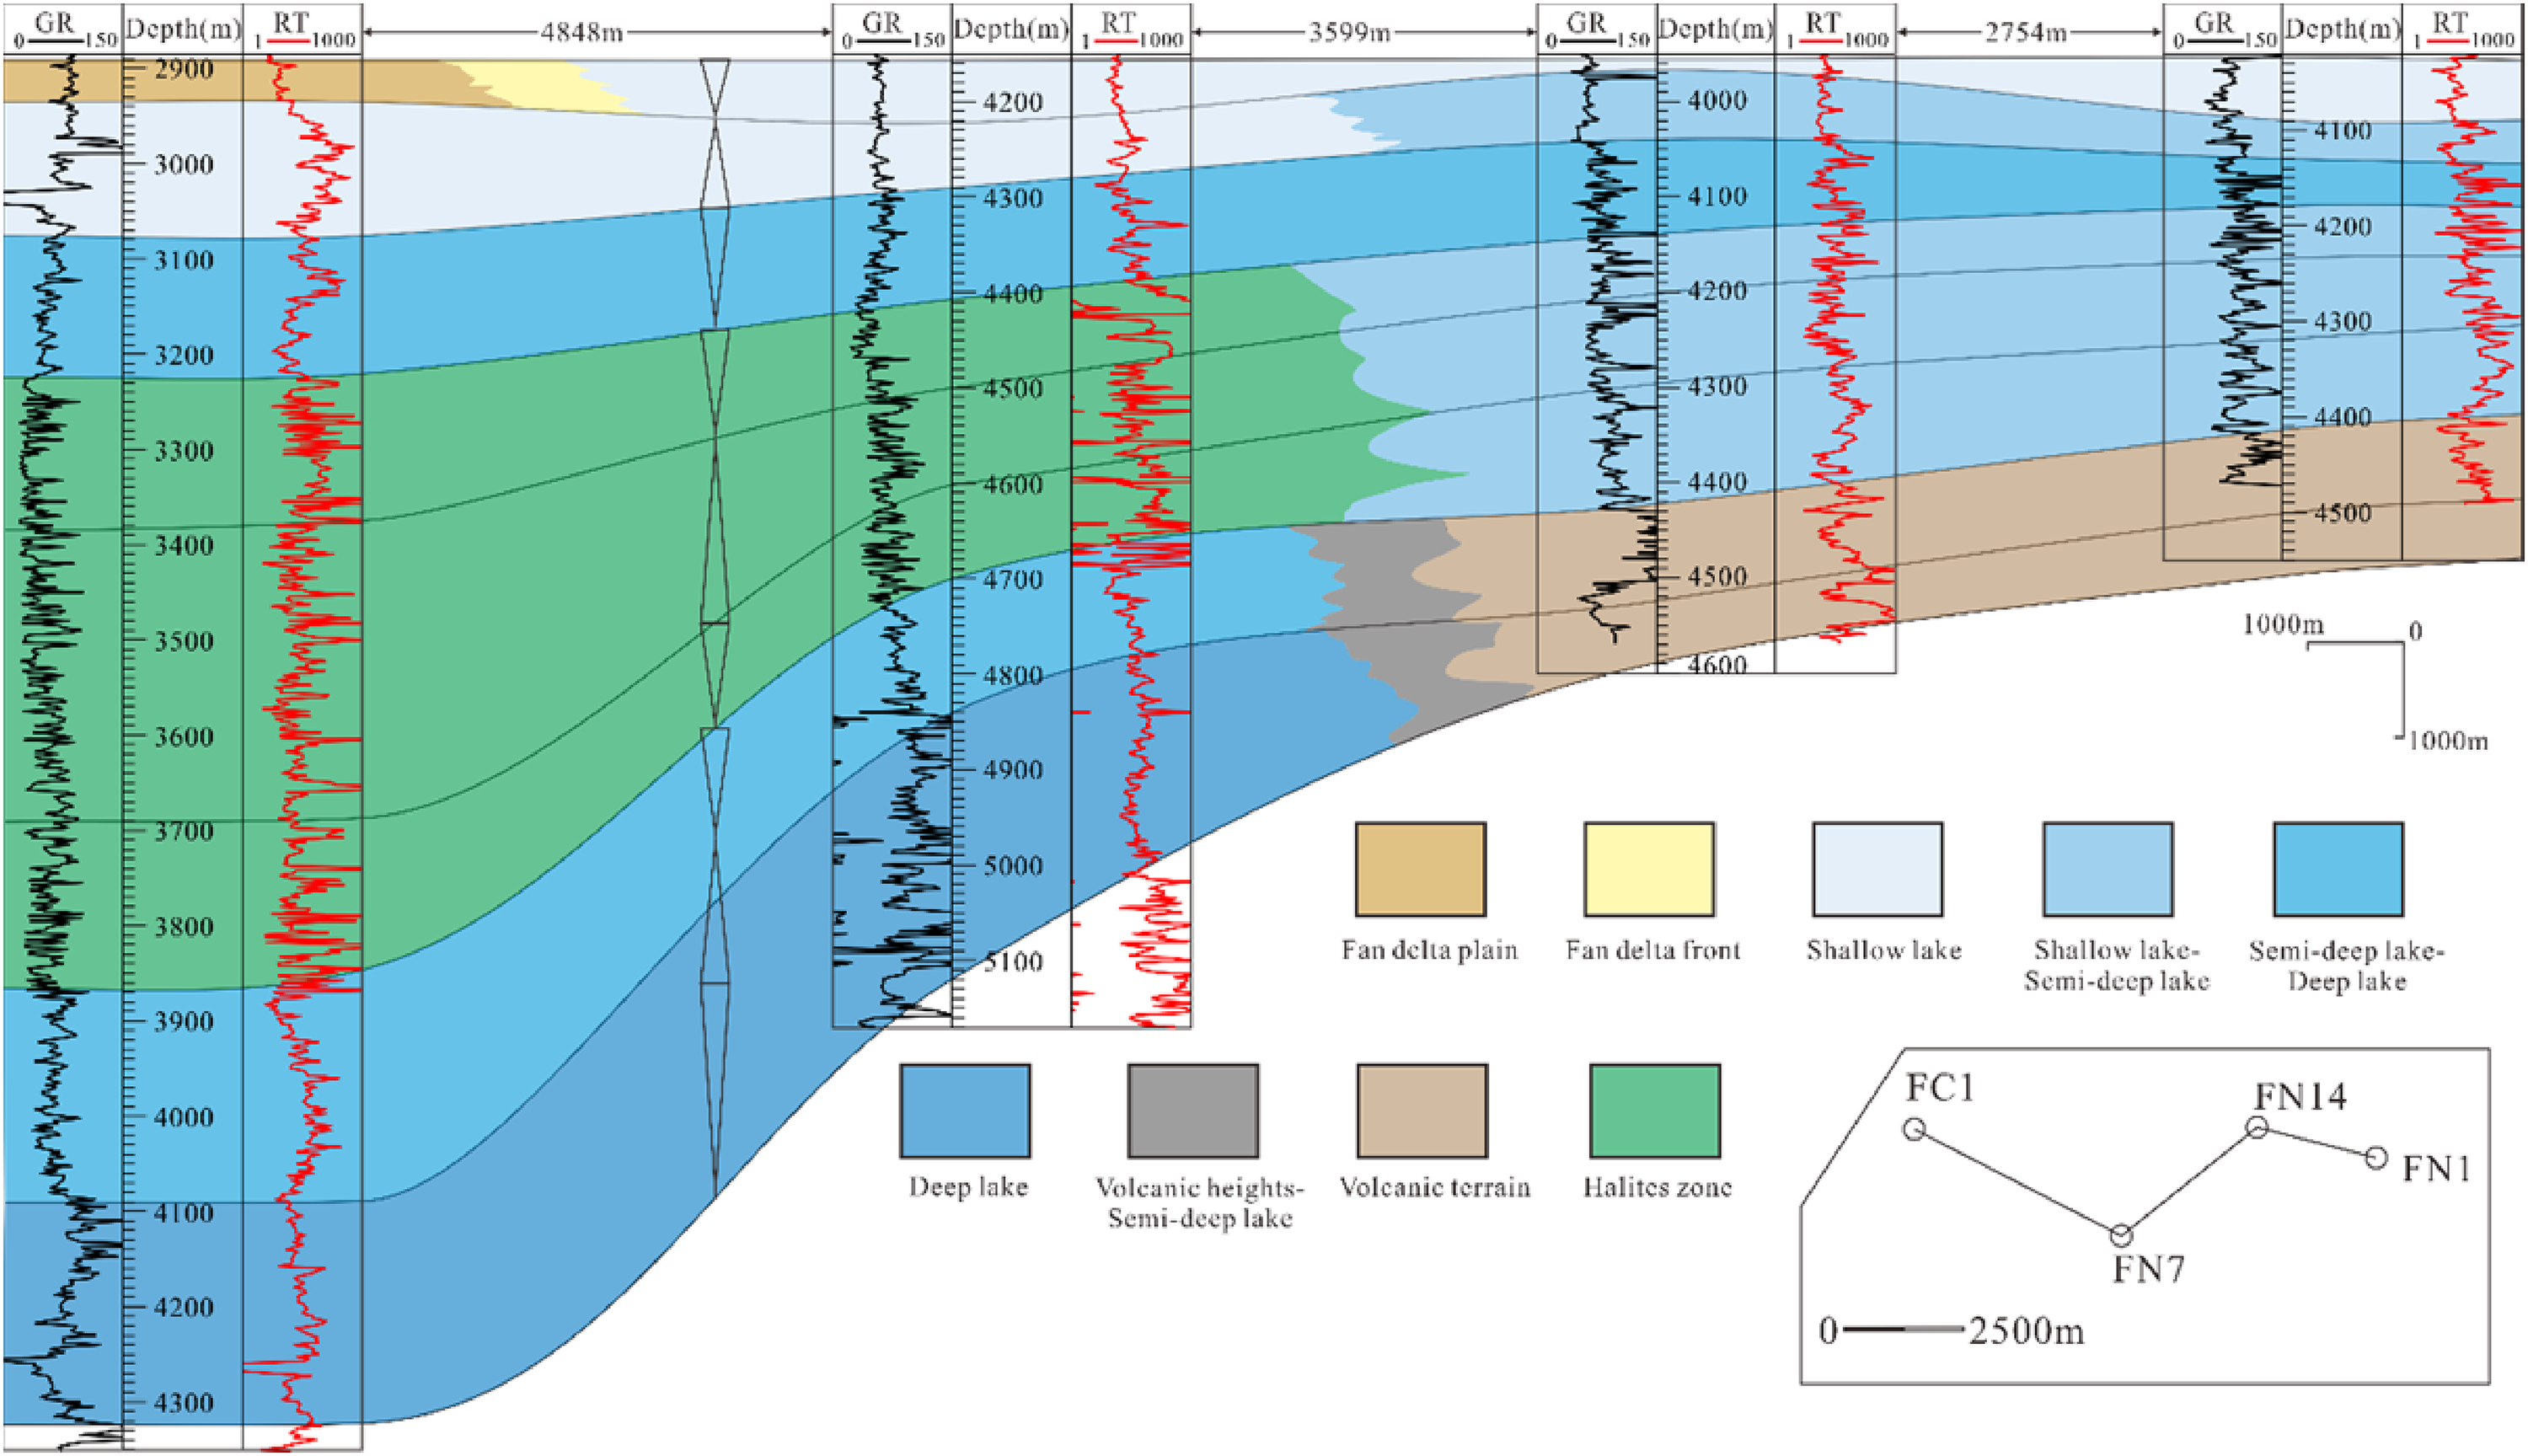
Cross-well section of sedimentary facies from different sequences.
Sedimentary environments
In accordance with the log responses of four representative wells, the boundaries of three third-order sequences were easily identified (Figure 5). SQ1 mainly contains volcanic facies and shallow to semi-deep lacustrine facies, with fine-grained mudstone, silty mudstone, and volcanic rocks (Figures 3 and 5). SQ2 mainly contains shallow to semi-deep lacustrine facies, with fine-grained sediments and alkaline sediments containing trona and other alkaline mineral layers(Figures 3 and 5). SQ3 mainly comprises shallow to semi-deep lacustrine facies, with fine-grained sediments and sandstone. Otherwise, fan deltaic plain and front subfacies with coarse-grained pebbly sandstone occur in the northwestern of the study area.
Spatially, the marginal region was more affected by volcanic activities in the Xiazijie area (Wang et al., 2021; Zhang et al., 2018). The sedimentary environments of the transitional and central regions were shallow to semi-deep lakes and showed little spatial change (Zhang et al., 2018). The facies of the middle and lower members of P1f were mainly shallow to semi-deep lake facies (Figure 5). The fan delta was distributed in late P1f (Figure 5). Therefore, the selected samples of this study focus on shallow to semi-deep lakes from the transitional region and central region.
Source rock geochemistry in different sequences
Figure 6 shows the geochemical sections of different sequences in the study area. The TOC contents and PG values (S1 + S2, mg HC/g rock) of SQ1 samples range from 0.4% to 1.0% and from 1.0 mg/g to 3.0 mg/g, respectively, indicating poor to fair source rocks. The TOC contents and PG values of SQ2 samples range from 0.2% to 1.5% and from 0.7 mg/g to 11.5 mg/g, respectively, showing poor to good source rocks. For SQ3 samples, the TOC contents range from 0.2% to 1.1%, and the PG values range from 1.0 mg/g to 10.0 mg/g, characterized by poor to fair source rocks (Figure 6). The hydrogen index (HI) values of SQ1 samples ranges from 150–400 mg/g, suggesting typical geochemical characteristics of Type II2 to Type III kerogen. The samples from SQ2 were mostly dominated by Type II1 to Type II2 kerogen with HI >200 mg/g. The SQ3 samples mainly plot in the region of Type II2 to Type III kerogen, similar to SQ1 (Figure 6).
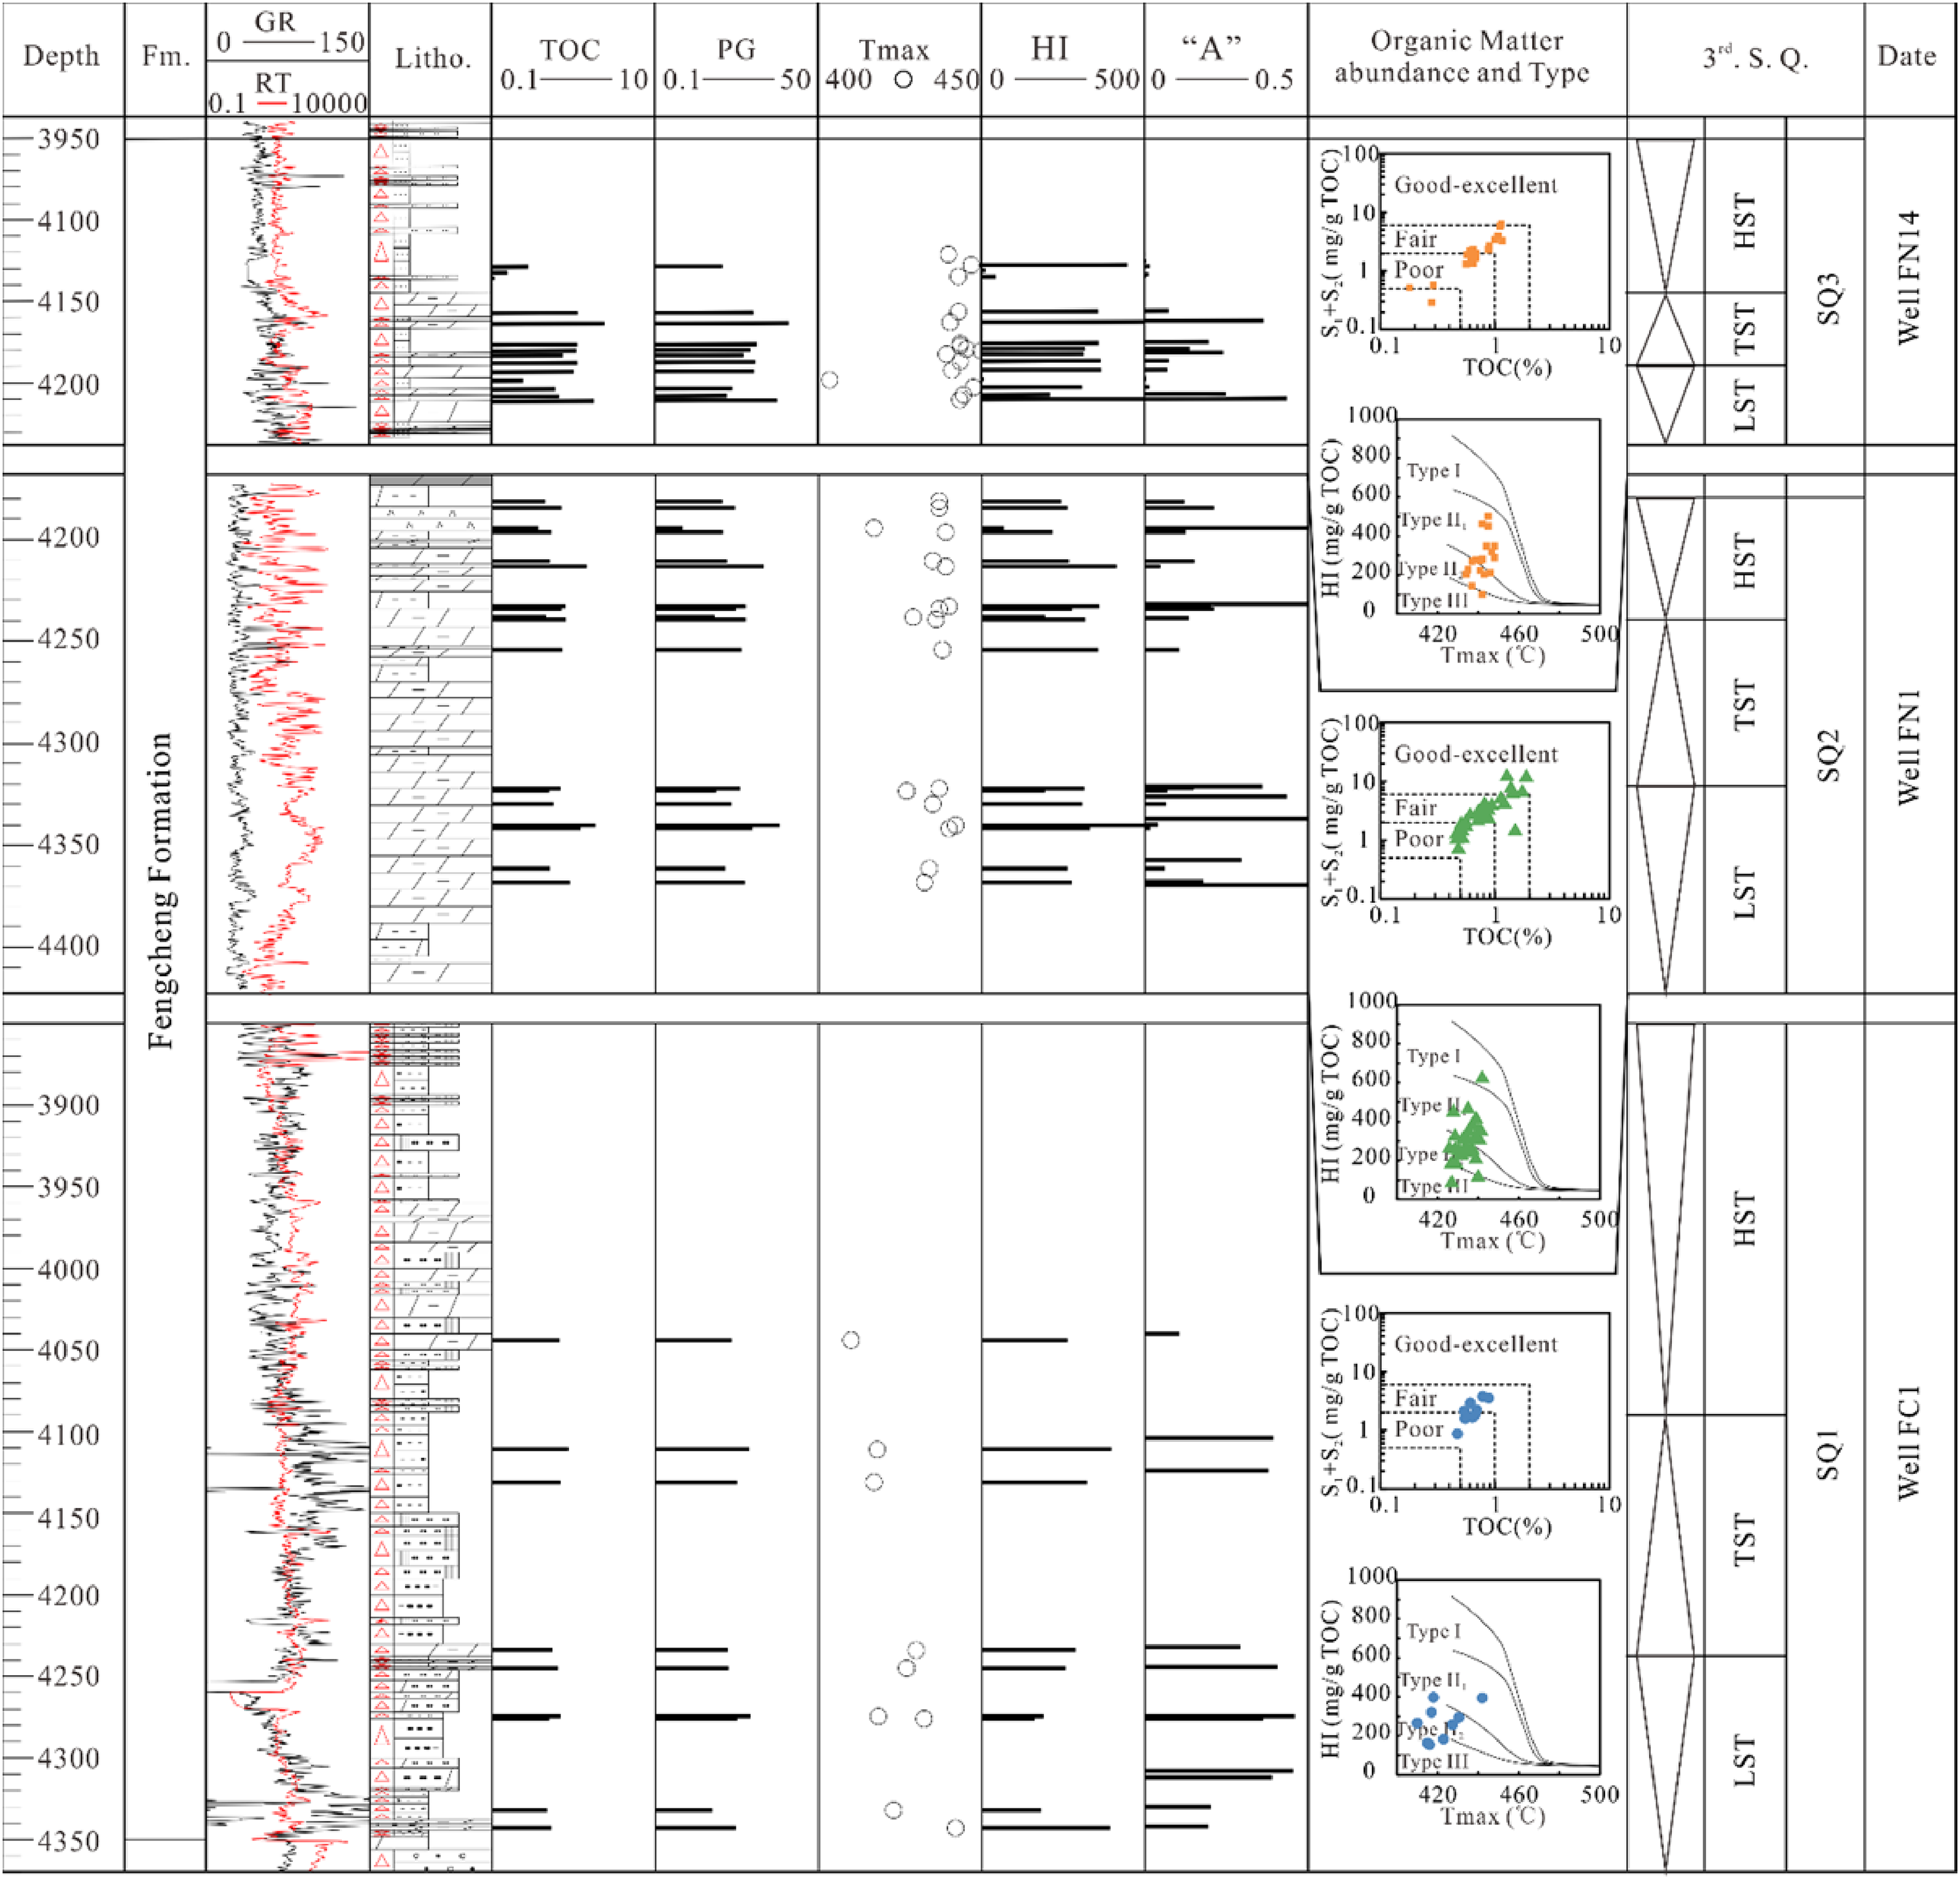
Geochemical sections of source rocks from different sequences of P1f.
The Tmax values of the SQ1, SQ2 and SQ3 samples are in the ranges of 410°C–445°C, 425°C–445°C and 429°C–450°C, respectively. It is noted that the Tmax of samples from SQ1 is lower than that of the samples from SQ2 and SQ3 at similar depths, showing that the organic matter maturity of SQ1 in the well FC1 is lower than that of the SQ2 and SQ3 samples at similar depths. The results may be caused by the development of alkaline minerals in P1f. Special minerals, such as calcium carbonate and boronite, were easily identified in the cores of SQ1 (Figure 3(c) and (d)). However, the biomarker parameters used to characterize the maturity of organic matter, such as odd-even predominance (OEP) and carbon preference index (CPI) (Table 1), show little difference in organic matter maturity.
Organic geochemistry parameters of source rock samples from Fengcheng Formation in Mahu Sag.
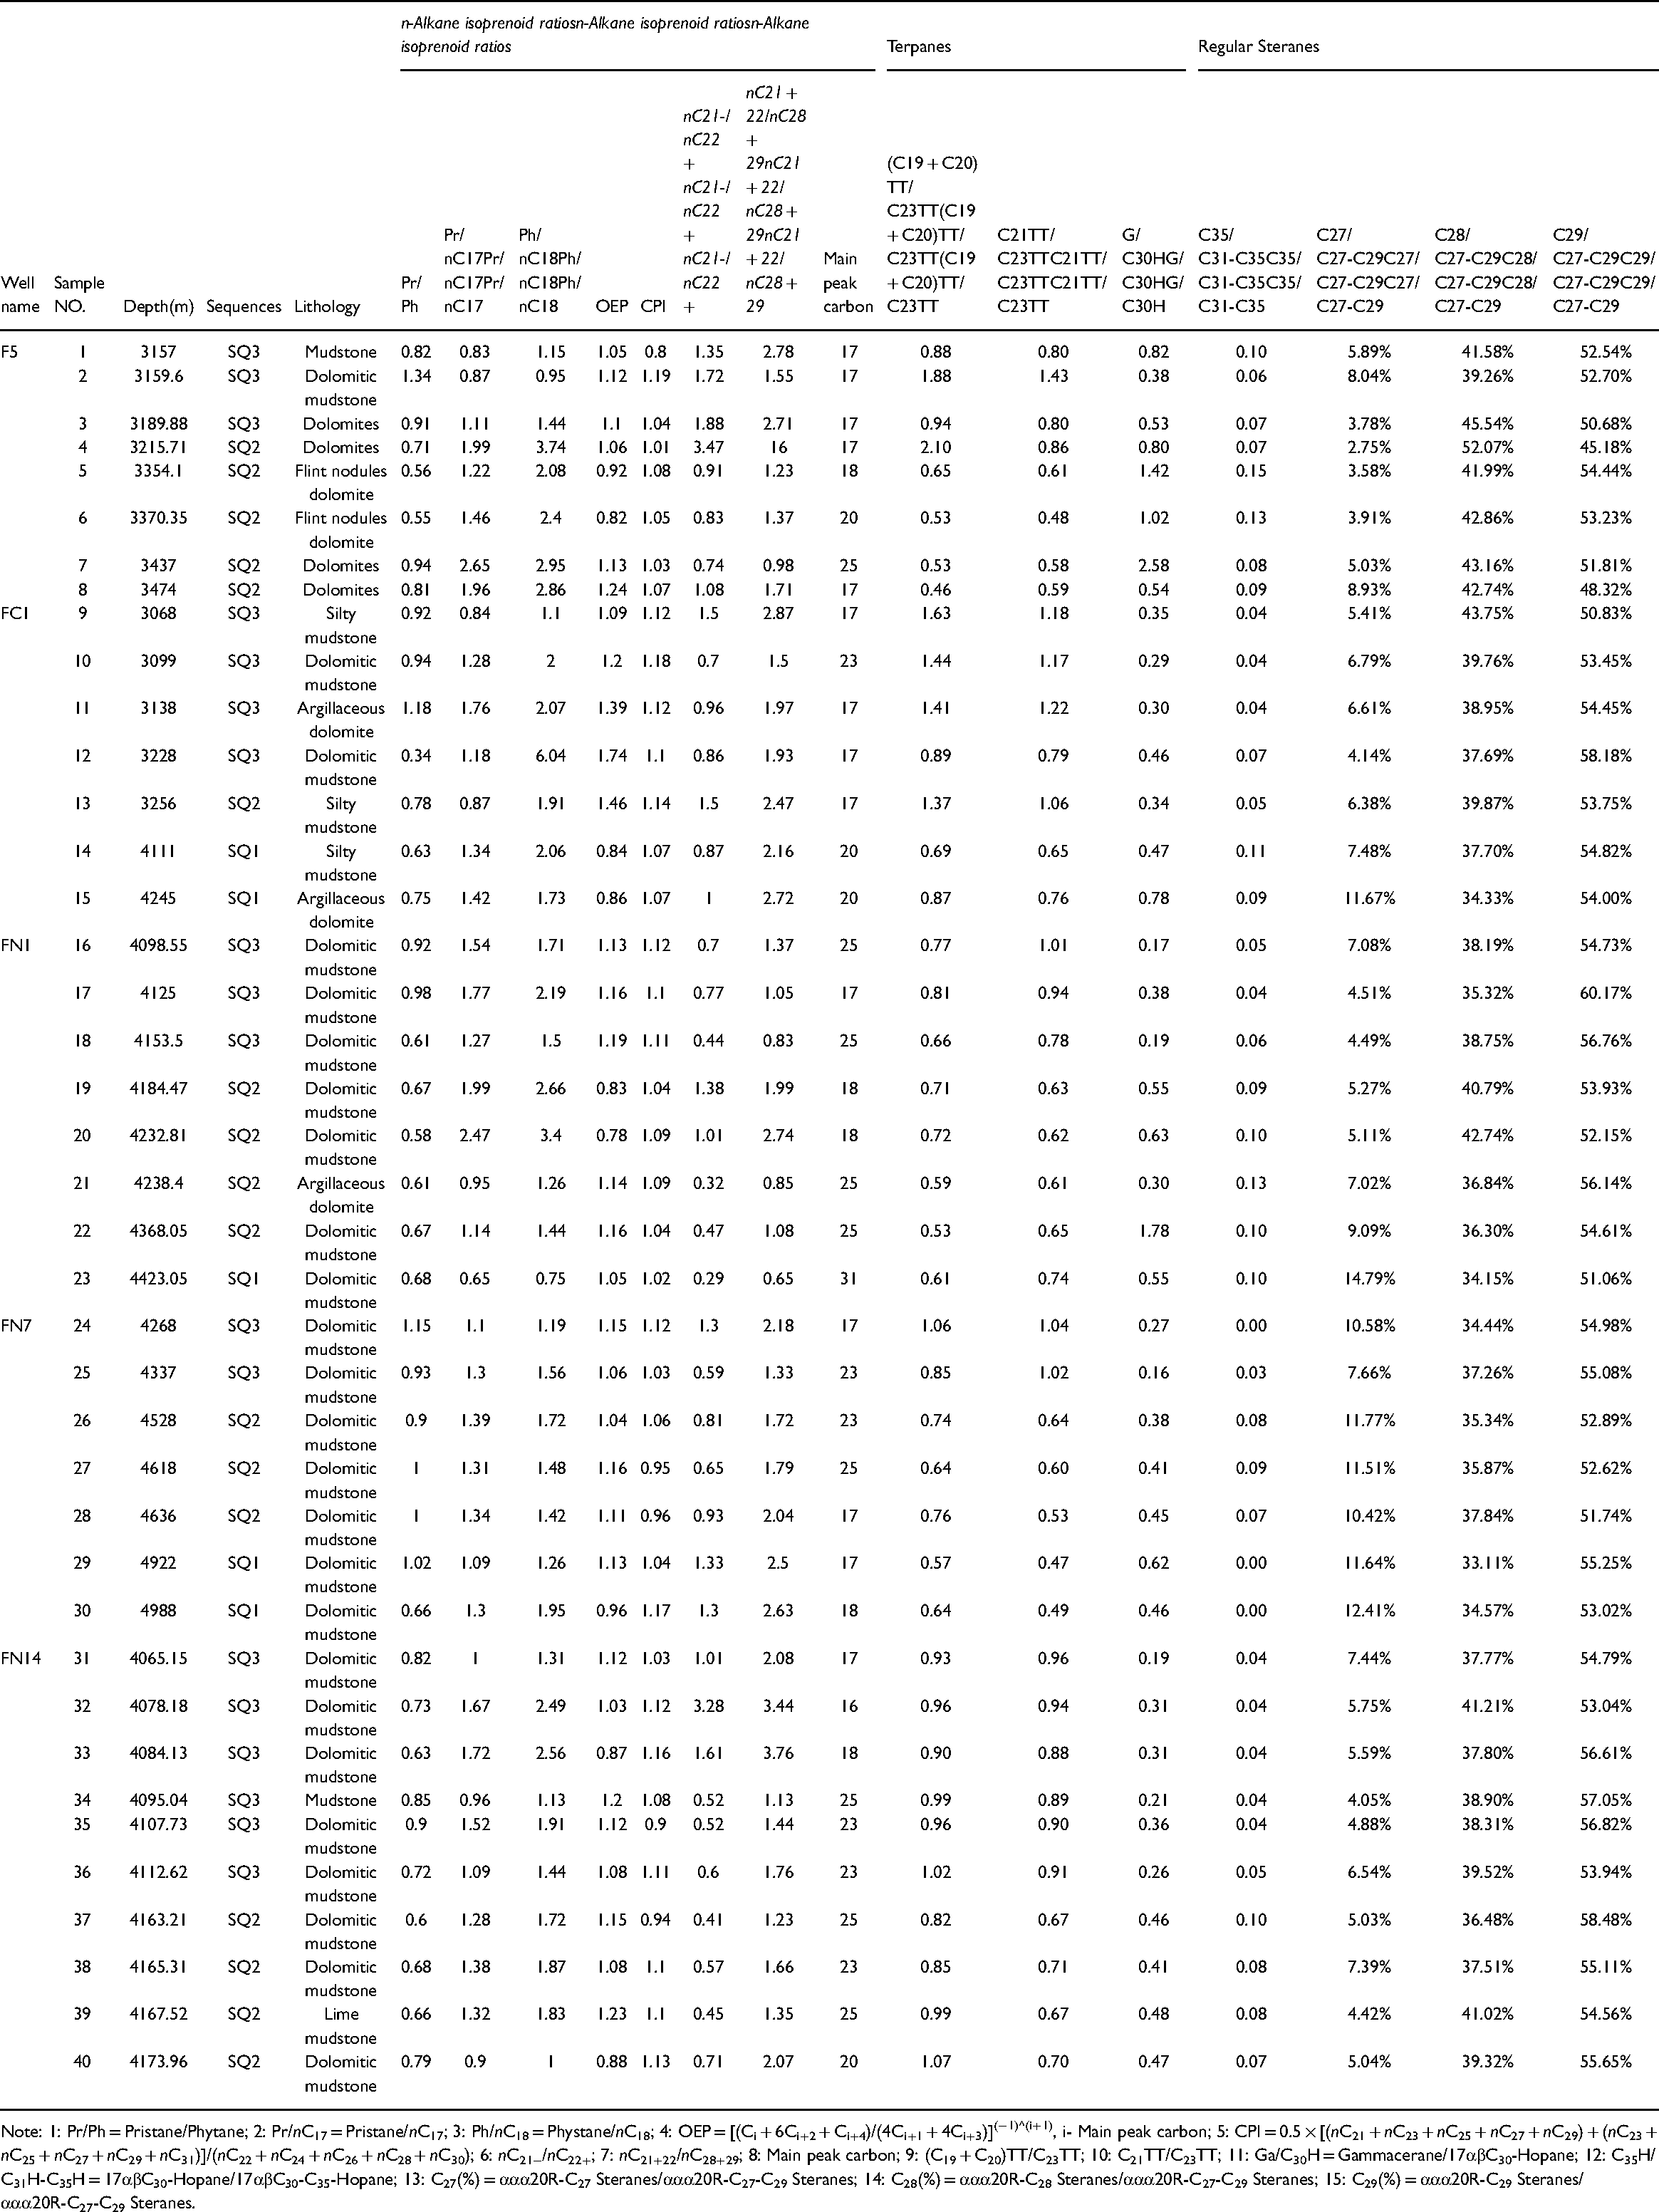
Note: 1: Pr/Ph = Pristane/Phytane; 2: Pr/nC17 = Pristane/nC17; 3: Ph/nC18 = Phystane/nC18; 4: OEP = [(Ci + 6Ci+2 + Ci+4)/(4Ci+1 + 4Ci+3)](−1)^(i+1), i- Main peak carbon; 5: CPI = 0.5 × [(nC21 + nC23 + nC25 + nC27 + nC29) + (nC23 + nC25 + nC27 + nC29 + nC31)]/(nC22 + nC24 + nC26 + nC28 + nC30); 6: nC21−/nC22+; 7: nC21+22/nC28+29; 8: Main peak carbon; 9: (C19 + C20)TT/C23TT; 10: C21TT/C23TT; 11: Ga/C30H = Gammacerane/17αβC30-Hopane; 12: C35H/C31H-C35H = 17αβC30-Hopane/17αβC30-C35-Hopane; 13: C27(%) = ααα20R-C27 Steranes/ααα20R-C27-C29 Steranes; 14: C28(%) = ααα20R-C28 Steranes/ααα20R-C27-C29 Steranes; 15: C29(%) = ααα20R-C29 Steranes/ααα20R-C27-C29 Steranes.
Lipidic compounds
n-alkanes and isoprenoid hydrocarbons
N-alkanes, widely occurring in extracts from source rock and oil samples, are the main components of saturated hydrocarbons. Pristane (Pr) and phytane (Ph) are common isoprenoid hydrocarbons (Peters and Moldowan, 1993). Abundant n-alkanes and isoprenoid compounds were detected in the SQ1, SQ2, and SQ3 source rock samples of P1f in the study area. In terms of the carbon number of n-alkanes, SQ3 samples exhibit nC11-nC29, with the dominant peak at nC17, and have a pre-peak distribution pattern (Figure 7(a)). SQ2 samples exhibit nC14-nC29, with the dominant peak at nC17, and have a pre-peak distribution pattern (Figure 7(b)). However, the relative content of large carbon numbers is higher (Figure 7(a)). SQ1 samples exhibit nC14-nC35, with the dominant peak at nC20, and have a pre-peak distribution pattern (Figure 7(c)).
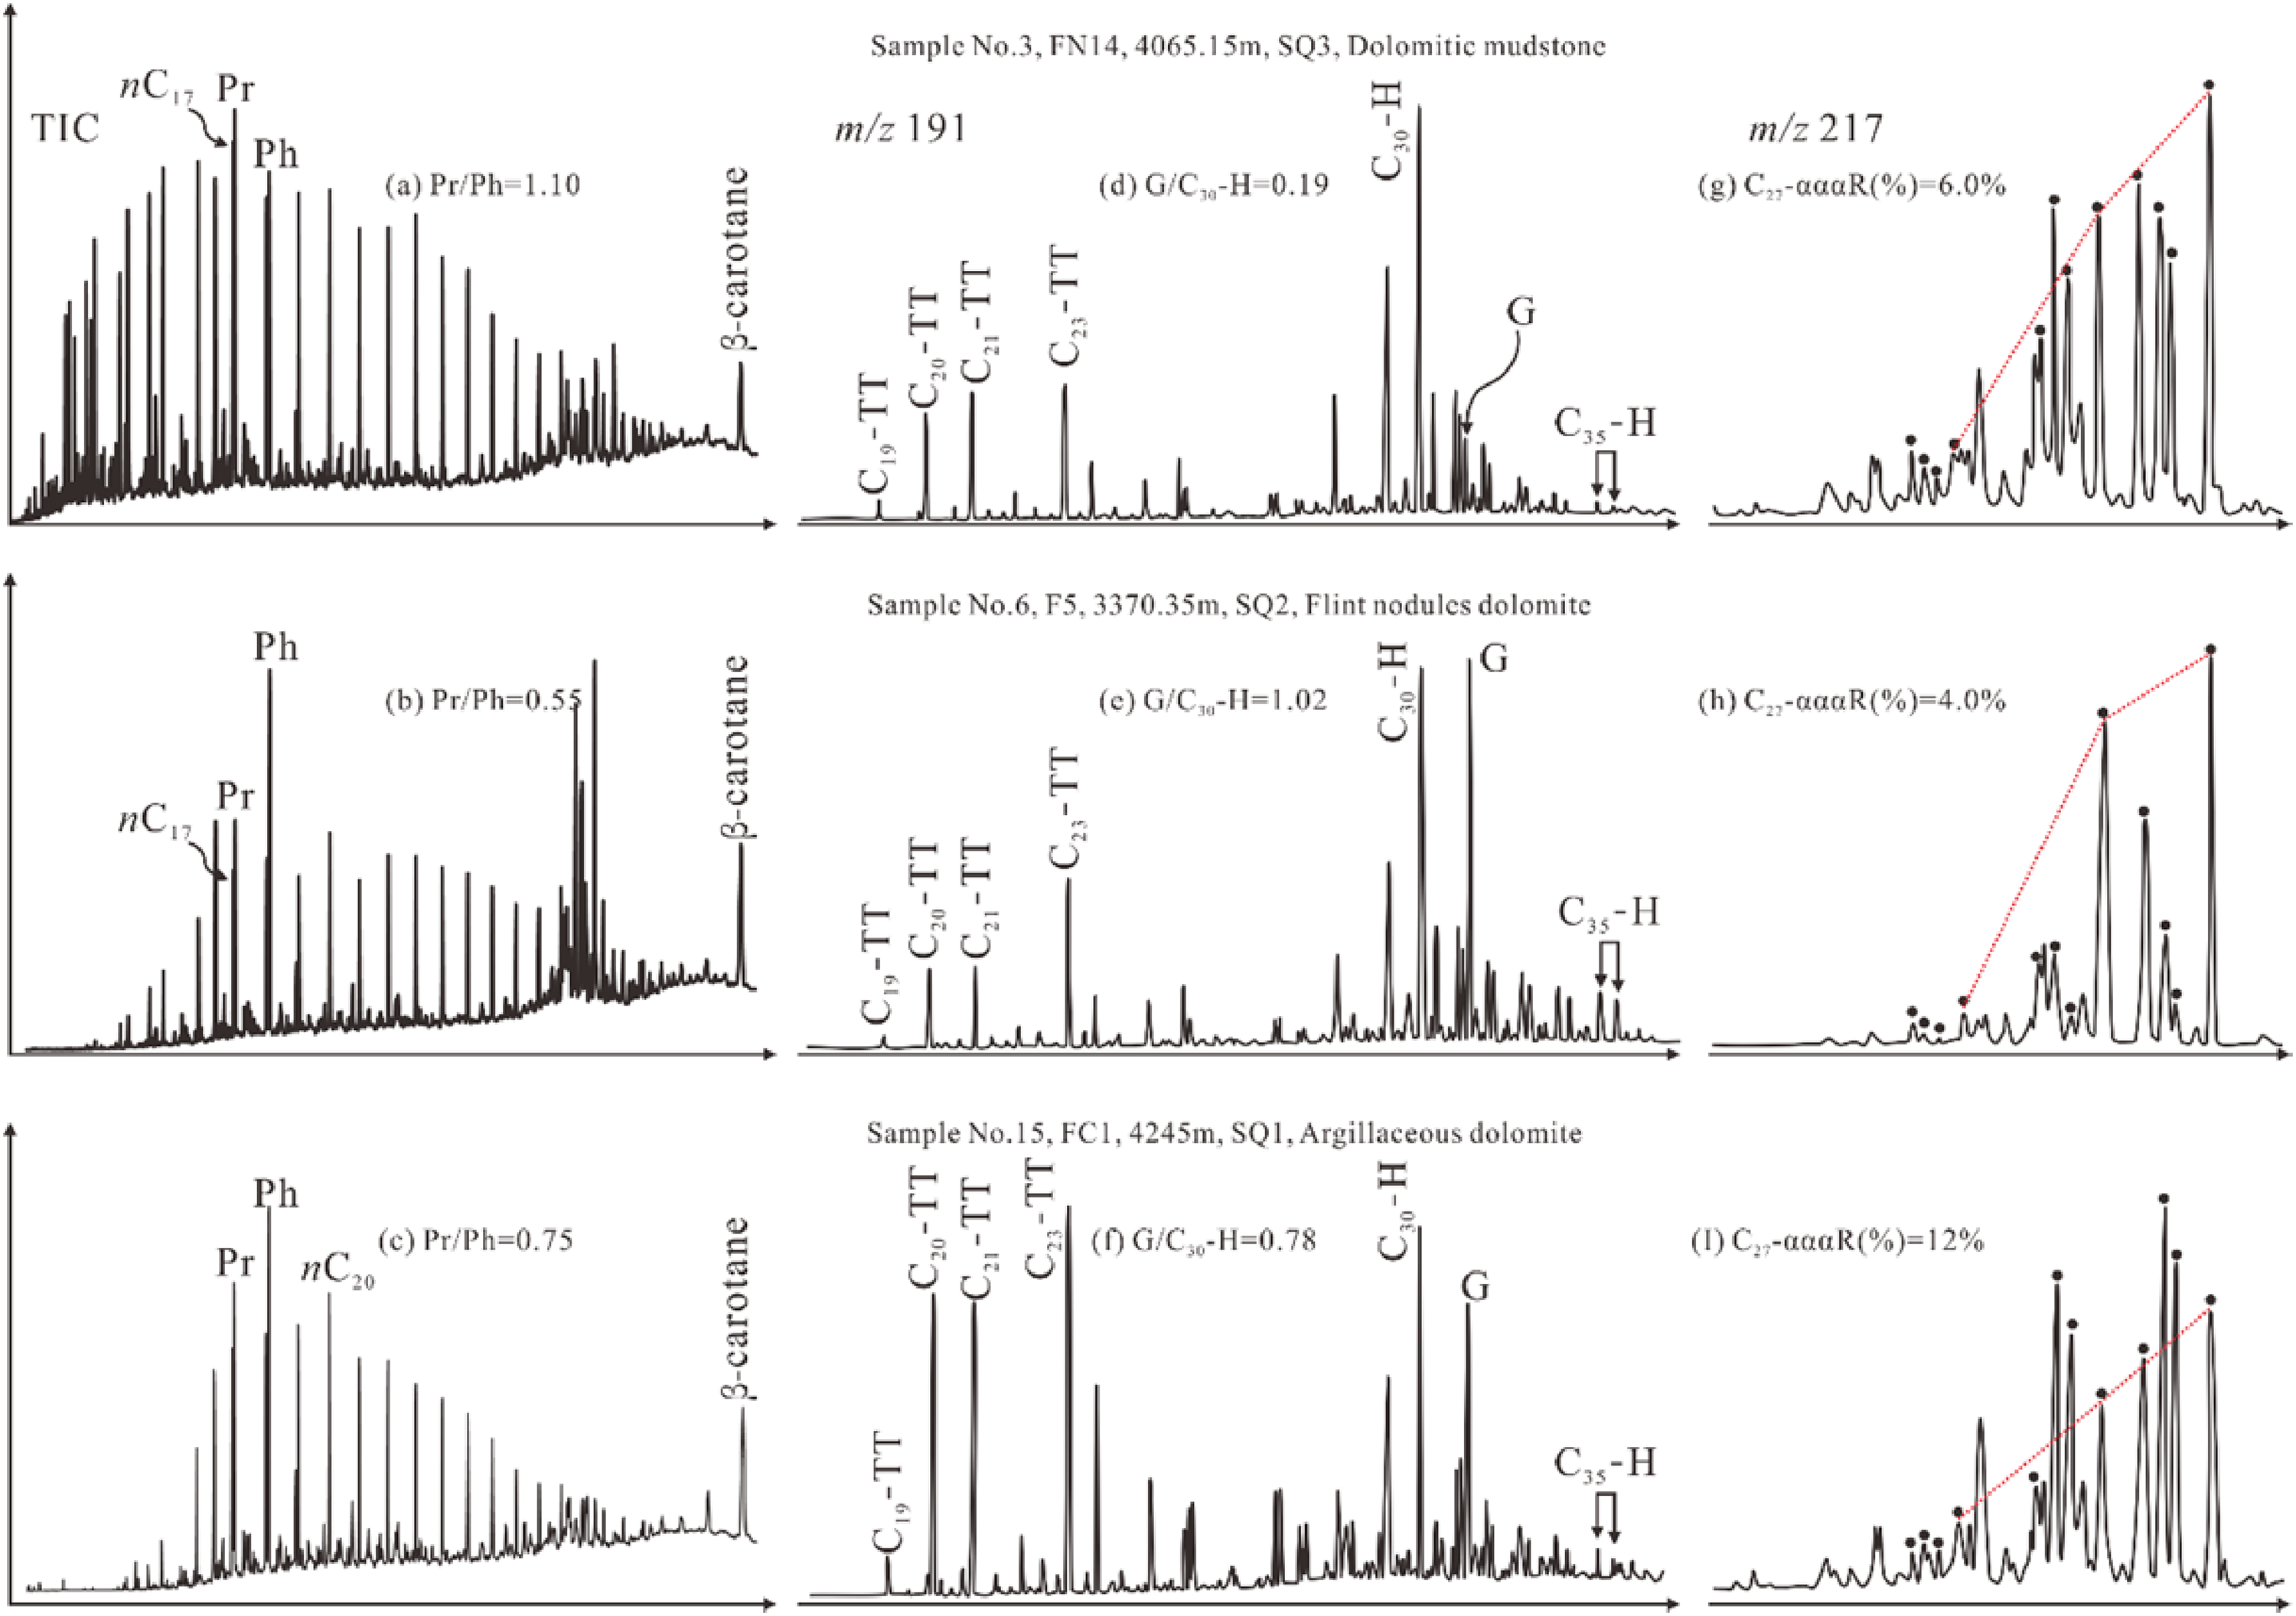
Representative saturated hydrocarbon chromatograms (TIC), terpenoid (m/z 191) and regular sterane (m/z 217) distributions in source rock samples from different sequences in P1f.
Long-chain n-alkanes are usually used as indicators of higher plants, and short-chain n-alkanes are related to algae and other microorganisms (Eglinton and Hamilton, 1967; Fu et al., 1991; Peters et al., 2005). The odd predominance and even predominance of n-alkanes characterized by high CPI or OEP values indicate the predominance of terrigenous higher plants (Bray and Evans, 1961; Scalan and Smith, 1970). In this study, the SQ3, SQ2, and SQ1 samples show similar pre-peak distributions of n-alkanes with the dominant peak at nC17-nC20 (Table 1). The OEP and CPI values were mostly less than 1.2 (Table 1). The results indicate that the organic matter sources and maturity from different sequences are not distinctly different. However, SQ3 and SQ2 show the predominance of high carbon numbers, while SQ1 shows the predominance of low-carbon n-alkanes from the cross-plot of n-alkanes (Figure 8(a)). The results show that the organic matter sources of SQ1 contain more aquatic organisms than SQ2 and SQ3.
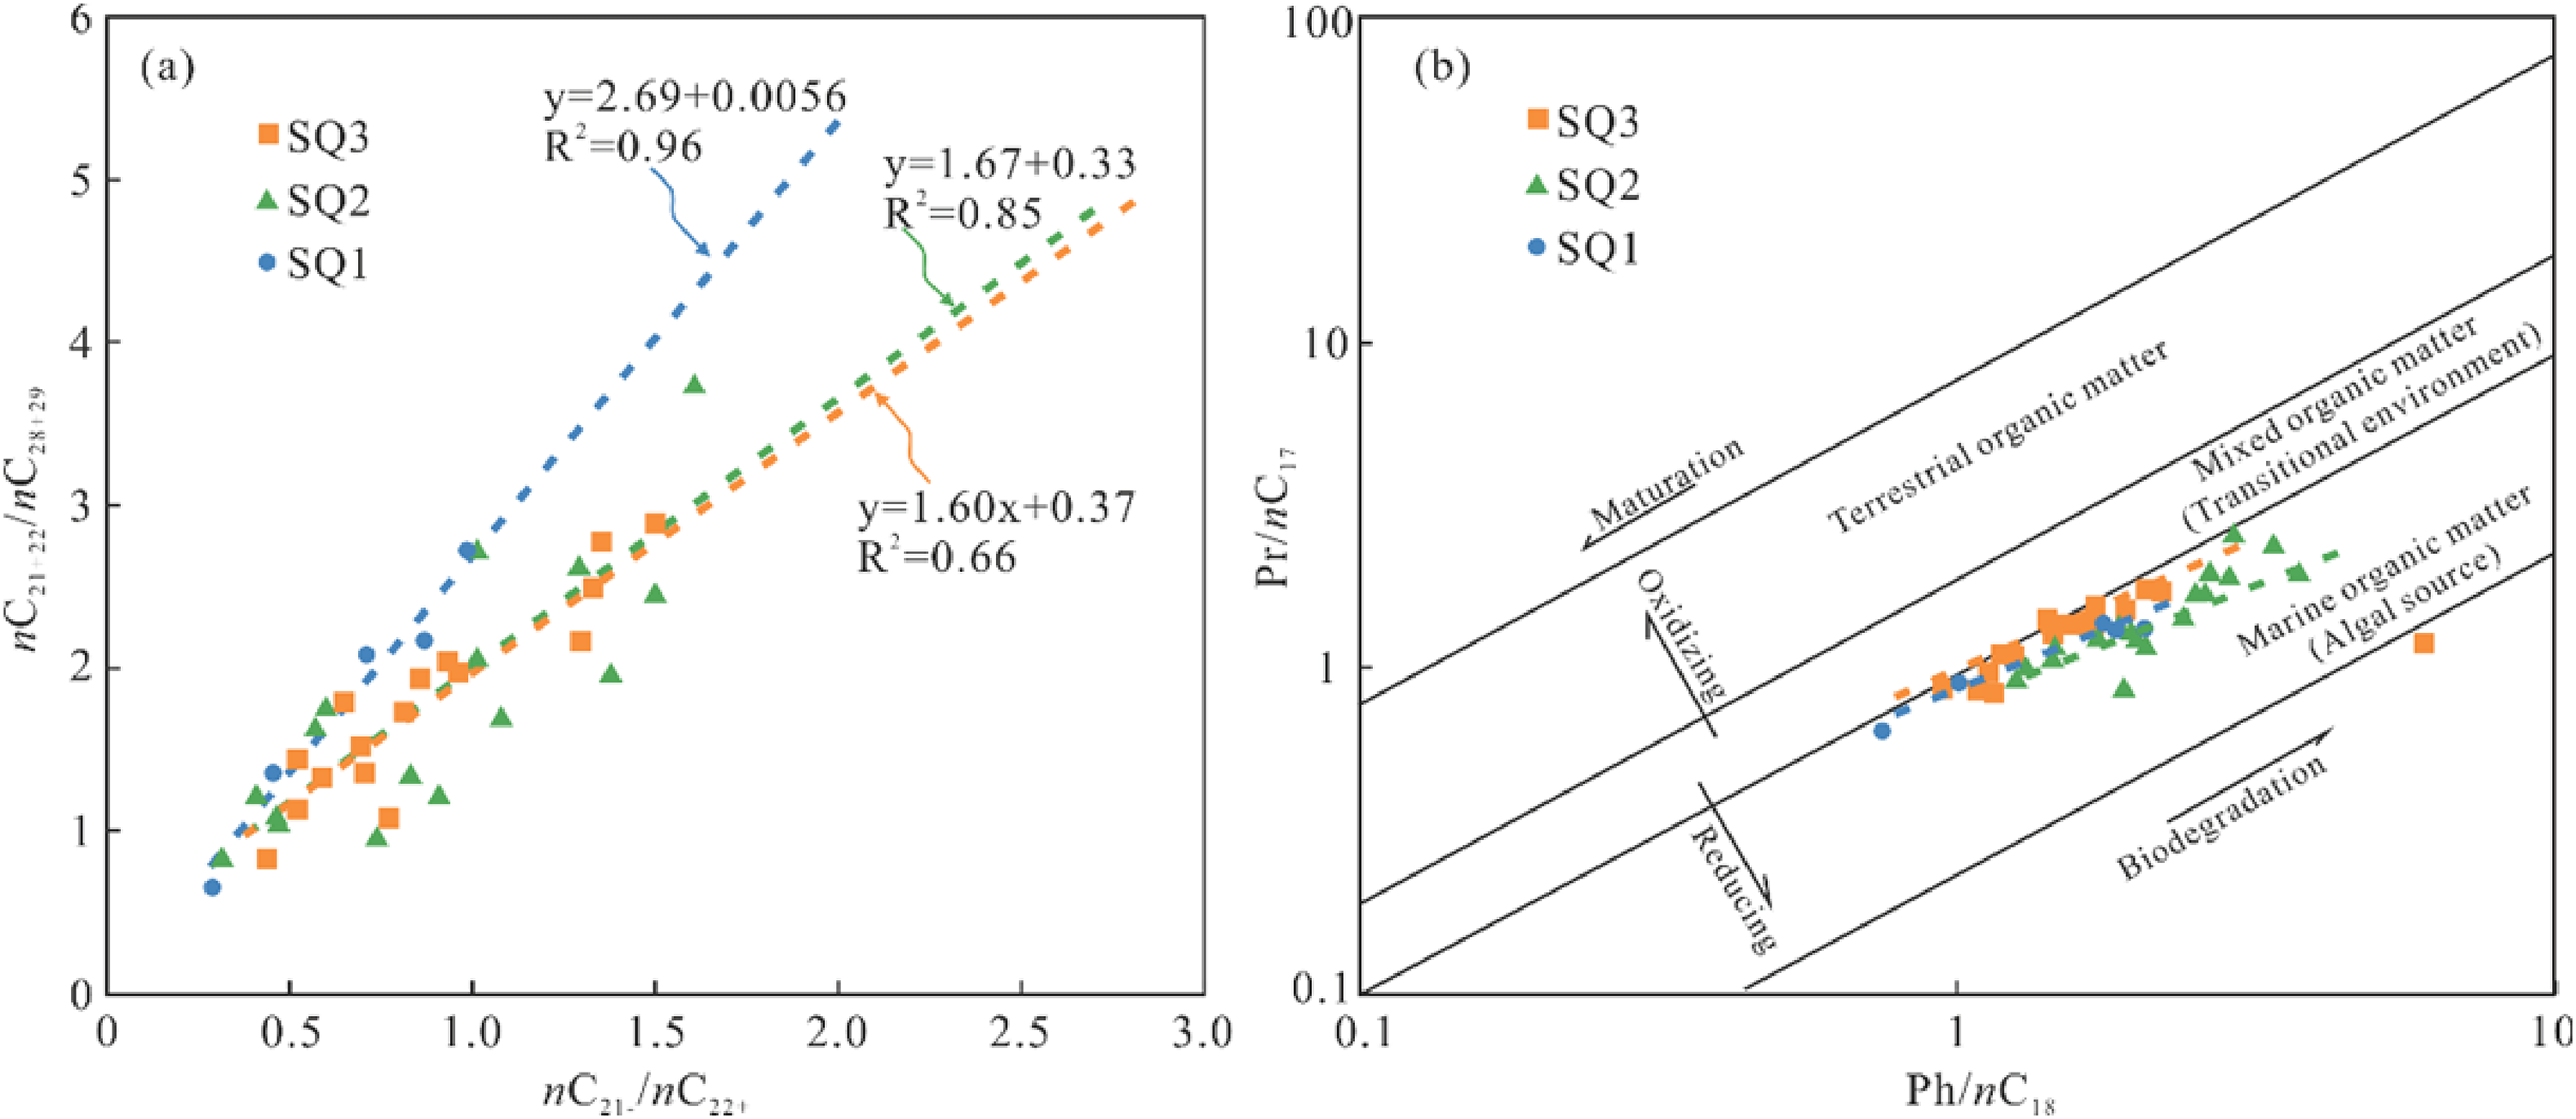
Cross-plot of (a) nC21−/nC22+ versus nC21+22/nC28+29 and (b) Pr/nC17 versus Ph/nC18 for source rock samples from different sequences.
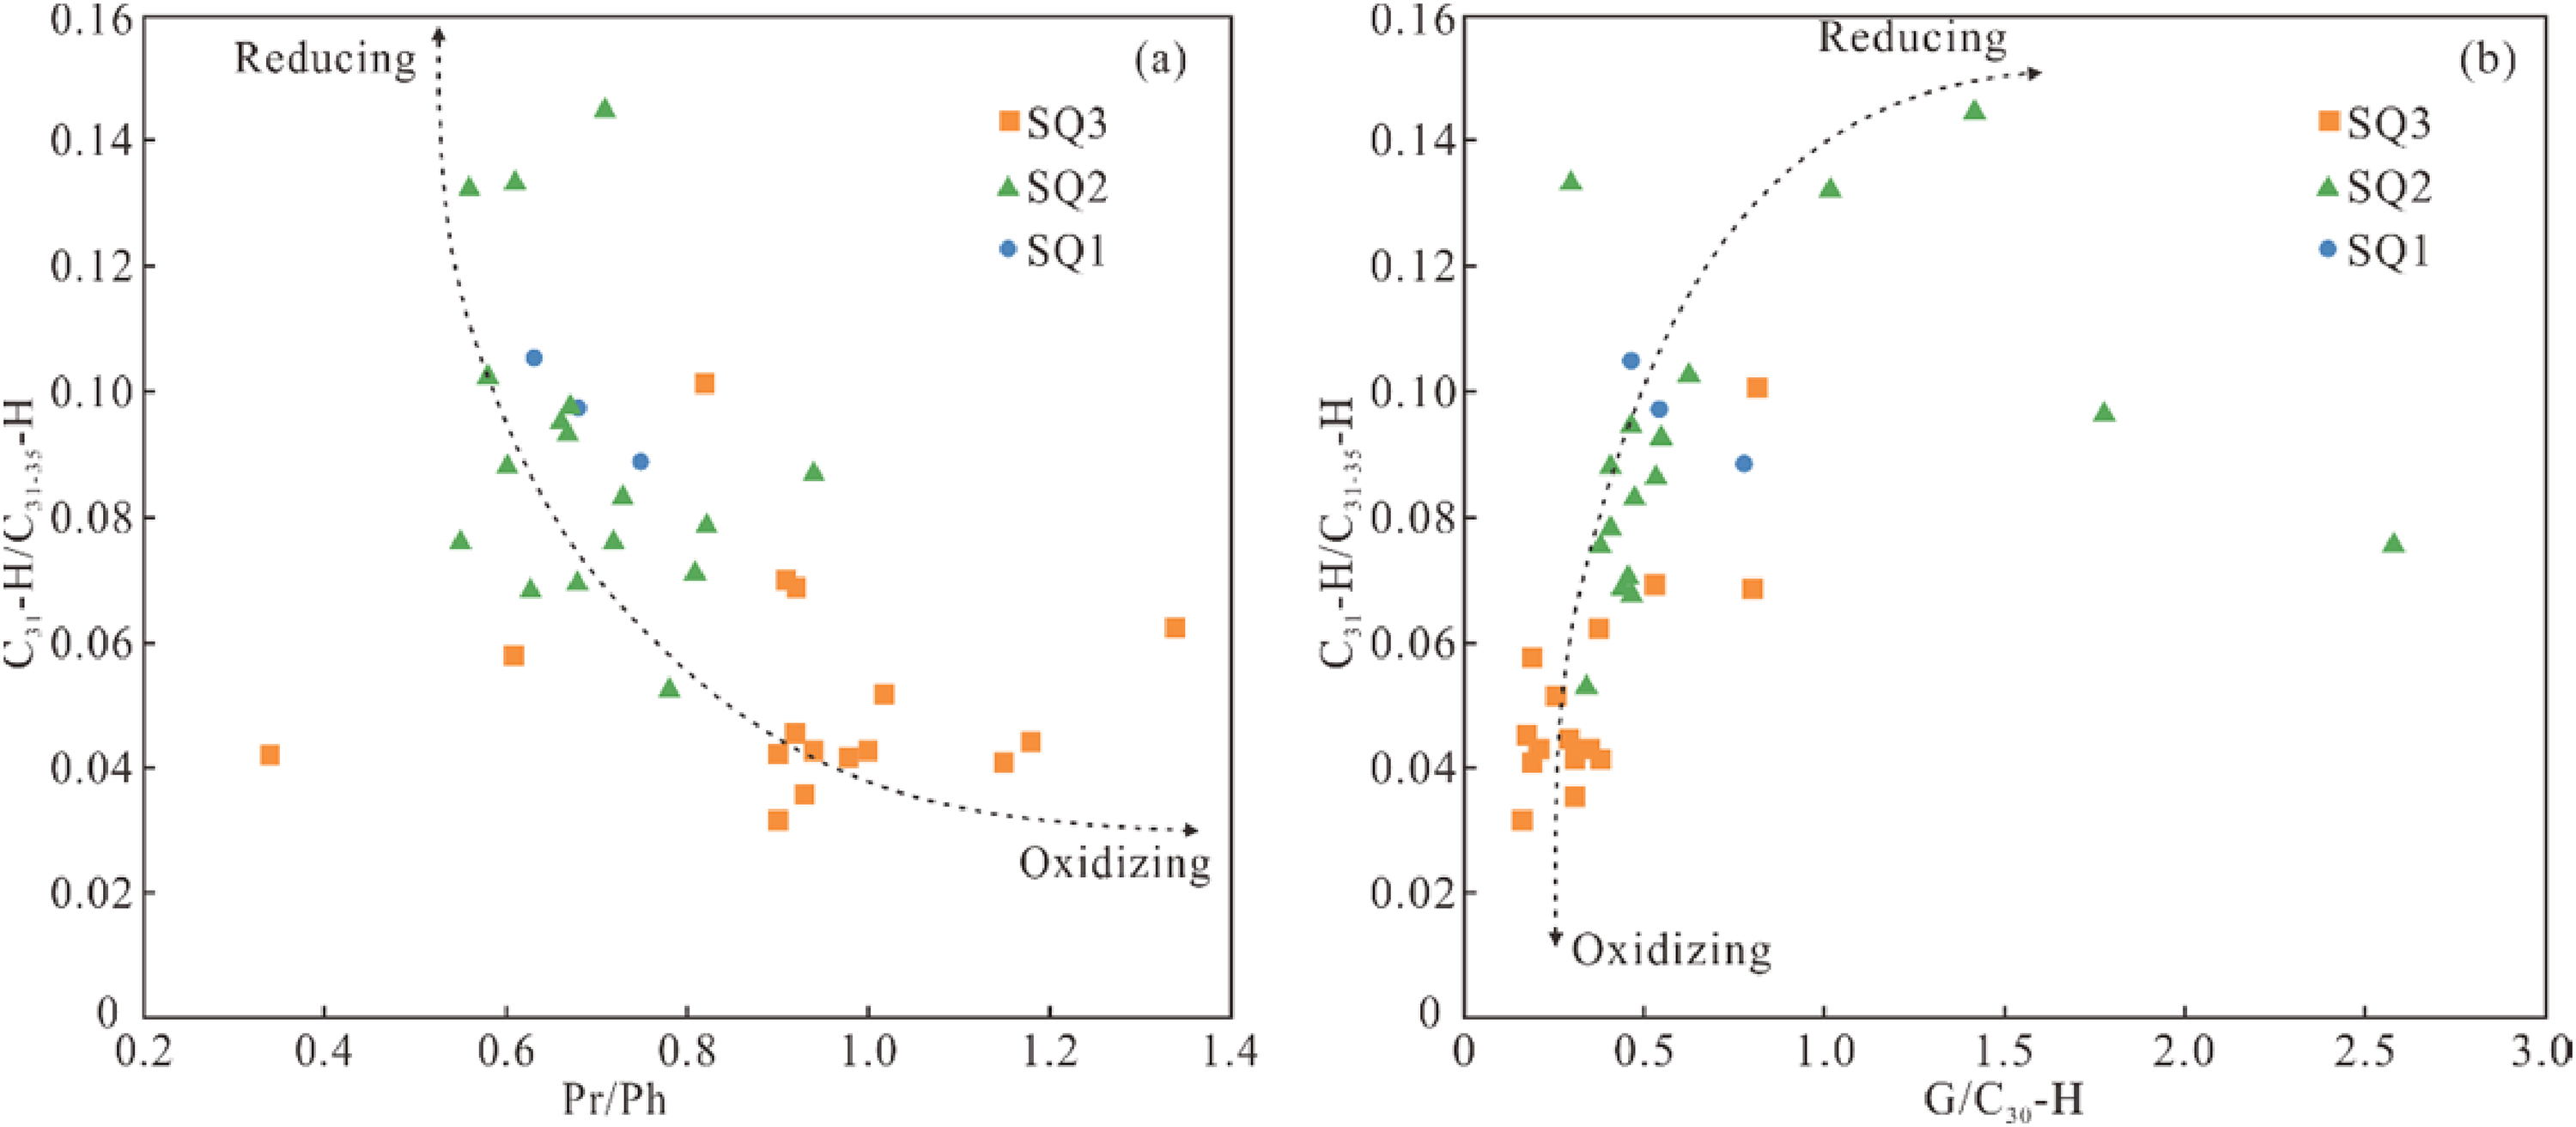
Cross plot of (a) Pr/Ph versus C35-H and (b) gammacerane index versus C35-H for source rock samples from different sequences.
Pr/Ph may be affected by many geologic factors, but it is still an effective indicator of oxidation–reduction conditions in sedimentary and diagenetic processes (Volkman and Maxwell, 1986). SQ3 samples show Pr predominance with Pr/Ph values reaching 1.34 (Table 1), which is remarkably higher than that of SQ1 and SQ2. However, SQ2 samples show Ph predominance with Pr/Ph values less than 1 and a minimum of 0.55. SQ1 samples show weak Ph predominance, with Pr/Ph values of 0.63–1.02 (Table 1). The results show that SQ3 organic matter was formed under weakly reducing conditions and in freshwater bodies with higher plant contributions. However, SQ2 organic matter was deposited in a strong reducing environment. During SQ1, the reducibility of the water environment was moderate, and algae were the main source of organic matter.
The cross-plot of Pr/nC17 versus Ph/nC18 shows that all the samples were formed in a reducing (marine and salt- lake) environment (Figure 8(b)). However, SQ3 samples show slightly mixed features, while SQ2 samples show more reducing features. The results correspond to phytane predominance in SQ2 and pristane predominance in SQ3 in the TIC chromatograms (Figure 7). In summary, water in which SQ2 was deposited was characterized by the strongest reducibility, and water in which SQ3 was deposited was characterized by the weakest reducibility; SQ1 water lies in between the former two sequences.
Terpenoids
Tricyclic terpanes (TTs) are usually used as indicators to investigate organic matter origin, deposition, and preservation, as well as oil population classification and oil and source rock correlation (Bohacs et al., 2000; Peters et al., 2008; Tao et al., 2015). C23TT is generally derived from aquatic organisms deposited in saline water, while the source of C19TT, C20TT and C21TT are mainly terrigenous higher plants formed in freshwater (Peters and Moldowan, 1993; Xiao et al., 2019). TTs are detected and show different distributions in different sequences. The relative abundance of TTs from the SQ3 and SQ2 samples is distinctly lower than that of the TTs from the SQ1 samples (Figure 7(d) and (e)). The relative contents of C21TT are close to those of C23TT in the SQ3 samples, and the C21TT/C23TT ratios range from 0.78 to 1.43 (Table 1). The relative contents of C23TT are higher than those of C21TT in the SQ2 and SQ1 samples, and the (C19+20) TT/C23TT and C21TT/C23TT ratios are lower than 1 (Table 1). The distribution of TTs shows that the organic matter of SQ3 formed under weak reducing conditions and had a greater contribution from higher plants.
The precursors of hopane compounds are important constituents of cell membranes in living cells existing in most prokaryotic organisms. C27-C35 homologs are generically identified in the source rocks and oils (Peters and Moldowan, 1993). The relative proportions of Pr and Ph may be dependent on the oxidation–reduction conditions in sedimentary processes. The C35-H index (C35-H /C31-H-C35-H) is used as an indicator of oxidation–reduction conditions (Peters and Moldowan, 1993). The correlation between these two parameters indicates a high Pr/Ph ratio corresponding to a low C35-H index. SQ3 samples are characterized by high Pr/Ph and low C35-homohopane index values. In contrast, SQ2 and SQ1 samples are characterized by low Pr/Ph and high C35-H index values, and the C35-H index values of several SQ2 samples are extremely high (Figure 10(a)). The results show that the salinity of water was the highest in SQ2, but the salinity of water was the lowest in SQ3. This result is supported by the n-alkanes and isoprenoid hydrocarbon distributions (Figure 8).
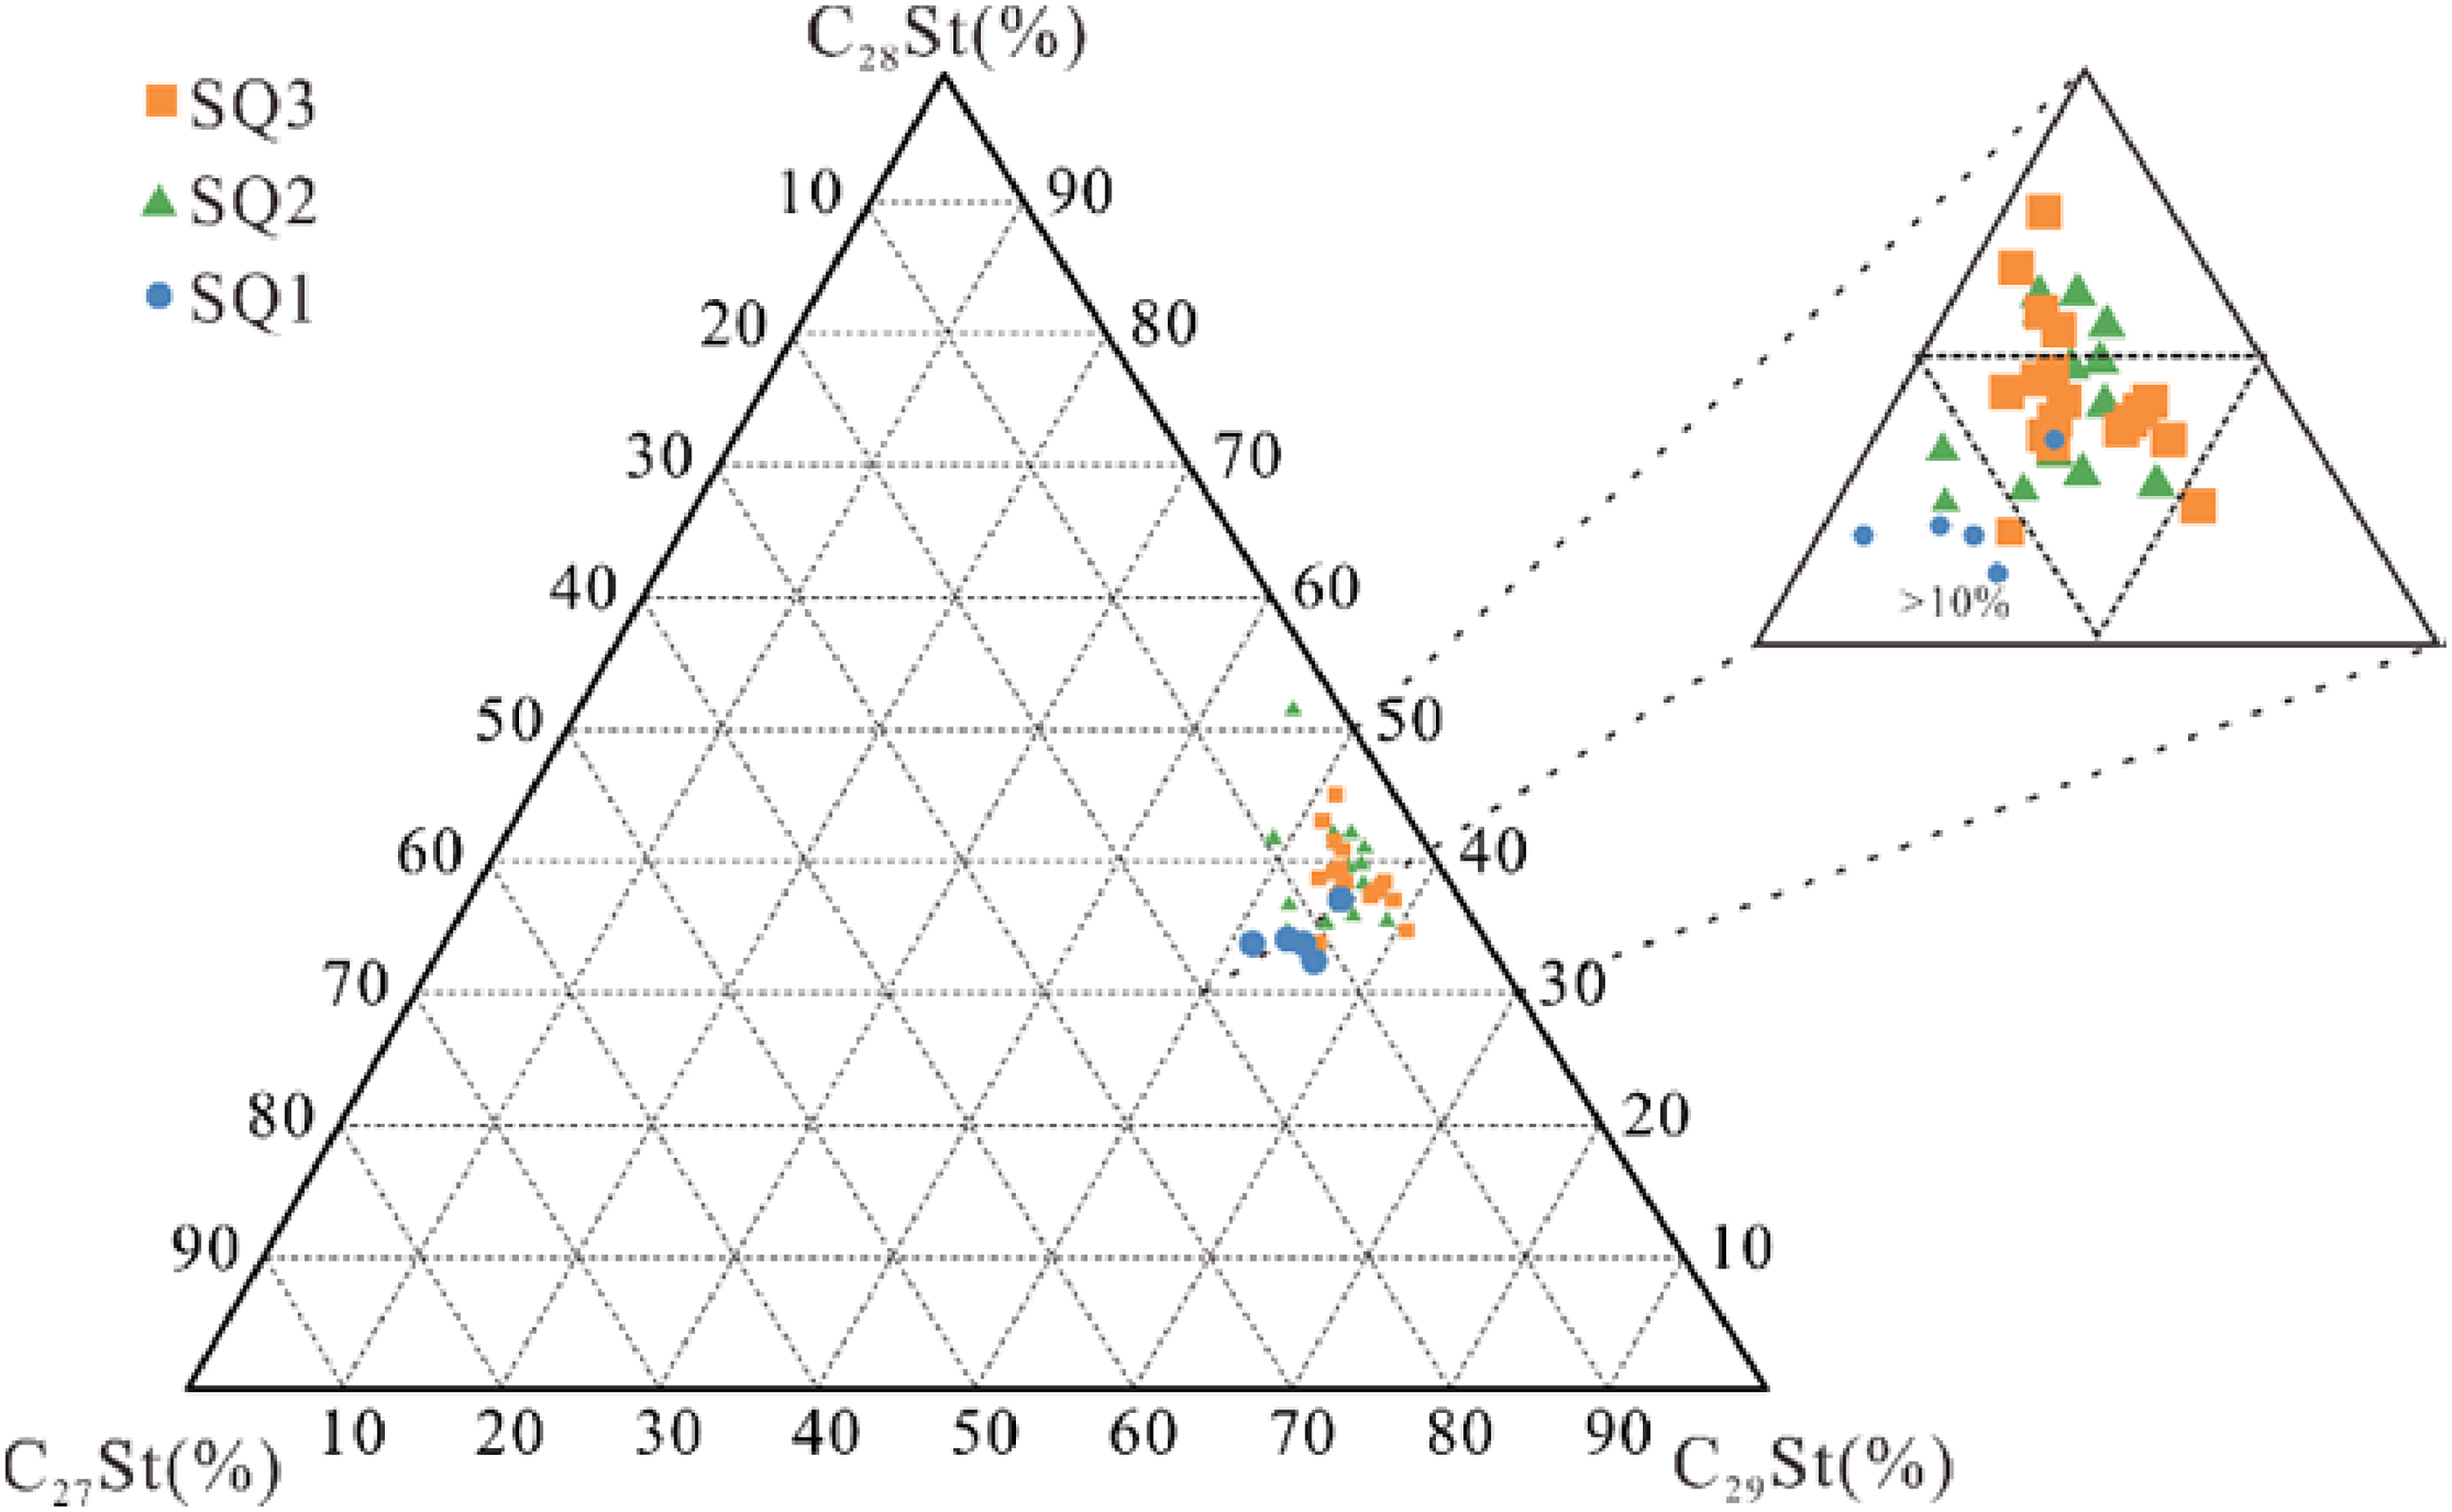
Triangular plot of the relative contenta of C27-C28-C29 regular steranes in source rock samples from different sequences.
A high gammacerane content has already been used as a marker of stratified water and anoxic photosynthetic layers (Sinninghe Damsté et al., 1995). In this study, the G/C30-H ratios of SQ3 are the lowest, which indicates that the salinity of the water body is also lowest The G/C30-H ratios of SQ2 are the highest and indicate the highest salinity of the water environment (Figure 10(b)). These conclusions are consistent with the above discussions (Figures 8 and 10(a)).
In summary, sedimentary water of SQ2 featured the strongest reducibility; SQ3 water featured weak reducibility-oxidizability; SQ1 water featured moderate reducibility. The findings are consistent with preceding petrologic and mineralogical conclusions (Cao et al., 2015; Wang et al., 2020).
Steroids
Steroids widely occur in all eukaryotes (Peters et al., 2005). In general, low-carbon steranes and regular steranes are identified in saturated hydrocarbon fractions of extracts and oils. In this study, C27, C28, and C29 regular steranes and their isomers are detected, most of which are C28 and C29 regular steranes (Figure 7(g) to (l)). The content of C27 regular sterane is low in P1f. The distribution of C27, C28, and C29 regular steranes shows an ascending pattern (Figure 7(g) to (l)). The content of C27 regular sterane is below 10% in SQ2 and SQ3, but the content is above 10% in SQ1 (Table 1).
The distribution of regular steranes is an important biomarker of organic matter sources. In general, a high abundance of C27 regular sterane indicates an aquatic organism origin, while C29 regular sterane indicates a dominant contribution of terrigenous higher plants (Huang and Meinschein, 1979; Grantham, 1986; Volkman, 1988). However, it has been reported that a large number of C29 regular steranes have been detected in algae-dominated organic matter without the additional input of higher plants (Moldowan et al., 1985). C29 regular steranes could originate from some special algae, including blue–green algae, brown algae or other algae. The distribution of C27, C28, and C29 regular steranes from different sequences is similar, with high relative contents of C28 and C29 regular steranes and low contents of C27 regular steranes ((Figure 7(g) to (l)); Table 1). The results suggest that the organic matter source may be special algae characterized by C29 regular sterane, e.g. brown algae and green algae (Moldowan et al., 1985; Volkman, 1988). Compared with SQ2 and SQ3, the distribution of C27 regular sterane is relatively complete (Figure 7(l)), and the relative content of C27 regular sterane is higher (Figure 12). Despite the similar organic matter sources of SQ1, SQ2, and SQ3, the organic matter of SQ1 may also contain more general aquatic organisms characterized by C27 regular steranes. These conclusions agree with the above discussion of n-alkanes (Figure 8).
The above indicators and analysis demonstrate that the organic matter of the P1f source rocks may have originated from some special algae. However, the general aquatic organisms also contributed to the organic matter of SQ1.
Factors controlling source rock evolution and organic matter properties
Relative lake level change
The depositional stage of P1f is characterized by hot arid paleoclimate and a shallow water environment (Qin et al., 2016). The lithologies of SQ1 consist of pure shale and dolomitic mudstone with increased carbonate mineral content characterized by high GR and low RT logging values. The lake level was high and reached a maximum. However, water regression appeared late in the SQ1 depositional period (Figure 11(a)).
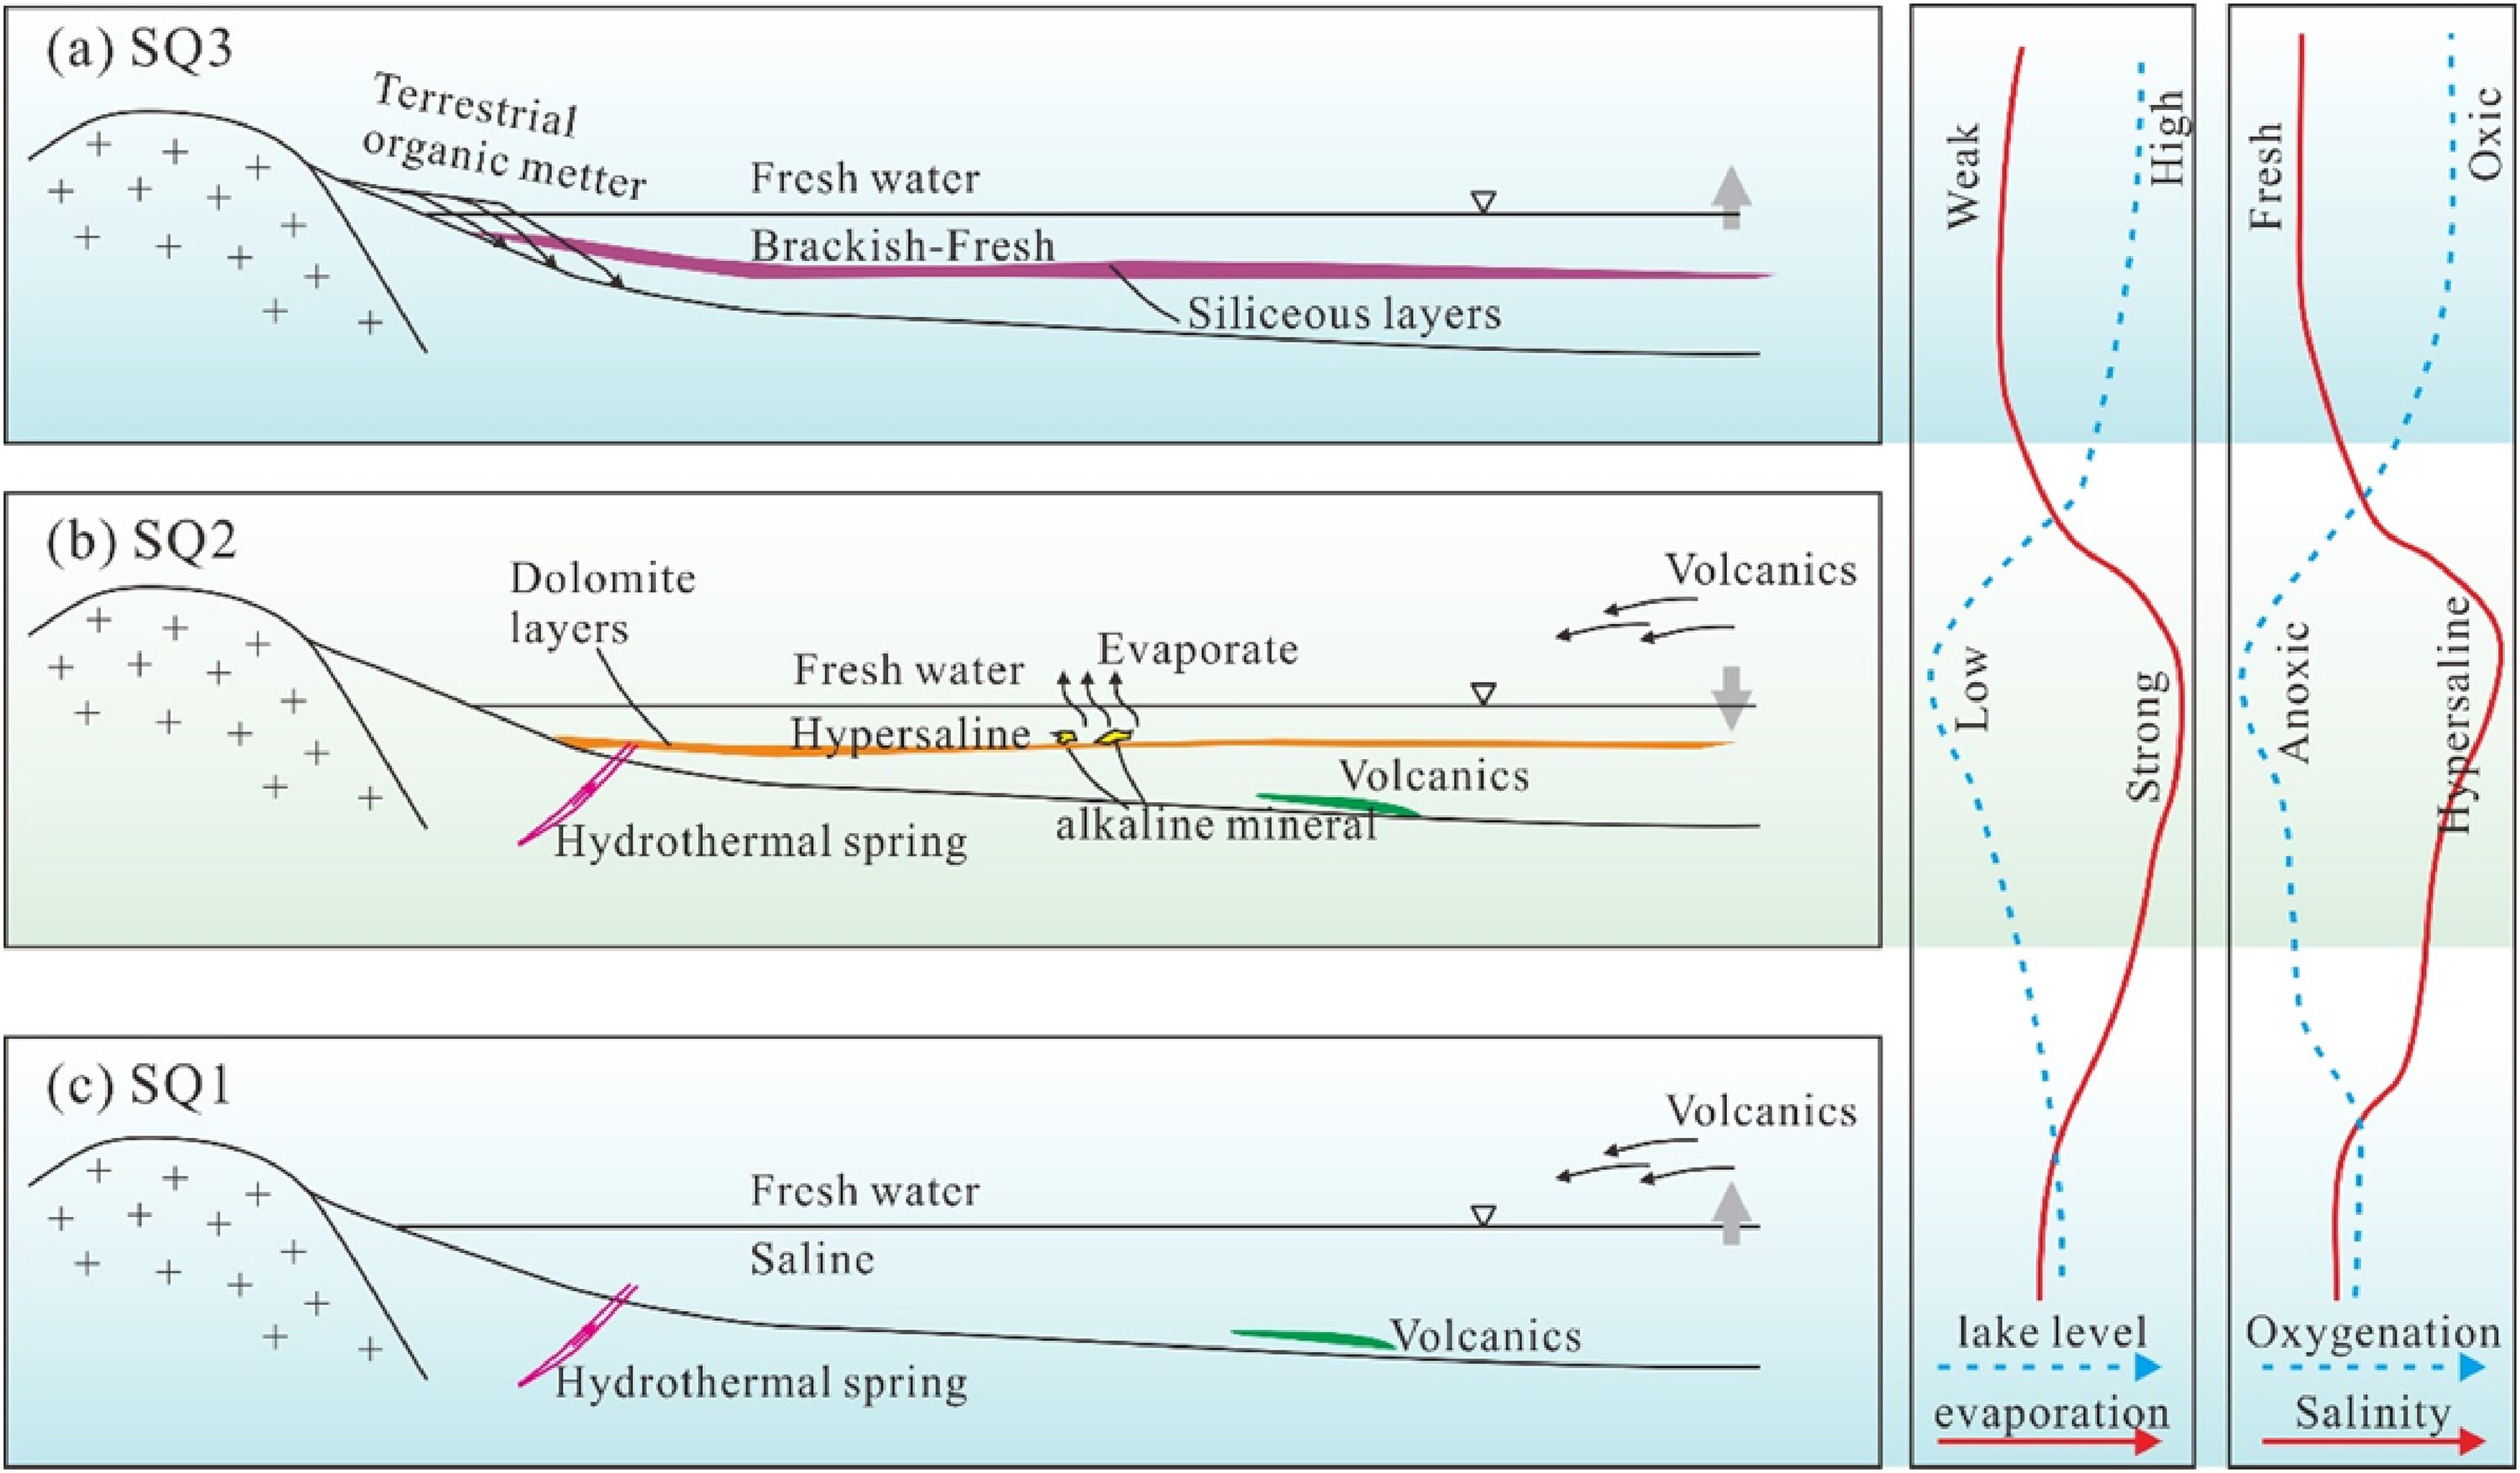
Depositional model showing depositional processes and organic matter enrichment mechanisms of P1f.
Compared with SQ1, the well log of SQ2 is characterized by low GR and high RT values (Figures 4 and 5). The carbonate mineral content is high, and a number of evaporite minerals are identified. The sediments are mainly composed of dolomitic rocks, and the sedimentary association is composed of alkaline mineral sediments. This indicates a low lake level and strong evaporation in SQ2.Therefore, SQ2 corresponds to the stage of lake regression (Figure 11(b)).
The log responses of SQ3 are similar to that of SQ1 in that high GR and low RT values (Figures 4 and 5). The lithology of SQ3 is different from that of SQ1 and SQ2, and is mainly composed of clastic rocks, especially thickened sandstone (Figures 3 and 4). The results indicate that the lake level rose during SQ3 deposition and more terrigenous clastics were transported into the study area (Figure 11(c)).
With the sequence stratigraphic subdivision and analysis of P1f, it is concluded that the lake level was high, and rapid lake transgression appeared at the initial stage of SQ1. However, the lake level began to drop in the highstand systems tract (HST) period of SQ1 and dropped to the lowest level in SQ2. The lake level obviously rose in SQ3, leading to deepened lake water.
Water salinity change and organic matter source
SQ1 samples are characterized by low Pr/Ph and high gammacerane index values (Figure 9; Table 1), manifesting as a sedimentary environment with strong reducibility, high salinity, and stratified water. The high relative content of C29 regular sterane indicates that some special algae were the source of the organic matter in SQ1 (Figures 7 and 10). The general algae were also a main source of organic matter in SQ1, as characterized by the high relative contents of short-chain n-alkanes (Figure 8), and C23-TT (Figure 7) and C27 regular steranes (Figures 7 and 10), which are different from that of SQ2 and SQ3 (Figure 7). A reducing environment with abundant organic matter supply and good preservation conditions is promising for organic matter accumulation in this period (Figure 11(a)).
SQ2 samples are characterized by the lowest Pr/Ph and highest gammacerane index values (Figure 9; Table 1), suggesting a sedimentary environment with the strongest reducibility, highest salinity, and significantly stratified water body. The high relative content of the C29 regular sterane suggests that the organic matter originated from some special algae. The relatively low contents of short chain n-alkanes (Figure 8) and C23-TT (Figure 7) show that general organisms contributed less to the organic matter (Figure 7). Despite its strong reducing environment and good preservation conditions which are indispensable for organic matter enrichment, species were scarce and the organic matter supply was insufficient under such a high salinity sedimentary environment (Figure 11(b)).
Compared with SQ1 and SQ2, SQ3 samples are characterized by the highest Pr/Ph and lowest gammacerane index values (Figure 9; Table 1), which indicates the sedimentary environment with the weakest reducibility, lowest salinity, and indistinct water layering. The high relative content of C29 regular sterane is an indication of some special organisms existing in SQ3 (Figure 7). Different from SQ1 and SQ2, the organic matter source of SQ3 may have been mixed with terrigenous higher plants due to lake level rise and more terrigenous clastics supply. Therefore, the relative contents of short chain n-alkanes, C23-TT and C27 regular sterane are low in SQ3 (Figure 10). The low degree of organic matter enrichment in this period may be attributed to more higher plants being transported into this region and the weak reducing-oxidizing environment (Figure 11(c)).
Conclusion
Organic matter accumulation in alkaline lacustrine source rocks was dominated by lake level variations, salinity of sedimentary water, water layering, special organic matter sources in saline water, and terrigenous organic matter supply caused by freshwater input, among which two key factors are the relative lake level and salinity of sedimentary water. During the SQ1 period, the lake level was relatively high, and the salinity of the water body was moderate. In addition to special algae sources, common marine organisms also contributed greatly to organic matter. The deep-water reducing environment with abundant organic matter supply and good preservation conditions was favorable for organic matter accumulation. During the SQ2 period, the lake level dropped to the lowest point, evaporation was strong, and the salinity and reducibility of the water body reached the strongest values. Salt-tolerant organisms survived, and there were few other biological sources in such settings. During the SQ3 period, the lake level rose, accompanied by the input of freshwater and salinity reduction. In addition to special algae sources, organic matter was also contributed by terrestrial higher plants. However, it had poor preservation conditions.
Footnotes
Acknowledgements
The authors would like to thank the anonymous reviewer and Dr Jian Cao for their careful check and constructive comments and modification of the manuscript, which have greatly improved the quality of this manuscript. We would like to thank the PetroChina Xinjiang Oilfield Company for providing samples and data, and for permission to publish this work. The authors are grateful for the great help and patience of Dr Yuzhuang Sun in handling the manuscript. The authors also thank AJE (American Journal Experts) for providing professional language editing assistance.
Declaration of conflicting interests
The author(s) declared no potential conflicts of interest with respect to the research, authorship, and/or publication of this article.
Funding
The author(s) disclosed receipt of the following financial support for the research, authorship, and/or publication of this article: This work was supported by the Scientific Research Program in Colleges and Universities of Xinjiang Uygur Autonomous Region, China University of Petroleum-Beijing at Karamay Scientific Research Program, (grant number XJEDU2018Y059, RCYJ2017A-01-002).