
Abstract
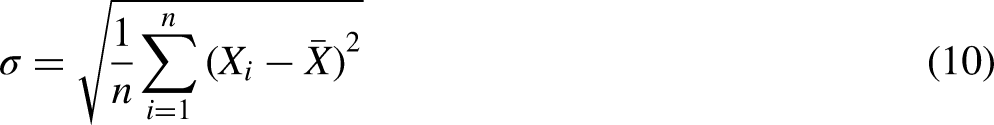
Coal mining at deep levels can cause mine water inrush and groundwater contamination, making it important to accurately and rapidly identify the water inrush source. In this study, 52 water samples were extracted from three types of aquifers in the Linhuan mining area, China. The water sample components Na+ + K+, Ca2+, Mg2+, HCO3−, Cl−, and SO42−, measured in the experiment, were used as evaluation variables, and the piecewise function equation was established by using the exponential whitening function. Finally, combined with water sample data and the CRITIC weighted grey situation decision-making method, the comprehensive membership degree was obtained, and the water inrush source was identified according to the principle of the maximum membership degree. The comprehensive accuracy of the model was 92.3%. The traditional grey situation decision-making method uses the linear whitening function to determine the membership value, ignoring that the value of the whitening function outside the adjacent level is 0, which improves the weight of the adjacent level, causes the loss of effective information, and reduces the discrimination rate. The exponential whitenization function in this paper will solve this problem and further improves the grey situation decision-making method to discriminate the water inrush source, which would also be beneficial regarding the prevention and control of mine water inrush and groundwater contamination.
Keywords
Introduction
Despite the continuous increase in the production and use of new energy, coal still plays a key role in the global fossil fuel supply system (Chen et al., 2014; Bi et al., 2021; Ju et al., 2020; Dong et al., 2020). It is the major energy source for electricity, residential heating, and industrial production in most countries (Qiao et al., 2019; Yin et al., 2019b). However, with the large-scale development of coal resources in China (Song et al., 2021; Yin et al., 2019a), especially with the increase and expansion of mining depth (Ruan et al., 2019), coal mining is bound to damage the surrounding rock structure of the aquifers (Shi et al., 2019a; Fan et al., 2019). Therefore, groundwater problems related to coal resource mining have become increasingly prominent. The groundwater geochemistry of an area is a highly complex and dynamic (Adhikari and Mal, 2019), and the hydrochemical parameters can quantitatively reflect the properties of aquifers. Hydrogeochemical differences occur due to natural environmental processes by means of recharge and discharge, rock-water interaction, flow pattern, and residence times (Liu et al., 2018; Mu et al., 2018; Shi et al., 2019b). After accidental water inrush, it is crucial to quickly identify the water inrush source, find out the cause of the accident, and find mitigation strategies (Shi et al., 2019a; Song et al., 2021).
At present, the methods used to determine the mine water inrush source mainly include water temperature and water level measurements (Sui et al., 2010; Lin et al., 2014), hydrochemical analysis (Wang et al., 2020; Li et al., 2016), and mathematical analysis (Wang et al., 2020; Zhang et al., 2019). Under the influence of stratification conditions and circulating environment, the temperature of the groundwater often presents heterogeneity and variability. In the actual production process of the mine, the water temperature of the water inrush point can be compared with that of the aquifer with potential water inrush, and the water source of the mine water inrush can be preliminarily predicted. By establishing the ground temperature equation to calculate the water temperature of the water inrush aquifer and comparing it with the water temperature at the actual outlet point, the source of water inrush can be preliminarily predicted. In recent years, some quantitative and semi-quantitative methods have been widely used in the identification of water inrush sources. They are generally combined with multivariate statistics, such as the grey correlation analysis method, the grey clustering method, fuzzy comprehensive evaluation, artificial neural network identification technology, fussy grey decision-making, stepwise discriminant analysis, and the support vector machine method (Huang and Wang, 2018; Guan et al., 2019; Lipshutz et al., 2021). Computer technology is also gradually applied to water source identification, such as the Fisher Linear Discriminant (FLD), the Support Vector Machine (SVM), the Bayesian Model, and the Extreme Learning Machine (ELM), overcoming the influence of human factors in the identification process and improving the recognition accuracy (Dong et al., 2019; Zhang and Yao, 2020). A grey system can be used to distinguish the water source of mine water inrush based on the grey system mathematical theory (Xie, 2017). It can be divided into the grey correlation degree method, the grey situation comprehensive discrimination method, and the maximum effect measurement method. Ju and Hu (2021) used the combination of principal components analysis and the grey situation decision-making method to accurately identify the water inrush source of the Xieqiao mine; the authors compared the results with those of the Bayesian method.
In this paper, the traditional whitening function is a “half-trapezoidal” structure. The function of this structure only considers the relationship between the evaluation values of two adjacent levels. If the evaluation value is outside the adjacent levels, the whitening function value will be zero. To avoid this problem, the exponential whitening function is introduced in this paper, and the traditional whitening function is improved by using curved edges instead of straight edges of the “trapezoidal structure”. The improved exponential whitening function curve is smooth and can cover the measured values in all ranges, thus effectively solving the zero-weight problem. Therefore, a grey situation decision-making water inrush source discrimination model based on the improved exponential whitening function is proposed.
Study area
As shown in Figure 1, The Linhuan mining area of Huaibei City is located in Suixi County, about 30.0 km from Suzhou City in the east and 40.0 km from Huaibei City in the north. In the mining area, there are mostly northeast winds in spring and autumn throughout the year, with east to southeast winds in summer and north to northwest winds in winter. The average wind speed is 2.0 m/s, the average temperature is 14.1°C, and the annual average rainfall is 830 mm. Most of the precipitation is concentrated in July and August There are 210 frost-free days on average throughout the year. The freezing period is generally from early December to mid-February of the following year, and the maximum frozen soil depth is 19. 0 cm. The stratum in the Linhuan area is a large area of the North China stratigraphy, the Huaihe stratigraphic division of the Shandong-Jinyu-Hebei stratigraphic area, and the stratigraphic district of the Huaibei area. The strata in the area where Linhuan Coal and Electricity is located are all concealed under the loose Cenozoic layer. According to the data collected from boreholes and via geological surveys in the area, the strata in the area from bottom to top are Ordovician, Carboniferous, Permian, and Quaternary. According to the characteristics of the storage medium of groundwater in the Linhuan mining area, the groundwater types in the study area can be divided into three types: loose pore water, bedrock fissure water, and carbonate karst fissure water. The Linhuan mining area mainly mines 3, 5, 7, 8, and 10 coal seams with an average thickness of 7.1–23.35 m, and the coal mining process is mainly integrated mechanized coal mining. The total number of coal mine water inrush cases in the study area is about 25. There are about 19 cases in the Cenozoic aquifer, with a water inrush volume of about 54.2–3887 m3/h, and 2 cases in the Permian aquifer, with a water inrush volume of about 20–37 m3/h. In addition, there are 2 cases in the Carboniferous aquifer, with a water inrush volume of about 3.5–35 m3/h, and there is 1 case in the Ordovician aquifer, with a maximum water inrush water volume of 3457 m3/h.
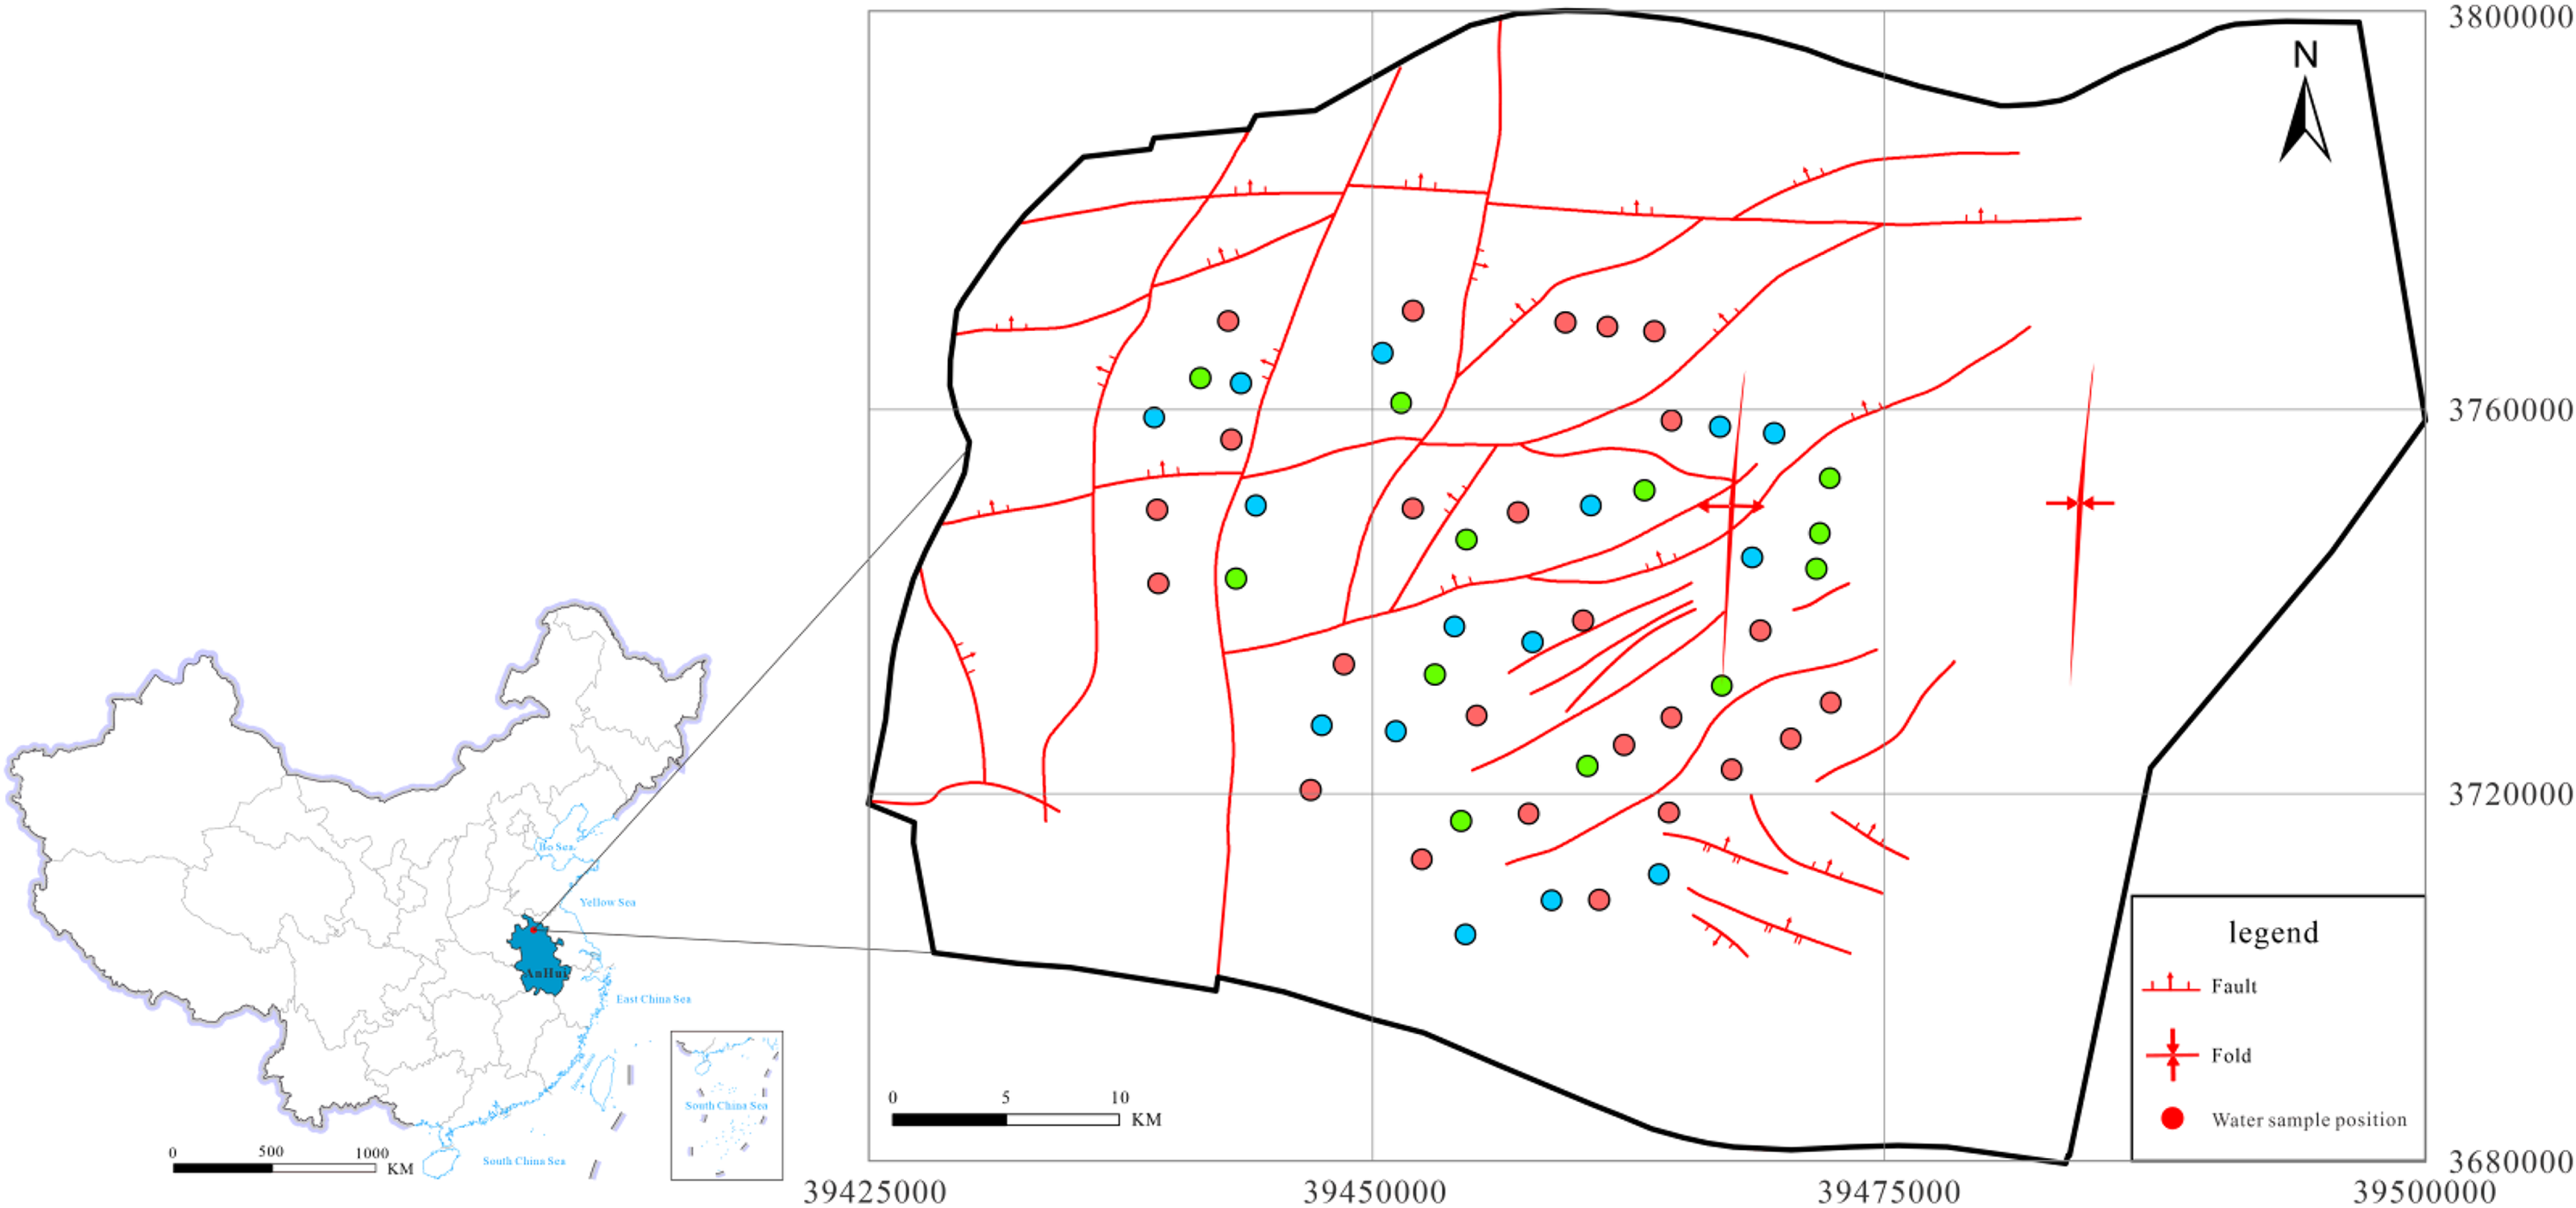
General map of the study area and sampling sites.
Materials and methods
Sampling and testing
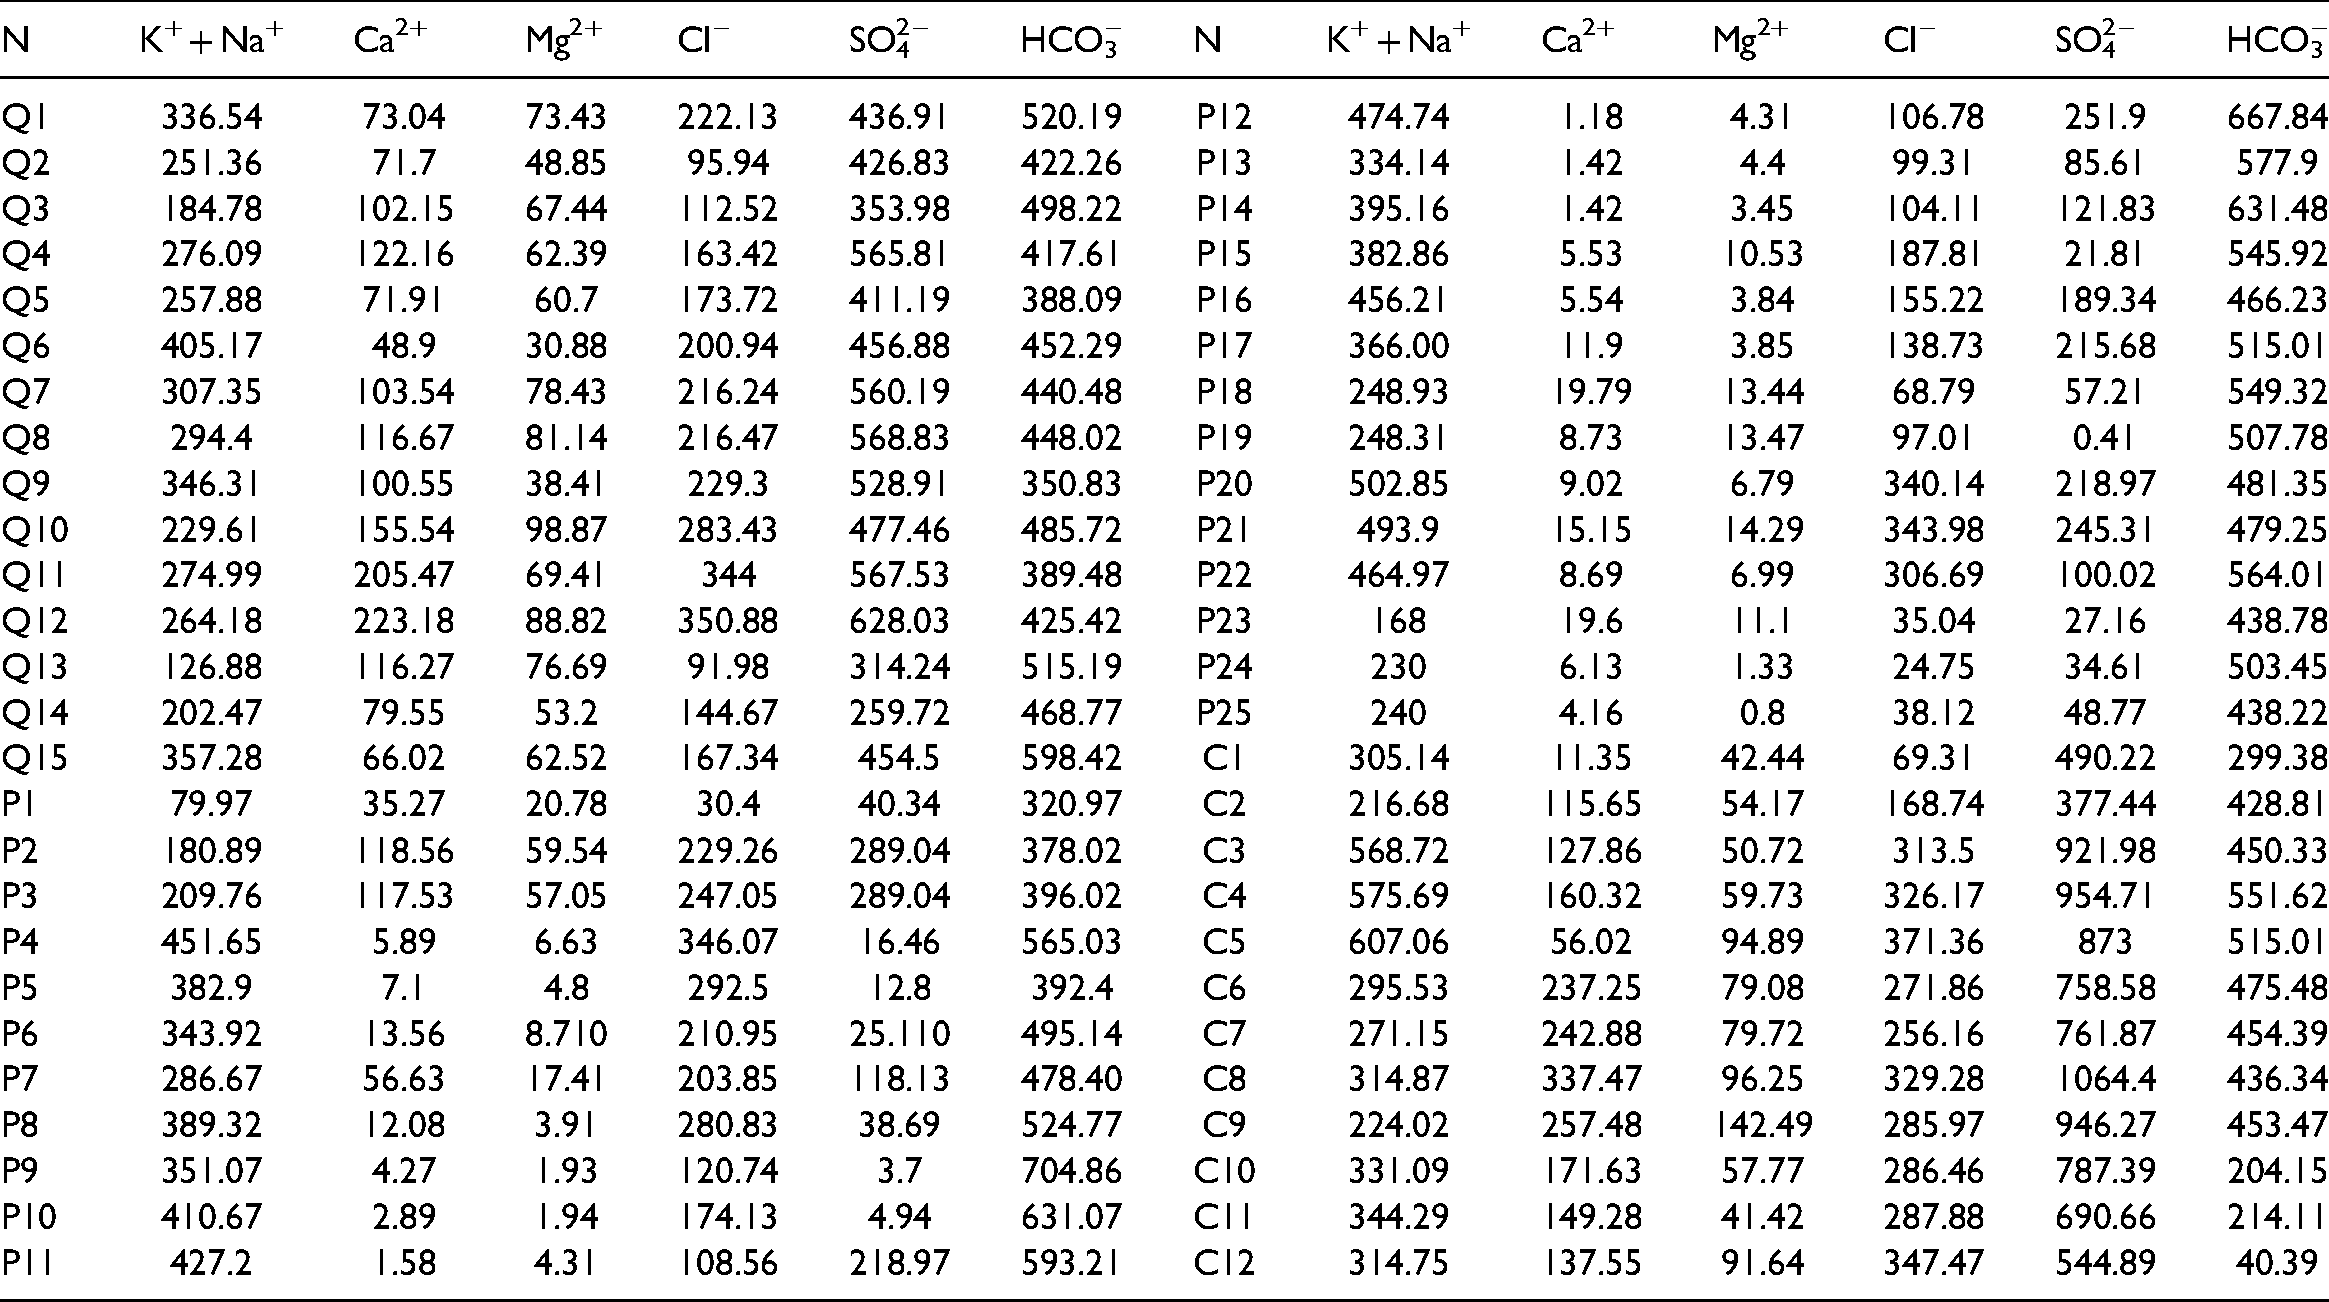
In September 2020, the Linhuan mining area was surveyed, and 52 water sampling points were selected (15 Cenozoic Quaternary loose pore water water, 25 Permian sandstone water, 12 Carboniferous limestone water sampling points); Figure 1 shows the distribution of the sampling points. After sampling, the levels of Na+ + K+, Ca2+Mg2+, HCO3−, Cl−, SO42−, TDS, and PH were determined. When sampling, a portable water quality analyzer was used to determine water PH and temperature (Guo et al., 2016). All water samples were filtered through a 0.45-µm membrane on site (Alçiçek et al., 2019). The water samples used for cation analysis were acidified to pH < 2 with nitric acid (Wang et al., 2021). The concentrations of the main cations were determined by inductively coupled plasma atomic emission spectrometry (ICP-AES) with an accuracy of 3%. Chloride and sulfate were determined by ion chromatography (DX-120, Dionex) with an accuracy of 5%, and the bicarbonate ion concentration was determined by on-site titration. The ion charge balance of all samples was below 5% (Yuan et al., 2017). The test results are shown in Table 1. The higher K+ + Na+ concentrations in No. C5 can be explained by the enrichment of K+ + Na+ as a result of cation exchange as the area is located in the drainage area with weak runoff. The lower K+ + Na+ concentration in points P1 and Q13 might be a result of the cation exchange in this sampling point, which is located in an area with strong runoff.
Measured values of major chemicals in the study area (unit: Mg/L).
General hydrogeochemical phases
As seen in Figure 2, the Cenozoic (Q), Permian (P), and Carboniferous (C) aquifers were characterized by K + Na·Mg-HCO3·SO4, K + Na-SO4·HCO3, K + Na·Mg-SO4·Cl. The presence of Mg2+ in the loose pore water and the limestone water, in addition to the predominance of K+ + Na+ and HCO3−, indicates that they were formed in areas with good excretion conditions. All water samples were dominated by K+ + Na+ and HCO3− and had a common K + Na-HCO3 water chemistry type, indicating that these water samples were formed in areas with long groundwater retention periods; such conditions are usually found in formations with small permeability coefficients.
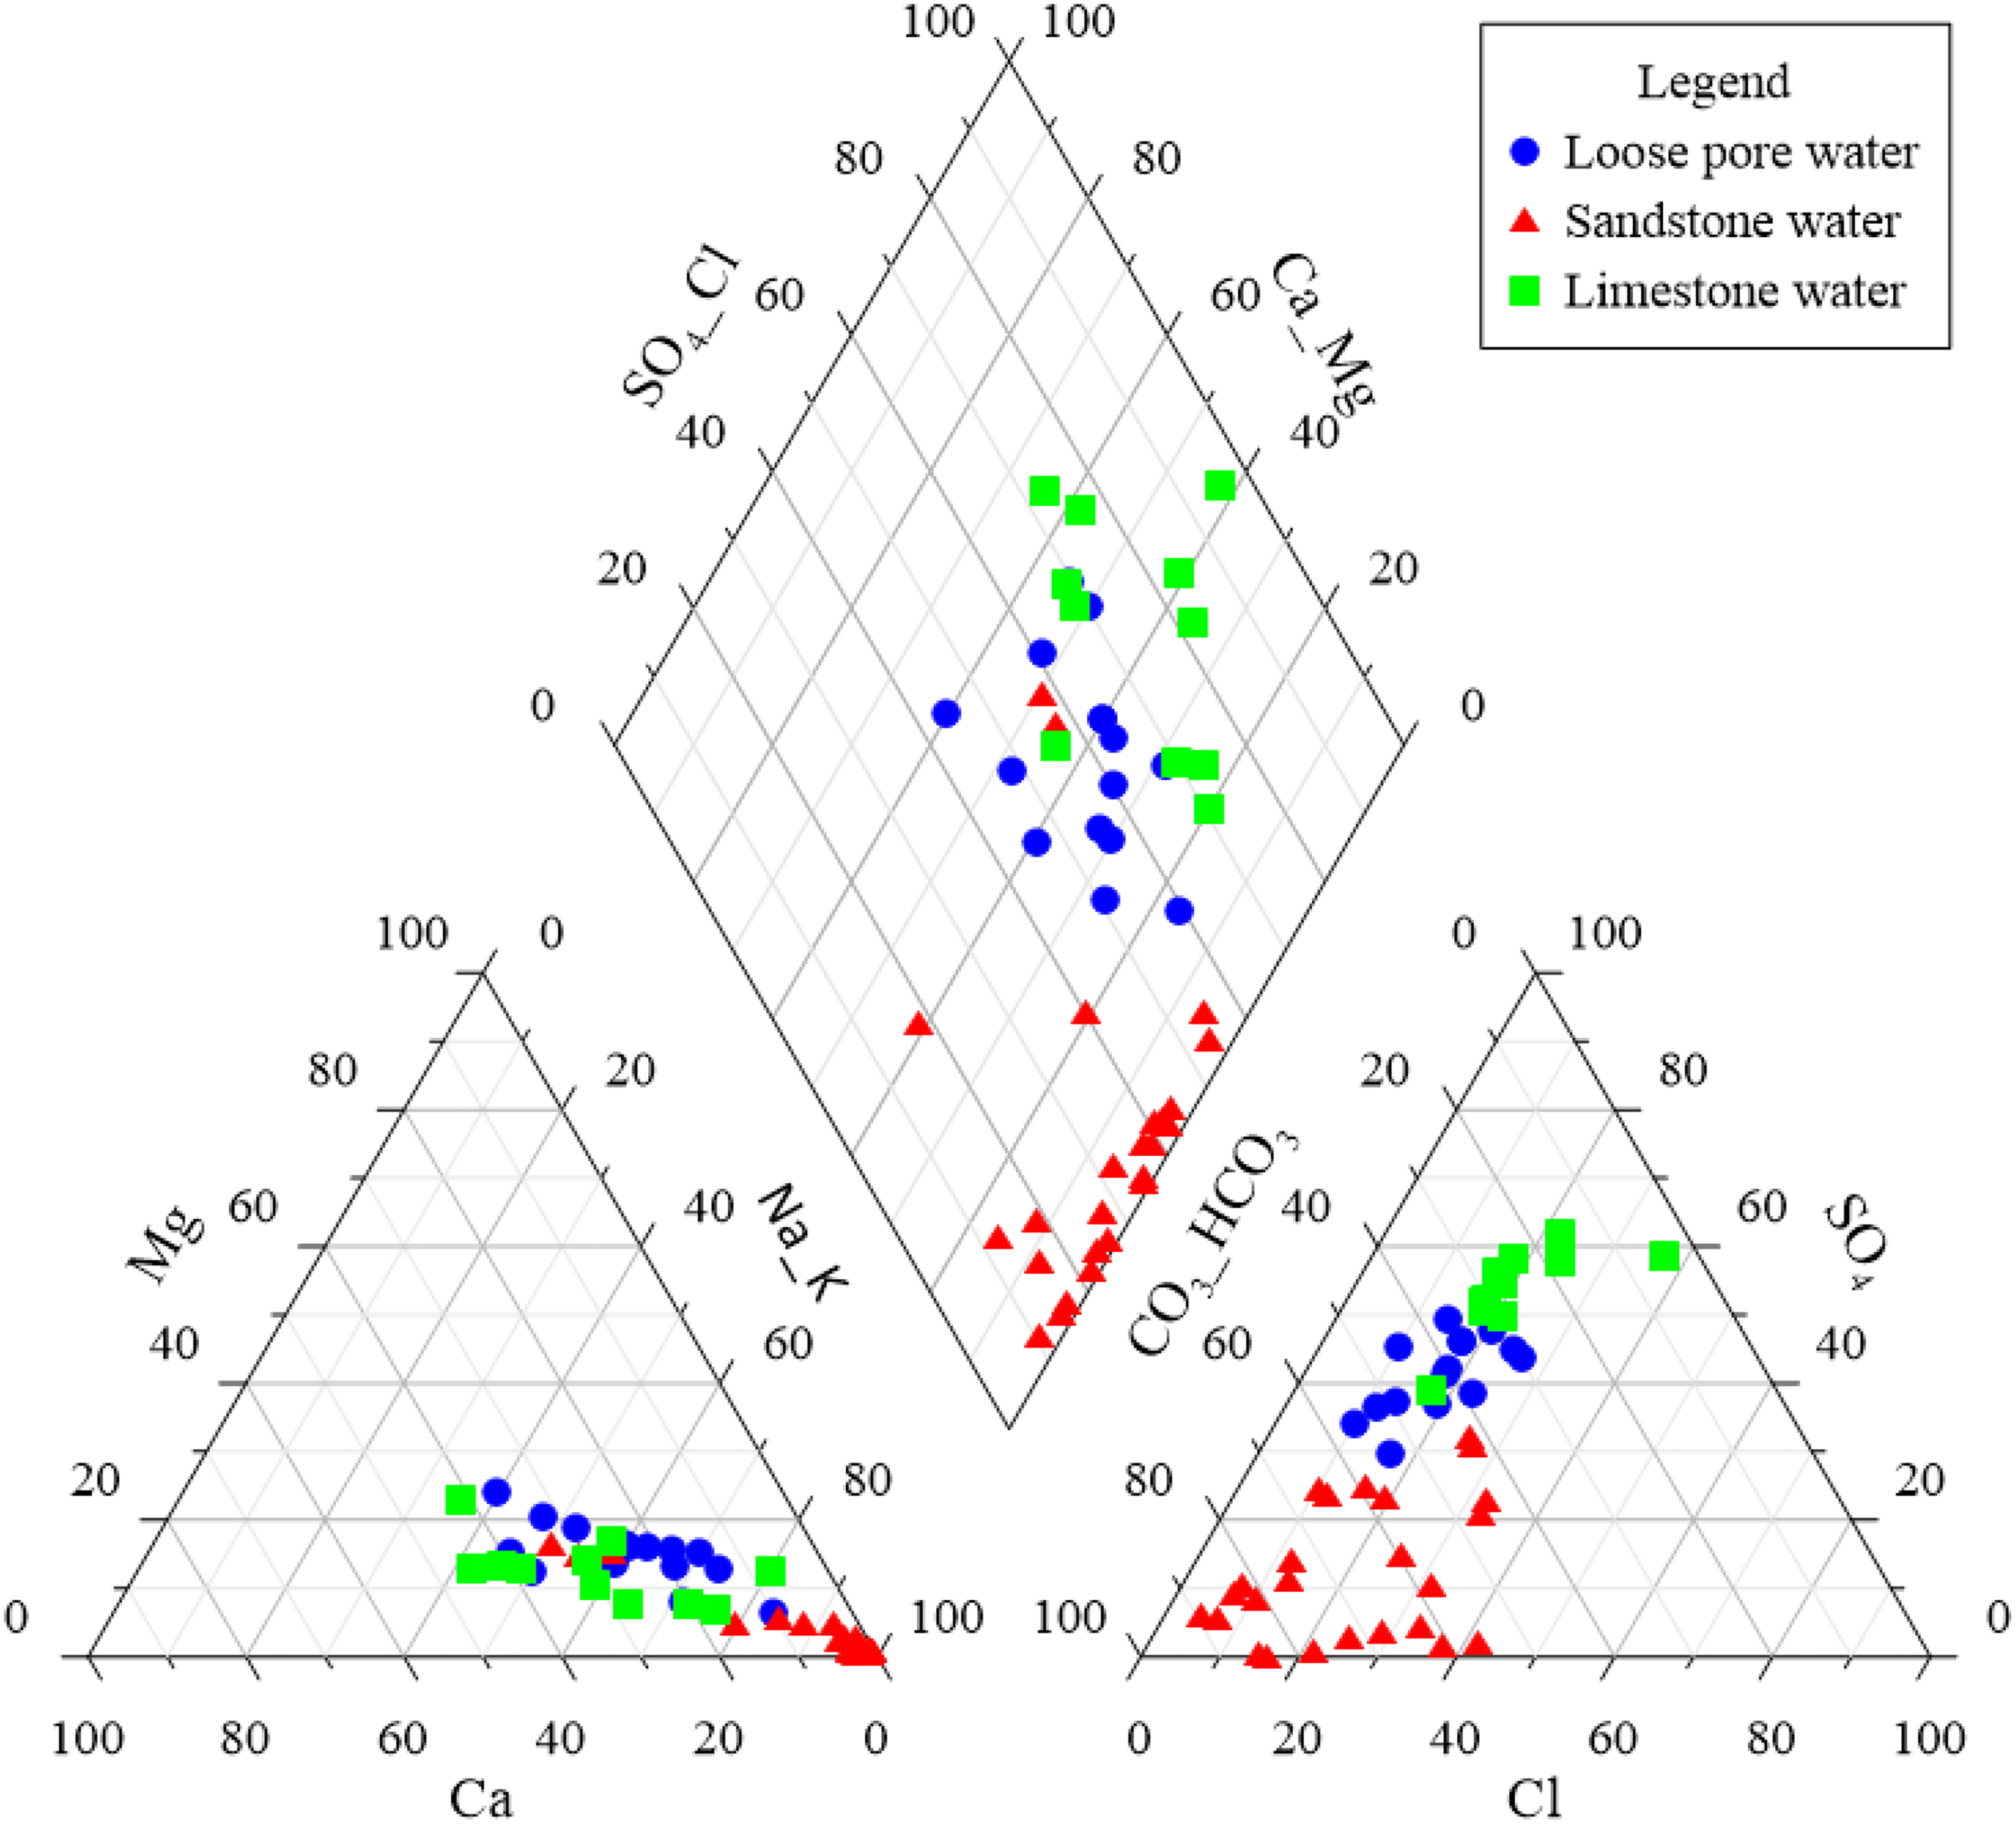
Piper diagram of all water samples.
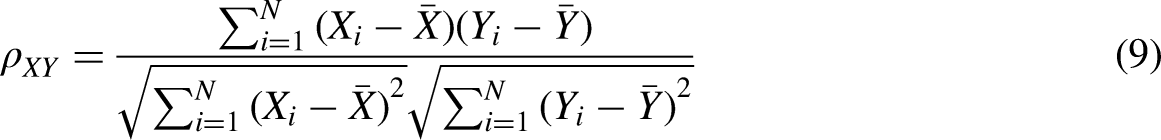
As shown in Figure 3, the correlation coefficients of SO42− with Ca2+ and Mg2+ were 0.83 and 0.82, respectively, with significant correlations, indicating that the main hydrochemical effect occurring in the groundwater was gypsum dissolution. The K+ + Na+ negatively correlated with Ca2+ and Mg2+, indicating that cation exchange occurred in the groundwater. The SO42− showed a weak negative correlation with HCO3−, indicating that sulfate reduction may have occurred in the groundwater.
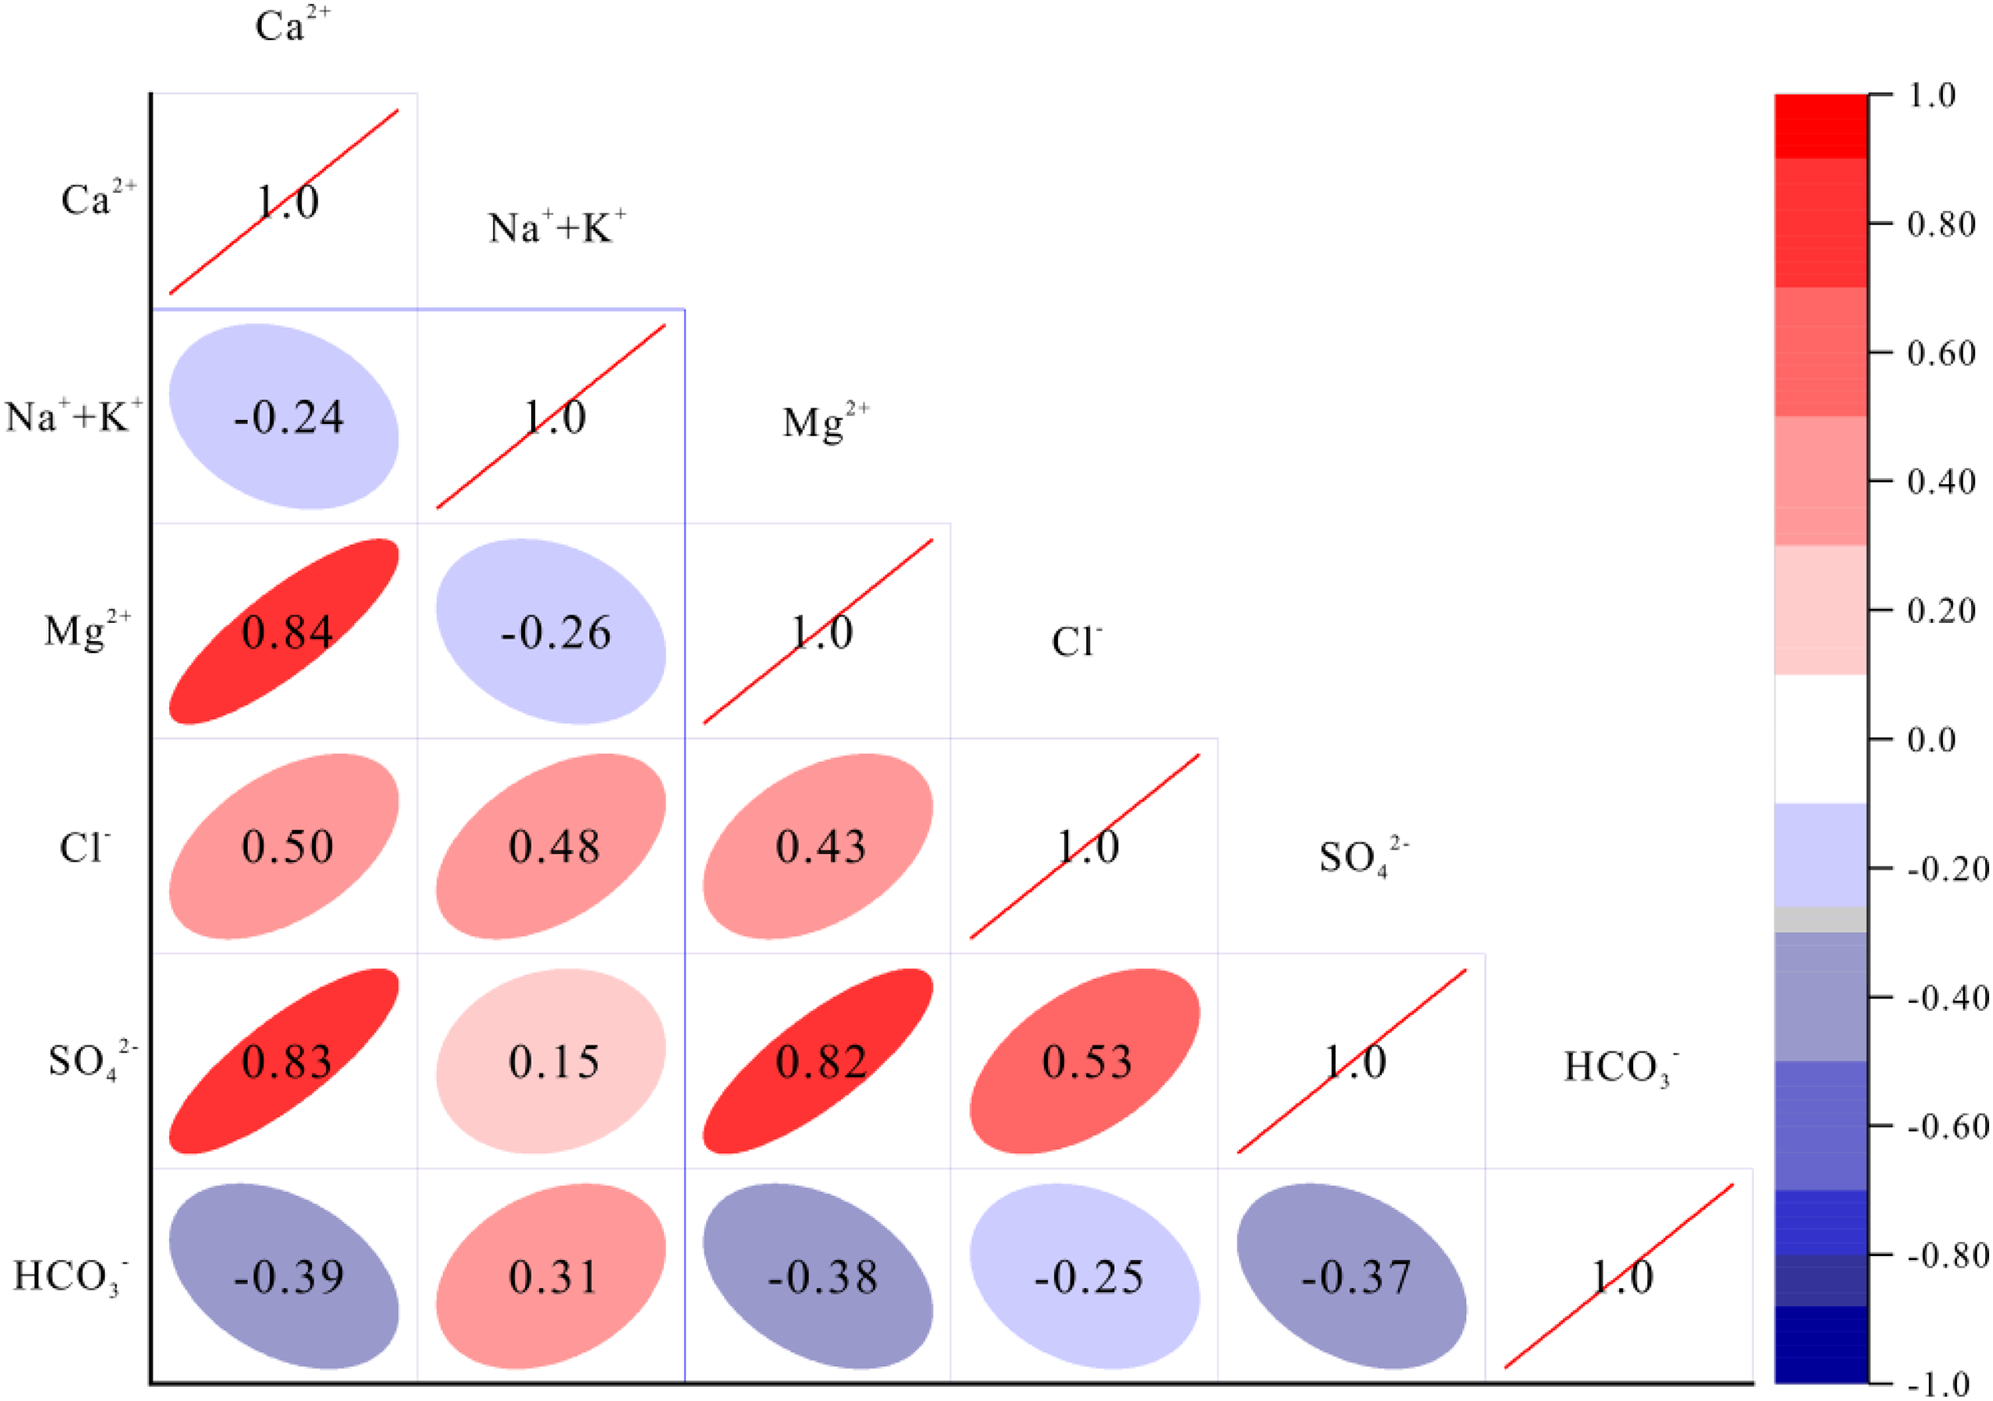
Plot showing the results of Pearsońs correlation.
Exponential whitenization function and grey situation decision
Establishing of the exponential whitening function
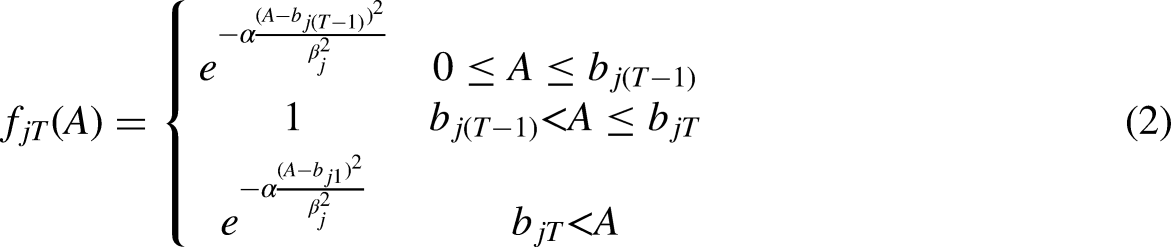
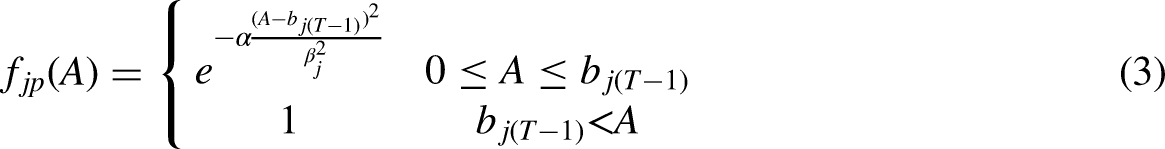
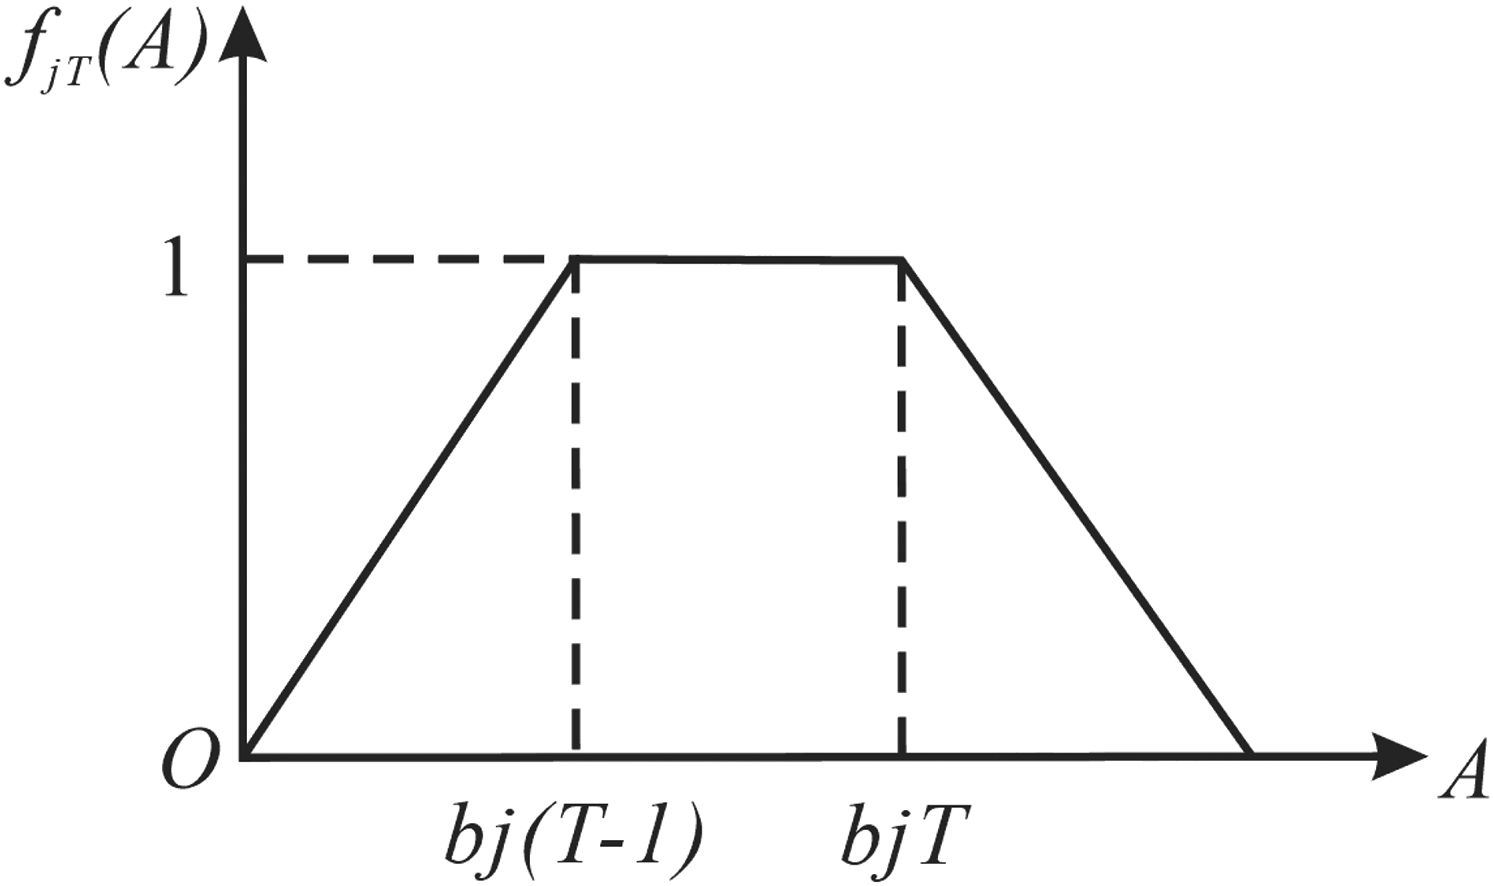
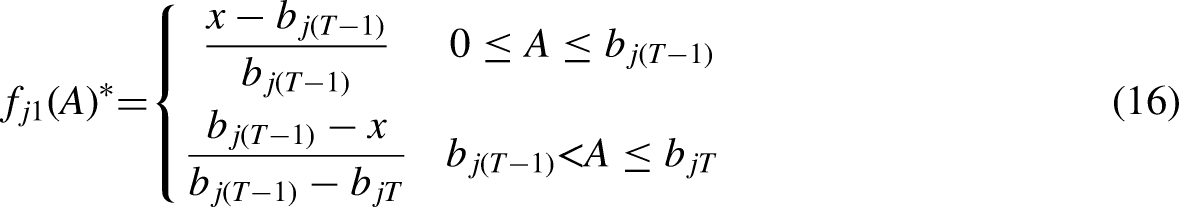
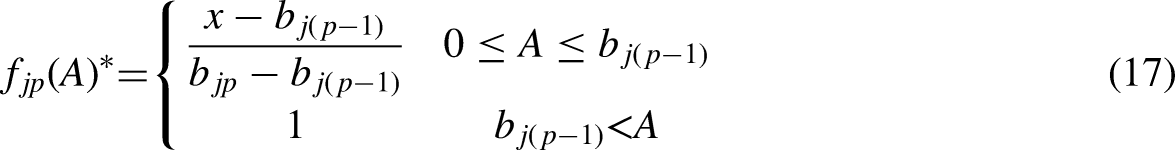
The exponential whitening function is shown in Figure 4, established using Equations (1) to (3).
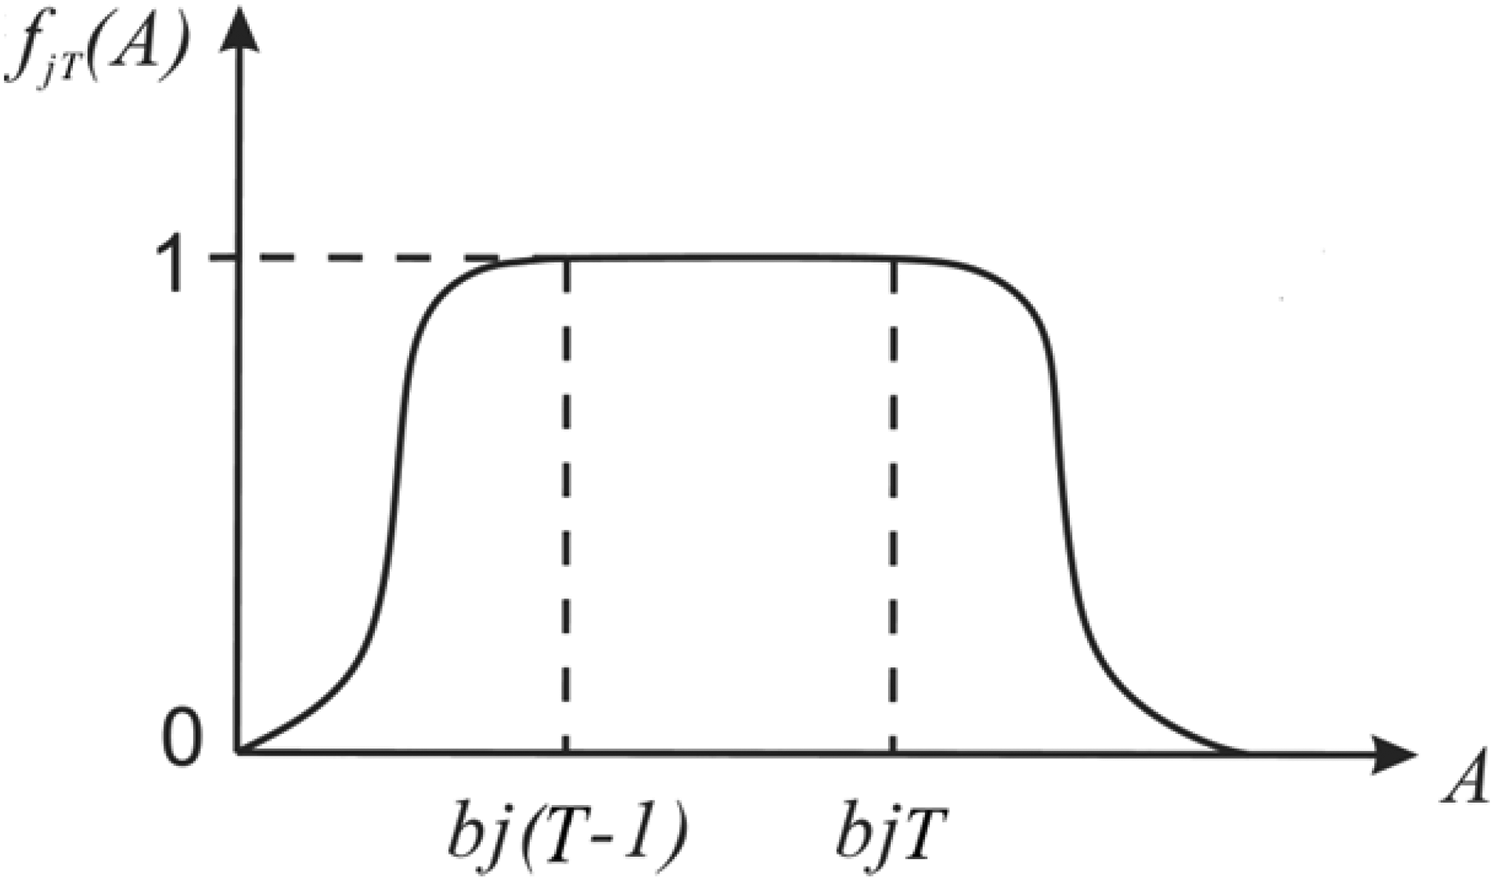
Exponential whitening function.
T = 1, the membership function of “reduced half curved trapezoid” is as follows: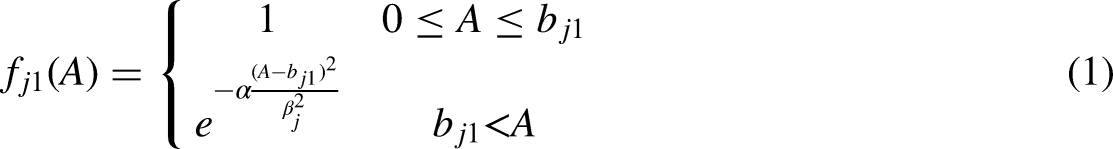
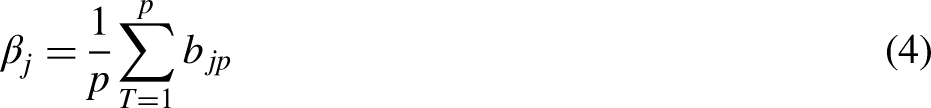

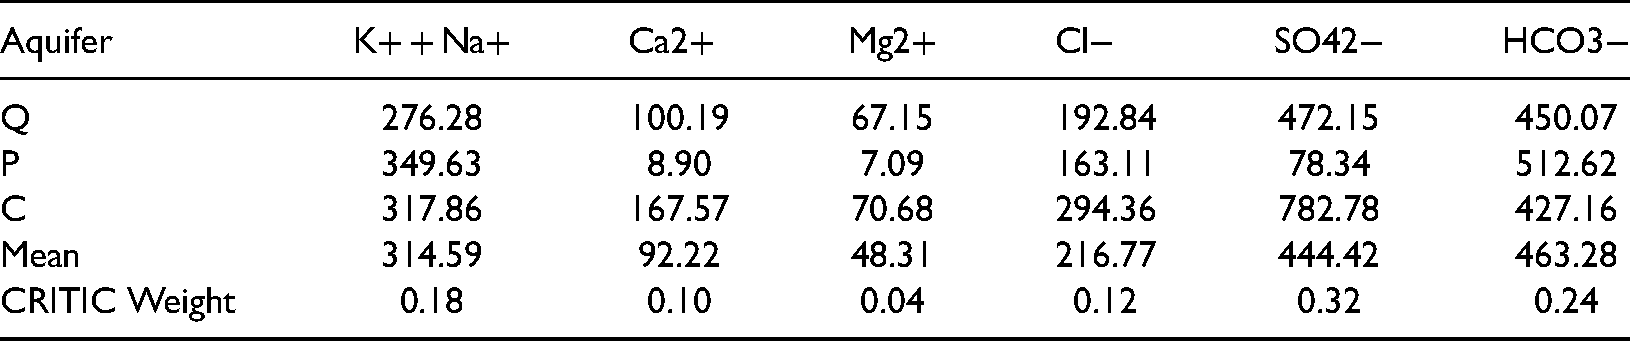
CRITIC weight calculation
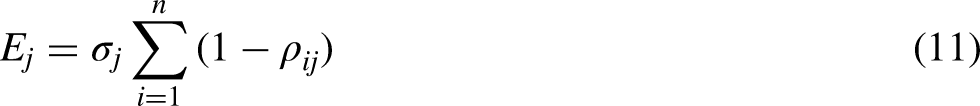
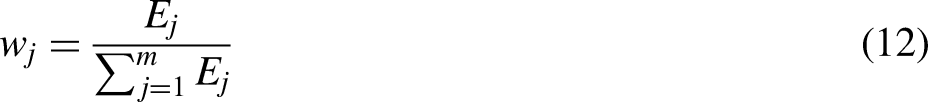
The CRITIC Weight method is an objective weighting method. It is based on the idea to use it for two indicators, which are contrast strength and conflict. Contrast intensity is expressed by the standard deviation; if the standard deviation of the data is larger, it means more fluctuation and a higher weight. Conflict is expressed by the correlation coefficient; if the correlation coefficient value between indicators is larger, it means less conflict and a lower weight. The final weights are obtained by multiplying the contrast strength and conflict indices and normalizing them. Because the data in this paper were characterized by volatility (Table 2) and strong correlation between indicators (Figure 3), it was suitable to use the critical weight method, which greatly improved the accuracy of discrimination.
Classification table of mine water inrush hazard sources and CRITIC weight.
Maximum value method:

Establishing the comprehensive model
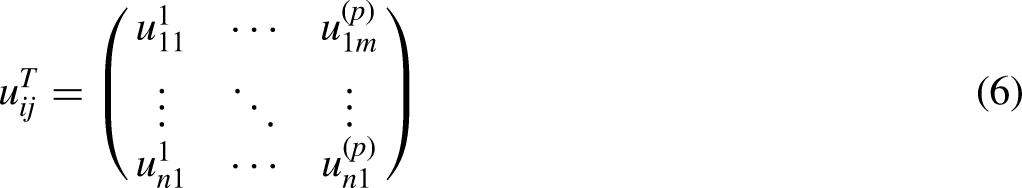
We determined the comprehensive membership matrix 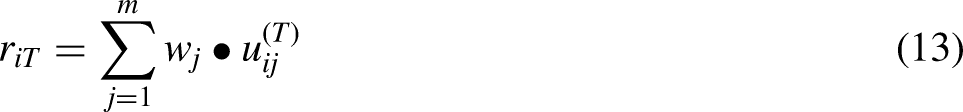

Linear whitenization function and grey situation decision
The linear whitening function is shown in Figure 5. Equations (11) to (13) were used to establish the whitening function. Similarly, we continued to calculate the comprehensive membership according to Equations (6), (12), (13) and (14) above.
Linear whitening function.
T = 1, the membership function of the “reduced half curved trapezoid” is as follows: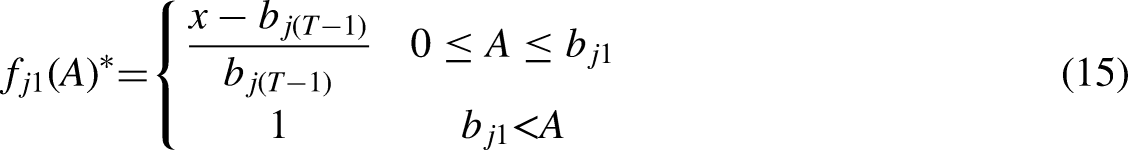
Construction of the mine water inrush source recognition model
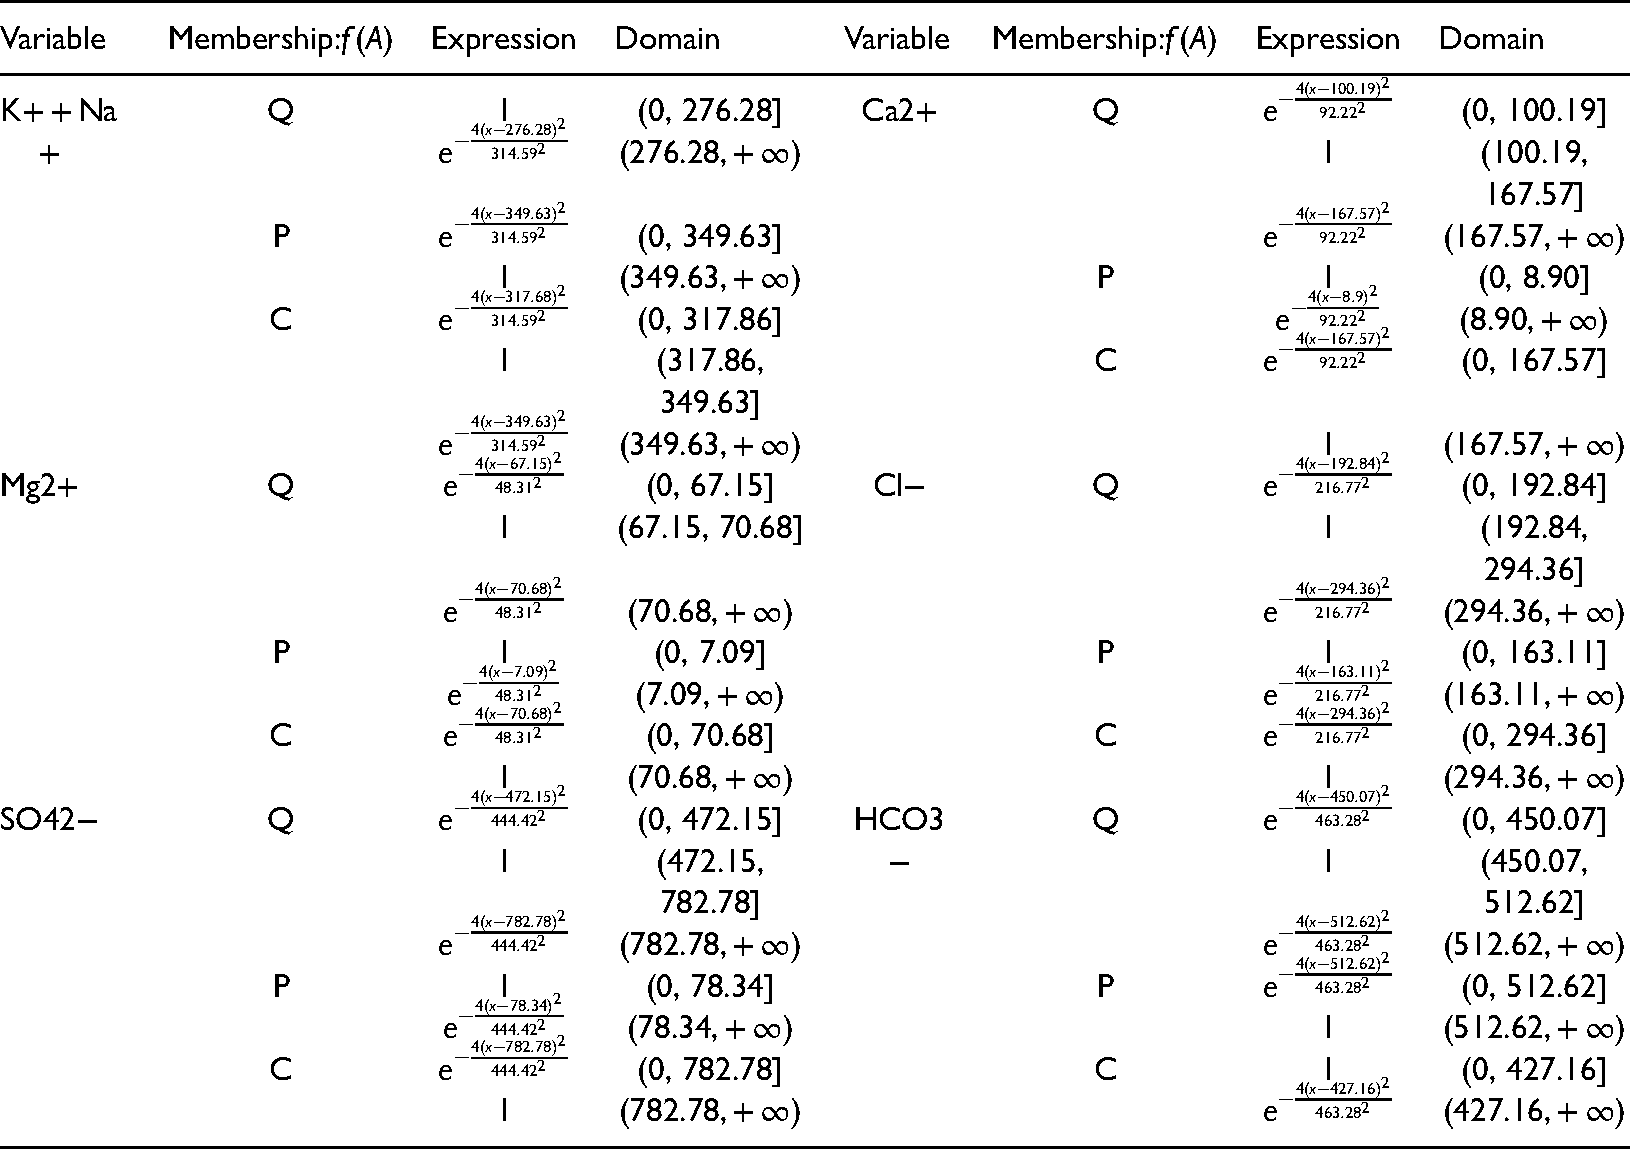
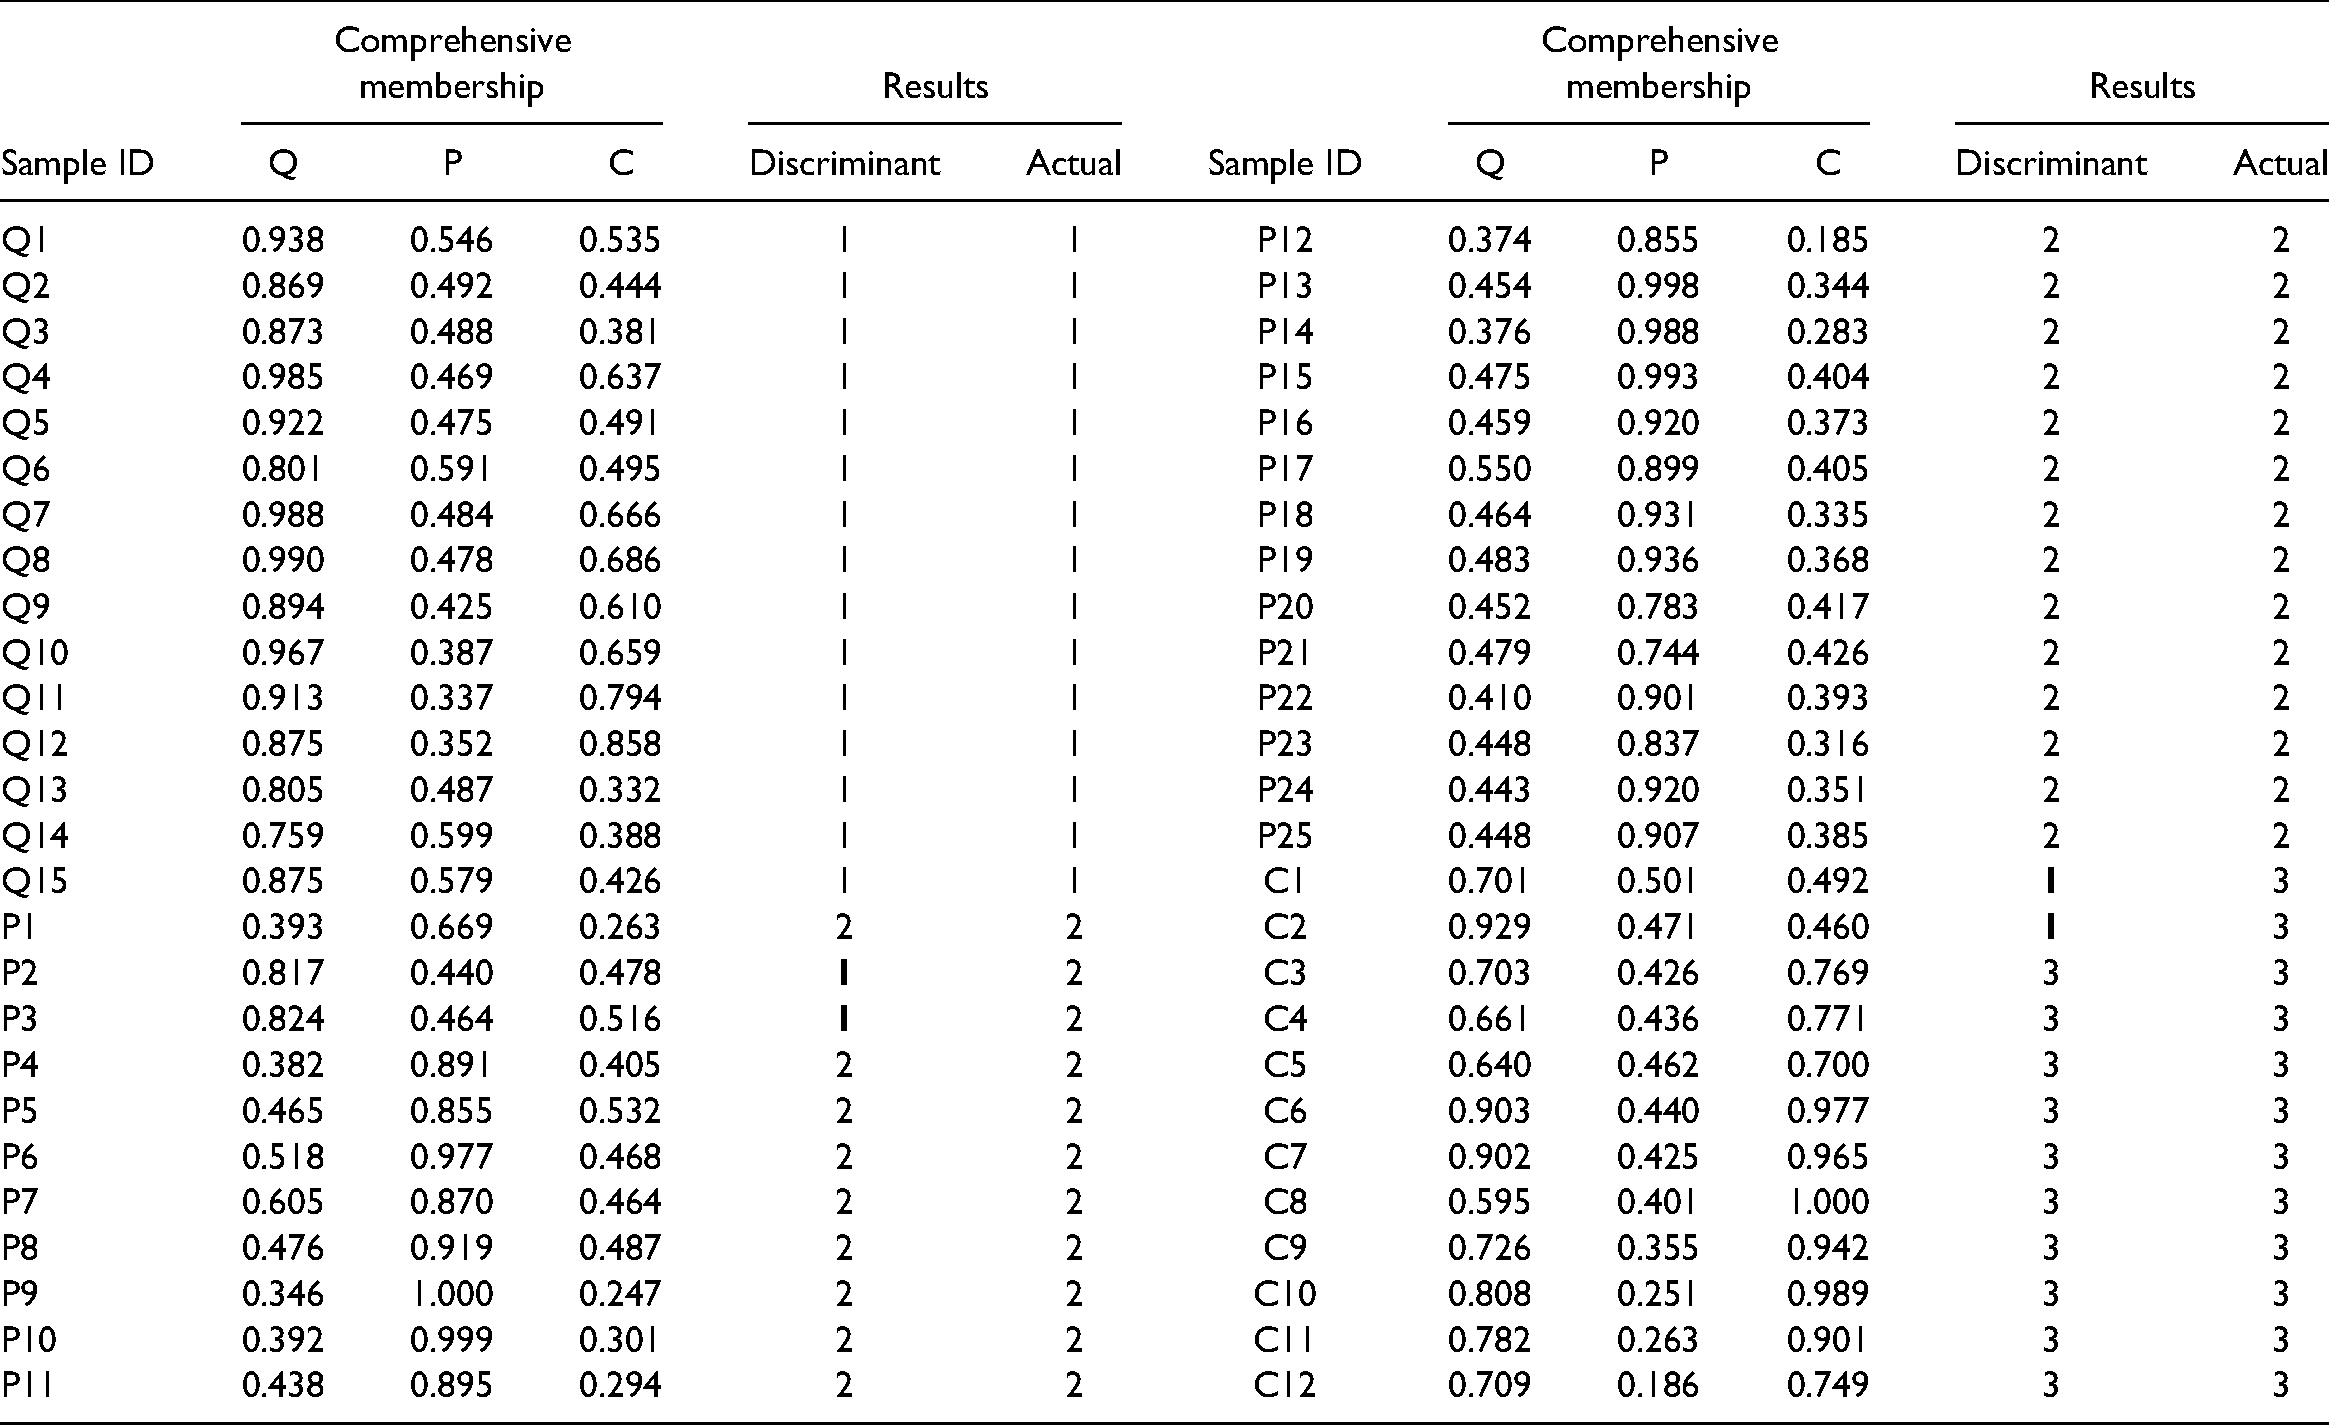
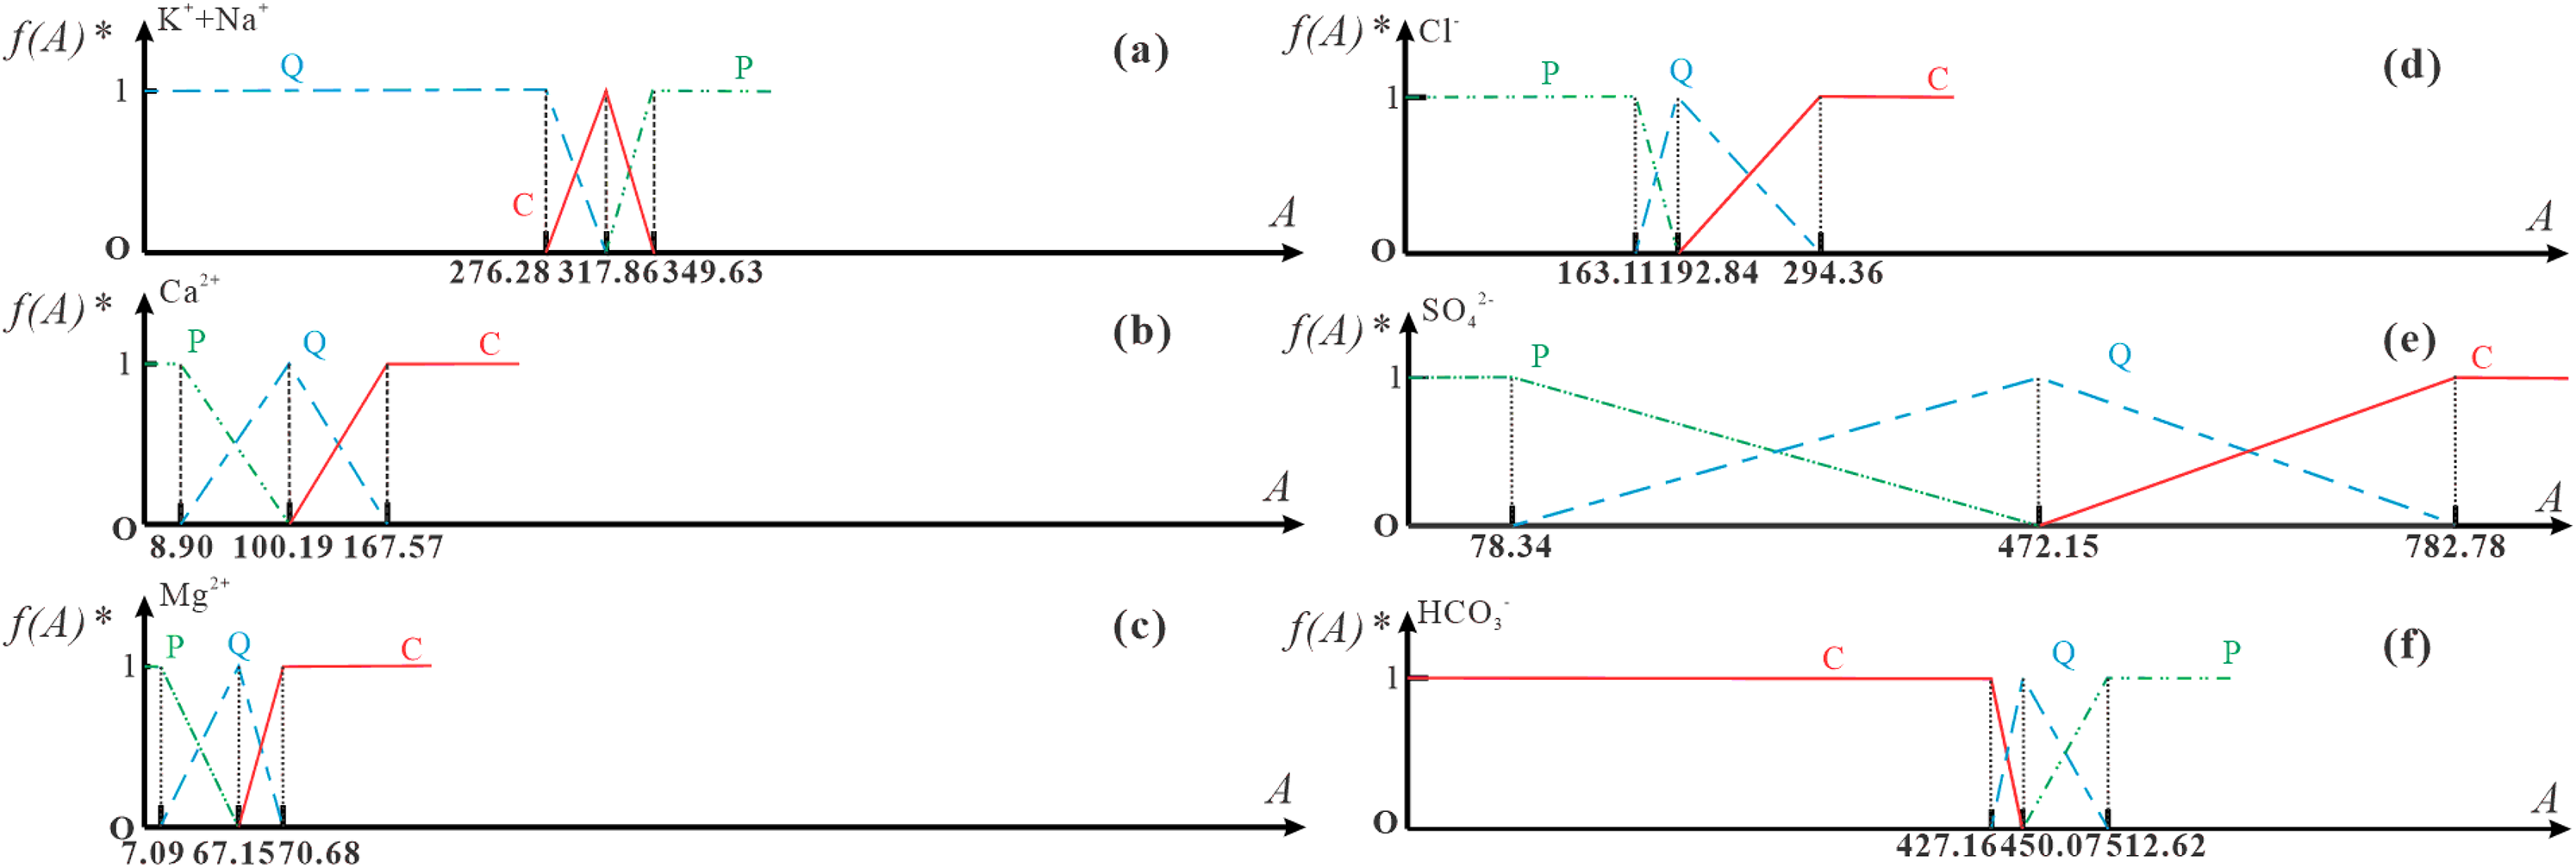
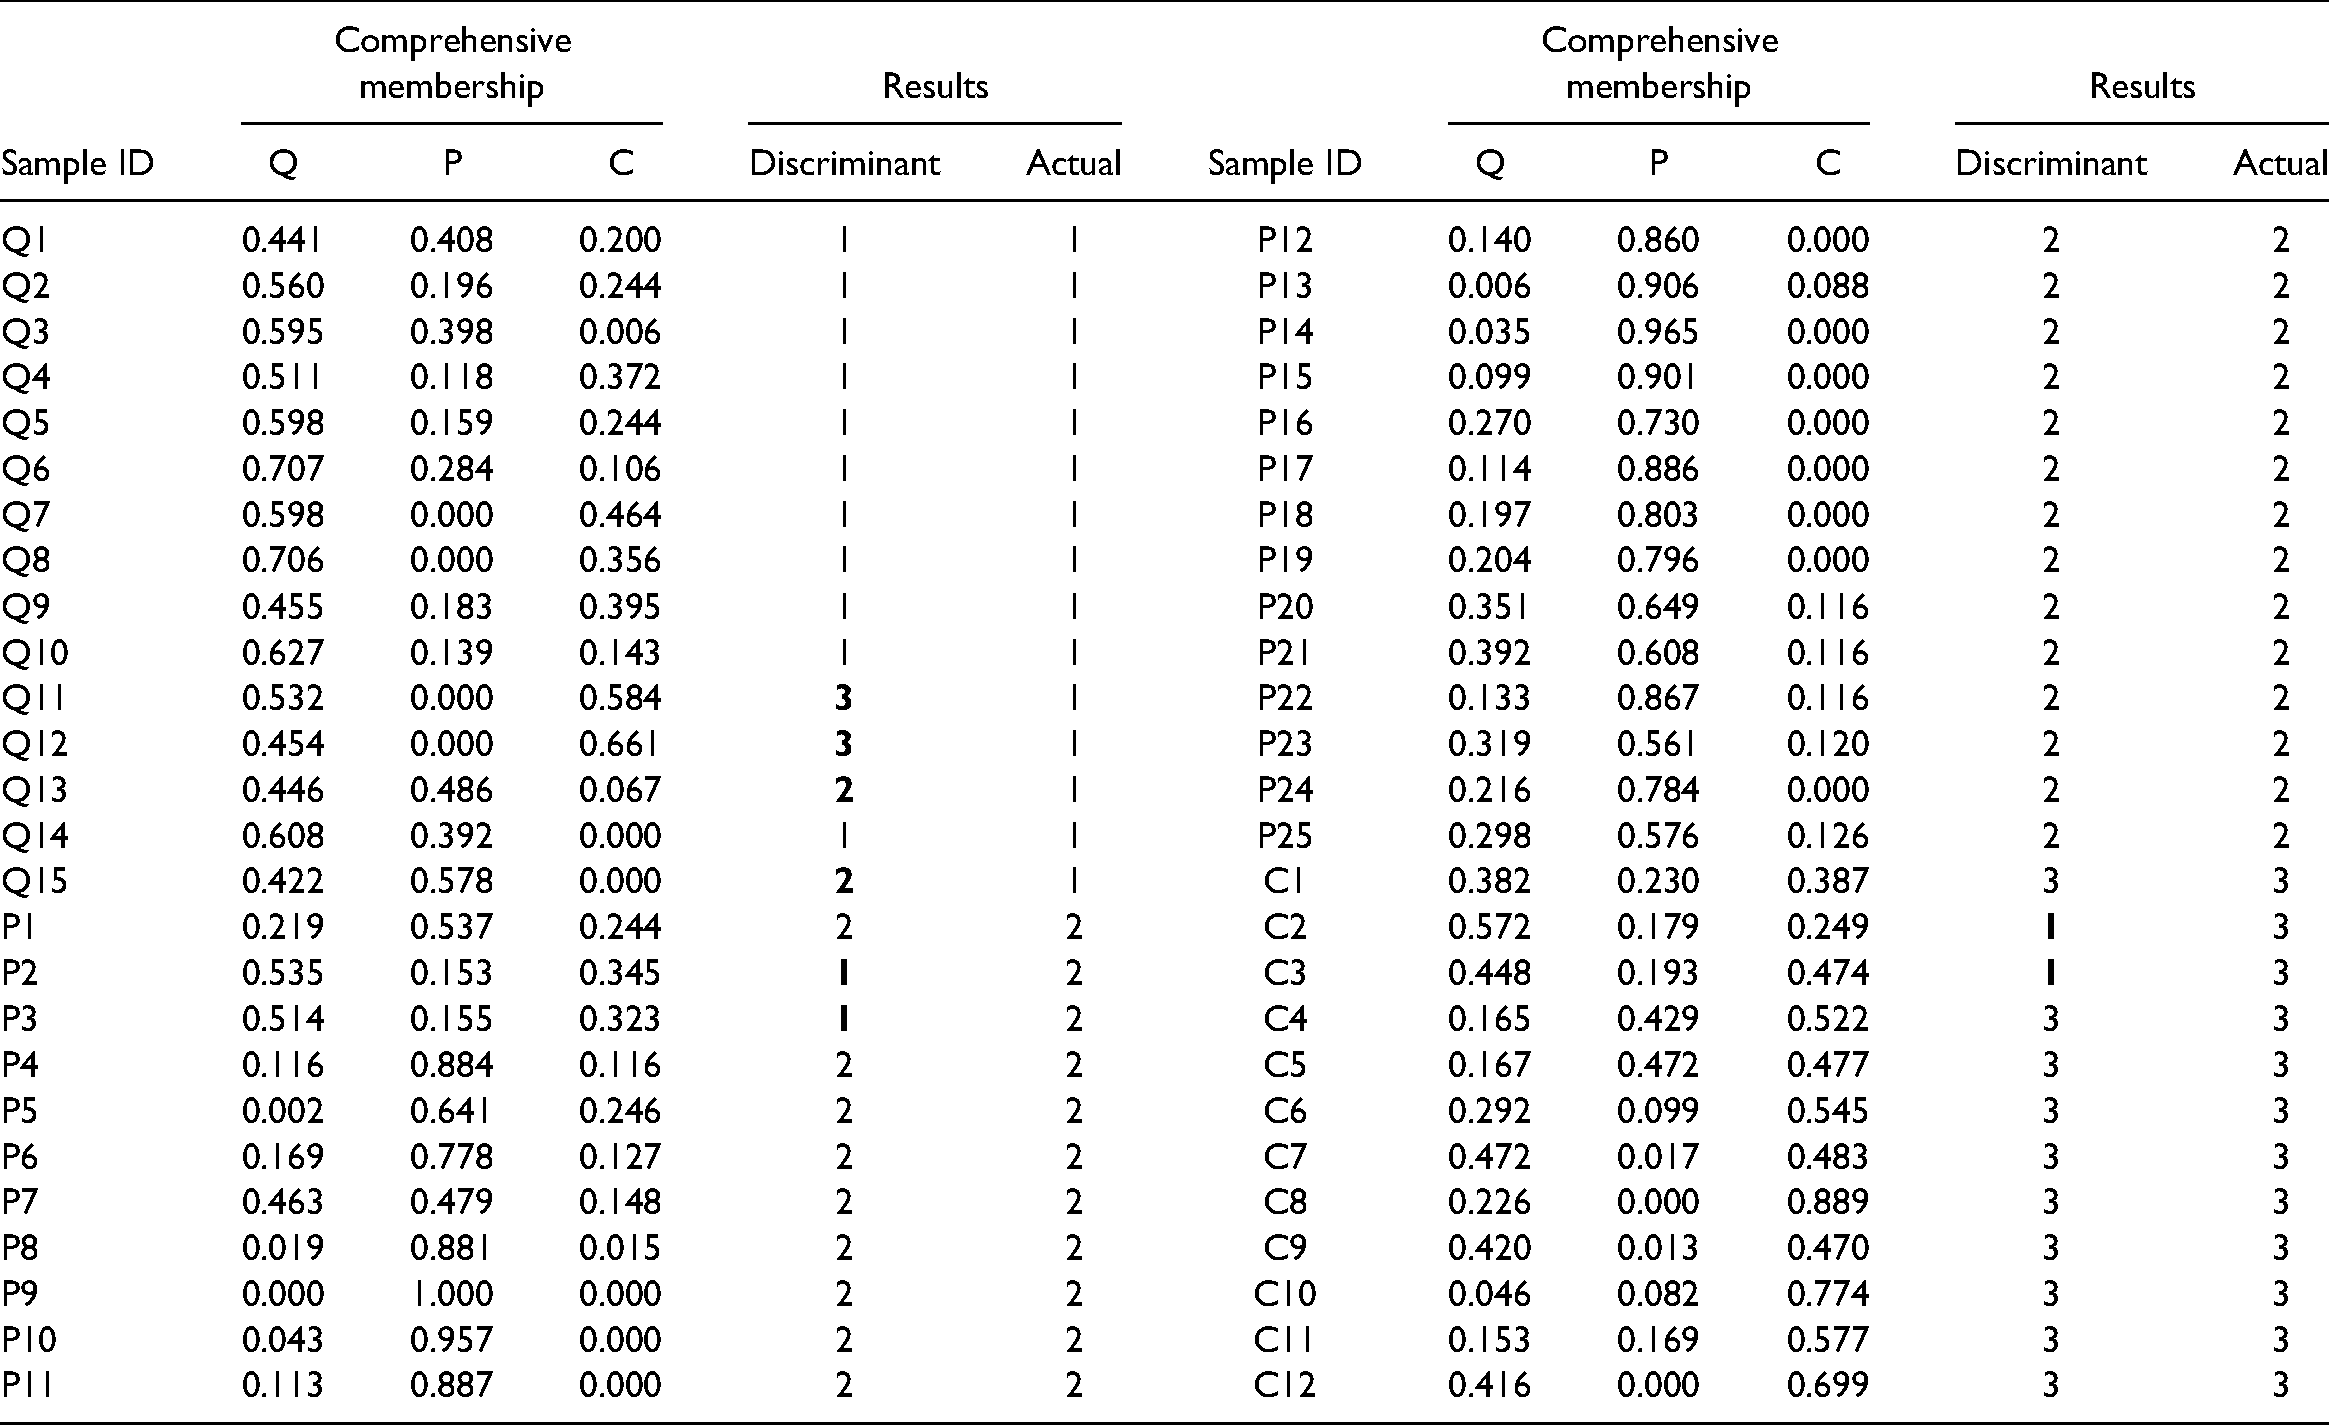
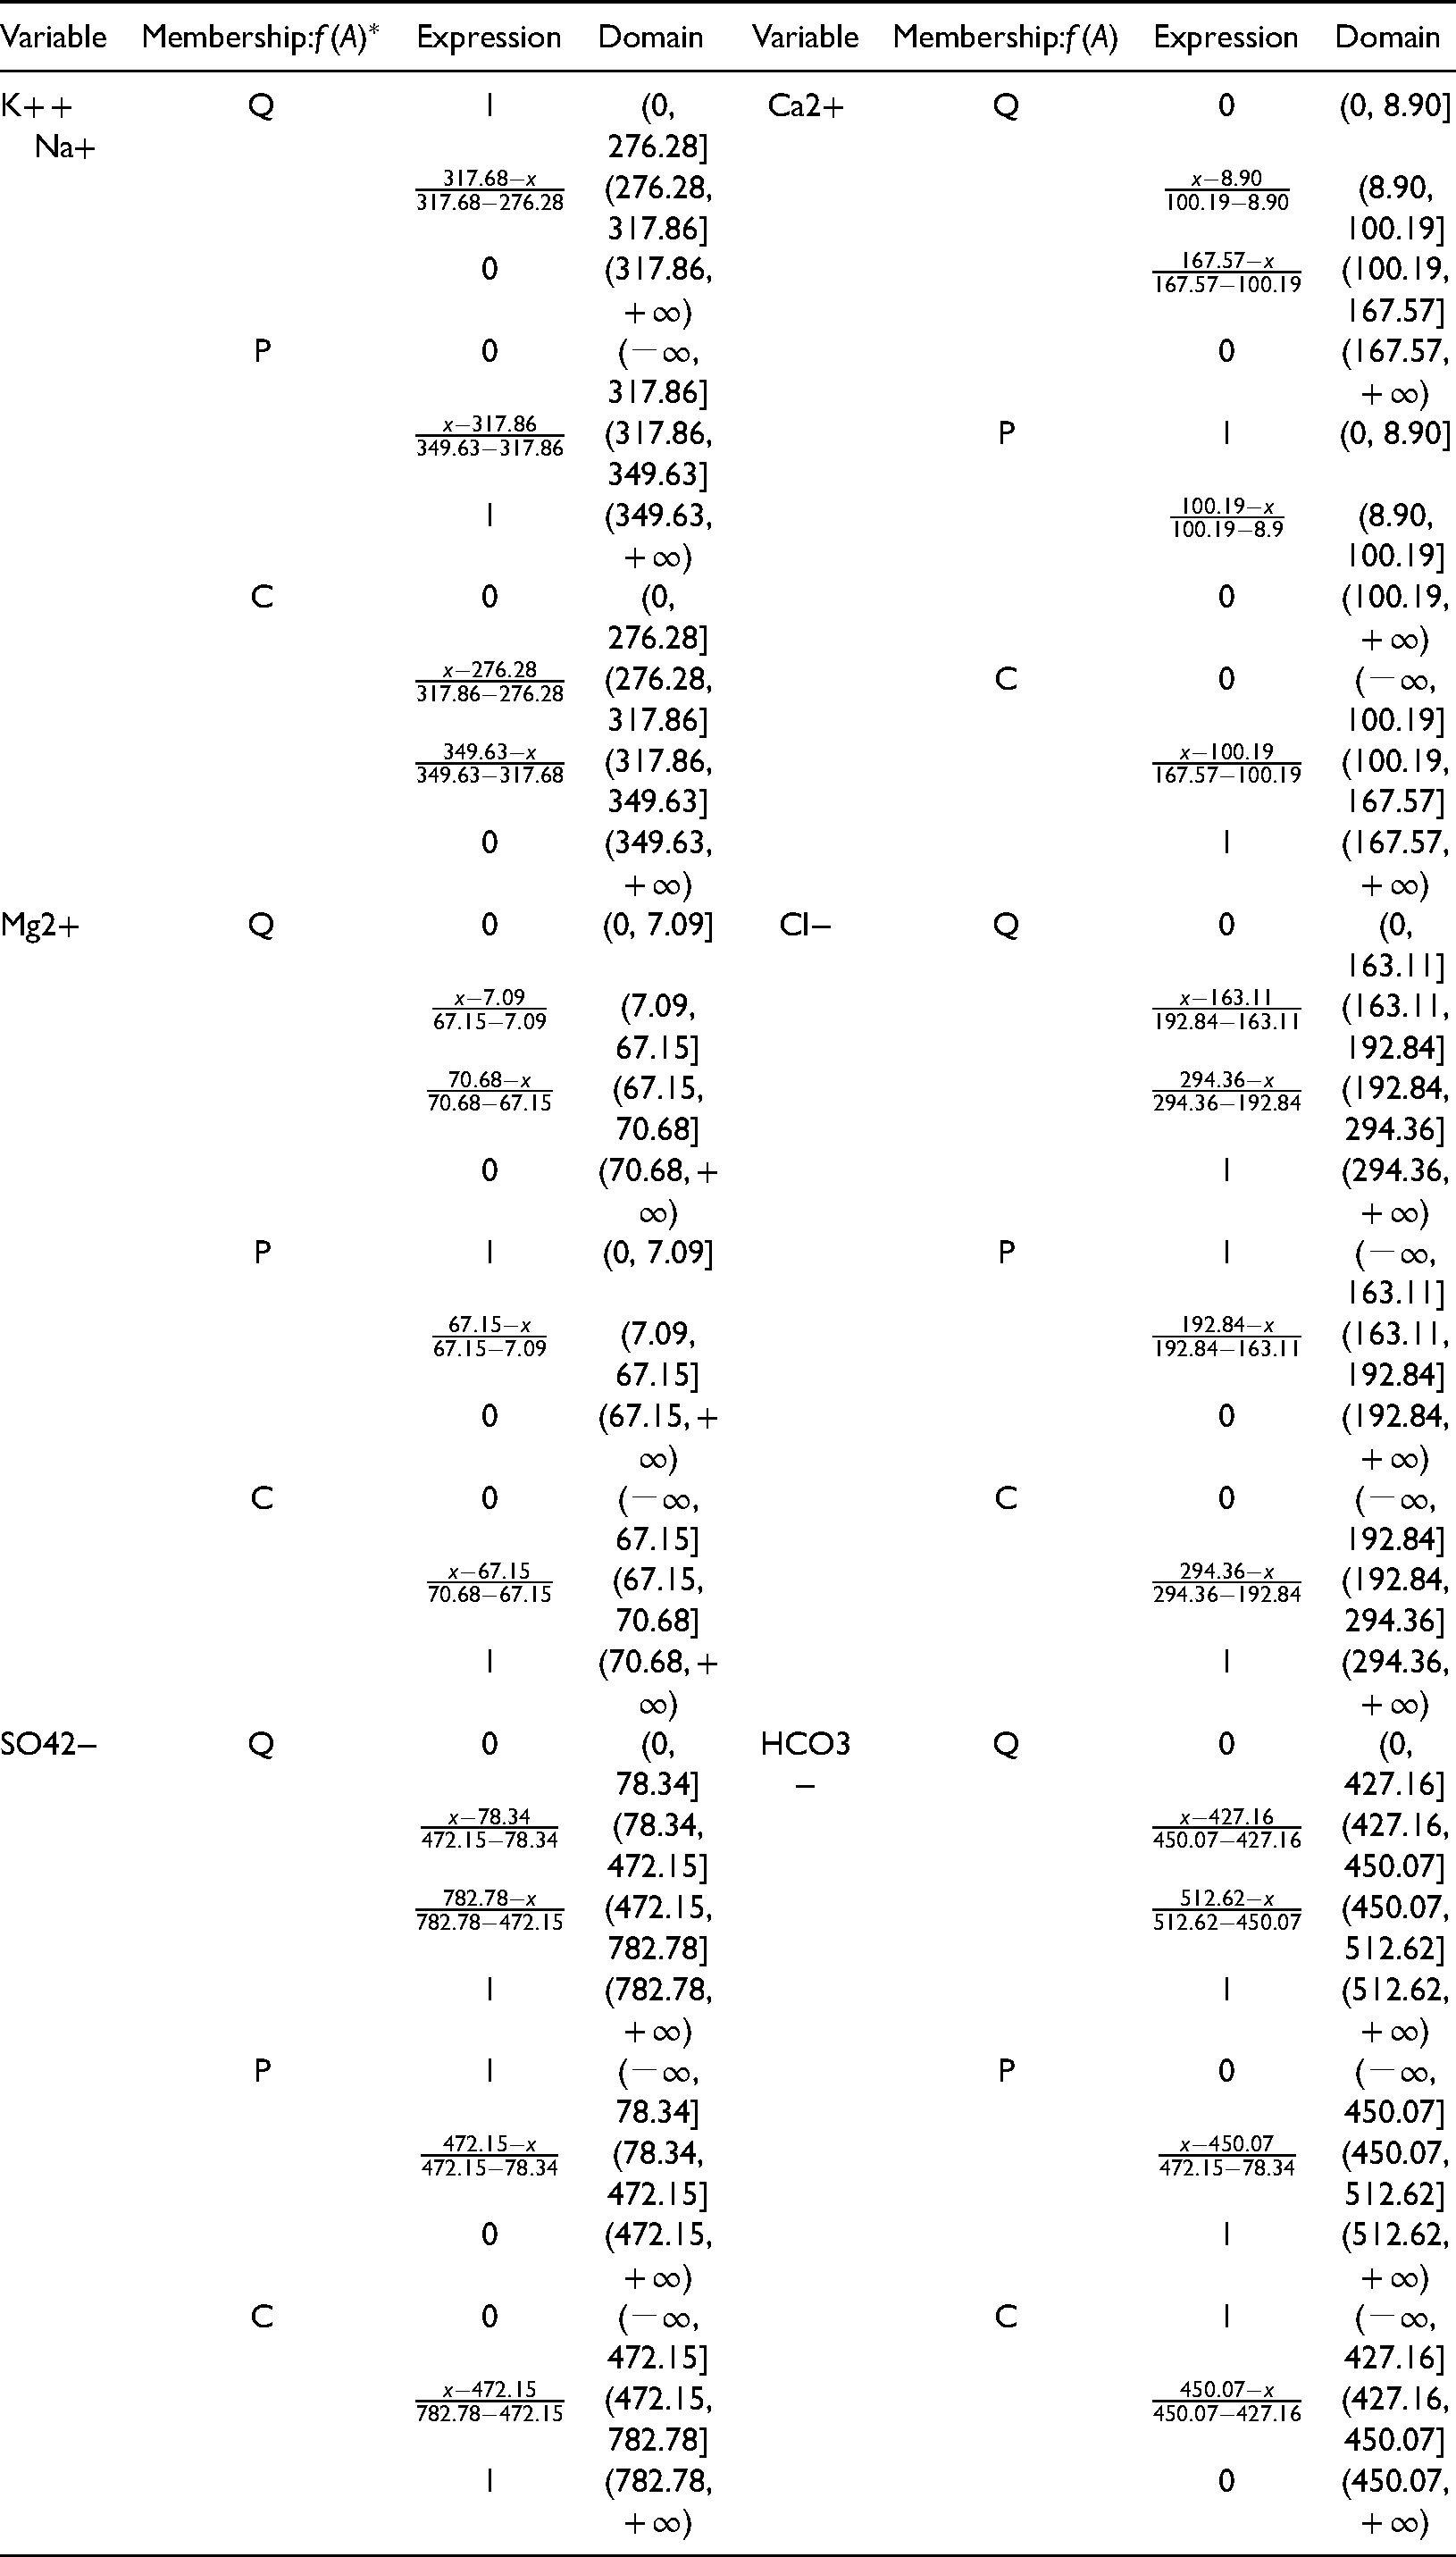
To generate Table 2, Huber's M-estimator method was used to find out the graded values of each variable corresponding to the source of the mine water inrush hazard. The calculation results of the critical weights are shown in Table 2. Based on the theory of the trapezoidal whitening function, a whitening function model was established, as shown in Figure 6. The affiliation of the variables to mine water inrush hazard sources was calculated by substituting the concentration value A of each variable into the corresponding relational equation of the whitening function f(A). According to Figure 6(a) and Equations (2) to (5), the three membership functions of the variable K+ + Na+ were defined and are shown in Table 3. The affiliation degrees and entropy weights of each variable were used to obtain the comprehensive affiliation degrees of different mine water inrush sources, as shown in Table 4. In the Table 4, 1, 2 and 3 represent Q, P and C aquifers respectively. The recognition accuracy of water samples from the Cenozoic aquifer was 100%, that of water samples from the Permian aquifer was 92.0%, and that of samples from the Carboniferous aquifer was 83.3%. The comprehensive accuracy of the model was 92.3%.
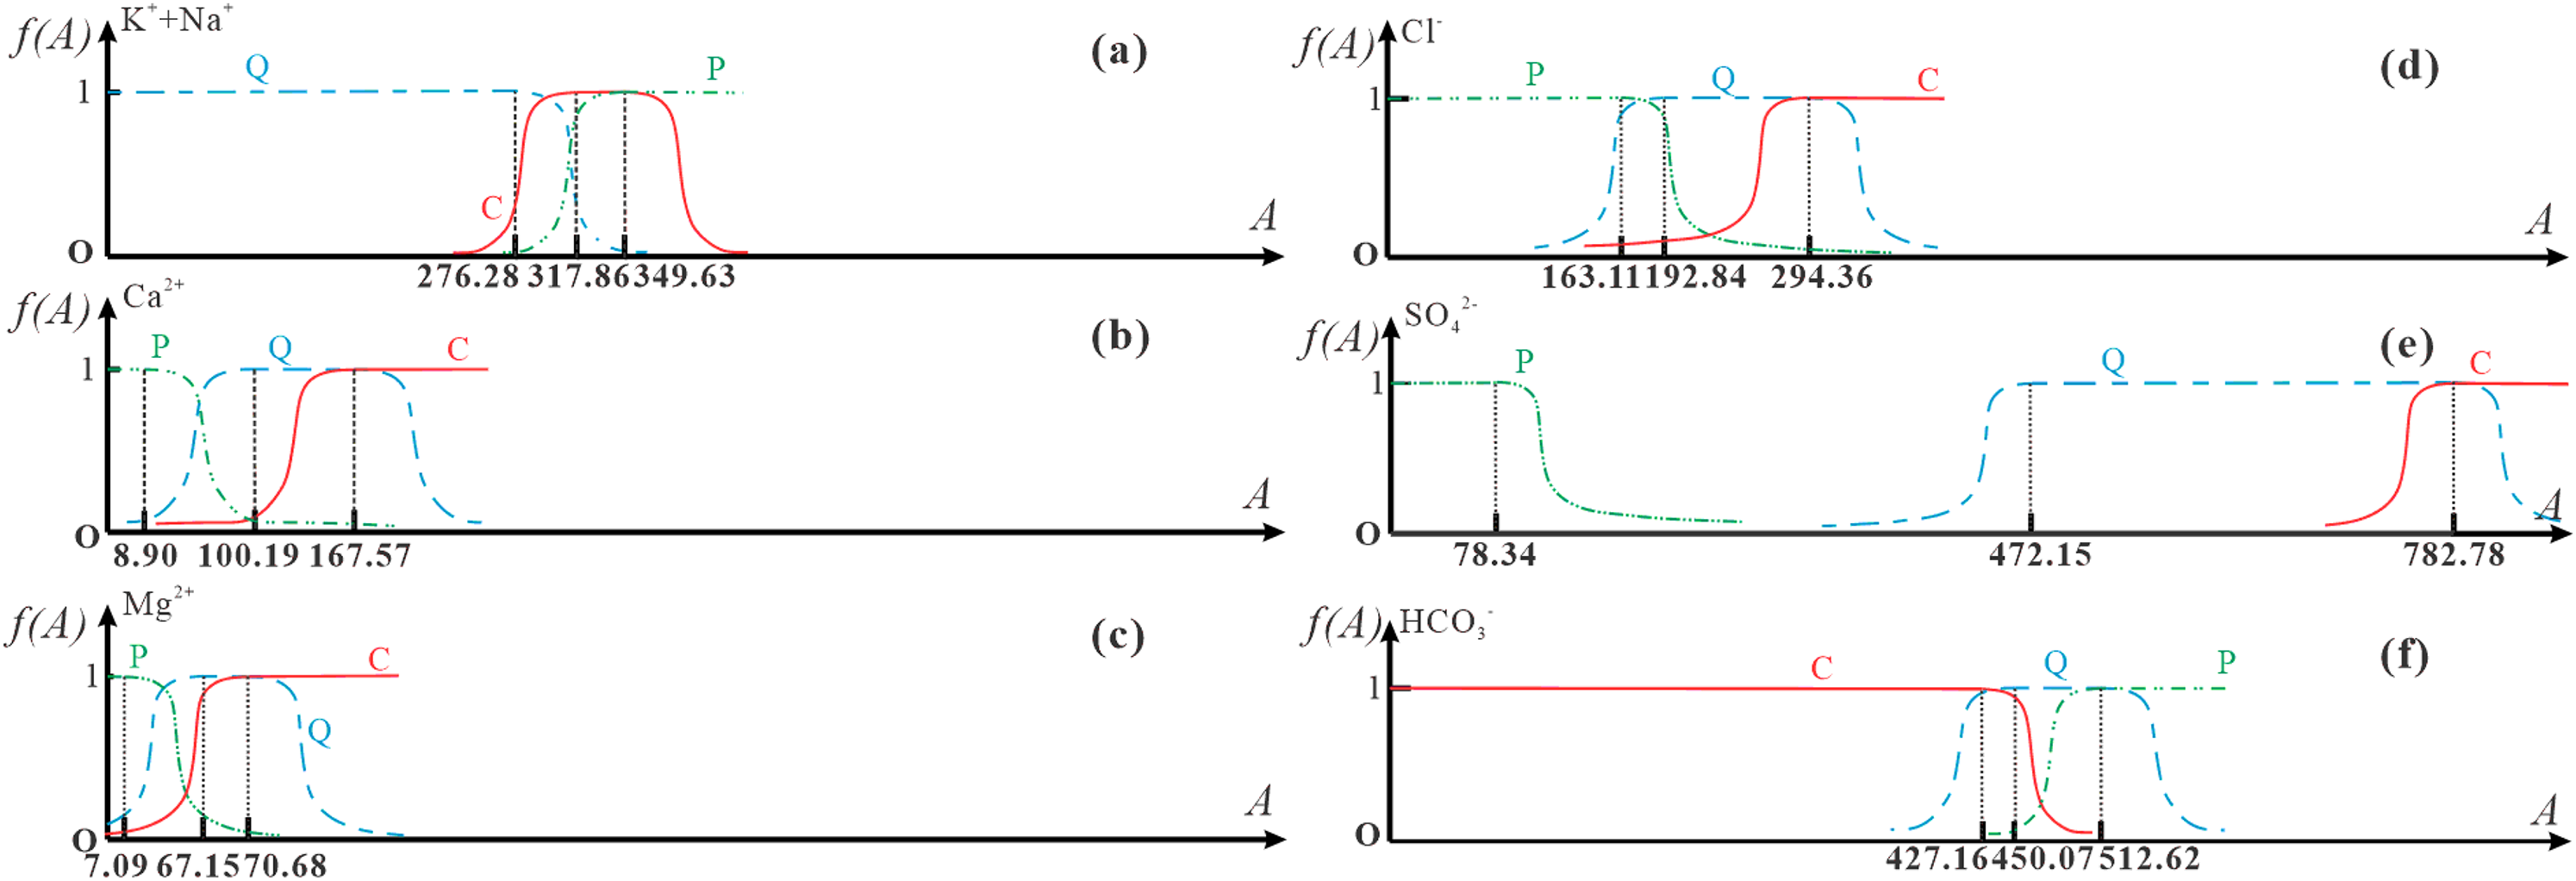
Exponential whitening function diagrams of the different variables.
Membership function results by the exponential whitenization function.
Integrated affiliation and discriminatory results of mine water inrush sources by the exponential whitenization function.
Results and discussion
The grey situation decision method is used to obtain the optimal situation in an environment with known and unknown factors (Zhang et al. 2014; Zu et al. 2018). Here, it was applied to identify the water inrush resources with various multi-factor variables, which are attributed to a single target for decision discrimination. It solved the problem that a single factor cannot identify the source category. When the grey situation decision method is used to solve the problem, the whitening function can be used to calculate the membership value. In the past, the “linear semi trapezoidal structure” was generally used, but this function only explained the variable value relationship of adjacent levels. If it is outside the adjacent level, the variable value is zero, which will only increase the weight of the adjacent level variables. Subsequently, this causes a lack of effective information. Therefore, we imported an exponential whitening function which has a smooth function curve and can cover all variable values within the range. The exponential whitenization function and the grey situation decision were used to build the model of water source identification; P2, P3, C1, and C2 were misjudged as Cenozoic water by the exponential whitenization function and W1, W2 as Carboniferous water (Table 4 and Table 5), which may be due to the mixing of Permian water, Carboniferous water, and Cenozoic water. In addition, the hydrochemical types of Q, P, and C were a, B, and C, which further indicates the possibility of mixing some water sources.
Integrated affiliation and discriminatory results of mine water inrush sources by the linear whitenization function of unknown water samples.
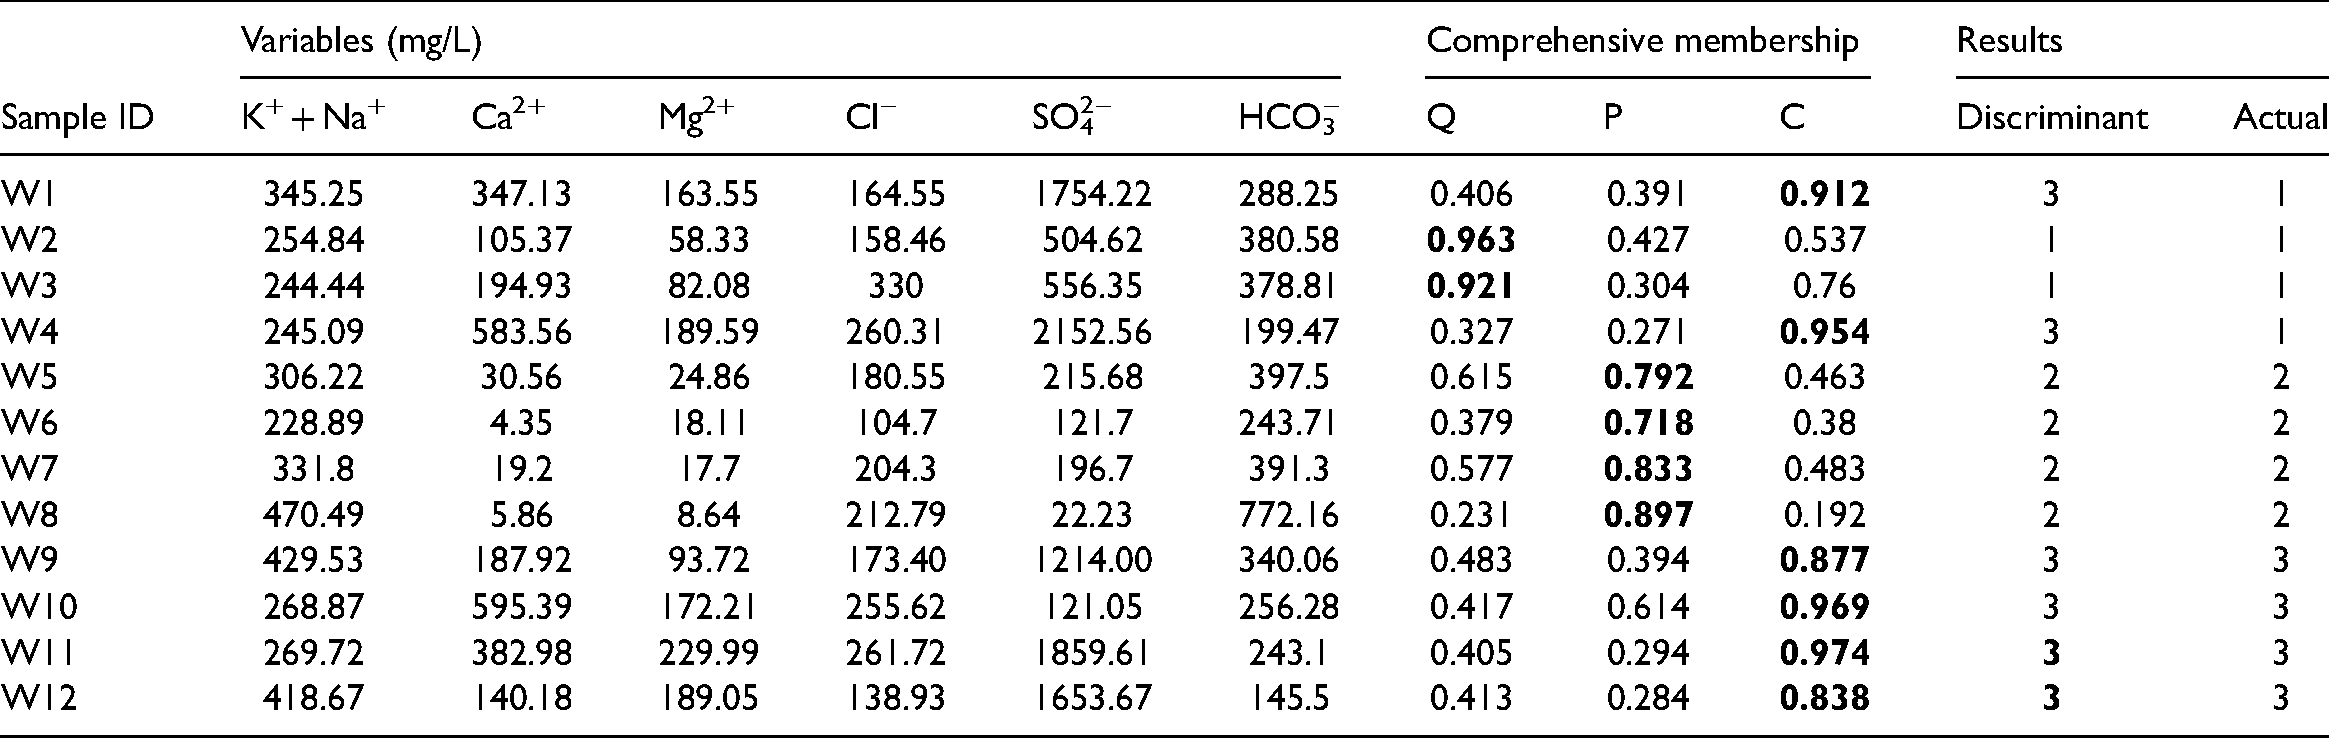
To evaluate the accuracy of this method, it was compared with the linear whitenization function. The calculation results are shown in Table 6. Based on the theory of the linear whitening function, a whitening function model was established, as shown in Figure 7. According to Figure 7a to f) and Equations (11) to (13), the three membership functions of the variables were defined (Table 7). The recognition accuracy of the water samples from the Cenozoic aquifer was 80.0%, that of the samples from the Permian aquifer is 92.0%, and that of the samples from the Carboniferous aquifer was 83.33%. The comprehensive accuracy of the model was 86.5%. To strengthen the practicability of the model, unknown water samples were collected, and four water samples were taken from each of the three aquifers. The model in this paper was used to distinguish unknown water samples (Table 8). The recognition accuracy of water samples from the Permian and Carboniferous aquifer was 100%, but two Cenozoic water samples were misjudged as samples from the Carboniferous aquifer. The comprehensive accuracy of the model was 85.7%.
Linear whitening function diagrams of the different variables.
Integrated affiliation and discriminatory results of mine water inrush sources by the linear whitenization function.
Membership function results obtained by the linear whitenization function.
Conclusions
In this study, the grey situation decision method was used to unify the event (water sample), countermeasure (ionic variable), and effect (water inrush source type) to make decisions (discrimination) on the system, with the aim to obtain the water source type of each water sample. On this basis, the exponential whitening function was introduced to identify the water source. Compared with the results of the linear whitening function, the following conclusions can be drawn:
The Cenozoic, Permian, and Carboniferous aquifers were characterized by K + Na·Mg-HCO3, K + Na-SO4·HCO3, K + Na·Mg-SO4·Cl. Mineral dissolution and cation exchange mainly occurred in the groundwater. Through the back substitution discrimination of the two models, the comprehensive accuracy of the exponential whitening function was 92.3%, whereas that of the linear whitening function was 86.5%. The unknown water samples were also distinguished, and the comprehensive accuracy was 85.7%. Based on these results, the accuracy of the exponential whitening function and the grey situation decision-making discrimination model was higher. The exponential whitening function can eliminate the disadvantage that the external function value of the adjacent levels is 0, thereby avoiding the loss of information. The ion variables are weighted, which effectively solves the phenomenon of an equal weight of ion variables in multi-objective decision-making by the grey situation decision-making method.
Footnotes
Declaration of conflicting interests
The author(s) declared no potential conflicts of interest with respect to the research, authorship, and/or publication of this article.
Funding
The author(s) disclosed receipt of the following financial support for the research, authorship, and/or publication of this article: This work was supported by the the Natural Science Foundation of Anhui Province, the State Key Laboratory of Mining Response and Disaster Prevention and Control in Deep Coal Mines (Anhui University of Science and Technology), (grant number 2008085QD191, SKLMRDPC19ZZ06).