
Abstract
This commentary addresses “Numerical investigation of the potential contamination of a shallow aquifer in producing coalbed methane” by Xianbo Su, Fengde Zhou, and Stephen Tyson. We think the models used in the simulations described in the paper are unrealistic, even as a conceptual worst case scenario. Concerns regarding how the results of these simulations are interpreted and portrayed, and in particular how they are related to previous works are discussed in detail. We believe the original paper uses language which could be misleading, and possibly alarmist, and we suggest references cited in the original paper may have been misinterpreted.
Introduction
Su et al. (2017) present the results of numerical simulations which were intended to represent or conceptually illustrate well integrity failure in a producing coal seam gas (CSG), or coalbed methane (CBM), well. We consider the simulations contrived and unlikely to represent any credible worst case reality. The conclusions presented (based on the results of these simulations) have potential to be misleading or even alarming to readers unfamiliar with CSG production. In our view, it is important to address this work in order to avoid misrepresenting well integrity issues in relation to CSG wells.
CSG well behaviour
Before commenting on specifics of the models created by Su et al., it is important to discuss differences between CSG and conventional gas production, which were not adequately explained in the original paper. These differences have important implications for well behaviour, which makes directly comparing well integrity issues in unconventional (e.g. CSG) and conventional wells challenging (and inappropriate in some cases) as evidenced in the discussion between Davies et al. (2015) and Thorogood and Younger (2015).
Unlike conventional reservoirs, the porosity of coals is generally low, and the majority of the gas occurs adsorbed on the coal. Production of CSG involves reducing the pressure of the coal seam (usually by producing water) to cause desorption of gas, which will diffuse through the coal matrix then flow through the fractures in the coal to the wellbore. The need to reduce the pressure in the coal to cause desorption means producing coals are under-pressured compared to nearby formations (i.e. significantly below normal hydrostatic pressure). If there is any permeable connection between a coal body and an overlying aquifer, this pressure difference means any viscous flow will be from the aquifer to the coal, rather than the opposite. This effect is even more significant near the well-bore, where the pressure at the well completion in the coal seam decreases to the flowing bottom-hole pressure of the well, causing viscous flow from around a producing well towards the wellbore, both from the coal, and from any connected aquifer if a permeable pathway (whether due to undetected well integrity issues or natural fractures) exists. This flow of water from the aquifer towards the wellbore is mentioned in references cited by Su et al. (see discussion on literature), and is actually identified by Su et al. who report significant volumes (11,000 m3 in 3600 days) of extra water produced in their models when a permeable annulus is added connecting the aquifer to the coal.
We note that this does not rule out well integrity failures in CSG wells (whether producing or abandoned) as a potential cause of aquifer contamination. It may be that buoyancy effects can lead to gas flow through pathways caused by well integrity failures, and we agree that numerical simulations may help to better understand this behaviour, but the models used in these simulations must represent a technically credible reality. We believe the models created by Su et al. cannot be considered to reasonably represent any realistic well integrity failure.
Well integrity models
The base case model described by Su et al. is a radial model of a single well, completed into a 10 m thick coal interval at a depth of either 530 m (according to the text) or 509 m (according to Table 3). A shallow aquifer with high permeability is located above the coal. These two zones are separated by an impermeable third interval representing a mudstone. This base case is modified to represent two potential well integrity failures described by Su et al. as “type A – leakage through cement sheath”, and “type B – impaired zonal isolation at the aquifer interval.”
The base case model was modified to represent a “type A” failure by adding a high permeability conduit around the well, which passes through the whole model from top to bottom. This high permeability annulus is stated to have a porosity of 1% and a vertical permeability of 100 D. In CMG’s GEM simulator (as used by Su et al.), the permeability value used for fracture cells in a dual porosity model is the effective permeability, and choice of 100 D (i.e. 100,000 mD) in these illustrative cases is not supported by literature or field evidence.
For comparison, the effective permeabilities of actual “leaky” wells determined by Tao et al. (2013) are shown in Figure 1. These permeabilities are typically in the range of 0.01–10 mD, with the highest values around 1 D, or 1% of the value used by Su et al. in their model.
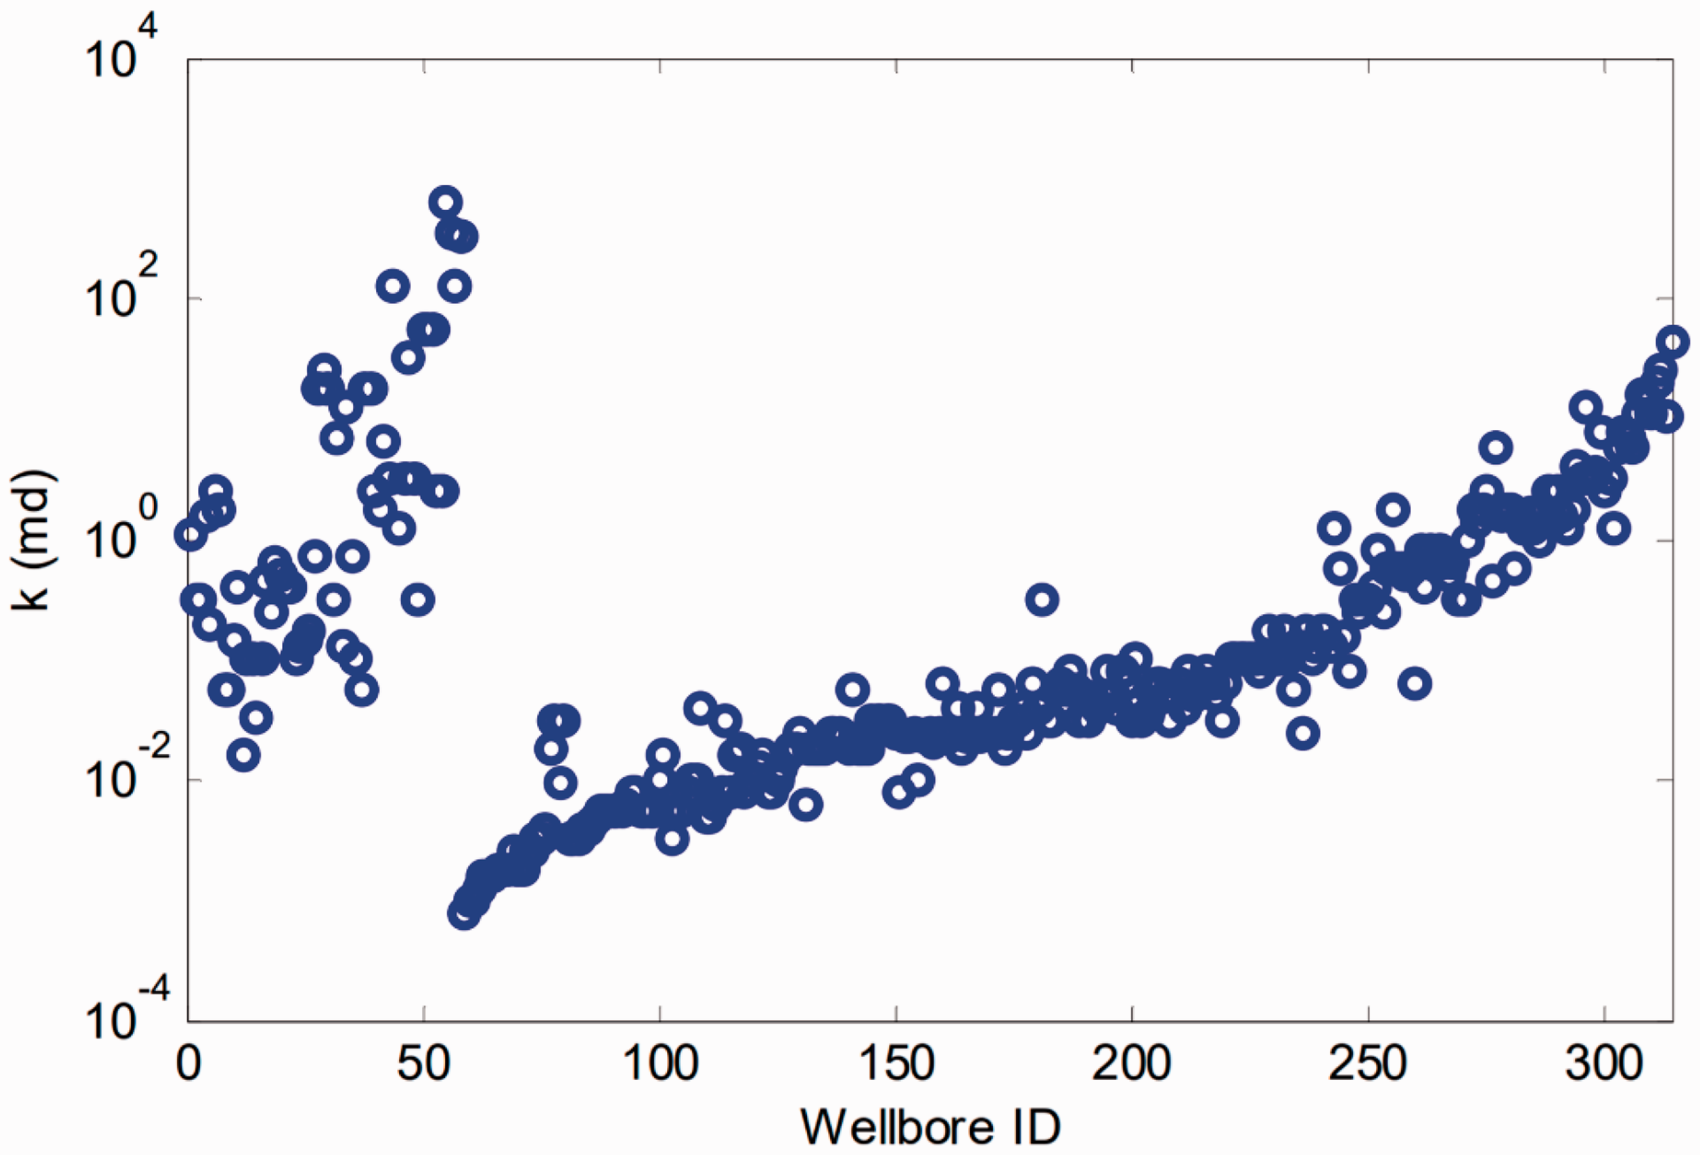
Effective permeabilities of actual “leaky” wells from Tao et al. (2013). Note the logarithmic scale, and that the maximum value on the scale is 10 D. 100 D (as used in the models created by Su et al.) would sit outside the plot area.
100 D is described by Gasda et al. (2013) as the maximum bound of permeability calculated from vertical interference tests in a hypothetical worst case scenario, representing “a well with no integrity or ability to prevent flow through the annular region”. While it may be possible for short sections of cement to have failed significantly enough to indicate a permeability 100 D, it is practically inconceivable that a >300 m section of a wellbore which follows a modern well construction standard, or code of practice (such as DNRM, 2017) could have such high permeability throughout. By using such a high permeability, Su et al. are likely to have significantly overestimated the effects of a well integrity failure of this type.
The “type B” failure is modelled as a perforation into the permeable aquifer layer. The exact hypothesis behind this leak is not clear, nor are the parameters applied in modelling it. It is important to understand the circumstances which are associated with specific failure modes, as accurately modelling such a failure would likely necessitate more significant alterations to the model than simply adding perforations. For example, it could be that the scenario is intended to represent shallow casing corrosion, caused by hypothetical shallow water “flow”. To maintain an air of reasonableness, this scenario would require (i) to be some years into the field life when coal seam pressures are very low; (ii) involve a high permeability, fresh aquifer with a known head gradient distribution; and, (iii) incorporate an extensive formation damaged zone where the initial cement would have invaded the aquifer, which might be modelled as a high skin factor.
The models described by Su et al. include well integrity failure from first production. This seems an unlikely scenario. In wells, completed open hole (as are the majority of CSG wells in Queensland) wells are pressure tested to confirm the integrity of the cement at the casing shoe post cementing. In Queensland, this is stipulated in the “Code of Practice for the construction and abandonment of coal seam gas wells and associated bores in Queensland” DNRM (2017). Wells failing the cement integrity test must be notified and must be remediated. A report prepared by one of the authors for the Queensland Gasfield commission (QGFC, 2015) found a notification rate of just 0.3% of wells, all of which were remediated. In that same report, based on several thousand wells, the relevant regulator reported that “no leaks have been reported to date for subsurface equipment” (QGFC, 2015: 10). An independent detailed detection survey, albeit of just 43 wells, found “…no evidence of leakage of methane around the outside of well casings…” (Day et al., 2014: 2).
It would, therefore, seem more conceptually reasonable and better illustrative to create a model representing the case where a higher permeability conduit forms after a certain period of production.
Simulation results and interpretation
The simulation results presented in Su et al., showed a slight increase in gas production, and a significant increase in water production (an additional 11,000 m3 in 3600 days) when a “type A” (cement sheath) failure was included in the model. The increased water production is not surprising (see earlier section on CSG well behaviour), and represents the flow of “higher quality water into neighbouring coal measures as water flows from high to low pressure” described by the CSIRO (2012).
The results of the simulations featuring the “type B” connection appear interesting, but are not discussed in depth. Su et al. simply point out that this model yields lower gas and water production, but do not comment on the changes of production rates, and in particular the large spike in gas production seen at around 2000 days (Su et al., 2017, Figure 11). It would seem necessary to determine what is causing this behaviour in the model.
Su et al. then calculate methane concentrations in the top grid layer of their model after 3600 days of simulated production. The calculated methane concentrations are then compared to an “Immediate Action” limit of 28 mg/L, which is the solubility of methane in water at atmospheric pressure and 15°C, although higher concentrations of methane in water can occur depending on temperature or pressure (Eltschlager et al., 2001). Su et al. report methane concentrations of 10,000 mg/L, which would appear to indicate that there is free gas present (i.e. not in solution). It is unclear what the actual concentration of methane in solution would be under these conditions, or how this would compare to the limits specified by the U.S. Department of the Interior (Eltschlager et al., 2001). It is also important to note that these values are based on the top layer of the grid only (where free gas would accumulate due to buoyancy), and may not be representative of the concentrations in the other aquifer layers.
The calculated methane concentration are presented in a plot (Su et al., 2017, Figure 12(a)) alongside a figure showing methane concentrations at various distances from gas wells as reported by Osborn et al. (2011).
There are several issues with the figure presented by Su et al. (shown with the original plot from Osborn et al. in Figure 2):
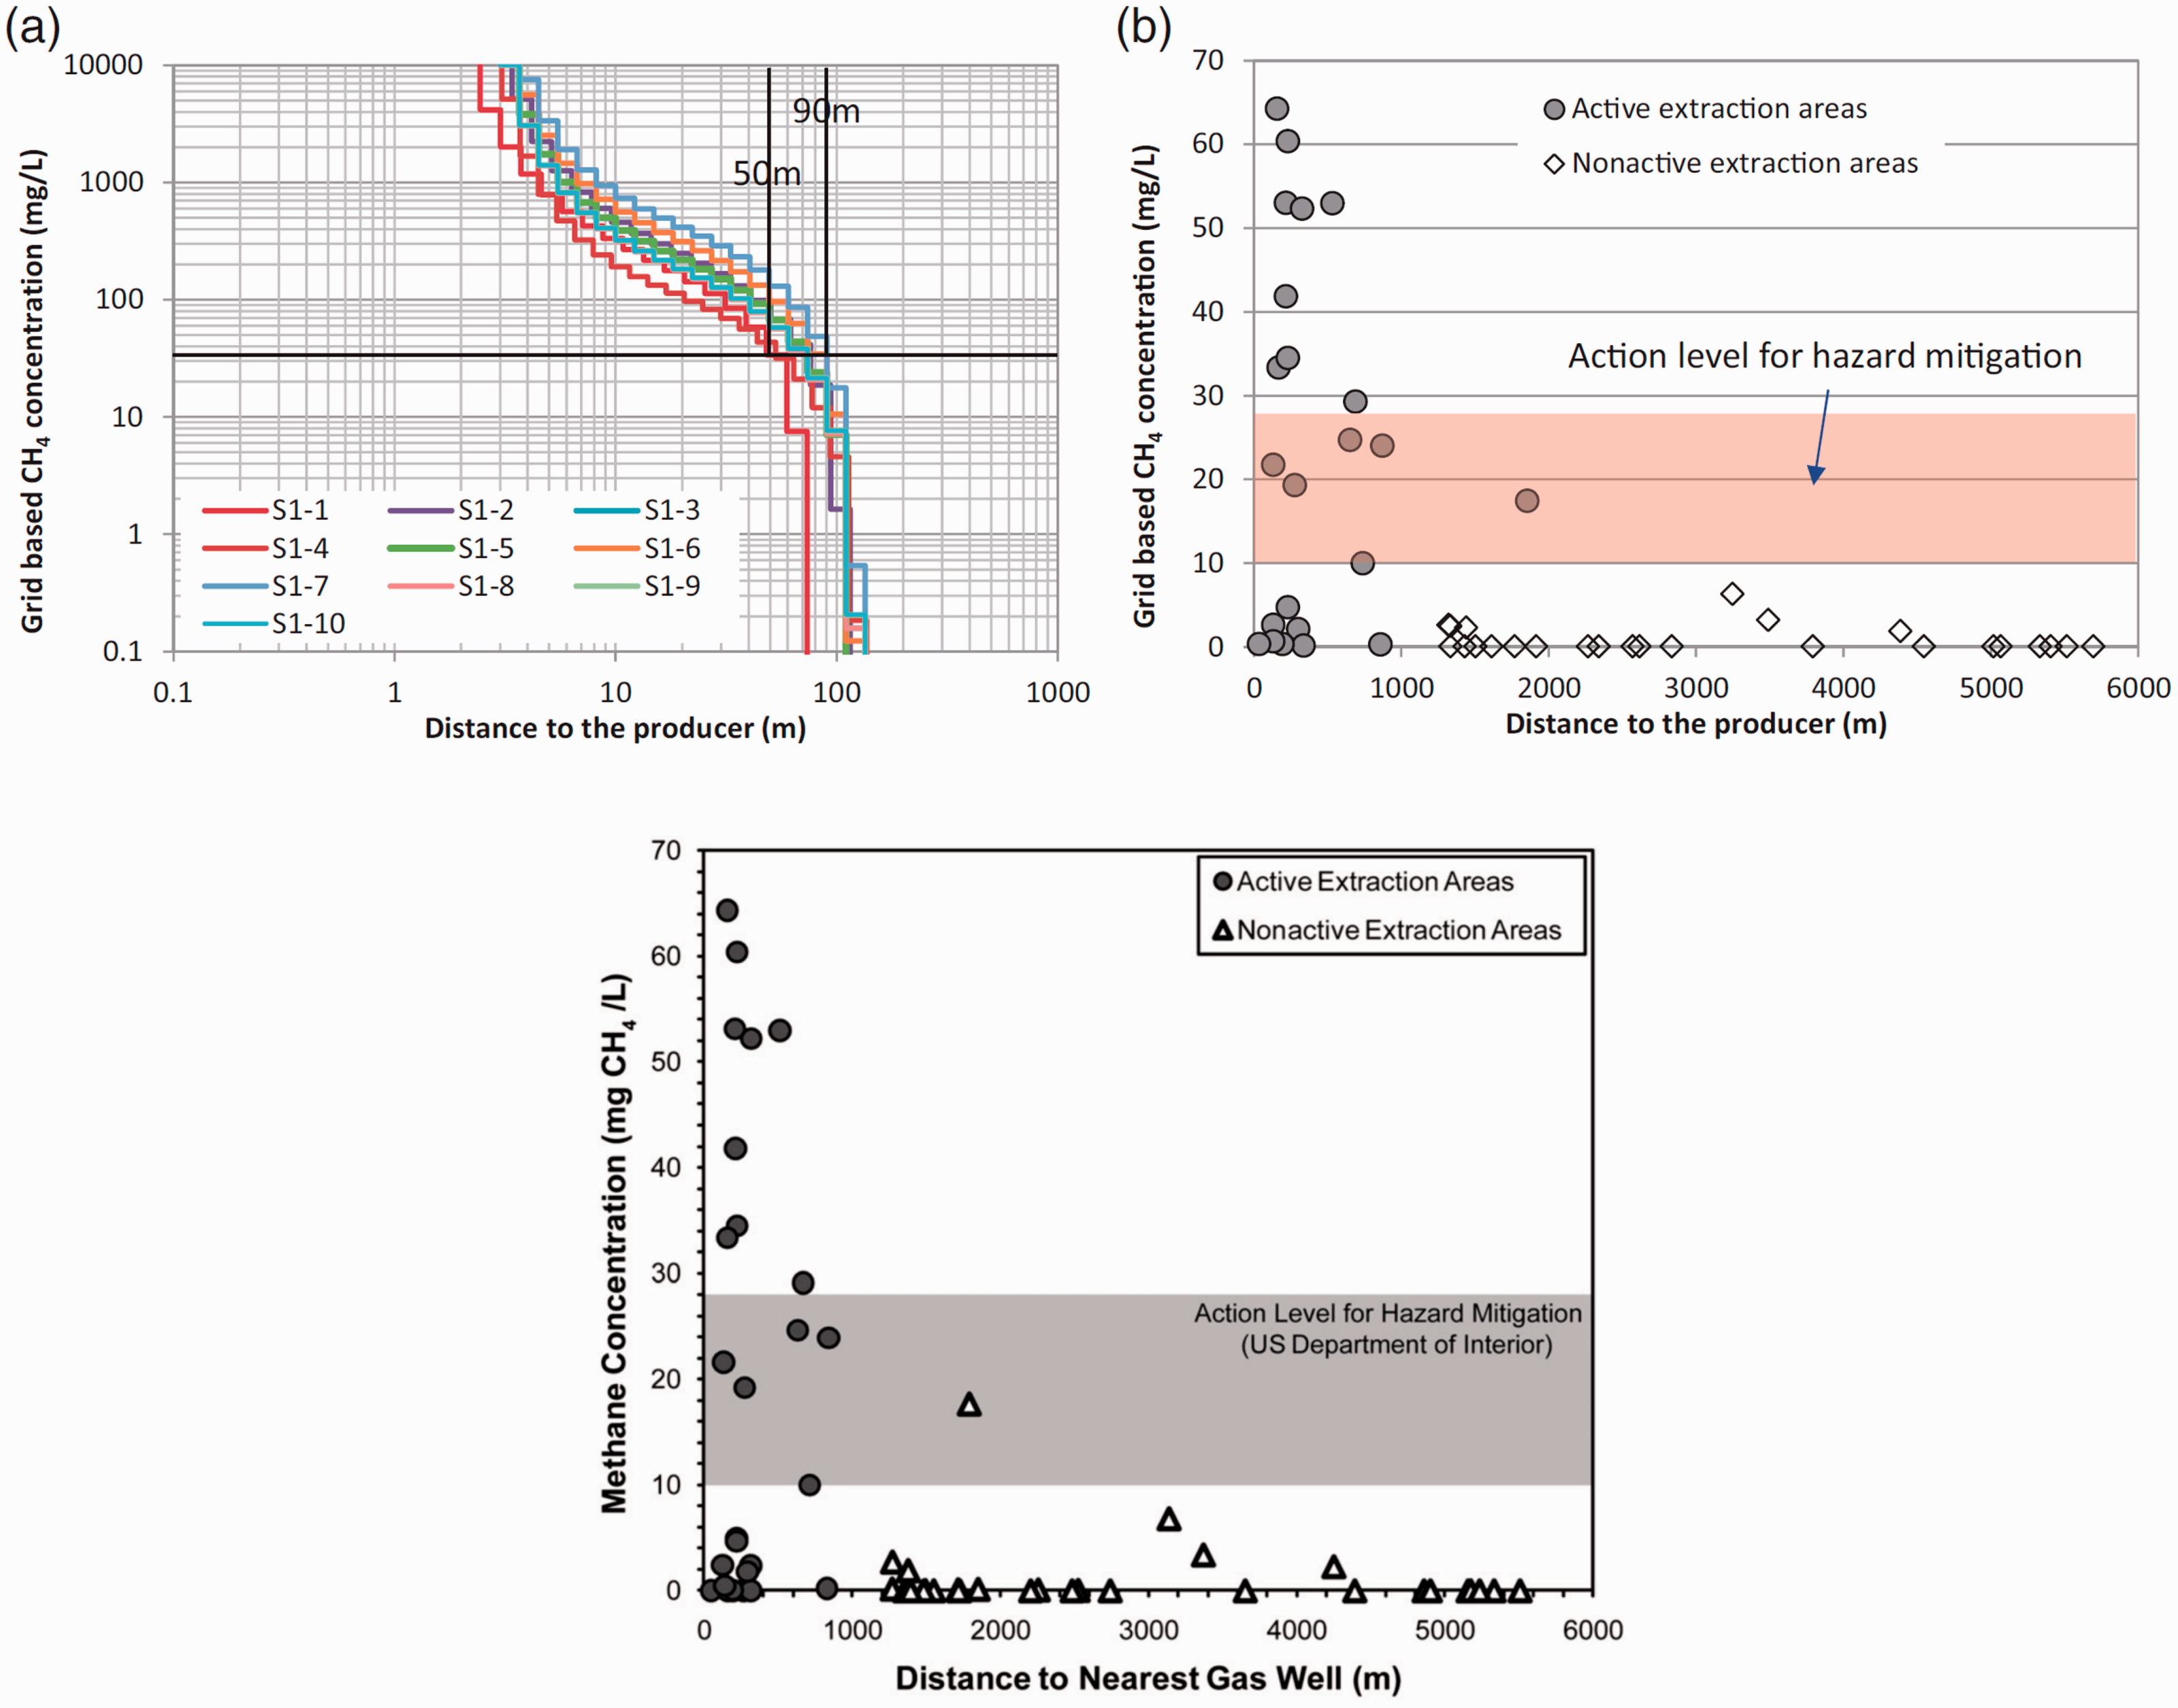
Figure 12 from Su et al. (2017) (top), and Figure 3 from Osborn et al. (2011) (bottom). Figure 12(b) is based on the original figure from Osborn et al. but note the changed axes labels, and the alteration of the data point at approximately 1800 m and 18 mg/L from “nonactive” to “active”.
Both y-axes are labeled as “Grid based CH4 concentration (mg/L)” despite the fact that the values from Osborn et al. are real methane concentrations as measured in samples from water wells. Calling these values “grid based” gives the impression that they are analogous to the simulation results, when they are clearly not.
Both x-axes are labeled as “Distance to the producer (m)”, whereas the original figure from Osborn et al. has the axis labeled as “Distance to Nearest Gas Well (m)”, and makes no mention of production. Osborn et al. actually identified points in the original figure as “from active (closed circles) and nonactive (open triangles)
The point at a distance of 1800 m indicating elevated methane concentration (approximately 18 mg/L) in part (b) has been labelled in Su et al. as from an “active extraction area”. In the original Osborn et al. figure, this point was considered to be from a “nonactive extraction area”. “Nonactive” was defined by the original authors as >1 km from a gas well, and it is unclear why Su et al. have changed the labelling of this particular point.
The horizontal line in part (a) of the figure is presumably meant to indicate the “Immediate Action” limit of 28 mg/L specified by the U.S. Department of the Interior (Eltschlager et al., 2001). The line shown is actually somewhere between 30 mg/L and 40 mg/L.
Aside from the issues with the presentation of the data, it is also important to point out that Su et al.’s values are grid block methane concentrations based on simulations of a single CSG well, producing from coals 50 to 500 m below an aquifer, whereas Osborn et al. present real methane concentrations in samples from water wells in regions where shale gas is produced from 900 to 1800 m below the aquifers sampled. This comparison is described by Su et al. as “very rough” and this seems an optimistic assessment, the two situations are not analogous.
Su et al. make the statement that “the safe radius should be greater than 90m for case No. S1–10 while it is about 50m for case No. S1–1” and “Osborn et al. (2011) reported that the safe radius away from the wellbore is about 500 m which is longer than the results from this study.” We suggest these statements are poorly worded, and have potential to mislead, and possibly alarm, some readers. While Osborn et al. did report elevated methane levels in areas around wells, they did not mention a “safe radius”, and it is unclear where the value of 500 m comes from. It is also unclear how “safe” and “unsafe” are defined. It seems the authors are actually reporting that this is the radius at which cells in the top grid layer of their model have calculated methane concentrations higher than the immediate action limit, although it seems unlikely that this “safe radius” has any meaning relative to a real CSG well.
In the models presented in the paper, gas was only present in the aquifer when a “type A” (cement sheath) connection was present. No gas contamination was simulated using the model with the “type B” connection, but Su et al., state that “if the well is abandoned, the gas in the wellbore may invade into the aquifer by the gravity and the density difference between gas and water.” This statement demonstrates a serious lack of understanding of the well abandonment process. Wells are abandoned by isolating the gas bearing zones, aquifers, and/or permeable zones of different pressure regimes or salinity with cement which is then tested (in Queensland with both mechanical and pressure tests) to confirm its integrity. This means the wellbore is left filled with a combination of cement plugs and high density fluids. Furthermore, the return to hydrostatic pressure of CSG reservoirs effectively kills the well leaving little prospect of continued gas production, unless there is a further episode of draw down. The exact regulations for abandonment may vary between countries (or states), but wells are not abandoned with gas in the wellbore. This means there is virtually no likelihood of gas which is present in the wellbore when it is abandoned migrating into an aquifer as suggested by Su et al.
Interpretation of literature
Su et al. cite a number of other works in their paper, but we suggest some of these works have been misinterpreted.
For example, in their introduction, Su et al. state that “There are environmental concerns related to the potential contamination of shallow aquifers caused by CBM production from well integrity failure”, citing work by Cheung et al. (2010), CSIRO (2012) and Williams et al. (2012). While the cited papers and reports do discuss potential impacts of CSG production on aquifers, it seems important to comment on some of the specifics of these references in relation to the work by Su et al.
The reports from the CSIRO (2012), Prosser et al. (2011) 1 and Williams et al. (2012) do mention aquifer contamination as a risk related to CSG operations, but suggest that the most significant risk of contamination is related spillages on surface during hydraulic fracturing operations. The risk of aquifer contamination due to gas migration from producing wells is considered low due to the depressurisation of the coal required for CSG production: “Water extraction from coal seams makes cross contamination of aquifers unlikely; most of the inter-aquifer transfer will be of higher quality water into neighbouring coal measures as water flows from high to low pressure” (CSIRO, 2012).
Su et al. also state that “Cheung et al. (2010) reported leakages of methane from coal seams into shallow groundwater wells in Alberta, Canada, by analysing the major ion and isotope geochemistry.” This statement appears to be inaccurate. Cheung et al. (2010) were attempting to identify geochemical parameters which could potentially be used to identify leakage of fluids into shallow aquifers, but did not report leakages in Alberta. They did find methane in groundwater samples, but state that “the CH4 in the shallow groundwater is not connected to CBM activity” and even refer to “the hypothetical case that leakage of fluids and gases from CBM operations occurs.”
While the study itself could imply that aquifer contamination is an environmental concern relating to CSG production, they make no mention of well integrity failures in producing wells as the mechanism for this contamination. In fact, the paper cited by Cheung et al., as an example of “leakage of produced gases into shallow aquifers” in CSG producing areas suggests the leakage was not through wells targeting the coal seams, but instead through conventional wells which passed through the coal seams on route to deeper targets. These conventional gas wells had reportedly not been cemented across the coals, and when the coals were depressurised by nearby CSG wells, gas was desorbed and migrated through the casing/openhole annulus in the conventional wells (Beckstrom and Boyer, 1993). This meant the leakage was associated with the producing CSG wells, but the leakage pathway was not due to integrity failures in those wells, and nothing like the scenarios discussed by Su et al.
Concluding remarks
With the high number of wells required for CSG projects, well integrity issues must be understood in order to protect aquifers from both contamination and depletion. It is important to remain vigilant in appropriately representing any risks associated with these extremely sensitive topics, and particular care must be taken when using terms such as “safe radius”.
We are of the opinion numerical simulations can be useful in helping to understand how aquifers are affected by the presence of CSG wells, whether producing or abandoned, but these simulations must represent a technically credible scenario. If numerical models are used for worst case consequence analysis, these must be credible worst cases, and to inform risk they must also be set in the context of how likely these might be.
Su et al. state that their work is “a conceptual study to address the consequence if there is a well integrity issue”.
We are concerned at potentially misleading use of literature, and we suggest that there is not enough emphasis in the original paper on just how conceptual (i.e. unrealistic) the models in the study are.
Footnotes
Declaration of conflicting interests
The author(s) declared no potential conflicts of interest with respect to the research, authorship, and/or publication of this article.
Funding
The author(s) disclosed receipt of the following financial support for the research, authorship, and/or publication of this article: This research has been completed with funding and support from Energi Simulation, and the UQ Centre for Coal Seam Gas and its industry members (Arrow Energy, APLNG, Santos and Shell/QGC).