
Abstract
This study, based on a case from the 1314 working face of Xiaoyun Coal Mine, provides an in-depth analysis of the stress and velocity field characteristics of waterproof coal pillars under different porosities during water inrush events. The research emphasizes the significant impact of water inrush on the stress field distribution of coal pillars. Simulation results, validated by field data, reveal that the highest stress concentration occurs on the side of the coal pillar adjacent to the goaf, with the stress distribution under water inundation conditions exhibiting greater irregularity. The findings not only enhance the understanding of stress variations in coal pillars during water inrush events but also offer valuable insights for coal pillar design and monitoring strategies. This research provides critical theoretical support and technical guidance for the safe design and dynamic monitoring of water inrush disaster prevention in coal mines.
Keywords
Introduction
Before coal mining, detailed geological surveys and pretreatment of potential water hazards are essential (Hu et al., 2019, Zhang et al., 2023c). While water accumulation in old goafs and groundwater inrush is well-managed, detection errors in complex mining areas may lead to unexpected water inrush from concealed collapse columns or activated aquifer layers due to stress fractures. Mining disturbances can also reactivate groundwater, creating drainage pathways that trigger water inrush accidents (Xue et al., 2020). Scholars have focused on water–coal interactions in complex conditions to guide safe production and improve coal utilization. Zhao et al. (2020b) studied karst water inrush using a nonlinear seepage–pipeline flow model. Liu et al. (2023) analyzed waterproof coal pillar failure during shaft construction. Li et al. (2023b) examined the physical and mechanical properties of gravel aquifer overlying strata. Wang et al. (2024a) proposed a strip-filling method to prevent floor water inrush, while Gai et al. (2024) introduced automatic entry mining to reduce floor damage and examined failure characteristics above confined water. Most studies use fluid–solid coupling methods to trace water inrush and propose safe coal pillar widths, but research on the mechanical properties of coal pillars under water inrush remains limited.
Research on coal pillar stability under water pressure has mainly focused on the water immersion characteristics and mechanical properties of coal pillar dams. At the microscopic level, Yao et al. investigated coal's mechanical properties and crack propagation (Yao et al., 2016, Yao et al., 2020, Yao et al., 2023, Yu et al., 2022), analyzing the relationship between stiffness, stress, and acoustic emissions to understand the effects of water on coal's mechanical performance. Luo et al. (2024) studied how hydrodynamics impact the microstructure and permeability of fractured coal. Wang et al. (2022) developed a statistical model to account for moisture content's influence on coal samples through uniaxial compression tests. Zhao et al. (2022) examined the effects of wetting-drying cycles on coal's mechanical properties, and Li et al. (2023a) analyzed the evolution of these cycles in coal pillar dams under natural conditions.
At the macroscopic scale, Gu et al. (2024) employed numerical simulations to analyze the development of water-conducting fracture zones in the overburden of coal pillars. Lai et al. (2024) derived the critical size of inclined waterproof coal pillars. Zhang et al. (2022) simulated the sealing performance of coal pillar dams in the Shenhua Dong area. Chen et al. (2023) proposed a theoretical formula for determining the optimal width of coal pillar dams. Wang et al. (2023) developed a seepage mechanics model for coal pillar dams. Wang et al. (2021a) investigated the seepage behavior in the goaf area. Qin (2022) examined the hydraulic connectivity and seepage patterns between goaf clusters. There are numerous additional studies in this field that are not addressed here.
At the same time, many researchers have studied water immersion or water inrush under complex geological conditions, with a focus on fault or collapse column activation, as well as water-conducting fracture zones. Zhao et al. (2020a) analyzed the impact of mining-induced stress on the porosity and water pressure distribution in the floor strata. Wu et al. (2019) investigated the seepage mechanism of sandstone in fault zones, and Shao et al. (2022) predicted the risk of water inrush from faults. Although these studies do not directly address the coal pillars in inundated sections, they provide important references for coal pillar size design and the application of fluid–solid coupling methods.
In summary, current research mainly focuses on water inrush prevention, mechanical changes in water-immersed coal pillars, and fault activation leading to water inrush. However, studies on coal weakening due to water inrush and the variation of internal stress in waterproof coal pillars remain limited (Wang et al., 2024b, Zhang et al., 2023b). This study integrates existing research to simulate the impact of water inrush on coal pillars using a three-field coupling model based on Darcy–Brinkman–Navier–Stokes equations. A seepage–stress coupling analysis is conducted to examine stress variations within the coal pillars during mining, identify hazardous zones, and develop preventive measures to ensure safe production and minimize resource waste. This research provides crucial theoretical support and technical guidance for the safe design and dynamic monitoring of water inrush disaster prevention in coal mines.
Engineering background
In this paper, the coal pillar in the 1314 working face of the Xiaoyun Coal Mine affected by water inrush is taken as the research background. The Xiaoyun Coal Mine is located in Jining City, Shandong, China. The 1314 working face elevation is −555.9 m to −665.5 m. The north of the working face is the 1312 goaf, the south is the village protection coal pillar, the west is the 1314 belt trough contact lane, and the east is the mining area boundary coal pillar. The strike length of the working face is 955 m, the dip length is 219 m, the average coal thickness is 3.9 m, the average dip angle is 15°, and the coal seam structure is relatively simple. Figure 1 shows a basic overview of the 1314 working face.
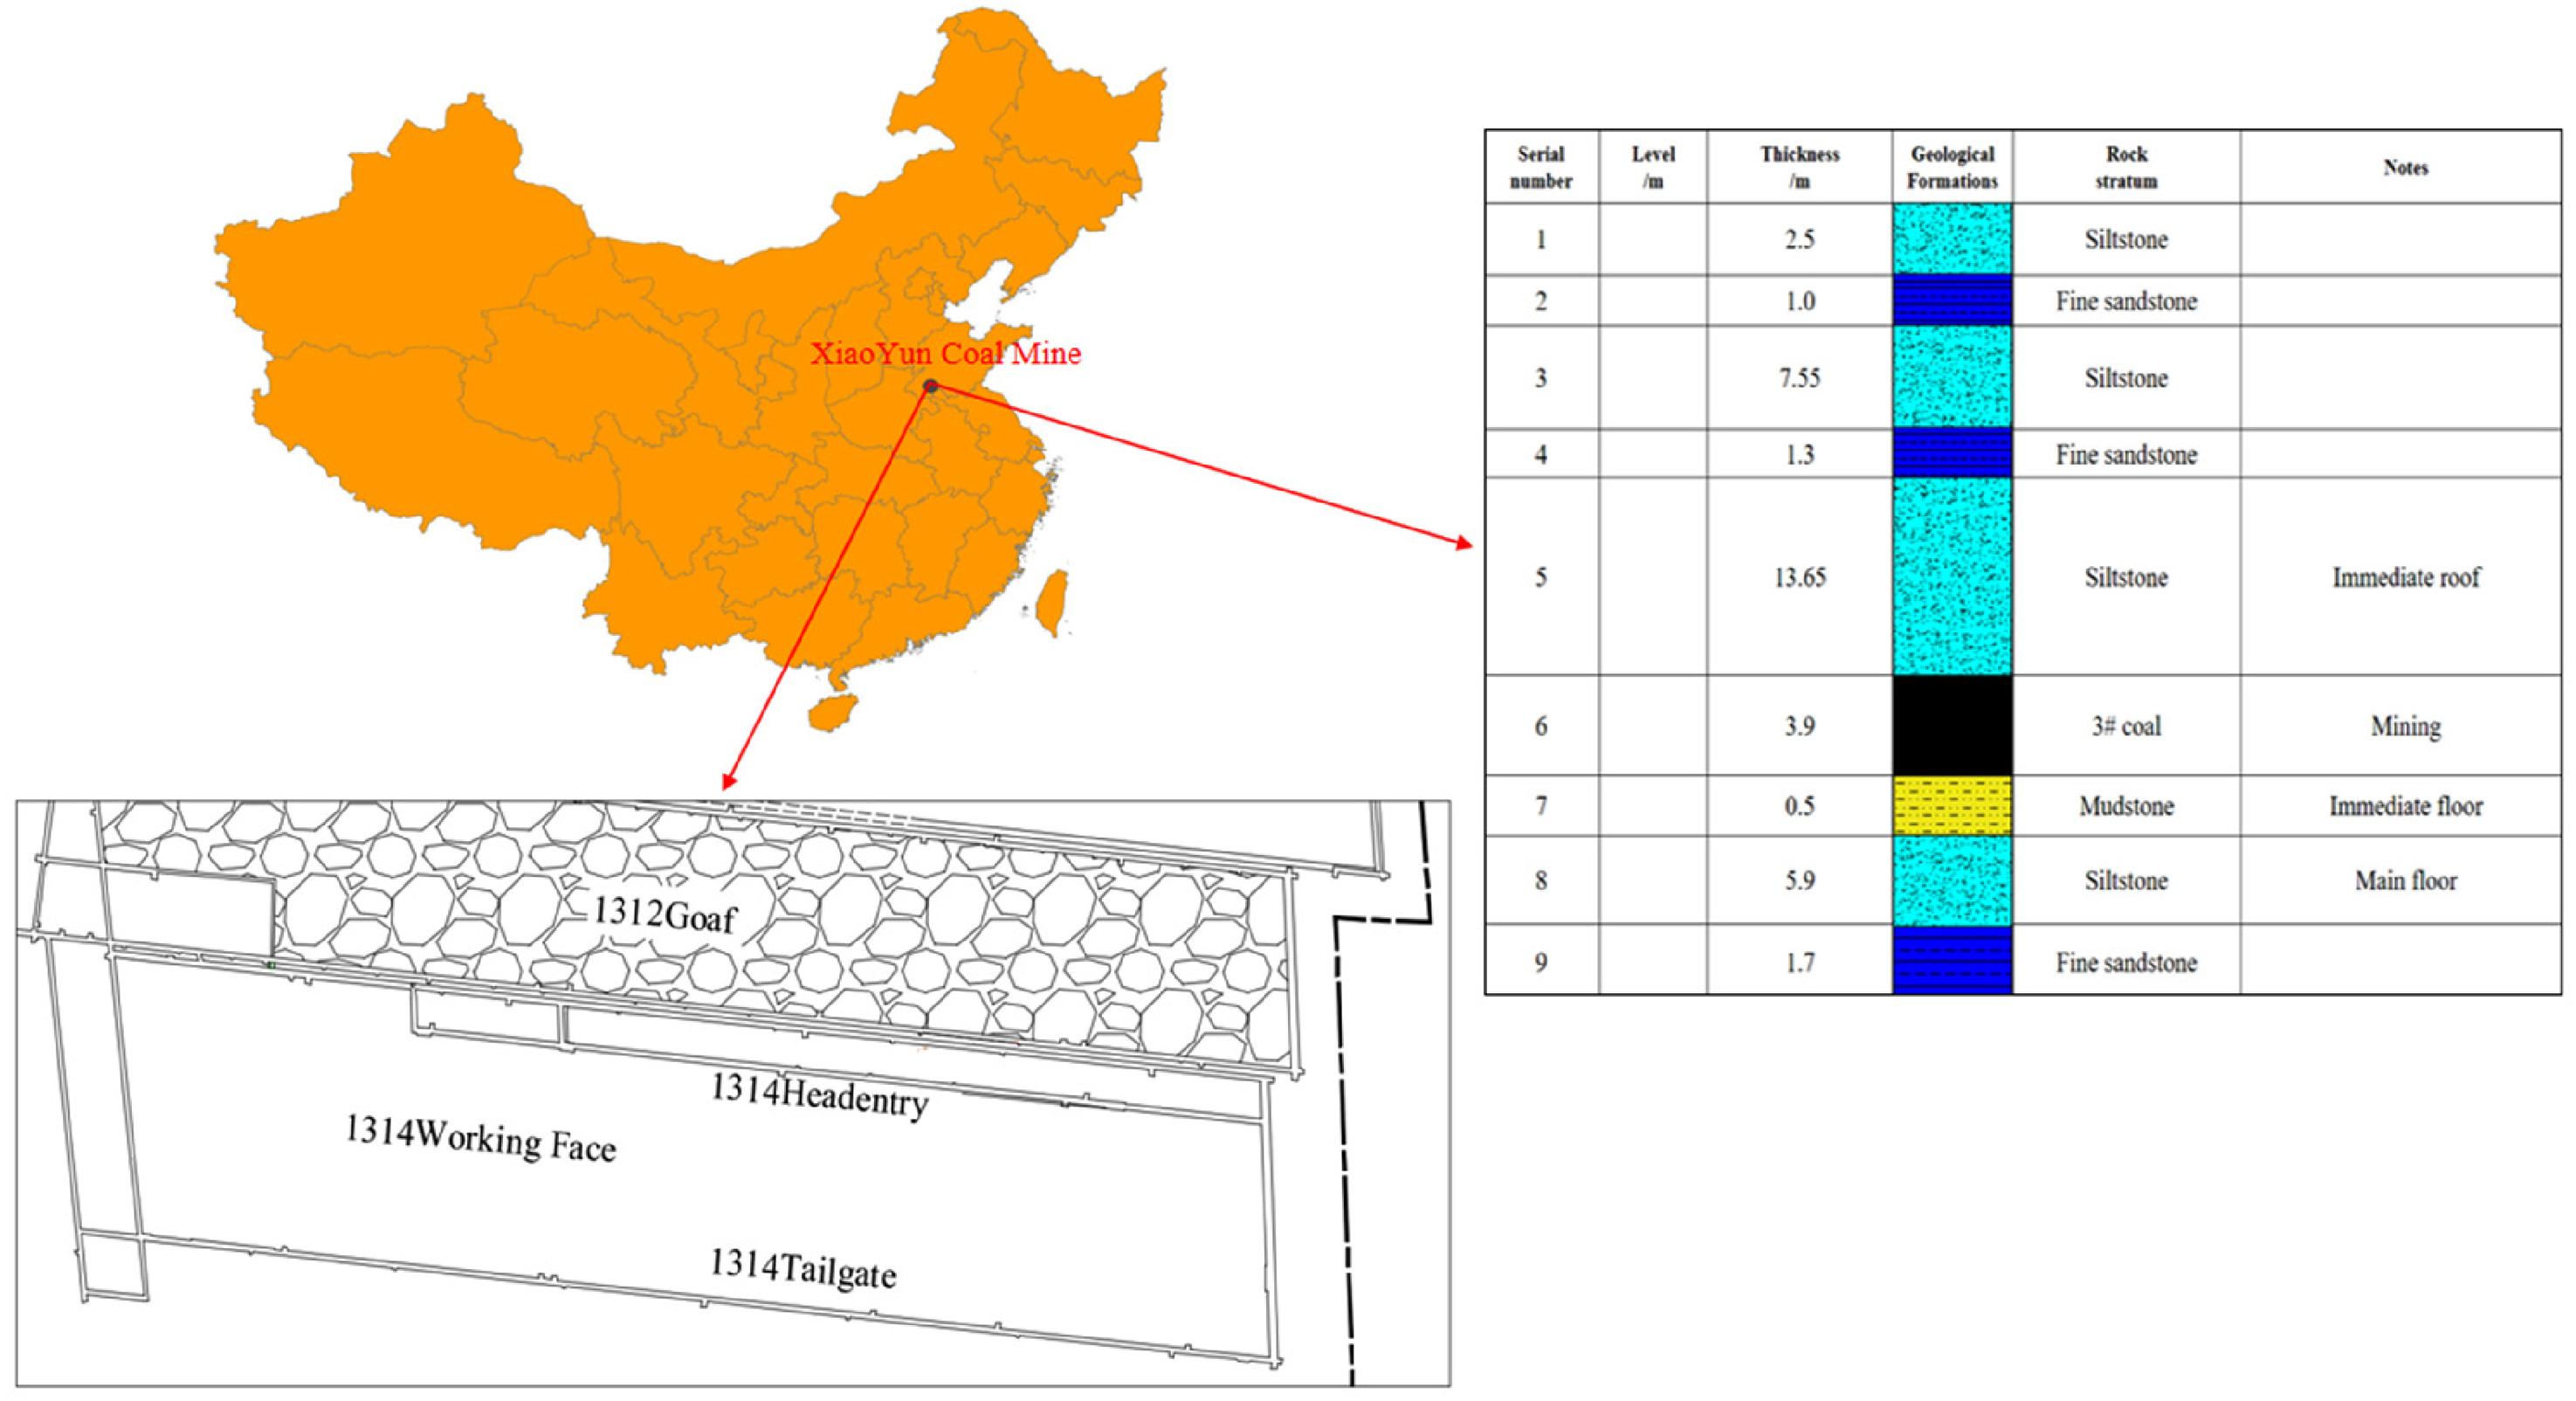
Basic overview of the 1314 working face.
The Xiaoyun Coal Mine began to experience slight water seepage at the 1313 working face on 10 September 2018, and within a few hours, the water inflow increased to 40–50 m³/h. Due to the lack of effective remedial measures, the water inflow increased to 900 m³/h at 14:00 on the 11th, and the estimated water inflow was approximately 3673 m³/h at 10:00 on the 13th. Finally, the central pump house of the mine was lost, and water inrush and flooding accidents occurred in the Xiaoyun Coal Mine. On September 11, domestic water prevention and control experts determined that the water inrush source was Ordovician gray water through the characteristics of water quality, water level, water temperature, etc., and determined that the water inrush channel of the 1313 working face was a hidden collapse column. The reason for the water inrush was that the 1313 working face was affected by the hidden collapse column in the case of more than 200 m of effective water barrier layer and suddenly delayed water inrush under the joint action of mineral pressure and water pressure, as shown in Figure 2.
A review shows a gap in research on coal pillar design for remining under high-pressure water conditions. At the 1314 working face, conservative pillar sizing and exploratory tunnels were used to address complex goaf conditions, though they increased costs and resource waste. Based on a three-field coupling simulation, this research offers insights into internal pressure variations, supporting the safer design of waterproof coal pillars in water-prone mines.
Mechanical test for coal pillar
The mechanical behavior of coal and rock masses can vary significantly under different stress, temperature, and hydrological conditions, leading to strong anisotropy in their properties across different regions. Testing the mechanical response of coal and rock masses under simulated conditions provides more accurate data, ensuring the feasibility and safety of engineering designs and offering essential baseline data for numerical simulations. This improves the assessment of field conditions and enhances mine safety. In this study, field sampling and testing of the mechanical properties of coal and rock masses were conducted in the 1314 coal pillar area. The sample sizes are 50 mm × 50 mm × 100 mm and Φ50 mm × 25 mm for the standard coal sample. Figure 3 shows the results of the mechanical parameter testing of the coal. The mechanical property data of the coal samples determined in the laboratory are shown in Table 1.
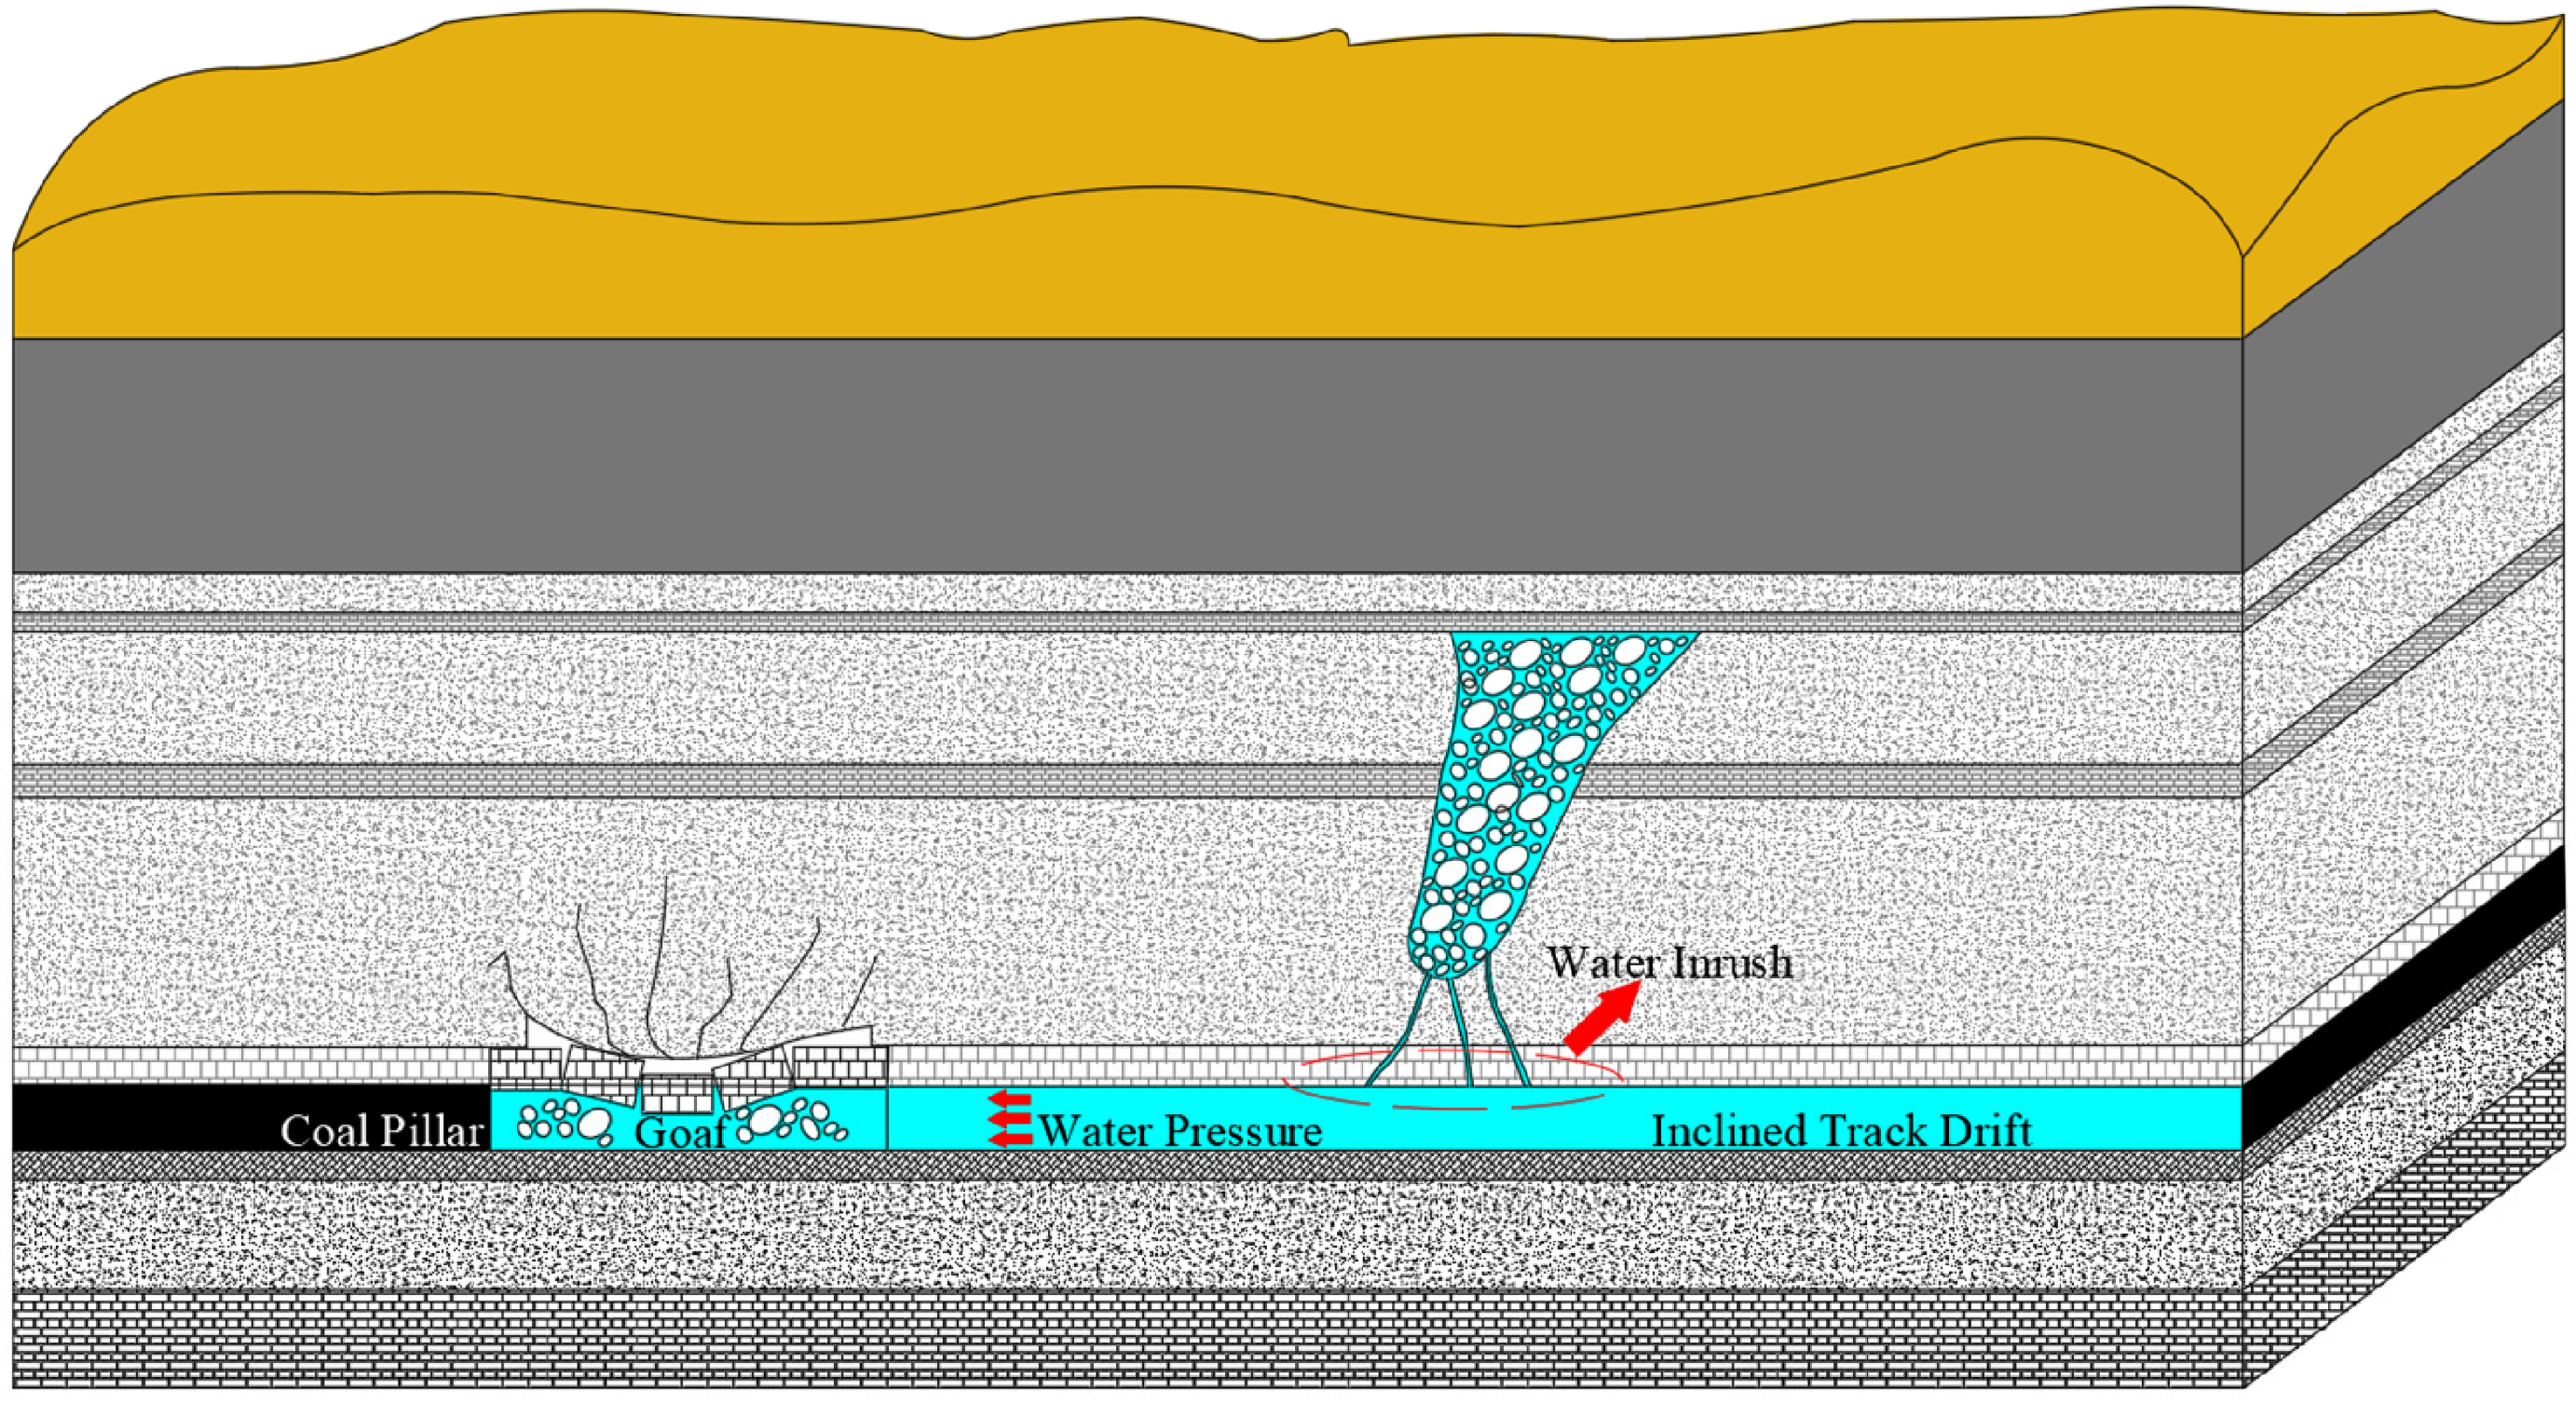
Schematic diagram of water inrush in Xiaoyun coal mine.
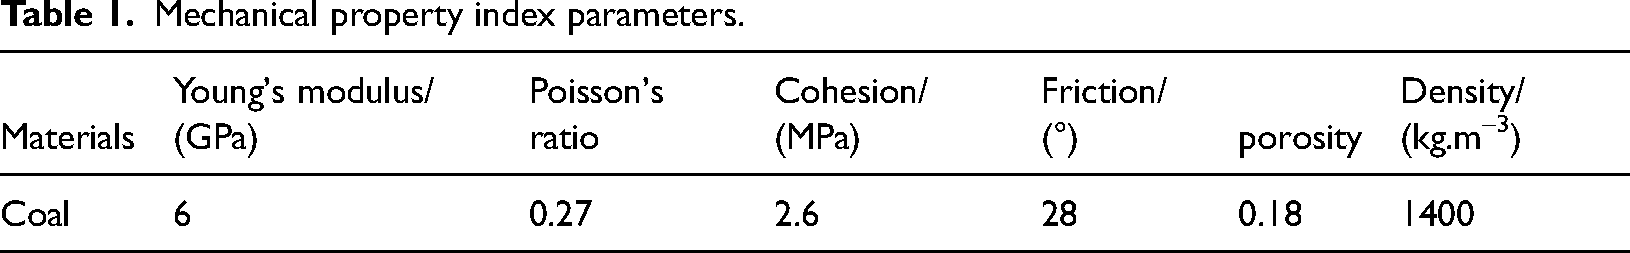
Mechanical property index parameters.
Effect of water inrush on coal pillar
Before simulation, the coal pillar is divided into an inelastic core zone (failure and plastic zones) and an elastic core zone (Chen et al., 2023, Gu et al., 2024, Vlase et al., 2017). Due to the small width of the failure zone, it is treated alongside the plastic zone as the inelastic zone. Despite differences in porosity and mechanical properties, this simplification has minimal impact on water immersion studies in large coal columns. The inelastic core zone is modeled as a porous medium, while the elastic core zone is treated as an elastic medium. Water inrush simulations focus on the coal pillar's response within a three-field coupling framework. Figure 4 illustrates the stress state of the coal in the goaf, with x representing the combined width of the inelastic and elastic zones. Simulation results are validated by calculating the width of the inelastic zone after mining the 1312 working face and obtaining the stress distribution on the coal wall side. Many references exist on calculating the inelastic zone of coal, with the limit equilibrium method (Qian et al., 2010) used to determine the range of region x as follows:
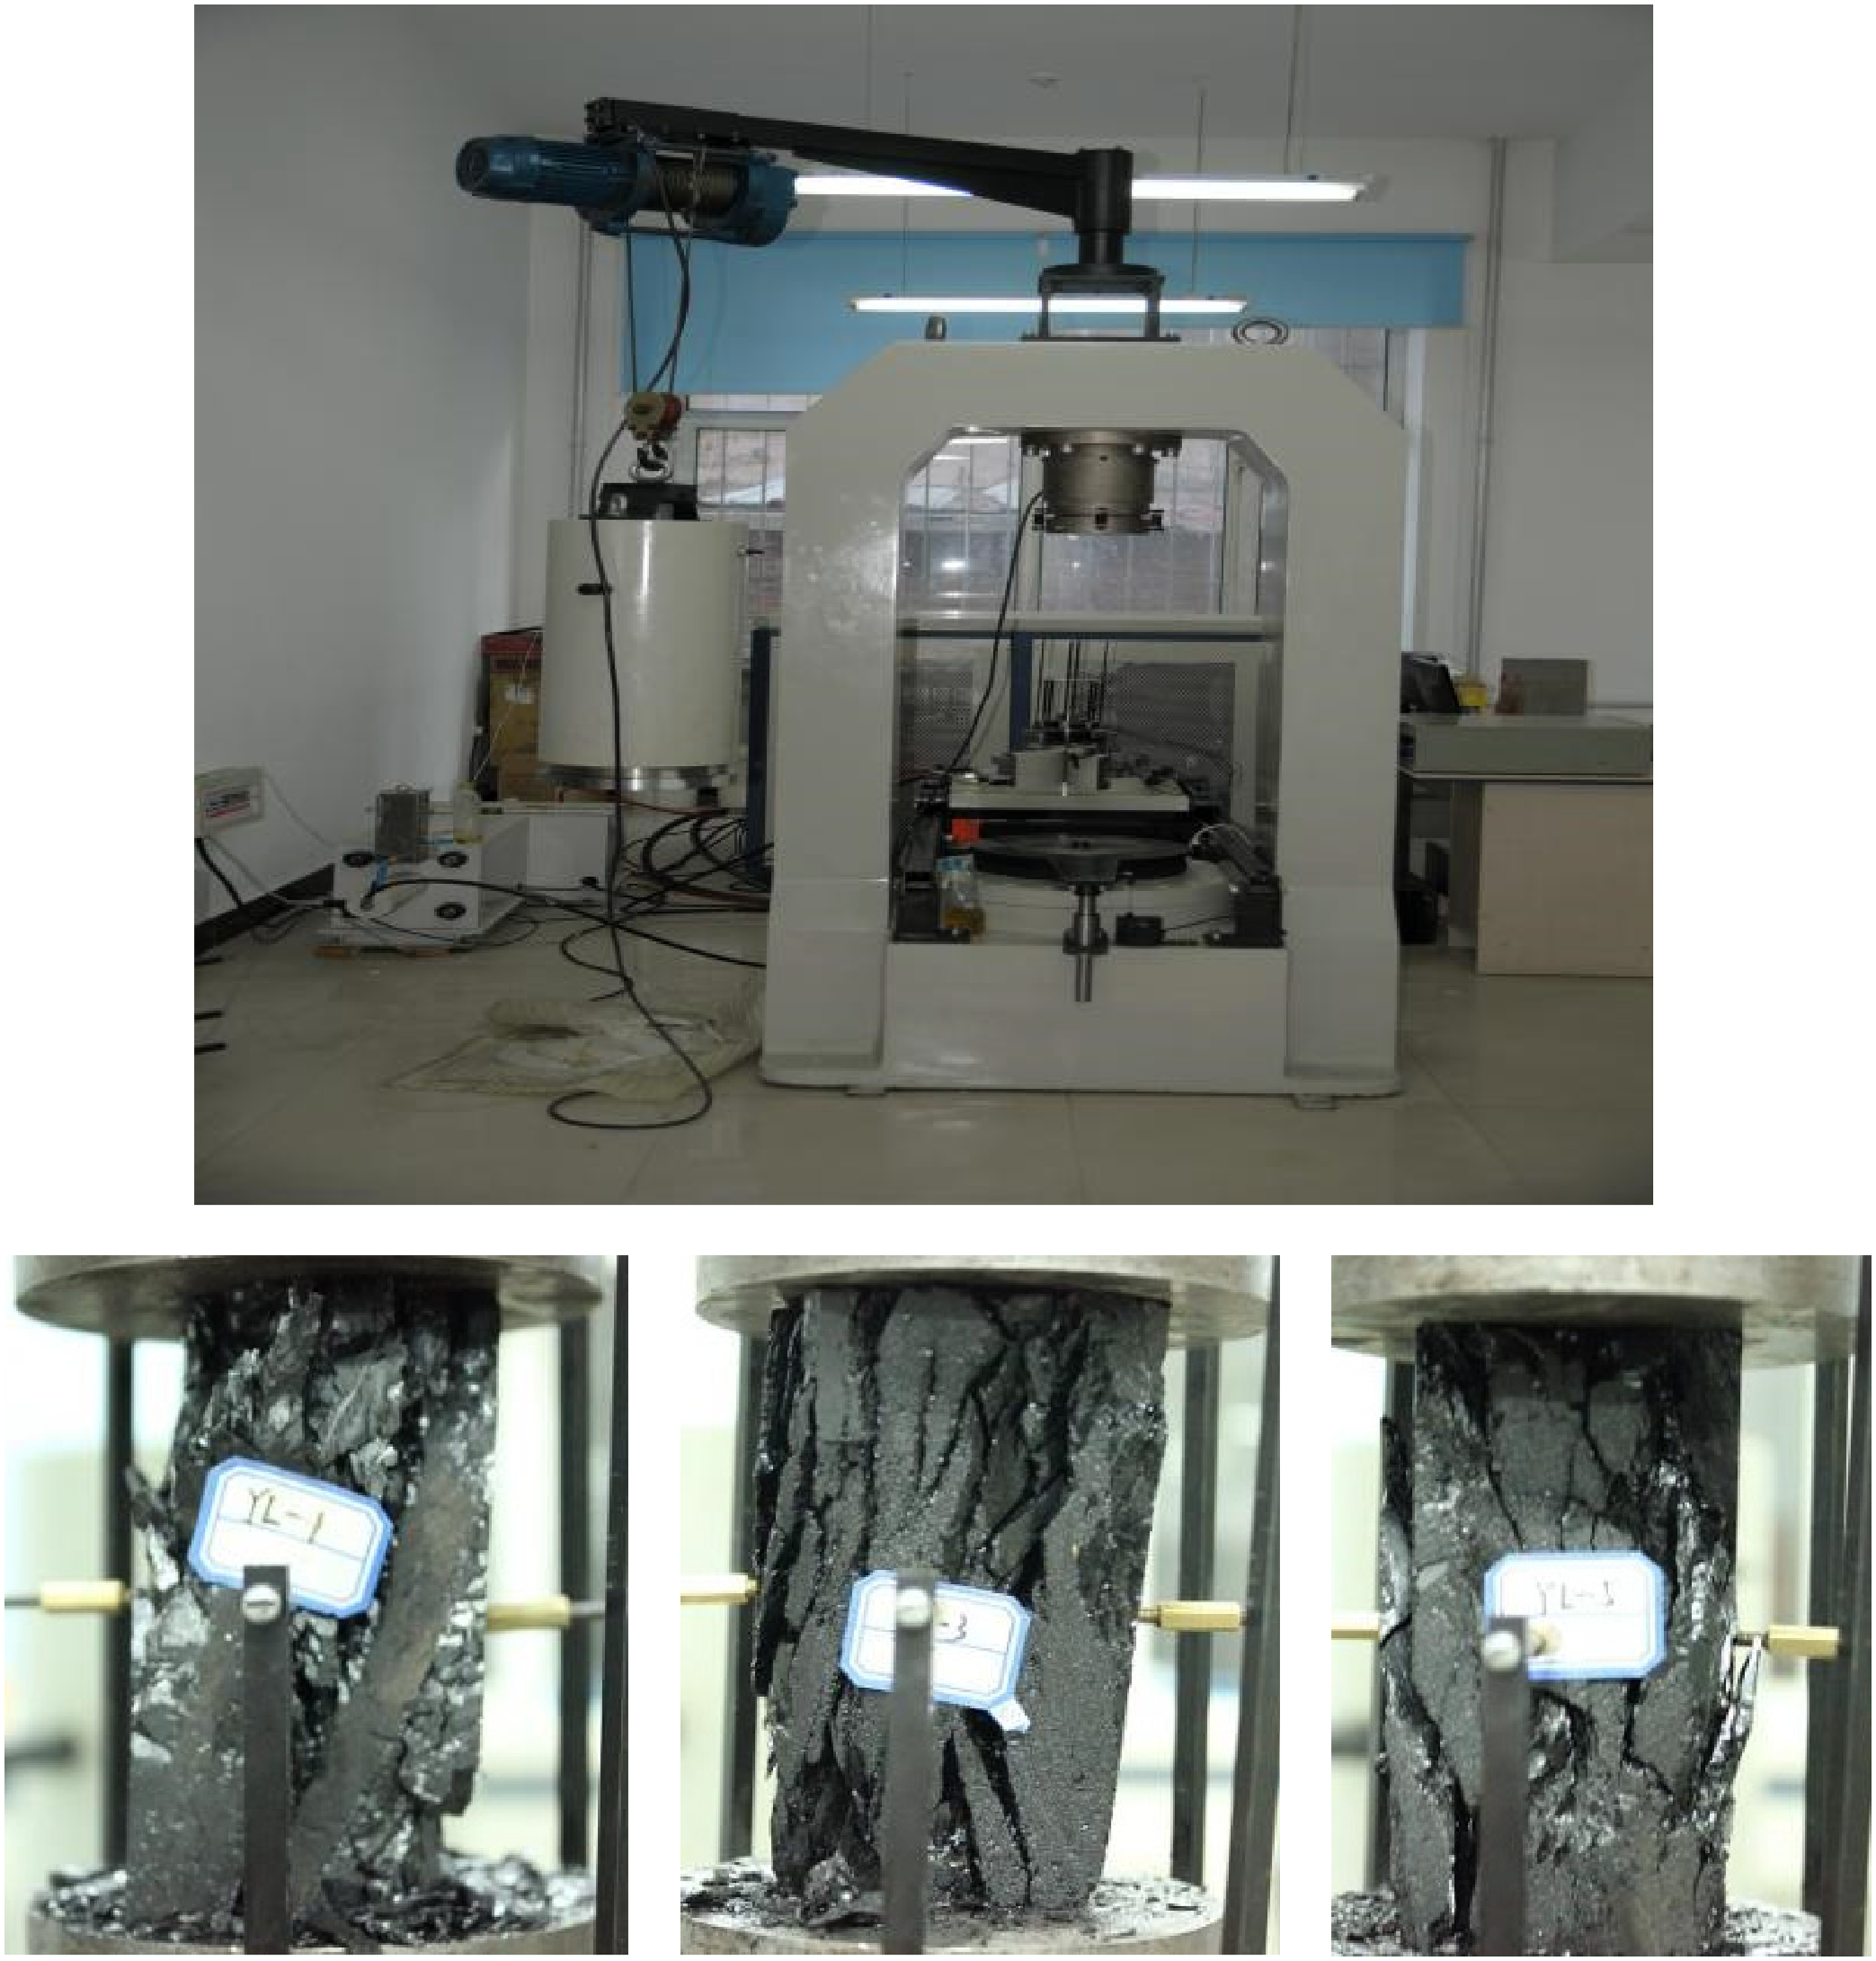
Mechanical parameter testing of coal.
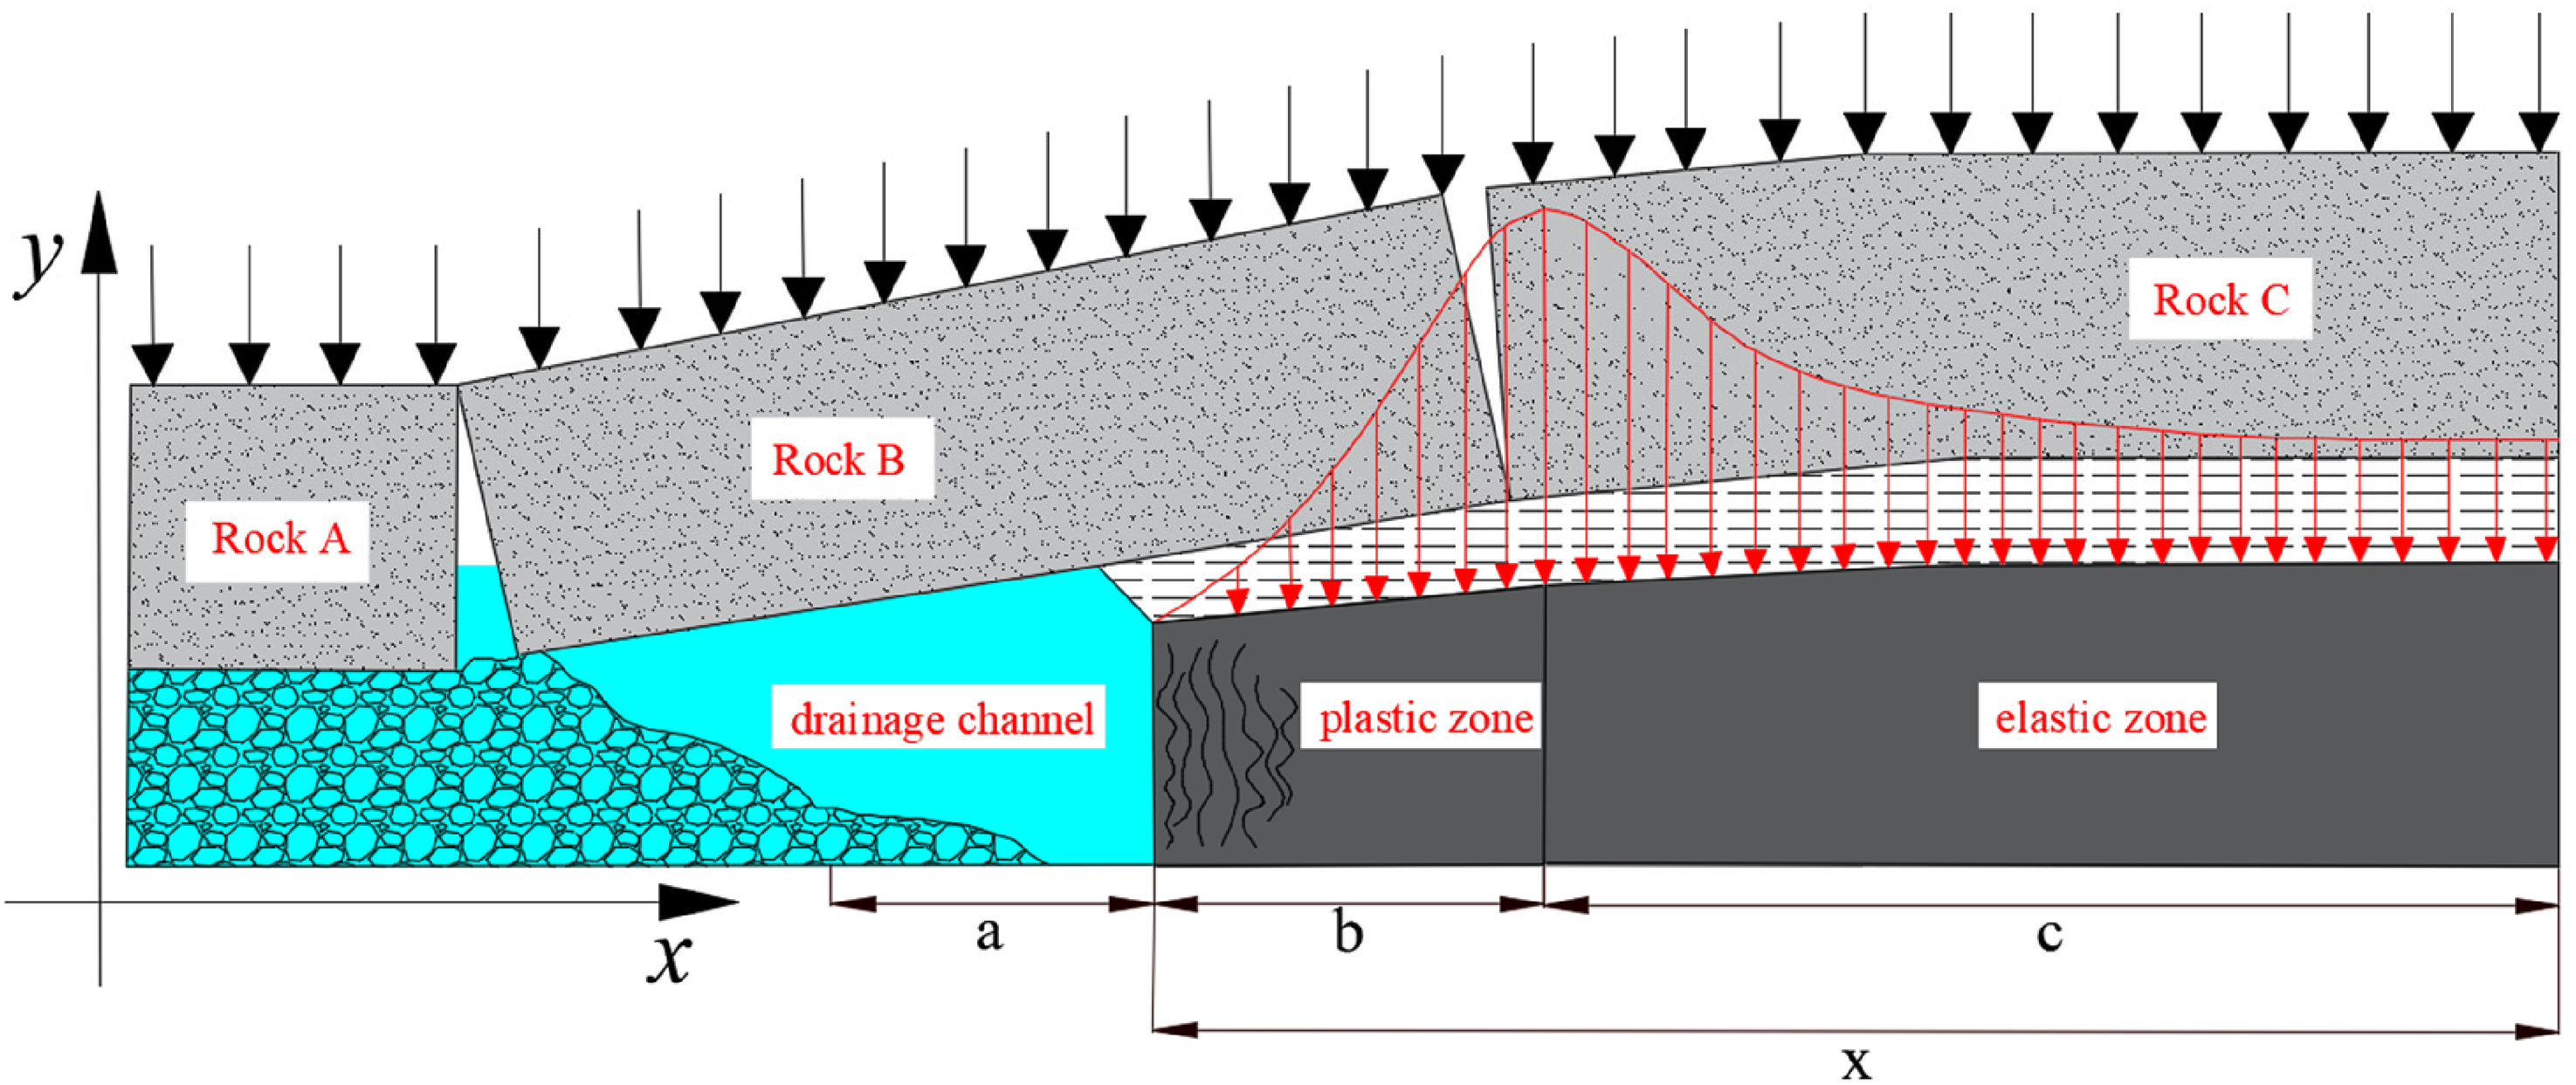
The stress state of coal in the goaf.
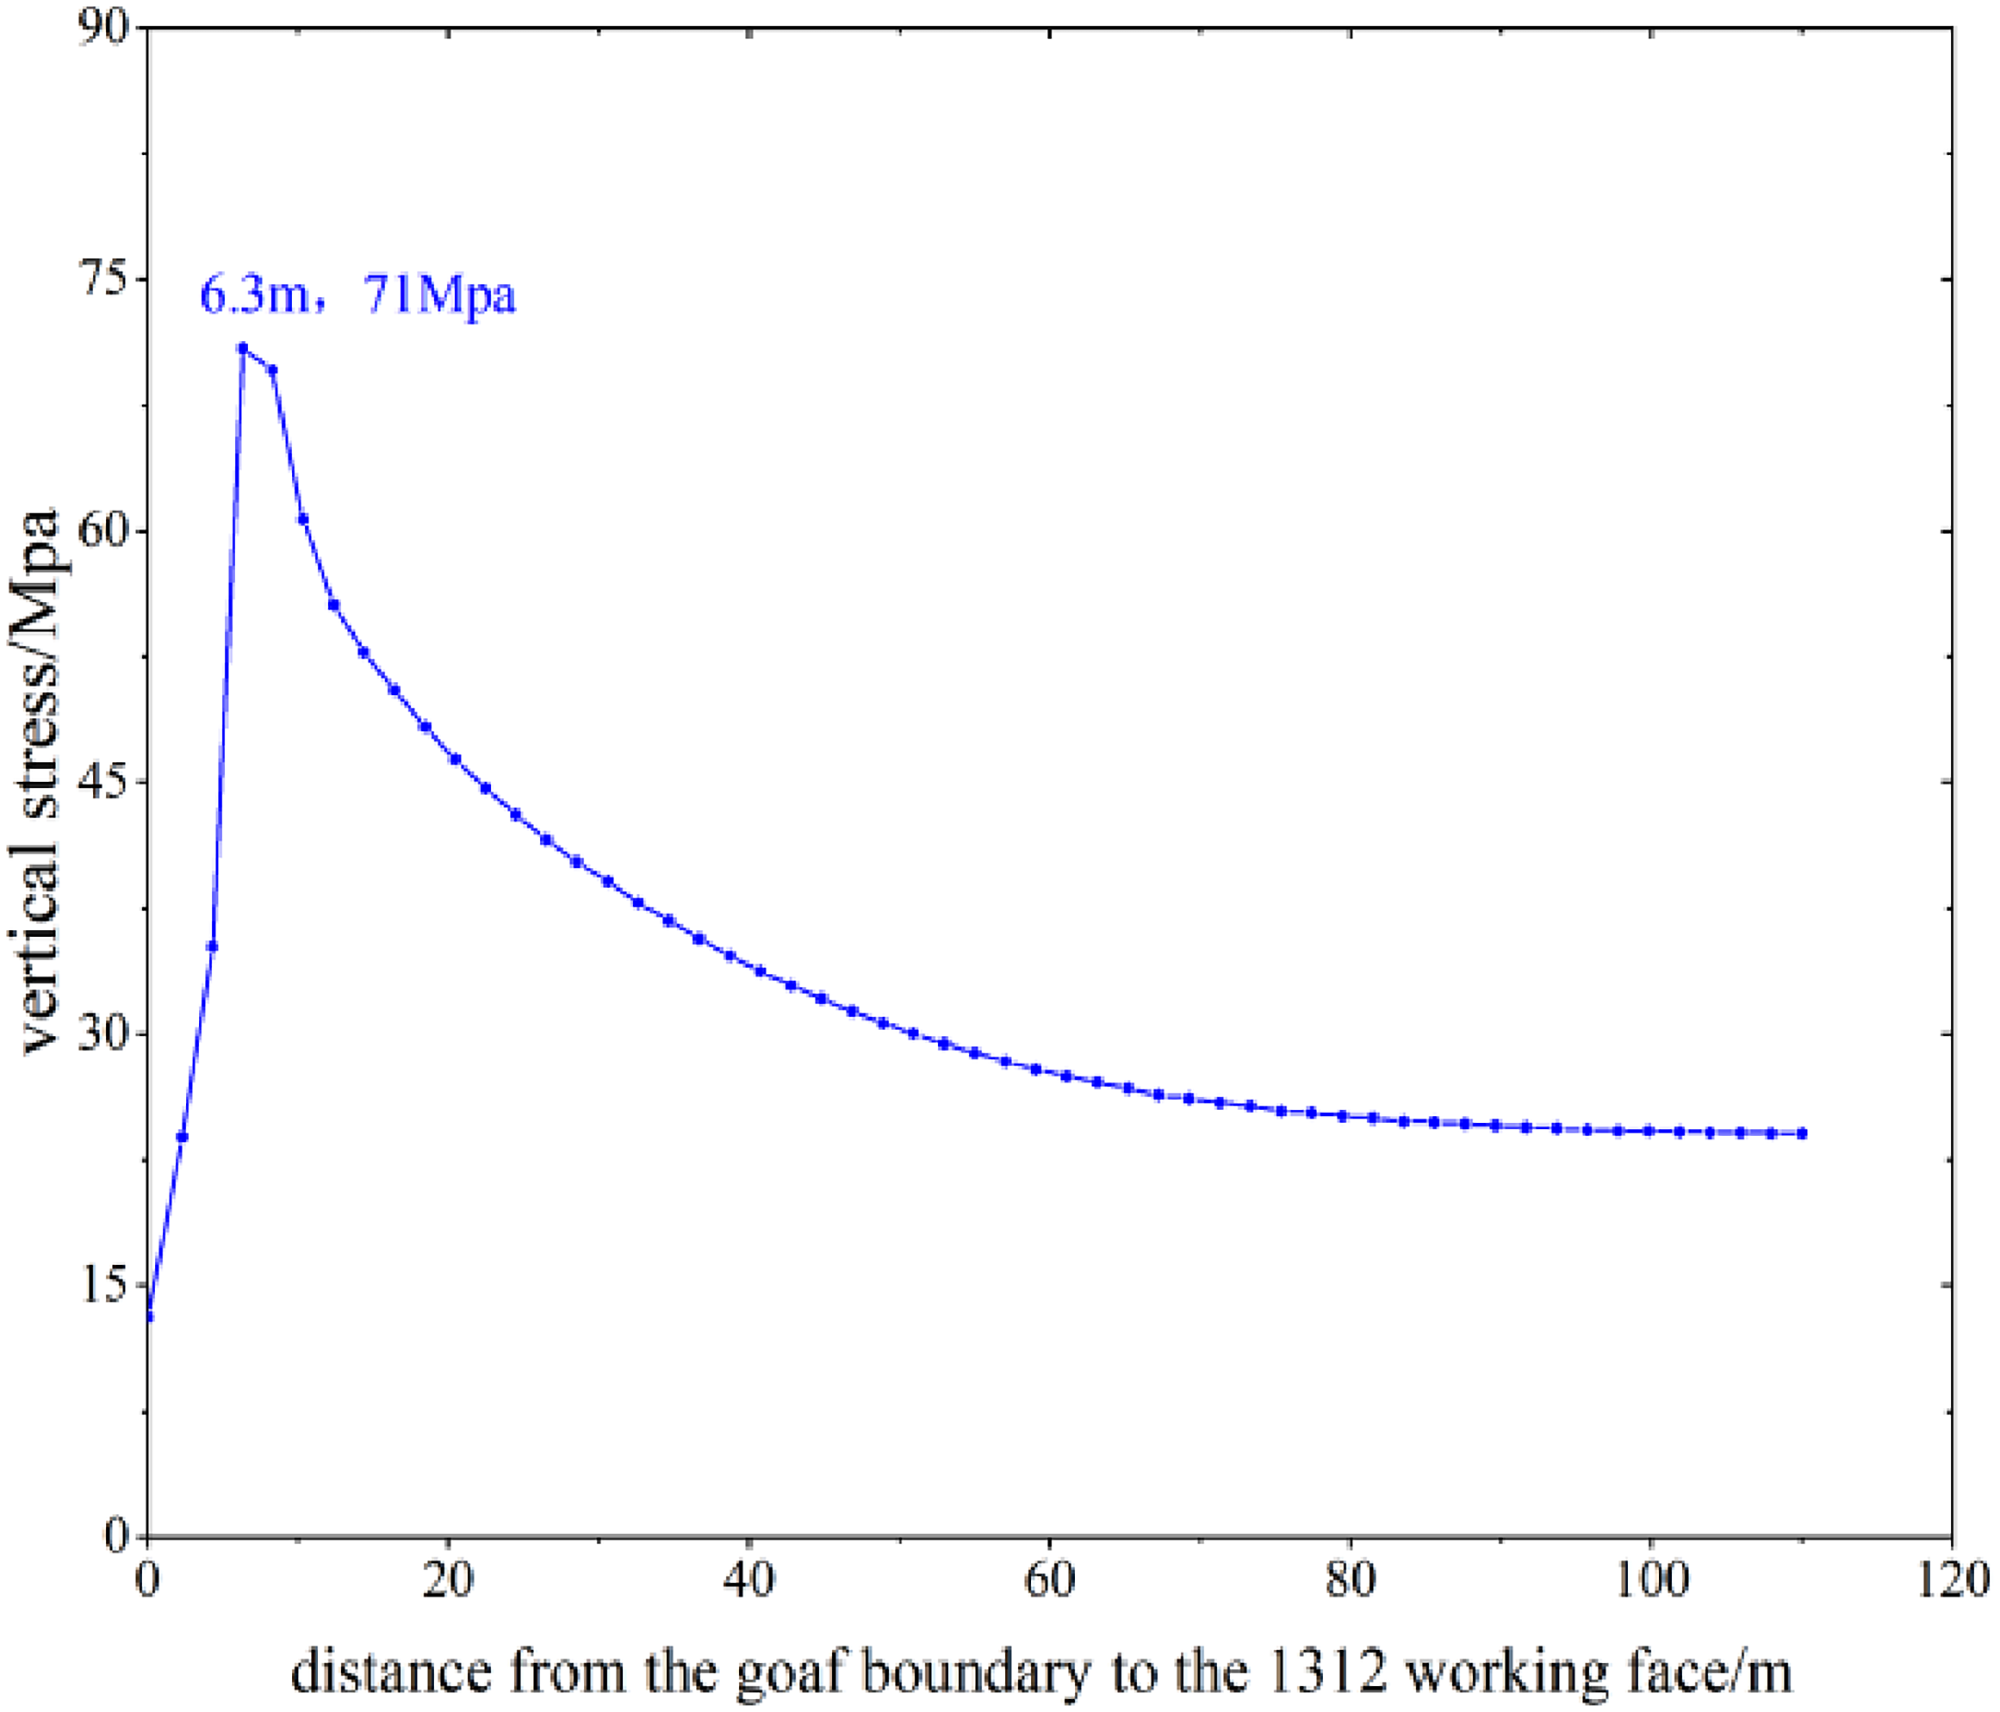
Figure 5 shows the change in vertical stress in the coal pillar. The inelastic zone starts 6.3 m from the coal wall, and the formula gives a result of 6.8 m, which is slightly different from the observed width. The discrepancy is due to the limit equilibrium method's dependence on boundary conditions, and the unknown peak stress and support force in the model. However, the width difference is minimal, so region B is set at 7 m. The elastic zone (region C) is 35 m, as seepage flow has little effect on the original ground stress zone. The water passage in the goaf is assumed to form a laminar flow. Upon mining completion, pillars in the ventilation and transportation roadway are withdrawn, and the masonry beam structure in the goaf exerts varying pressure on the adjacent coal wall, depending on the fracture position. Geological conditions and fracture types vary, but for simplicity, it's assumed the fracture point in block B is distant from the coal wall. Based on Qian et al. (2010), monitoring results show fewer instances of direct roof caving within 4–5 m of the coal wall, with no goaf or roadway filling. Therefore, region A is 5 m long. Figure 6 illustrates the water inrush model.
Change curve of the vertical stress in the coal pillar.
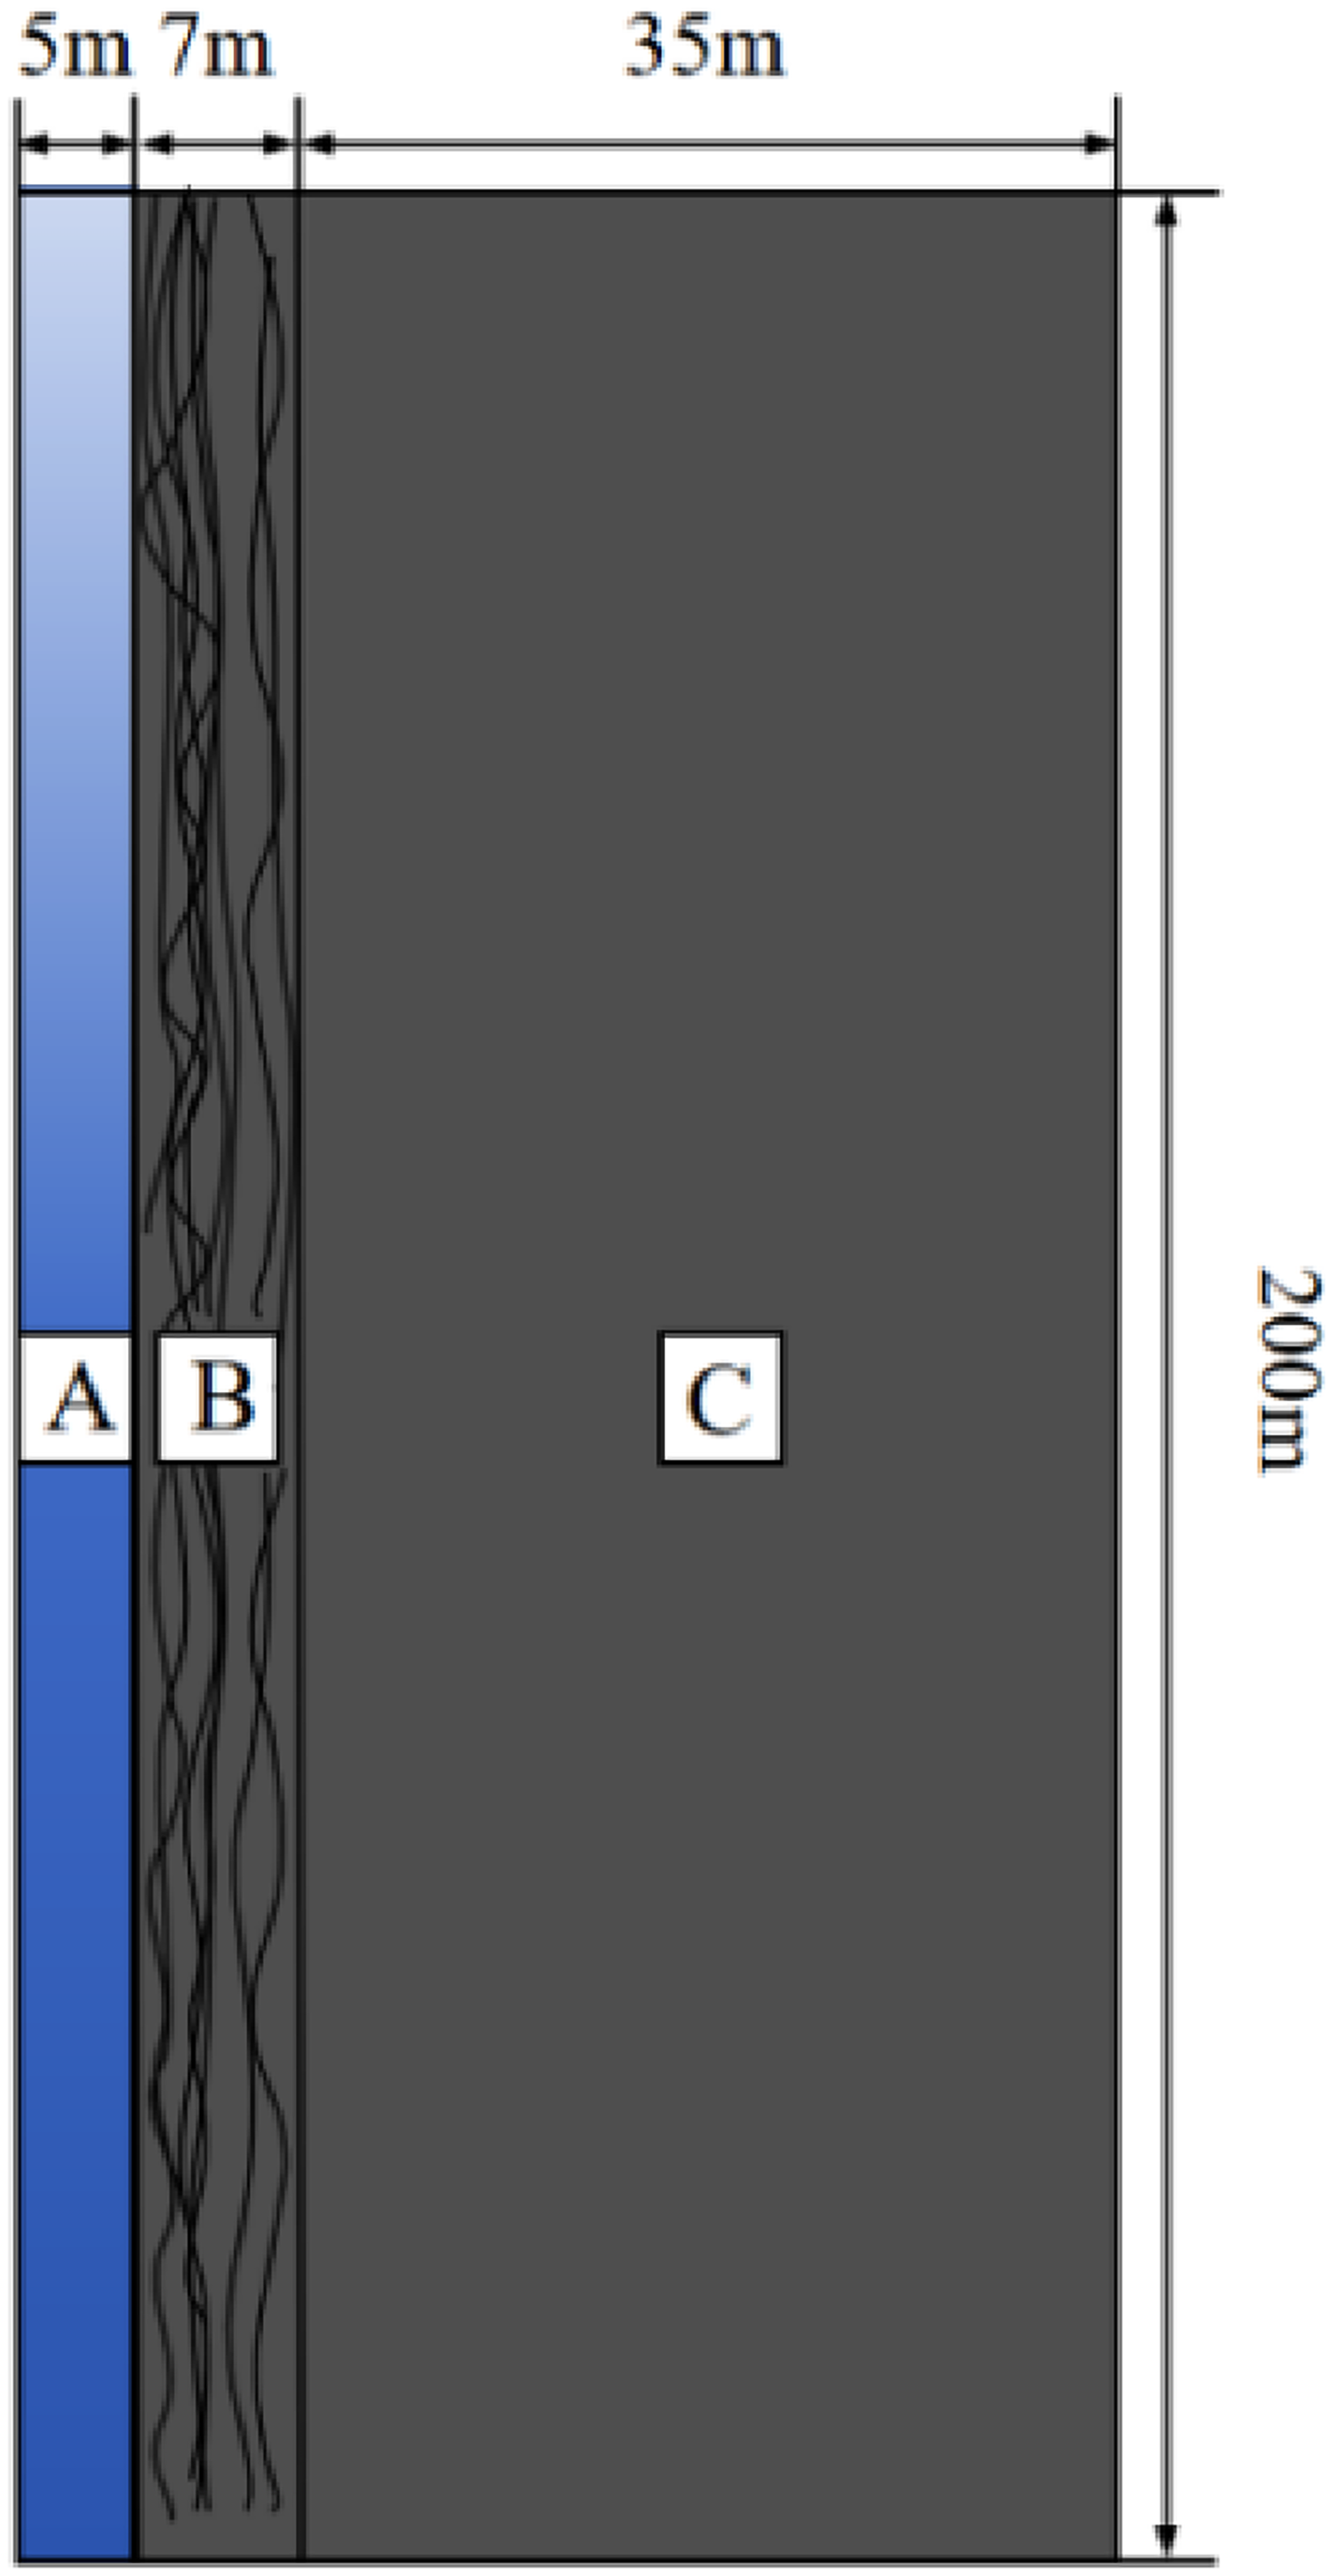
Model diagram of water inrush.
In the model, the elastic zone is governed by Darcy's law for water seepage in coal pillar dams. In the transition zone (referred to as the damaged zone), Darcy's equation becomes less accurate and is coupled with the Brinkman equation, which accounts for fluid dynamics in porous media under rapid flow. The Brinkman equation extends Darcy's law by incorporating kinetic energy dissipation due to viscous shear, similar to the Navier–Stokes equation. It effectively models the transition from slow flow (Darcy's law) to rapid flow (Navier–Stokes equation). The 1312 goaf is the only passage for water inundation into the 1314 coal pillar, treated as a free fluid region governed by the Navier–Stokes equation. Coupling between flow fields is established using mass and momentum conservation laws (Yang et al., 2016). However, the model has some limitations (Ehlers, 2022, Marin et al., 2020, Wang et al., 2023, Xue et al., 2024):
In the simulation, the influence of the goaf on area A is neglected, and the effect of the concentrated water flow in the main tunnel on the coal body is also disregarded. It is assumed that the fluid consists solely of water, and that chemical reactions between the water and coal or rock during water inrush are not considered. The flow equations are based on the continuum hypothesis. It is assumed that the fluid density variation is negligible and that the fluid is incompressible. The impact of temperature variations is not considered in the simulation. The simulation assumes that the flow in each region is steady and remains in a laminar flow state. Turbulent effects generated during the simulation are ignored, and the analysis does not address the occurrence of vortex effects. It is assumed that the porous media in regions B and C are homogeneous and isotropic.
The governing equations for each region in the simulation are as follows: the elastic region is governed by Darcy's law (Ma et al., 2016, Zhang et al., 2022):

The nonelastic region is governed by the Brinkman flow equation (Yang et al., 2017, Yao and Zhang, 2023):

The 1312 goaf is governed by the Navier–Stokes equations (Luo et al., 2024):

The simulation employs the finite element method for discretization (Cui et al., 2021, Wang et al., 2021b), with the partial differential equations from equations (2)–(7) being discretized in both time and space using an implicit method (BDF). The Newton–Raphson method is then applied to solve for the unknown parameters, including seepage velocity and pore water pressure, in the nonlinear problem. The model's boundary conditions (Wang et al., 2019) are set as follows:
Region A: The upper boundary is set as the water inrush entry. Based on parameters derived from the Xiaoyun Coal Mine water inrush report, the inlet pressure is set to 4 MPa, and the pressure at the inlet is applied using an interpolation function. The velocity at the left boundary is set to 0. The right boundary is the outlet, where the velocity is the same as the inlet velocity of region B.
Region B: The left boundary is the inlet, controlled by pressure, with the pressure set equal to the outlet pressure of region A. The right boundary is the outlet, controlled by velocity, with the velocity equal to the inlet velocity of region C.
Region C: The left boundary is the inlet, controlled by pressure, with the pressure set equal to the outlet pressure of region B. The right boundary is set as a no-flow condition, with a flow rate of 0.
The upper boundaries of regions B and C are set as wall boundaries to simulate the no-slip condition (Xu et al., 2023). The model length is 200 m, larger than the dip length of the working face, as water inrush impacts are concentrated within the first 100 m. Beyond this, pore pressure and flow velocity stabilize. A larger model length would increase computational load and distort the model's length-to-width ratio, affecting accuracy. Therefore, the lower boundaries are set as symmetric domains to minimize deviation from actual field conditions.
To explore the difference between Brinkman flow and Darcy flow. First, the effect of water inrush on coal pillar is analyzed for a porosity of
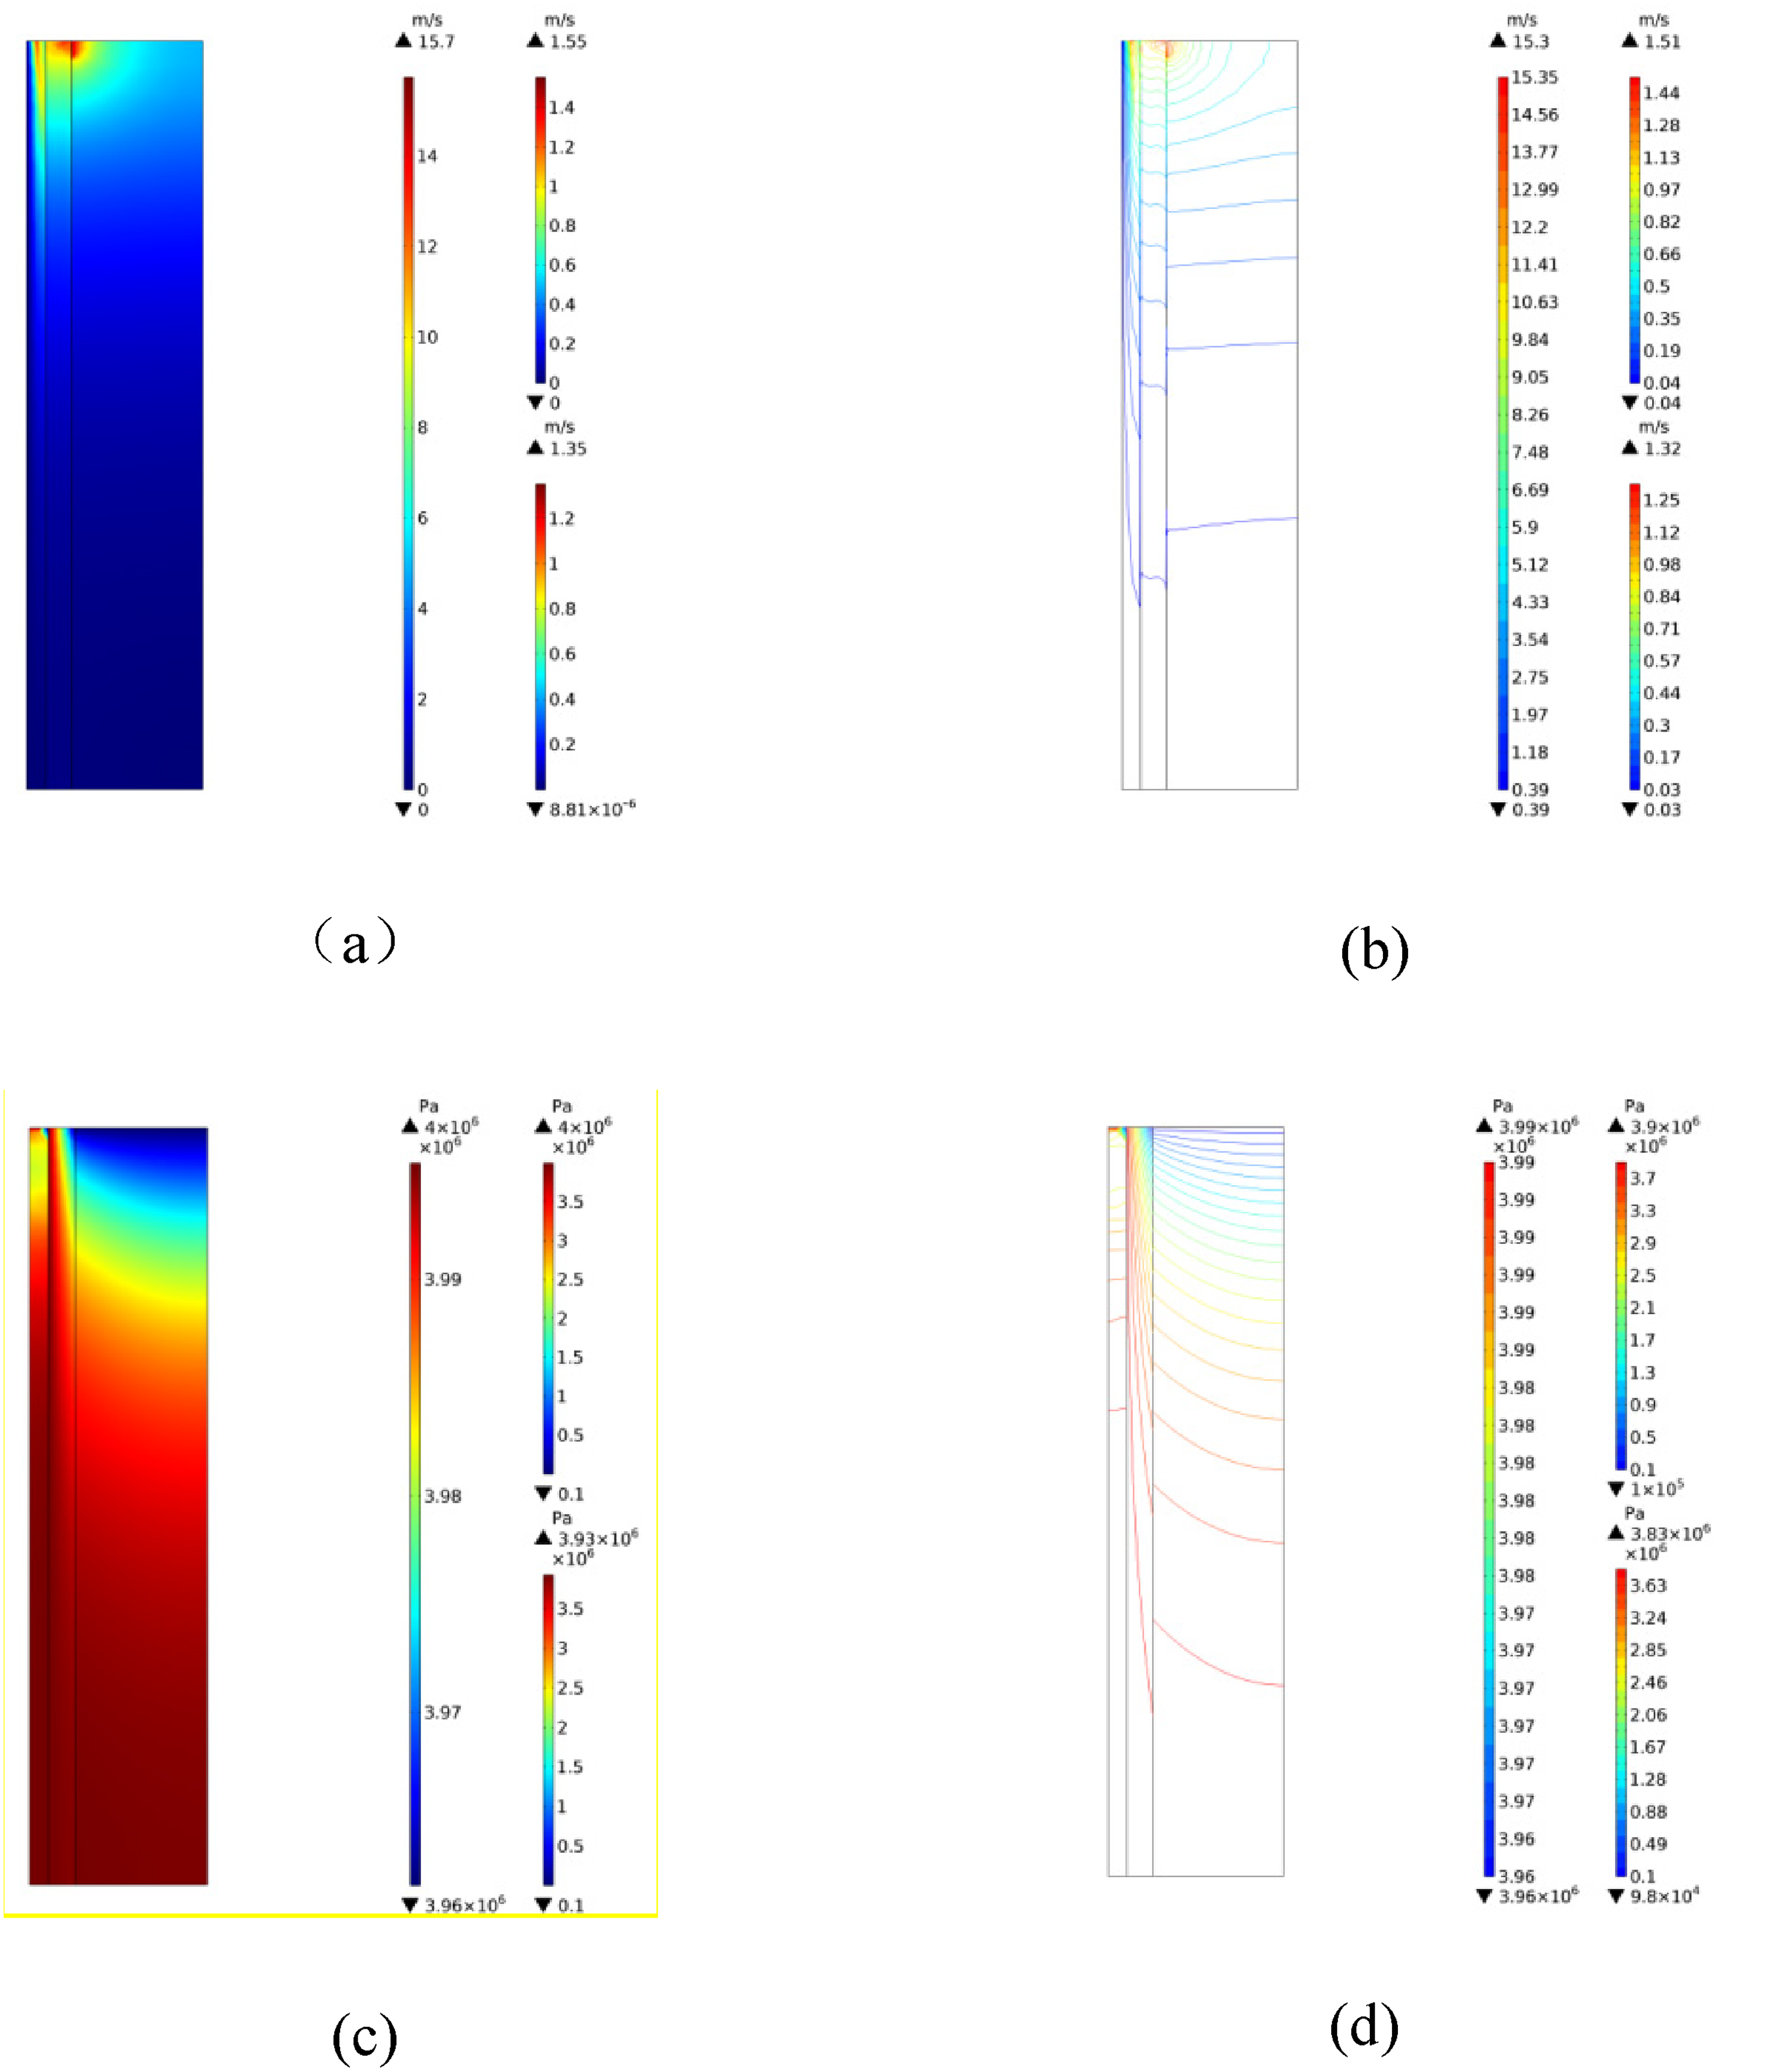
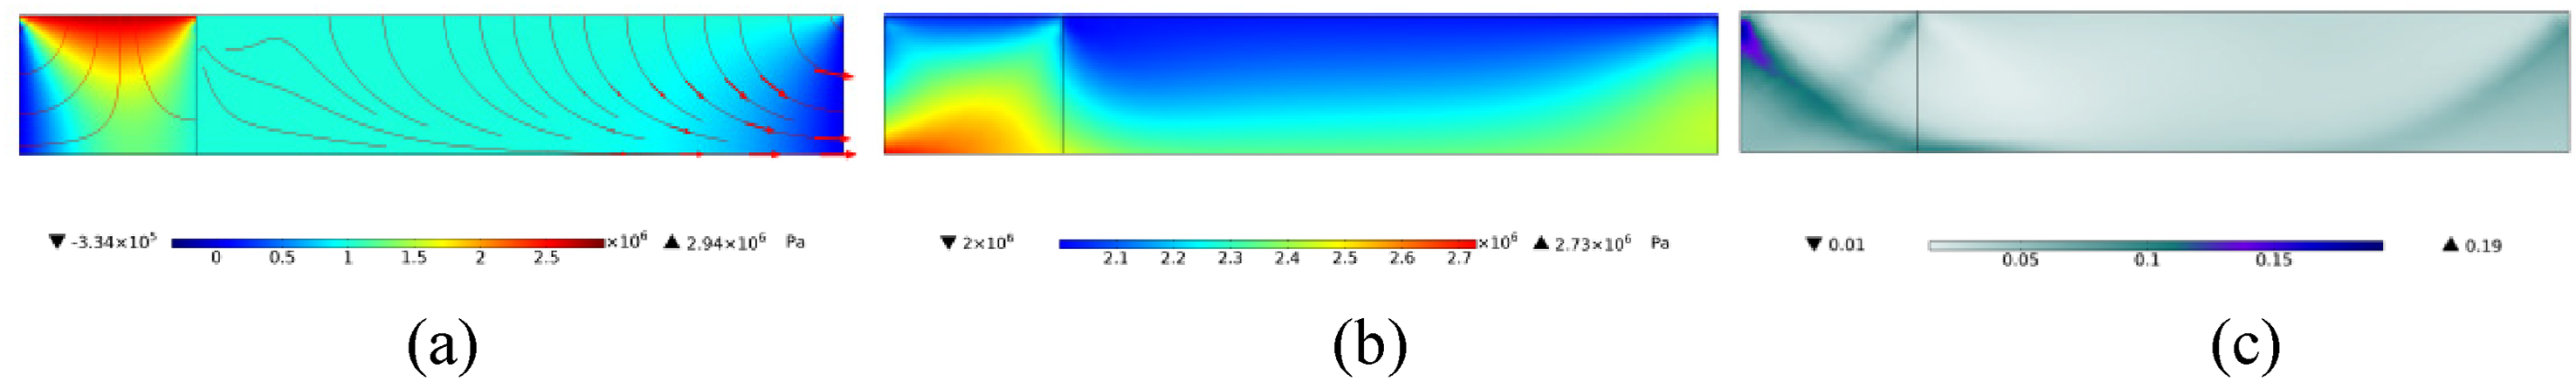
Figure 7 shows the distribution characteristics of the water velocity and pressure inside the model. From Figure 7(a), the velocities in regions A, B, and C are not continuous. The region with the highest velocity is region A because region A simulates water flow, so the velocity of region A is mainly affected by the inlet water pressure and the duration of action. The speed of region B is one order of magnitude smaller than that of region A but larger than that of region C. In Figure 7(c), the speed step at the junction of the two regions can be clearly seen. From Figure 7(b) and (d), the water velocity of region A remains the highest among the three regions. At the junction of regions B and C, the two regions exhibit good consistency in terms of water pressure, and there is no significant increase in water velocity. Figure 7 highlights the differences among the three areas. Therefore, it is necessary to divide the region according to the actual situation of the mining site and then apply different fluid dynamics equations to analyze the water inrush process. This can help us better understand the impact of water inrush on the coal pillar. This approach can guide our understanding of the degree of softening of coal during mining and increase the accuracy of coal pillar design and construction. Because the geological conditions of different coal mines vary greatly, this paper will further adjust the model parameters to identify more flooding patterns under different coal seam conditions.
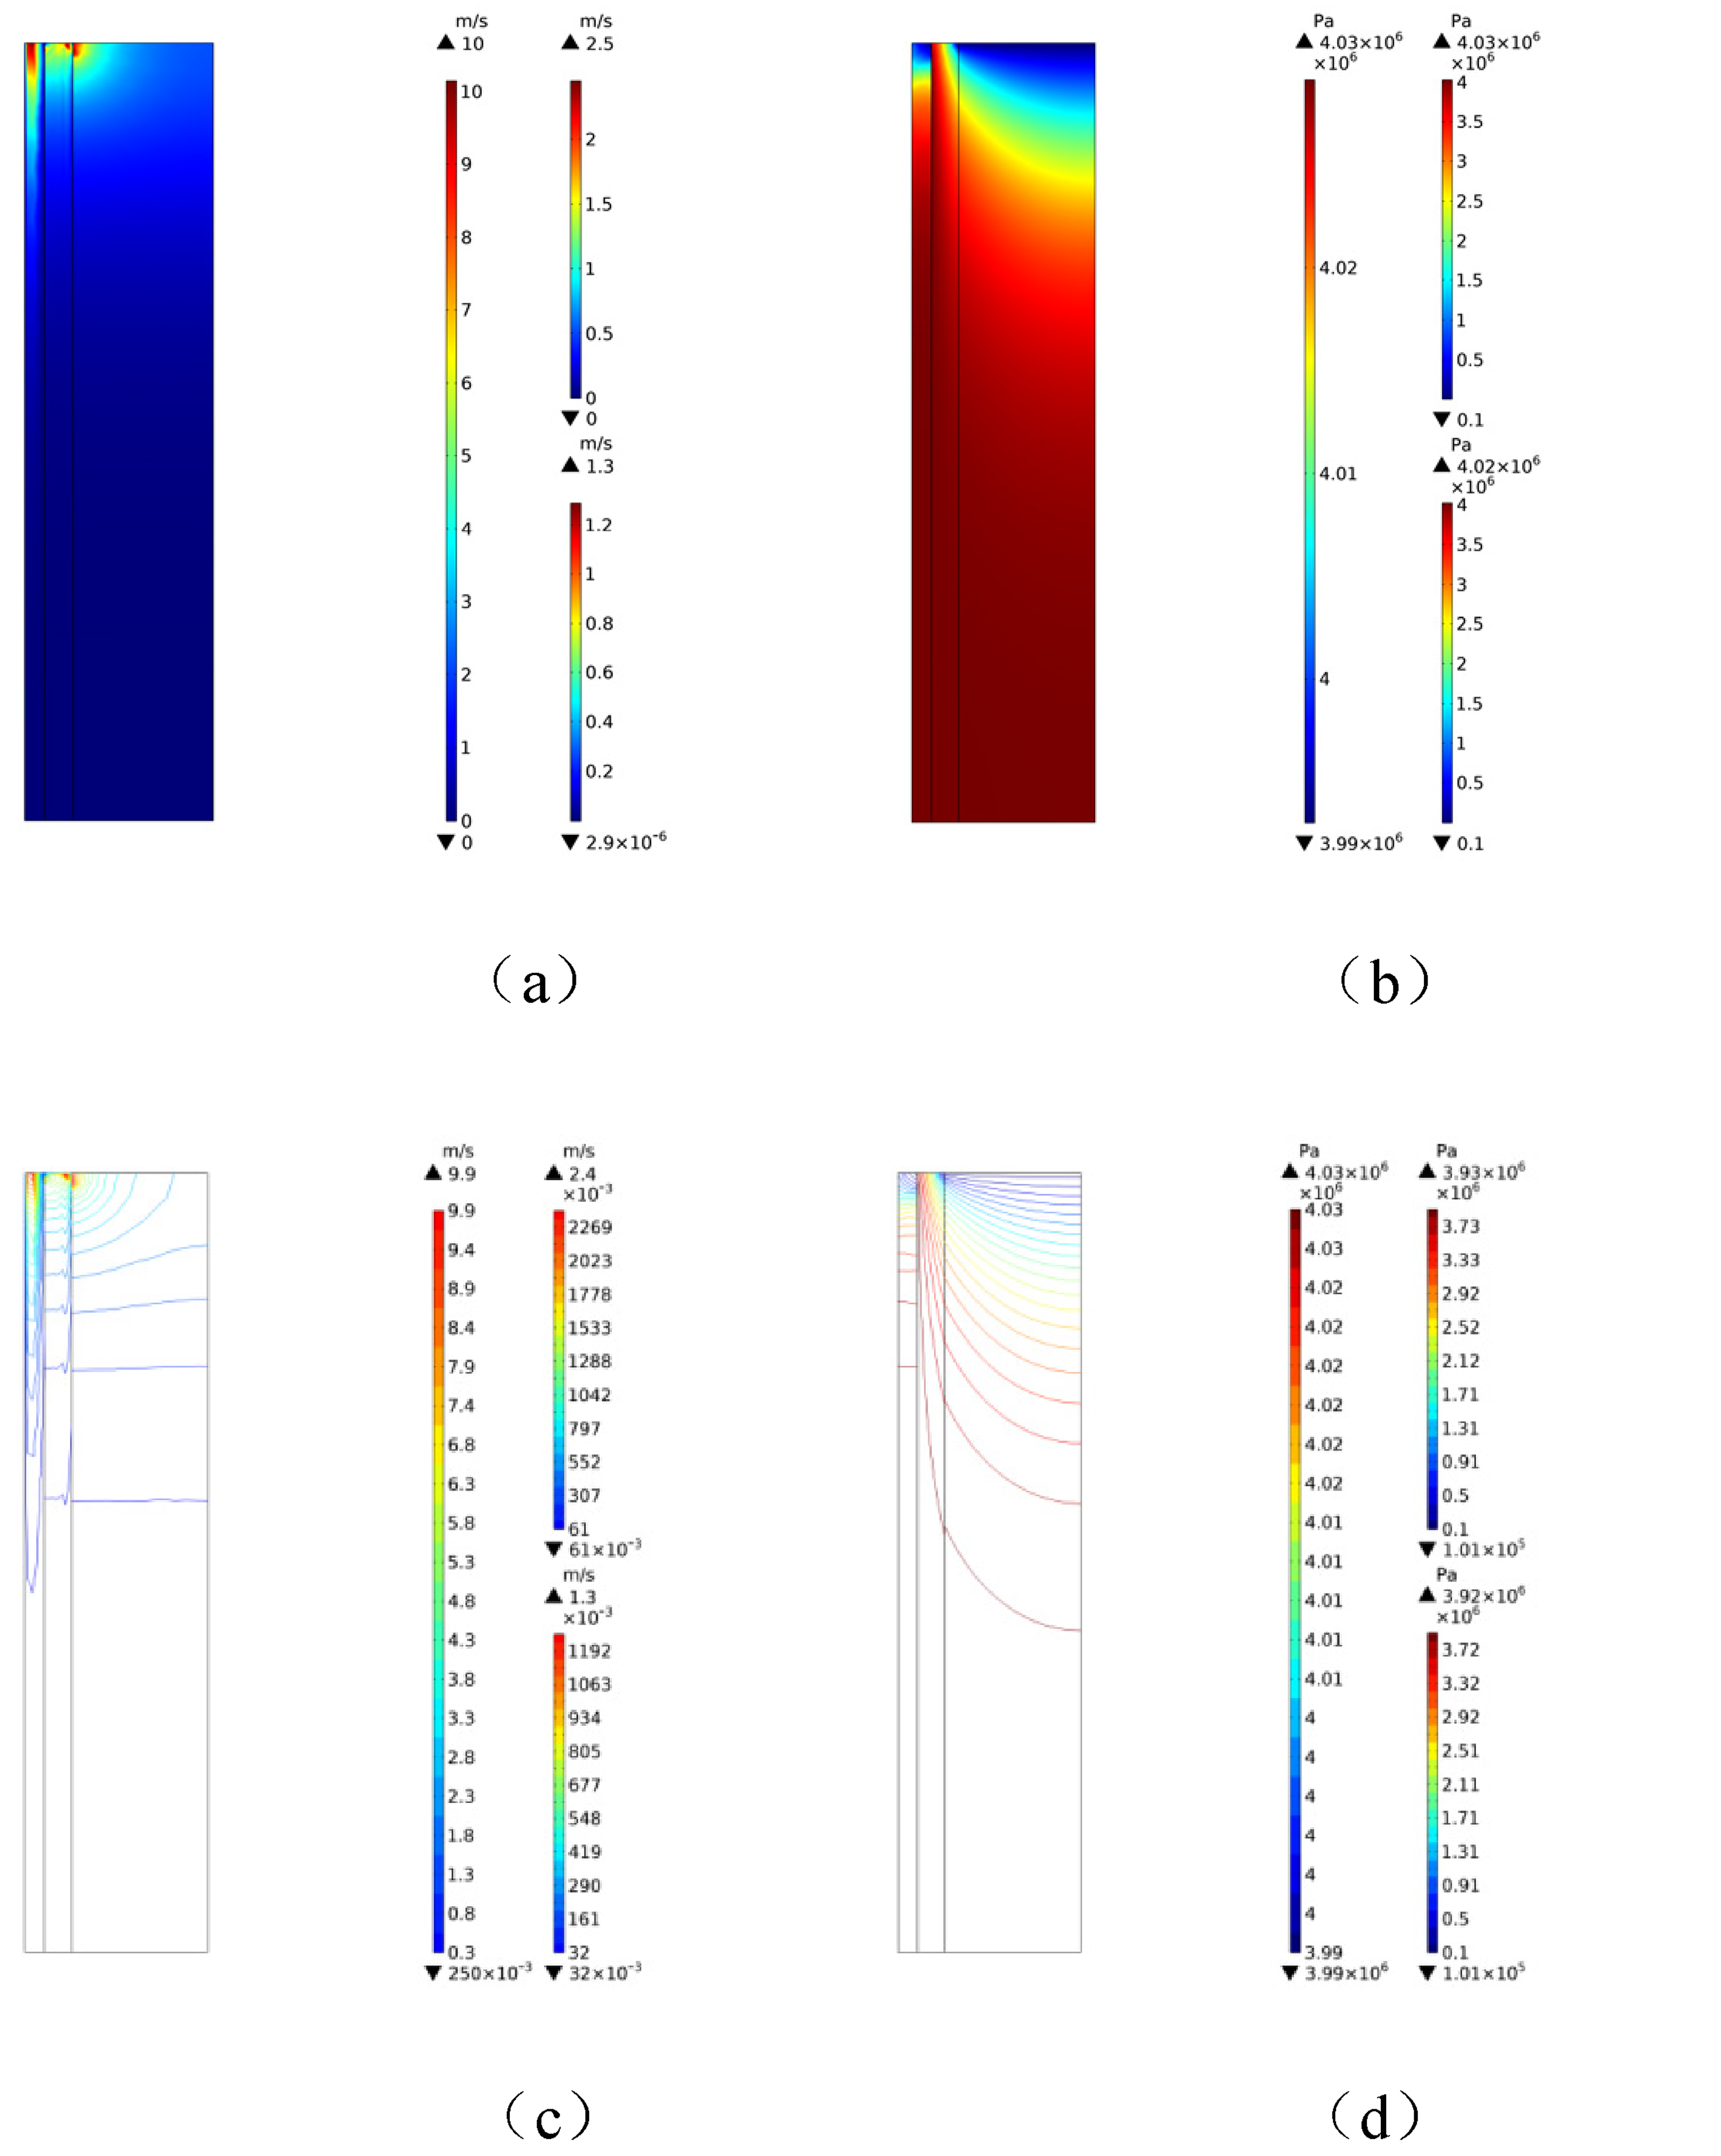
Distribution characteristics of the water velocity and seepage stress. Note: The color bar on the left represents the change in area a, the upper color bar on the right represents the change in area b, and the lower color bar on the right represents the change in area c. The following is the same, with no more details. (a) Water velocity. (b) Seepage pressure. (c) Water velocity contour. (d) Seepage pressure contour.
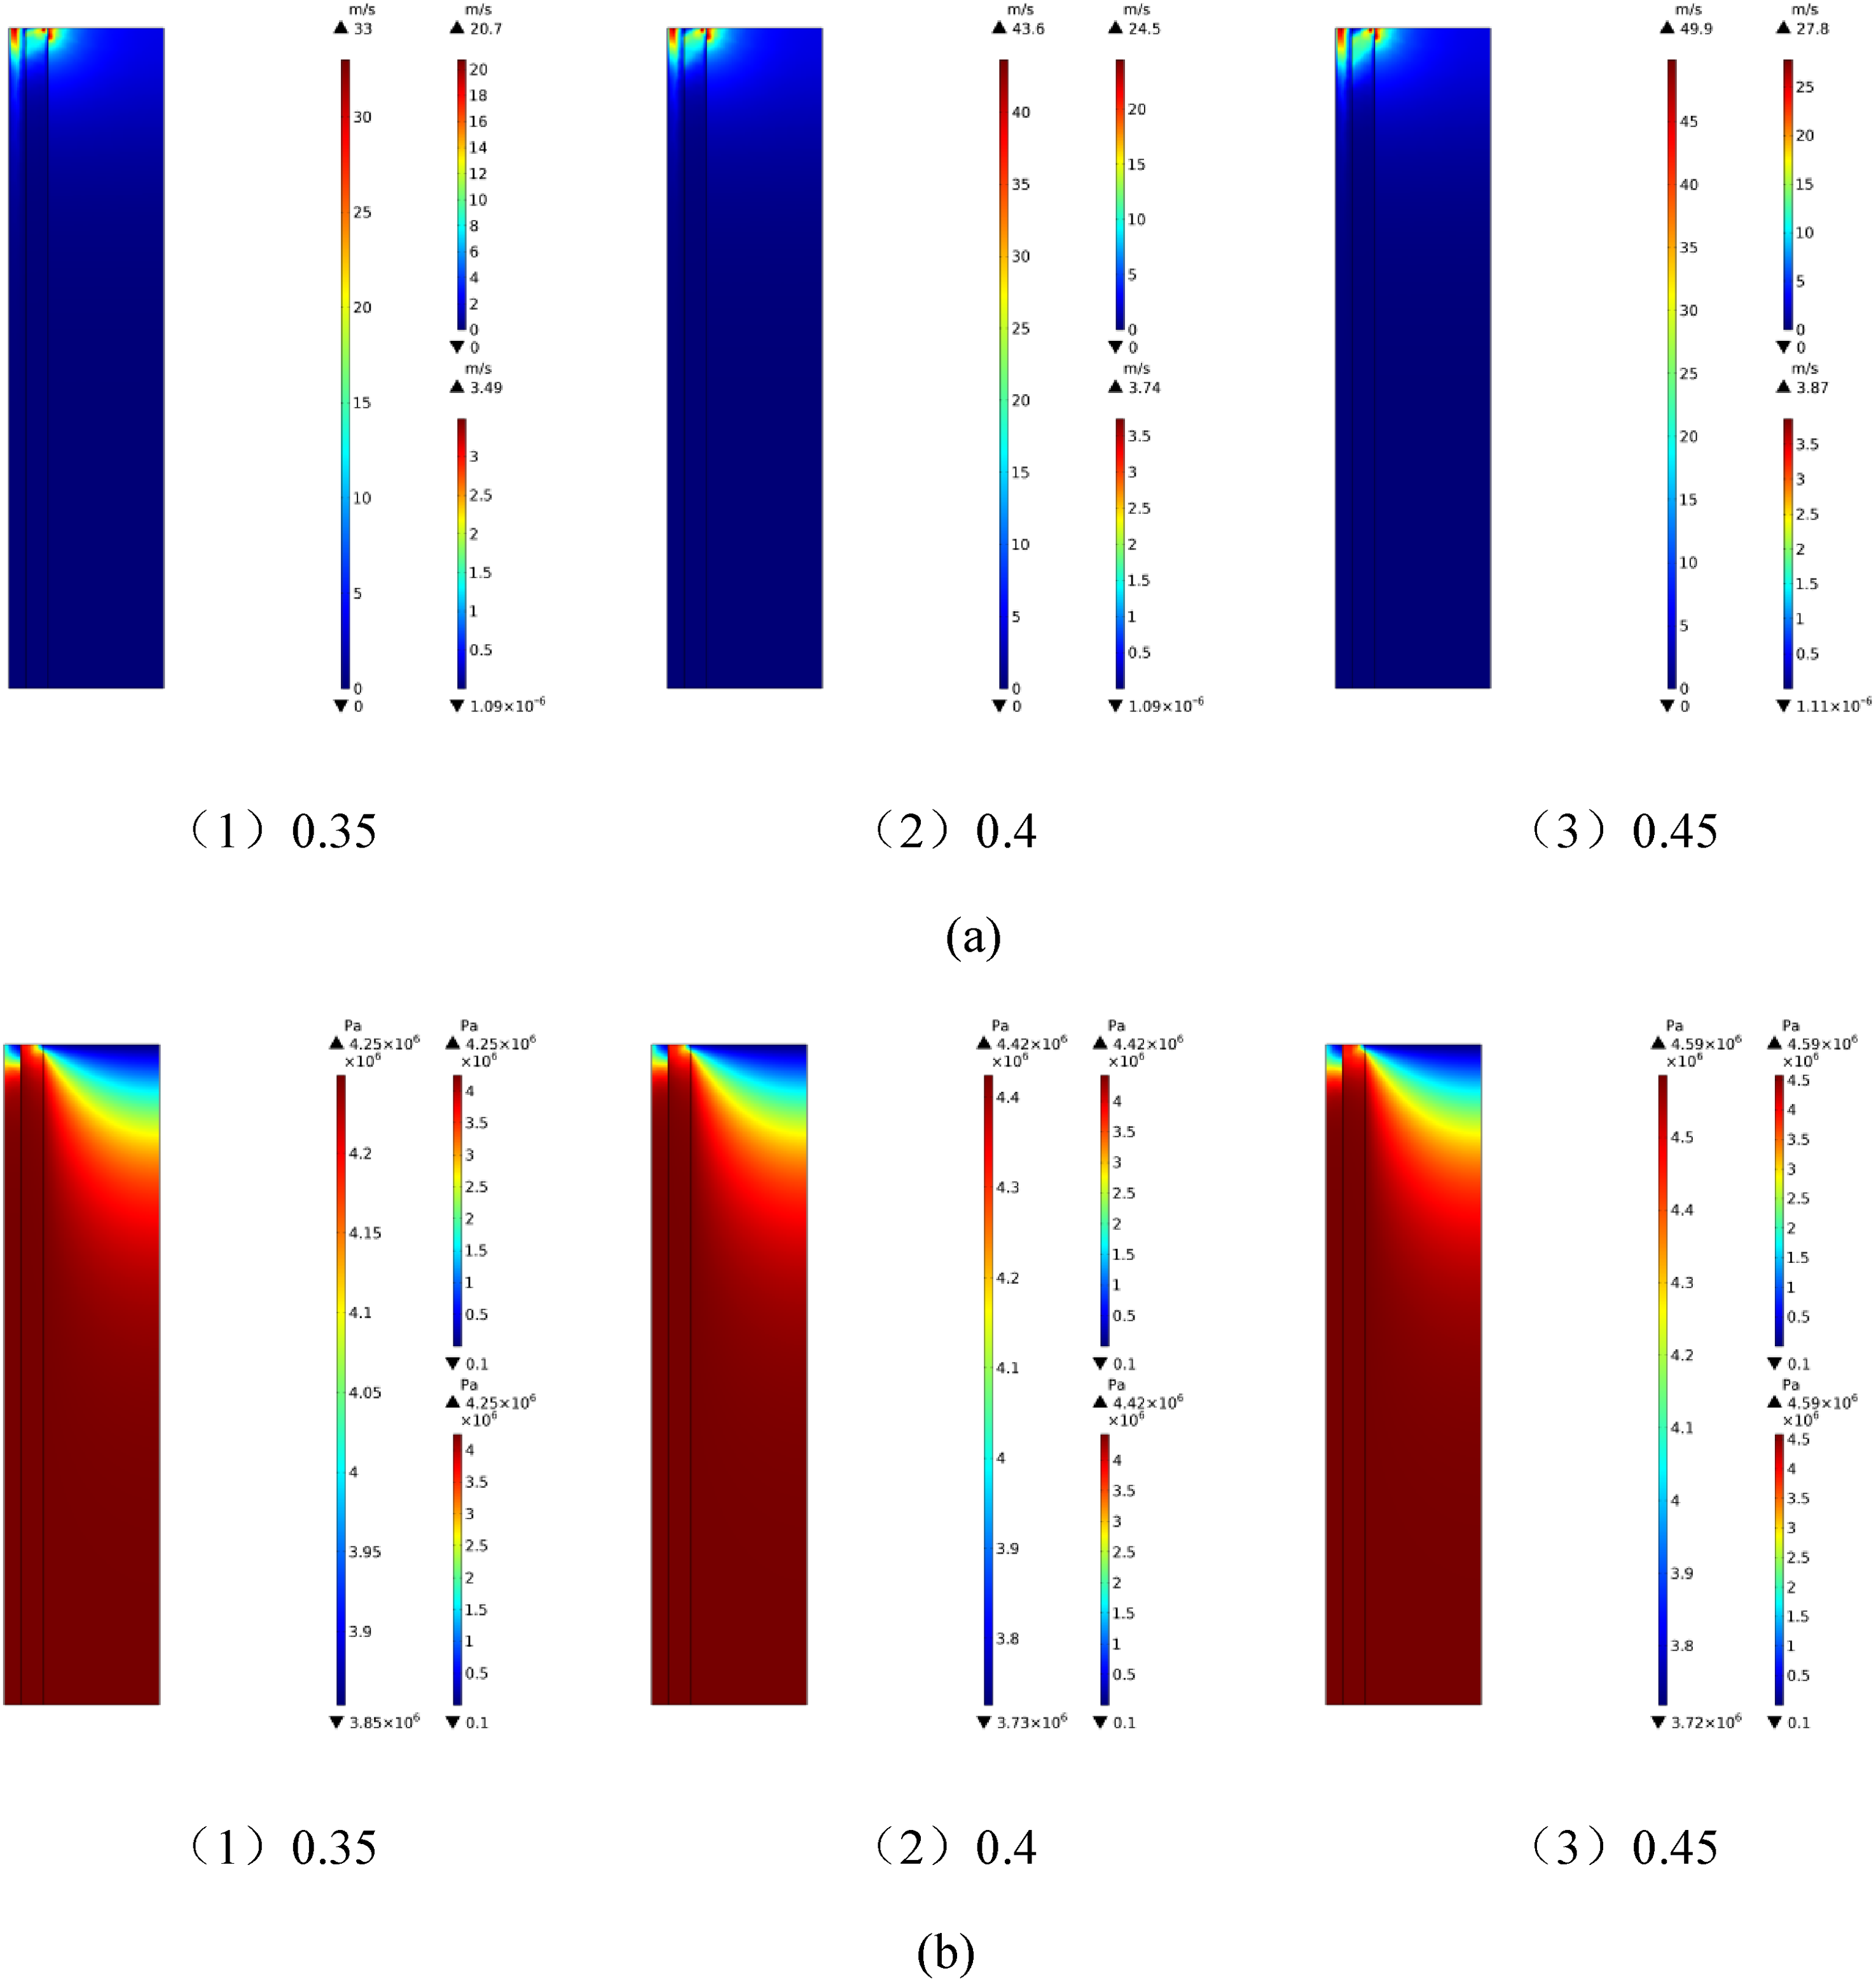
Based on the above model, the porosities of the coal samples are set to 0.15, 0.2, 0.25, 0.3, and 0.35 (Parts b and c are consistent). Figure 8 shows the distribution characteristics of the water velocity and seepage stress with different porosities.
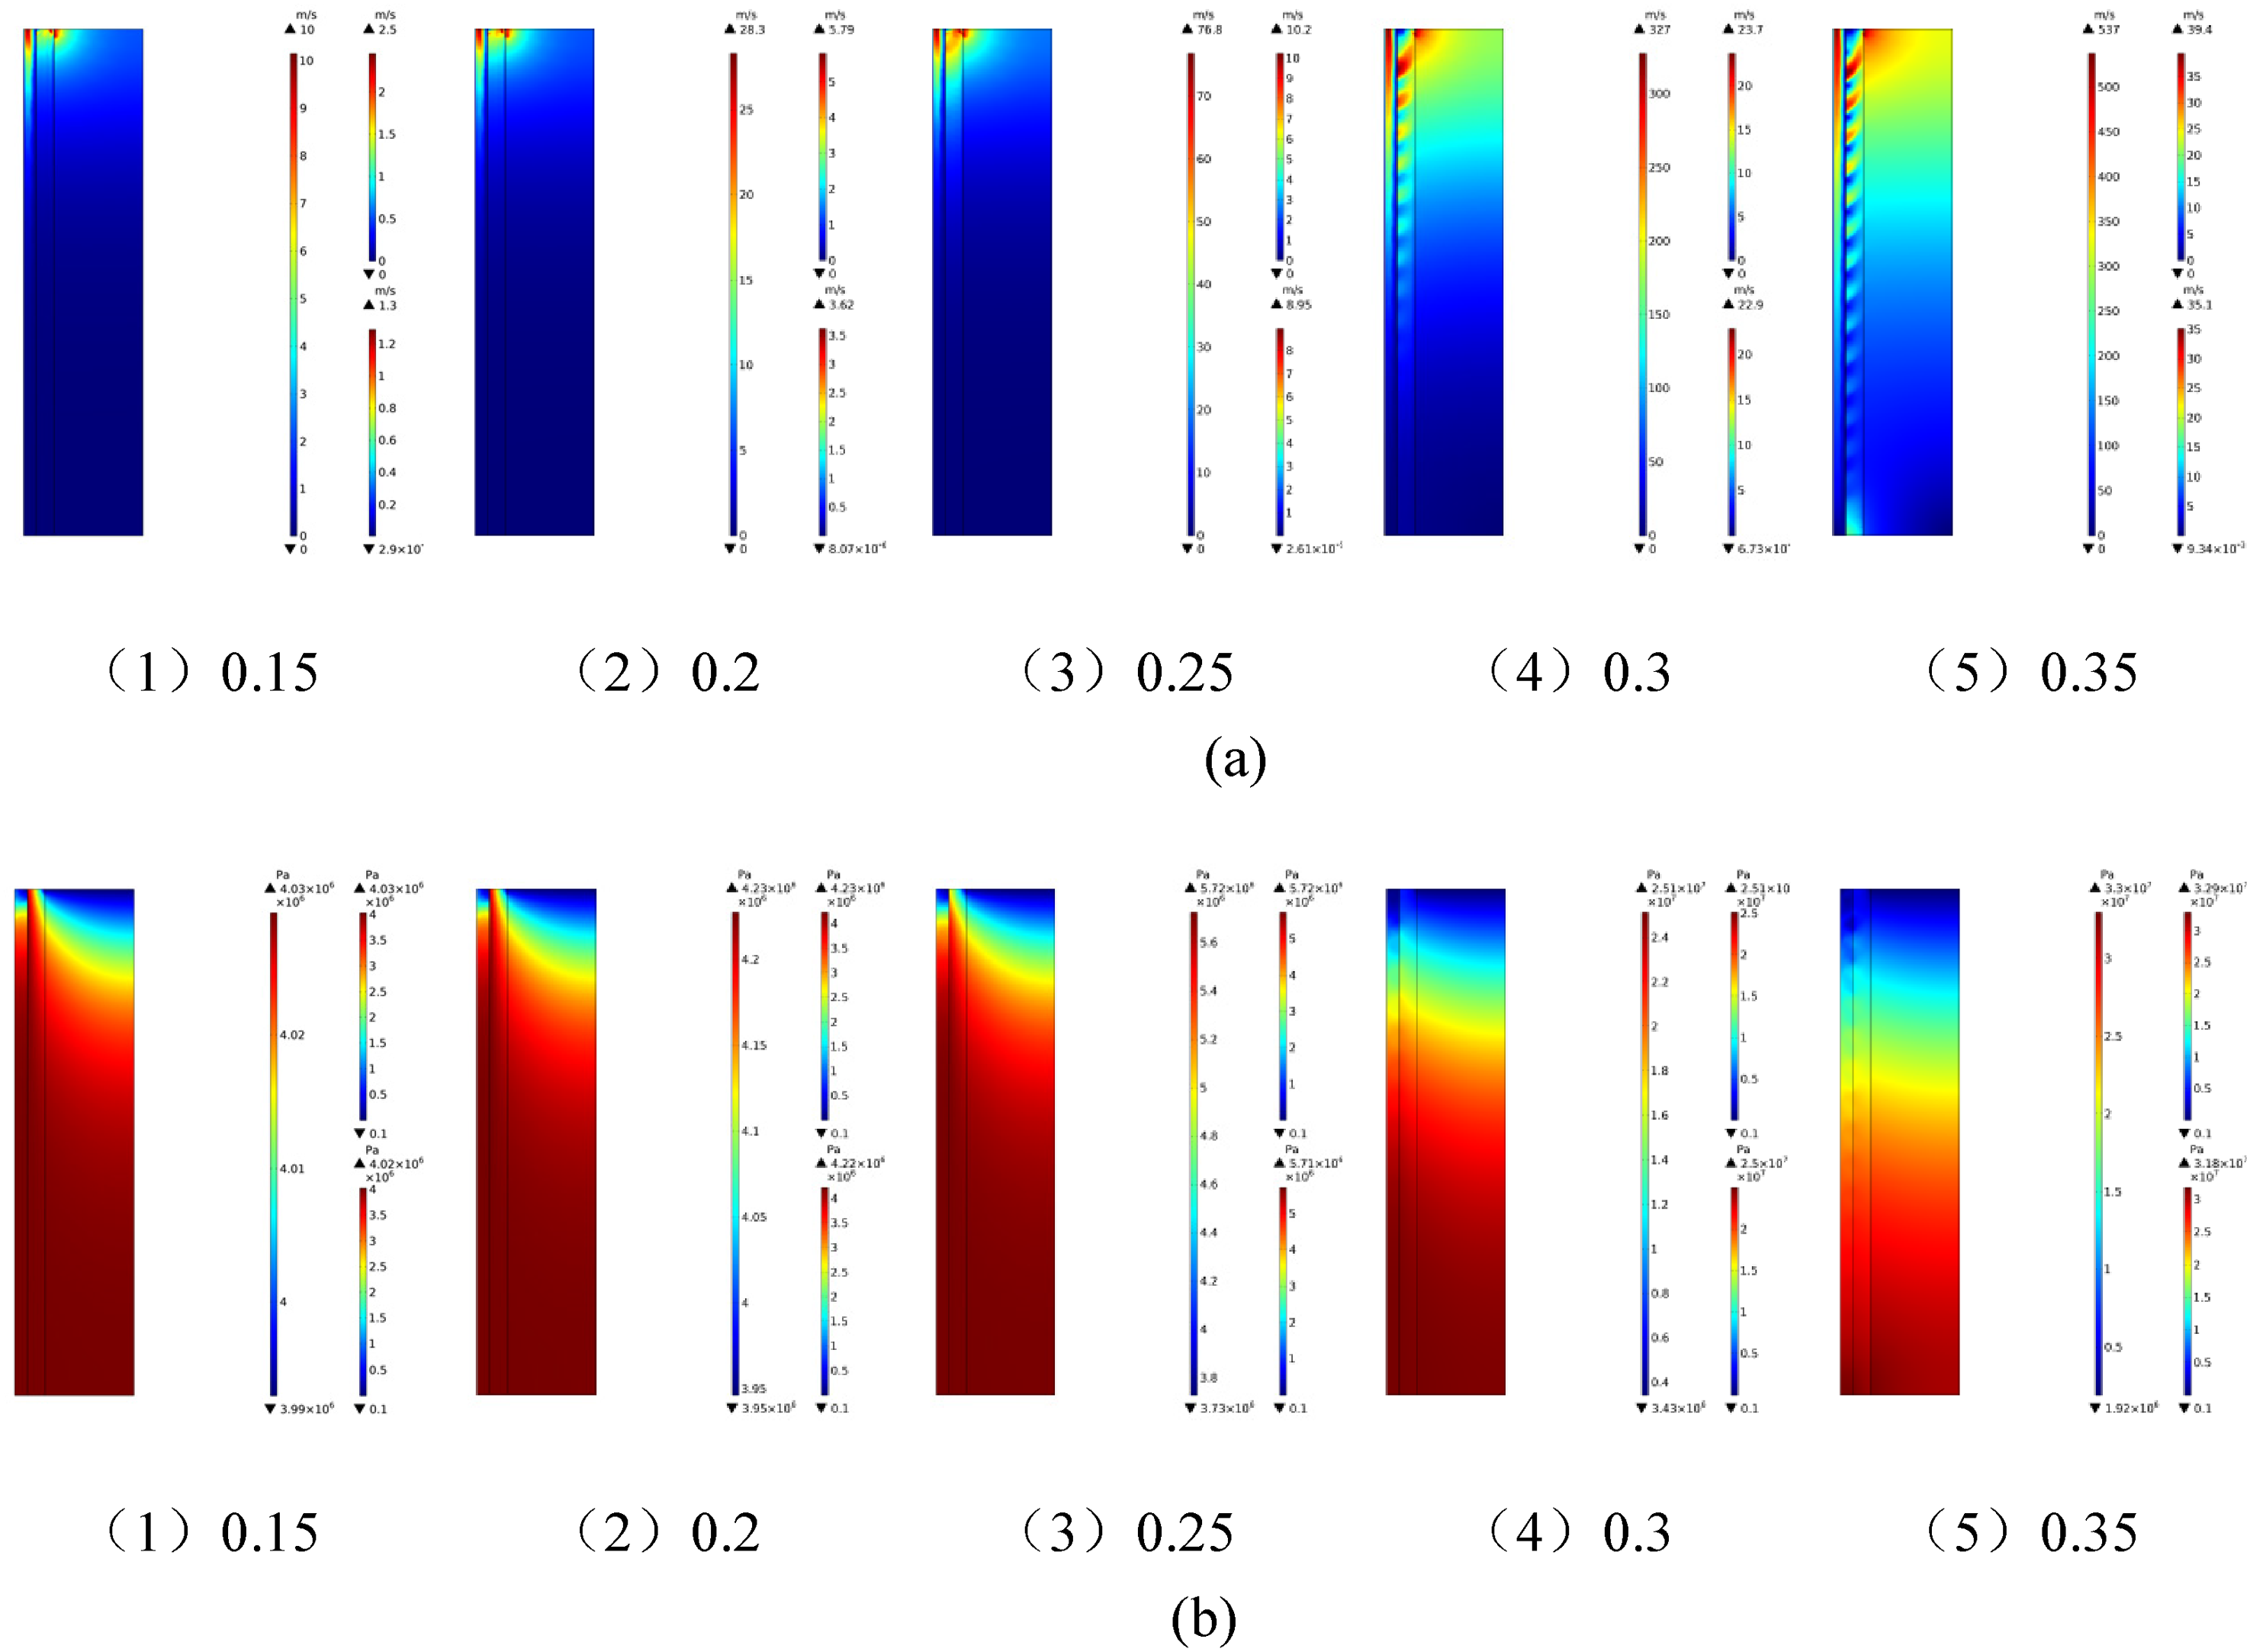
Distribution characteristics of the water velocity and seepage stress with different porosities. (a) Water velocity. (b) Seepage pressure.
Figure 8 shows that as porosity increases, flow velocities in regions A, B, and C rise. For porosity between 0.15 and 0.25, velocity trends remain consistent across regions. However, above 0.3, velocities in regions B and C become more unstable, especially at the coal seam's end, where velocity increases significantly due to boundary conditions and pressure variations. In high-porosity conditions, the velocity increase in region B is particularly pronounced, leading to uneven vortices and intensified turbulence. This results in discontinuous pressure variations at the regions B–C interface, with a reduced stable pore water pressure zone as water flow influence expands.
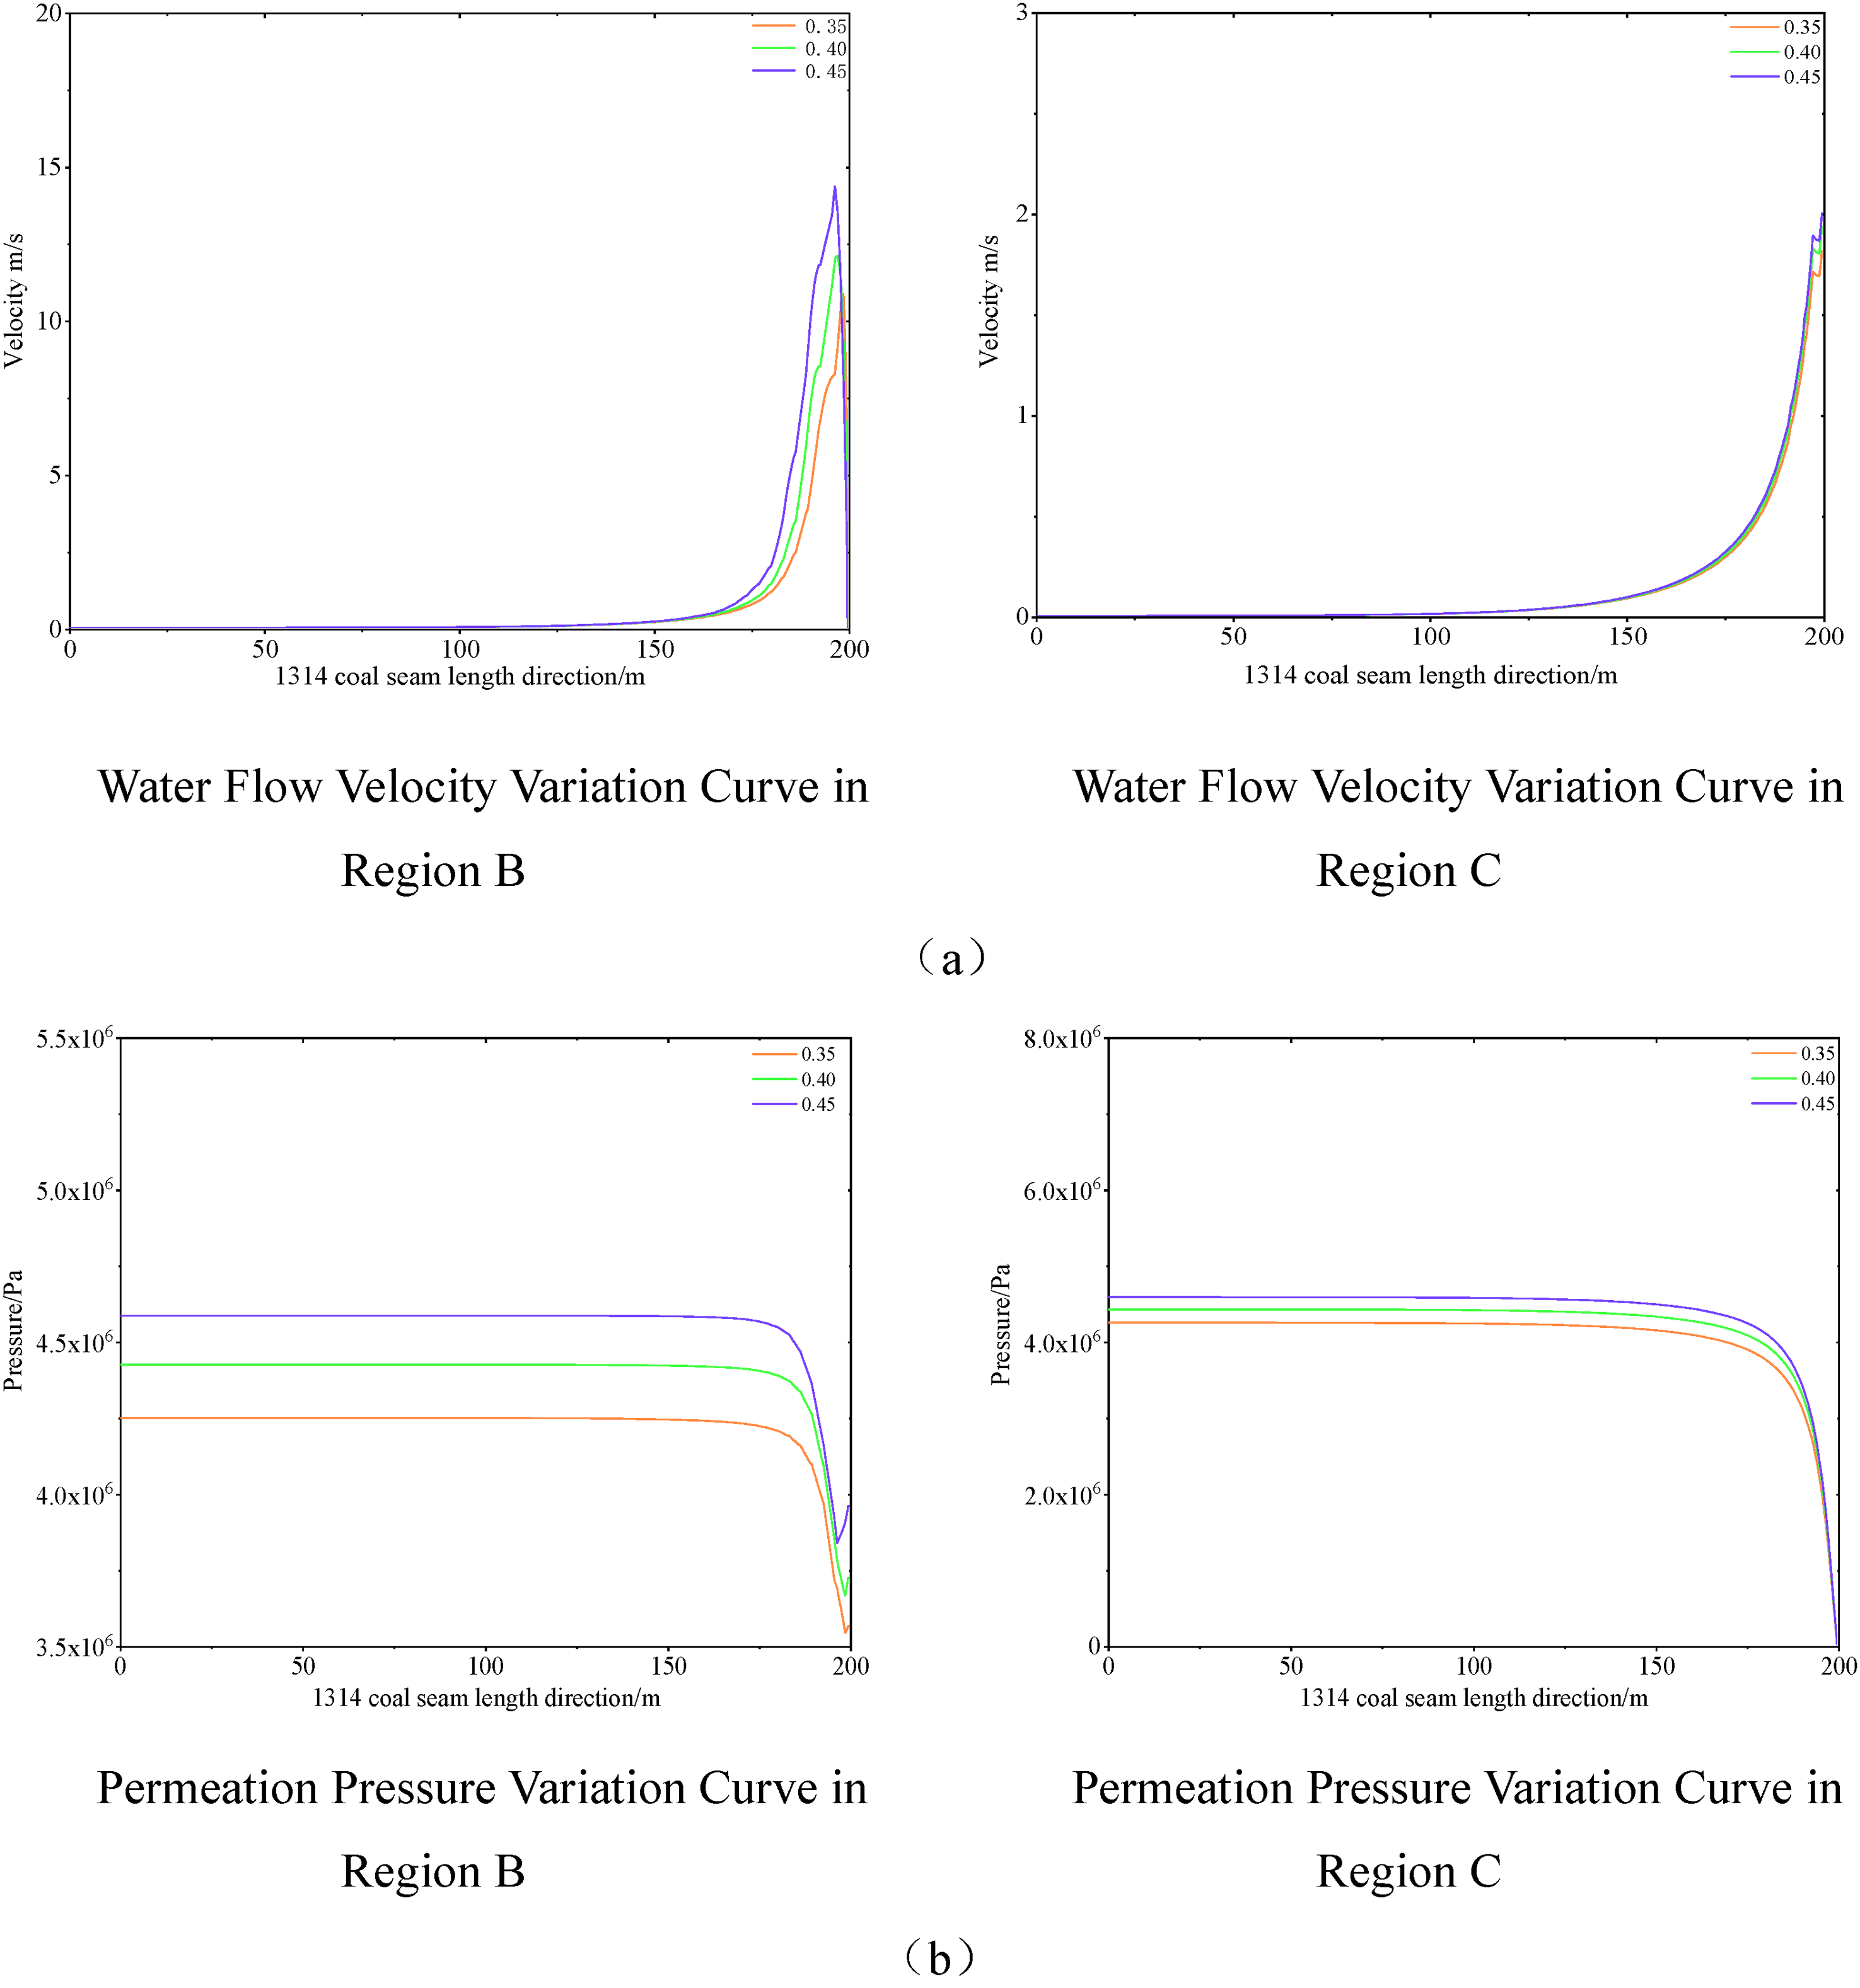
Figure 9(a) shows that as porosity increases, the fluid velocity in regions B and C rises, with region B experiencing a sharper increase due to its higher sensitivity to porosity changes, making it prone to complex flow patterns. In contrast, region C exhibits a more gradual increase in velocity and maintains a more stable flow. Figure 9(b) indicates that pressure decreases with increasing porosity, with a more significant drop at the seam's end. Pressure in region B is higher than in region C, and porosity has a greater impact on pressure in region B, where the pressure decline is steeper. In region C, the pressure curves are closer, indicating that porosity changes have a smaller effect on pressure.
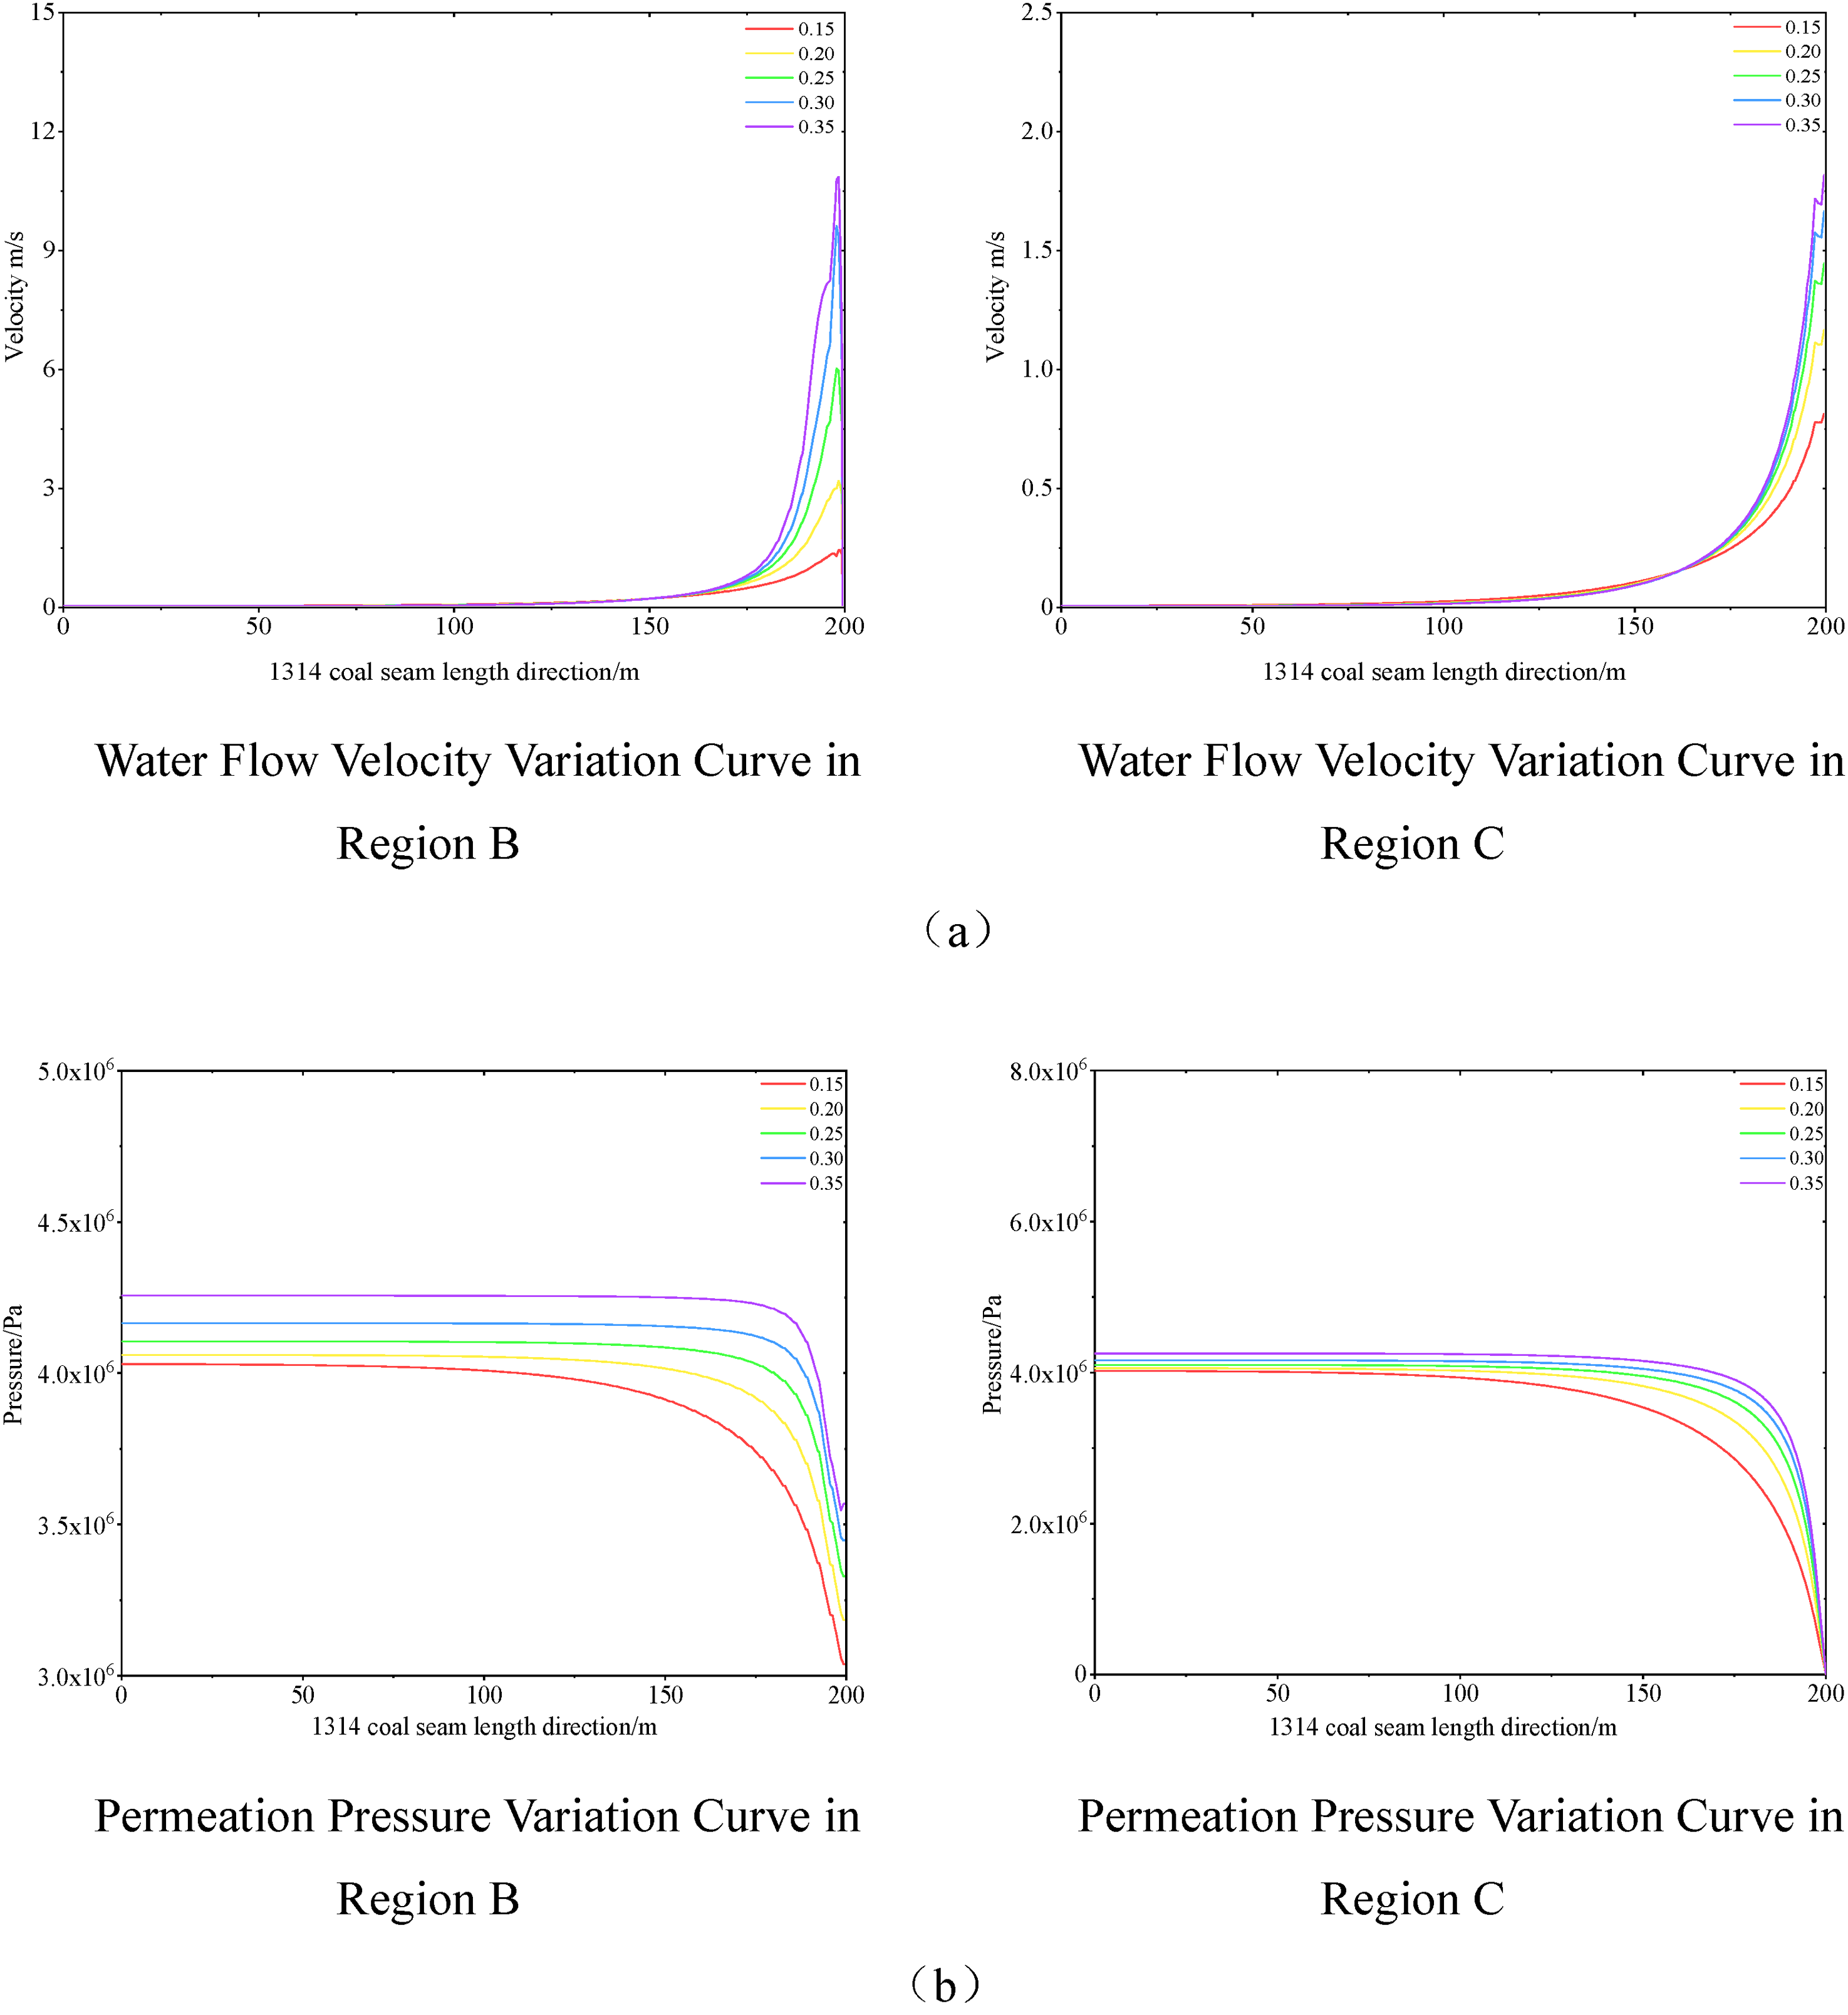
Changing curve of water velocity and seepage stress with different porosity. (a) Water flow velocity variation curve. (b) Permeability pressure variation curve.
As porosity increases, both fluid velocity and pressure within the coal body rise significantly, especially under high porosity, where fluid sensitivity and turbulence increase. Region B is more sensitive to porosity changes, showing greater variations in velocity and pressure, while region C remains more stable. As water inrush continues, the plastic zone may expand, accelerating coal failure. Therefore, coal bodies with higher porosity, lower confining pressure, or greater lateral support from the goaf should be closely monitored for the potentially destructive effects of water inrush on stability.
Figure 10 shows that as porosity increases, flow velocity rises in regions A and C. In region C, velocity increases exponentially with porosity, while in region A, it increases gradually. In region B, the velocity remains nearly unchanged, possibly due to porosity approaching saturation. When the porosity in region B is fixed at 0.3, changes in region C's porosity have little effect on overall pressure, with no significant variations in pressure contours. However, when the porosity difference between regions B and C is large, pressure in region B becomes discontinuous, especially when porosity in region C is low. As porosity in region C decreases, the pressure discontinuity between the regions becomes more pronounced.
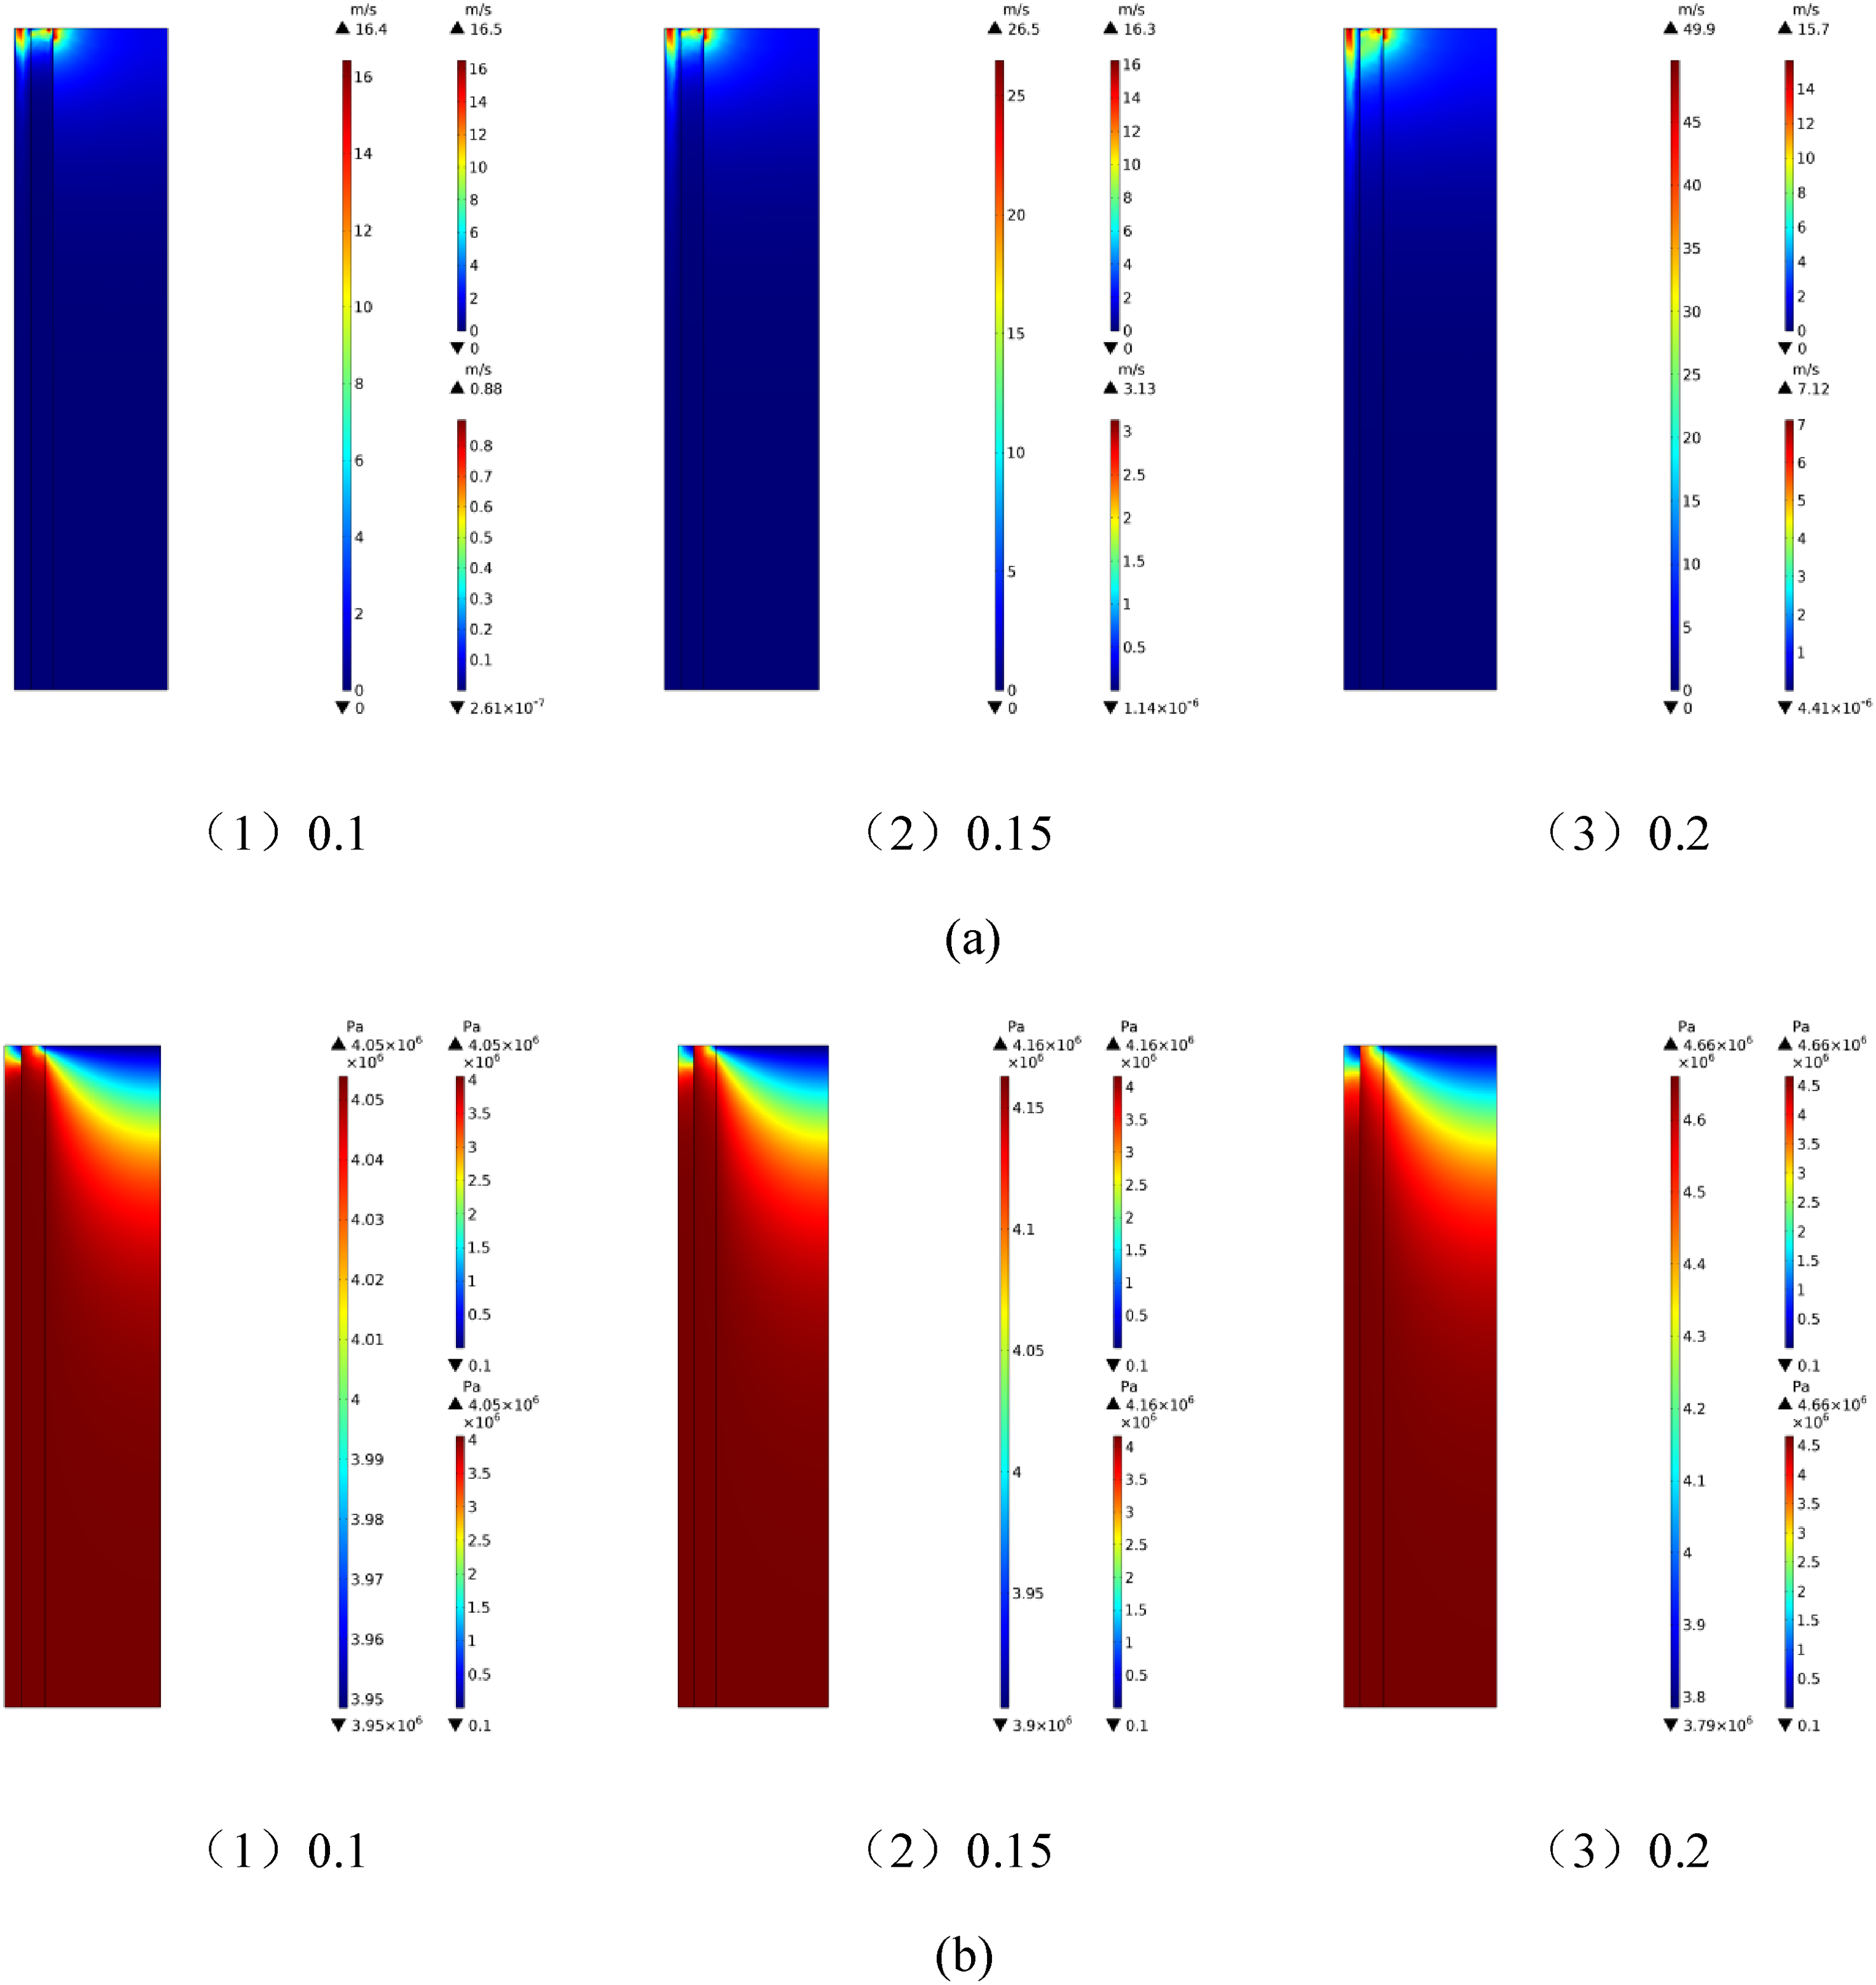
Distribution characteristics of water velocity and seepage stress in region B with the same porosity and region C with different porosity. (a) Water velocity. (b) Seepage pressure.
In summary, porosity significantly affects flow velocity in regions A and C, especially in region C, where velocity increases sharply with porosity. In contrast, velocity in region B remains stable. Regarding pressure distribution, when region B's porosity is constant, changes in region C's porosity have little effect on overall pressure. However, a large porosity difference between the regions increases pressure discontinuity, which is closely linked to the magnitude of the porosity difference.
As shown in Figure 11(a), porosity in region C affects pressure differently in regions B and C. In region C, flow rate increases with porosity, while in region B, the flow rate not only rises but is less sensitive to changes in porosity. However, the increase in flow rate is more pronounced in region B than in region C, suggesting a buffering effect on pressure changes. Figure 11(b) shows that increasing porosity raises pressure in region C. In contrast, pressure in region B remains stable initially and decreases slightly later, indicating a more independent pressure distribution. Both regions show a complex, nonlinear correlation between pressure and porosity.
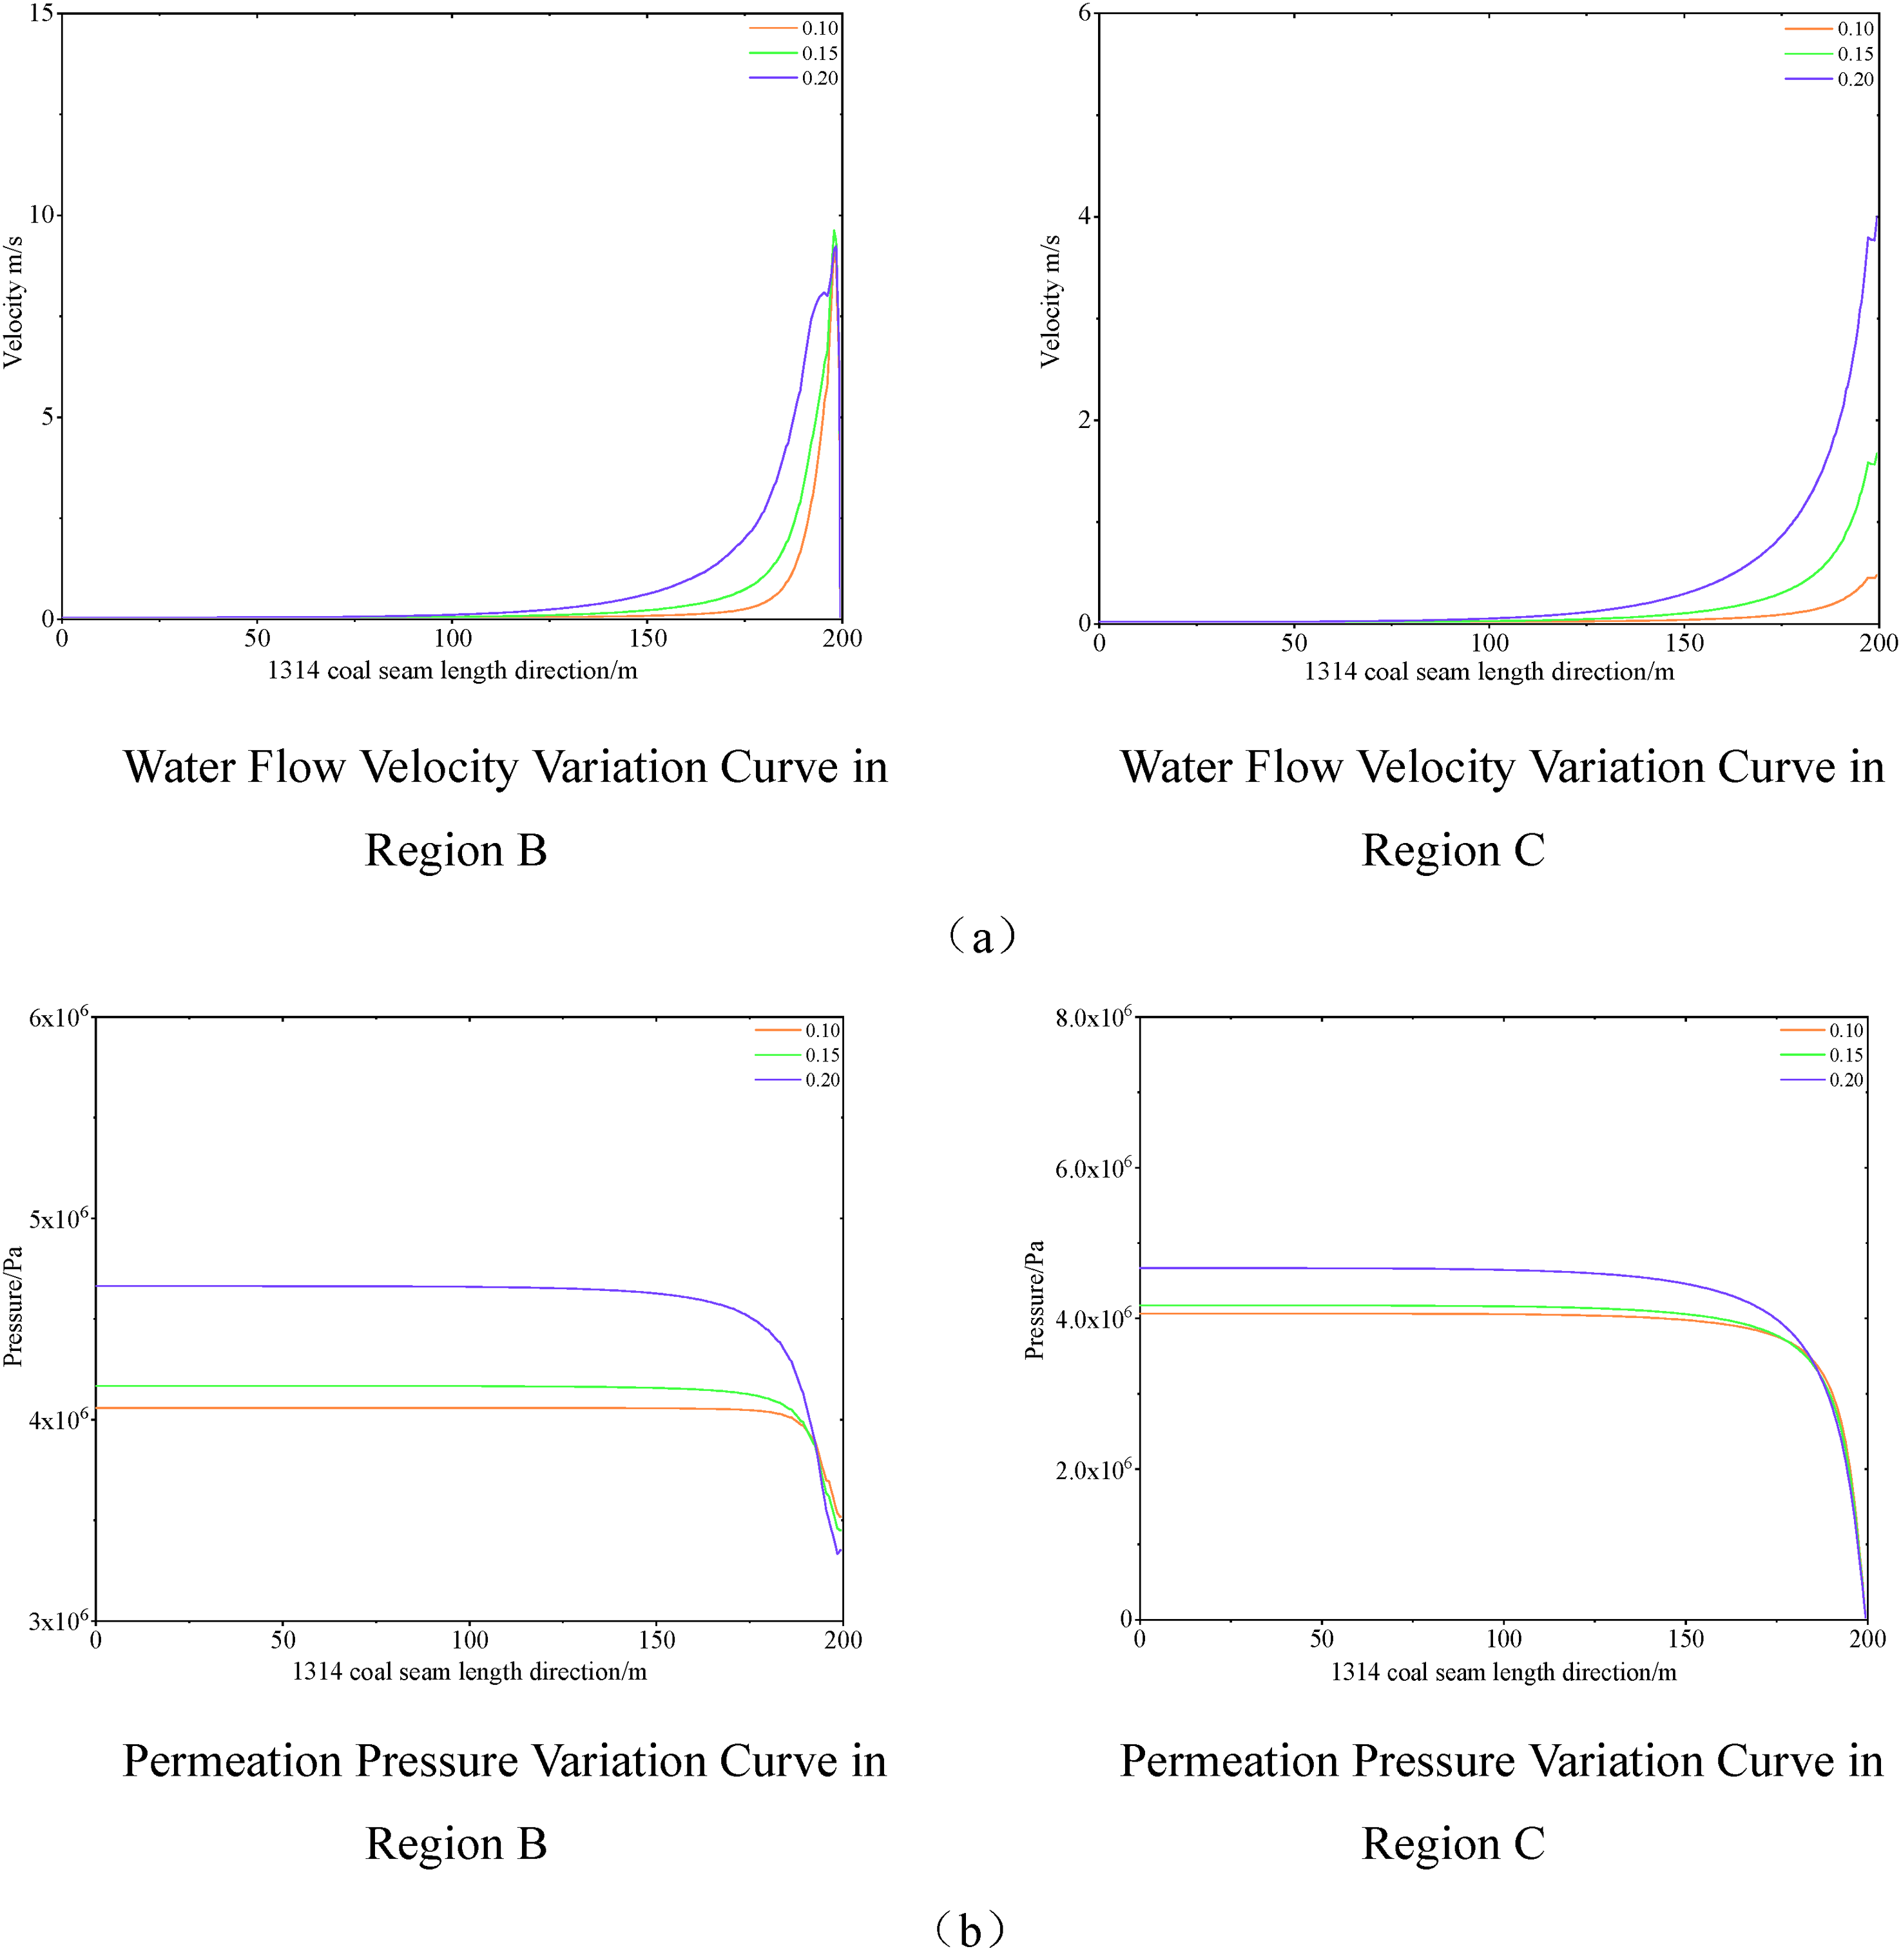
Change curve of water velocity and seepage stress in region C with varying porosity. (a) Water flow velocity variation curve. (b) Permeability pressure variation curve.
In summary, porosity in region C has a clear positive correlation with flow velocity. The flow velocity increases more in region B, indicating its buffering effect on pressure changes. As porosity increases, pressure rises in region C, with a sharp drop in the later section. Pressure variation in region B is minimal, suggesting more independent pressure distribution. Both regions show a nonpositive correlation between pressure and porosity, with pressure discontinuities increasing significantly when the porosity difference between regions is large, indicating uneven porosity influence.
As shown in Figure 12, when porosity in region C remains constant, flow velocity in region B increases with porosity, while velocity in region C remains unchanged. Compared to changes in flow velocity with varying porosity in region C, the velocity in region A shows smaller variation, indicating it is more sensitive to porosity changes in region C. As porosity in region B increases, stress contours and pressure remain stable, suggesting that pressure is not sensitive to porosity changes. A significant discontinuity in velocity and pressure still exists at the boundary between regions B and C.
Distribution characteristics of water velocity and seepage stress in region C with the same porosity and region B with different porosity. (a) Water velocity. (b) Seepage pressure.
Figure 13(a) shows that as porosity in region B increases, flow velocity rises, while changes in region C's velocity remain minimal, indicating region C's independence from region B. Figure 13(b) shows that increased porosity in region B raises its pressure significantly, with little effect on pressure in region C.
Change curve of water velocity and seepage stress in region B with varying porosity. (a) Water flow velocity variation curve. (b) Permeability pressure variation curve.
In summary, porosity changes in region B significantly affect its own flow velocity and pressure, especially in the coal seam's latter section, while region C remains stable, resisting upstream variations and maintaining independent pressure and flow.
To further analyze the mechanical characteristics and water-soaking effect of the 28-m water-soaked coal pillar at the 1314 working face of Xiaoyun Coal Mine, a simulation is conducted. The simulation parameters are based on the mechanical tests described in “Engineering background” section, with porosity calculated accordingly. After mining at the 1312 working face, the coal wall in the goaf experiences side pressure, leading to damage in different stages, including natural crack compaction, slow crack expansion, or accelerated crack expansion. As porosity varies with pressure, it is modeled as a pressure-dependent function, using the Terzaghi model (Biot, 1941, Ji et al., 2022, Terzaghi, 1925) to describe the relationship between porosity and effective stress:
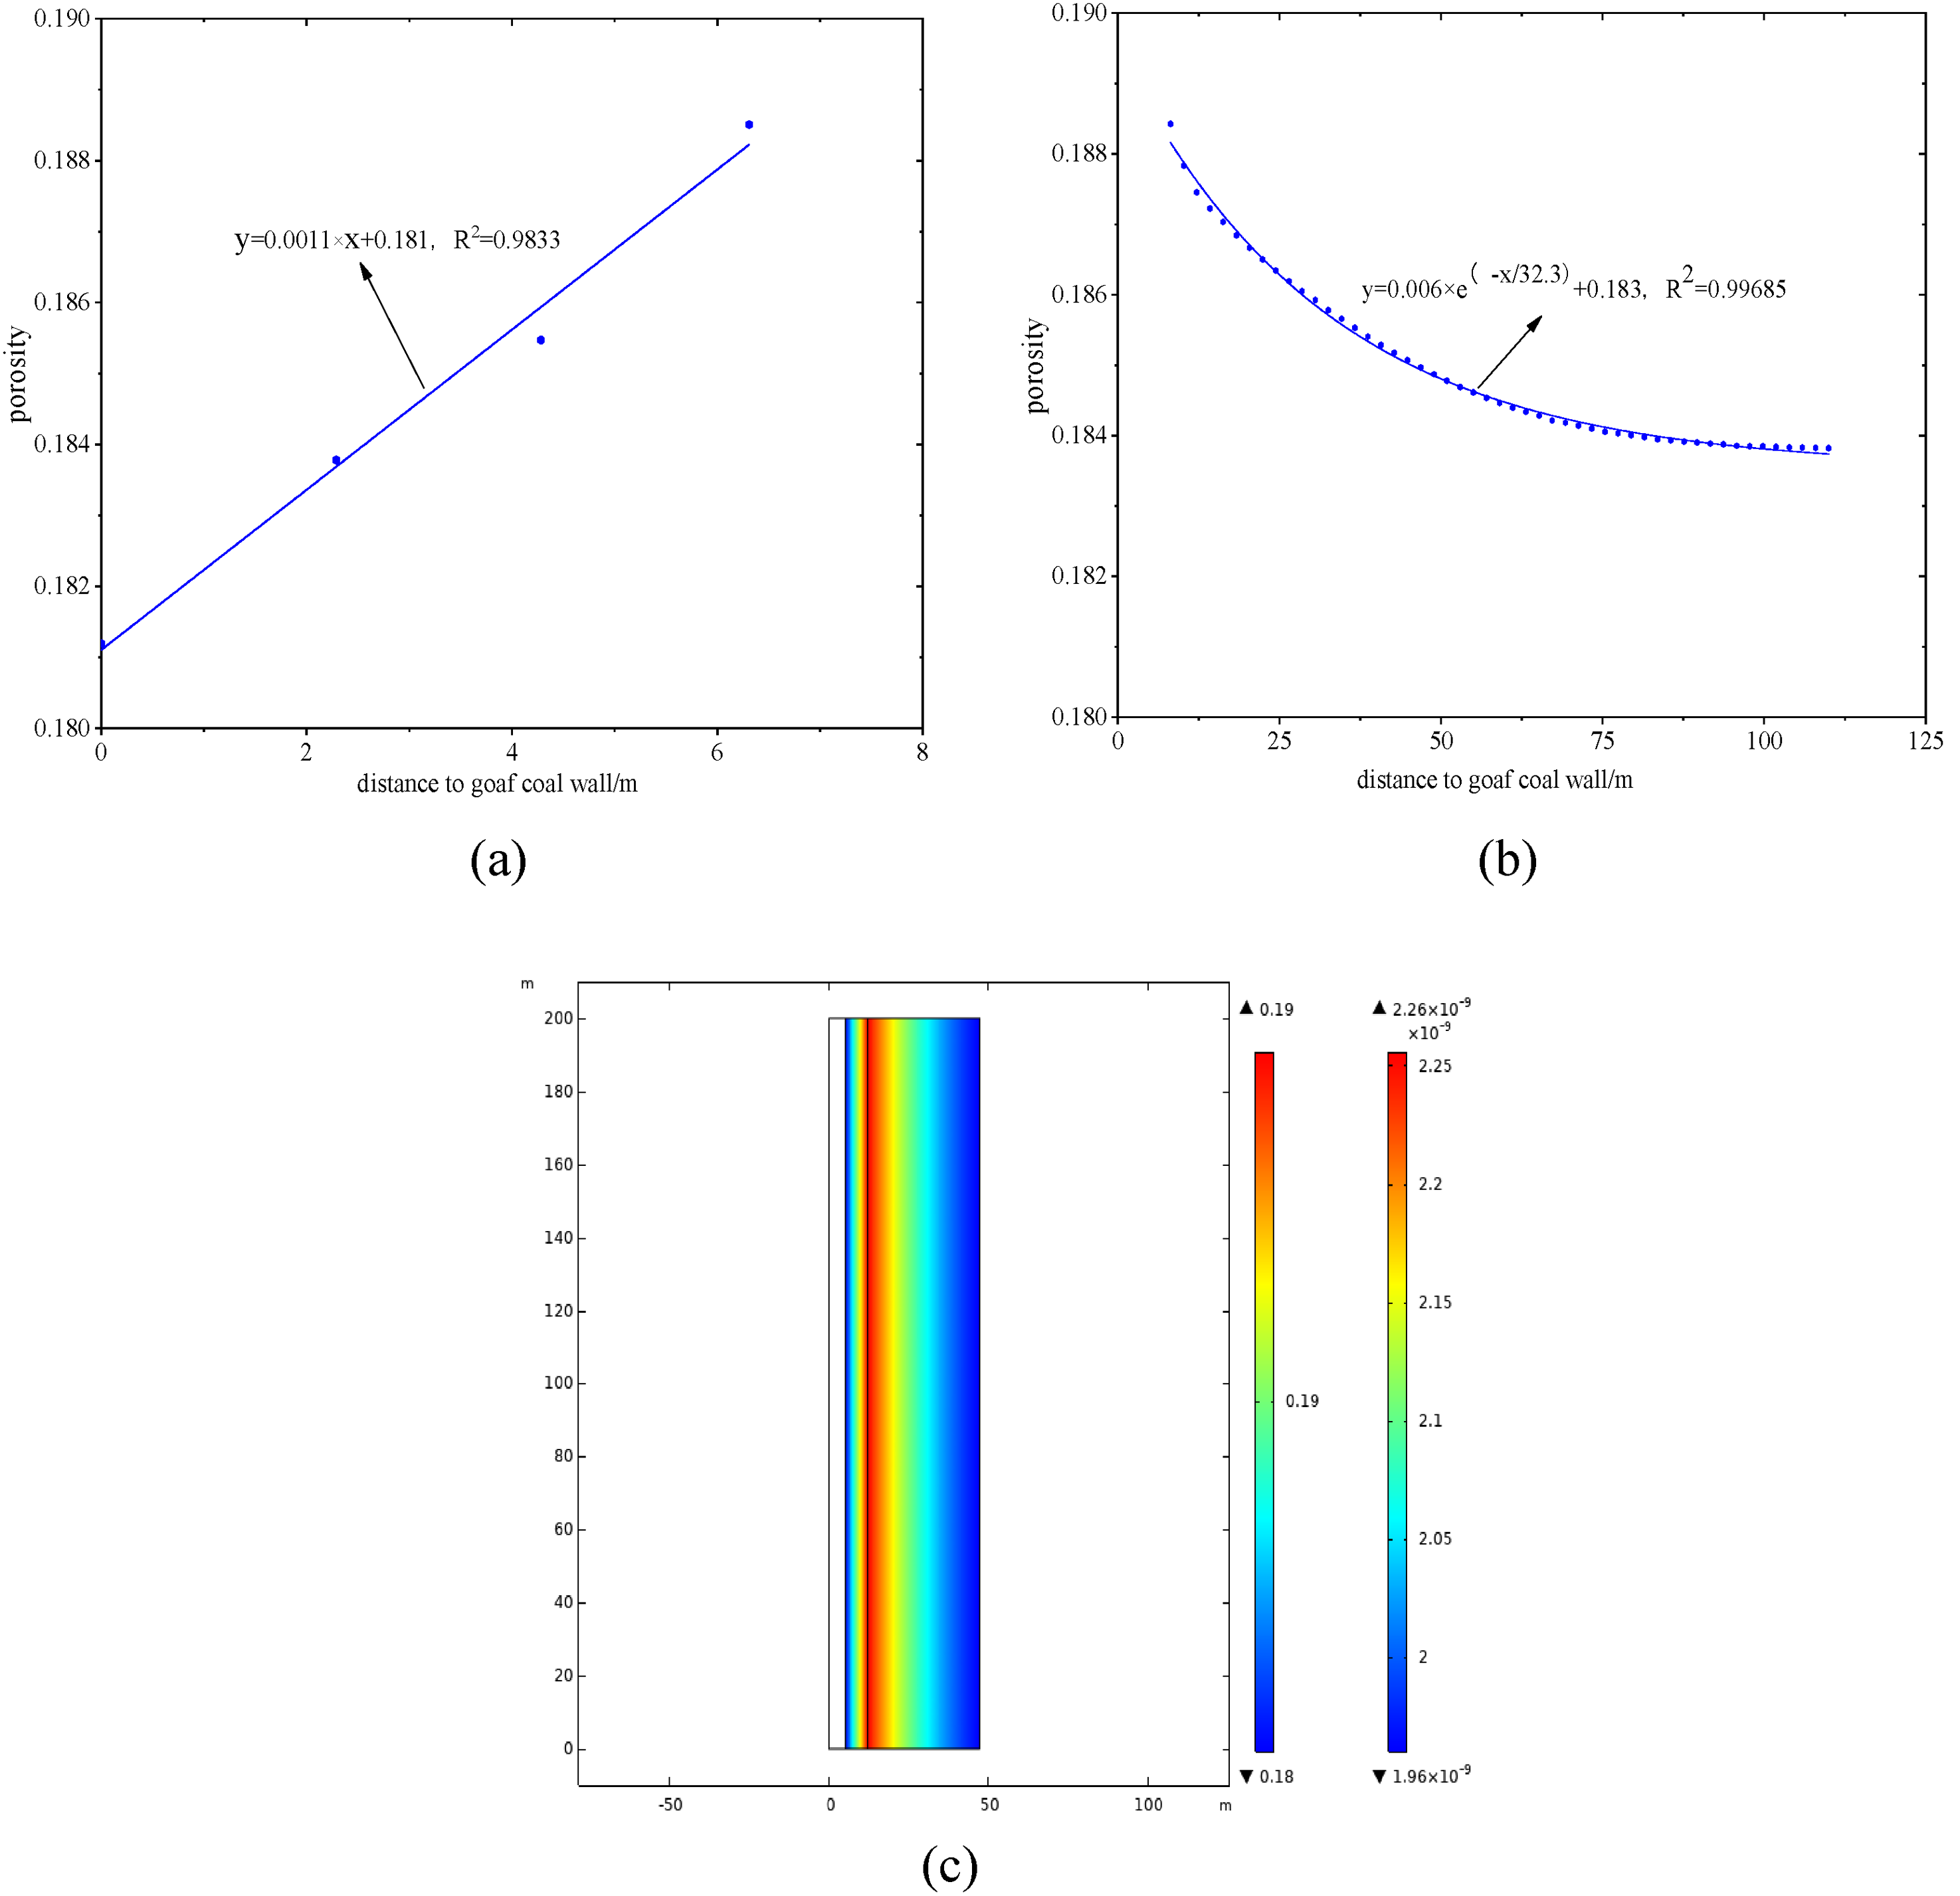
Porosity variation corresponding to the distance from the side wall of the 1312 goaf. Note: The colorbar on the left represents the change of area b, the colorbar on the right represents the change of area c. (a) Variation of porosity in the inelastic zone. (b) Changes of porosity in the elastic zone. (c) Porosity setting.
Permeability was also set as a variable in the simulation, and the seepage characteristics in porous media were described using the Kozeny‒Carman equation (Carman, 1937, Kozeny, 1927), which sets permeability as a function of porosity. The relationship between the porosity and permeability is described as follows: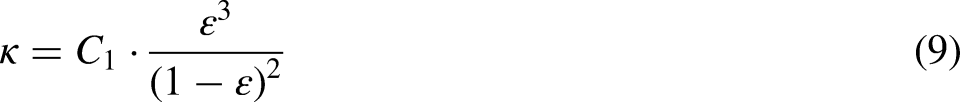
Water inrush effect of coal pillar at 1314 working face. (a) Water velocity. (b) Water velocity contour. (c) Seepage stress. (d) Seepage stress contour.
Figure 15 shows that although the porosity of the 1314 working face is relatively low during the simulation, its influence on water velocity and seepage pressure is larger than in previous simulations. The porosity change function differs between the inelastic and elastic zones, though they intersect at the same porosity value. Mutations at the B and C junctions highlight that fluid impacts the elastic and inelastic zones differently during flooding. Seepage pressure is significantly higher in region B, especially near the main roadway, where pressure changes are more intense, increasing the risk of damage. While the simulation's fixed region boundaries prevent observation of fluid pressure-induced failure transfer, the elastic zone near the main roadway is more likely to transform into a plastic zone under high seepage pressure.
Figure 16 illustrates the water inrush process. Water first flows from the collapse column into the 1312 goaf, then enters the main lane of the 1312 and 1314 working faces, impacting the coal wall near the channel. The coal wall is subjected to water pressure and fluid viscous forces, which increase the pore water pressure. As the water reaches the 1312 goaf, the solid coal at the goaf end blocks further flow, causing the water to primarily seep through the coal and rock, with some flow into old roof cracks. This results in the upper coal body becoming the main flow path. The analysis focuses on the final stage of the water inrush; however, the water injection process is gradual, and water pressure increases slowly. To examine the effect of time on space during the water inrush, water velocity, and seepage pressure were monitored at various points in the 1314 working face, as shown in Figure 17.
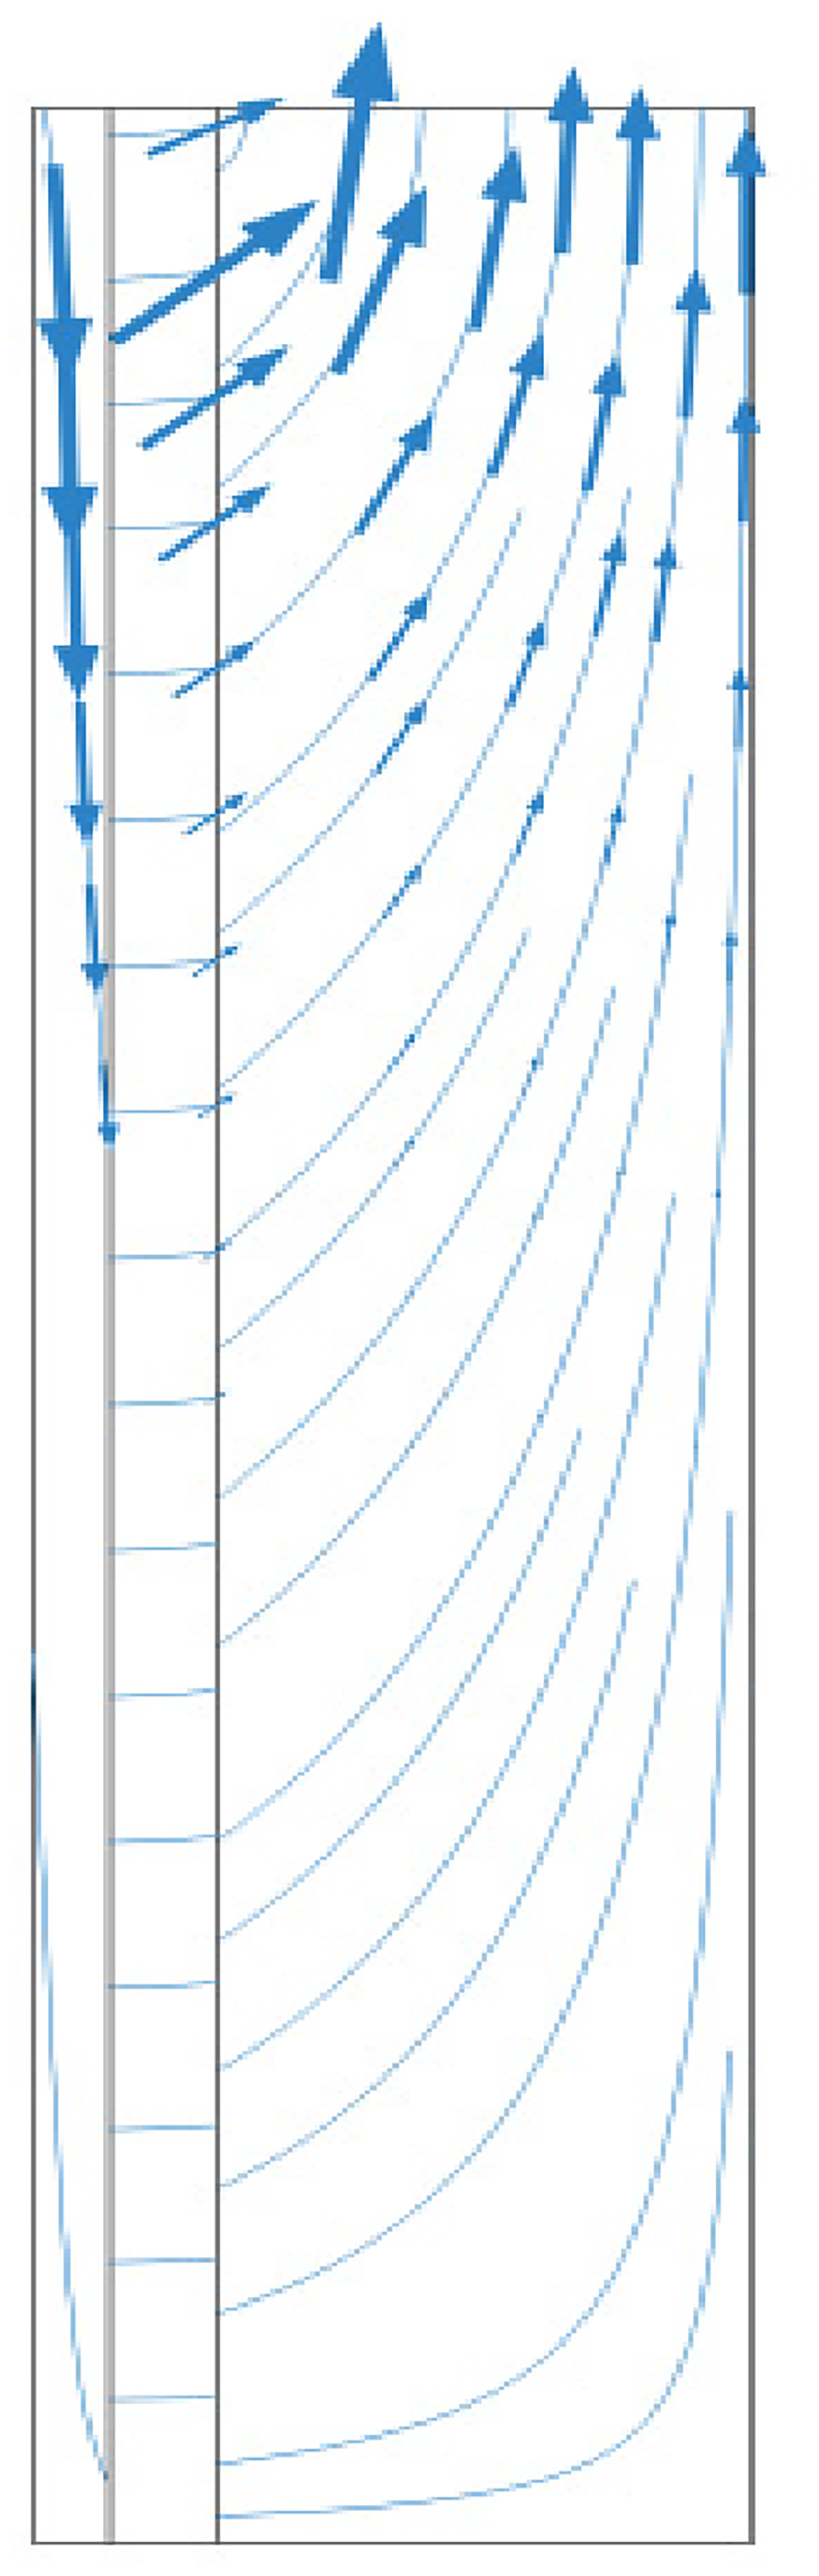
Flow diagram of water inrush.
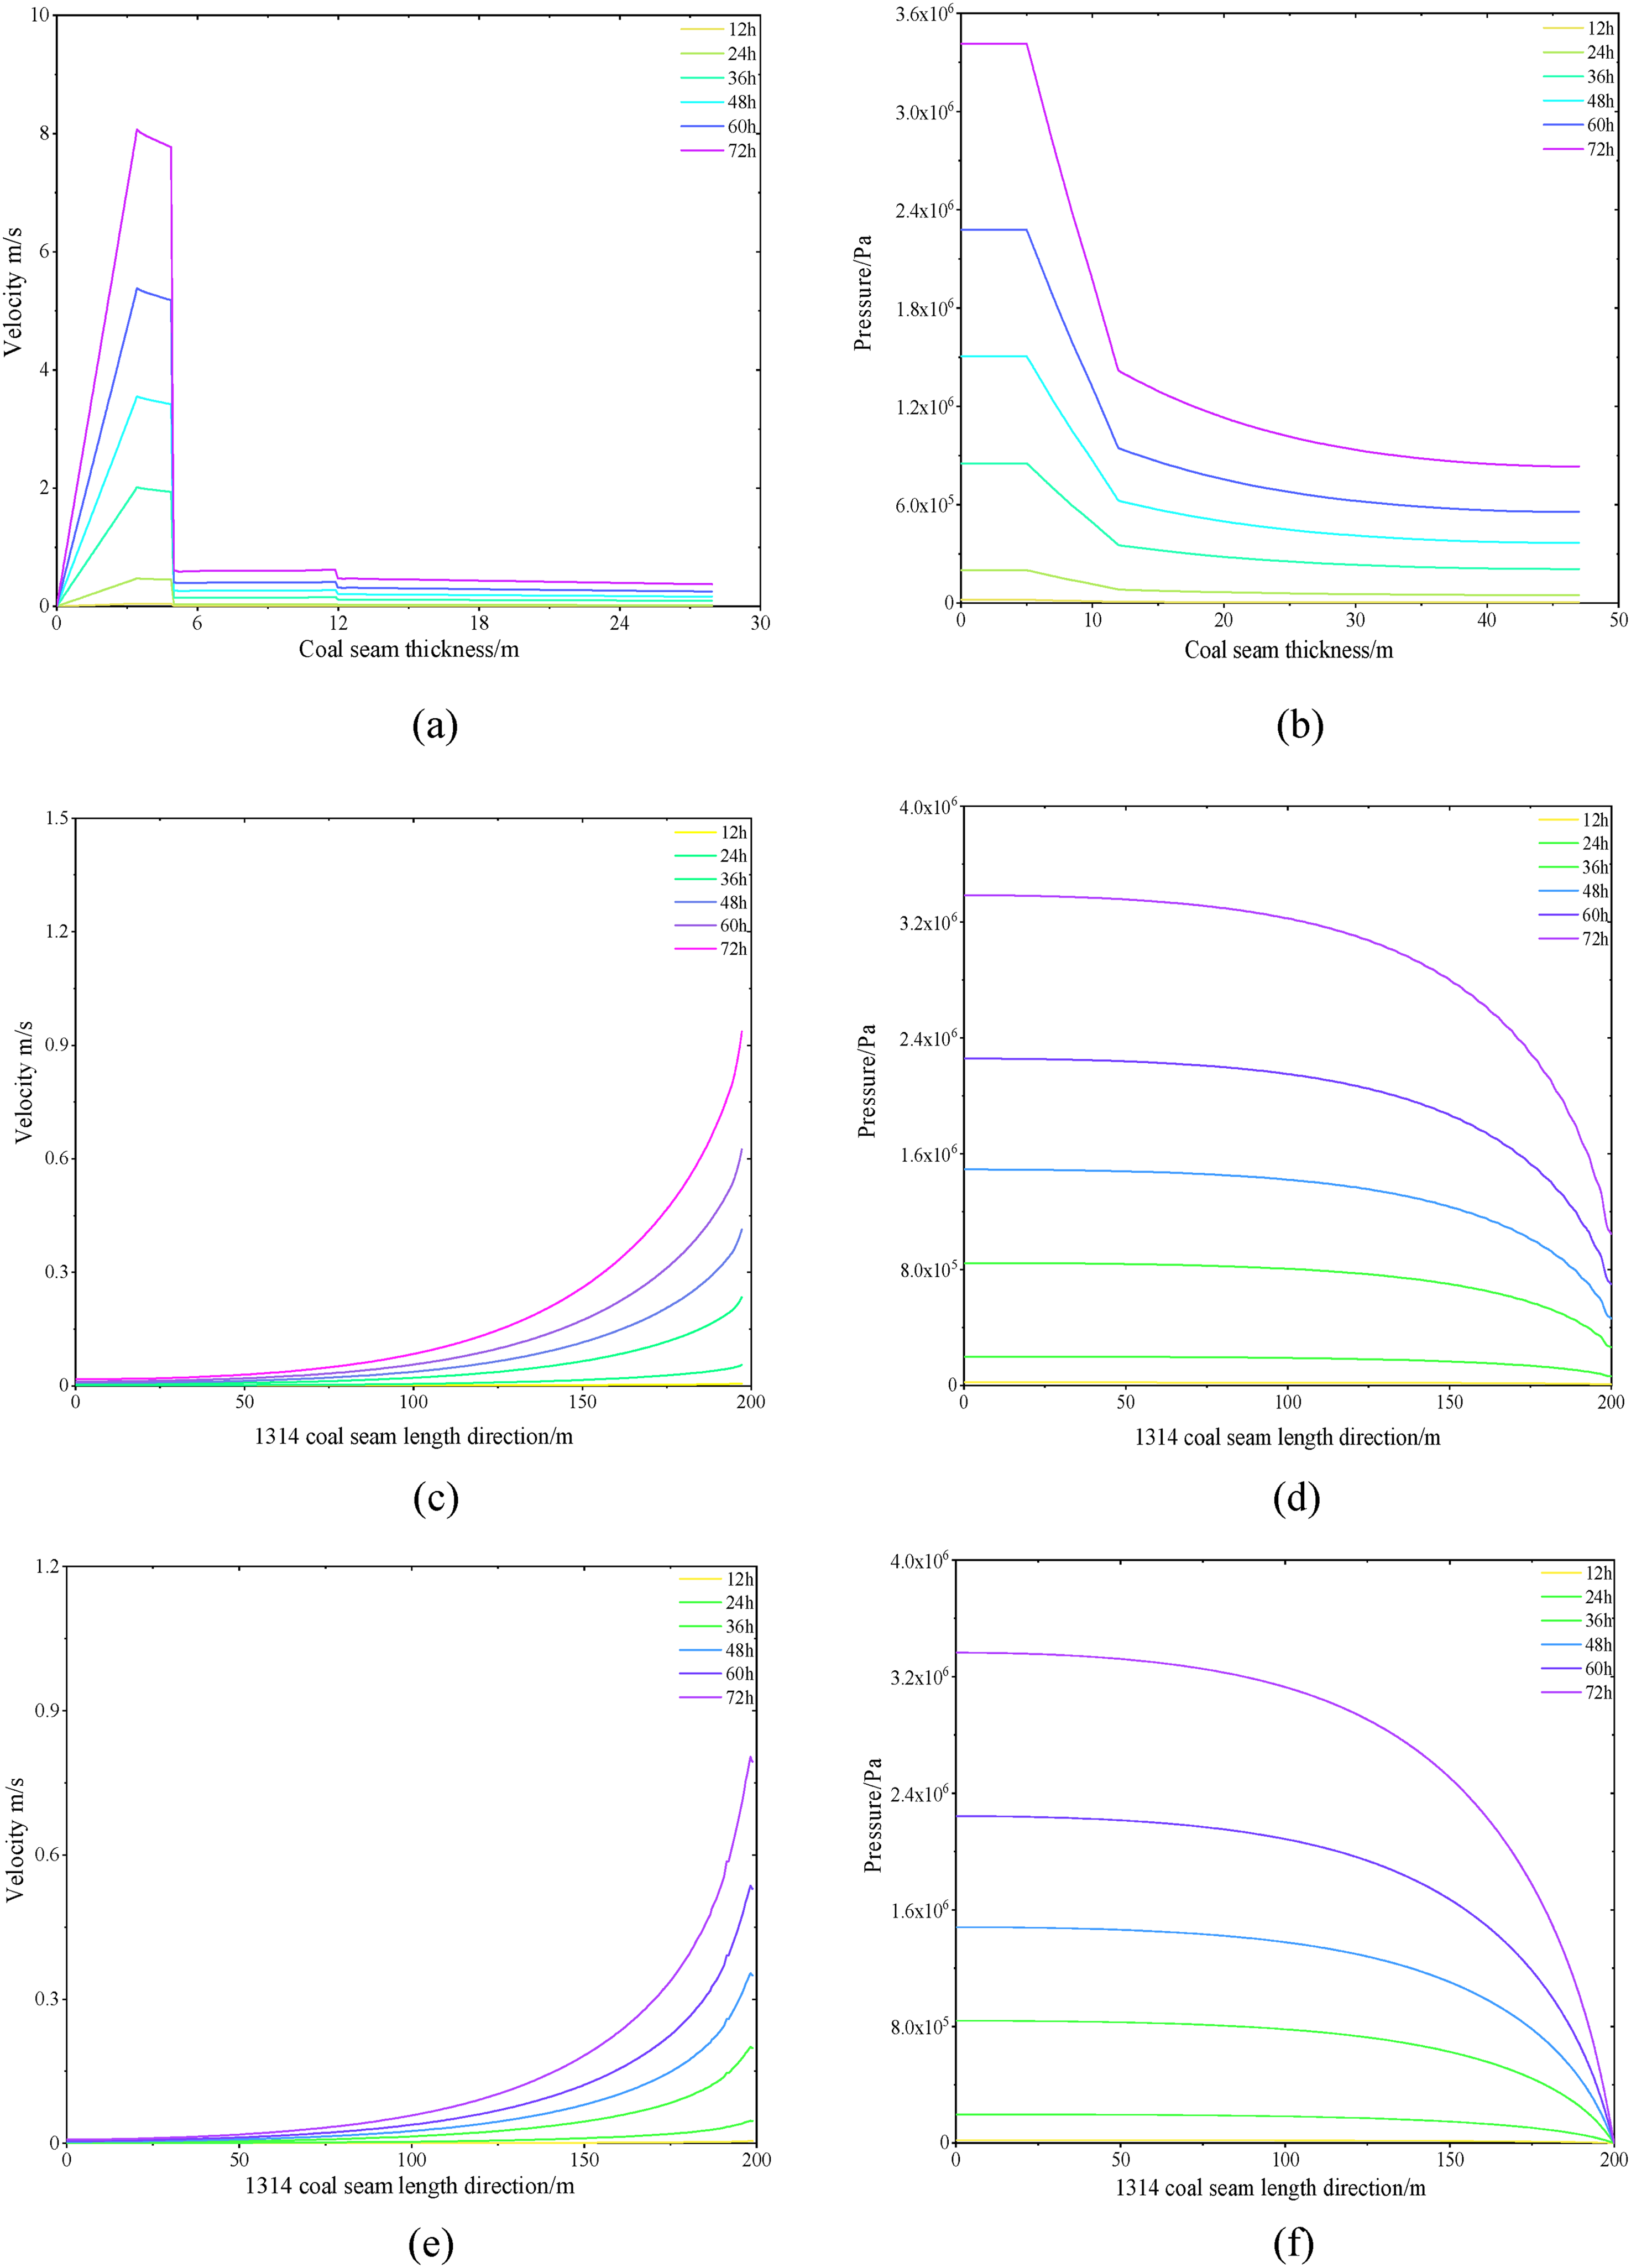
Change curve of water velocity and seepage pressure in different regions. (a) Change curve of water velocity inside coal pillar. (b) Change curve of seepage pressure inside coal pillar. (c) Change curve of water velocity in region B. (d) Change curve of seepage pressure in region B. (e) Change curve of water velocity in region C. (f) Change curve of seepage pressure in region C.
Figure 17 shows that as water inrush and seepage pressure increase, both water velocity and seepage pressure rise in each region. Over time, the differences in water velocity and seepage pressure become more pronounced, with the rate of change at region interfaces accelerating. Therefore, when assessing water inrush in coal mines, it is essential to consider the effect of water inrush duration on the coal wall's stress field, rather than only the seepage pressure under static water pressure in the later stages. This highlights the need for different fluid equations to study regions A and B.
Figure 18 shows the curves of water velocity and seepage pressure in regions B and C over time. As the water inrush duration increases, both water velocity and seepage pressure rise in regions B and C, with region B experiencing a faster increase. This growing difference between the two regions indicates that region B increasingly influences region C, exacerbating damage to the plastic zone and threatening the stability of the coal in the elastic zone. After 72 h, both water velocity and seepage pressure stabilize, with the seepage pressure in region B being roughly double that in region C. This seepage pressure difference is used to analyze the stress field in the coal pillar during mining.
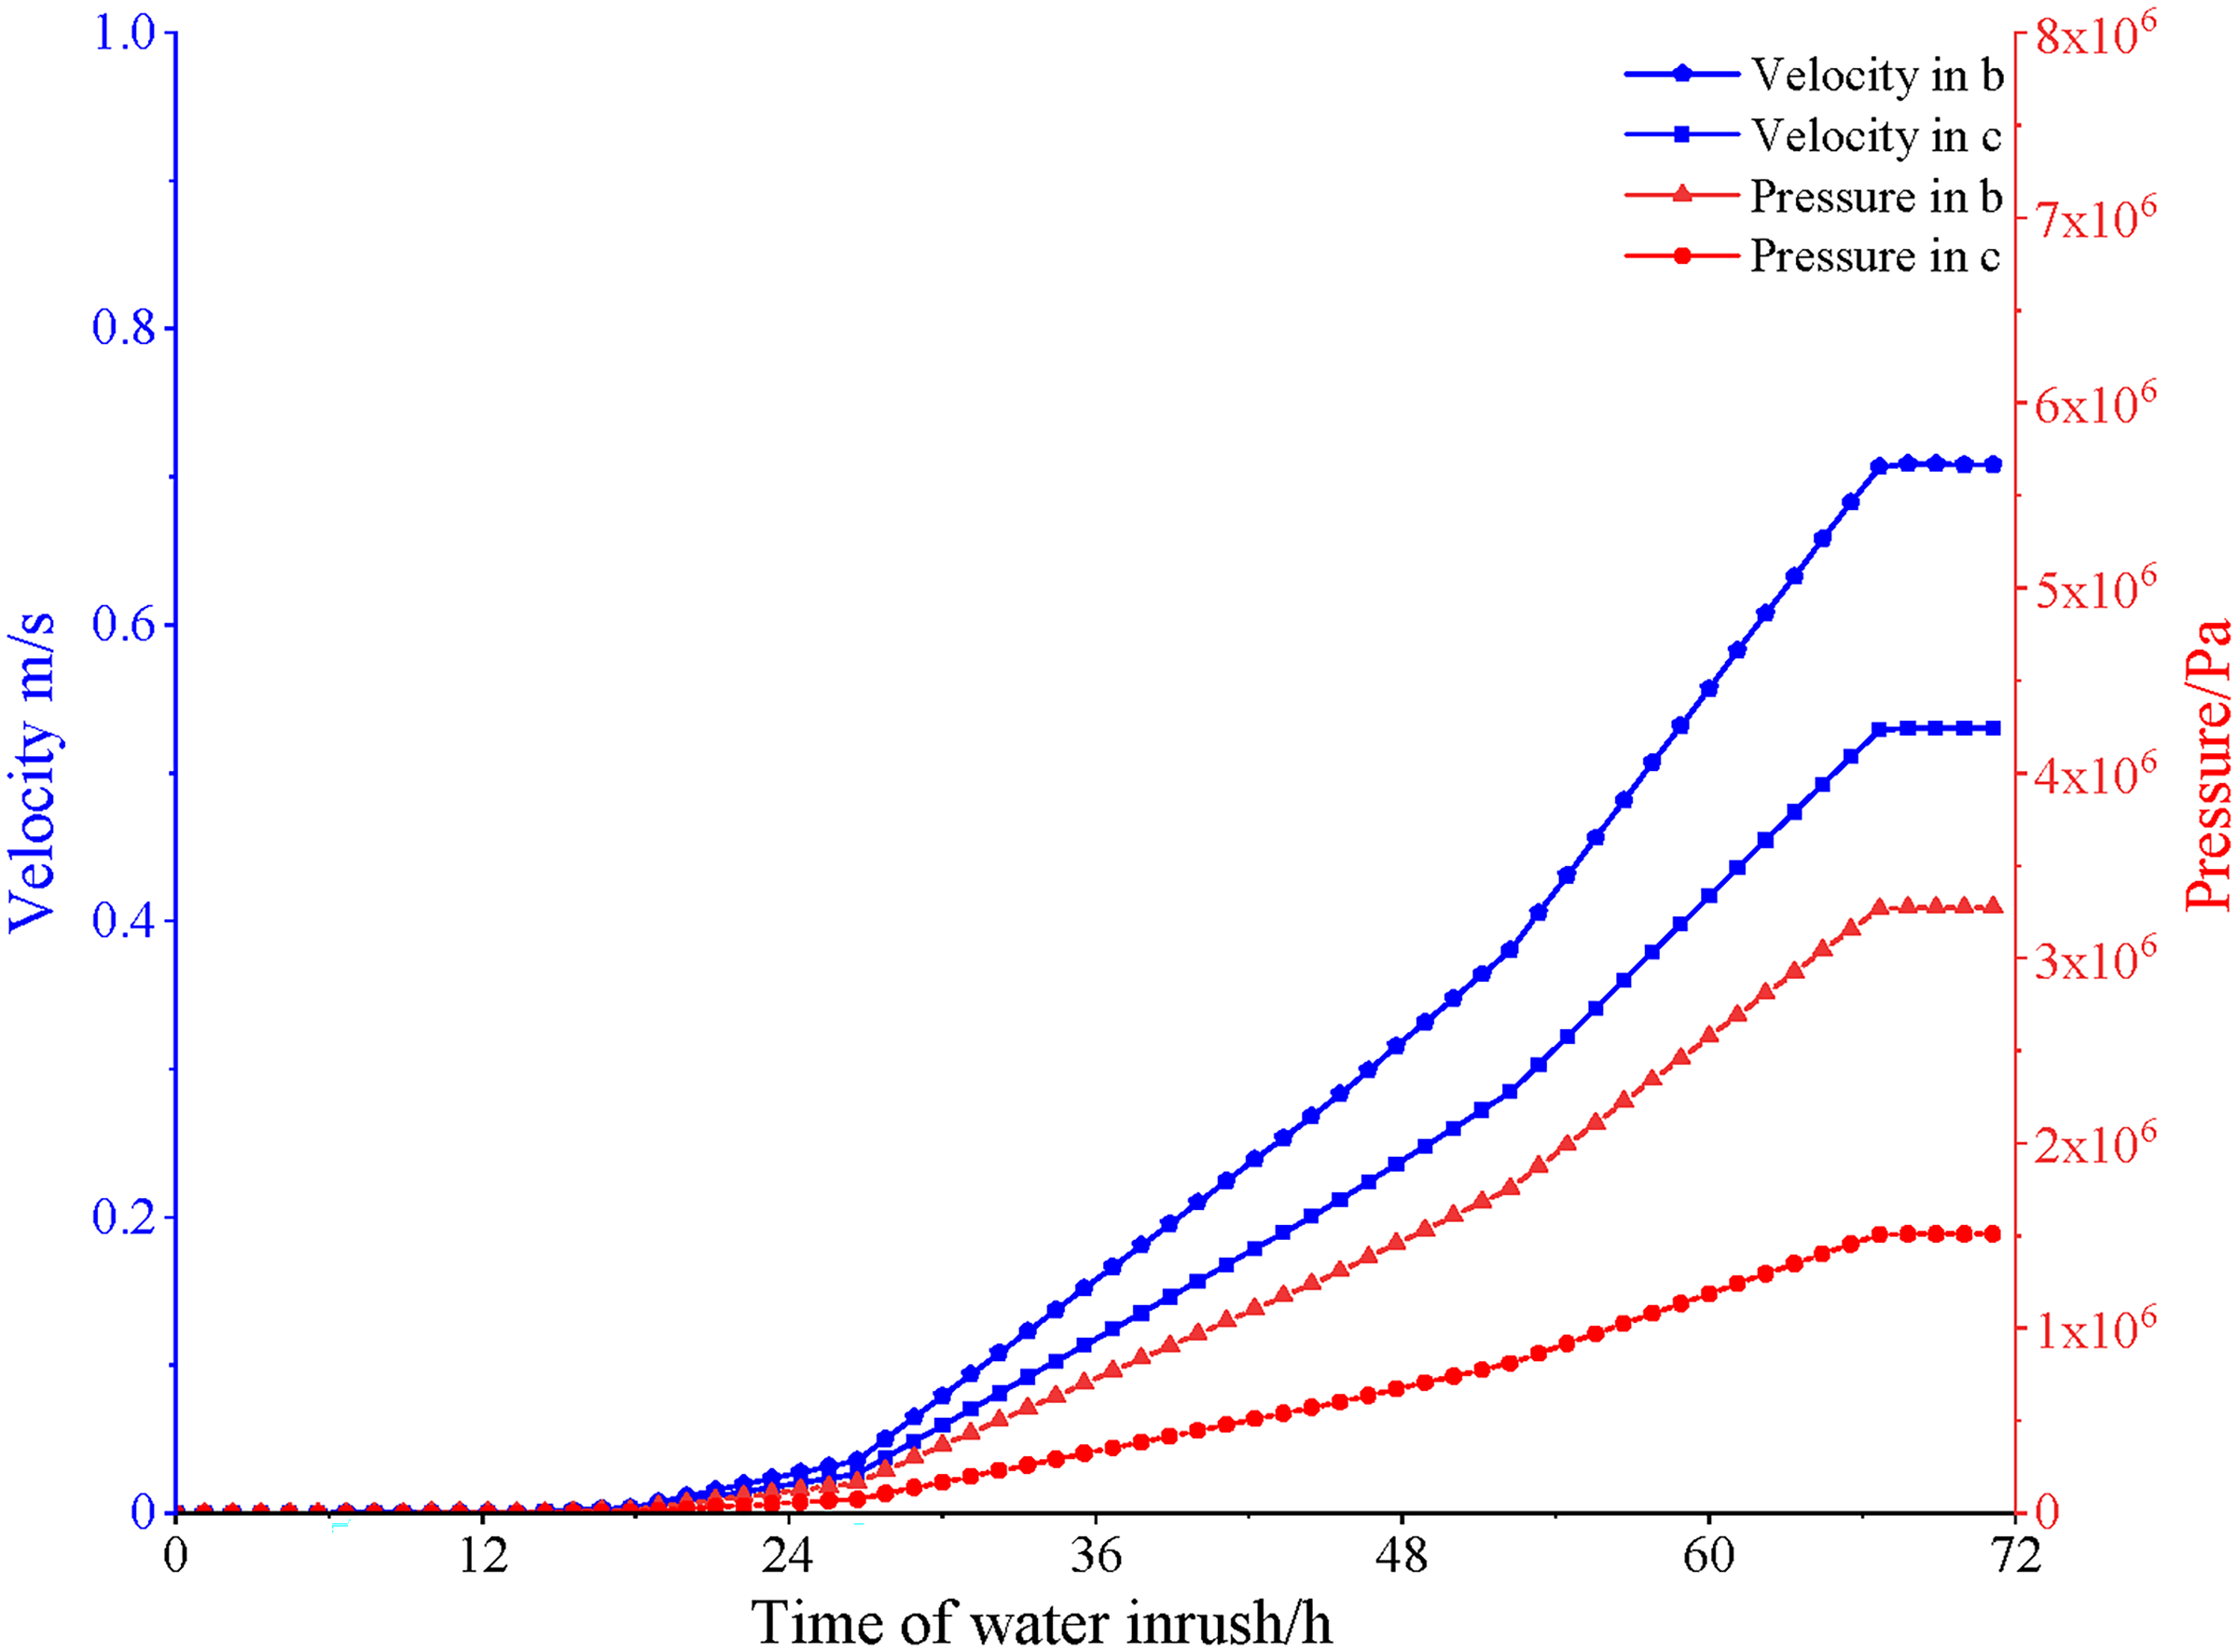
The curve of water velocity and seepage pressure in regions B and C with time of water inrush.
Study on the stability of immersed coal pillar
Based on the research, the seepage pressures in regions B and C differ, leading to varying force characteristics during mining. To study the stability of a water-immersed coal pillar, a fluid–structure coupling model is established. This model uses the effective stress equation to examine how seepage pressure affects solid deformation. Changes in porosity influence fluid flow, which alters pore pressure, affecting the solid's effective stress and causing its deformation. The coupling process is bidirectional.
According to “Effect of water inrush on coal pillar” section, the seepage pressure in regions B and C stabilizes beyond 100 m from the coal pillar, with the 1314 working face extending 1080 m. Therefore, the simulation focuses on the region with stable seepage pressure for practical results. The pore pressure values of regions B and C at 180 m from the coal pillar are used as the initial seepage pressures. A boundary stress of 5 MPa is applied to simulate the lead pressure during mining. Porosities for regions B and C are set separately for the simulations. Darcy's law is used to describe the fluid flow, as the water in the mine has been drained, and the coal pillar is no longer affected by water pressure in the goaf. Figure 19 shows the seepage pressure, vertical stress, and plastic strain during mining, while Figure 20 illustrates the coal pillar failure process.
Stress and deformation nephogram of coal pillar during the mining stage. (a) Seepage pressure. (b) Vertical stress. (c) Plastic strain.
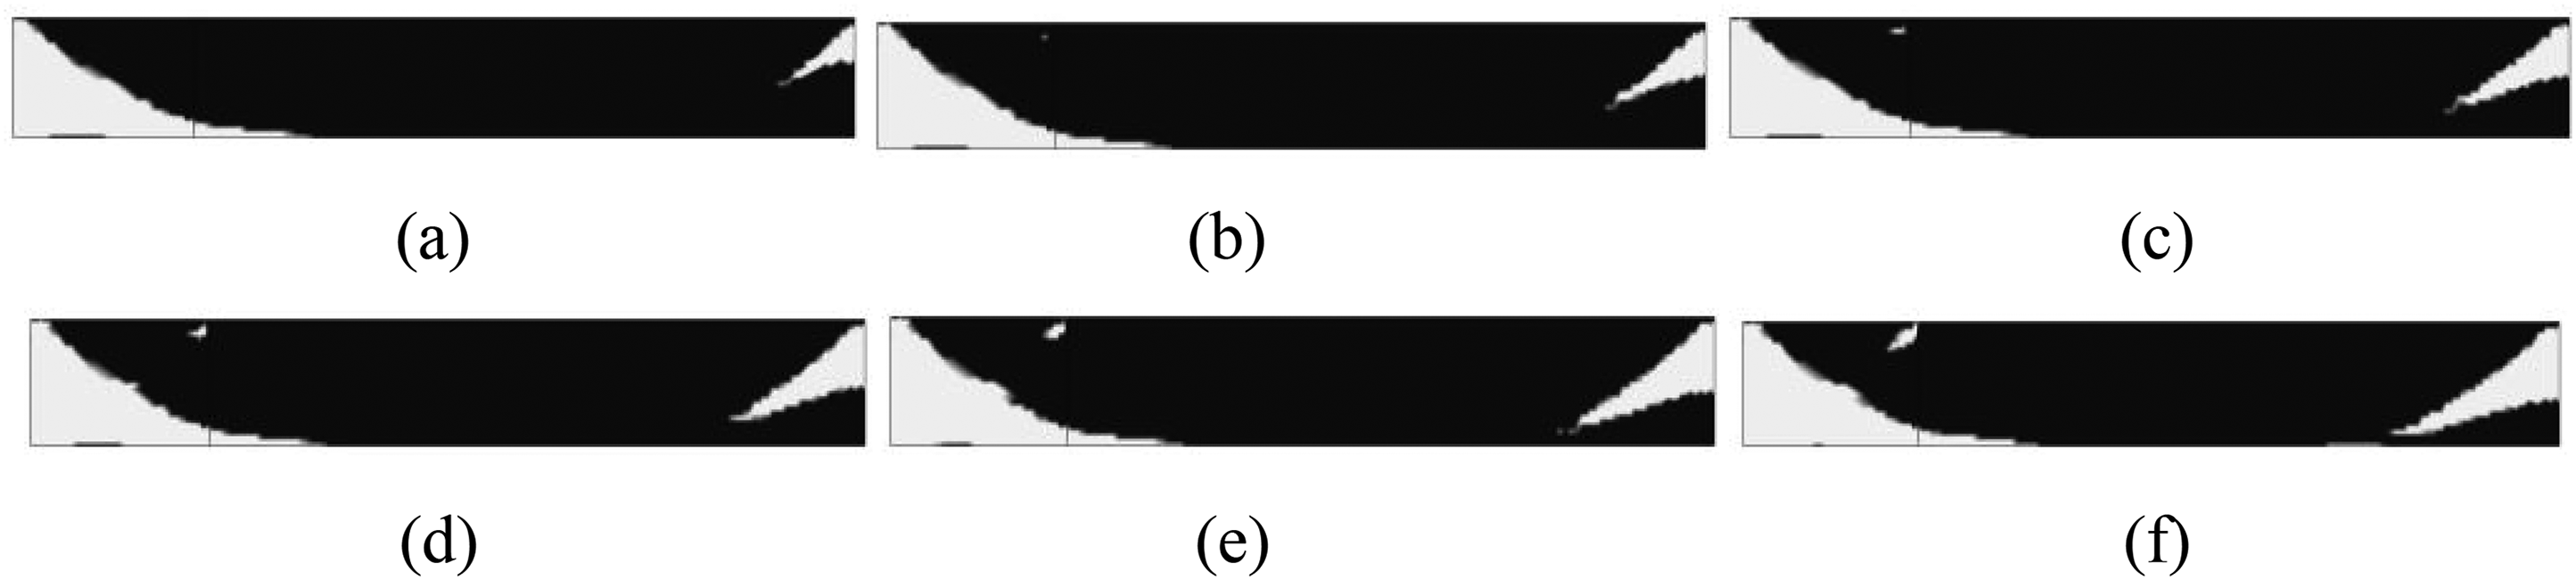
The failure process of coal pillar.
From Figure 19, during the early mining stage, the coal pillar in region B, with high seepage pressure, remains under high stress, causing continuous plastic strain until failure in the goaf direction. Figure 19(b) shows that the coal pillar's edge, closer to the 1314 working face, experiences higher stress than the center, making it prone to failure or energy accumulation. Figure 19(a) indicates that, despite higher porosity and water flooding in region B, the main drainage direction is toward the 1314 working face due to high stress. The stress distribution in the coal pillar is more complex under water inrush, with region B experiencing greater stress concentration, especially in the middle and lower parts near the goaf. Therefore, key monitoring areas for potential failure and energy accumulation are the middle and lower sections of regions B and C near the 1314 working face, which should be prioritized for pressure relief measures.
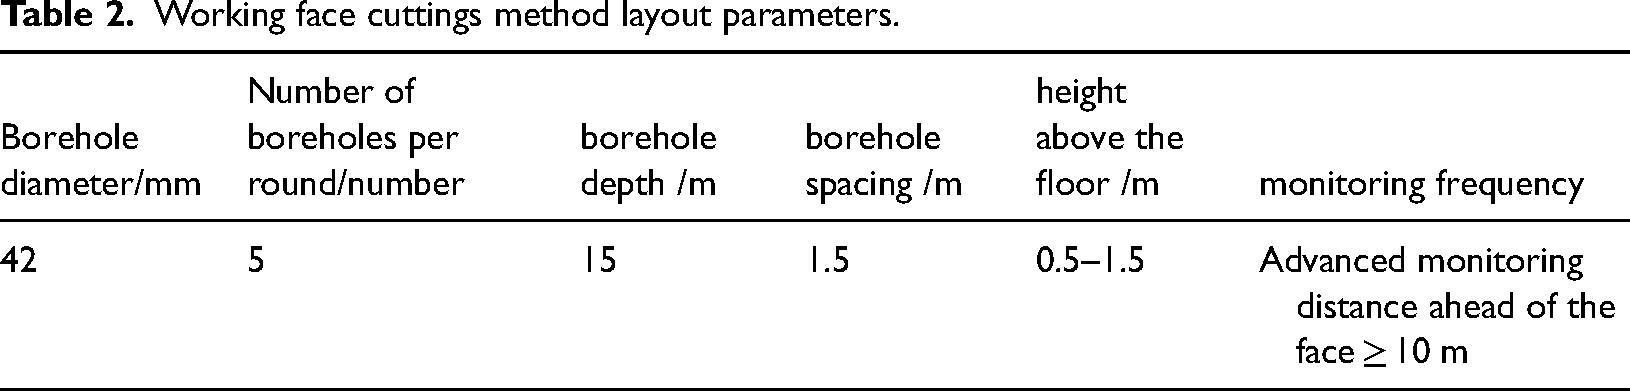
Working face cuttings method layout parameters.
Field validation of the stability simulation results for water-saturated coal pillar
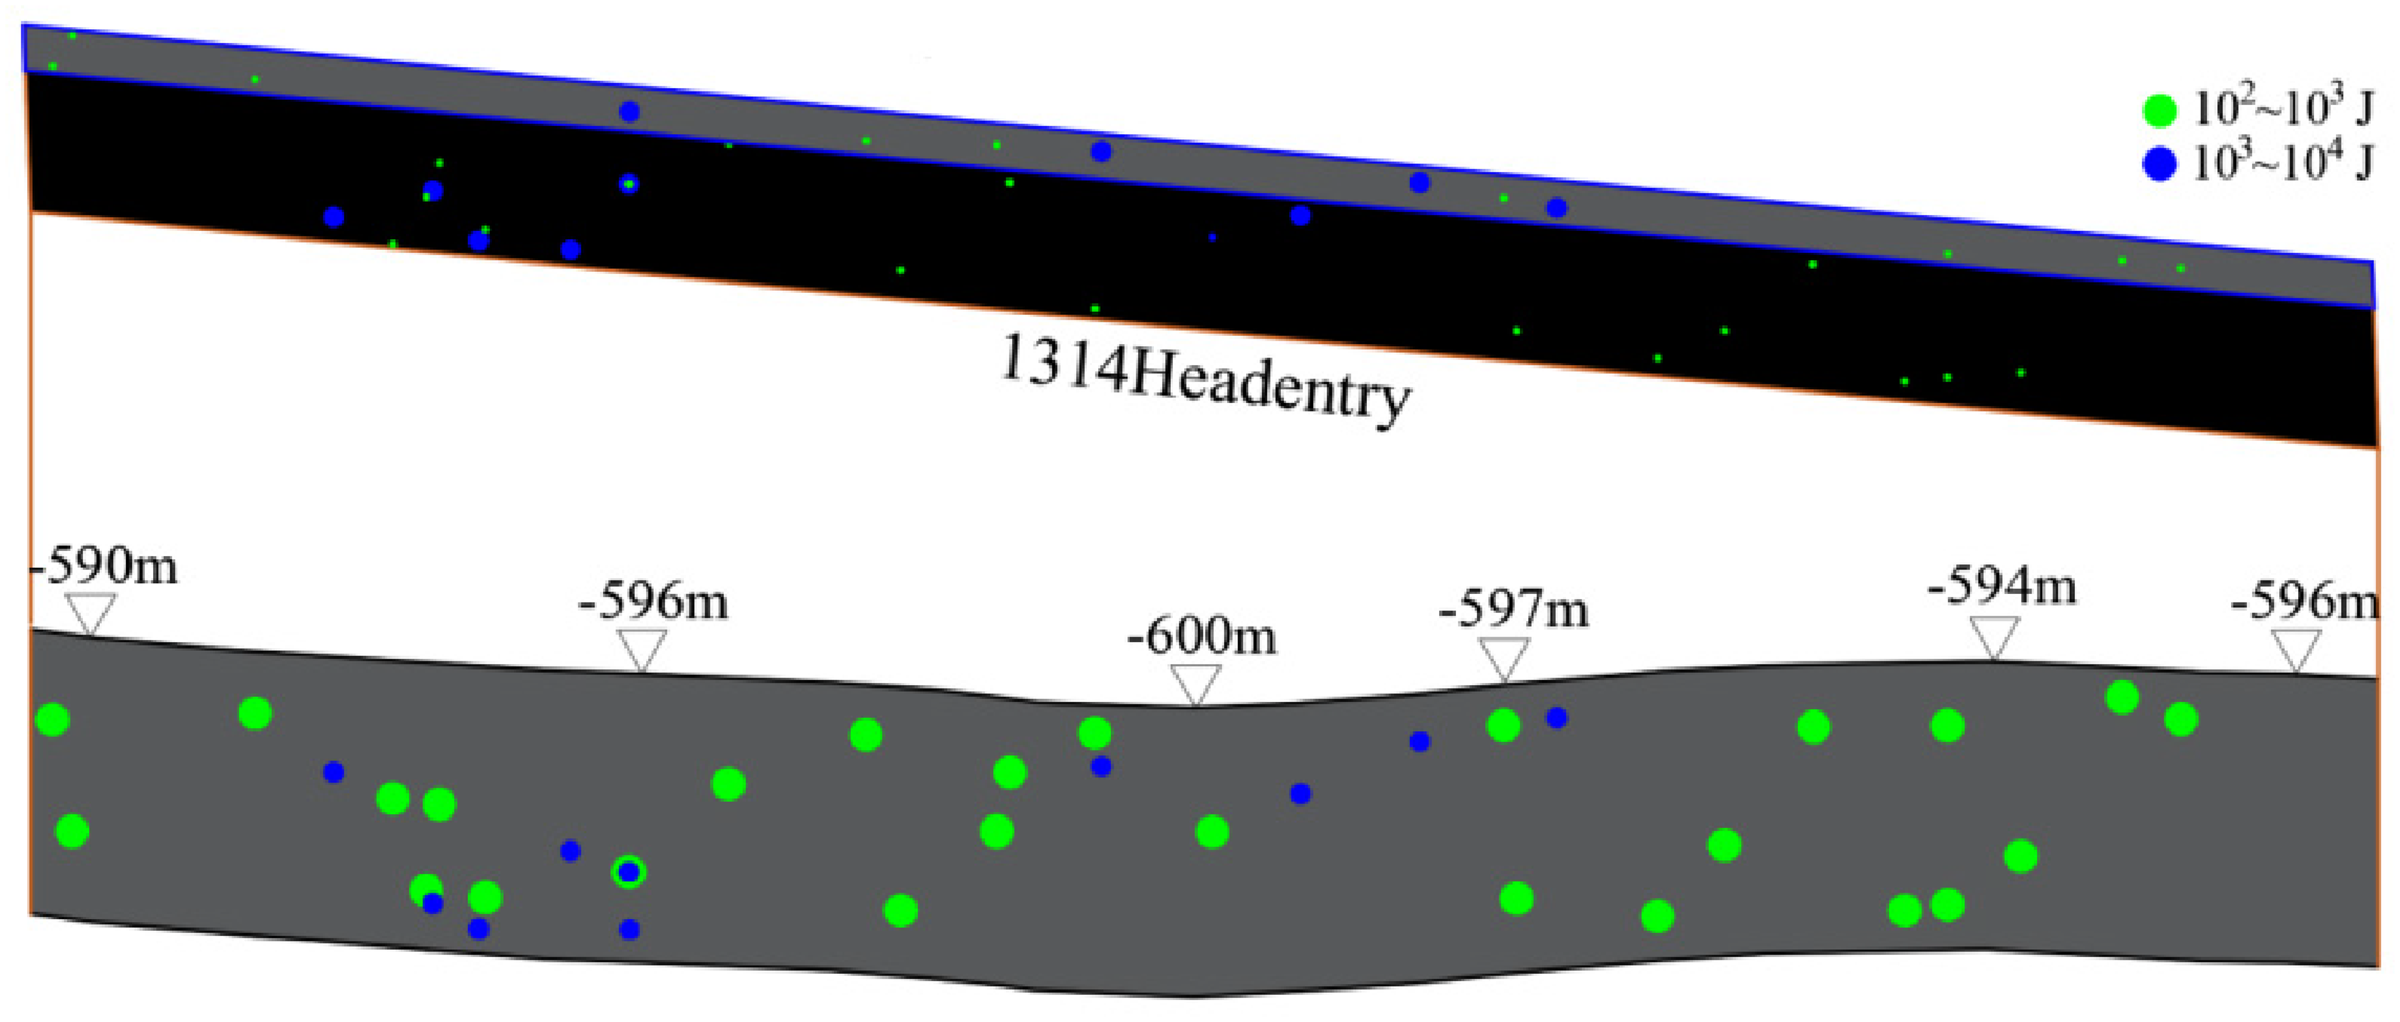
The statistical analysis of microseismic events within the first 300 m of the 1314 mining face during the extraction process is shown in Figure 21, while Figure 22 presents the spatial distribution of these events. A higher number of microseismic events near the original plastic zone indicates significant stress disturbance in this region. The occurrence of secondary energy events exceeds the expected number, likely due to the inability of shear waves to propagate in water, which may affect the collection of microseismic signals. Consequently, the actual number of energy events should be equal to or greater than the collected data. Following the excavation of the belt entry, stress redistribution within the coal pillar occurred, and under the influence of water inrush, the plastic zone shifted inward, releasing accumulated energy. Tertiary energy events are predominantly distributed at the boundary between the elastic and inelastic zones, further indicating the inward transfer of the plastic zone. Overall, a higher number of events, especially high-energy events, is observed on the water-saturated side of the coal pillar, suggesting that the influence of water on the pillar persists during the extraction process. The coal body in the water-saturated area accumulates more energy, and the internal stress of the coal pillar increases under the effect of pore water pressure. Even in the inelastic zone, where cohesion and internal friction angle decrease due to water influence, high-energy accumulation remains possible. In cases where the coal body exhibits a high tendency for dynamic failure, it is necessary to implement measures to relieve pressure on the water-saturated side of the coal pillar.
Statistics of microseismic events in coal pillar during the mining process.
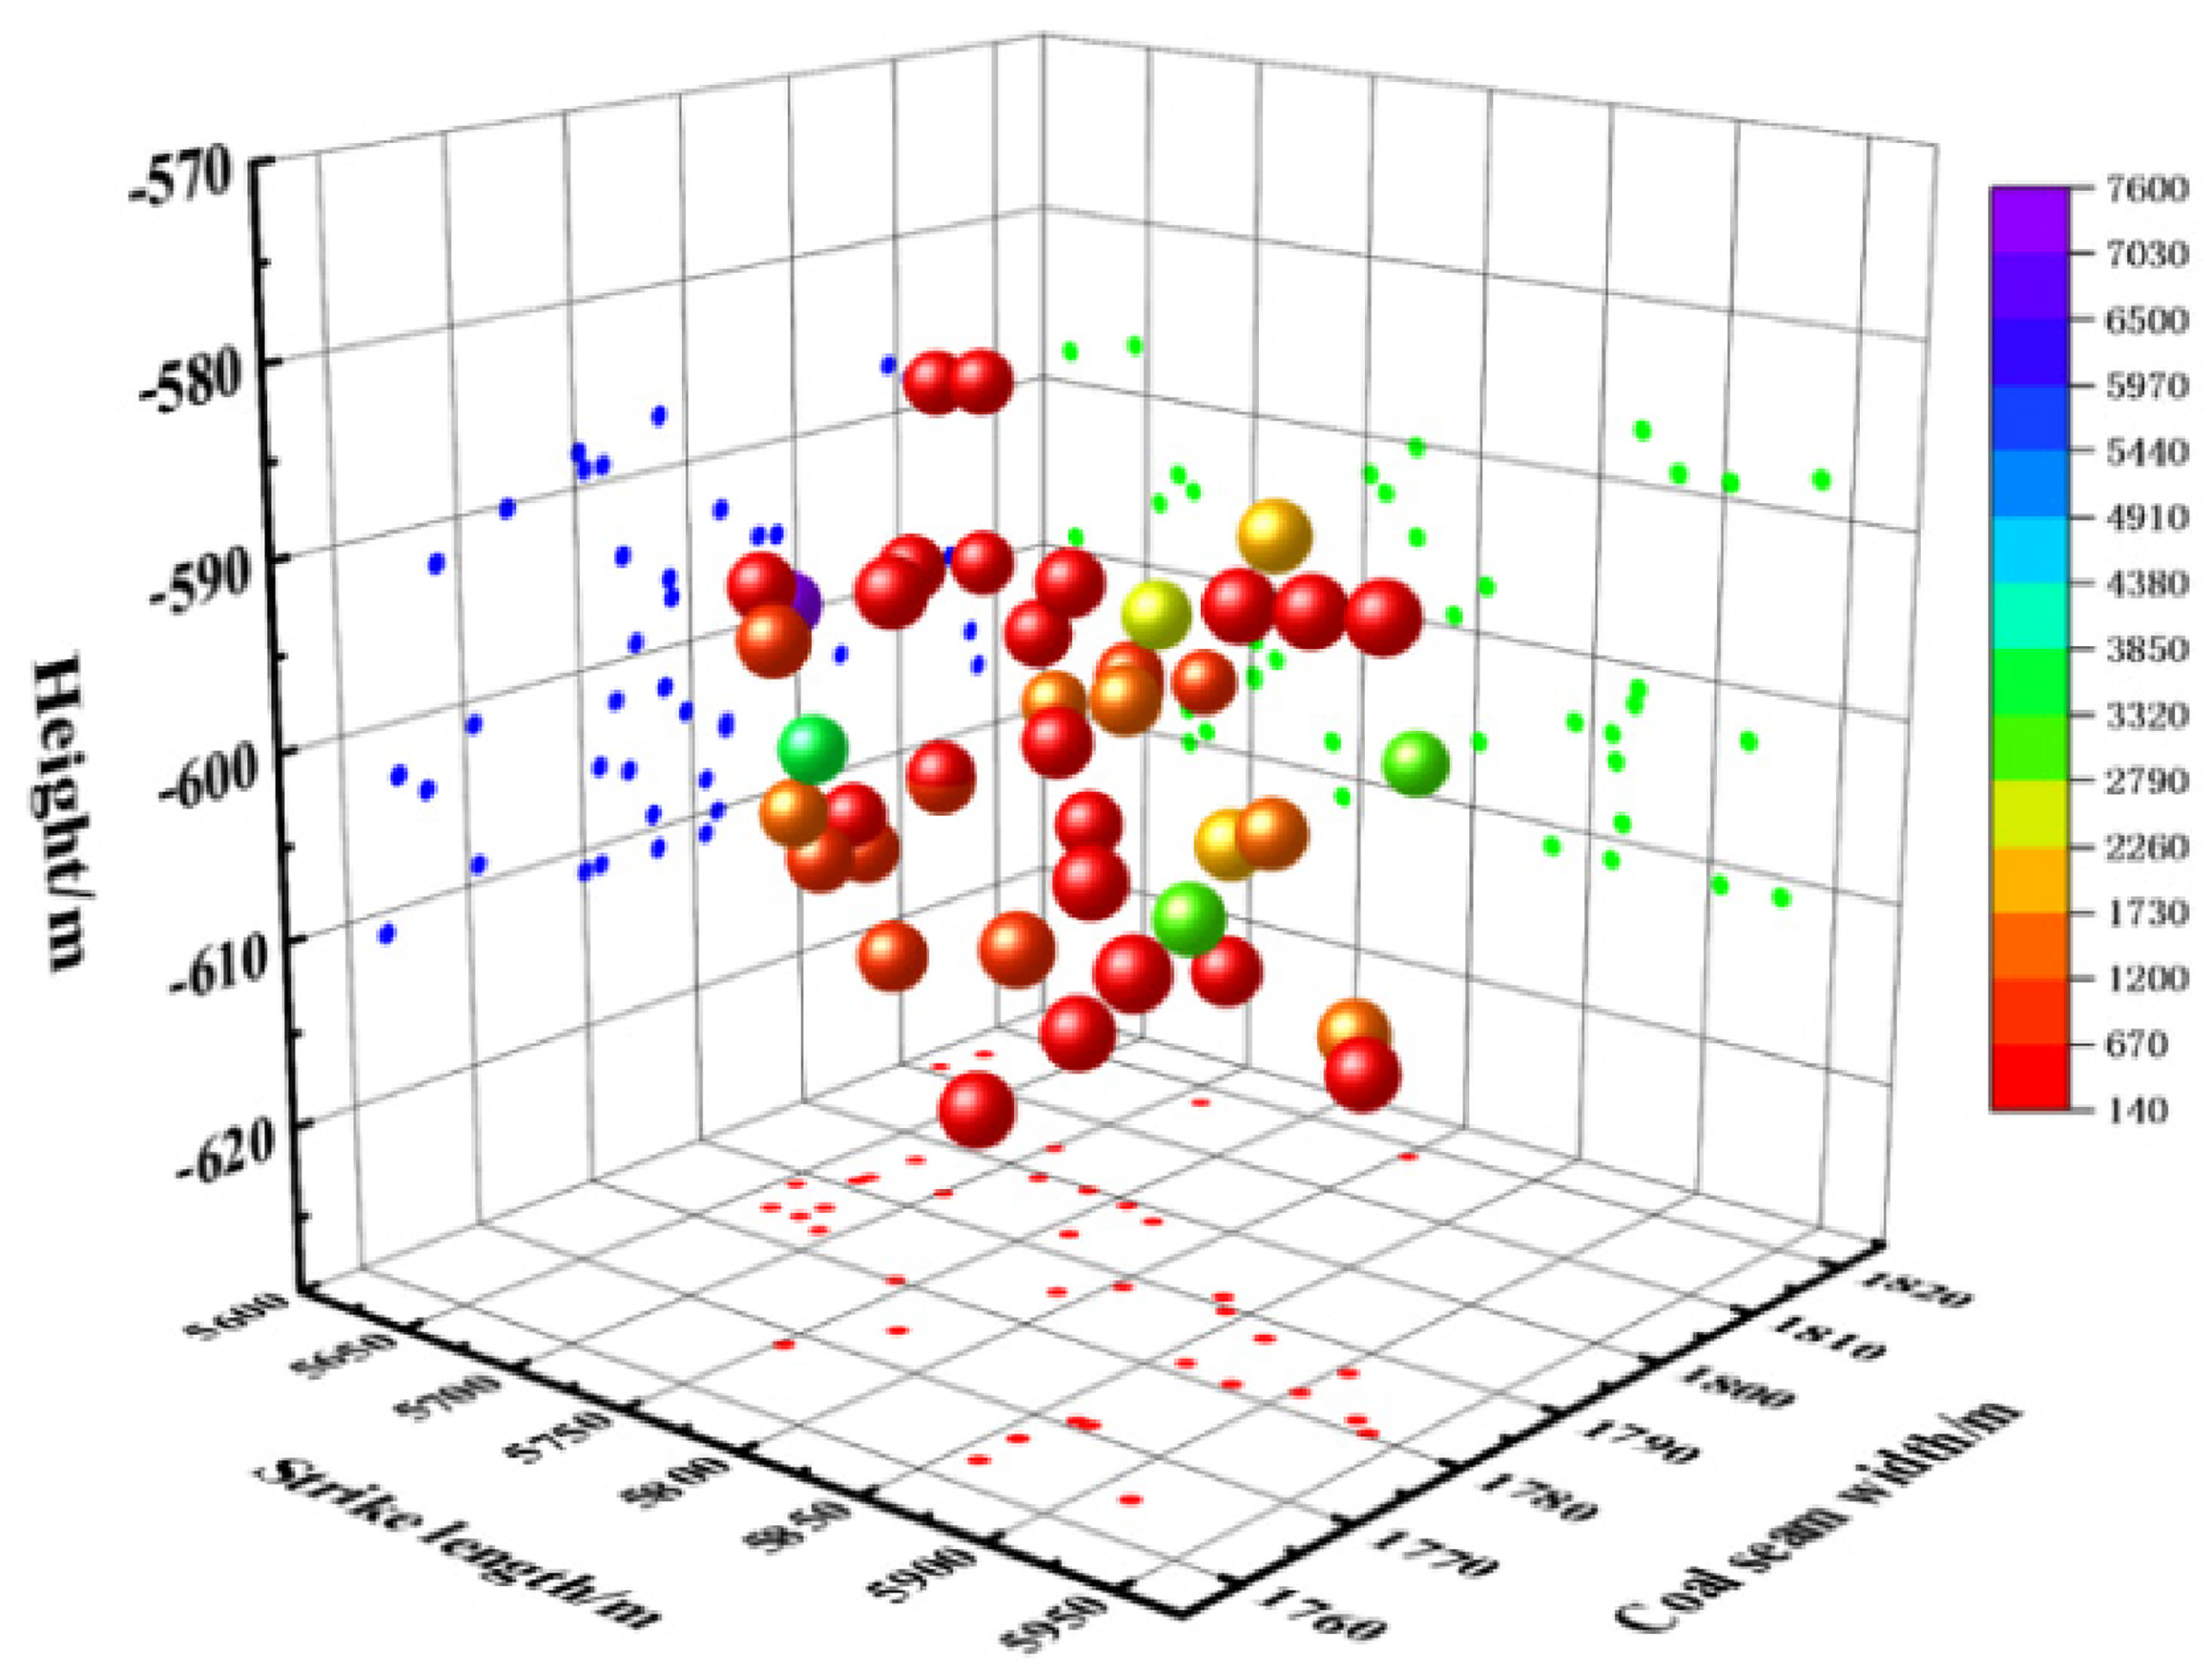
Spatial distribution of microseismic events.
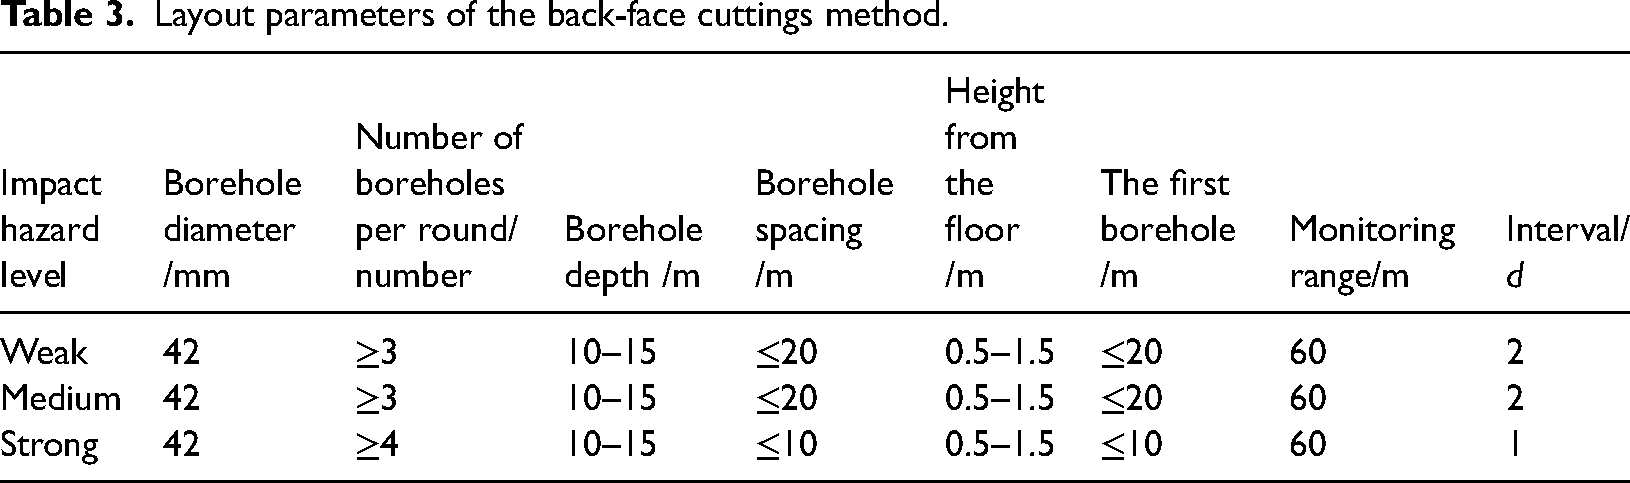
Layout parameters of the back-face cuttings method.
Practical application in mining operations
This study examines the impact of water inrush-induced pore water pressure on coal pillar stability in two key aspects: 1) the stability during the water inrush event, and 2) the effect of high pore water pressure on stability during the recovery phase. While the recovery of the working face had already been completed, the 28-m-wide coal pillar was determined without fully considering the influence of water inrush and pore water pressure. This oversight led to resource waste and increased monitoring costs. Therefore, it is recommended that the effect of pore water pressure be considered when determining the width of protective coal pillars, especially in areas impacted by water inrush.
Additionally, the following preparatory work should be undertaken to optimize the original design:
Theoretical Calculation and Coal Sampling: Calculate the plastic zone range and measure coal porosity through sampling. Governing Equations Assessment: Evaluate the applicability of governing equations based on porosity changes. Water Inrush Simulation: Simulate water inrush to determine pore water pressure distribution in the coal pillar. Field Data Calibration: Calibrate simulation results using field sampling data for improved accuracy. Coal Pillar Stability and Width Analysis: Simulate the recovery process, analyze stability, and determine the optimal coal pillar width.
These steps optimize coal pillar design, reducing excavation and tunnel costs.
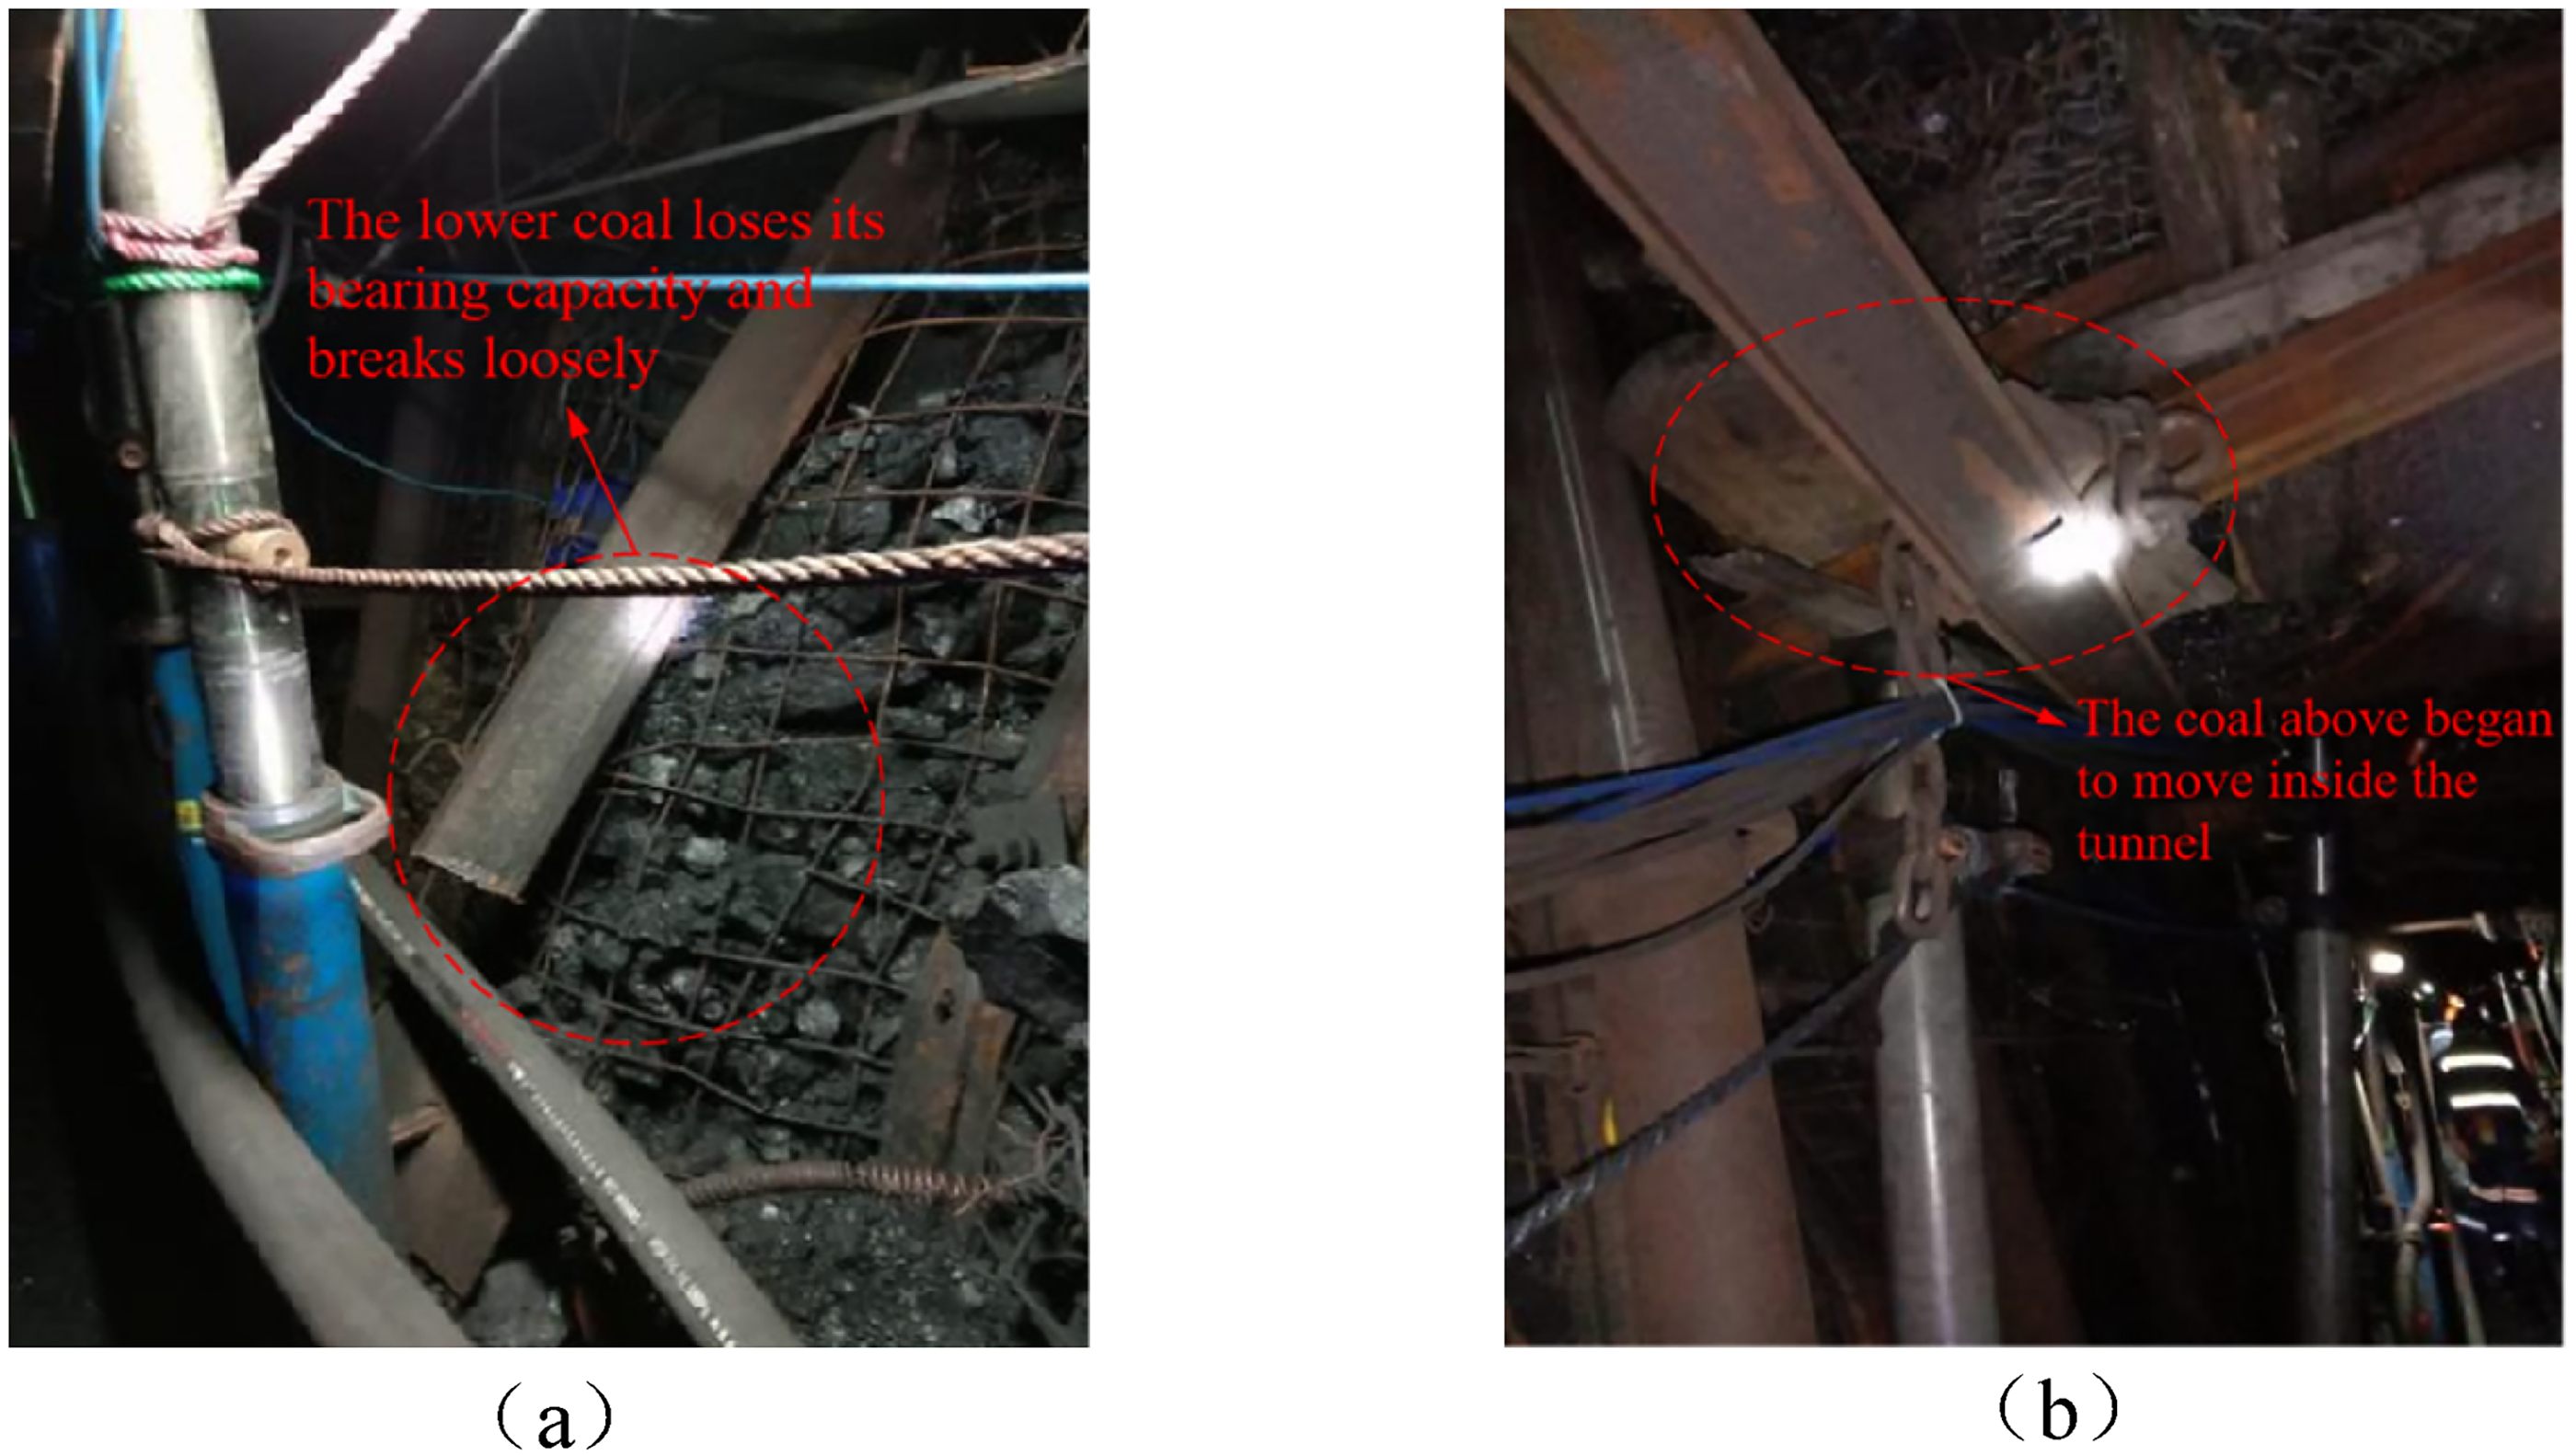
A total of 1314 work face site photos. (a) The lower coal loses its bearing capacity and breaks loosely. (b) The coal pillar loses its bearing capacity below, and the coal above begins to move inside the tunnel.
For mines that have resumed recovery operations, specialized management of protective coal pillars is recommended. Management approaches should differ for mines affected by water inrush and those unaffected, with design and plans tailored to the specific conditions of each case.
As discussed in “Study on the stability of immersed coal pillar” section, the loss of bearing capacity in the lower part of the coal pillar, combined with uneven internal stress and water-softening effects, exacerbates destabilization. The lower coal mass fractures first, leading to increased pressure from the overlying strata, which may cause additional lateral pressure from the roof, as shown in Figure 23. To mitigate this, it is recommended to closely monitor internal stress changes following a water inrush, with sensors placed closer to the roof separation.
When the lower coal mass loses bearing capacity, early measures such as pressure relief blasting or large-diameter drilling should be implemented to reduce stress on the upper coal pillar and roof. After pressure relief, further assessment of coal pillar stability and the impact of changes in width on stress distribution should be conducted (Dong et al., 2024).
As shown in Figure 24, when the internal stress of the coal pillar transitions from state (a) to (b) (Zhang et al., 2023a), the in-situ stress increases, forming an elastic core zone under high pressure. During the recovery phase, continuous disturbance makes the coal pillar vulnerable to dynamic pressure incidents, threatening production safety. Therefore, enhanced monitoring of energy changes, including microseismic data and more frequent cuttings extraction, is crucial to assess stability. To mitigate risks, we have improved the cuttings-based monitoring system design, focusing on dynamic pressure prevention for the stress concentration zone of the 1314 working face coal pillar.
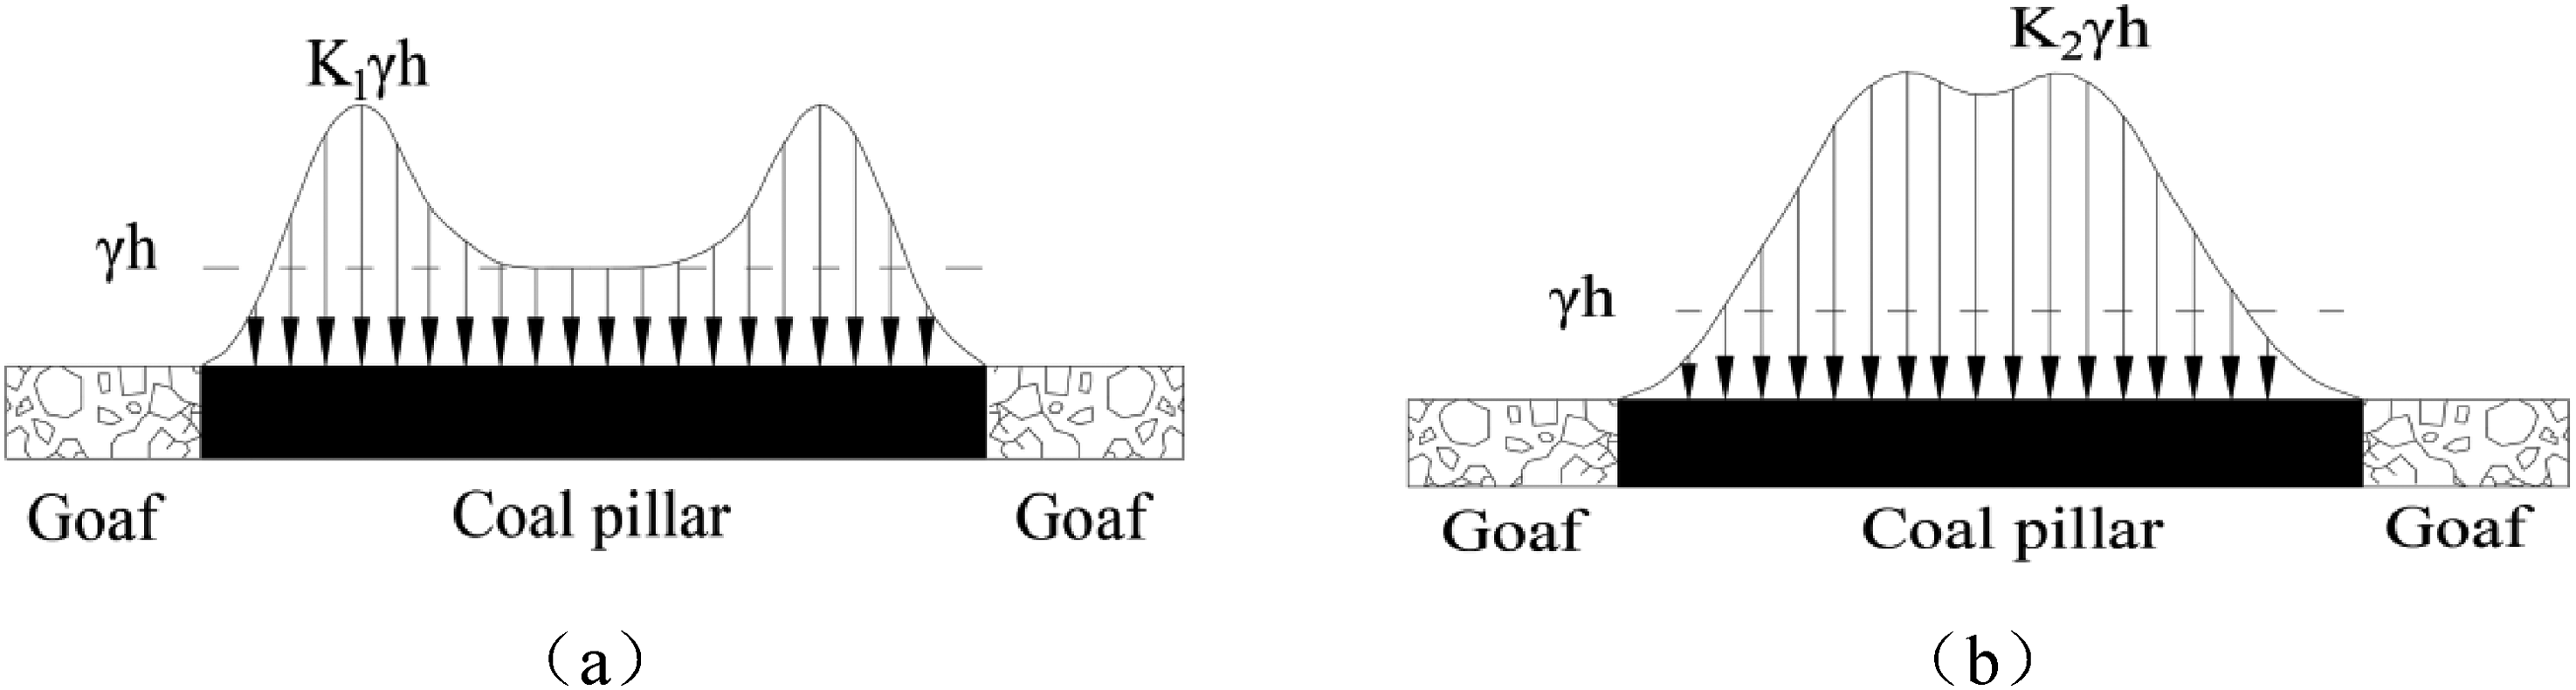
Schematic diagram of the internal pressure distribution in the coal pillar. (a) The coal pillar is in a stable state. (b) The coal pillar is in a high-pressure state.
Improved cuttings-based monitoring method:
1. Working face monitoring, with its layout parameters as shown in Table 2.
Monitoring frequency: Cuttings monitoring should be conducted before and after each advance, and once at the end of each tunneling cycle (after 1–2 m of advancement). The monitoring area should extend at least 10 m ahead of the working face, covering the front, both sides, and the roof.
Dynamic adjustment: In the event of dynamic phenomena such as coal bursts or sidewall sloughing, real-time cutting monitoring should begin immediately, with the frequency increased to twice per day.
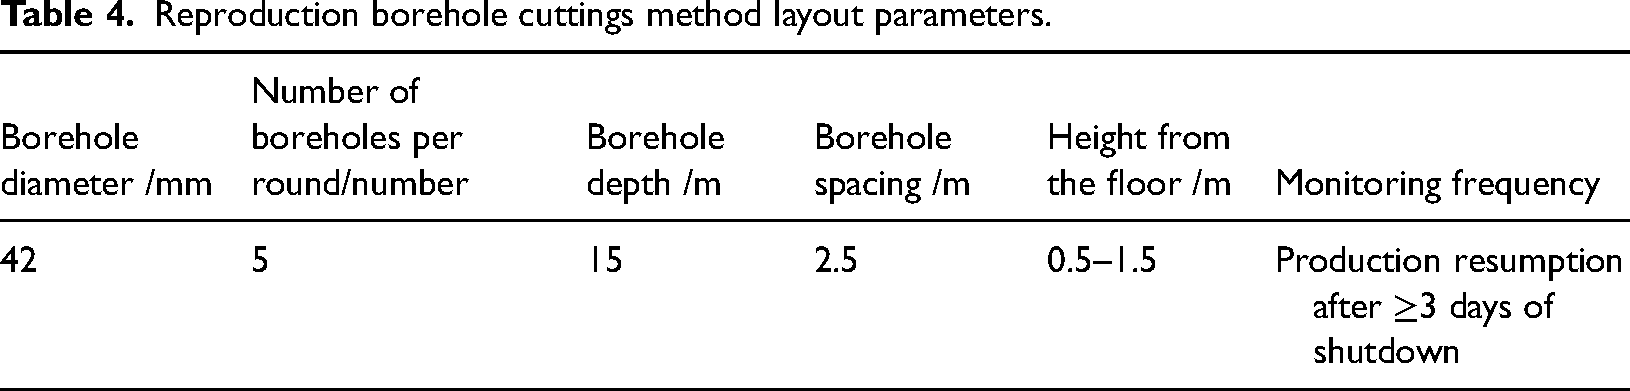
2. Monitoring behind the working face, with its layout parameters as shown in Table 3. 3. Monitoring Before Resuming Production in Idle Areas, with its layout parameters as shown in Table 4.
In the event of sudden dynamic phenomena (such as coal bumps, rib spalling, etc.), the monitoring frequency should be promptly increased, and the monitoring frequency should be adjusted to once per day.
In summary, when designing coal pillars, it is essential to thoroughly consider the impact of water inrush and pore water pressure. Through theoretical calculations, simulations, and on-site sampling, coal pillar designs should be optimized to enhance the safety and economic efficiency of the recovery process. Additionally, for mines that have resumed recovery operations, special attention should be given to coal pillar management to ensure both the stability and functionality of the coal pillars.
Reproduction borehole cuttings method layout parameters.
Conclusion
The effect of water inrush on the stability of the coal pillar is studied via three-field coupling simulations. Based on a simulation study with a porosity of 0.15, it is verified that there are obvious differences between Brinkman flow and Darcy flow, indicating that it is necessary to conduct partitioning research on the model. When the porosities of regions B and C are the same, permeability, water velocity, and seepage pressure are positively correlated with porosity. When the porosities of regions B and C are different, the water velocity of region A will also increase with increasing porosity, and changes in porosity in region C will have a greater impact on changes in water velocity in region A. When the porosity is higher than 0.3, the sensitivity of coal to fluid increases rapidly.
When porosity in regions B and C varies, the influence on flow and pressure fields expands, with pressure showing a nonlinear correlation across regions. During water inrush at the 1314 face, fluid impact differs between elastic and inelastic zones, with pressure fluctuations near the main roadway increasing failure risk. As water inrush progresses, velocity and pressure variations become more pronounced, with greater changes in region B than C. Additionally, porosity changes in region C have a stronger effect on velocity in region A than those in region B.
During the water inrush stage, the coal pillar's main drainage direction is toward the 1314 working face. In region B, high stress causes continuous plastic strain and eventual failure toward the goaf. Stress concentration is greatest in the middle-lower parts of both sides, requiring focused monitoring and pressure relief in later stages. An optimized coal pillar design, along with real-time monitoring and emergency response, is proposed to improve safety and cost-efficiency in mining.
Limitations of the Study and Directions for Future Research: This study, based on the 1314 working face, highlights that coal softening and goaf complexity after water inrush may cause deviations when inferring overall characteristics from local data. While three-field coupling simulations can assess the impact, accurately determining porosity changes remains a challenge. Future research could improve model accuracy using machine learning. Additionally, the regional division of areas B and C is coarse, and more dynamic factors should be incorporated to improve simulation accuracy (Chen et al., 2024). The impact of porosity on coal pillars also requires quantitative analysis, which will be addressed in future studies.
Footnotes
Acknowledgements
The authors gratefully wish to acknowledge The Research Program Project of Binzhou Polytechnic (2023yjkt06, 2023yjkt08).
Data availability
The datasets used and analyzed during the current study available from the corresponding author on reasonable request.
Declaration of conflicting interests
The authors declared no potential conflicts of interest with respect to the research, authorship, and/or publication of this article.
Funding
The authors received no financial support for the research, authorship, and/or publication of this article.