
Abstract
Low Voltage Direct Current (LVDC) Photovoltaic (PV) systems are considered suitable solutions for increasing the capacity of existing LV networks. They provide a good power quality, renewable energy source compatibility, and simple integration with batteries. This paper compares the proposed LVDC supply concept with existing traditional PV systems regarding energy efficiency. The proposed LVDC Photovoltaic System was realized. The results obtained from this study revealed that using the LVDC system supply concept, instead of Low Voltage Alternative Current (LVAC) ones, is very interesting if the PV-generated electricity is used locally during day hours. To achieve a high PV system efficiency, the PV power installed in the houses should be accurately sized regarding the consumed energy. The shorted path taken by the PV-generated power to feed load during daytime is the main advantage of the proposed LVDC architecture.
Introduction
Photovoltaic systems can be used as an on-grid system or a standalone power generation unit depending on the application's conditions. Currently, on-grid photovoltaic (PV) systems are very common in residential and office applications.
The main objective of this paper is to compare the proposed LVDC PV system in terms of energy efficiency with a traditional LVDC design and a traditional LVAC PV system with Alternative current (AC) loads. The studied PV systems are grid-connected and designed to supply homes and offices.
Generally, the energy consumption in the home is accomplished using AC sockets; even for a grid-connected PV system, the usage of AC might increase system losses, mainly when the DC is utilized at load levels.
In recent years, both academics and industry have been more interested in LVDC systems. Compared to typical LVAC systems, LVDC systems have several advantages over conventional AC systems, including better energy efficiency and simpler integration of renewable energy resources. Several factors impacting the power quality and reliability performance of the electricity supply allow the use of DC systems as an alternative to AC systems (Yoon et al., 2019; Kumar et al., 2017). Using DC power instead of AC would eliminate numerous power conversion losses by utilizing self-consumption of the energy produced on-site and reducing electricity imports from the grid (Trigueiro et al., 2016; Pellis, 1997). DC loads, such as those used in homes and offices, heating/cooling facilities, and bigger industrial devices like variable frequency drives have embraced DC motors (Pellis, 1997). Since DC circuits do not experience the skin effect or power factor, they are more effective than their AC counterparts (Kumar et al., 2017).
Subsequently (Lasseter, 2002) presented the DC Microgrid idea as an LV distribution network. The idea was projected as the future LV distribution systems, which were undergoing radical changes due to the emergence of decentralized production and market deregulation. The main idea underlying this notion is to integrate micro sources and loads into a singular unit that can respond quickly to fulfil distribution network demands.
The LVDC technology has been established for several years for specialized purposes such as aerospace, automotive, and naval (Ghareeb et al., 2013; Elsayeda et al., 2015; Du et al., 2019). According to a literature study Allee and Tschudi (2012), LVDC systems have grown significantly in popularity for industrial applications in recent decades, particularly in the telecommunications sector, ships, and buildings. In data centres, using direct current improves efficiency, lowers capital costs, increases reliability, and improves the power quality. Therefore, LVDC designs have been extensively researched in data centres. In the United States, Europe, Asia, and Oceania, several leadership projects have been implemented. According to these projects (Aldridge, 2009; Brian Fortenbery, 2011), the benefits of DC in data centres include a 10% to 30% decrease in energy consumption, a 15% reduction in capital costs, a more straightforward design, a possible increase in reliability, a smaller physical area needs, a lower environmental impact, and less cooling demand.
The biggest challenge facing DC power distribution systems is the lack of standards, codes, commercially available products, and regulations (Rodriguez-Diaz et al., 2016).
Monte Carlo simulation was used to evaluate DC systems’ technological and financial viability for residential use in Texas, using several network topologies. distribution topologies were tested in two scenarios: one with and one without power storage. The findings reveal that utilizing DC electricity in the home may save around 9 and 20% of energy. Adding a battery to store extra solar energy can save an additional 14 to 25% of energy. In addition, DC air conditioning condensation devices can save between 7 and 16 percent of energy (Glasgo et al., 2016).
In (Manandhar et al., 2015), the authors show that the LVDC distribution system is more efficient than the AC distribution one. The overall efficiency of LVAC and LVDC distribution is 78.24% and 84.6%, respectively. In this analysis, only the losses in power conversions are considered.
With the help of the previously conducted research (Yoon et al., 2019; Ghareeb et al., 2013; Weiss et al., 2015; Huyen et al., 2017), it was registered that local DC grids are a potential alternative for connecting renewable DC power supplies like solar power systems with DC demands like lights and data centres in residences (Aldridge, 2009; Weiss et al., 2015).
According to the research in (Ammous and Morel, 2014), DC microgrids are a viable alternative to traditional AC distribution networks, particularly for integrating renewable energy sources. For example, DC Microgrid makes it possible for a 25% reduction in energy usage when buildings are supplied directly from sectors and via solar panels.
In reference (Ammous et al., 2021), a novel architecture for an LVDC photovoltaic system is presented. According to conducted study for offices’ load in Jeddah, the new LVDC PV system saved more than 10% of energy compared to the conventional LVAC system. The proposed LVDC PV system registered a higher efficiency than other classical LVDC systems because the power transfer path is shorter in the nanogrid and offices loads consume especially during day hours.
The majority works on DC distribution grids assume that converters are installed at each household, which connect the local DC or AC nanogrids (Ammous et al., 2021; Salonen et al., 2008). In case of distributed energy resources, nanogrids in buildings could be functioned separately from the main grid in islanding mode (Salonen et al., 2008) and typical low voltage subsystems like 48, 24, or 12 V can be applied (Rodriguez-Diaz et al., 2016). They could, for example, be used for low power LED lighting or for connecting loads by USB Type-C connector and USB Power Delivery.
The paper is organized as follows: The first section of the paper presents different architectures of the photovoltaic system. The advantages of using the LVDC system are shown in this section. The second section shows the simulation results of the proposed PV architecture. The realization of the proposed LVDC architecture is shown in the third section. The final section of the paper discusses the proposed LVDC system's energy efficiency performance compared to the conventional AC system. Home loads consumption profiles are considered for this purpose, and the Jeddah location in Saudi Arabia was chosen in our study.
The studied Low voltage PV systems
The classical AC PV (system 1) connected to a low voltage network is shown in Figure 1. The Maximum Power Point Tracking (MPPT) algorithm controls the DC/DC converter (η1). The inverter (η2) transmits PV-generated electricity into the grid and guarantees that the inverter's DC voltage level (400 V) is regulated. This DC value is commonly used in single-phase PV systems since it easily converts to 230 V AC .
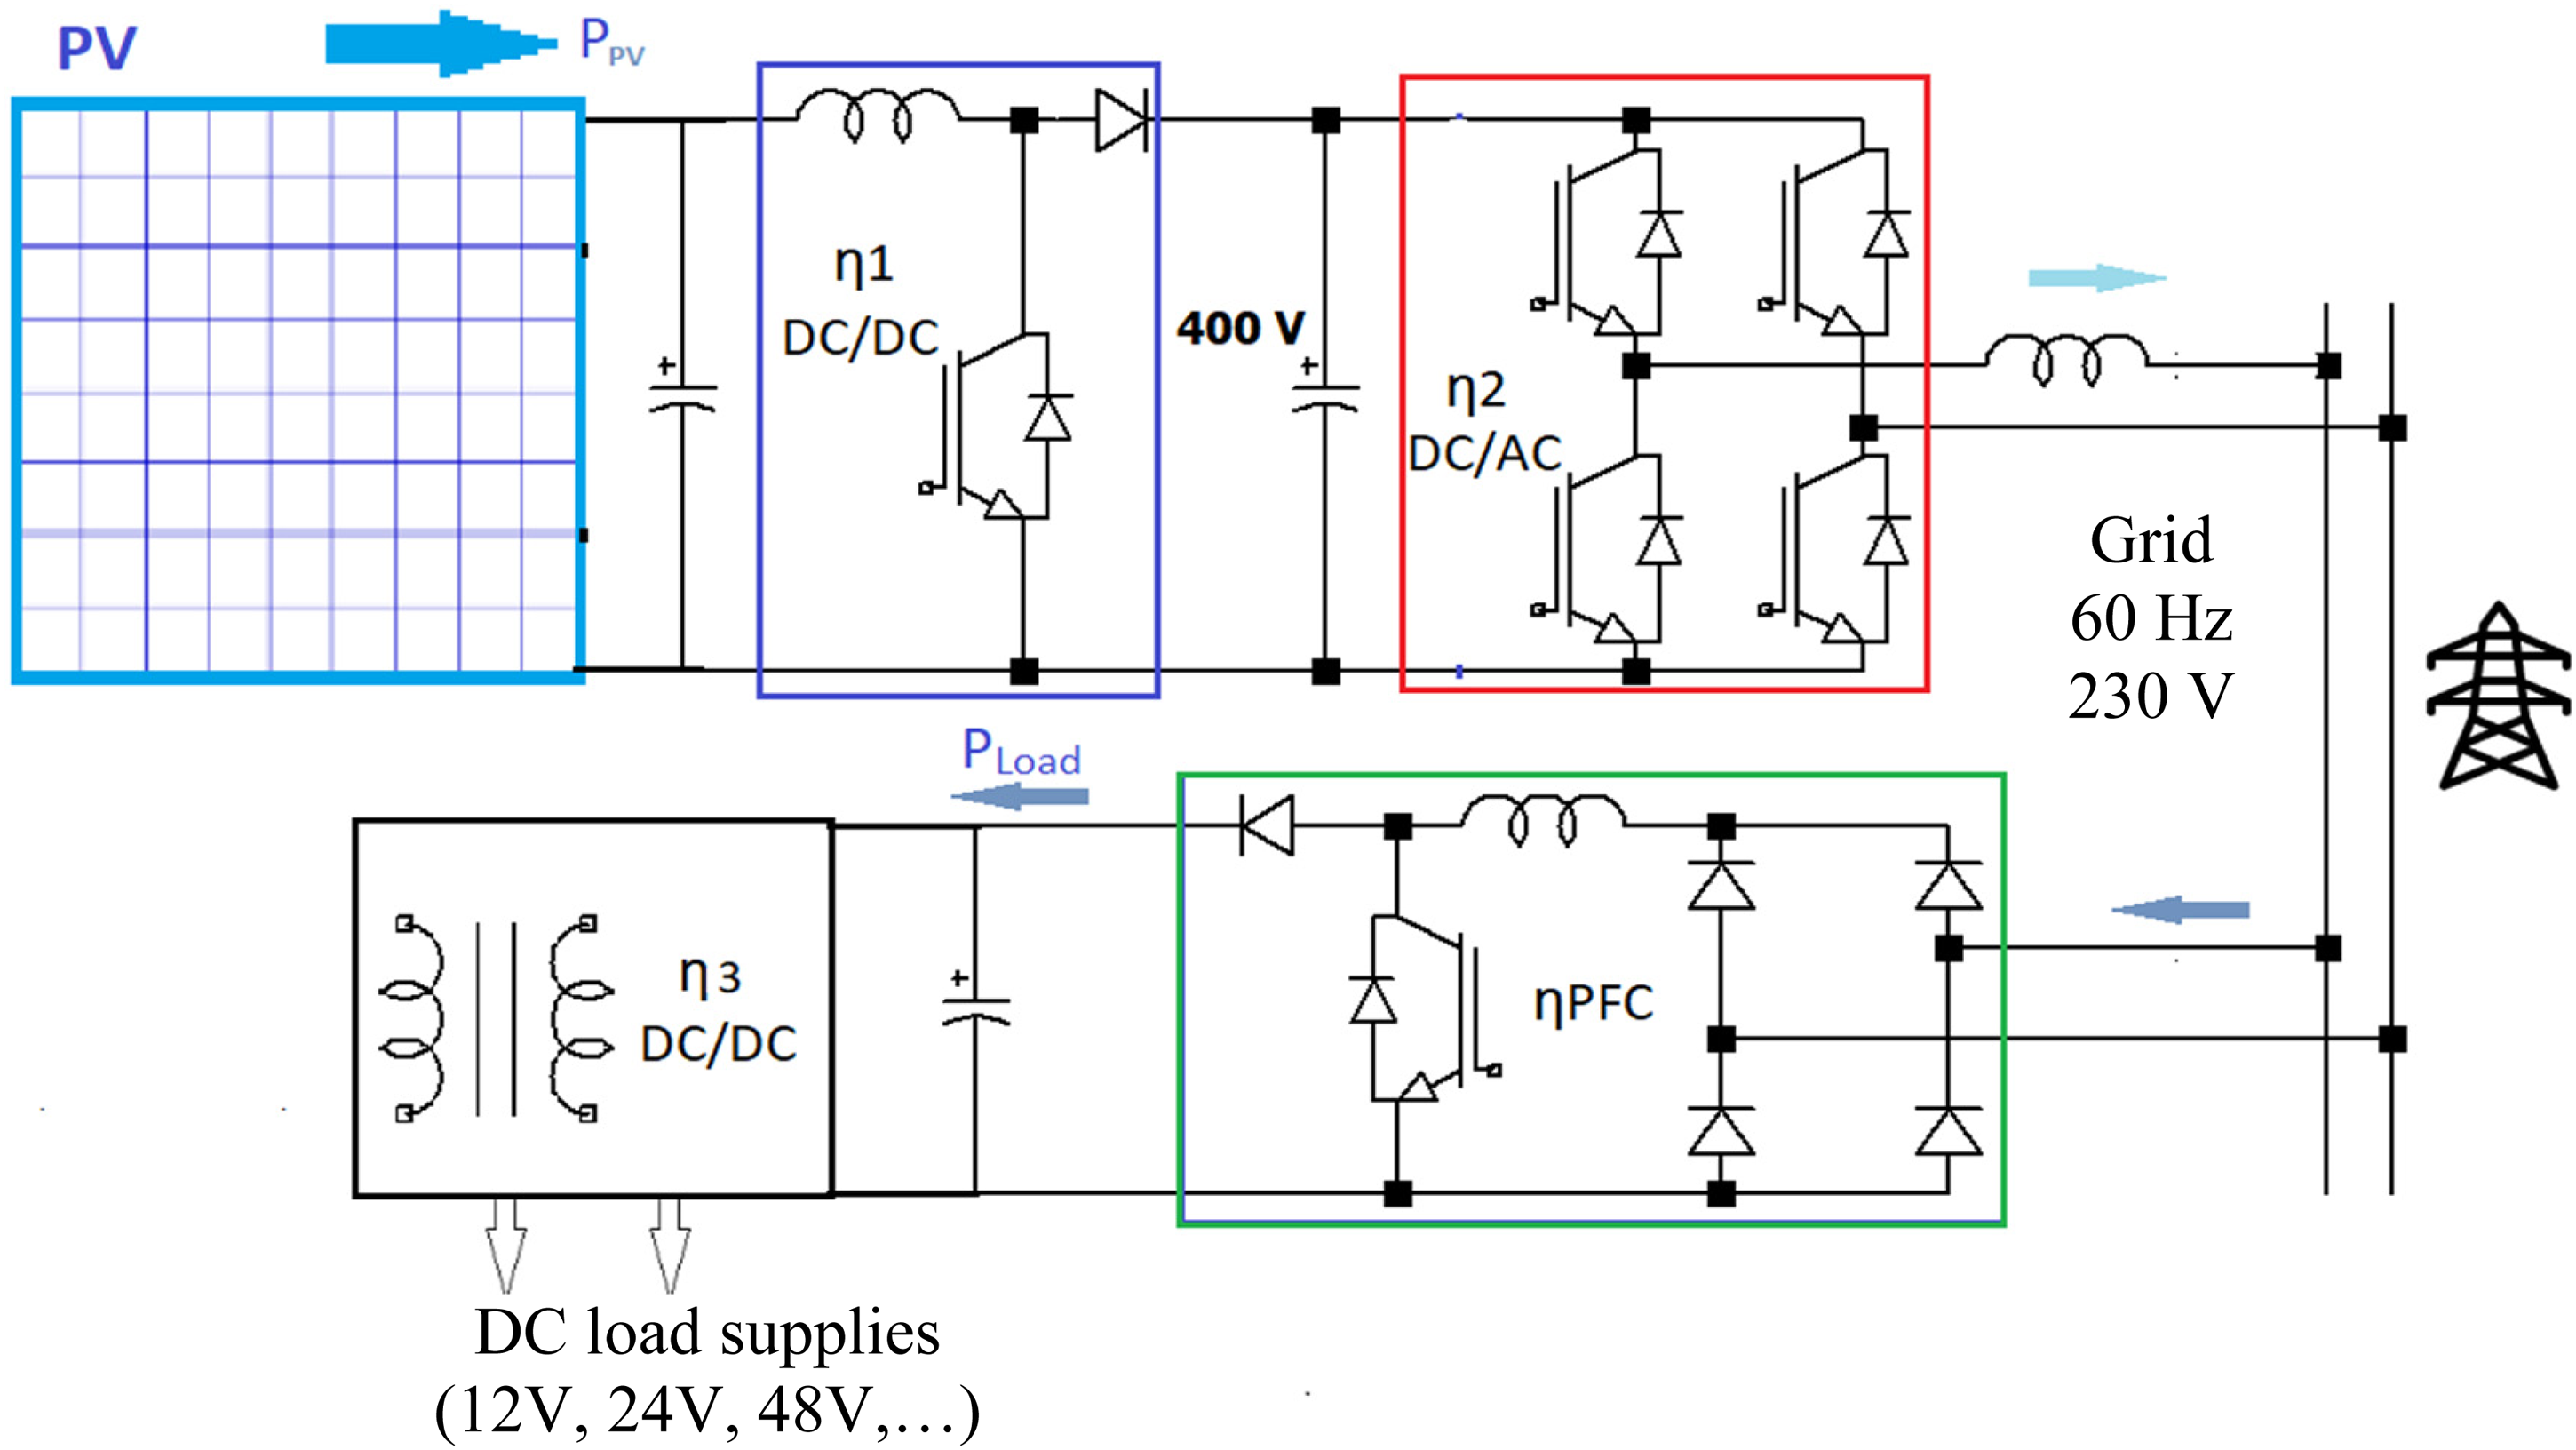
Classical LVAC PV architecture (system 1).
A further commonly used LVDC PV (system 2) is depicted in Figure 2. This system employs a direct current chain from PV to load. This is accomplished by a regulated DC-bus (400 V) and a DC/DC converter (η3) that allows the adaptation of this bus to the DC load voltage level.
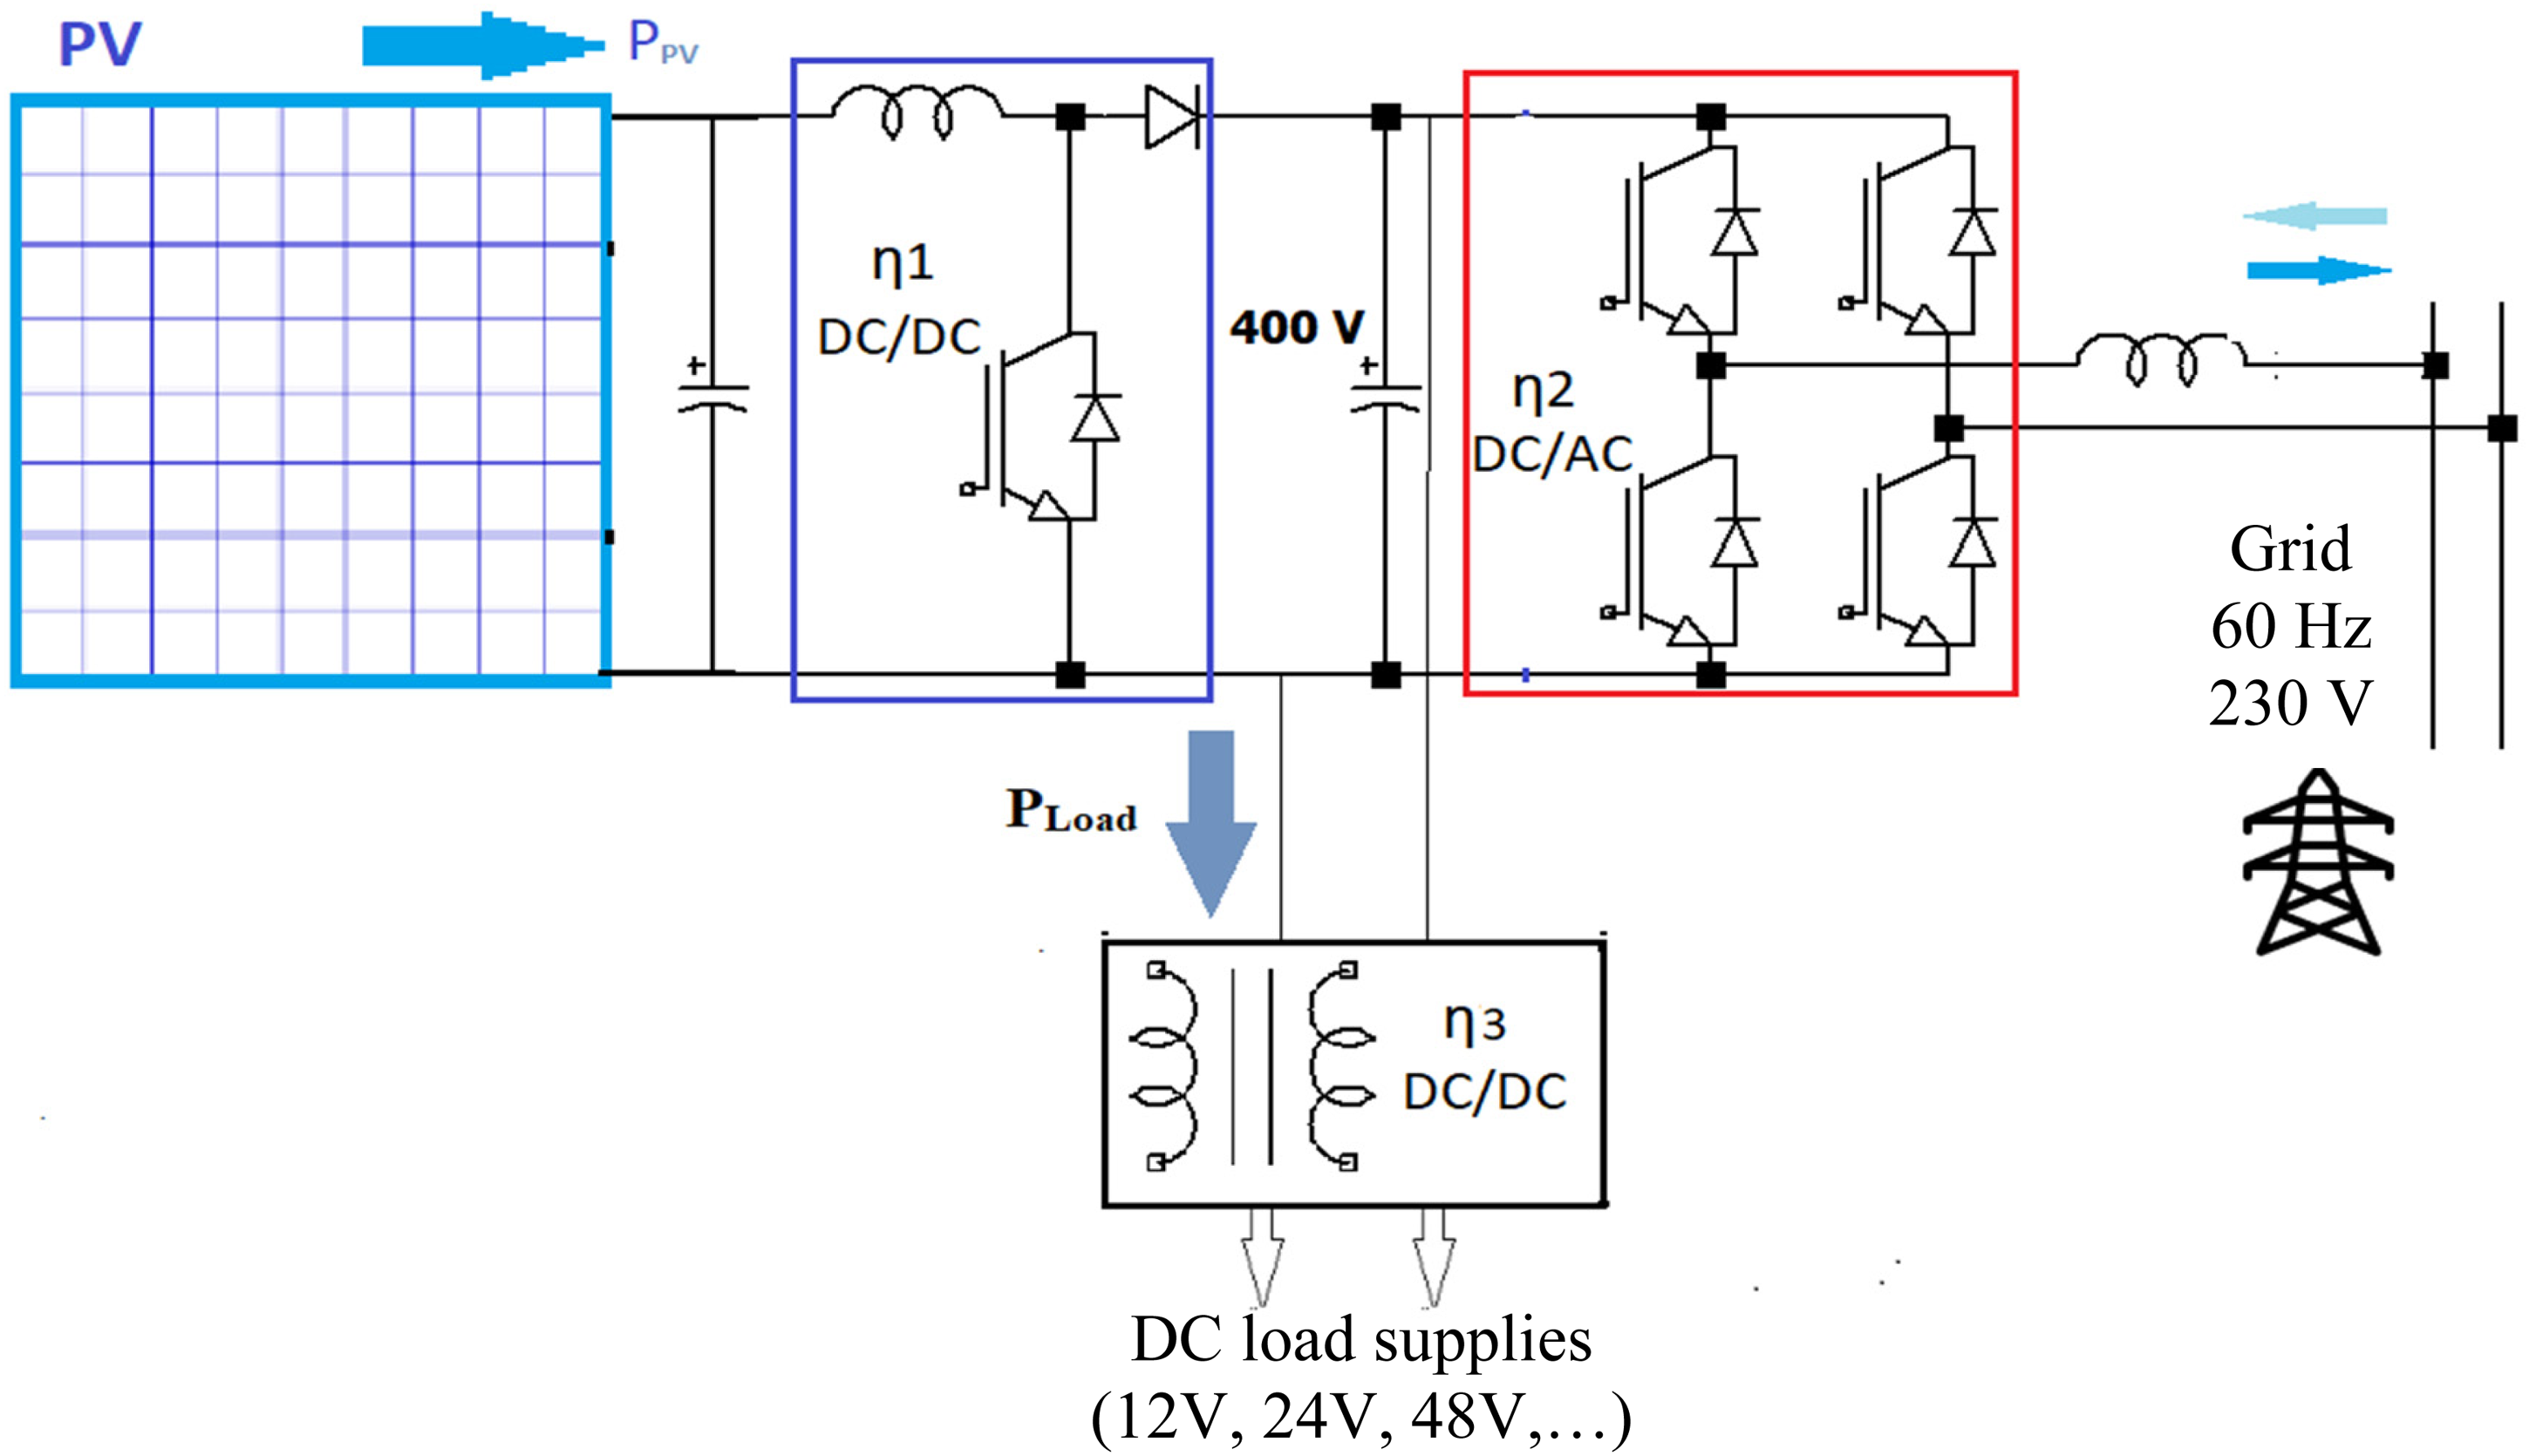
Classical LVDC architecture (system 2).
The proposed LVDC PV (system 3) uses the DC-bus immediately available following the PV panels. This DC-bus is unregulated, and its voltage value changes within a specific range that relies on the arrangement of PV panels and the open-circuit voltage across each panel. The architecture of the proposed system is depicted in Figure 3.
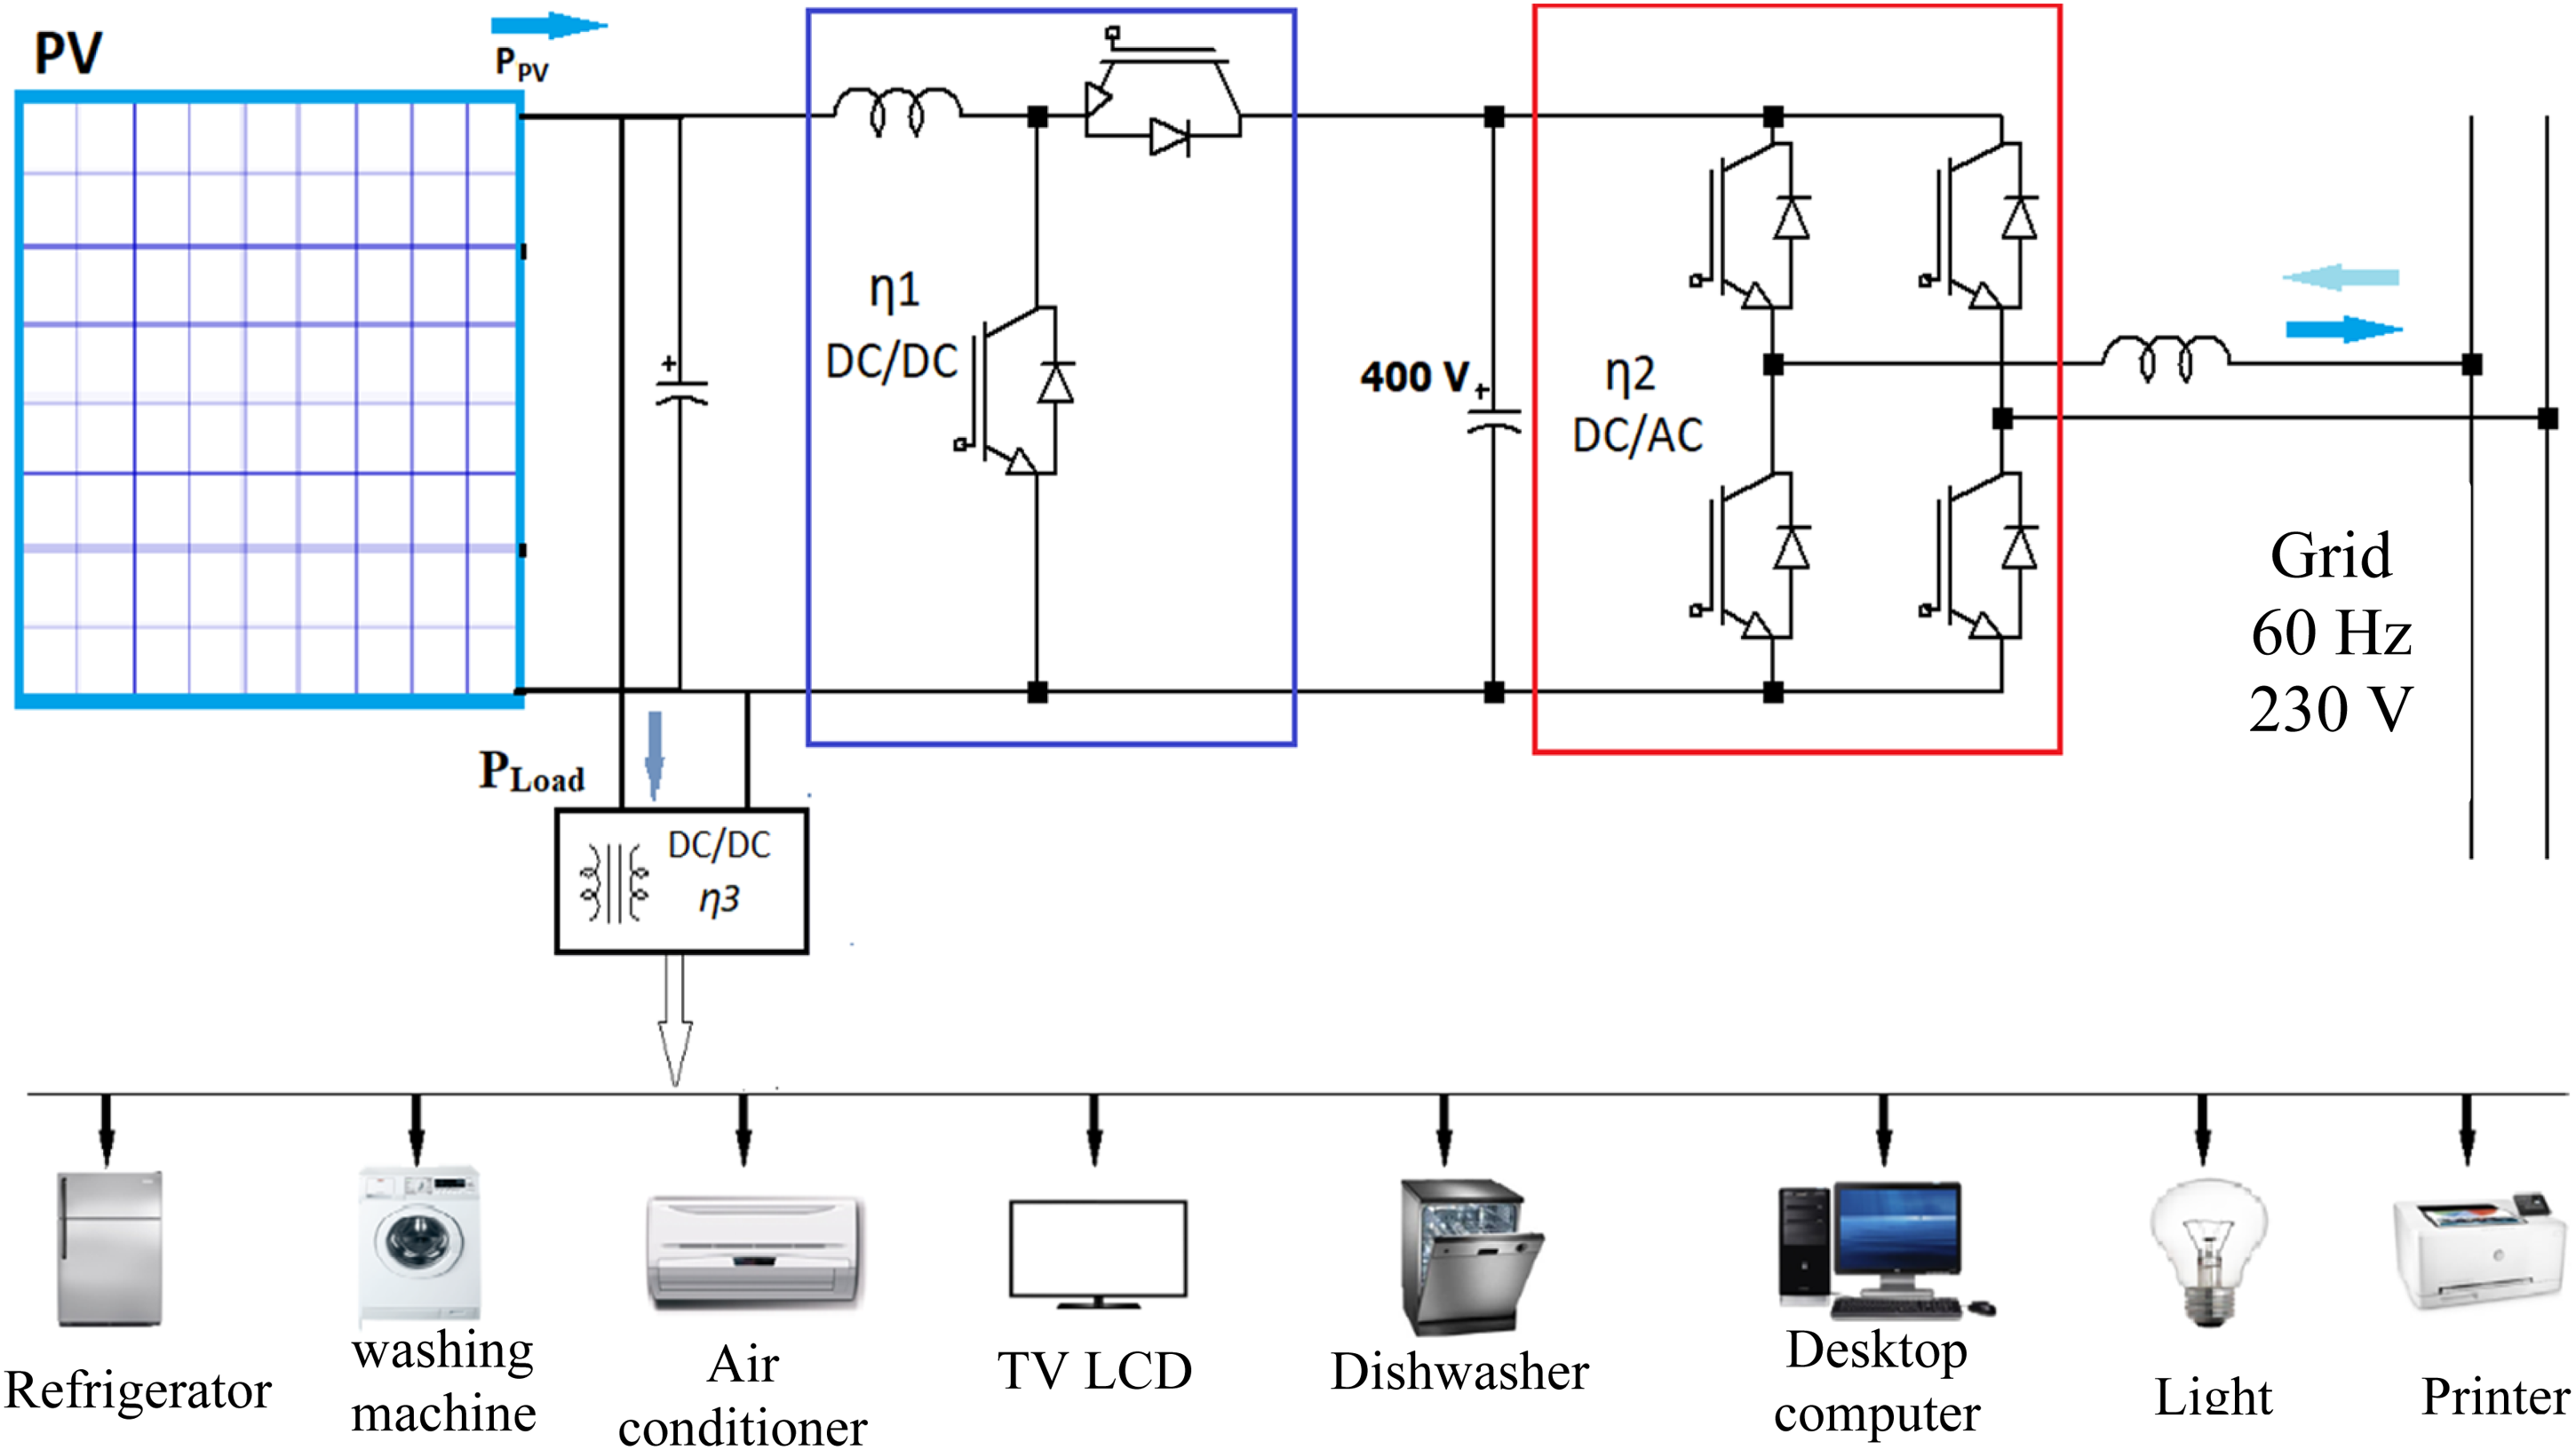
Proposed LVDC architecture for houses applications (system 3).
DC/DC converter (η3), often a buck converter, regulates the DC voltages that supply loads. The DC/DC converter (η1) is a reversible Buck-Boost converter. This reversible DC/DC allows power to be transferred from PV panels to the inverter when the consumed power is less than generated power from PV. Conversely, when the load consumed power exceeds the PV generated power, this reversible converter acts as a Buck converter and transfers power from the DC/AC converter (η2).
Both system 2 and system 3 use the same number of converters. The advantage of the proposed architecture (system 3) is that the power path from the PV source to the load is shorter during a day when PV power is available. On the other hand, during shadows on PV panels, especially at night, the load will be supplied by the grid via the inverter and the buck converter. In this situation, the power flow path becomes high, and the efficiency decreases. In order to evaluate the efficiency of the different systems, simulations are performed during a typical day (24 h/day) in each season. Then the saved energy is evaluated during an entire year (365 days).
The complete circuit of the proposed system is shown in Figure 4. The PV module is arranged as two in a parallel string of four series panels (2 kW).
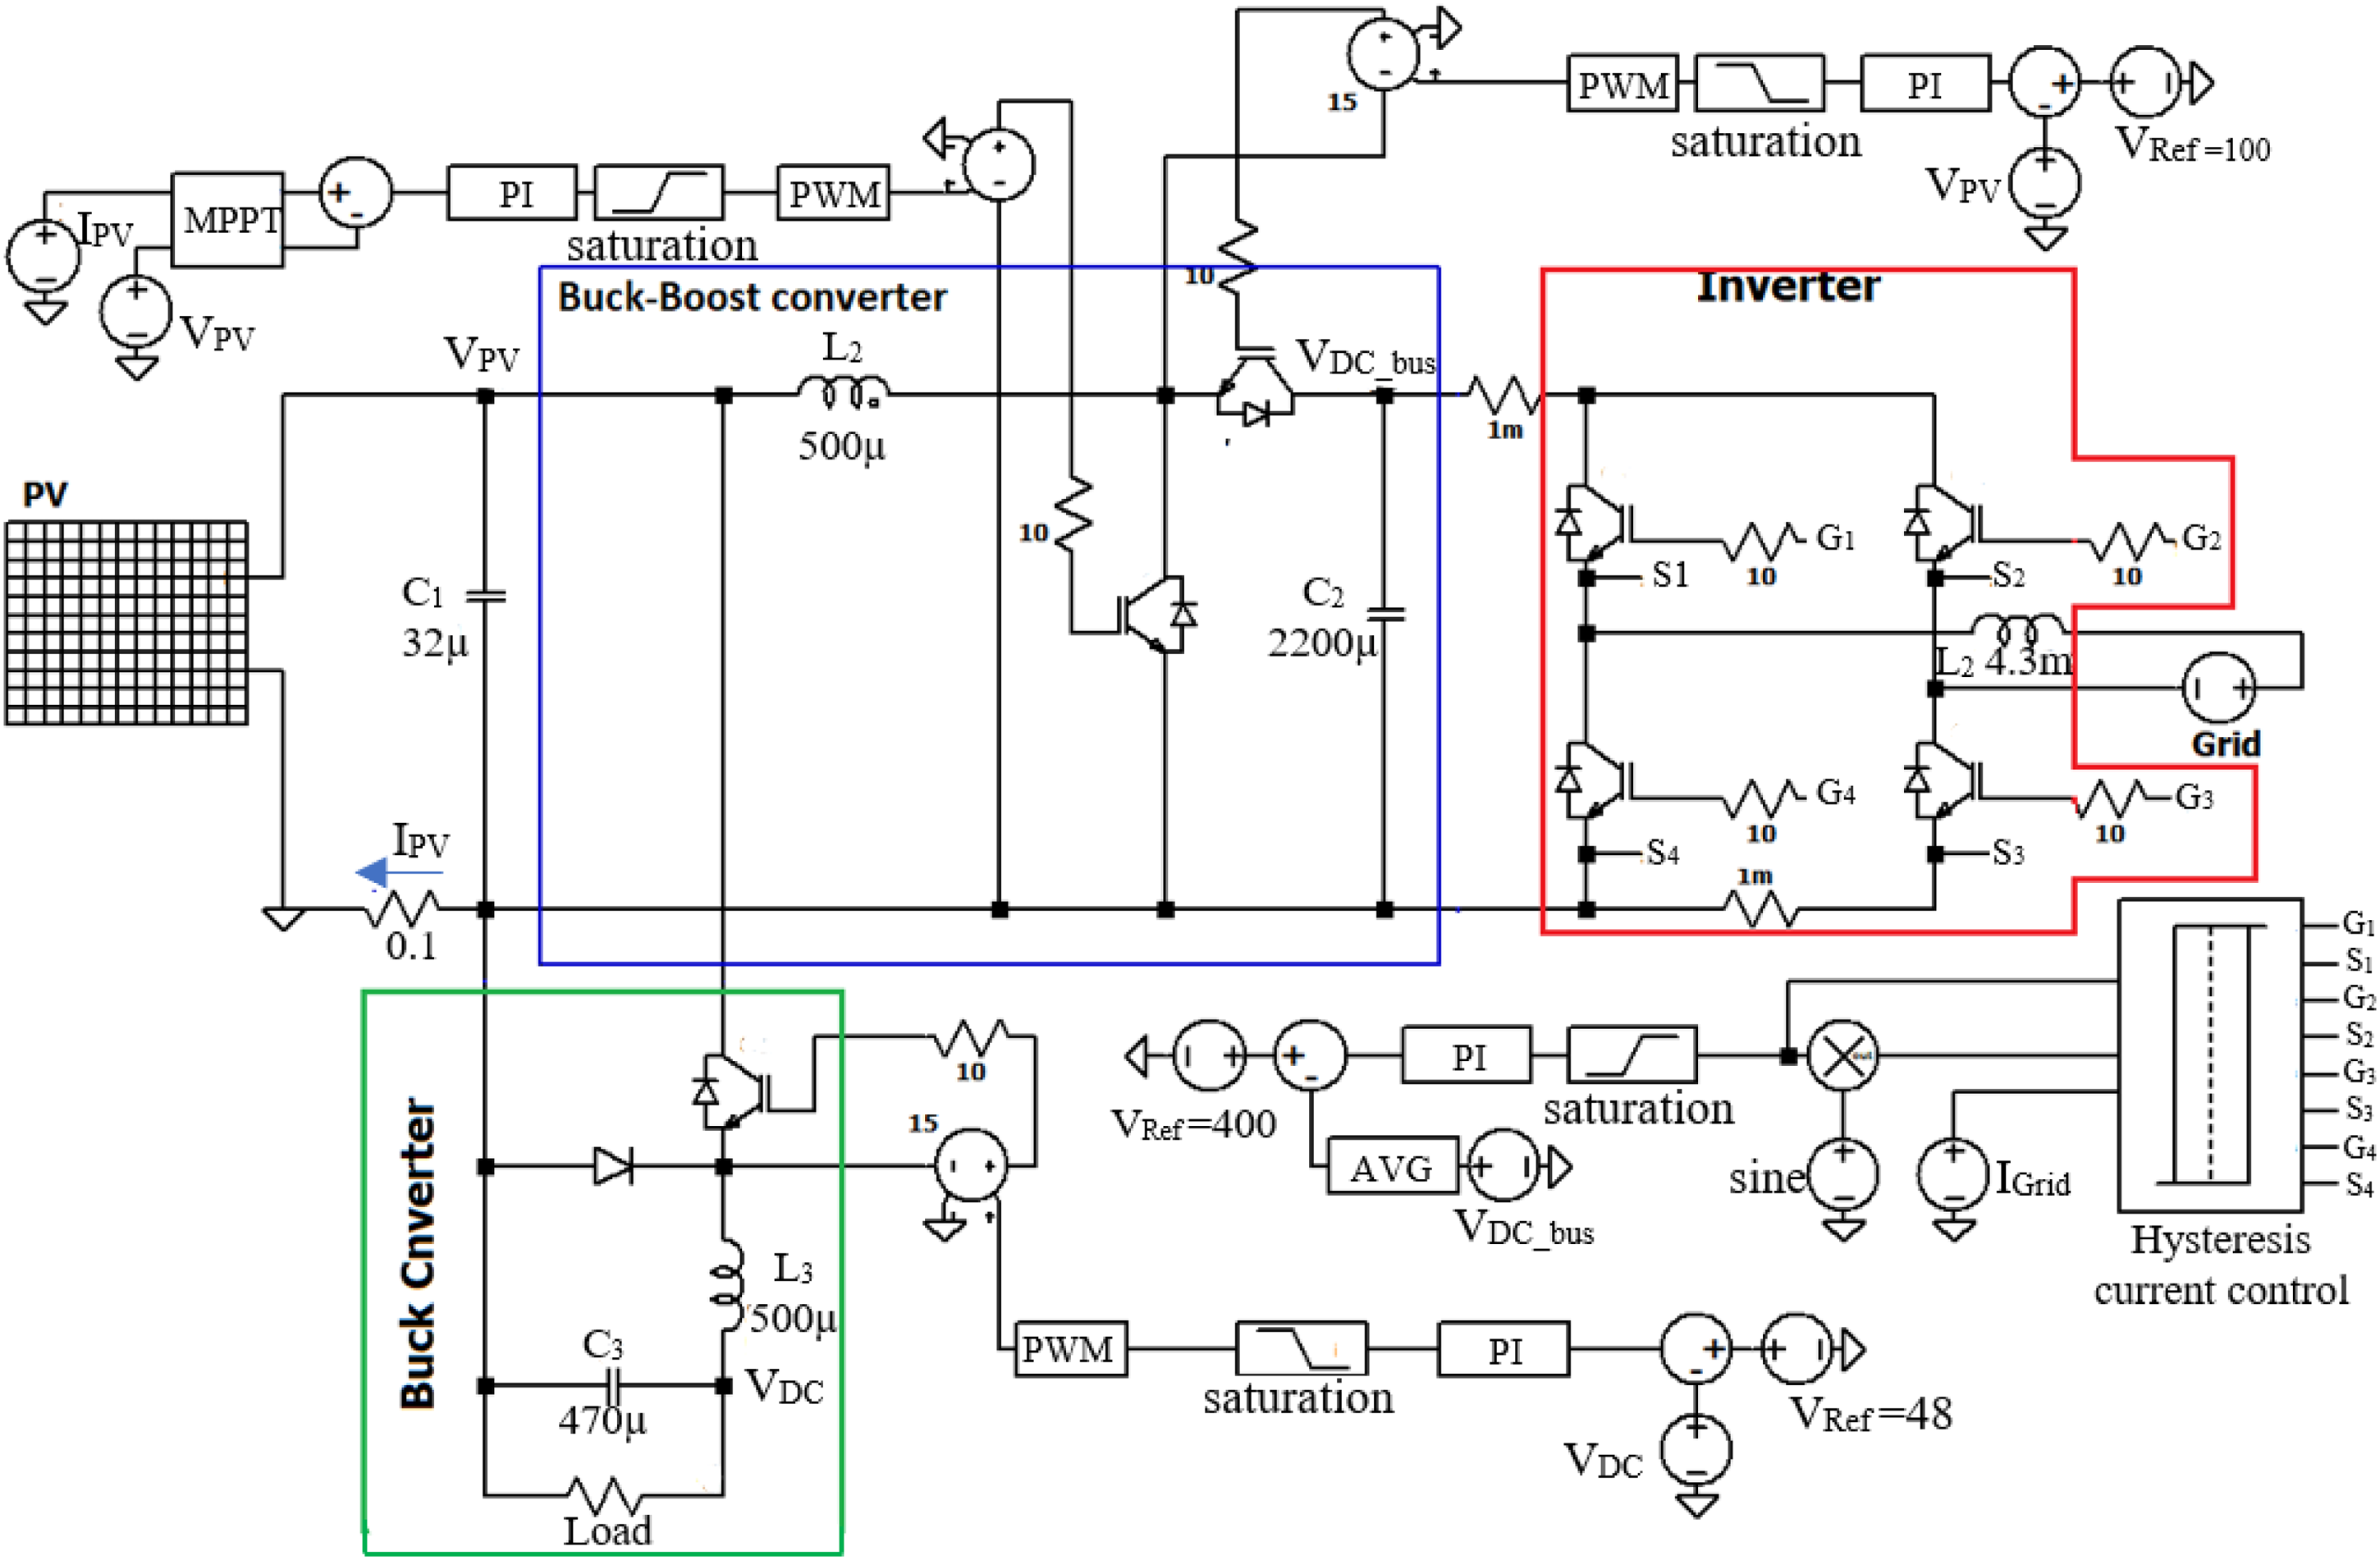
The proposed LVDC new concept.
The evolutions of generated PV power, PV voltage, PV current, main DC-bus voltage, and injected current into the grid are shown in Figure 5.
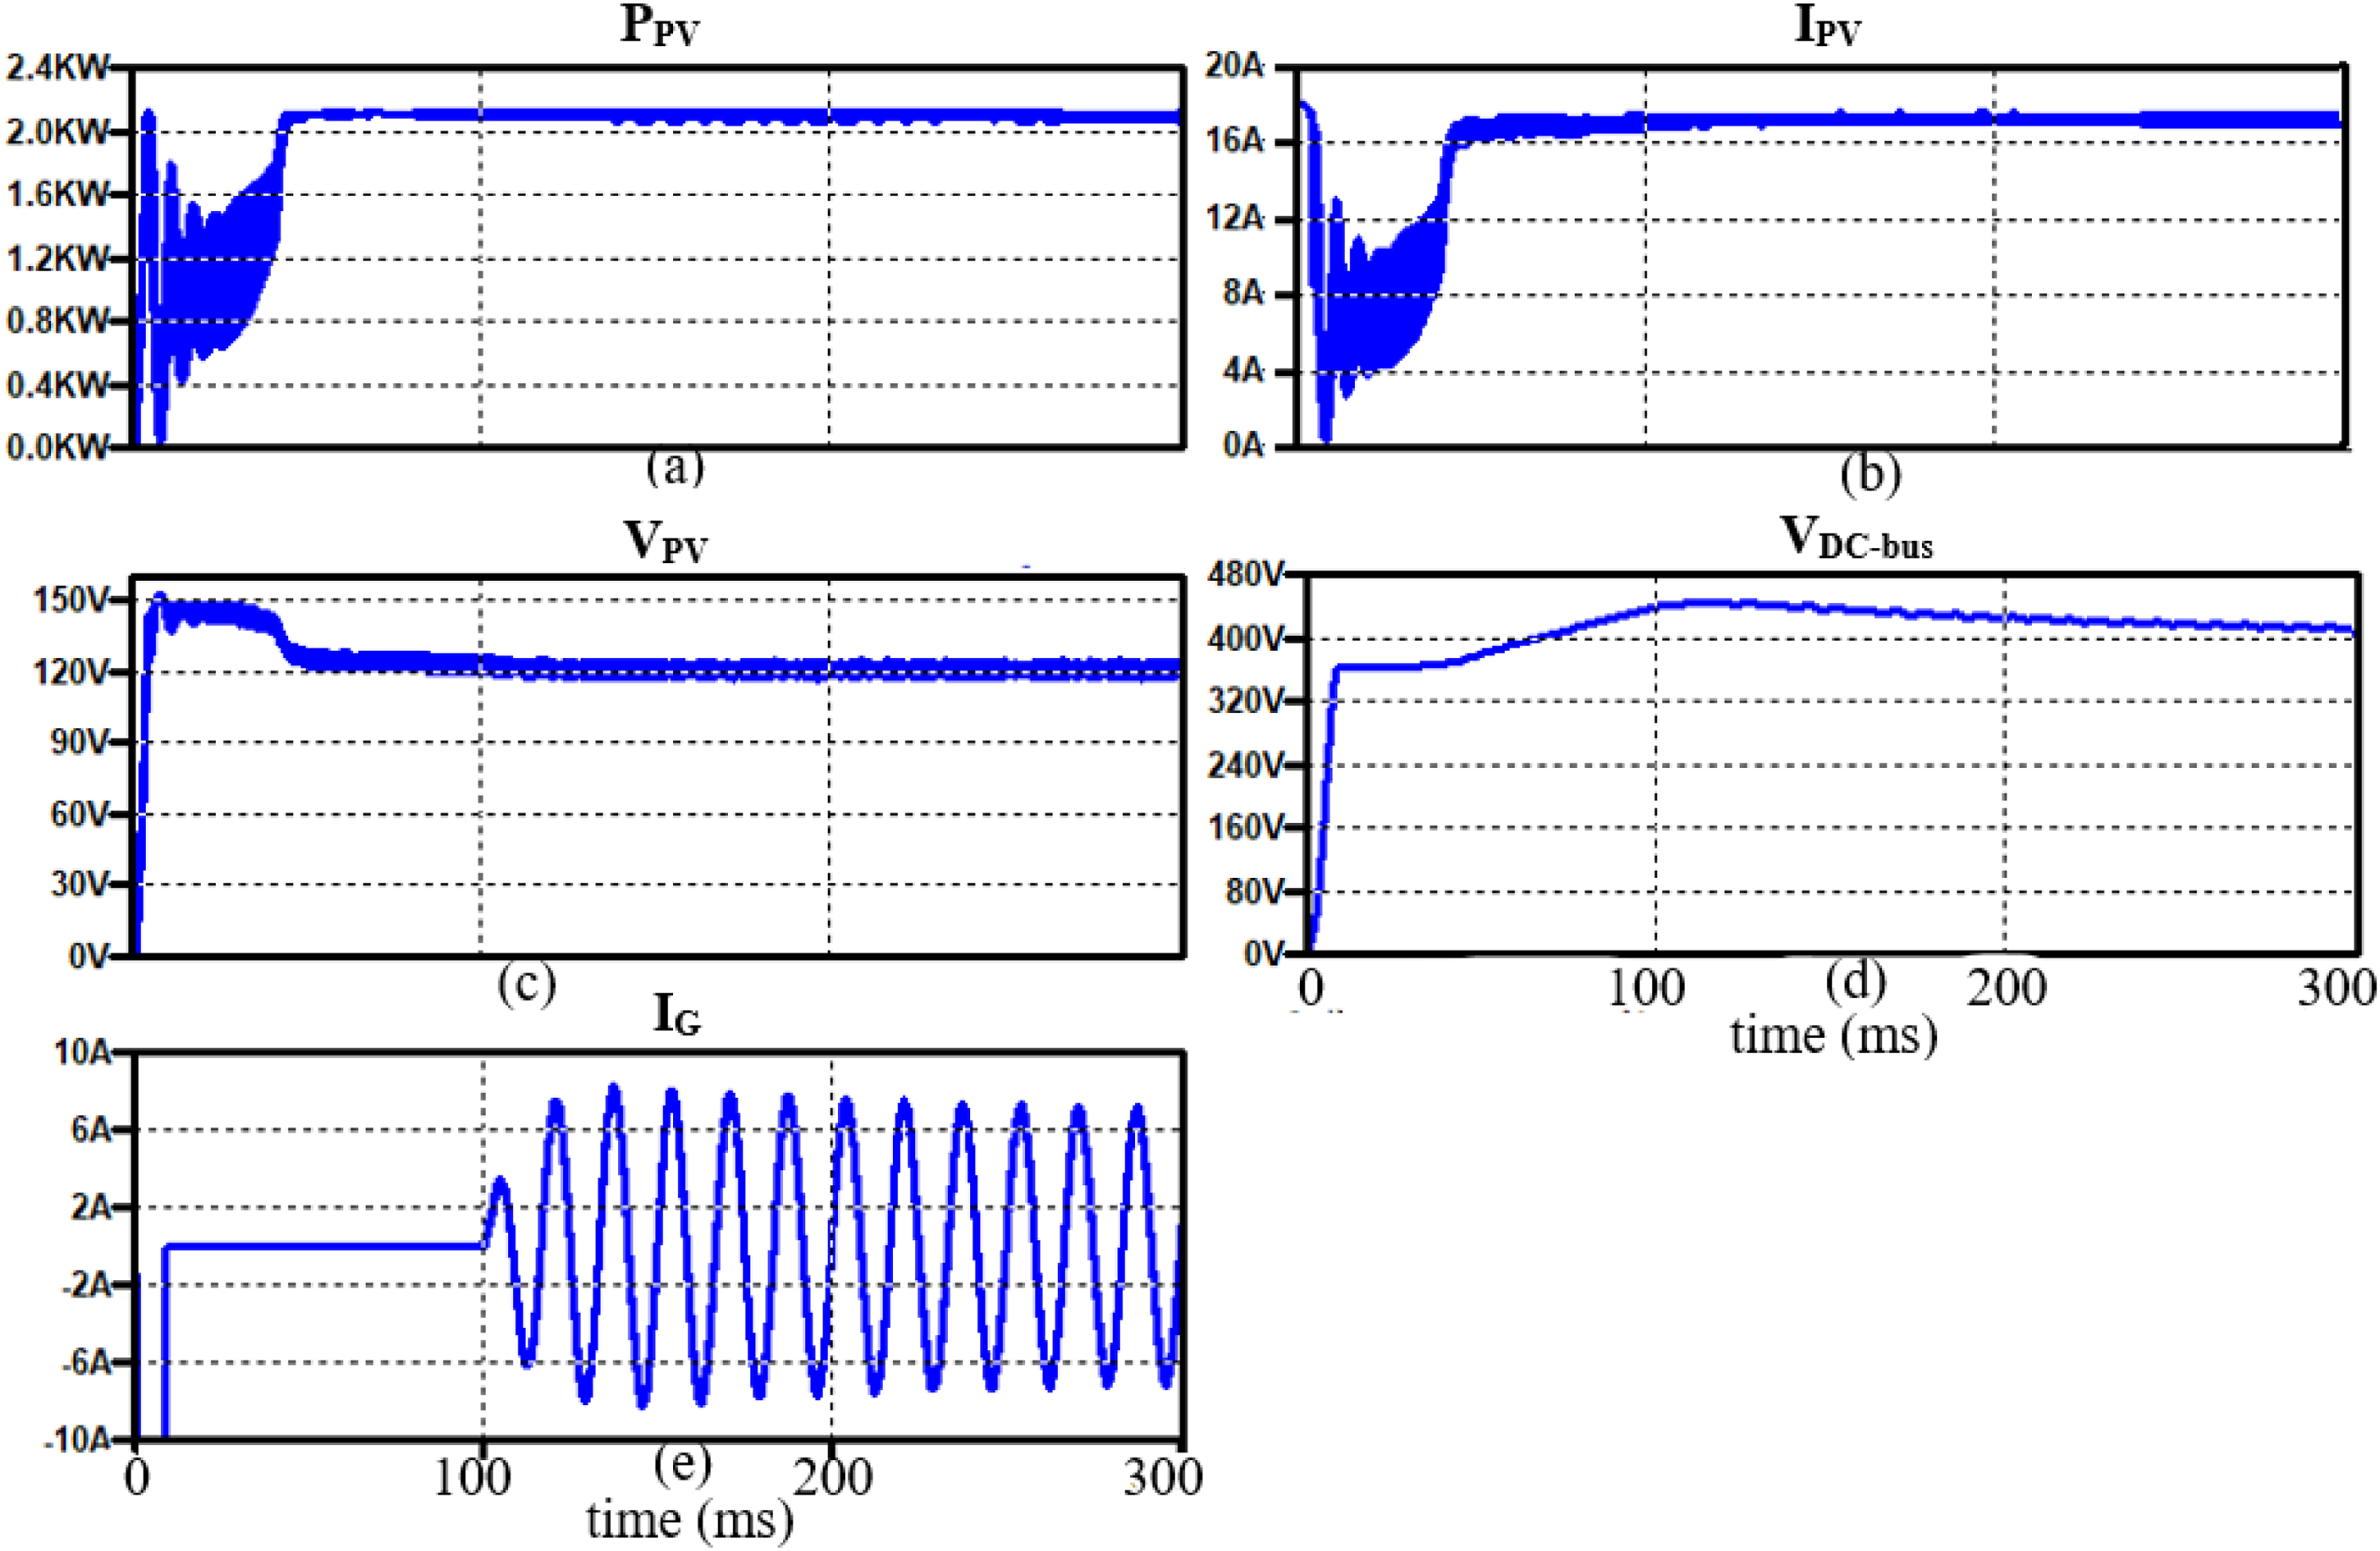
The evolutions of (a) PV power, (b) PV voltage (c) PV current, (d) DC-bus voltage, and (e) injected current into grid.
Figure 6 shows the photo of the proposed LVDC architecture (system 3) realization. It mainly consists of a buck-boost converter, inverter, and buck converter for supplying DC loads. In addition, the MicroLab box (from dSPACE) module is used to control the complete circuit. The controlled devices used in the different converters are N-channel IGBT IKW30N60T with antiparallel diodes. The generated output current by the nanogrid is shown in Figure 7.
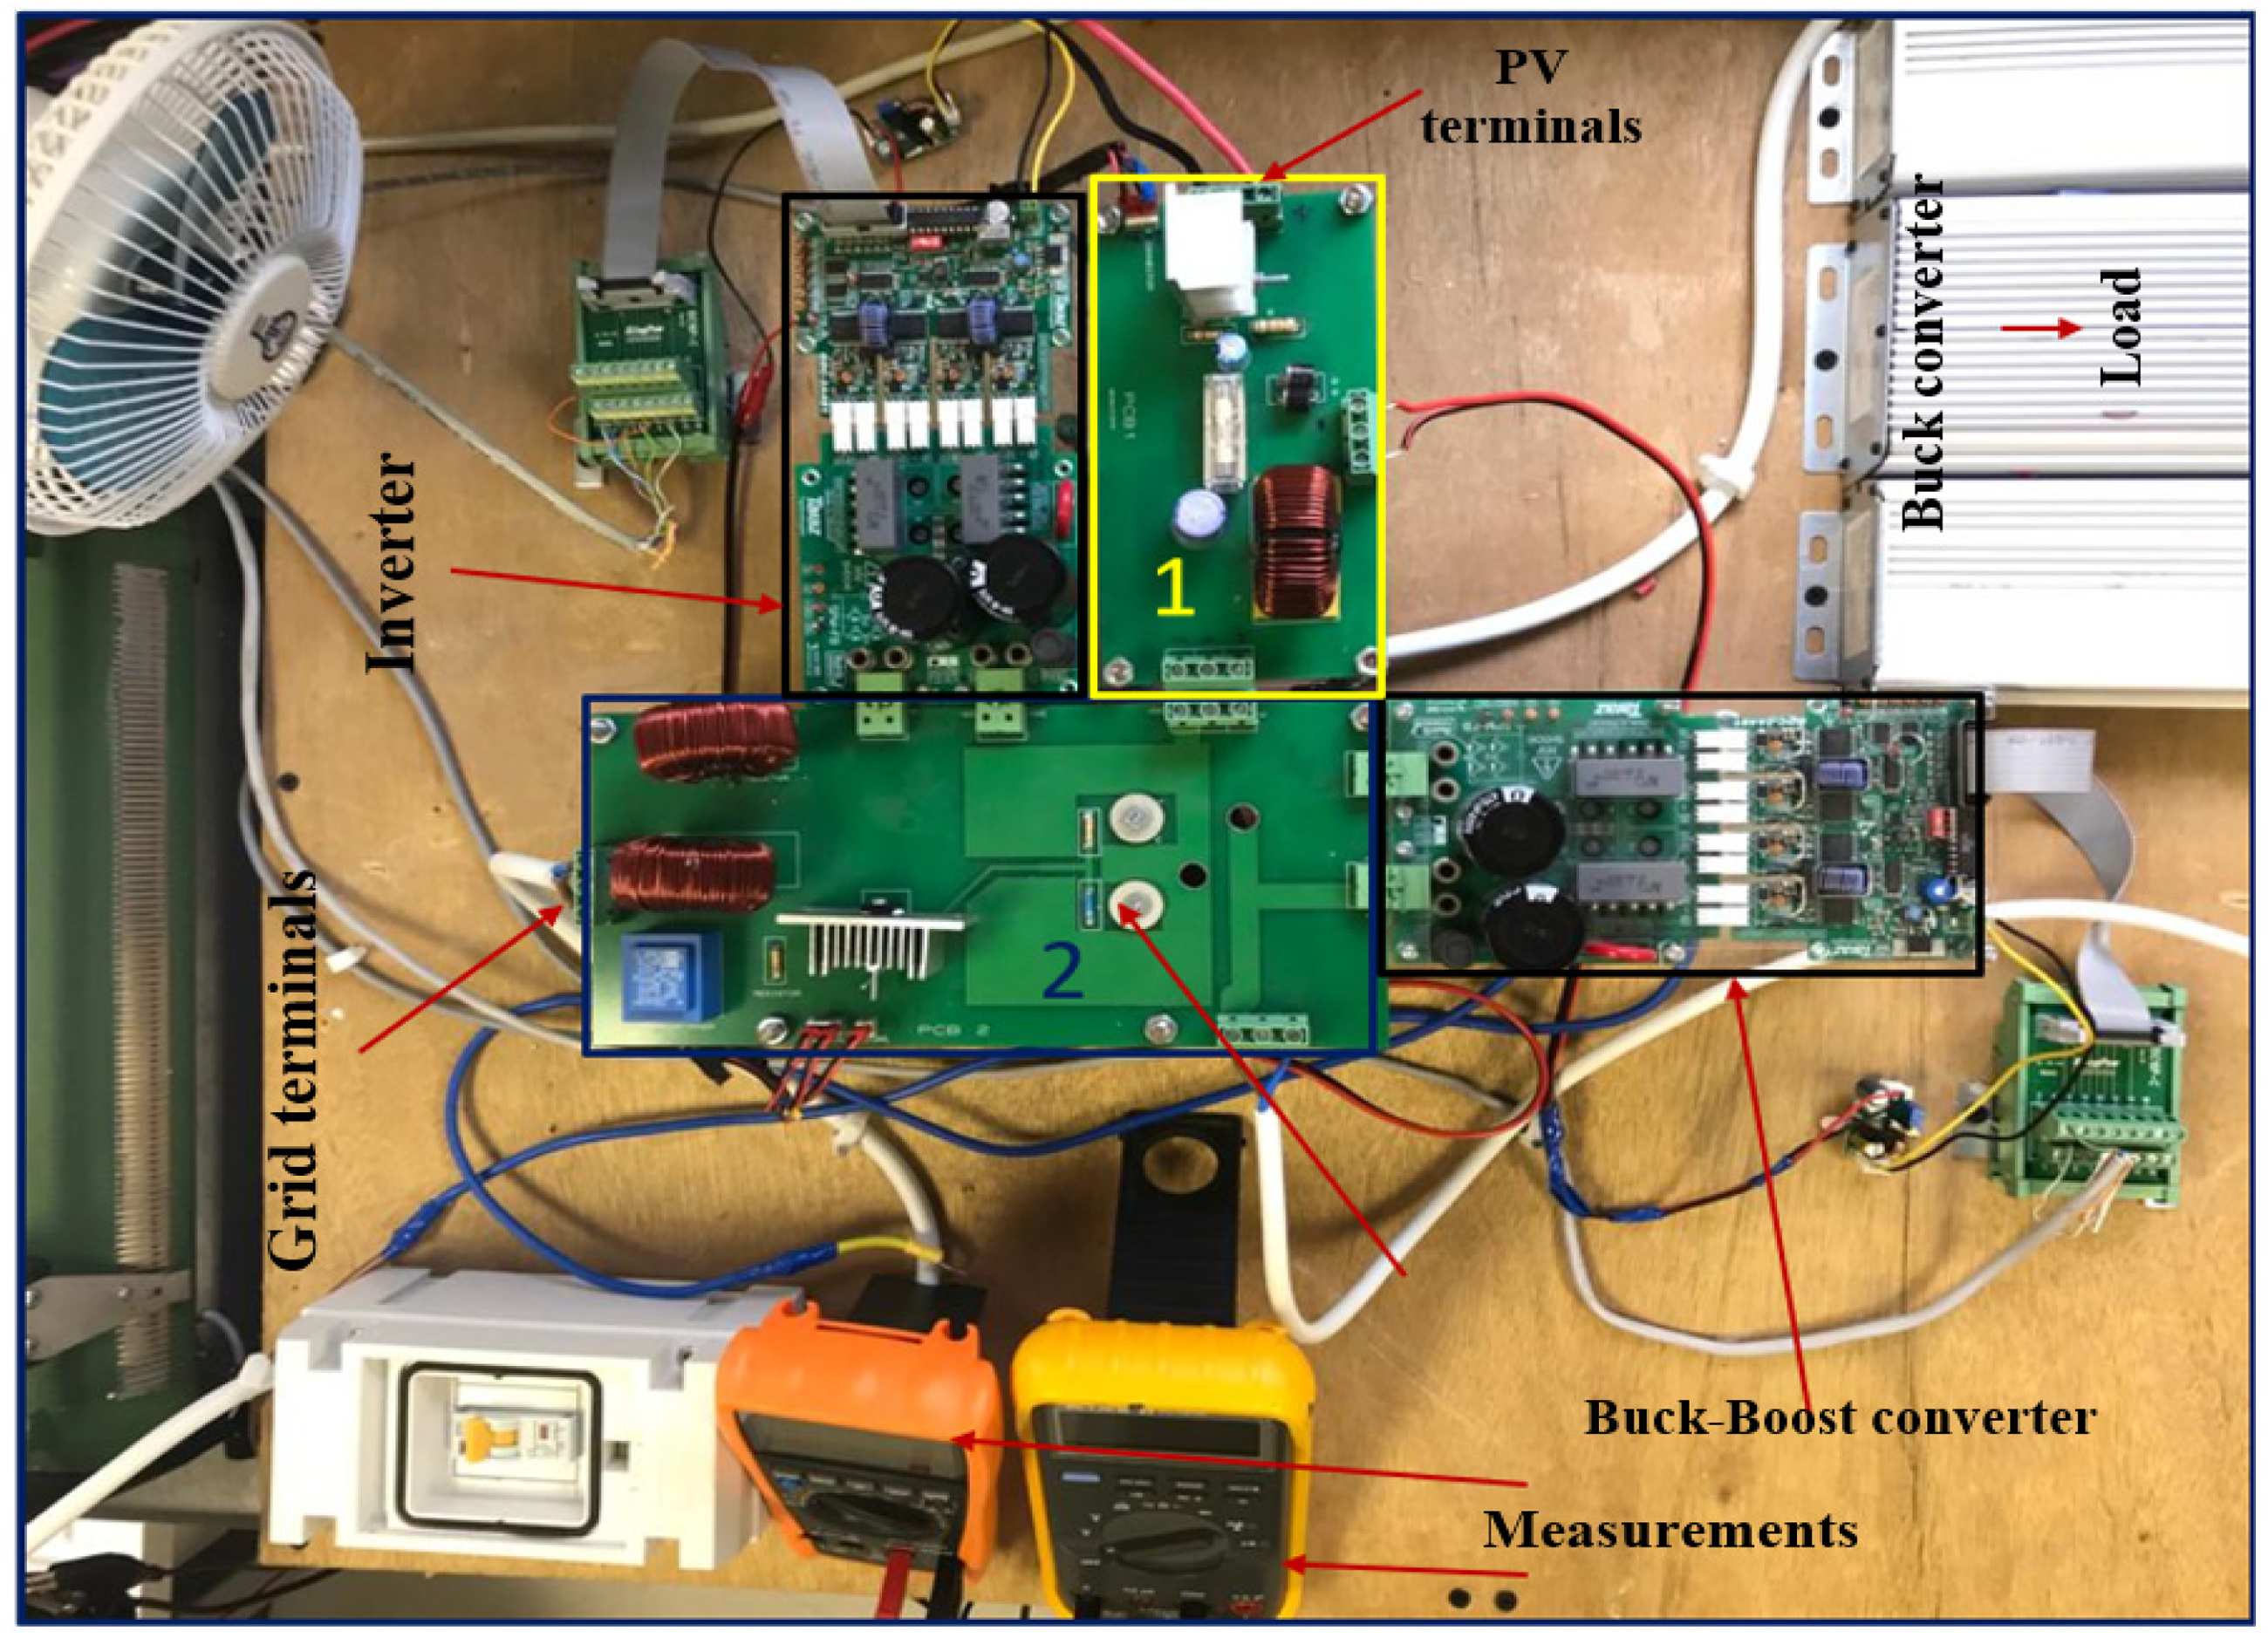
Realization of the proposed LVDC system 3.
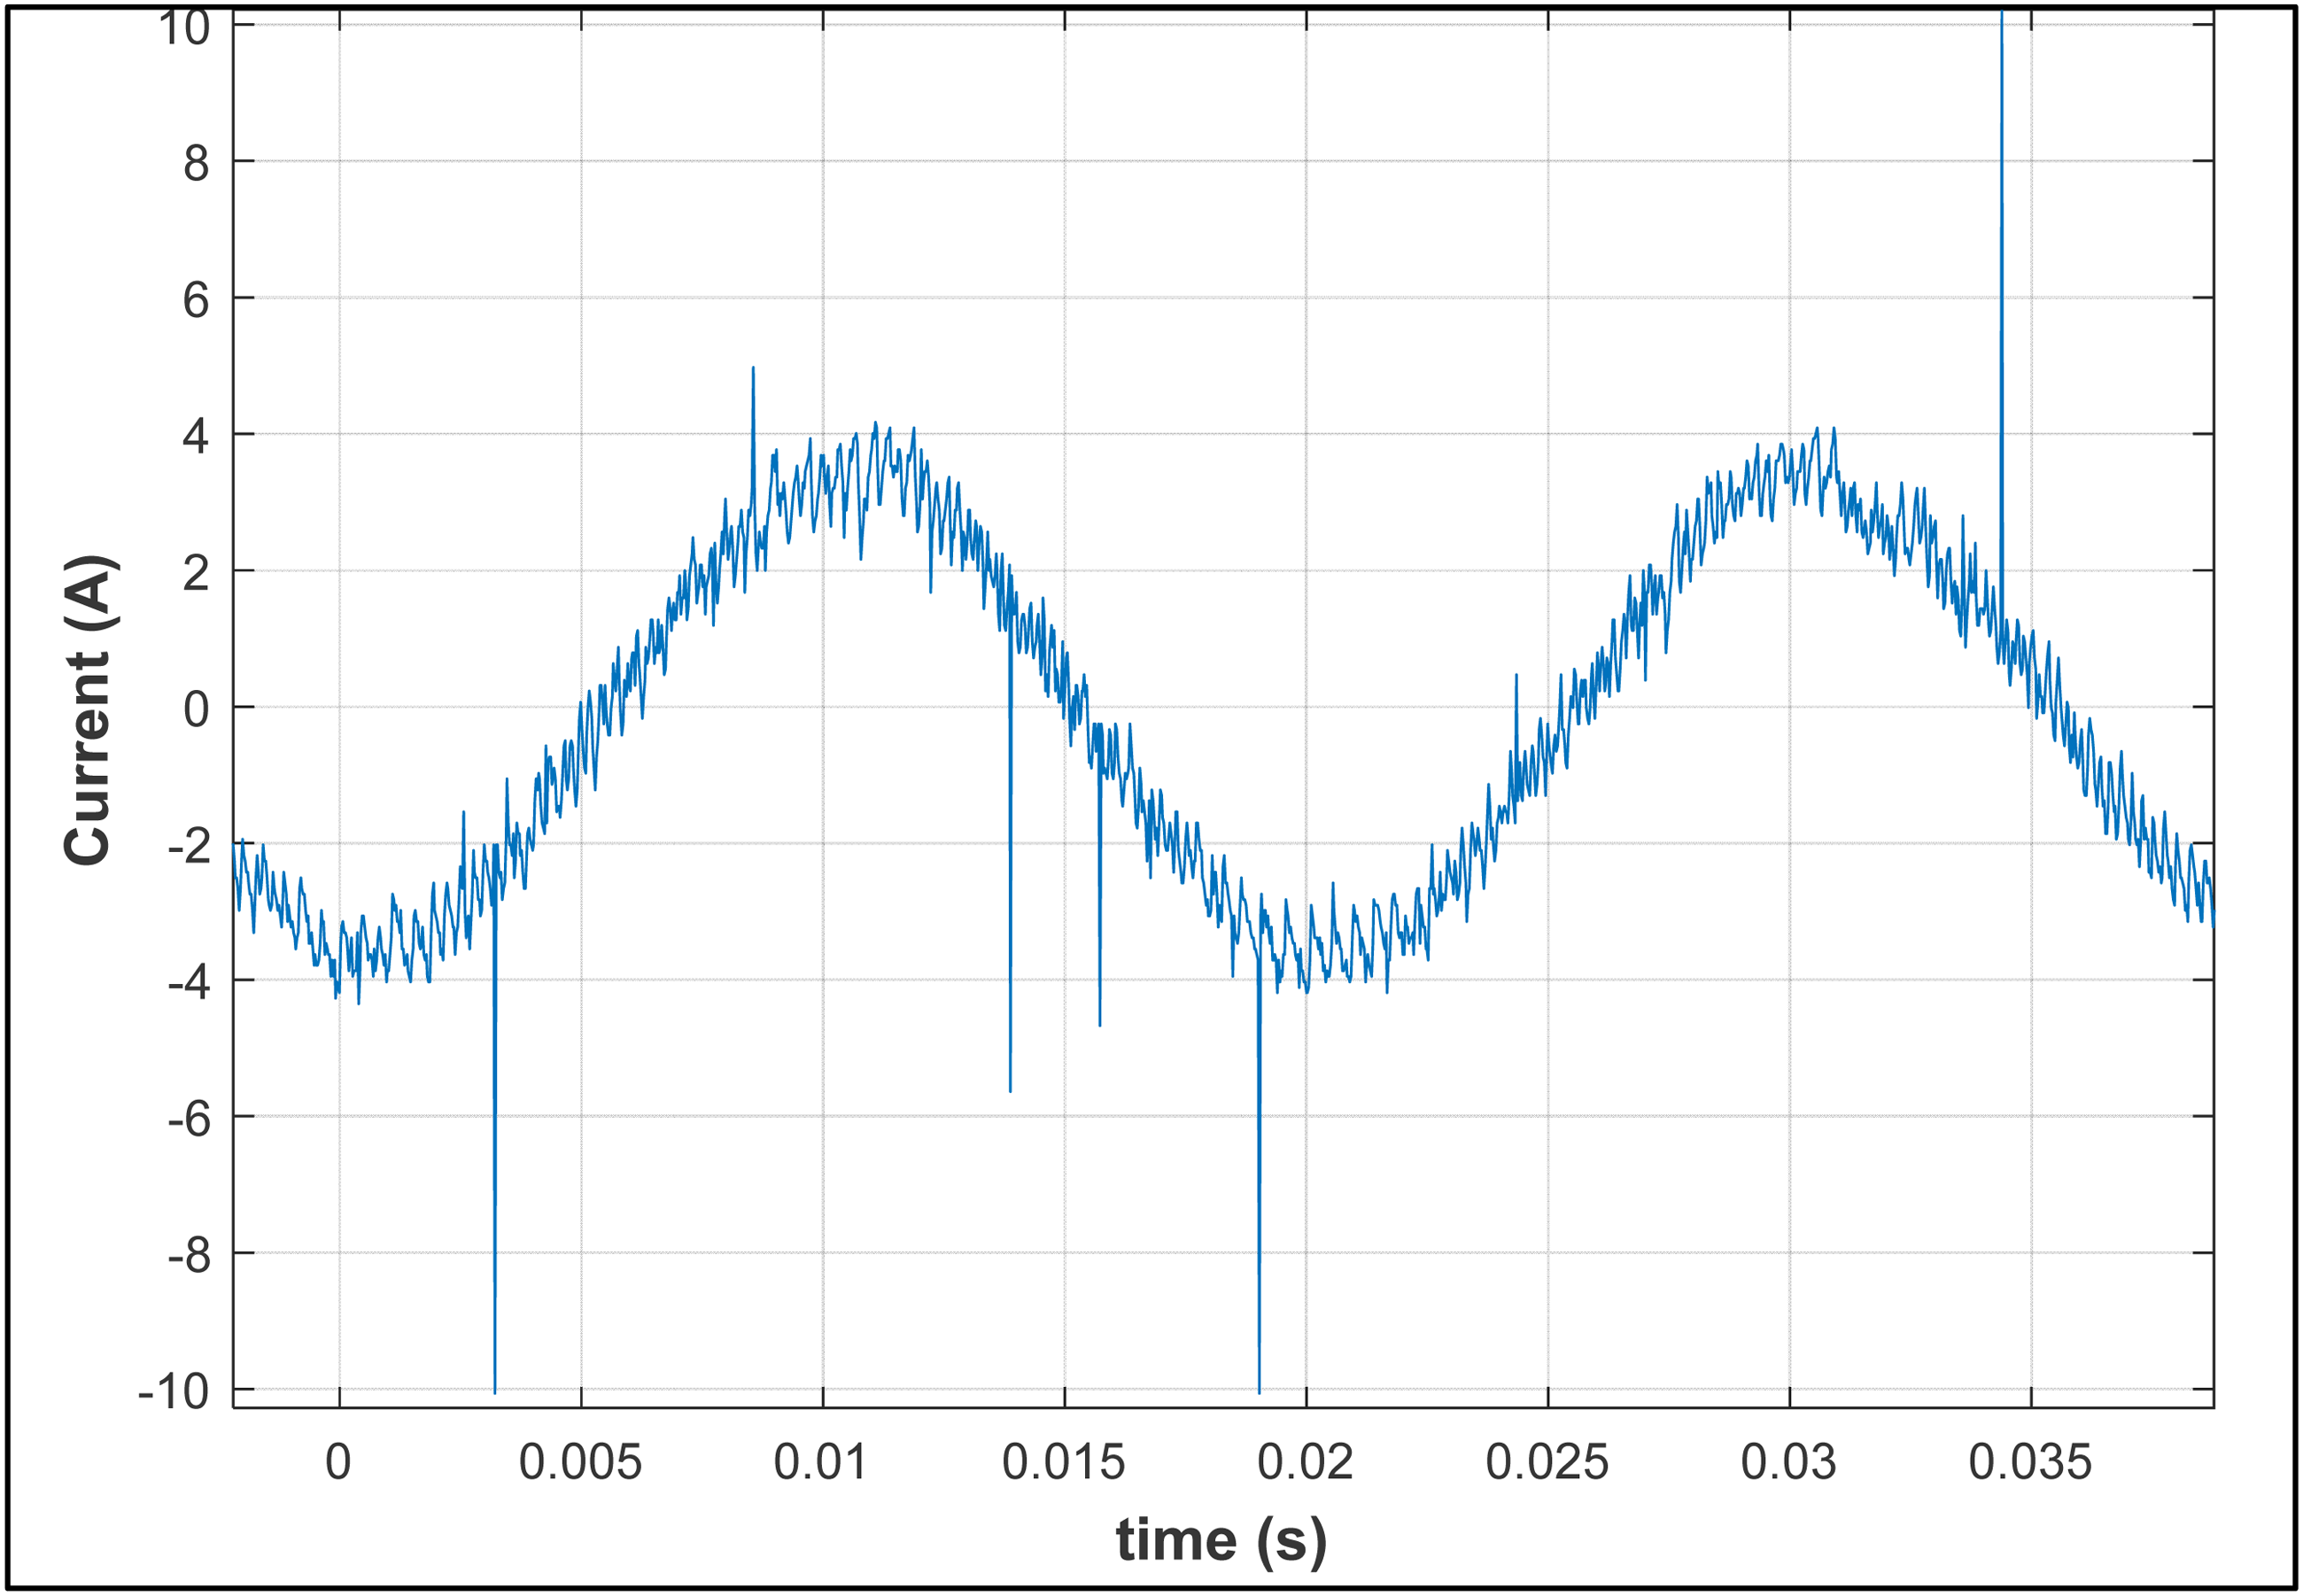
The expermintal generated current, injected into the grid by the proposed LVDC architecture (system 3).
Figure 8 shows the PV current, PV voltage, and generated transient power evolutions obtained by experiments from PV panels on 1/03/2021 at 10.00 am. The number of panels used in this study is three panels connected in series.
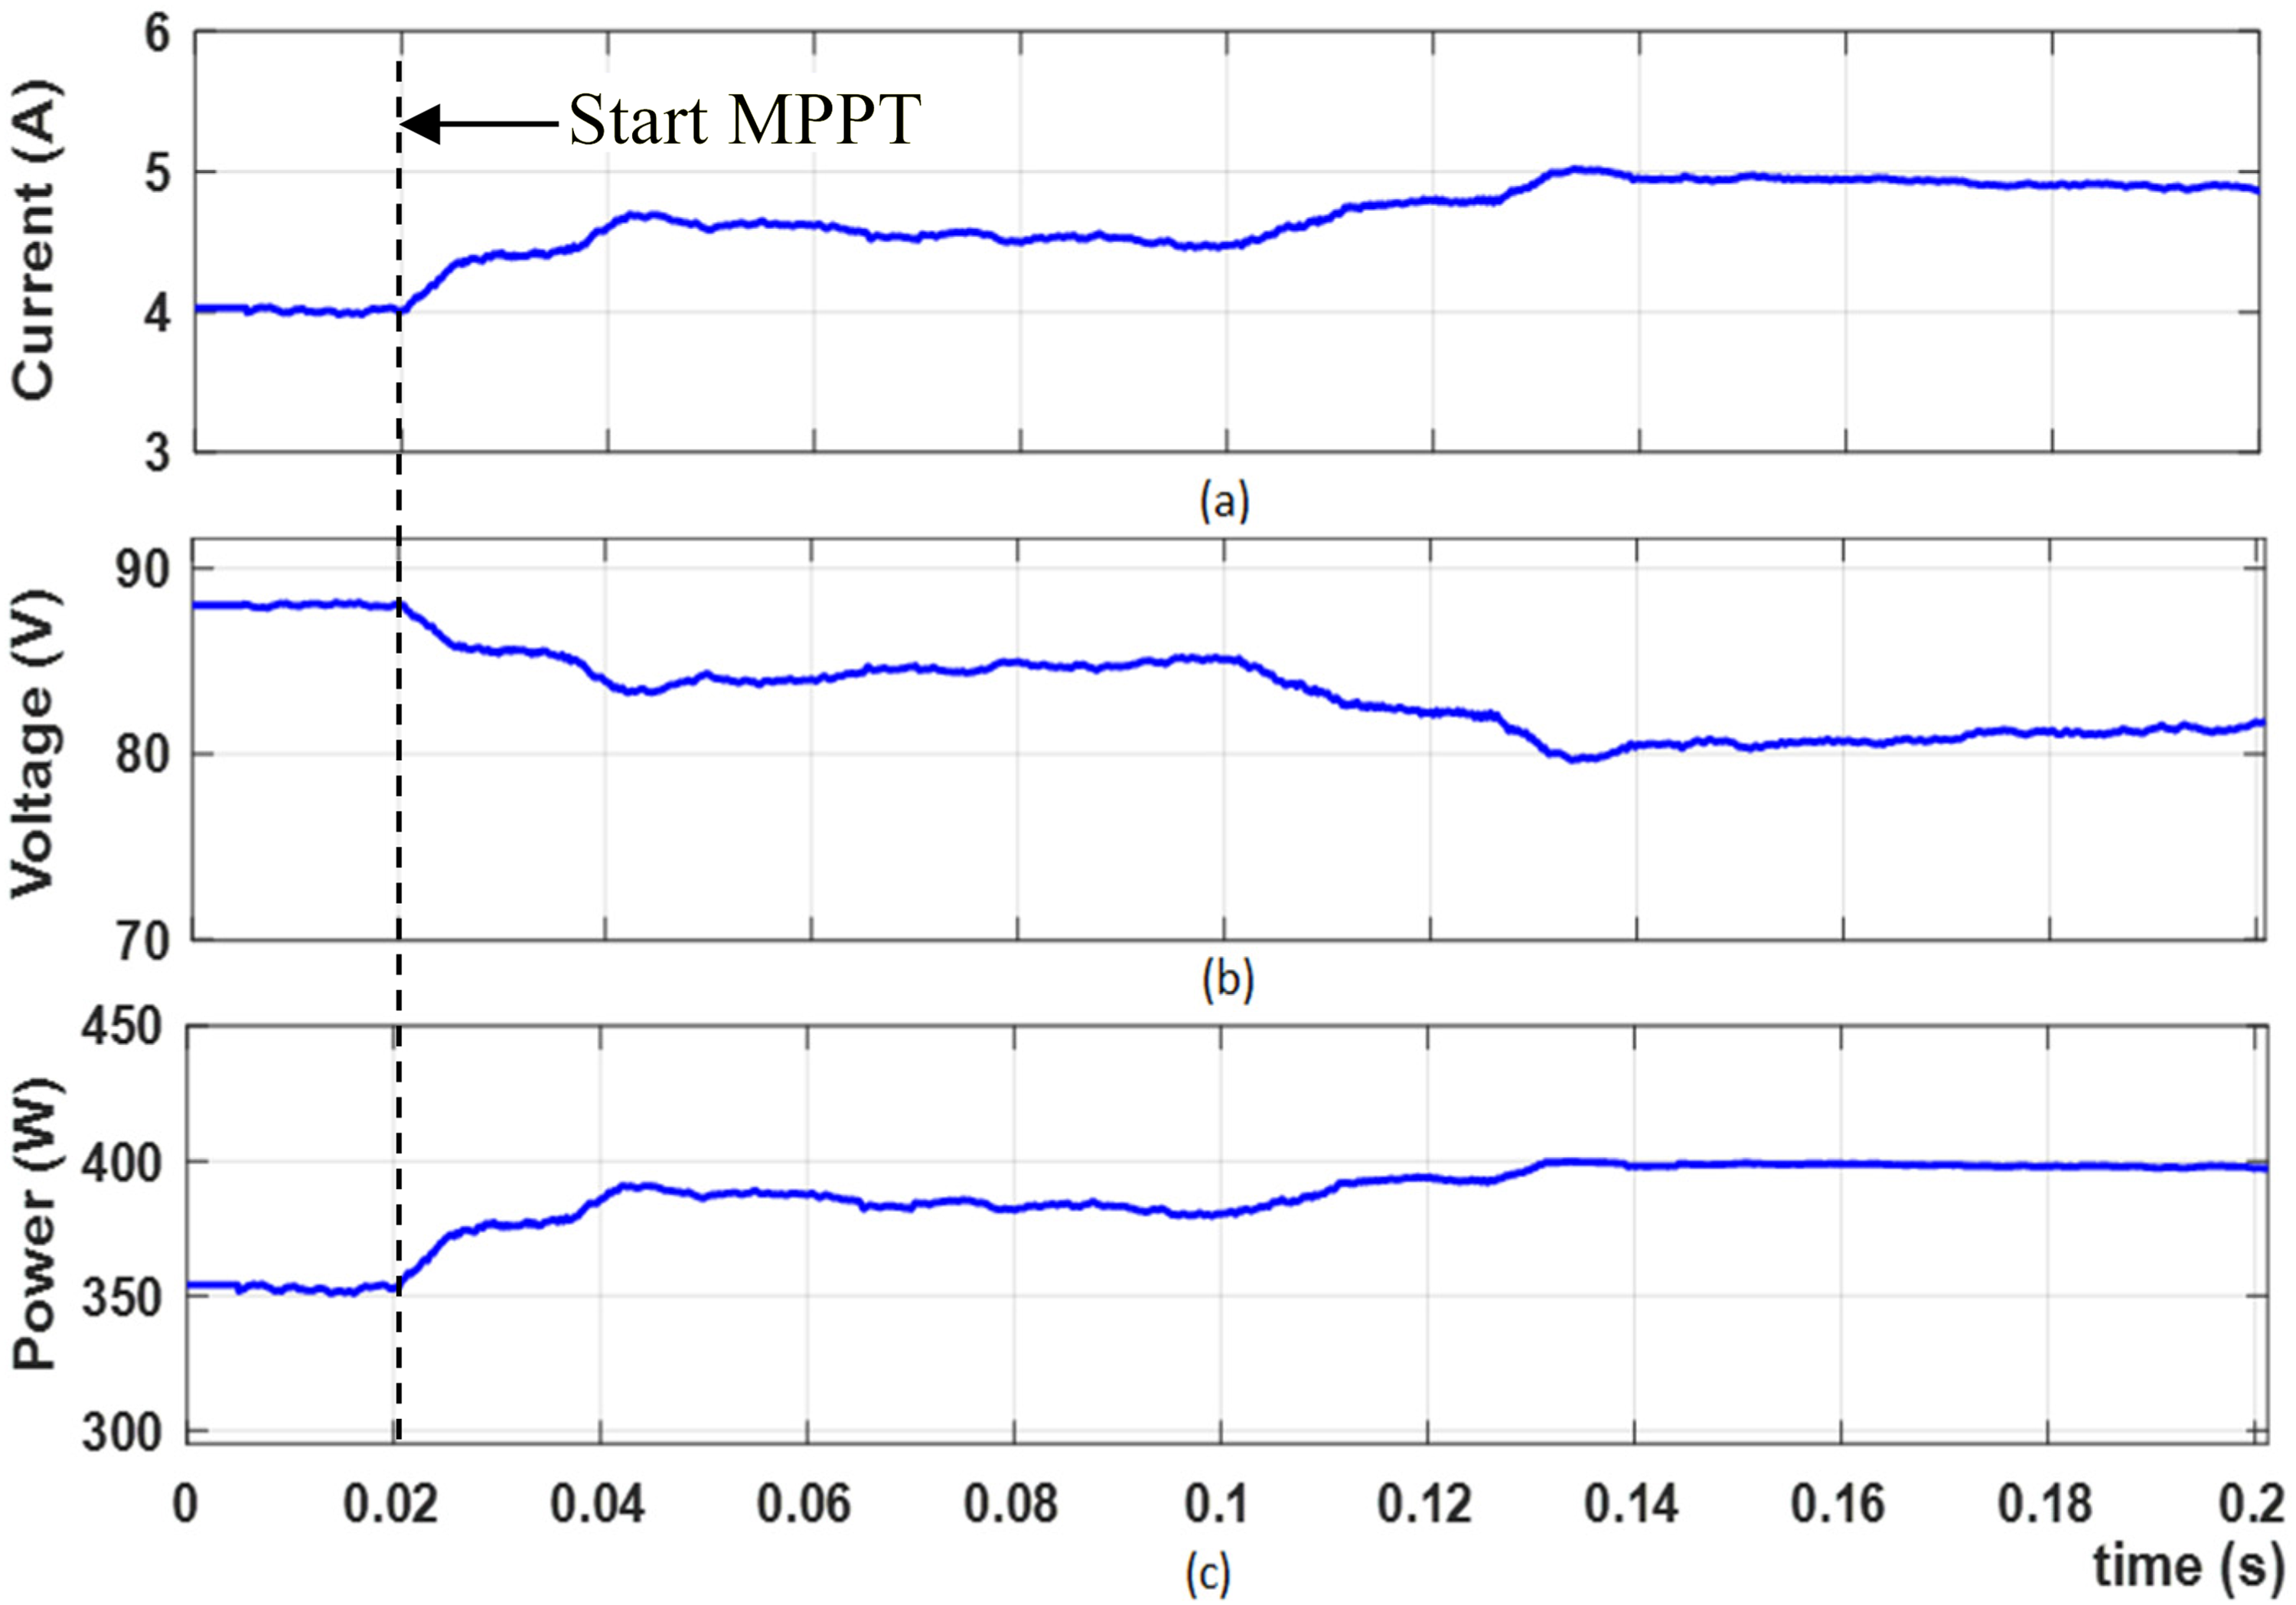
Pv current, PV voltage, and PV generated power waveforms, obtained by experiments, of three PV panels connected in series during MPPT transient.
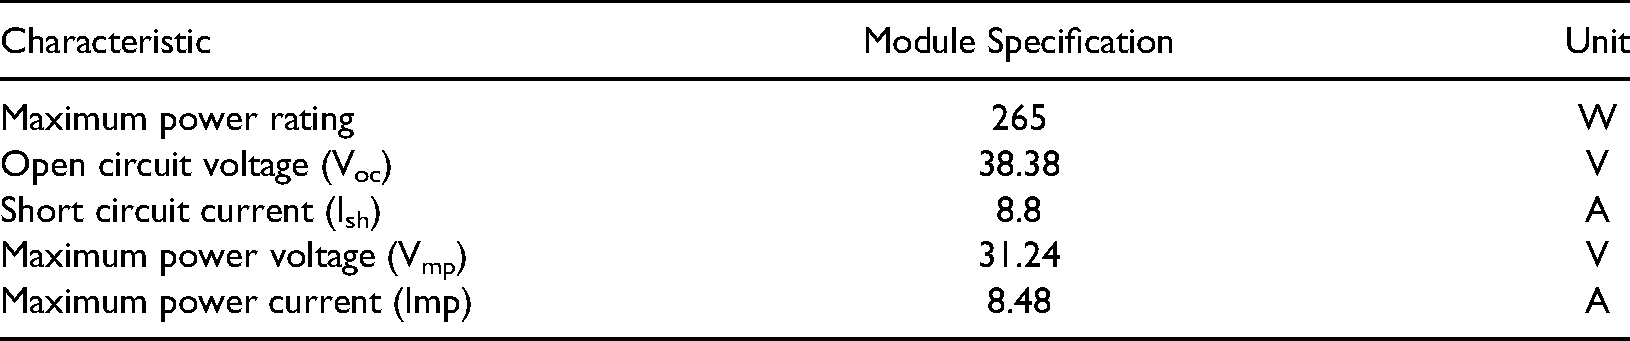
The PV panel, irradiance sensor, temperature sensor, and wind sensor are shown in Figure 9. Figure 10 shows experimental I-V curves and deduced P-V curves, of an elementary ''JaSolar'' panel, at three different times during a day. The maximum output power from one PV panel at 1024.6 W/m2 and cell temperature equal to 68.6° C is 160 W. The electrical characteristics of a new PV module ''JaSolar'' are shown in Table 1.
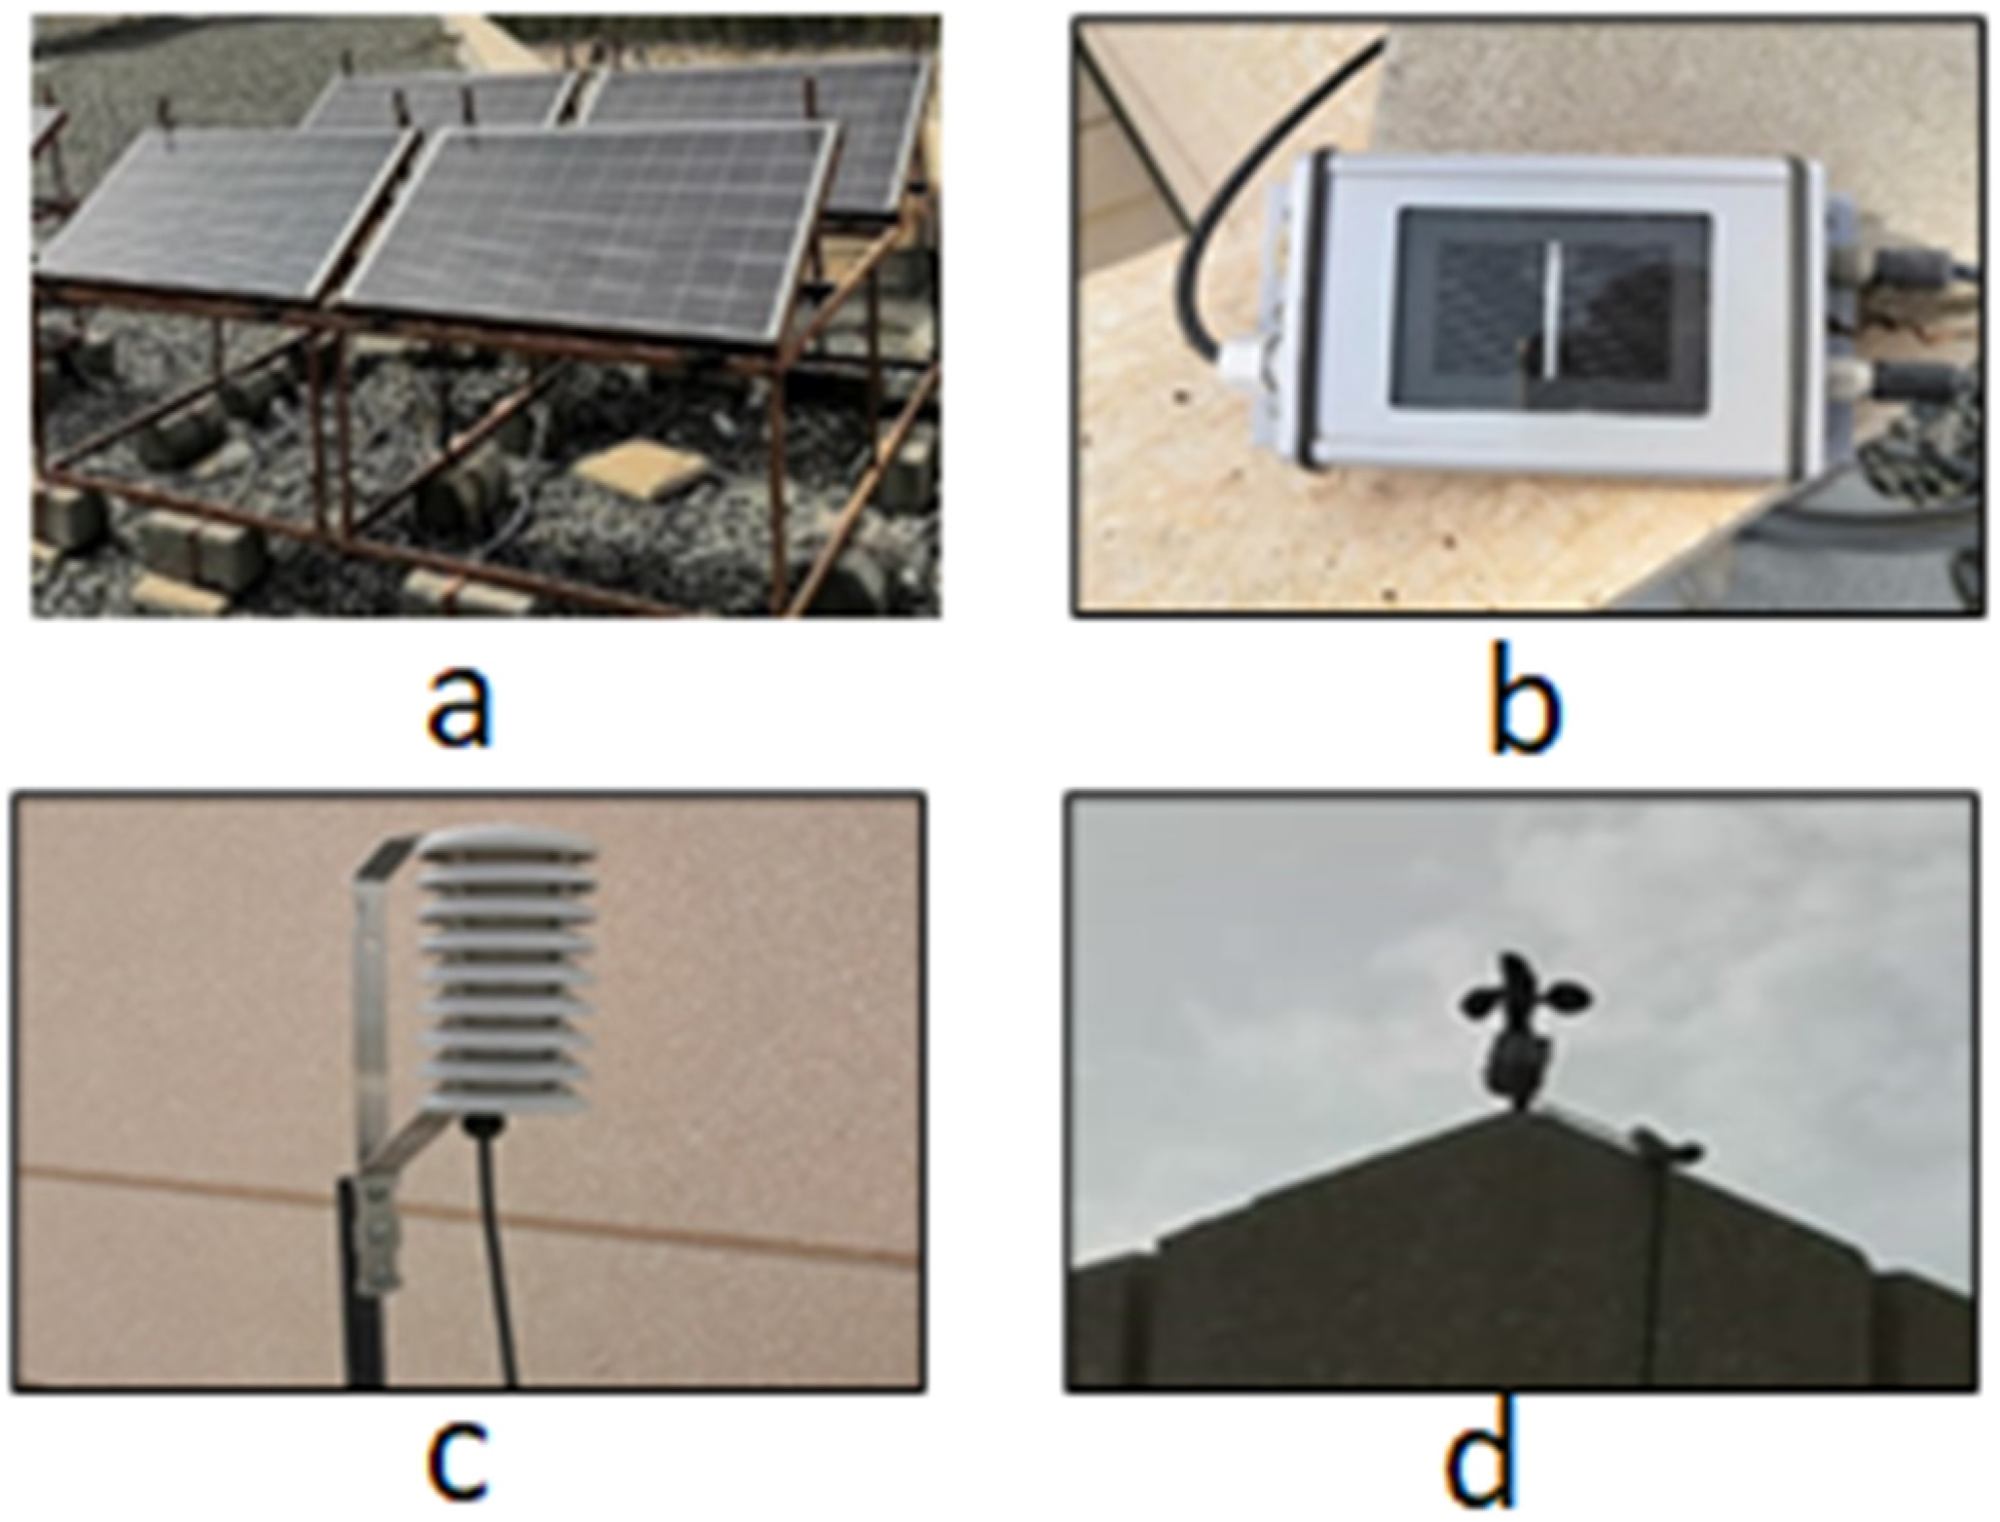
(a) PV panel (b) irradiance sensor (c) temperature sensor (d) wind sensor.
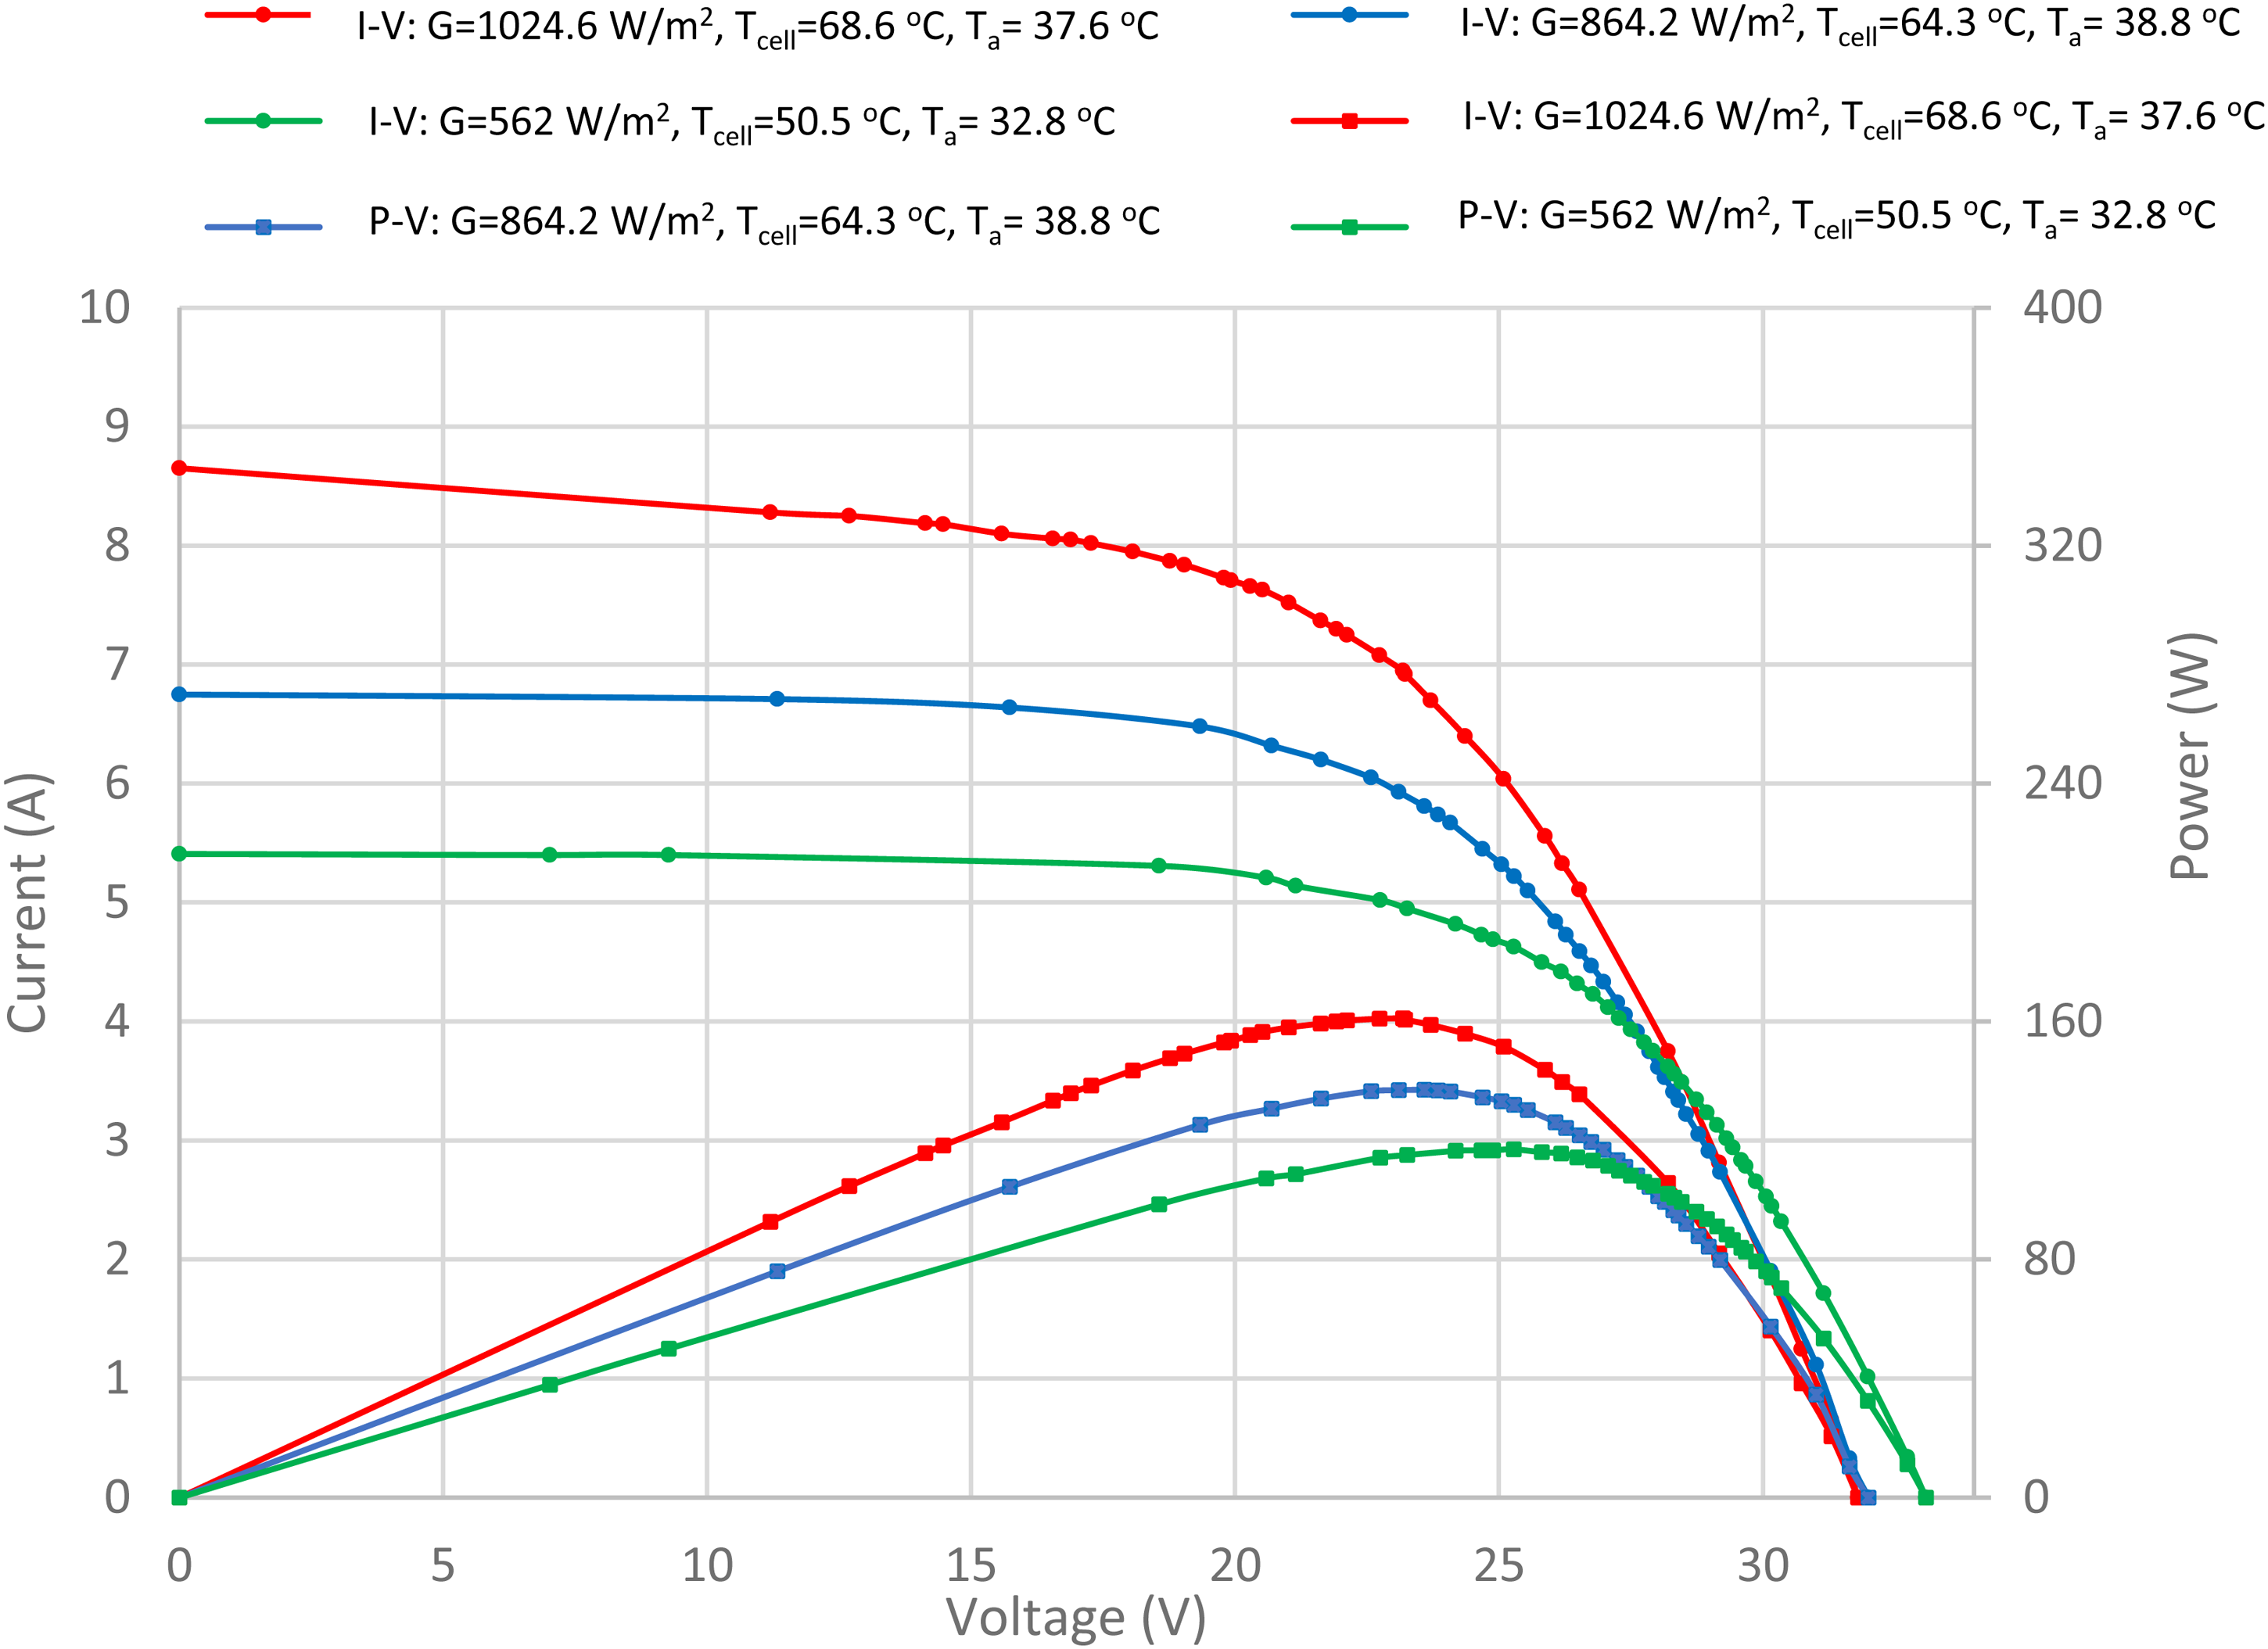
I-V and P-V by experimental investigations in 11/03/2021.
The electrical characteristics of the PV module ''JaSolar'' at 1000W/m2 and 25°C.
The different converters’ efficiencies are evaluated by experiments on the realized nanogrid. Figure 11 shows the evolutions of these efficiencies as a function of output power.
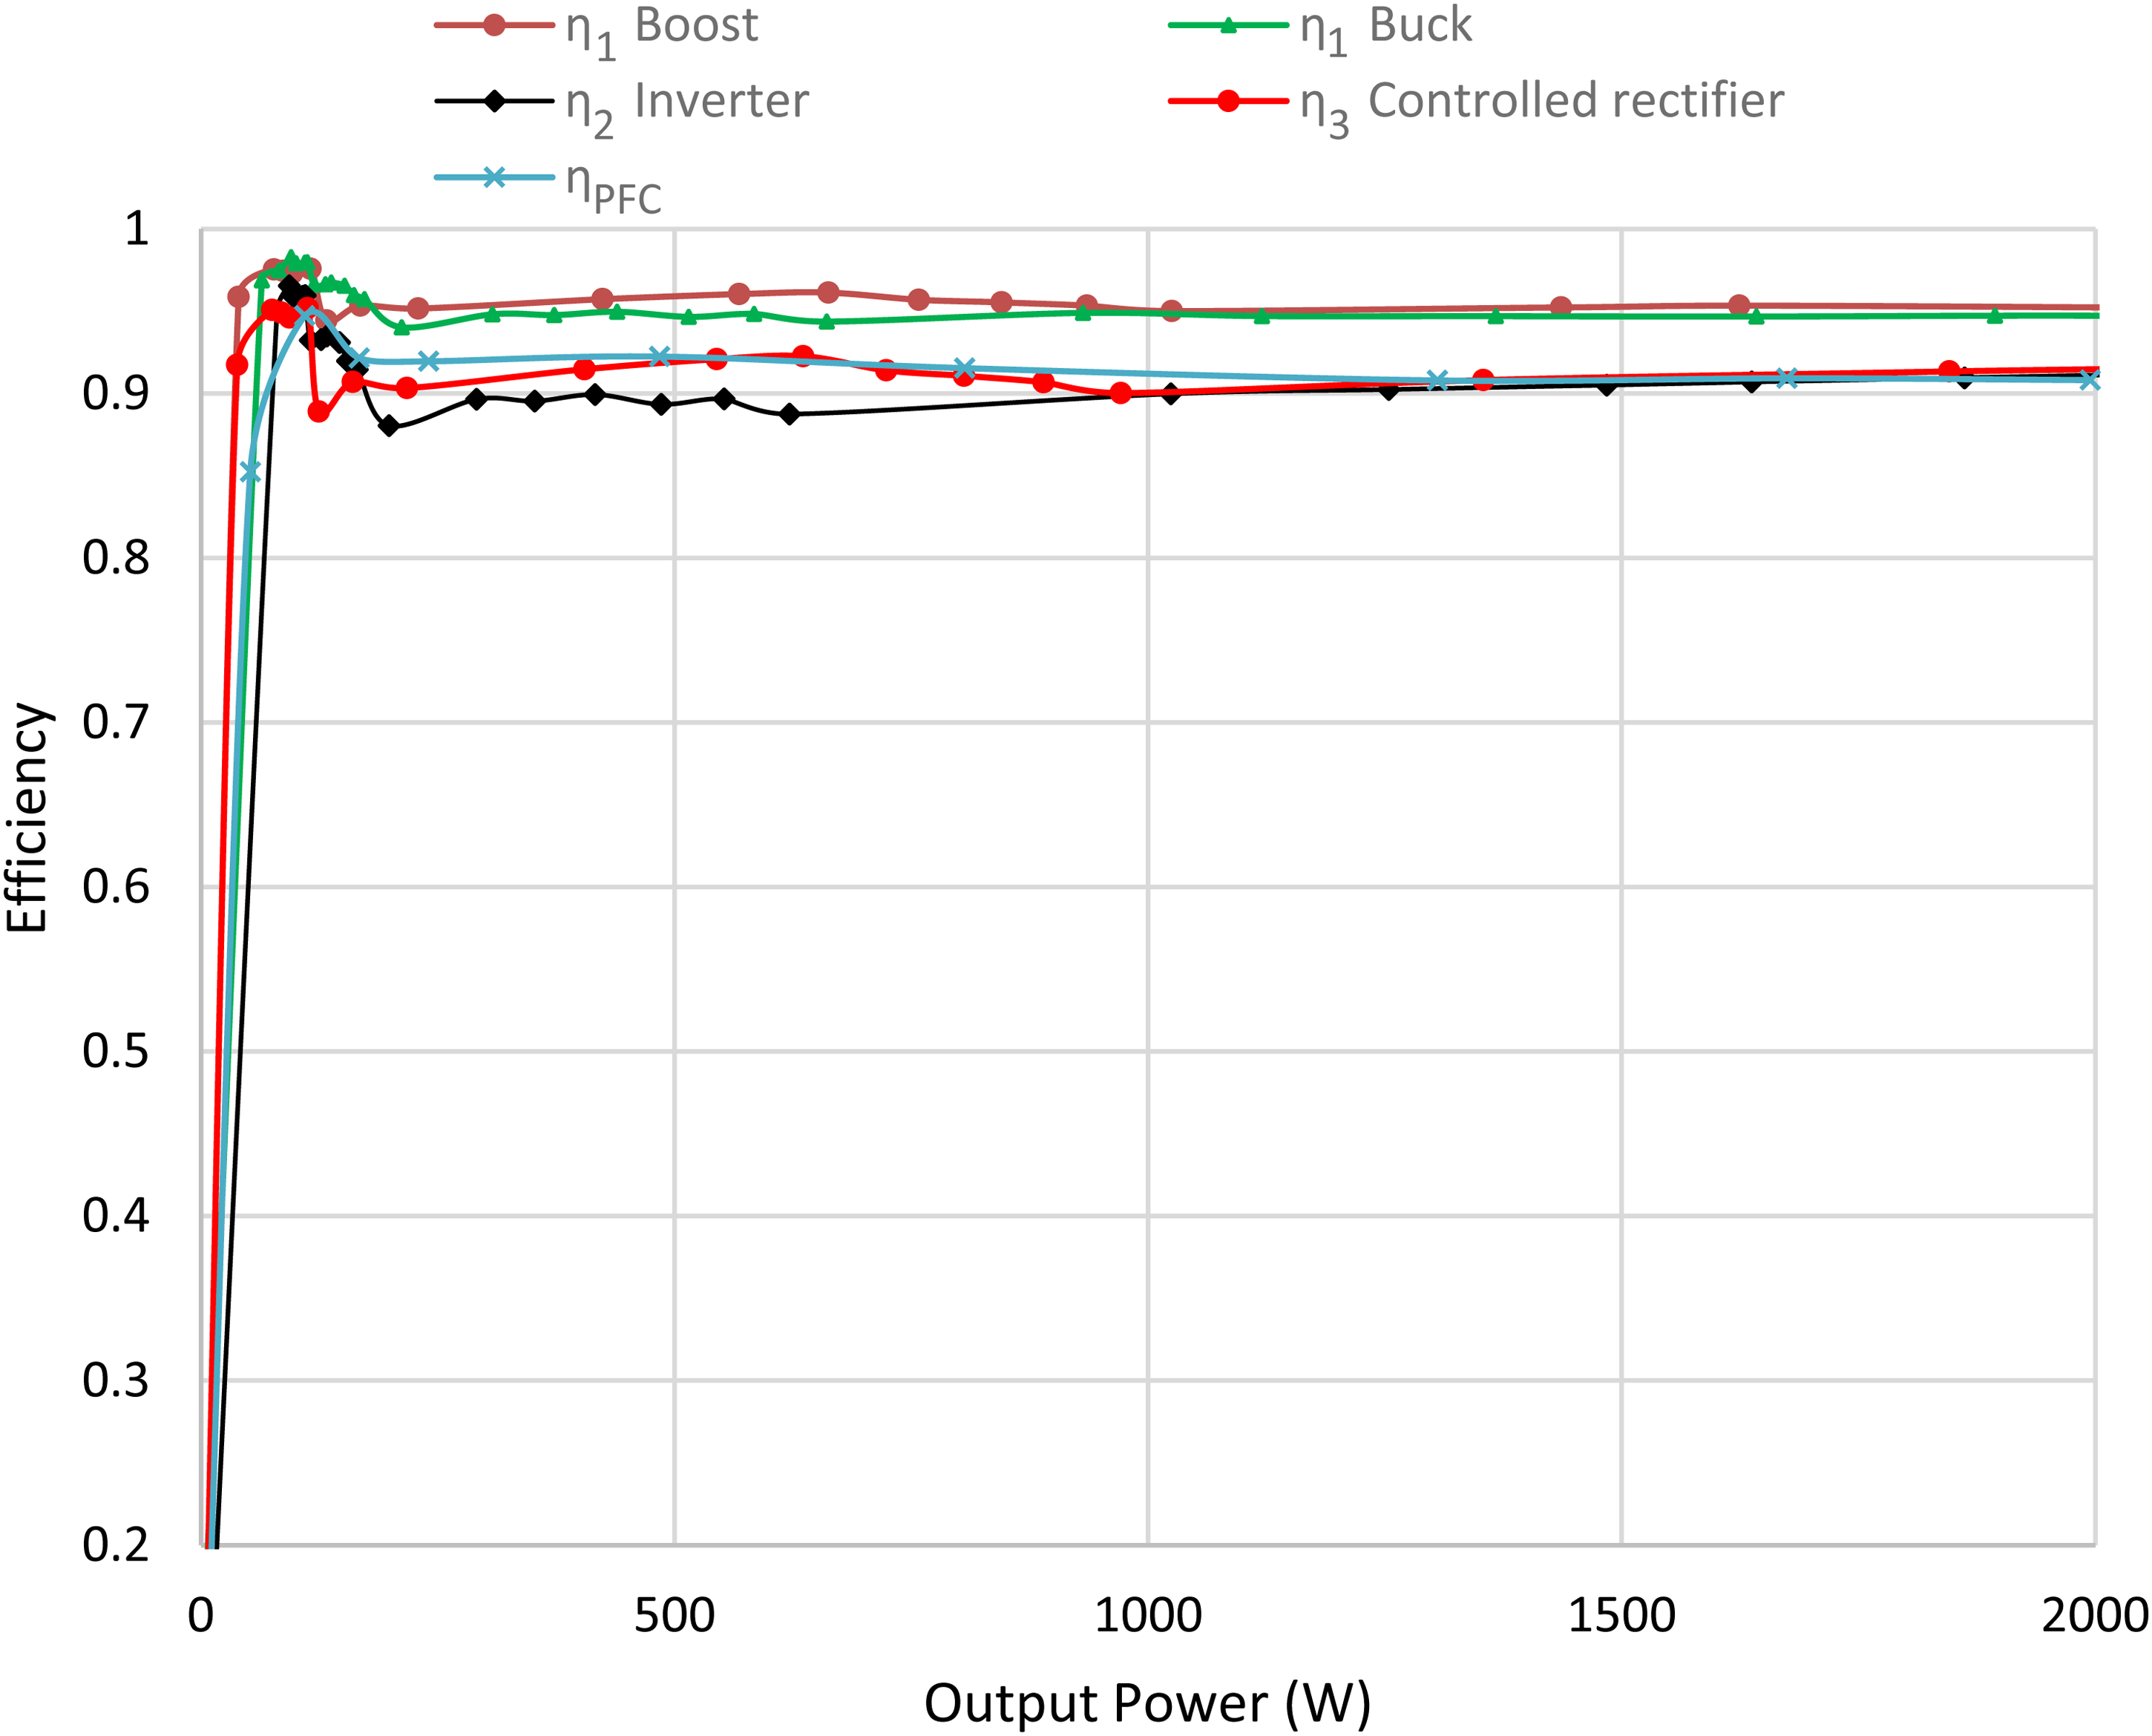
Converter's efficiencies are measured by experiments.
For the measurement of the output and input powers for each converter, voltmeters and ammeters are used to register the steady-state voltage and current in each operating point of the studied converter. DC and AC voltage supplies are used to perform experiments. The change of a converter operating point was performed using the variation of the load resistance value and/or by changing switches control signals. The MicroLabBox dSPACE is used to control the switches of the different converters. We note that converters’ input and output voltage levels are fixed to the same levels reached in nanogrid normal behaviour.
The site of Jeddah, Saudi Arabia (21o 32' 34"N, 39o 10' 22"E) has been selected to conduct energy efficiency performances of the various studied PV systems.
According to Koppen's climatic classification (Mindat.org, 2021). Jeddah has an arid climate with a tropical temperature range. In contrast to other Saudi Arabian towns, Jeddah has a mild winter climate, with temperatures ranging from 15°C at dawn to 28°C in the afternoon. Summer temperatures are exceptionally high, frequently exceeding 48°C in the afternoon and decreasing to 35°C in the evening.
The annual exchanged energy between the three nanogrid systems and the AC grid is noted (j = 1,2 or 3) it is the excess of energy injected into the grid after satisfying the load need. The energy
For classical LVAC system 1.
For classical LVDC system 2.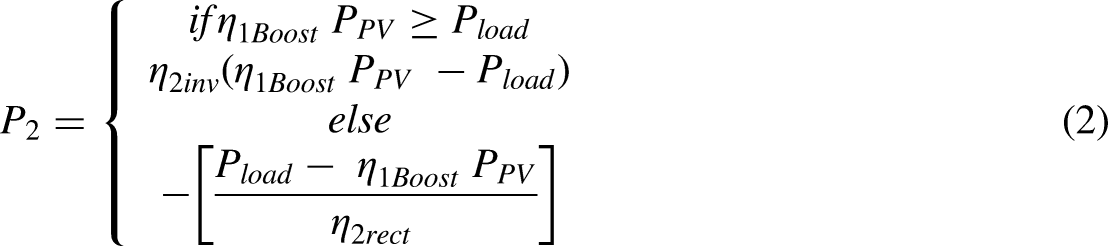
For the proposed LVDC system 3.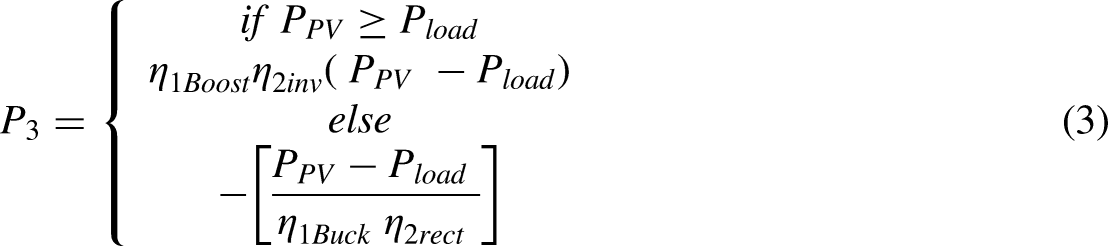
We define the Relative Saved Energy (RSEj %) of the PV LVDC chain (system j) compared to the classical PV chain (system 1), the ratio of the excess of saved energy of the given LVDC chain (W2 or W3) regarding the classical PV system (W1) by the value of the annual generated PV energy WPV (Ammous et al., 2021). The following equation gives the defined PV system RSEj regarding the classical PV chain.
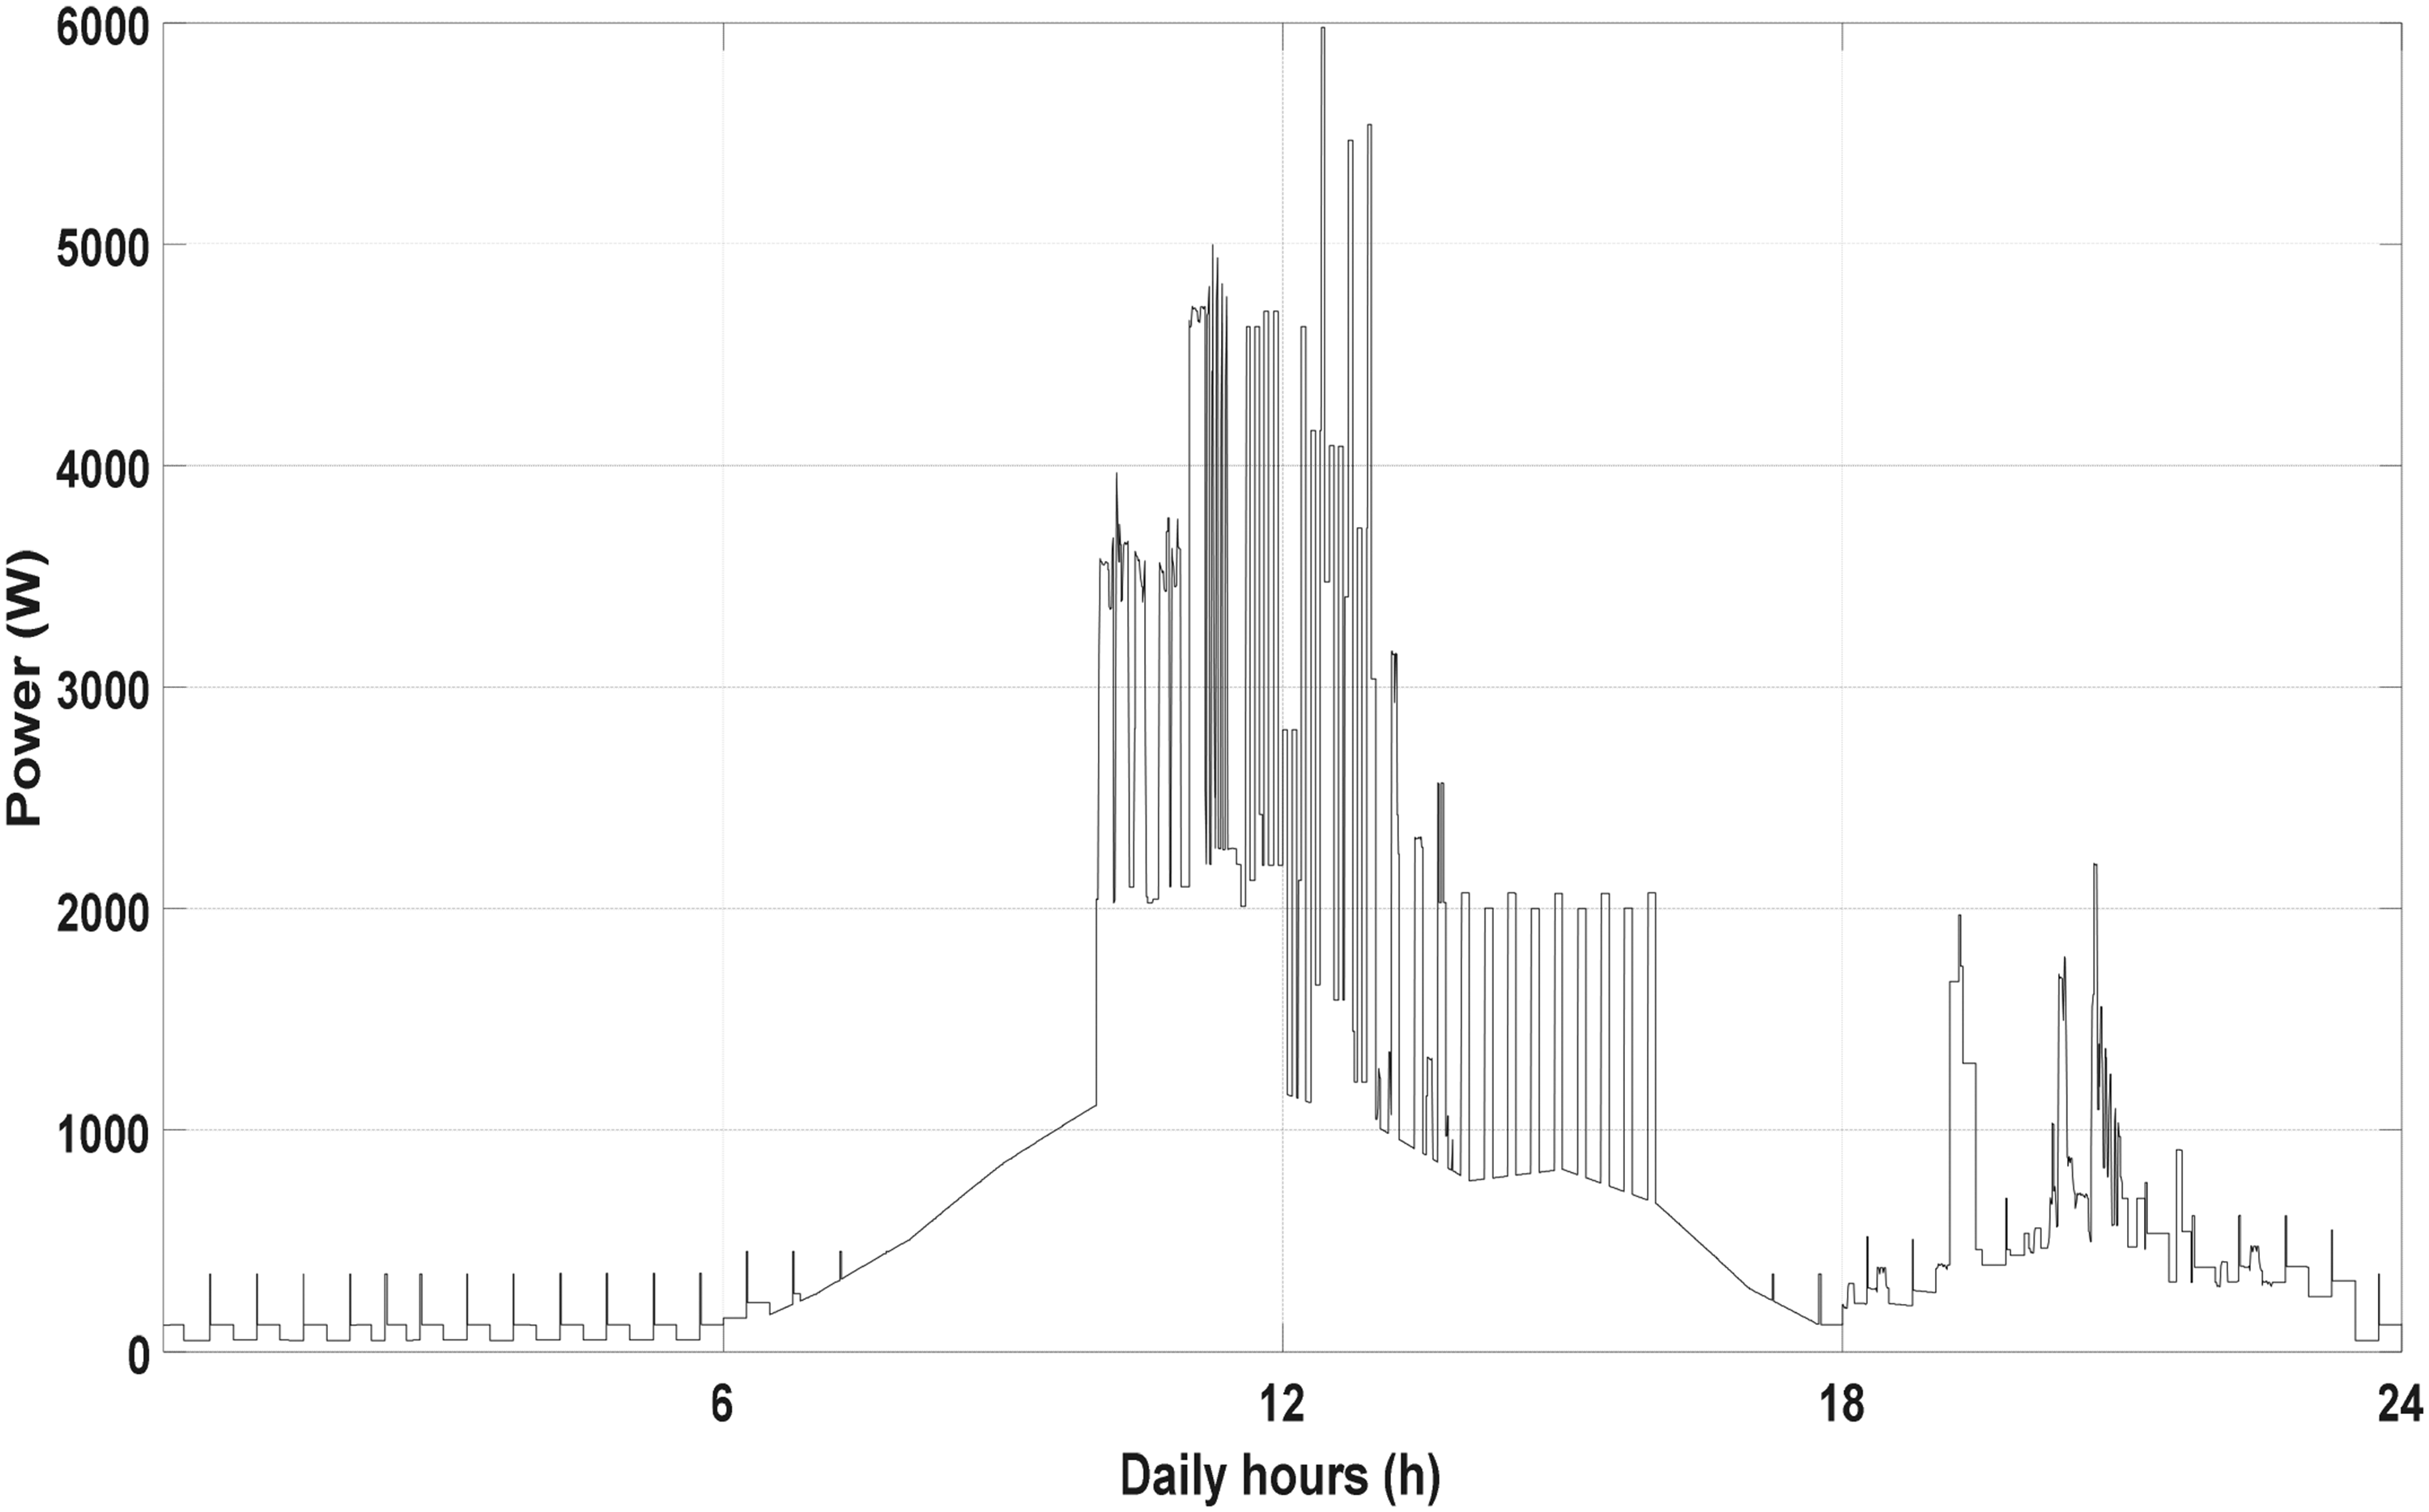
The generated powers by six panels, for example, during typical days in Jeddah are shown in Figure 12. The PV panels generated energy in a typical day, of January, for example, is 6600 Wh/day. The annual generated energy by the used PV panels, WPV, is equal to 3.006 MWh. This generated energy was calculated based on PV panels electrical model (Villalva and Gazoli, 2009; Sera et al.,; 2007) and using Irradiance (G), PV cells case Temperature (Tc), and wind speed (VW) values in Jeddah during each typical day/month in the year. The effect of wind speed on PV cells case Temperature is given by the following model for polycrystalline Silicon cells (Koehl et al., 2011; Schwingshackl et al., 2013).
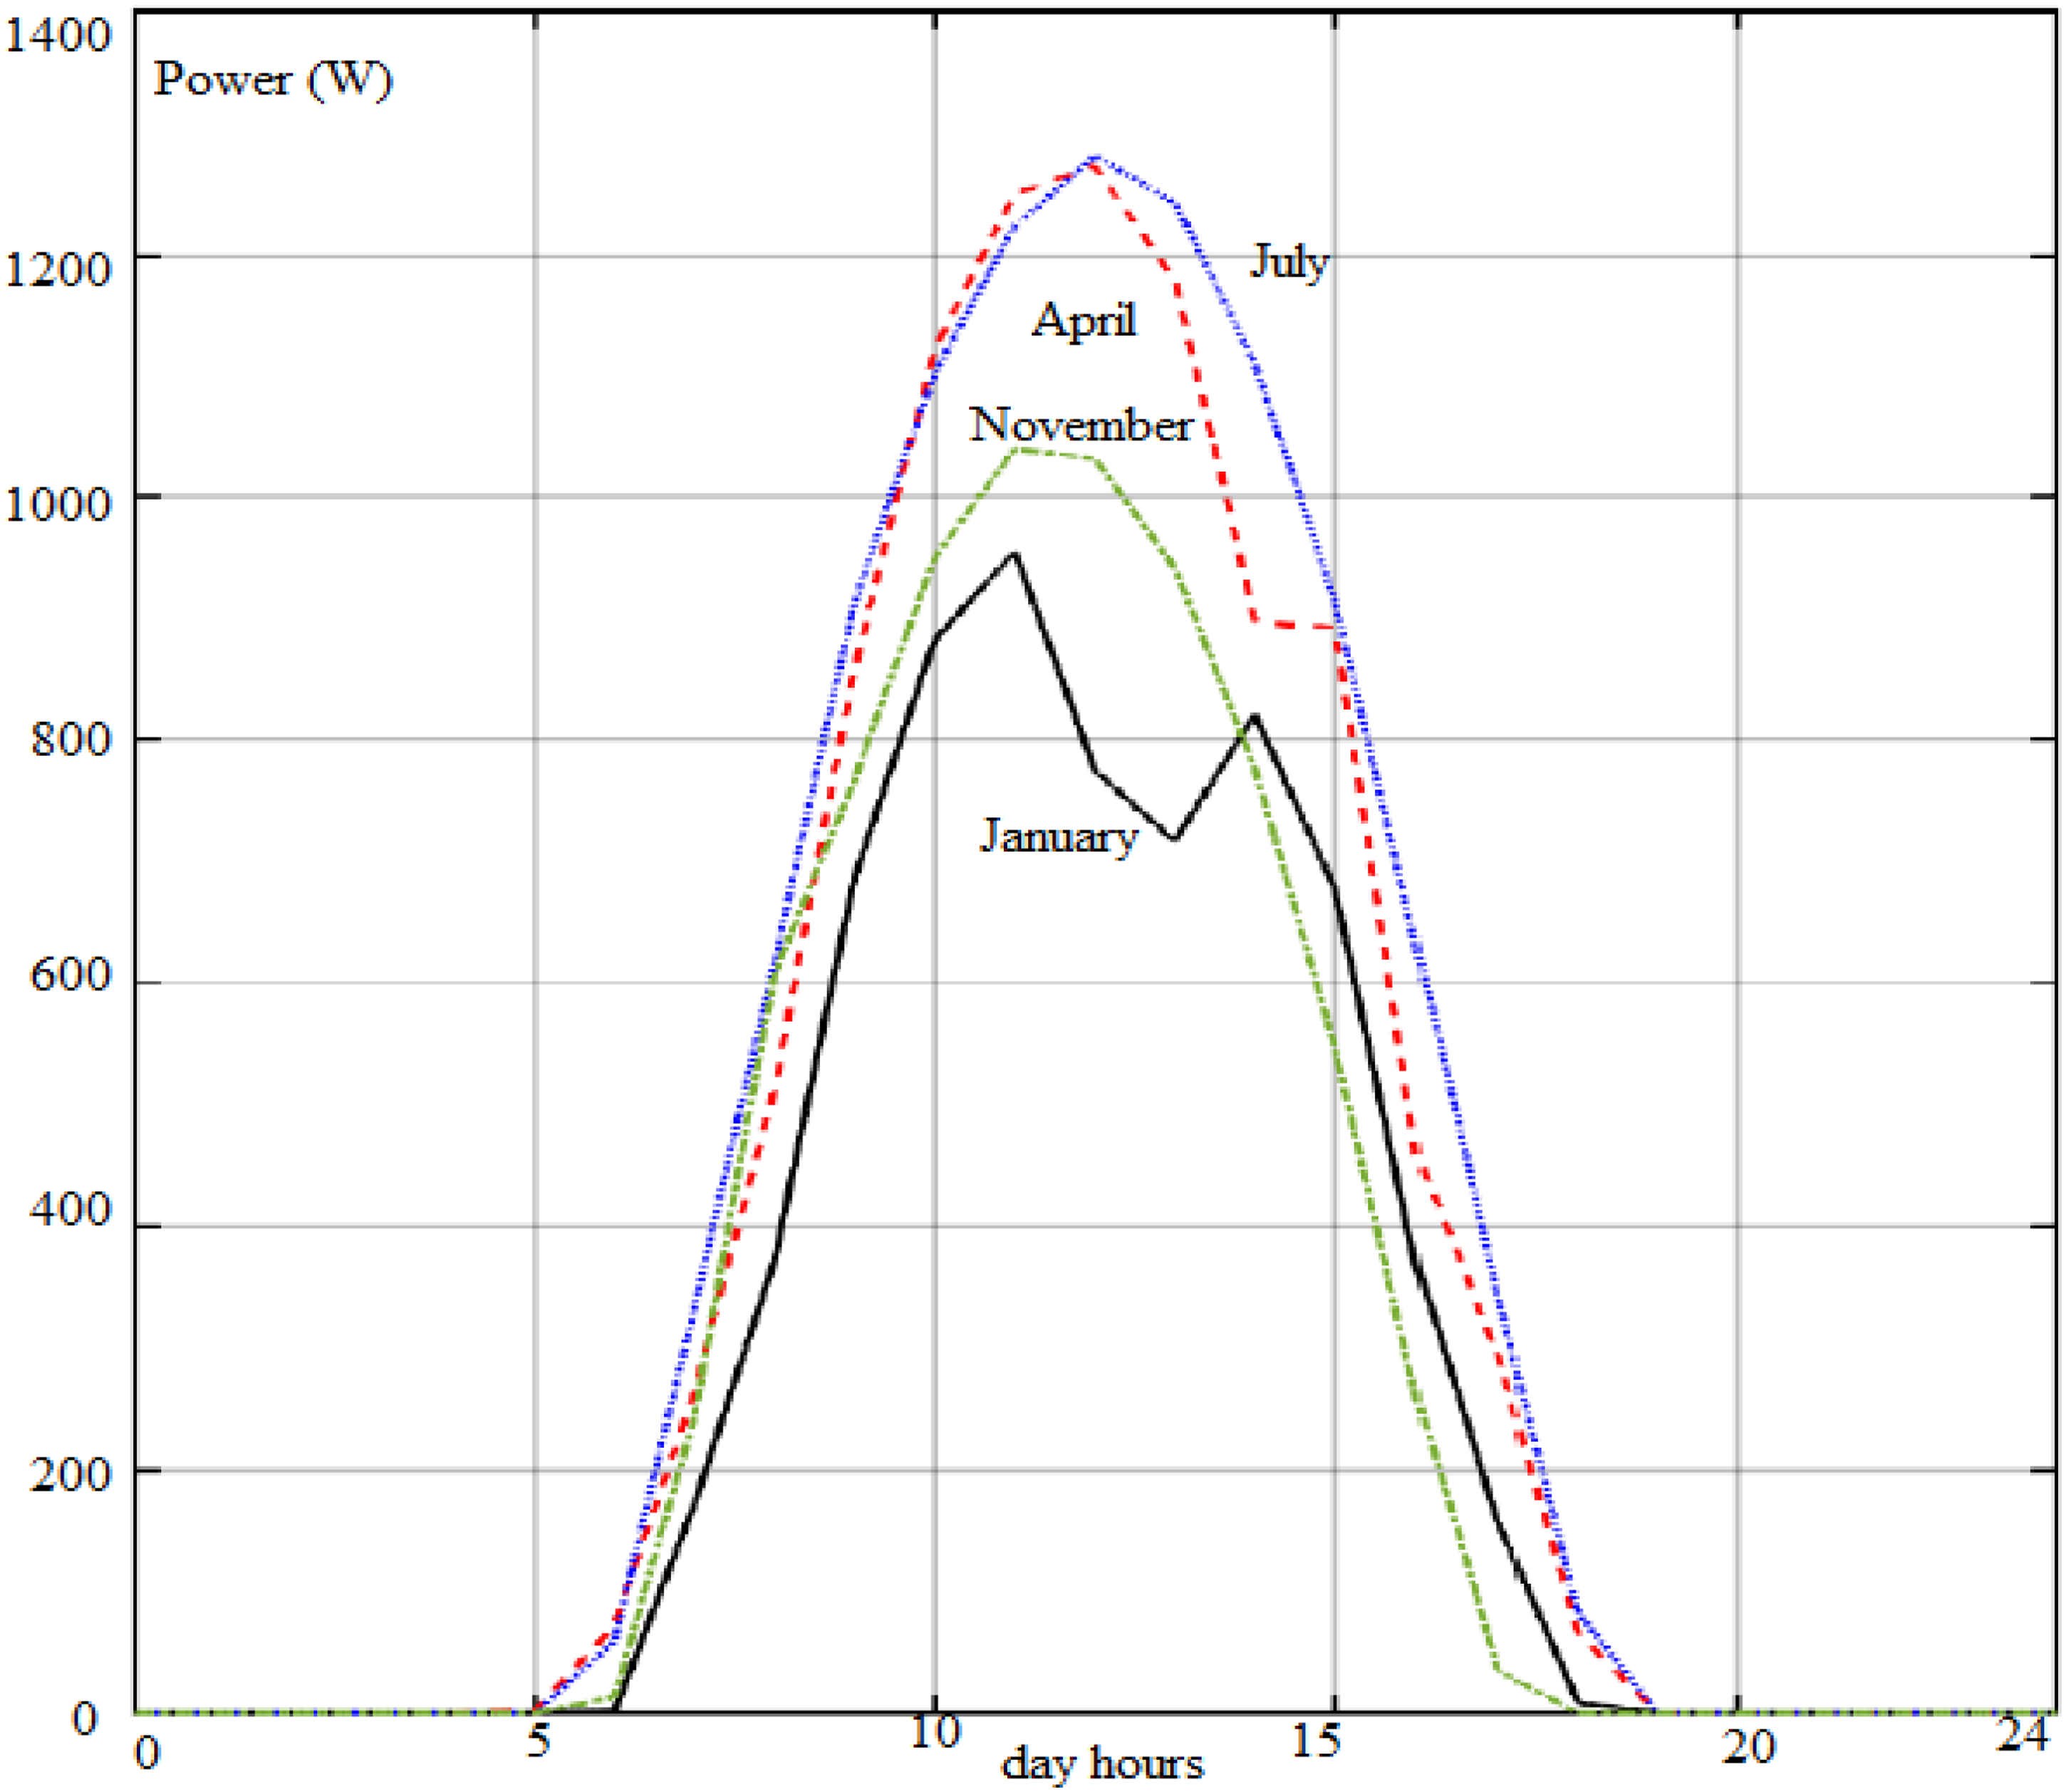
Generated power, by six panels, during a typical day of January, April, July, and November in jeddah.
Where
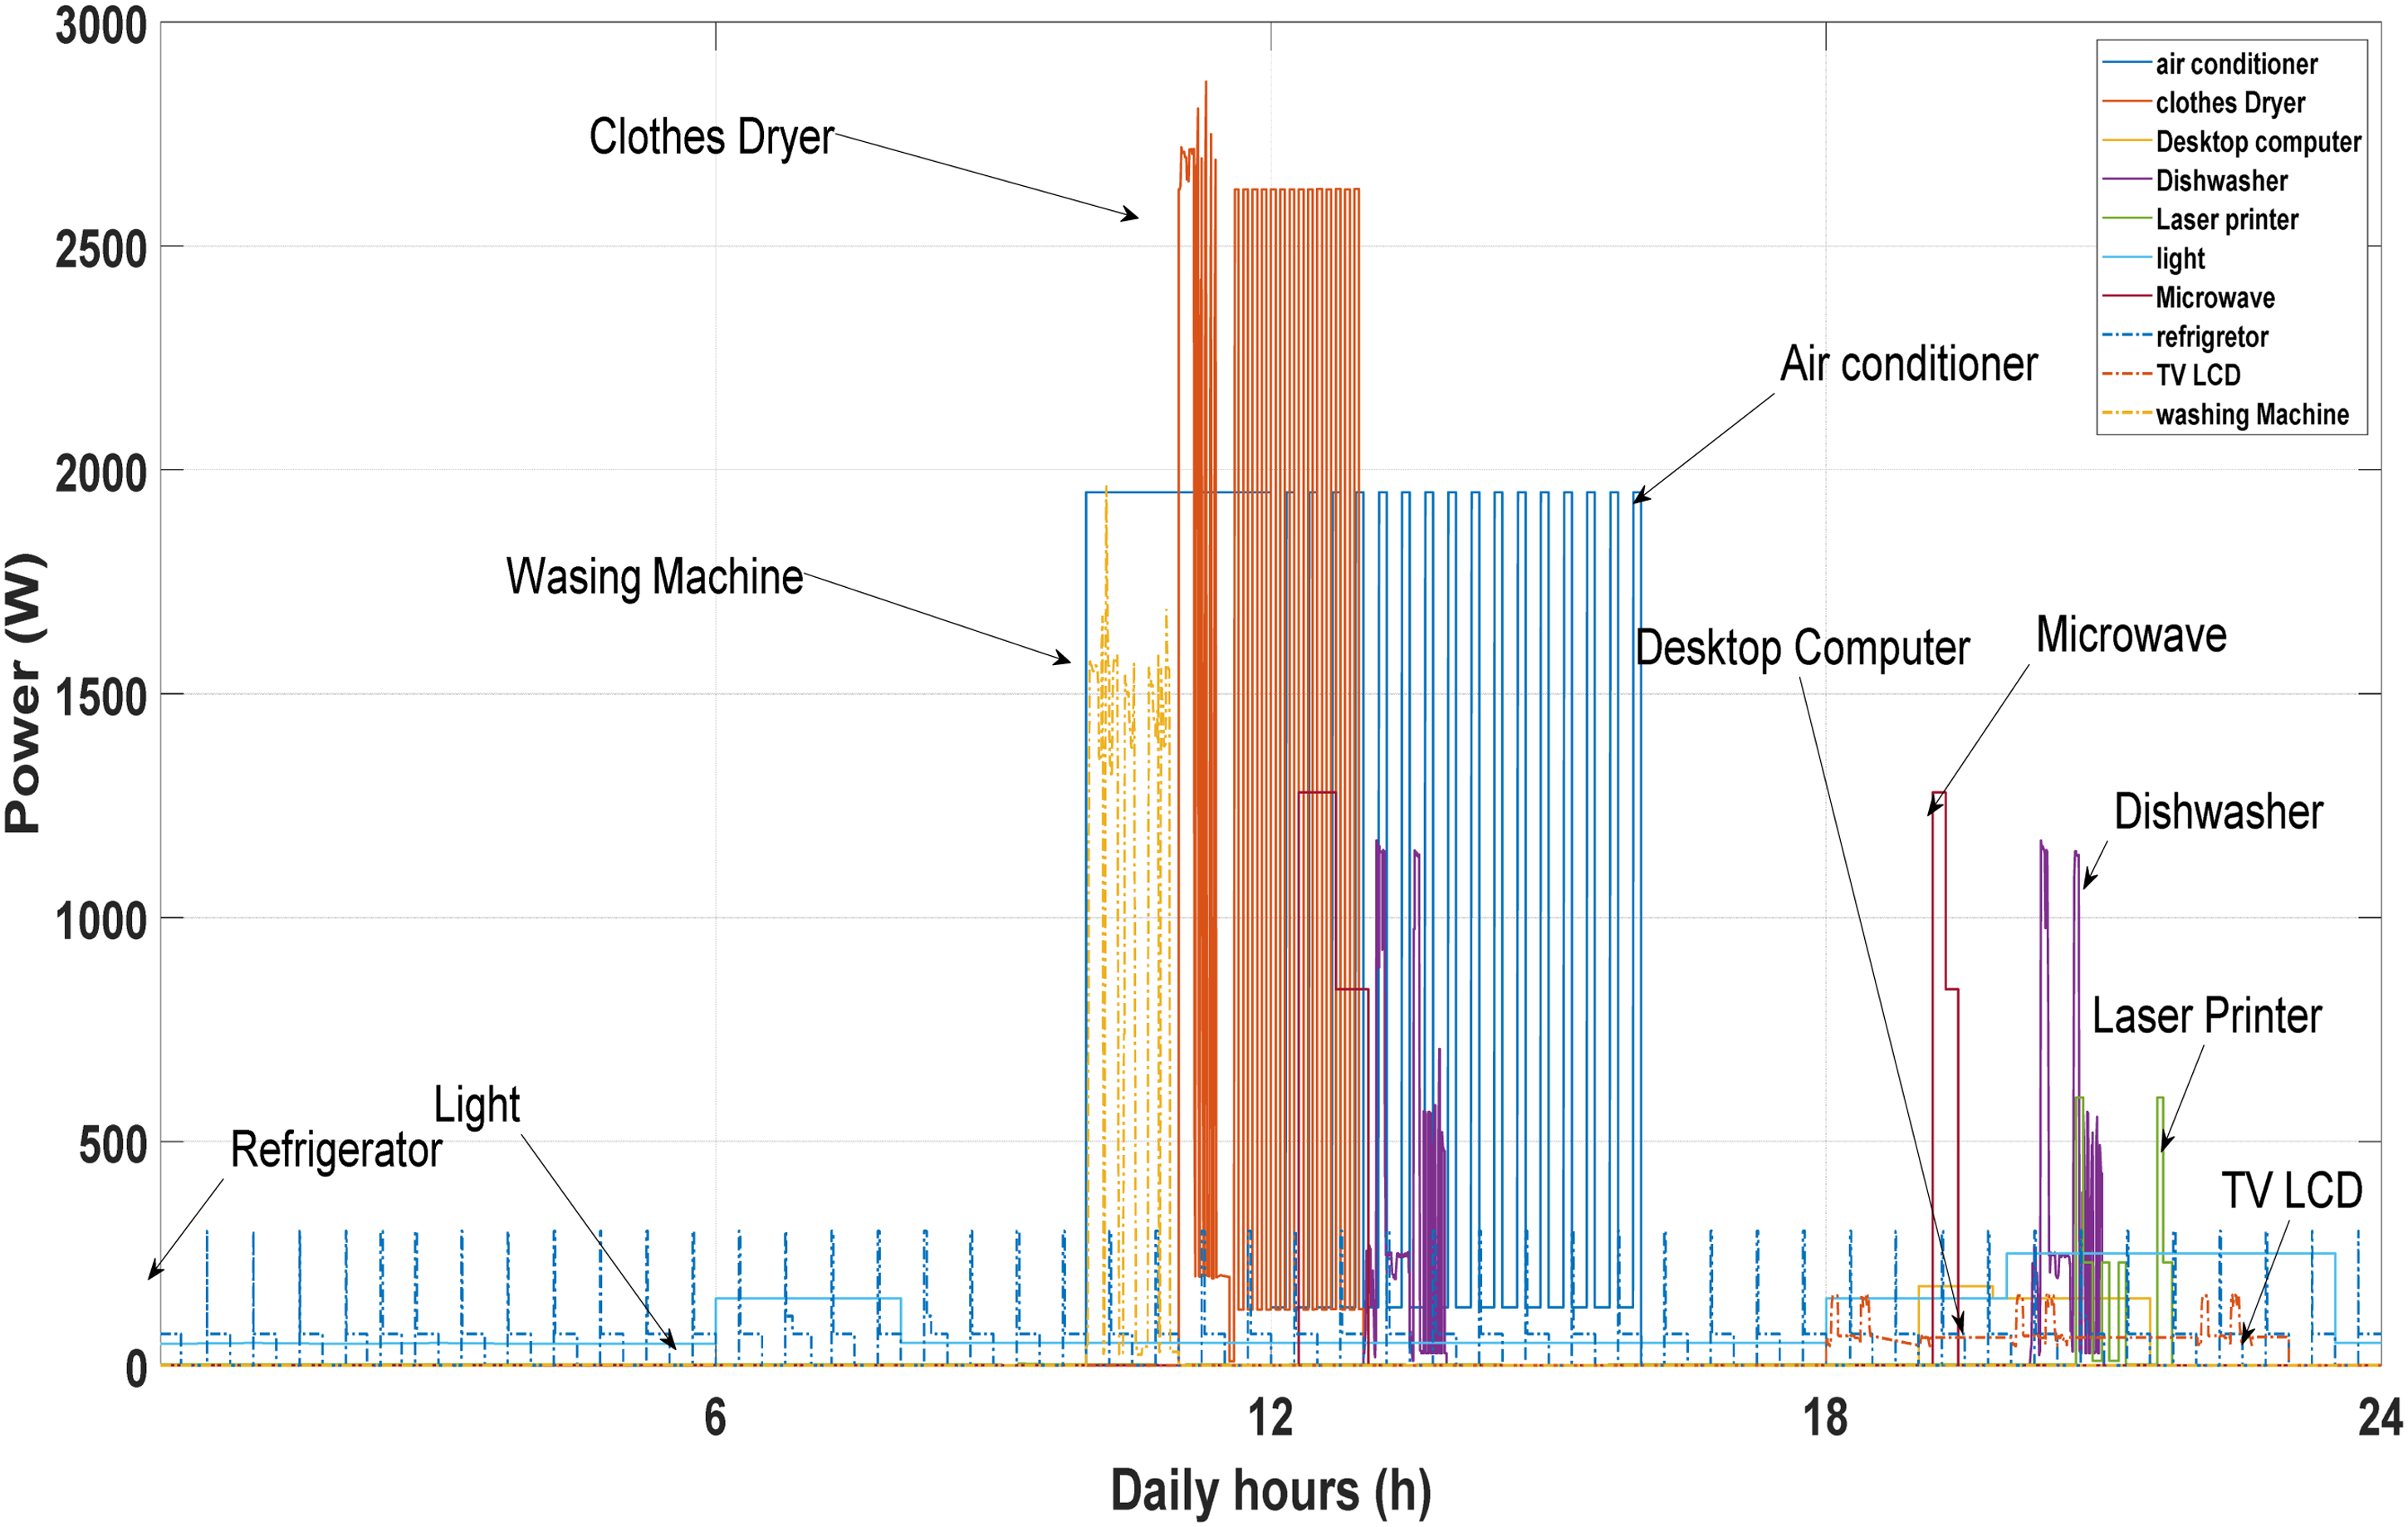
We will assess the efficiency performance of the three systems (system1, system 2, and system 3) for homes loads. Three profiles of home load consumption are considered. Basically, the home load consists of, clothes dryer, desktop computer, dishwasher, laser printer, light, microwave, refrigerator, TV LCD, washing machine, and air conditioner.
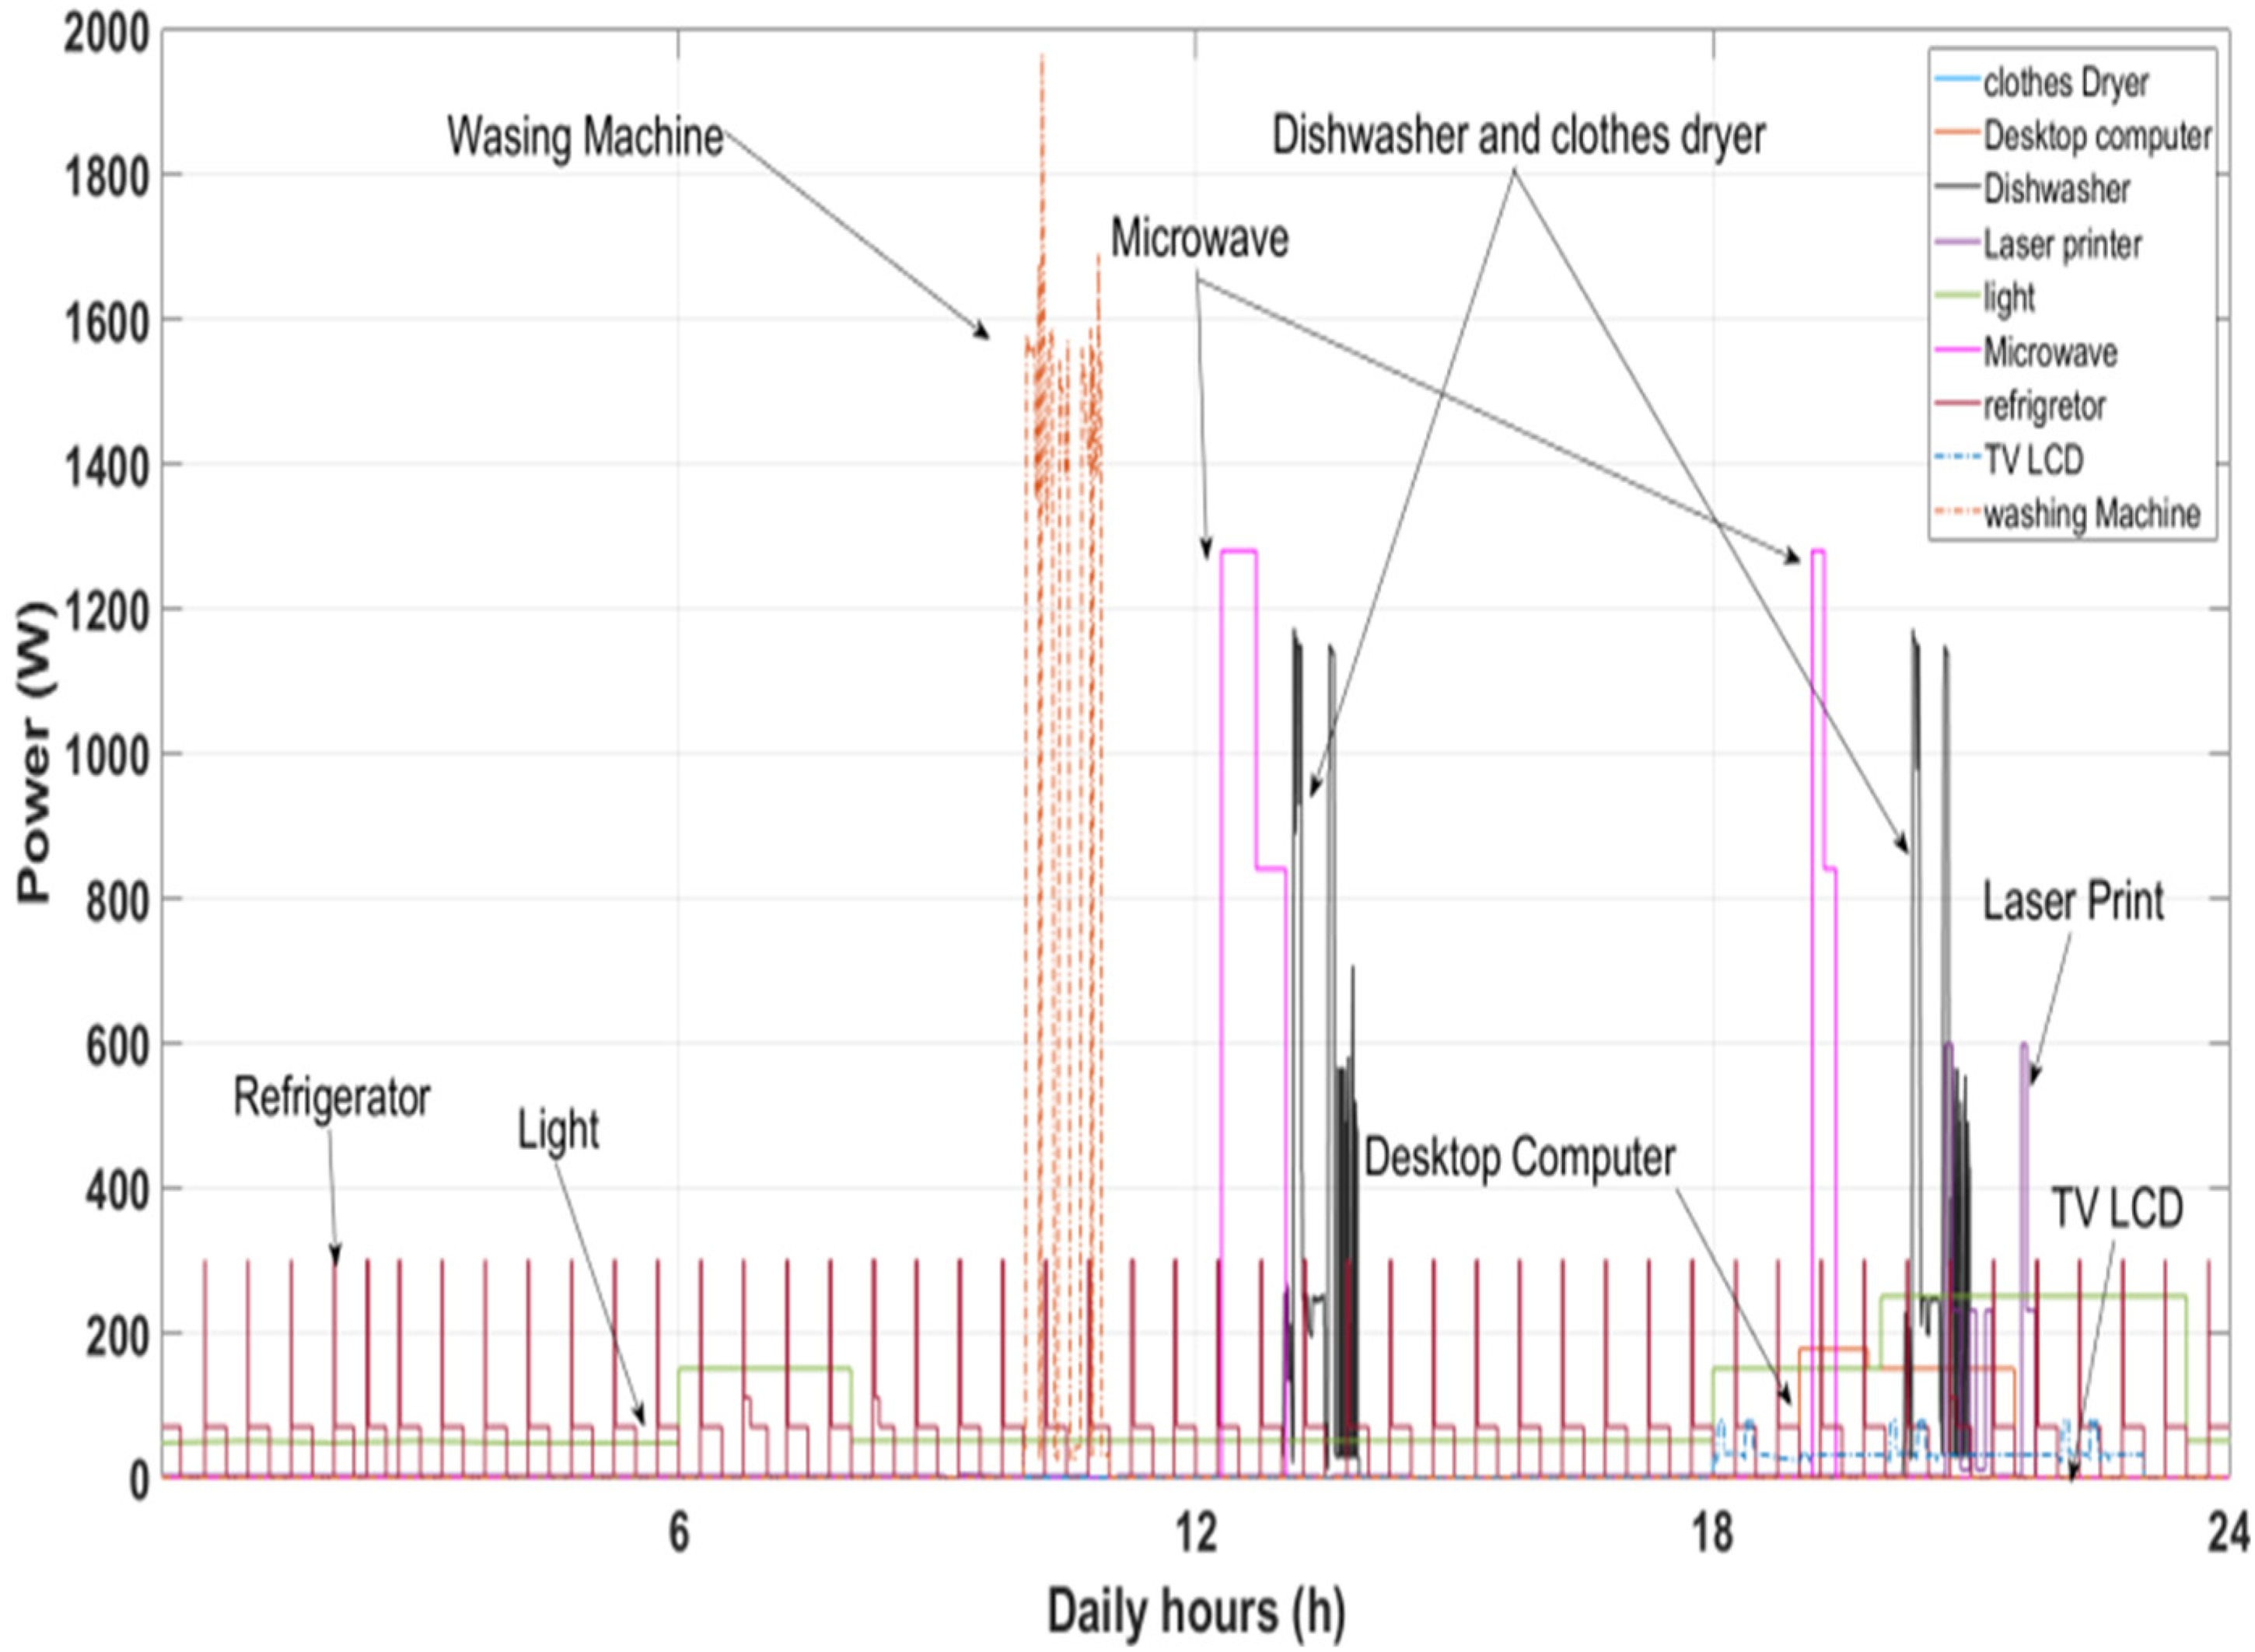
Power consumption by each load of the home case 1.
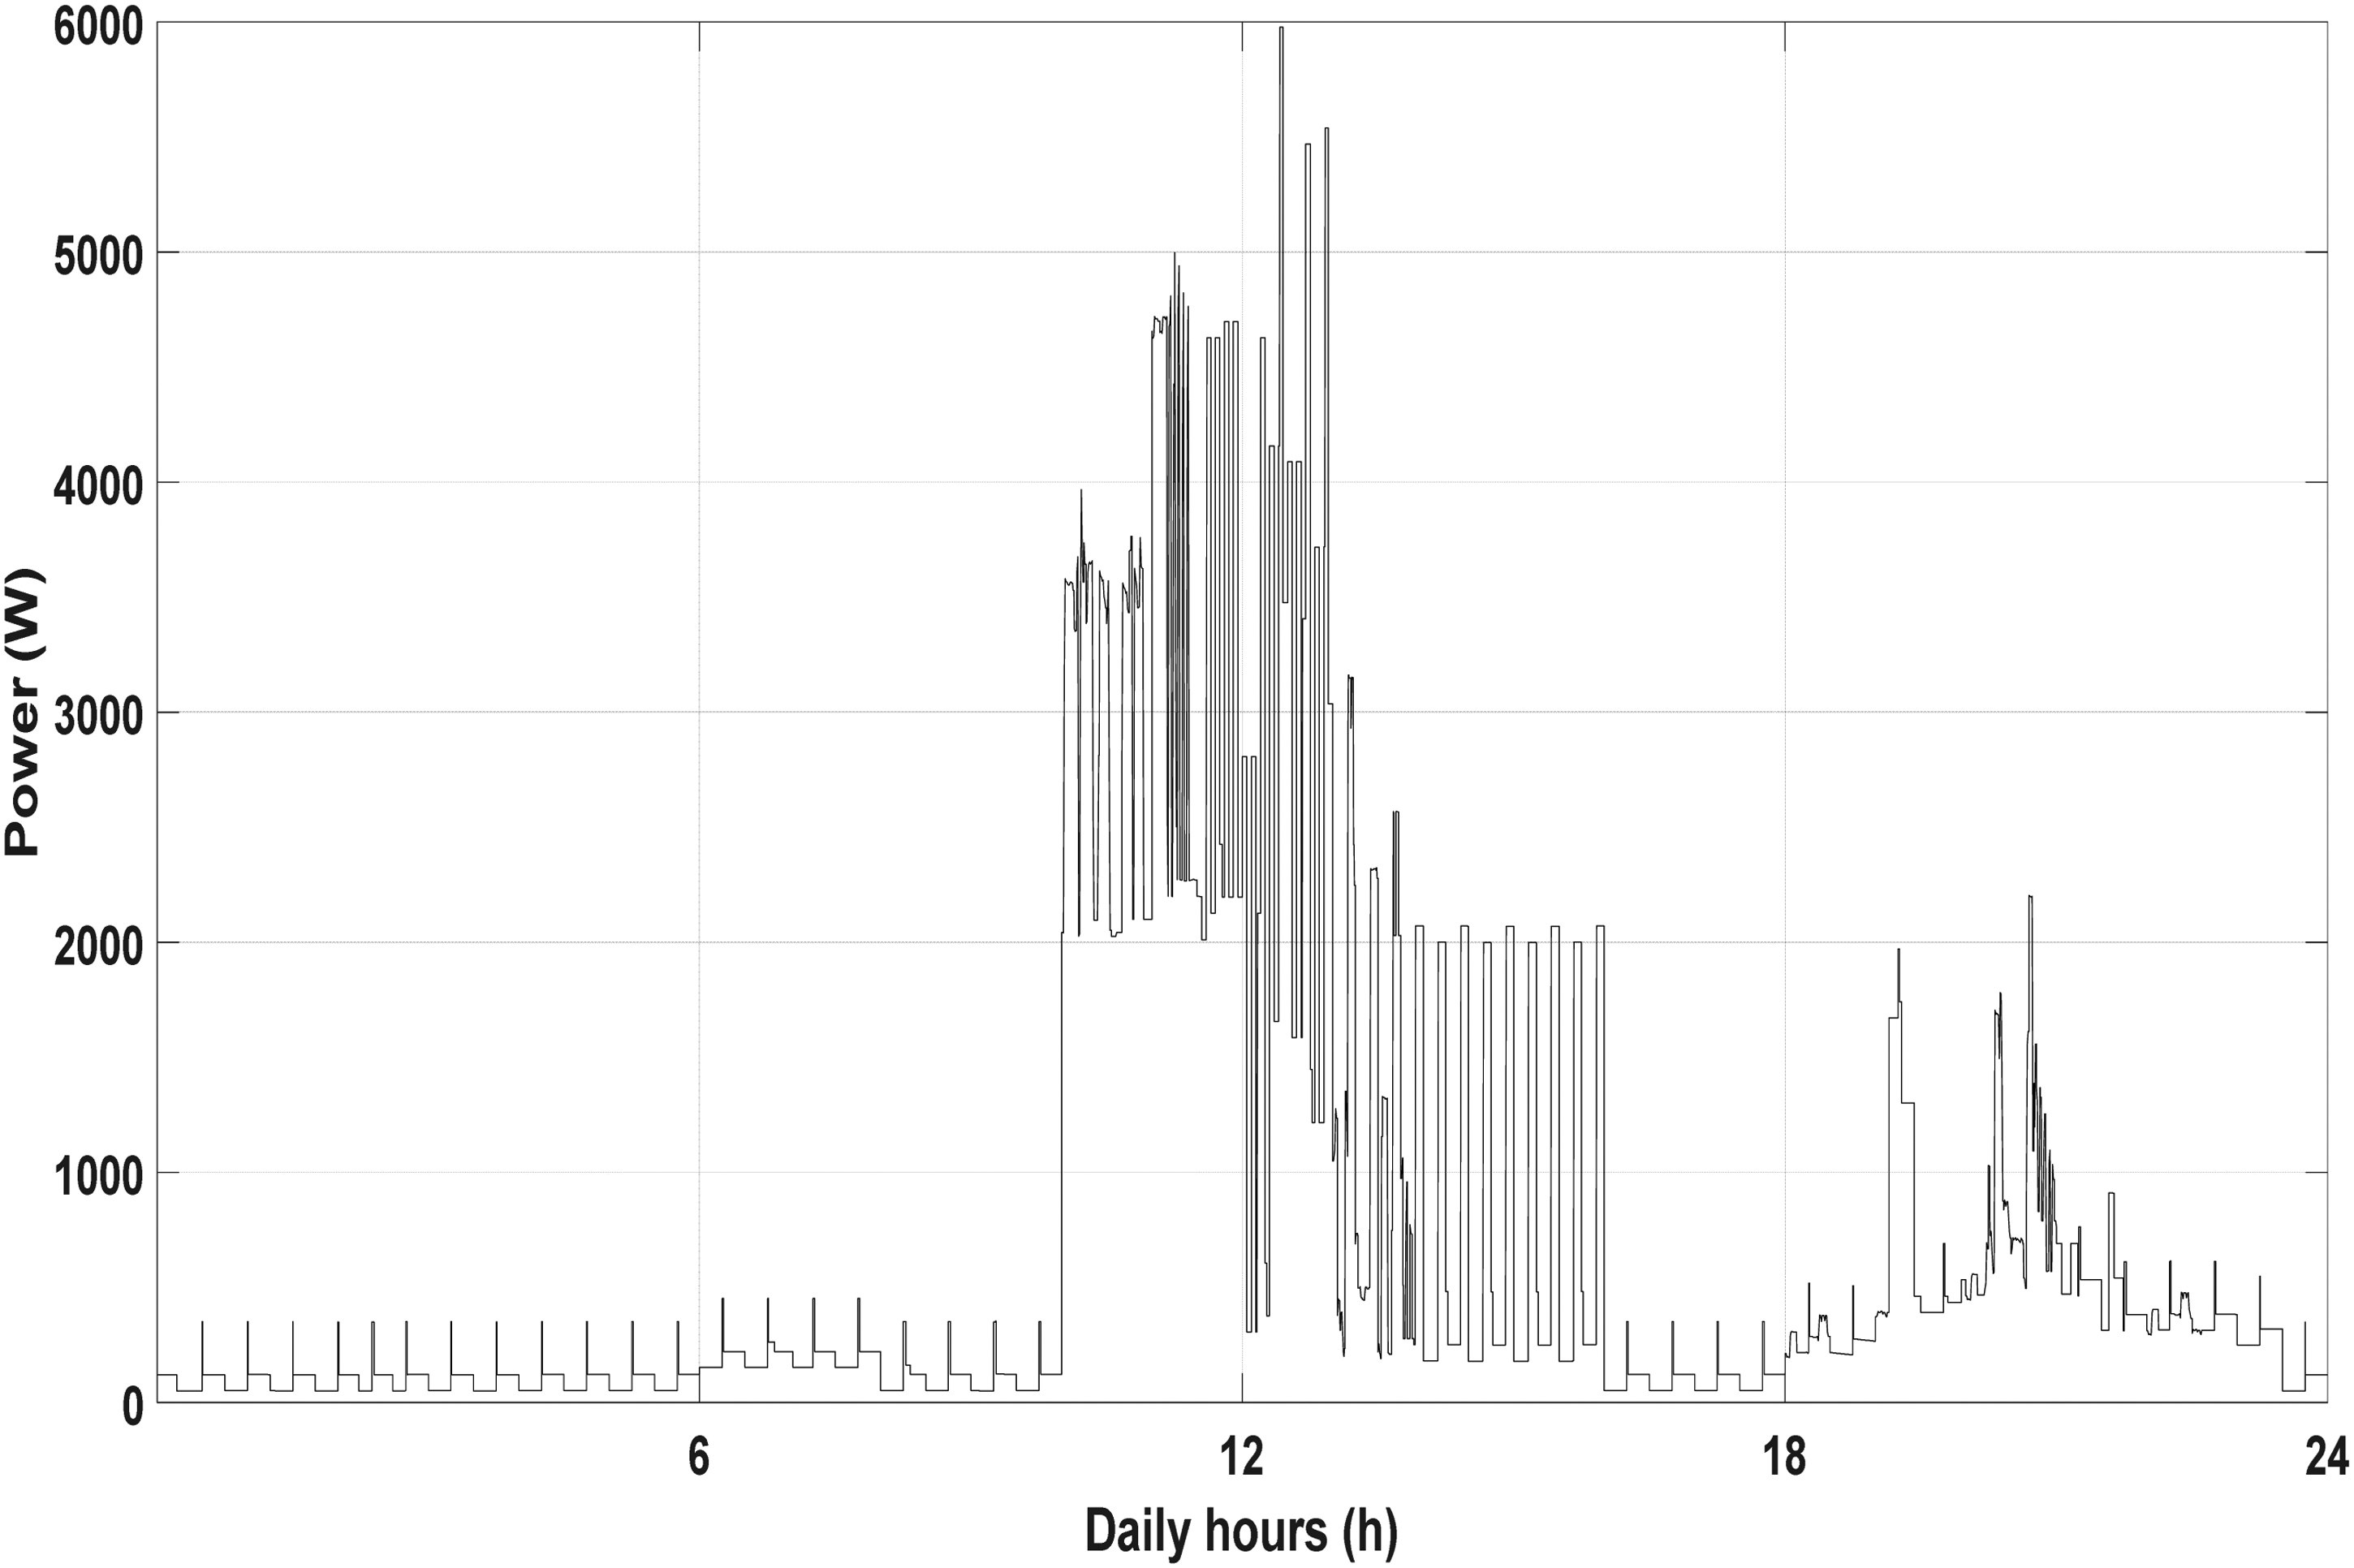
The annual consumed energy by the home is 2.67 MWh. The load consumption profile is shown in Figure 14.
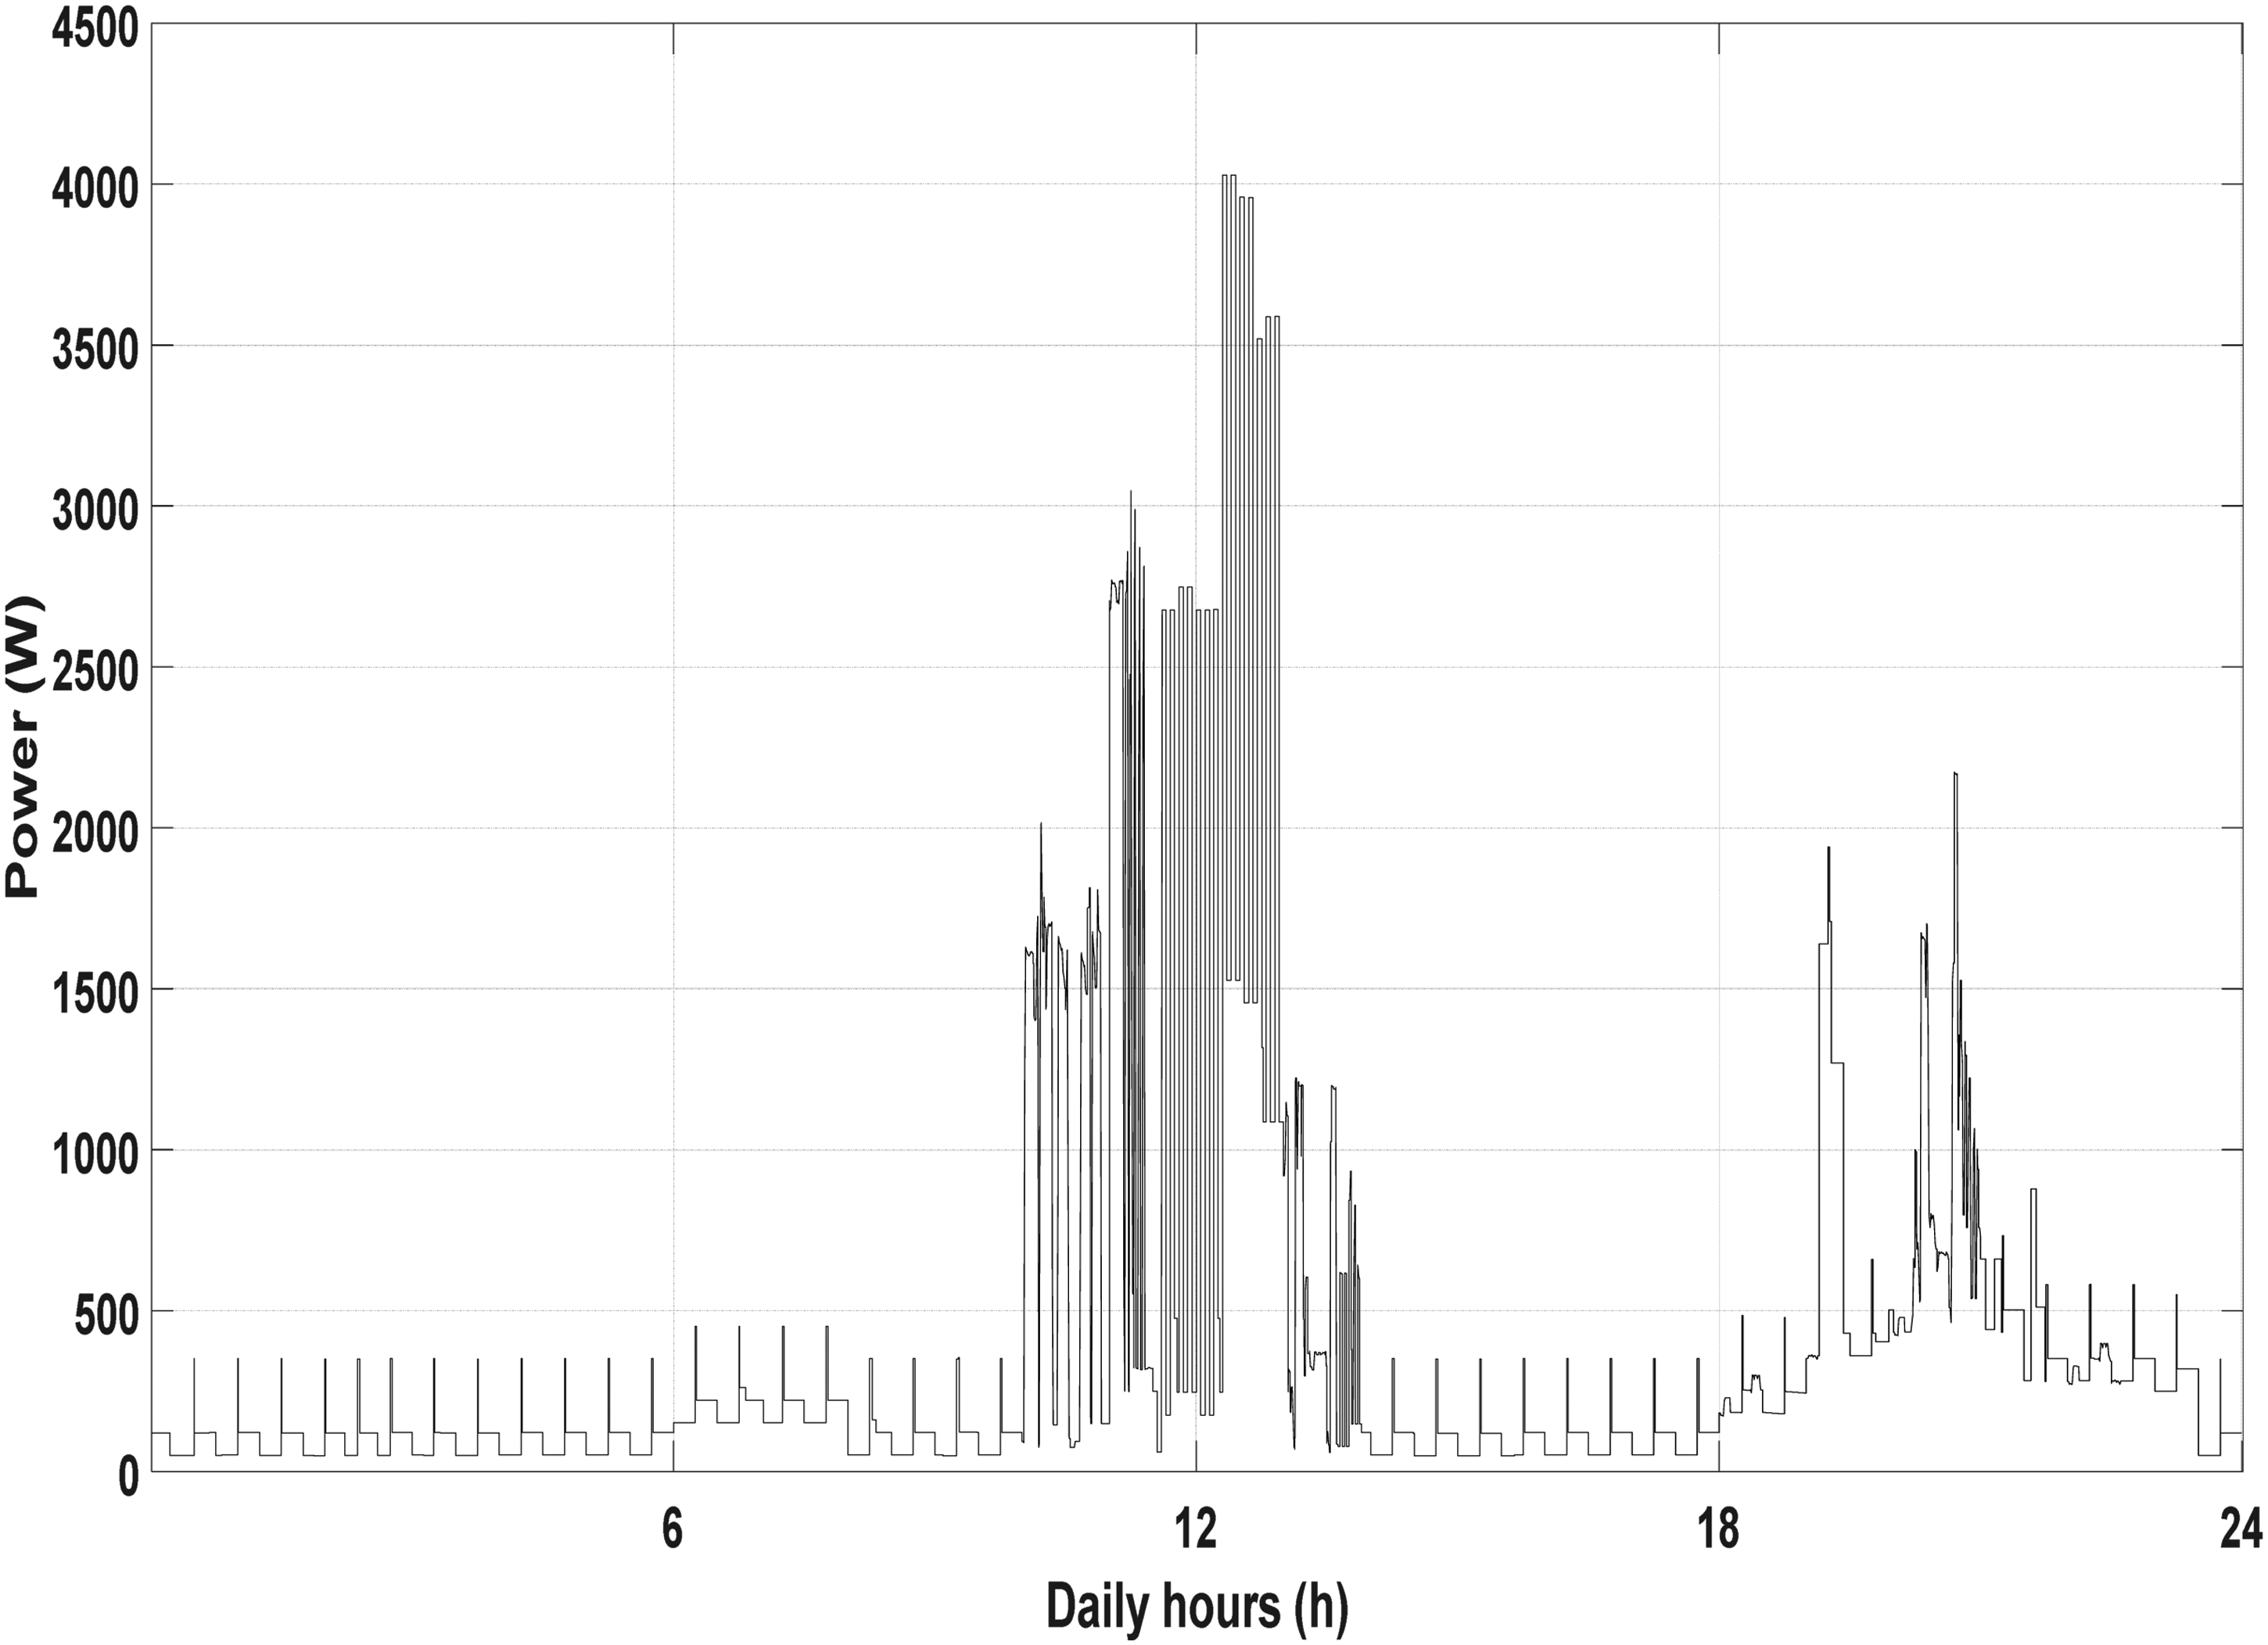
The daily load consumption for home case 1.
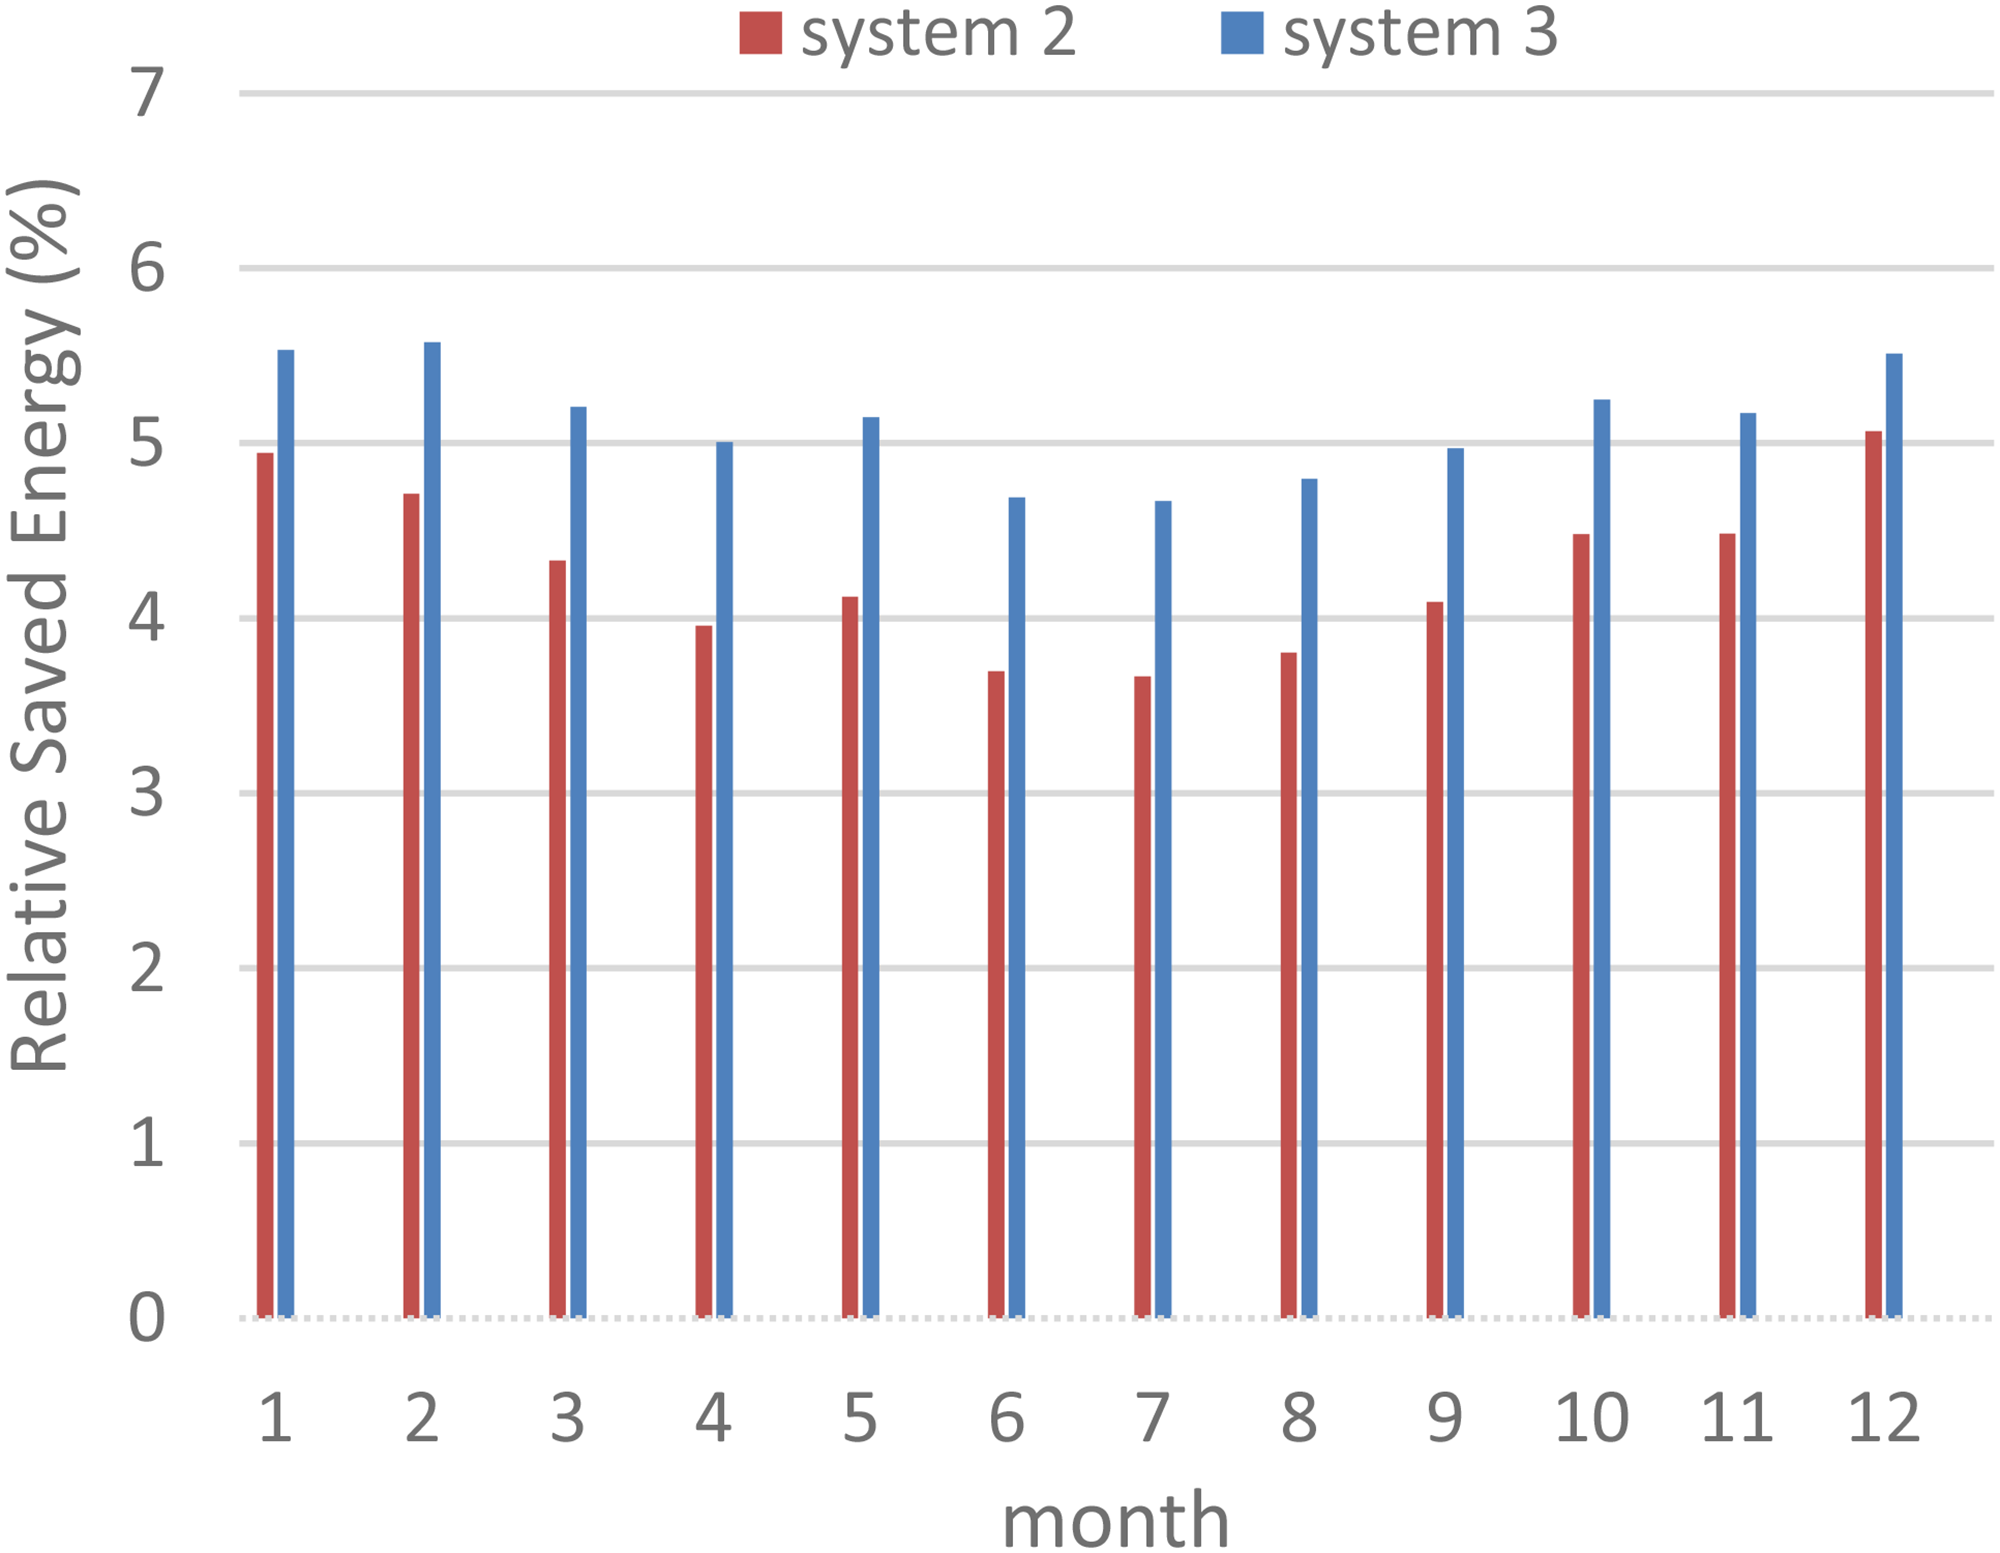
Figure 15 shows the RSE for the two systems 2 and 3 in each month when the annual generated energy from PV's is 3 MWh (by considering a power peak of 1.59 kW generated by PV panels), the RSE for the systems 2 is more important than the system 3 for
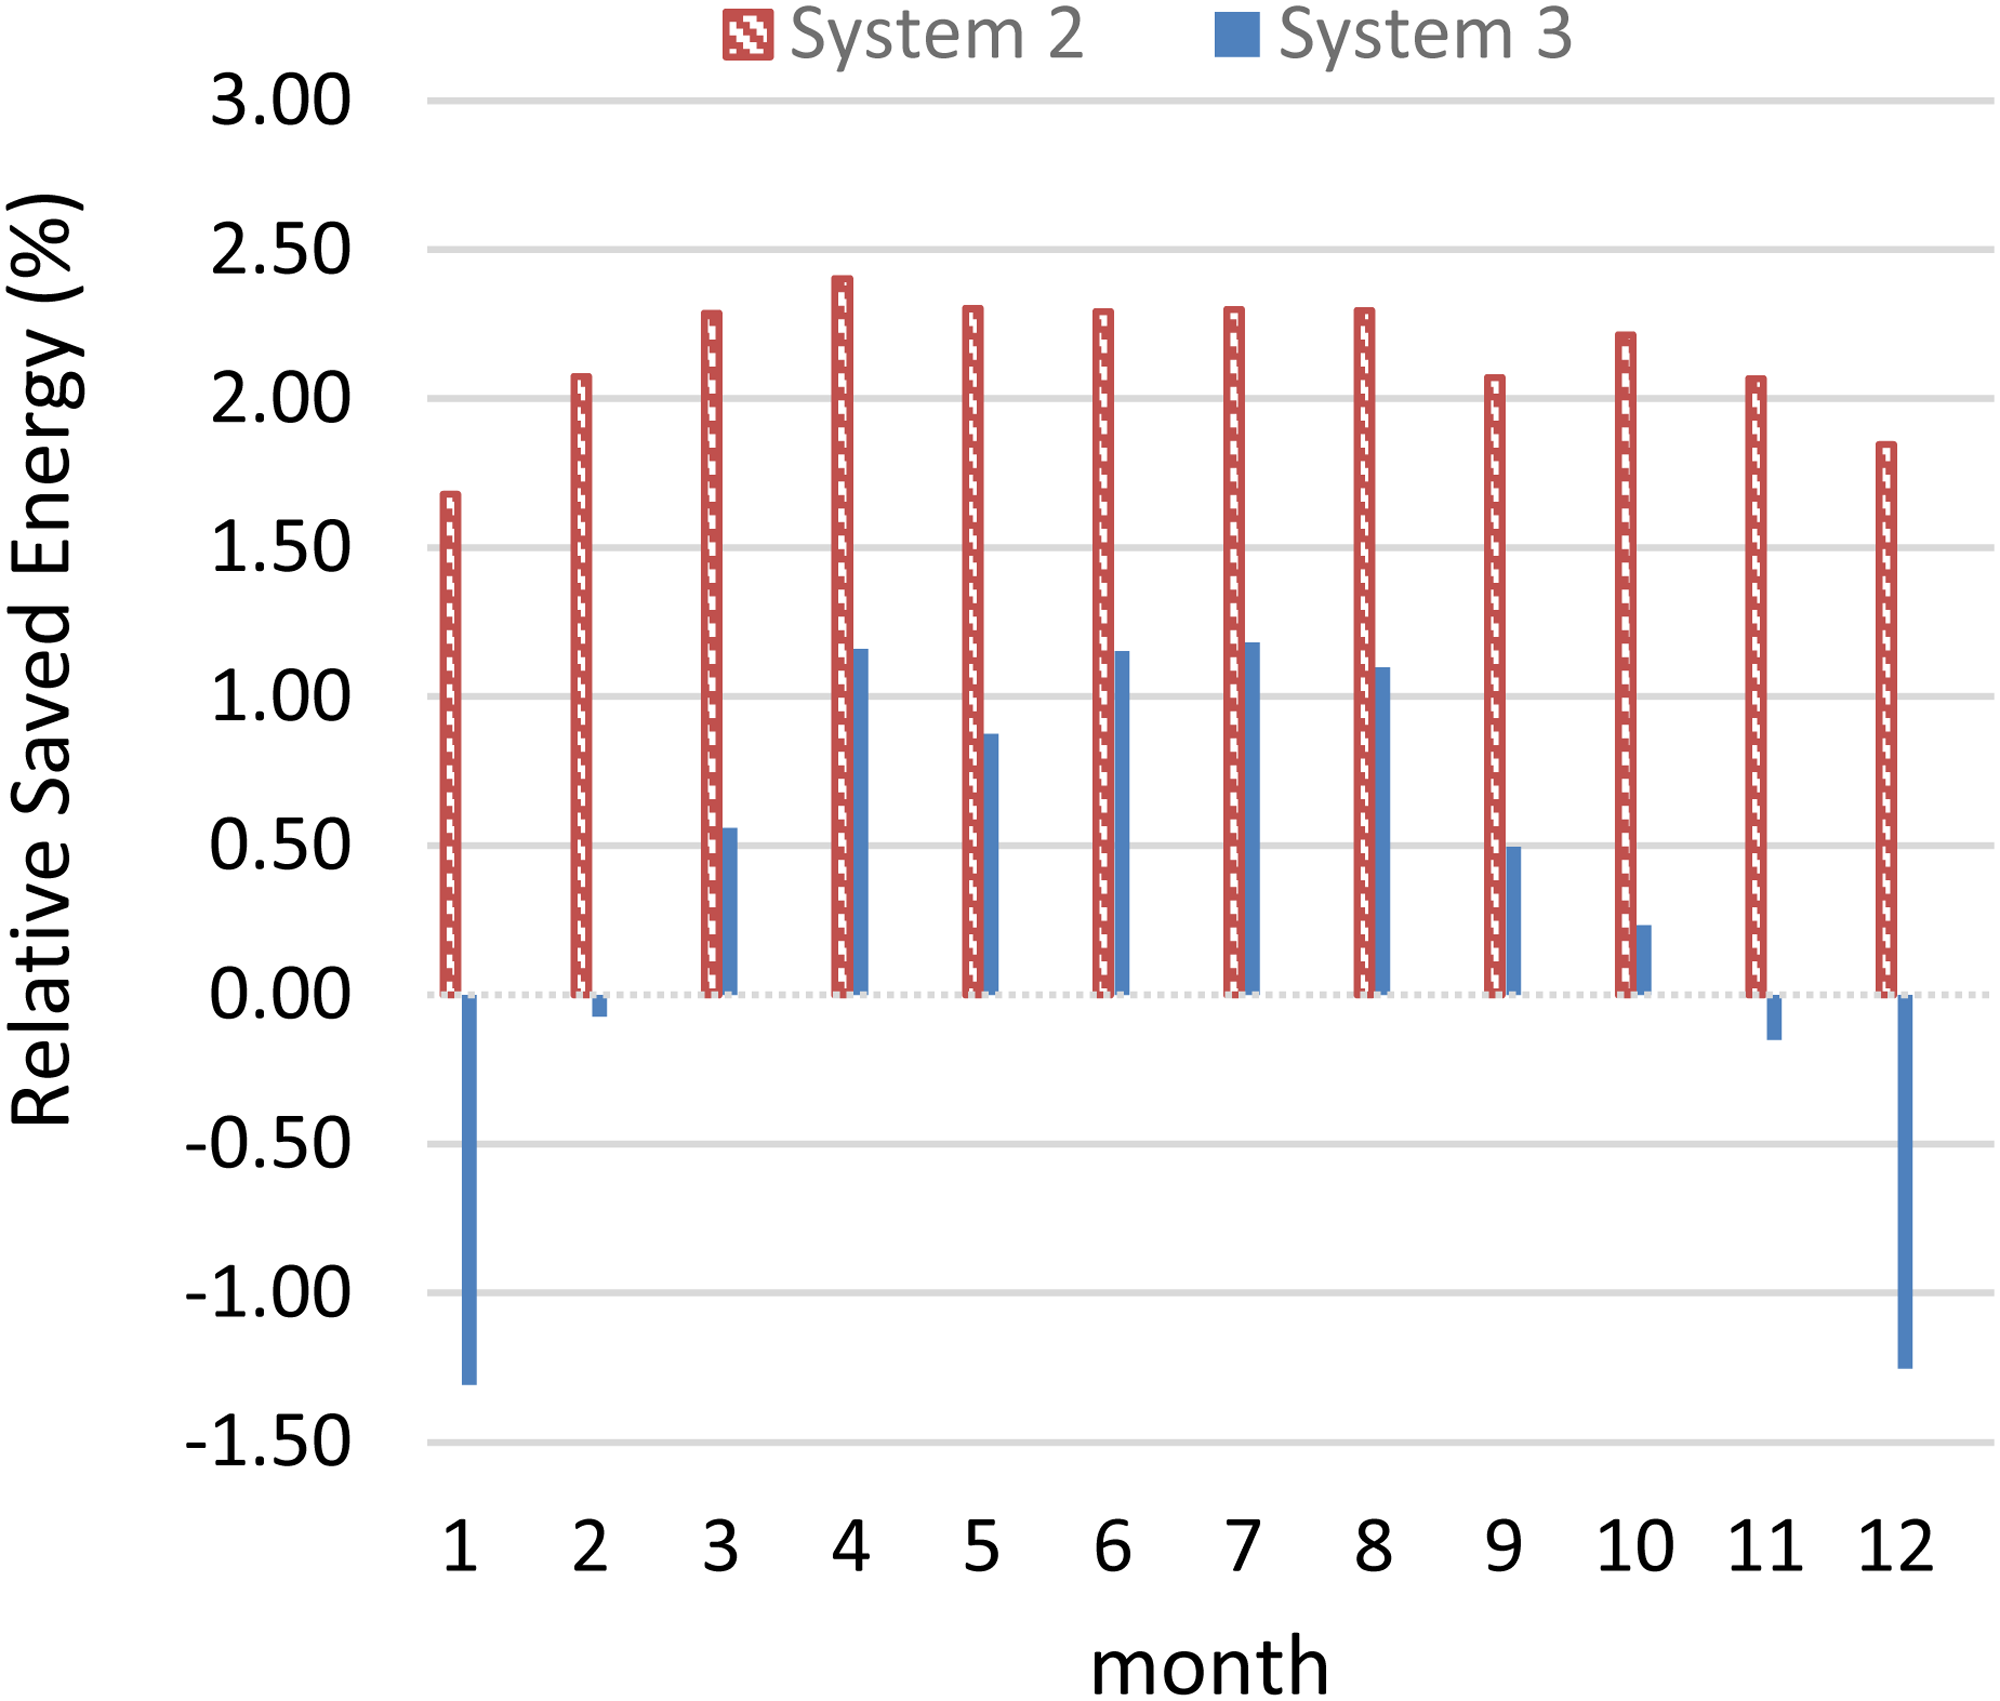
The RSE of system 2 and system 3 for each month when
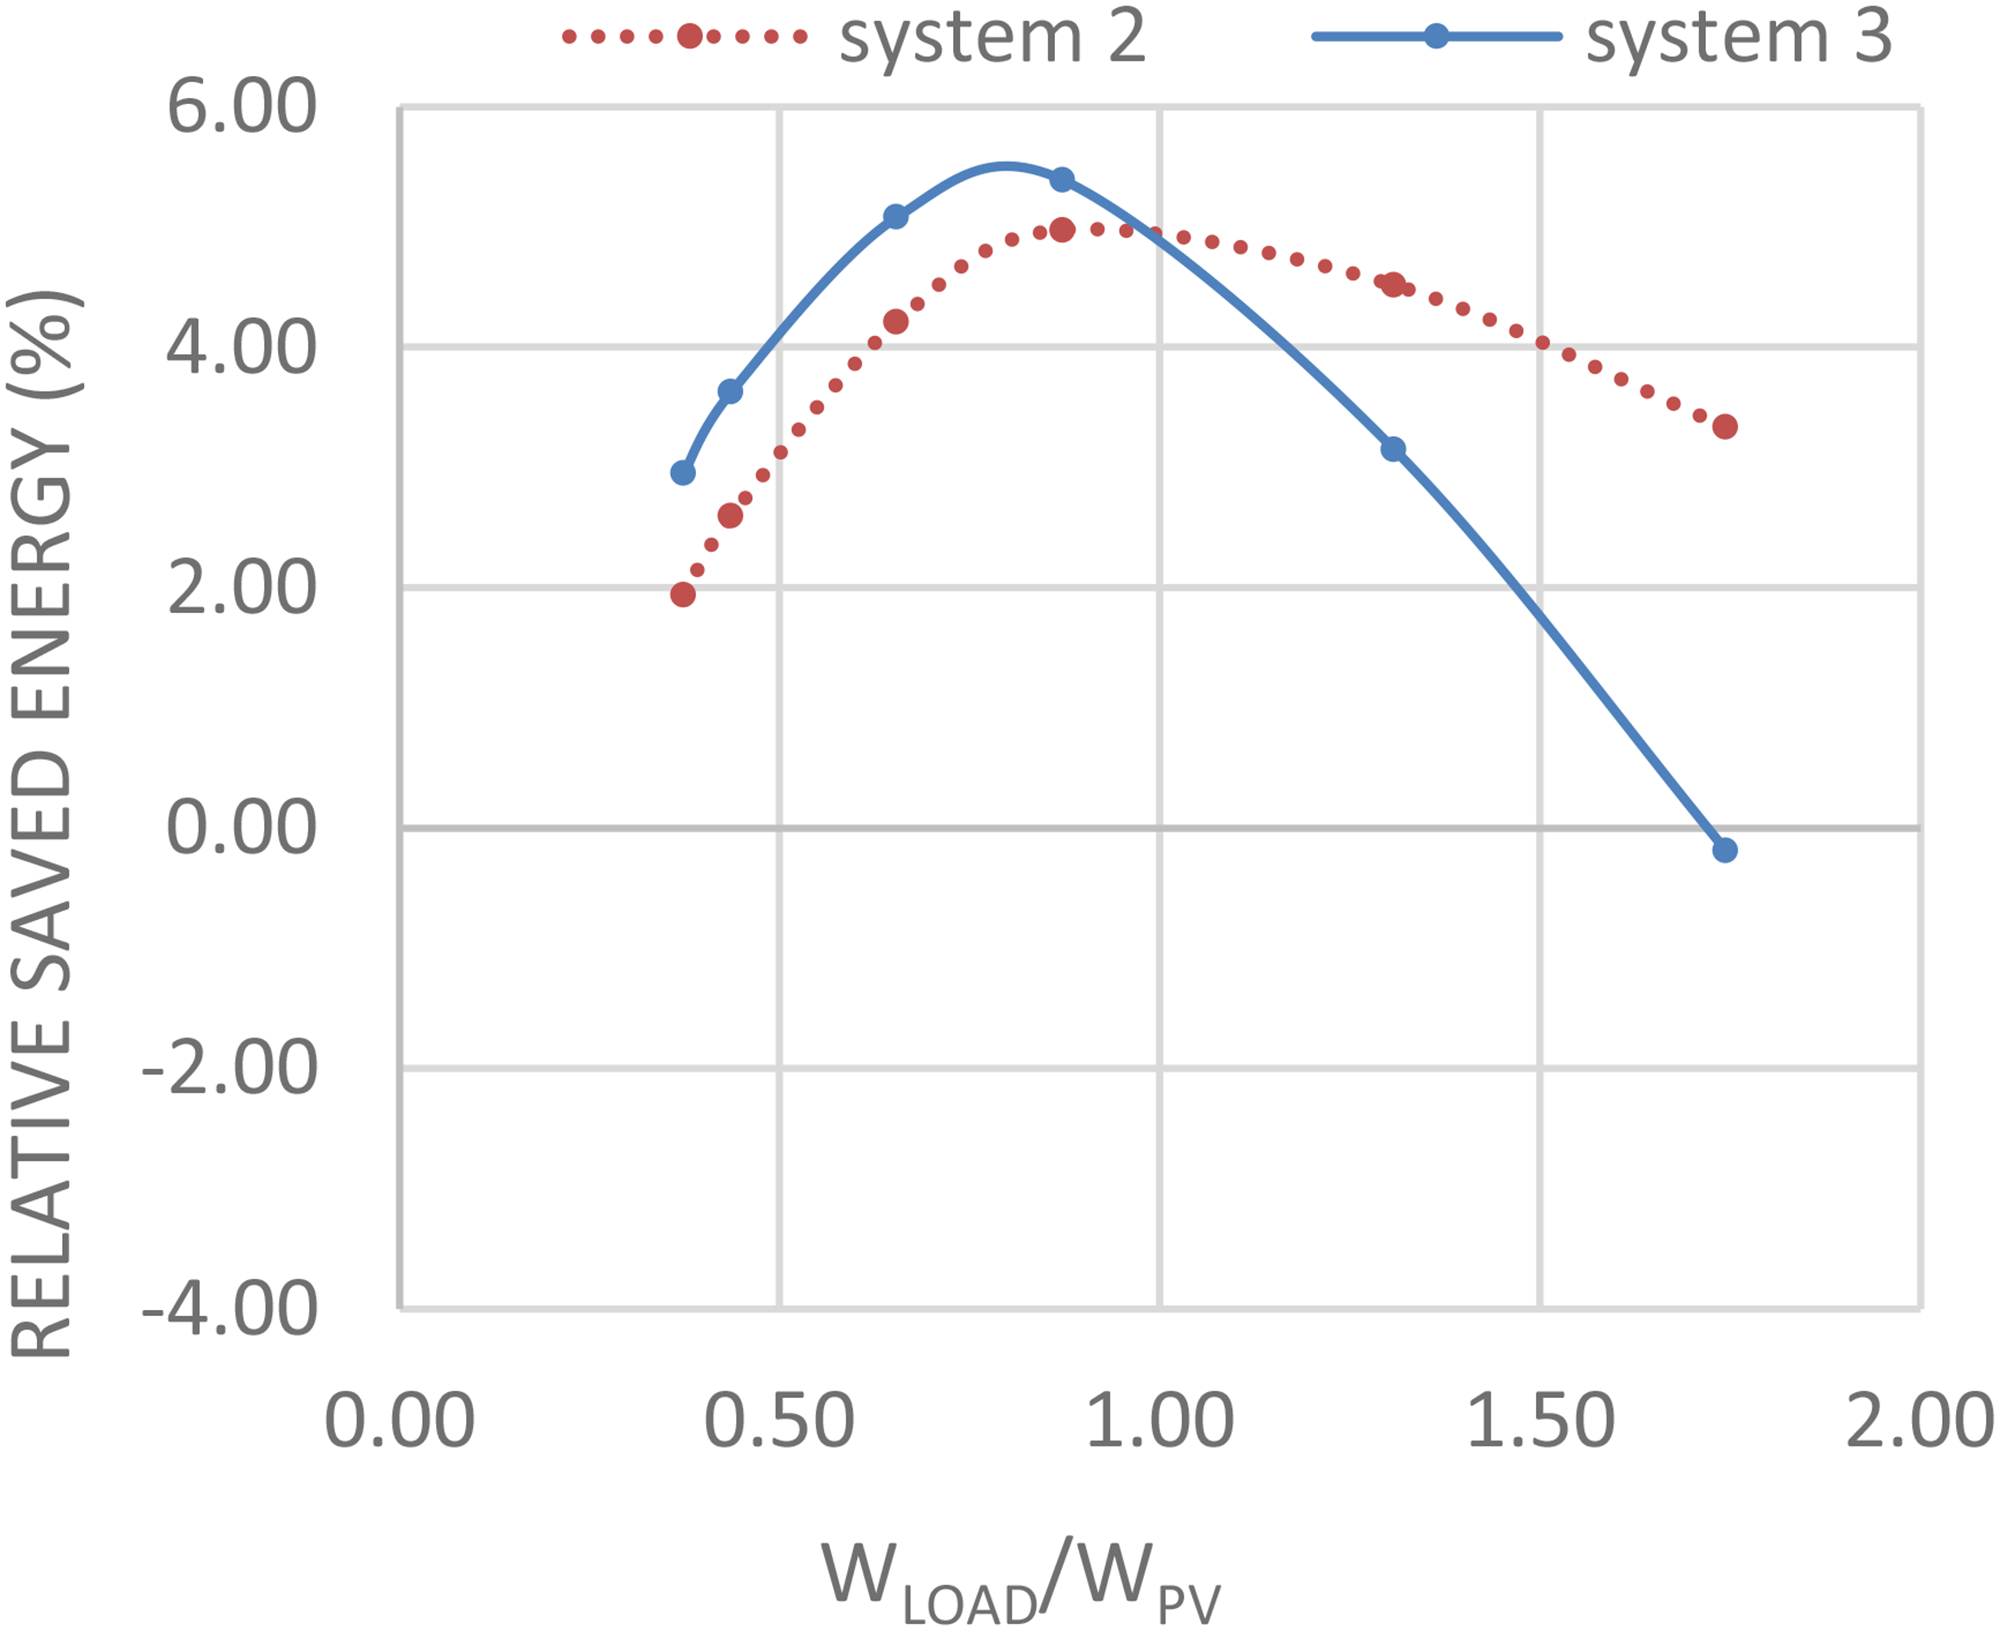
The waveforms give the evolution of the LVDC chains annual RSE as a function of load energy by PV energy rate
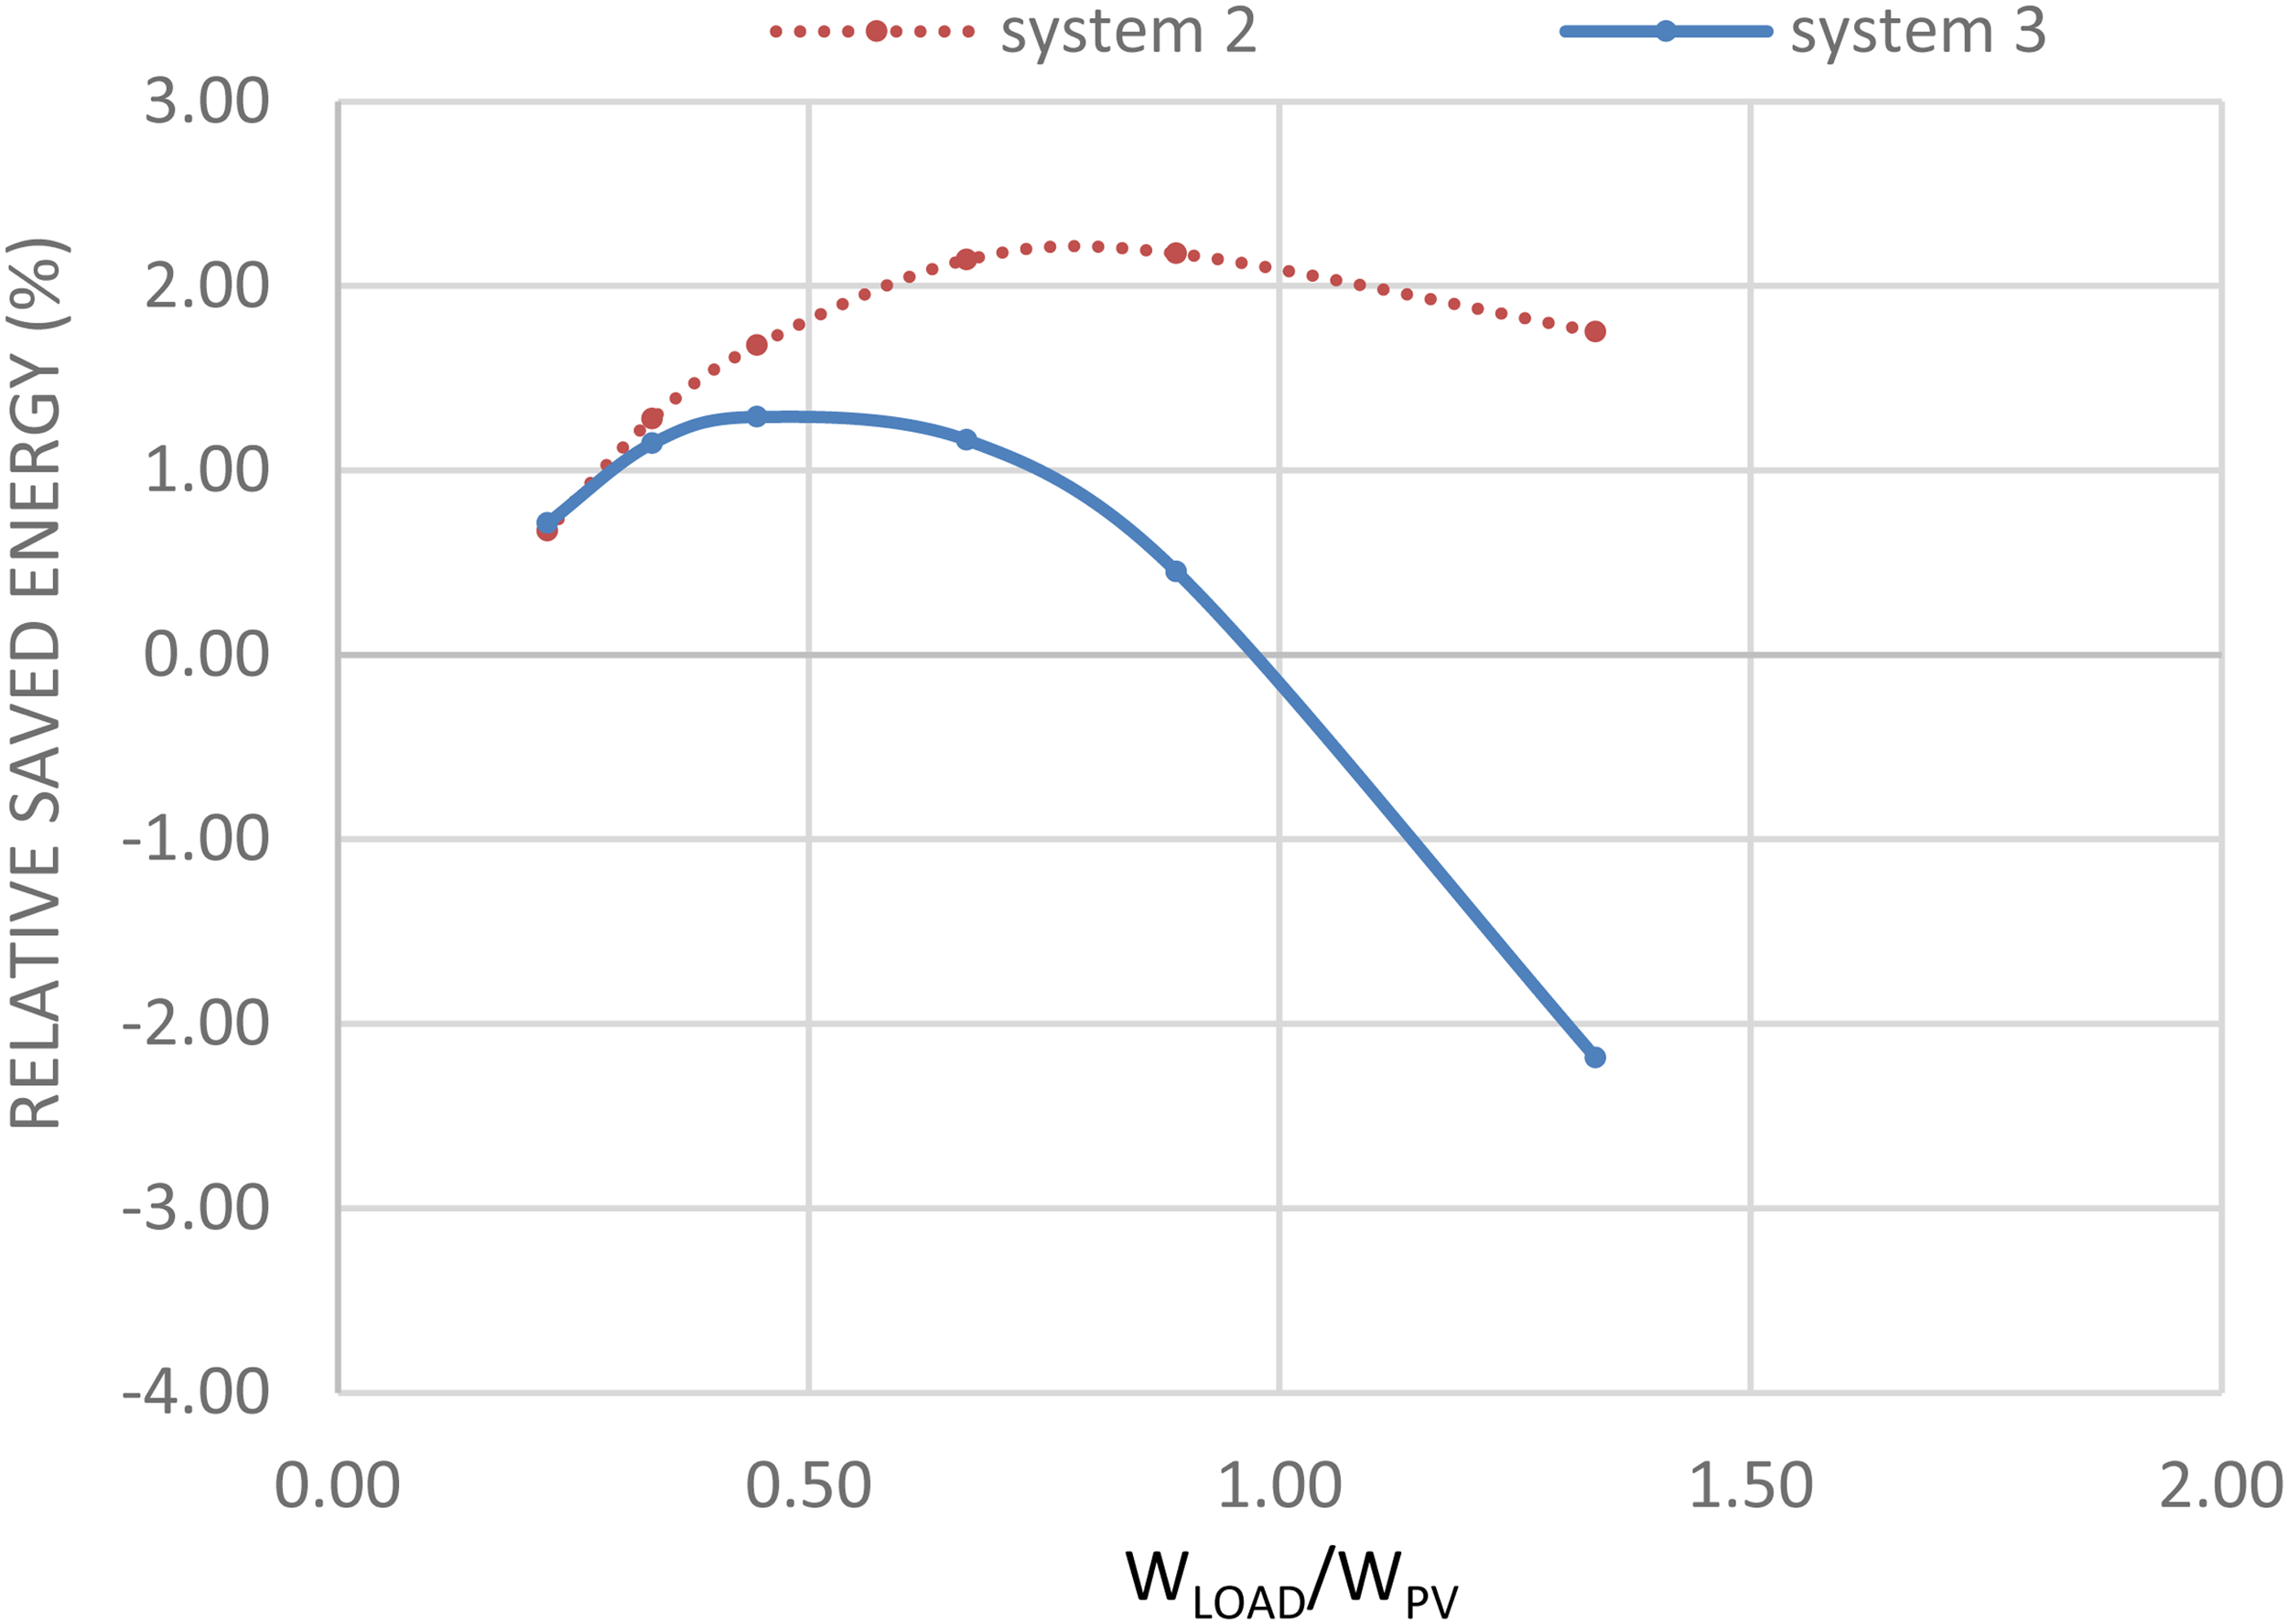
Annual RSE of system 2 and system 3 for home case 1.
The maximum annual RSE for the proposed LVDC chain in the first home case 1 is low and not interesting enough. This low efficiency was registered since the consumed power by the load during a day is low, and most of the PV-generated power goes to the grid. Consumed power by the home load at night participates mainly in the decrease of the LVDC configurations efficiencies. Therefore, we can conclude that using proposed system 3 for small home load consumption during the day is not interesting. The conventional LVDC system 2 becomes more interesting and registers a maximum of 2.0% increase in efficiency.
Power consumption by each load of the home case 2.
The daily load consumption for home case 2.
The RSE for the proposed system 3 becomes interesting as shown in Figure 19. The RSE value is higher than 4% for each month.
The RSE of system 2 and system 3 for each month when
The RSE for the two LVDC chains at various PV generated energy (WLoad constant) is shown in Figure 20, maximum RSE for system 3 is about 6%. We can remark that the optimum value of the consumed energy is not the same for system 2 and system 3, the optimum value of system 3 occurs when the PV-generated energy WPV is around 1.25 times the consumed energy WLoad.
Annual RSE of system 2 and system 3 for home case 2.
The daily load consumption for home case 3.
In this case, the RSE of proposed system 3 becomes more interesting than the other last cases. The monthly RSE with system 3 is higher than 14%, as shown in Figure 22. The annual generated energy from PV's is 16 MWh in the considered example of Figure 22 (considering a power peak of 8.48 kW generated by PV panels, this means a
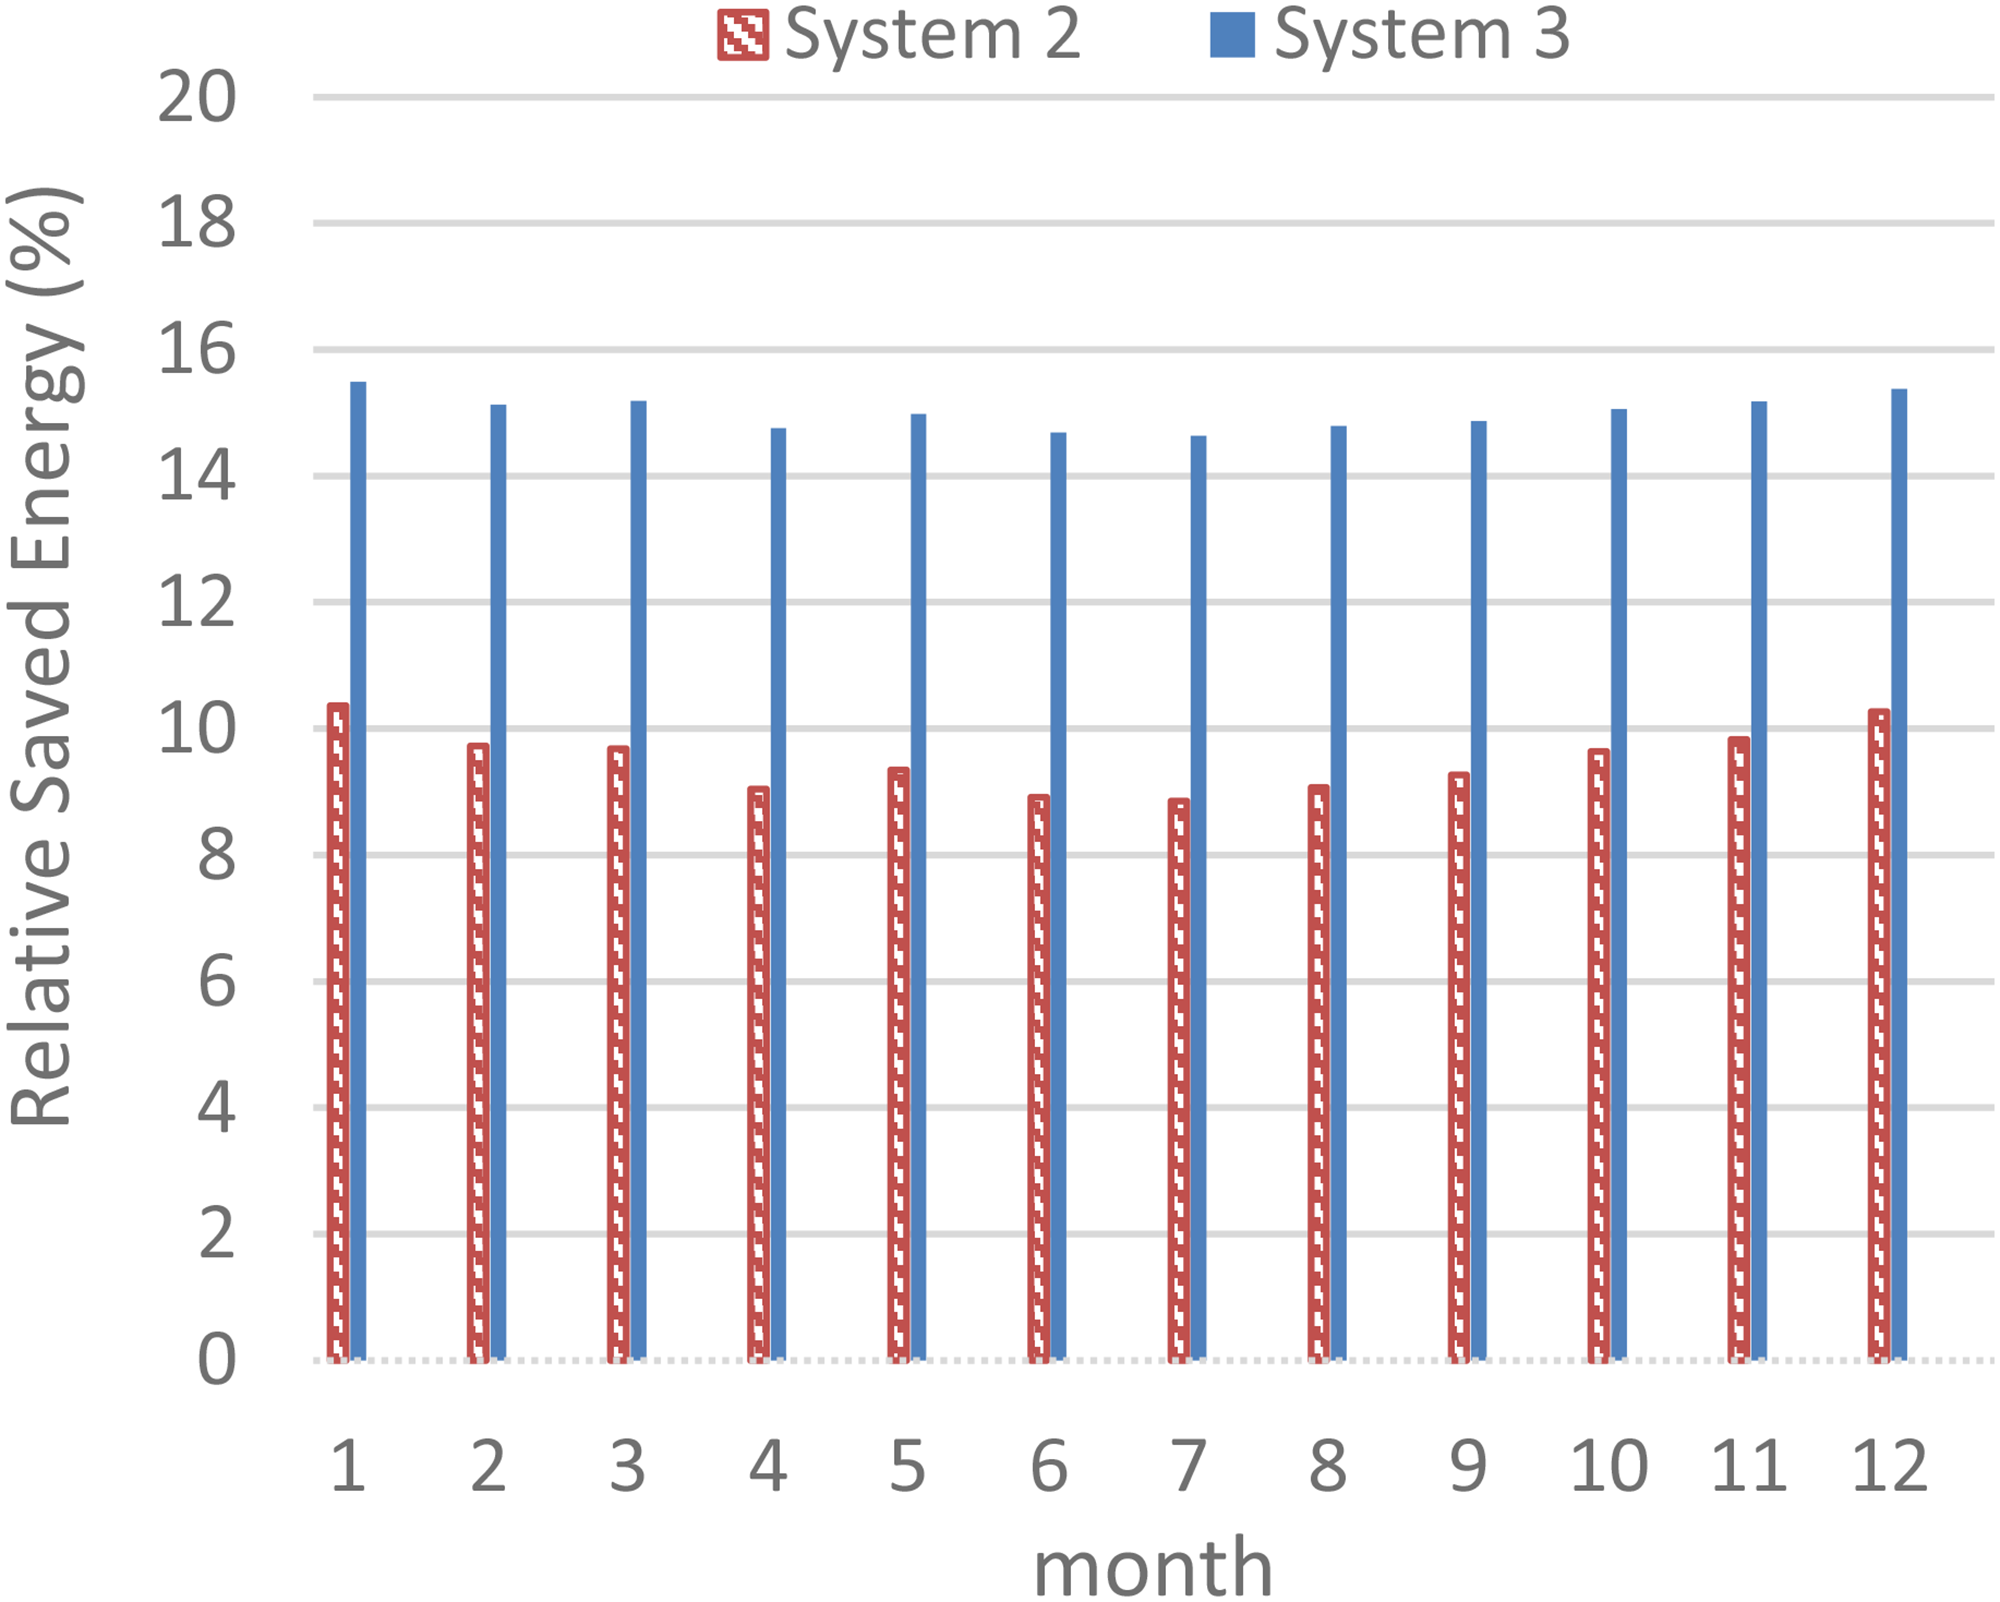
The RSE of system 2 and system 3 for each month when
The energy ratio
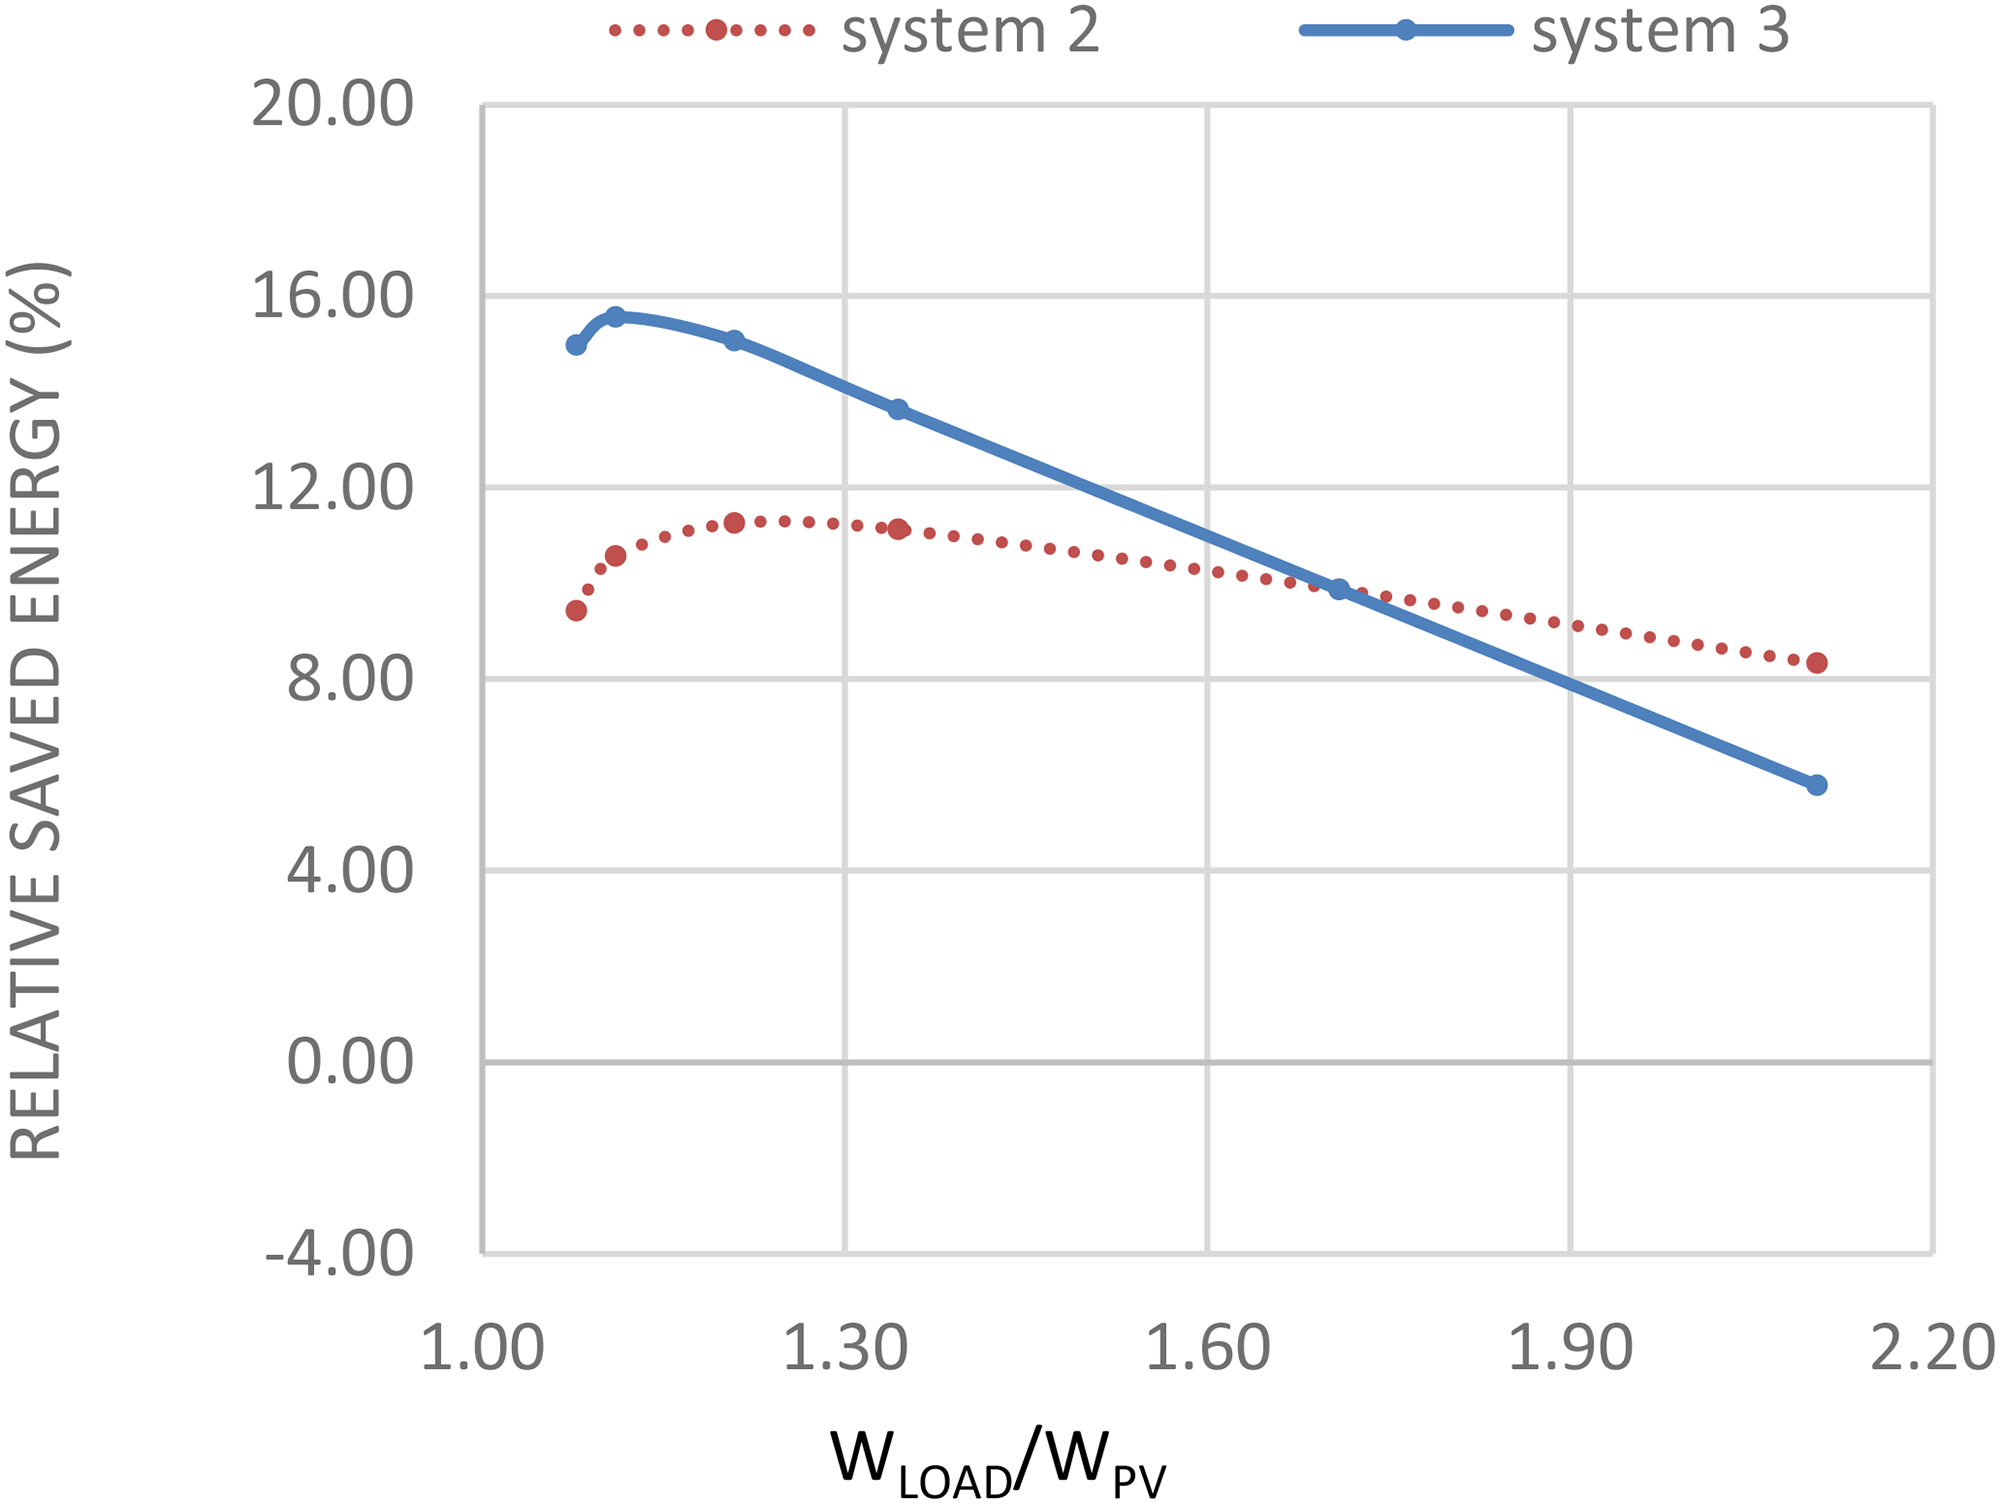
Annual RSE of system 2 and system 3 for home case 3.
The study performed in this last case shows and confirms that the use of the LVDC architectures, using PV's, is more beneficial if the consumed power by loads is during daytime. This is the case with most offices for example. On the other hand, for homes, the LVDC architectures become interesting for the same reason. However, for home case 3, the registered efficiencies are higher than the ones registered by offices due to the assumption that all the generated PV power was consumed (or saved in part).
The introduced notion of (RSE %) was proposed in order to evaluate the efficiency of LVDC architectures using DC loads compared to classical LVAC PV systems using AC loads. The RSE indicates if LVDC architecture is better or inferior to LVAC one and quantifies the saved energy, in percent, by using LVDC's instead of LVAC's architectures. A positive value of RSE means that LVDC architecture is more efficient than LVAC one, and the use of DC loads is better.
In order to decide about the accuracy of a given PV architecture, an evaluation of the RSE for the entire year is necessary since the generated PV power depends on climatic conditions, and load consumption is variable also.
Figures 16, 20, and 23 give the annual RSE, by three residential cases consumptions, are given as a function of the ratio (
In addition, the RSE evolutions give the ranges of the ratio (
From the studied three residentials cases, it was remarked that the saved energy, by using LVDC architectures, increases when the consumed power during daytime increases. The saved energy can be more than 15% (registered by system 3) compared to classical LVAC systems.
From higher residence consumed power during daytime, the proposed LVDC architecture (system 3) offers better efficiencies compared to classical LVDC architecture (system 2) that reached more than 5%. In fact, for system 3, the power generated by PVs takes a shorter path heading towards the load directly without going through the power controller (ɳ1) during the daytime. This means that it is more interesting to use the PV-generated power locally with a minimum conversion. The proposed architecture will be more interesting if DC loads exist during day hours and installed PV energy in the building is well-sized regarding the consumed energy. For low power consumption during the daytime, it is not interesting to use LVDC architectures. Classical LVAC PV systems become more practice and economical in this case.
Conclusion
A novel architecture of the LVDC supply concept is proposed in this paper. The proposed grid-connected PV system utilizing DC loads can be used in place of conventional grid-connected PV systems that use AC sockets to supply AC loads. In the proposed LVDC architecture, the power generated by PVs takes a shorter path heading towards the load directly without going through the MPPT controller. This means that it is more interesting to use the PV-generated power locally with minimum conversions stages. This propriety of the proposed LVDC architecture made it more attractive than the classic LVDC architectures, especially if the power absorbed by the load is important during the day hours. The realization of the proposed LVDC architecture is presented in this paper. The efficiency of each converter used in the studied systems is measured by experiments. Efficiency evaluation of the new LVDC architecture against the classical one was carried out for residential applications. Three different residential cases were considered, the performances of the different cases show that the LVDC systems are attractive, especially if the main home power is consumed during day hours. However, the LVDC system accuracy depends on the ratio of energy consumption by the load to energy produced by PV panels, and it can reach more than 15%.
Footnotes
Acknowledgements
The authors extend their appreciation to the Deputyship for Research and Innovation, Ministry of Education in Saudi Arabia for funding this research work through the project number 1212.
Declaration of conflicting interests
The author(s) declared no potential conflicts of interest with respect to the research, authorship, and/or publication of this article.
Funding
The author(s) disclosed receipt of the following financial support for the research, authorship, and/or publication of this article: Project funded by Deputyship for Research & Innovation, Ministry of Education in Saudi Arabia – Grant: 1212.