
Abstract
Keywords
Introduction
Jordan's geographical location is in the world's solar belt countries correspond to an annual total of 1800–2700 kWh/m². It has an average sunshine duration of more than 310 days per year and large zones of excellent annual global radiation (Abu-Rumman et al., 2020). In Jordan, a hot water supply is very essential for washing, cleaning, and other household needs as well as essential for hospitals, hotels, and various industrial applications. Solar water heaters (SWH) are operated by clean renewable solar energy, which reduces the conventional energy demand, electricity bills, and environmental effects, and greenhouse gases. About 20% of all Jordanian households in 2018 have their solar water heating systems. Jordan Energy Strategy “2020–2030” aims to equip 30% of the households with a SWH system by 2030 (Abu-Rumman et al., 2020).
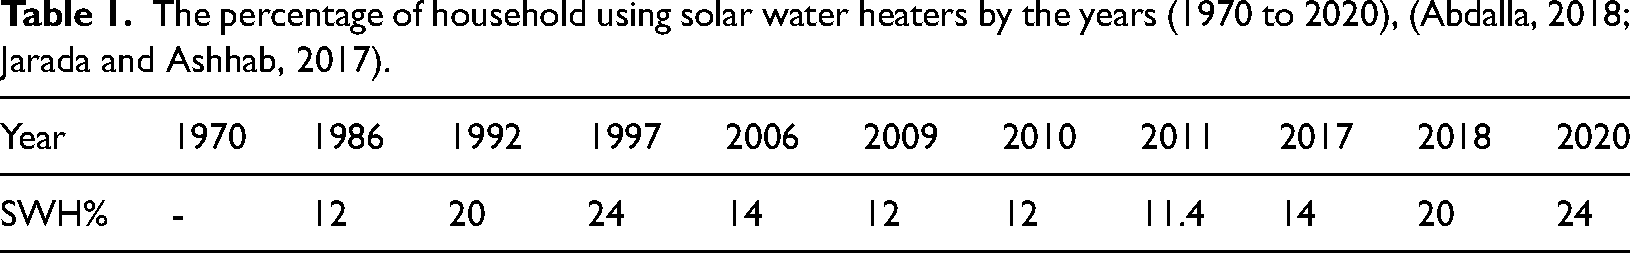
In the early 1970s, solar water heaters began to be used in Jordan as a source of renewable energy. Over time, the percentage of households using solar water heaters fluctuated as shown in Table 1 (Abdalla, 2018; Jarada and Ashhab, 2017). As shown in Table 1, some periods are characterized by a slowdown percentage because of relatively low economic feasibility and long payback period compared with the electricity, gas, and diesel fuels (Badran, 2001). Also, due to the fluctuations in oil and electricity prices after the world economic crisis in 2008 (Jaber et al., 2015). Although the cost per kWh of energy produced by SWHs is not affected by the rise in other fuel prices, the rise in these prices affects the percentage of Jordanian households that install these systems. The rise in electricity prices in Jordan has made the demand for installing solar water heaters is less than the demand for residential photovoltaic installations.
The percentage of household using solar water heaters by the years (1970 to 2020), (Abdalla, 2018; Jarada and Ashhab, 2017).
The paper becomes critical since it becomes after the Jordan Renewable Energy and Energy Efficiency Fund (JREEF) law had been approved in the Jordanian parliament in 2012 and the current Renewable Energy and Energy Efficiency (REEE) Law. As a result, Jordan's renewable energy projects had been increasing (Kiwan and Al-Gharibeh, 2020). Despite Jordan has enough natural sustainable and renewable energy sources, it still depends on the imports of fossil fuels and gas for energy generation. In 2019, Jordan imported 95% of its energy consumption (Hamed and Bressler, 2019). In Jordan, 61% of the total energy consumed in the domestic sector is used for heating purposes. It is nearly 14% of the total annual power consumption. SWH systems are widespread in Jordan: nearly 25% of the dwelling systems (Anwar and Dalabeeh, 2017). In Palestine, while Palestinian spends up to 21.6% of their monthly income on heating purposes, the average nominal heated area of the Palestinian households is just 9.2% (Jaber, 2002). As an oil producer, Iraq's energy strategy is to increase the contribution rate of electric power produced from renewable energy sources to 9.4% of the whole power consumption by 2030 (Al Qadi et al., 2018). By the end of 2017, the total installed surface area of SWHs in Lebanon exceeded 608,000 m2 with a total capacity exceeded 25,000 m3/day. There are two types of SWH used in Jordan, Flat-plate thermal solar collector and Evacuated-Tube Collectors. The Evacuated-Tube Collectors are widespread in Jordan due to their comparatively high-efficiency absorption of solar radiation in Jordan weather fluctuations of wind speeds and temperatures. In Lebanon, Evacuated-Tube Collectors represent 65% of the SWHs market that has a target to cover a 1,054,000 m2 by the end of 2020, which represents 12% of the total electricity and heating demands (Al-Kayiem and Mohammad, 2019; Kinab and Elkhoury, 2012). Data reported by (Streimikiene and Kasperowicz, 2016) classified the Mediterranean Countries based on total areas of SWHs installed (A in m²). It shows Algeria and Libya in the lower level where A < 300,000 m², Egypt and Syria in the middle level of 300,000 m² < A < 700,000 m² while Jordan and Palestine in the upper level where A > 700,000 m². In Jordan, nearly 1.400,000 m2 of SWHs were installed by the end of 2018, which represents 30% of house holdings demands (Streimikiene and Kasperowicz, 2016). In terms of per 1000 capita, thermal power installed capacity was (403 kW) by Israel, followed by Palestine (260 kW) and then Jordan (144 kW) (Streimikiene and Kasperowicz, 2016).
Human energy consumption indicates a significant growth in greenhouse gas production, which reduces life expectancy through environmental degradation (Mahdi, 2018). The type of energy used by humans has environmental concerns. The quality of life of a human being is considerably affected by these concerns and there is a direct relation between power consumption and quality of life (Tang and Tan, 2014). More power consumption means higher life quality. Installing solar water heaters maximizes the health benefits by increasing renewable energy consumption and reducing greenhouse gas emissions, which means higher human development index HDI.
Although extensive research has been carried out to study the mechanical characteristics of solar water heaters based on energy savings, installing data, and working conditions (Abdalla, 2018; Abu-Rumman et al., 2020; Al-Kayiem and Mohammad, 2019; Al Qadi et al., 2018; Anwar and Dalabeeh, 2017; Badran, 2001; Hamed and Bressler, 2019; Jaber, 2002; Jaber et al., 2015; Jarada and Ashhab, 2017; Kiwan and Al-Gharibeh, 2020). Many studies have been done to investigate the relationship between energy consumption and economic growth (Angelė and Violeta, 2020; Chica-Olmo et al., 2020; Husam et al., 2021; Peng and Wu, 2020; Rahman et al., 2021; Uma et al., 2021) [41]. Few studies were done to investigate the relation between economic growing considering energy consumption and life expectancy (Mahdi, 2018). However, no single study exists which sufficiently covers the effect of installing solar water heaters on the HDI or investigates the linkage between solar heaters installation growth and global HDI despite it has positively affected by the installation of these solar heaters.
This paper aims to estimate the use of SWHs in Jordanian households and their impact on improving quality of life as well as the Human Development Index (HDI) using data of Jordan. Also to estimate the impact of the rise in electricity prices and power consumption intensity on the installing capacity. Then to predict the solar water heaters characteristics using analytical equations for comparison with the statistical data. Through this study, we will know the rates of people's appetite for solar water heaters SWHs, and types of solar collectors in residential buildings to predict future demands. It is also necessary to display the growth in the use of solar water heaters, and the benefit from EDAMA projects that started in 2011, which resulted in raising the percentage of households using SWH to 15% till 2017 (The Evolution of the Solar Water Heaters Market in Lebanon 2012 2017 and beyond, 2019).
Methods
This investigation becomes to consider and analyze the statistical data of Jordanian households, and the SWH has been installed since the Jordanian program for funding the SWHs in 2012. It focuses on the impact of the SWHs on environmental issues and offers assistance to sustain and push the SWH market forward. The study was conducted through a survey covered an area of 10 km in diameter from Al Zaytoonah University of Jordan. The survey was conducted by sixteen students at the university during the 2016/2017 semester under the supervision of the authoring team. The area sampling method was implemented in this study. Area sampling has been used in studies that cover different and widely spaced geographical locations. The site adjacent to the university has been chosen as a sample representing the capital city of Jordan. The number of houses has been selected using a random sample of 1033 houses according to the population density zones and to the number of square blocks needed. The available studies related to this investigation in the world and neighboring countries are considered for comparison. The number of flats studied by the survey was 1033, with a total of 5597 occupants. The survey included questions dealing with the number of households, number of occupants in a given household, area of each household, and the type and number of SWHs installed. An estimate of the total household energy consumption and the total area of the solar collectors were obtained accompanied by the data from the Jordan weather and energy organizations. The data collected was analyzed for total energy consumption per capita and total area of the solar collectors per capita. Studying and analyzing the results were carried out to estimate the predictability and relationship between the interference variables.
Results and discussion
Researchers have already drawn attention to the installation of SWHs. On average, installing solar water heaters will decrease the electrical energy utility bills and increase energy efficiency. A high electricity demand, in the mornings and evenings, has been observed when the energy demand for domestic hot water increases (Wang et al., 2020). Experimental investigations of the overall consumption of energy under local weather conditions of Jordan indicated that the major share of residential energy consumed is used in heating domestic water (The Evolution of the Solar Water Heaters Market in Lebanon 2012 2017 and beyond, 2019; Wolde-Rufael, 2009).
Despite the high levels of solar radiation in Jordan, the Jordanian households have not yet used this amount in SWHs with the same level. Records of power consumption in Jordan in 2016 shows the domestic hot water is the second main energy demand in the household that consumes 23% of the global energy consumption. This amount of energy is distributed between domestic applications such as; heating, cooling, lighting, and other household uses (Bataineh and Alrabee, 2018). As estimated by (The Evolution of the Solar Water Heaters Market in Lebanon 2012 2017 and beyond, 2019), SWHs save 20–30% of electricity bills of Jordanian household's uses (The Evolution of the Solar Water Heaters Market in Lebanon 2012 2017 and beyond, 2019). Figure 1 show the time duration of Jordanian power consumption per capita as an energy indicator for the years “1990 to 2018”. It shows a growth period between “1990 and 2011” until it reaches its higher value in 2012, then it starts to decay in the period between “20013 and 2018”. This decay was due to three reasons: Firstly, the renewable energy and energy efficiency law that was approved by the government in 2010, which made several obstacles against the large renewable energy projects. This law was implemented during 2010 and 2015, and during this period the renewable energy and solar energy sectors faced a decline that continued until the beginning of 2016 (Kiwan and Al-Gharibeh, 2020). Secondly, the events of the Arab Spring, refugees from neighboring countries, and the war against terrorism at Jordan border. Thirdly, the growth in the using of photovoltaic cells to generate electricity directly from the sunlight. In recent years, there has been an increasing interest in installing PV panels on roof-tops as electricity generating units. Over the years, PV panels have been manufactured at lower costs and can generate energy at a higher efficiency. However, these progressive installations are having a great effect on reducing the electrical consumption from the public grid and decreasing the installation of SWHs.
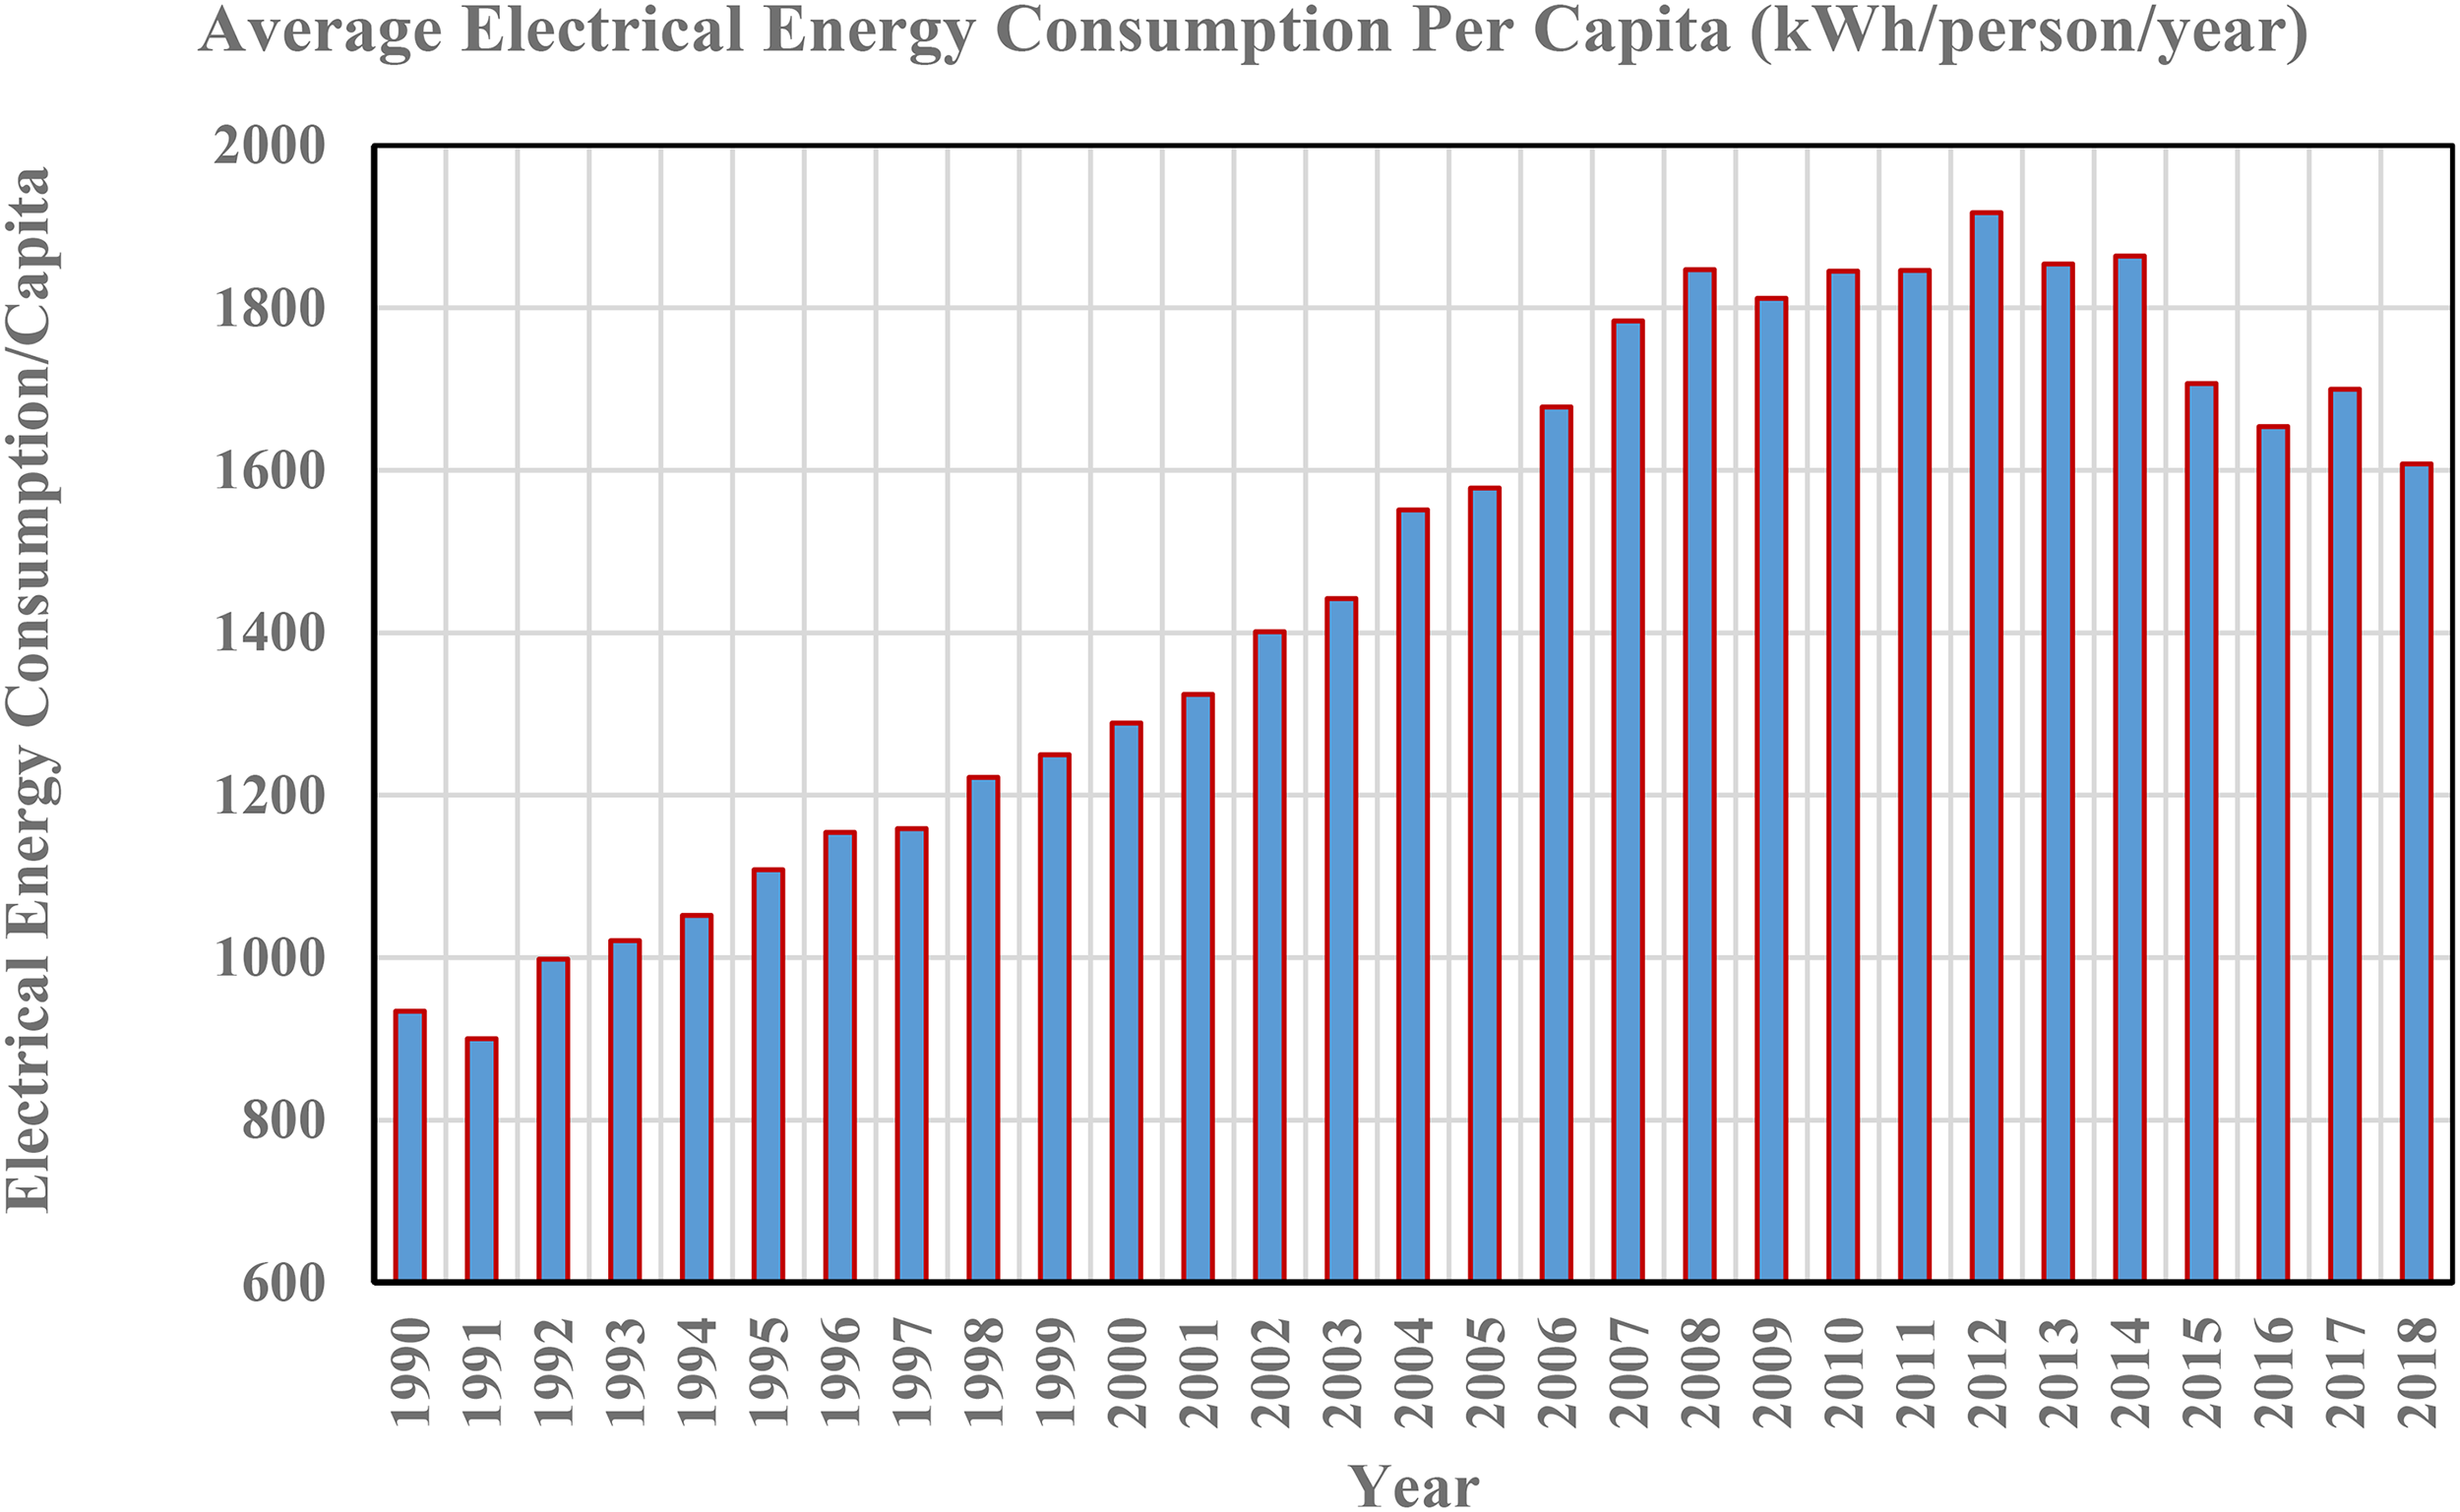
Shows the time evolution of Jordanian power consumption per capita as an energy indicator for the years “1990 to 2018”.
To identify the position of Jordan in its neighborhood, Figure 2 shows Jordan's electric power consumption per capita (kWh) compared with its neighbors in the Middle East As shown in Figure 2, the annual electric power consumption per capita in Jordan is low compared with its closest neighbors in the region. While the annual power consumption in Saudi Arabia (KSA) is 9401 kWh/capita, in Lebanon is 2588 kWh/capita, in Jordan, it is 1865 kWh/capita (Dar-Mousa and Makhamreh, 2019). On the other side, it is higher than Syria, Egypt, and Iraq. It is an indicator of human development where more people need greater energy use. Comparing to Europe, while the percentage of renewable energy to the total energy in Jordan is 12% it is 19.7% in Europe. While the annual electric power consumption per capita in Jordan is 503.00 kWh, the value is 3278.62 kWh for Europe (Dar-Mousa and Makhamreh, 2019).
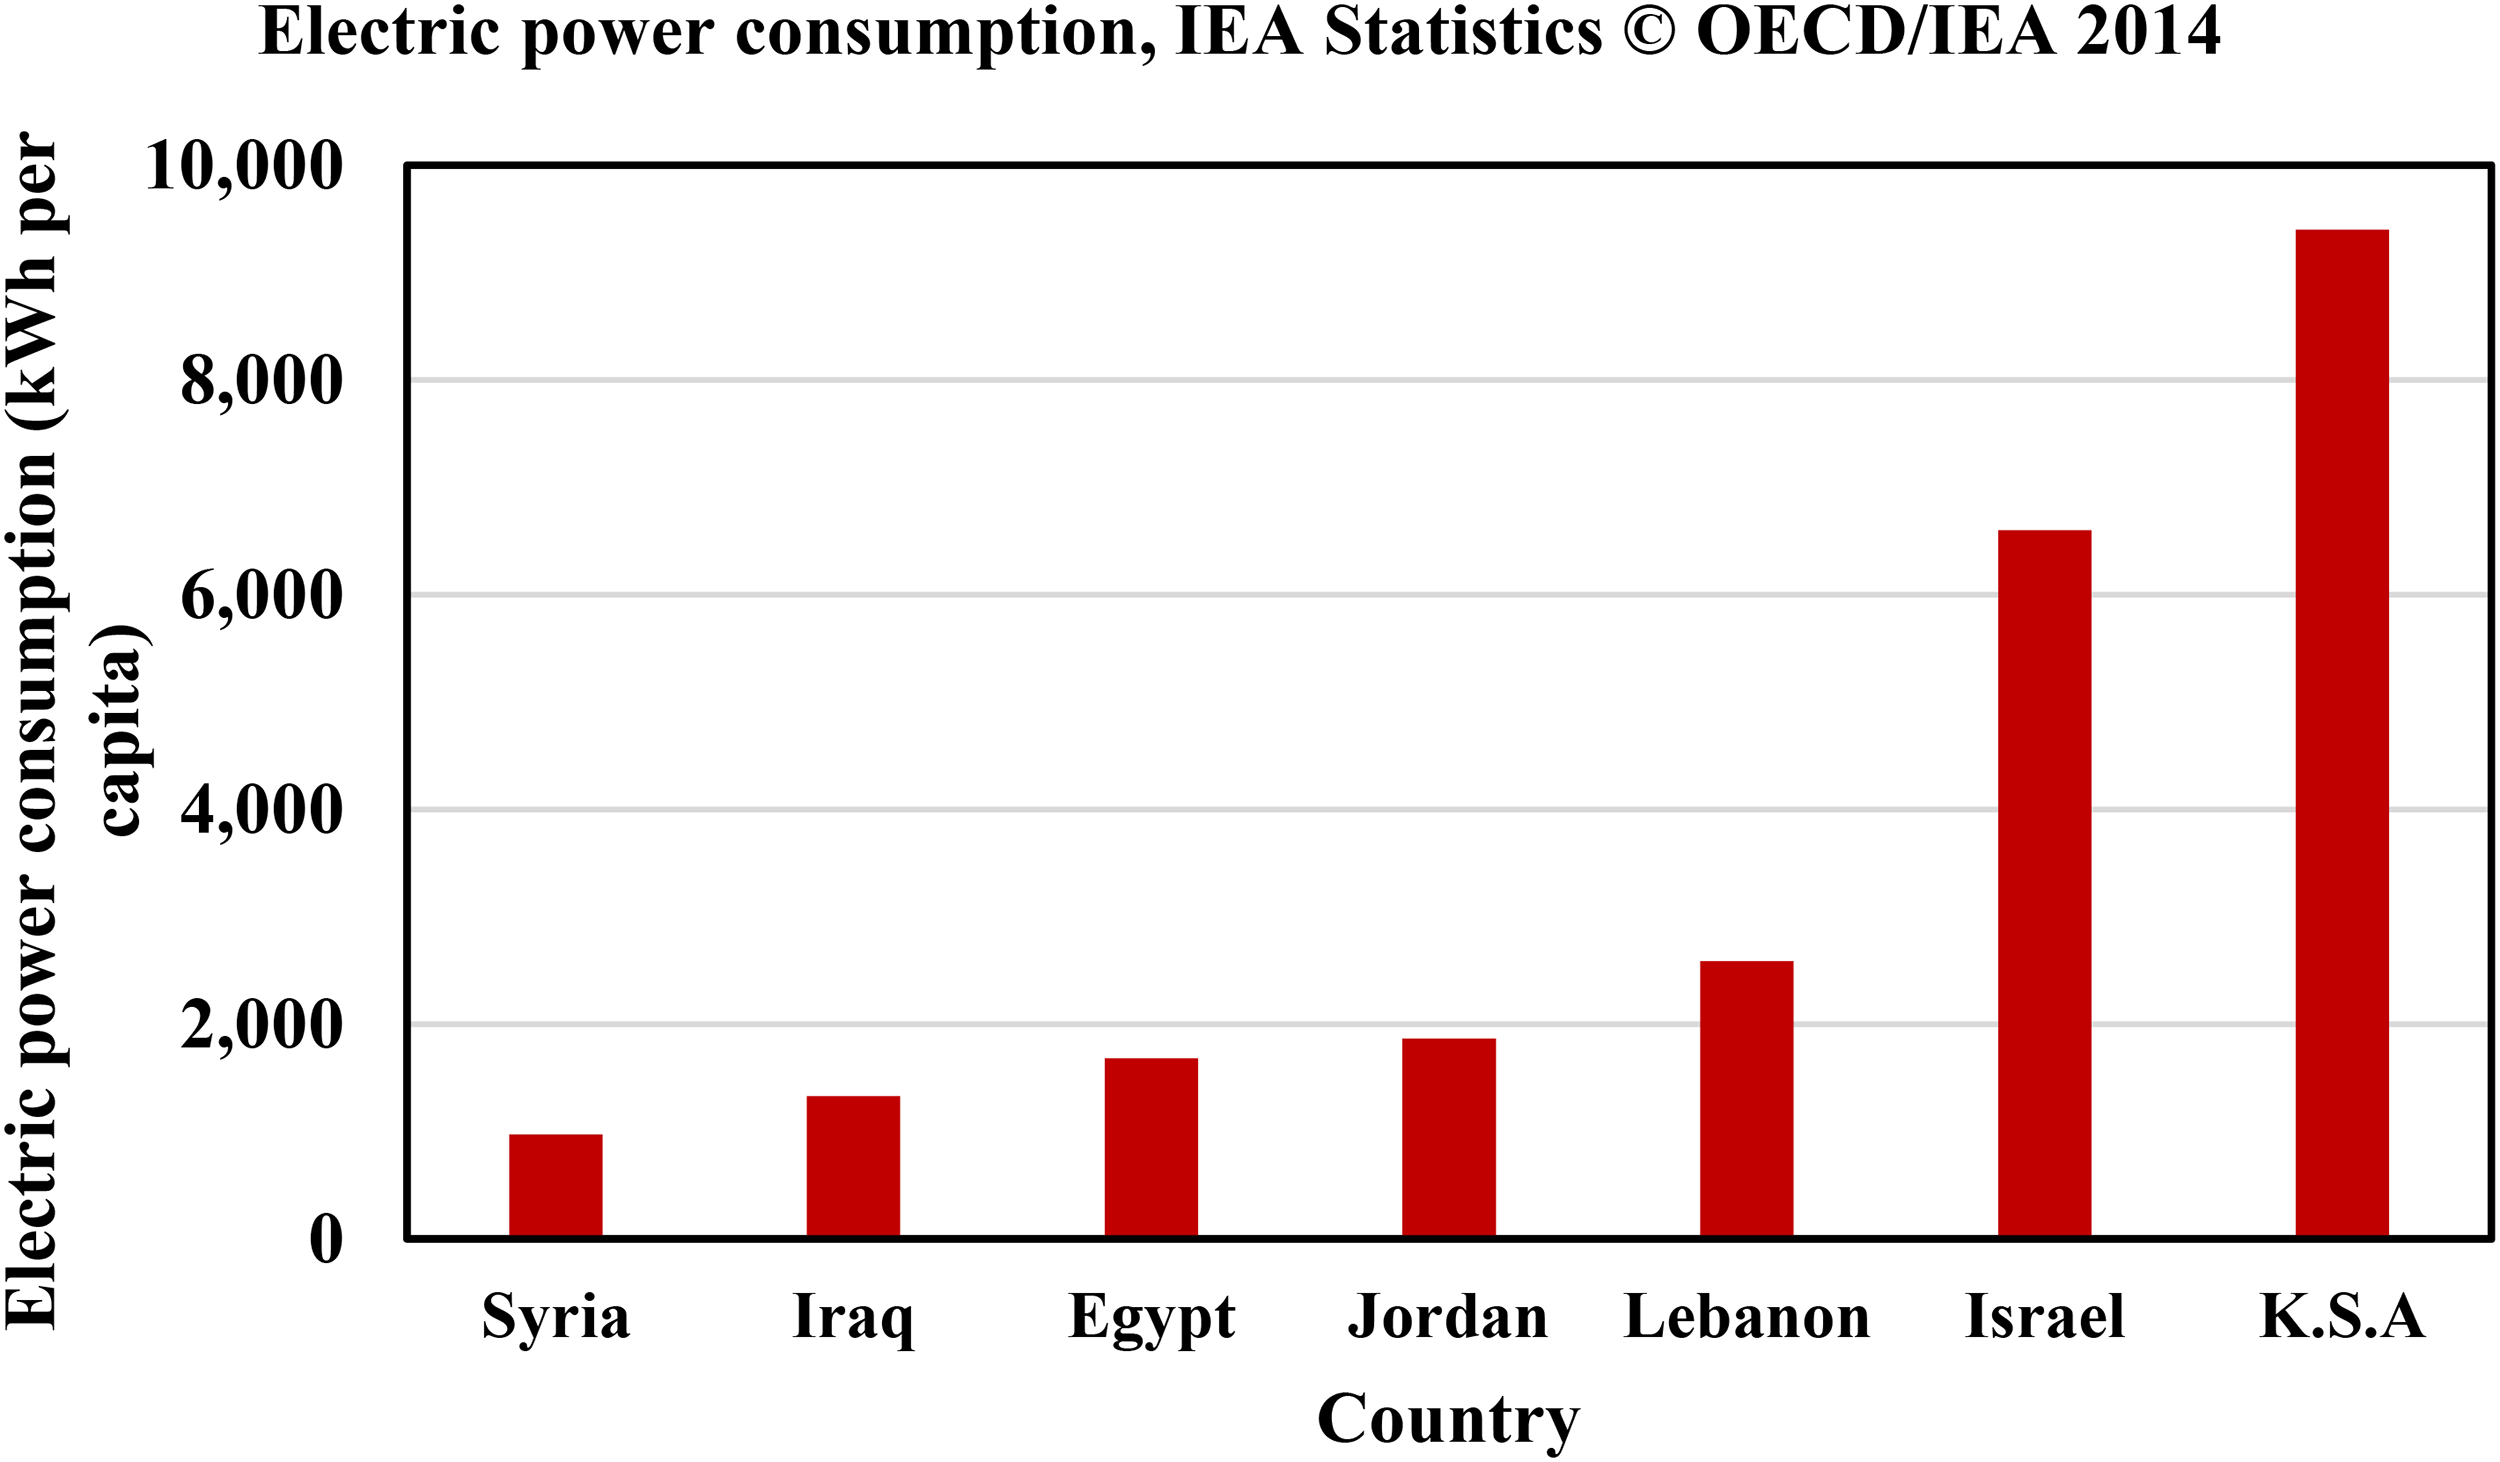
Shows Jordan's electric power consumption per capita (kWh) compared with its neighbors in the Middle East.
Figure 3 shows the Gross National Income (GNI) and the Human Development Index (HDI) for Jordanian life during the period “1990 to 2018”. Figure 3 shows the growth period of Jordanian level of development, which means a growing in Human Development Index (HDI), which is the arithmetical mean of three-dimensional indices of Health, Education and Income (The World Bank Group, 2020):
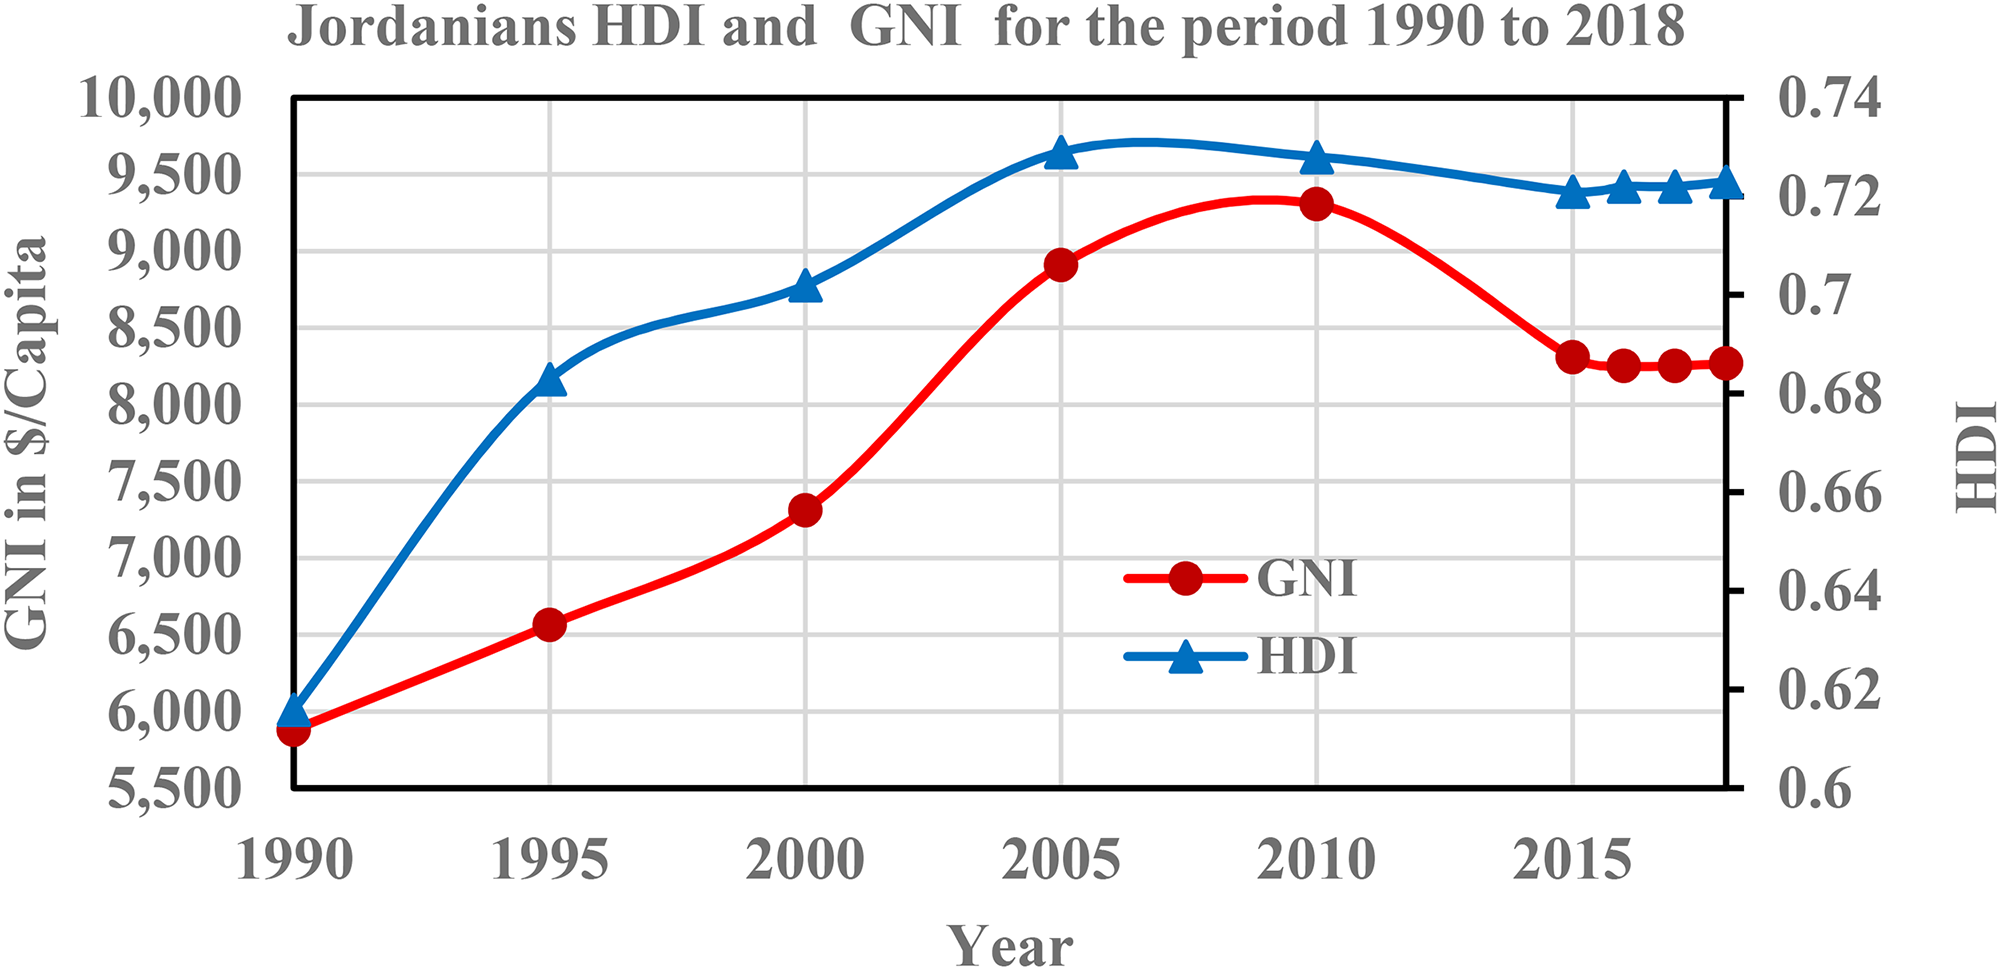
The time duration of Jordanian Gross National Income (GNI) and Human Development Index (HDI) as an energy indicator based on consistent time series data for the years “1990 to 2018” (The World Bank Group, 2020).
Figure 3 shows a significant growth of HDI in the period “1990 to 2005” accompanied by the growth in GNI. It reaches its higher value of 0.729 at the end of 2010, then it starts to stabilize in horizontal form with an insignificant decrease. AS shown in Figure 3, between 1990 and 2005, Jordan's HDI value increased from 0.616 to 0.729, an increase of 18.3 percent between 2005 and 2018, Jordan's HDI value is slightly decreased from 0.729 to 0.723, a decrease of 0.82 percent (The World Bank Group, 2020). Comparing with Figure 1, more power consumption per capita means more development so higher HDI. Combining the results of Figure 1 with that of Figure 3 leads to a direct relationship between energy consumption per capita and HDI. During the period “1990 to 2018”, global curves of power consumption per capita and HDI curves were identical. The identical relationship is presented in Figure 4.
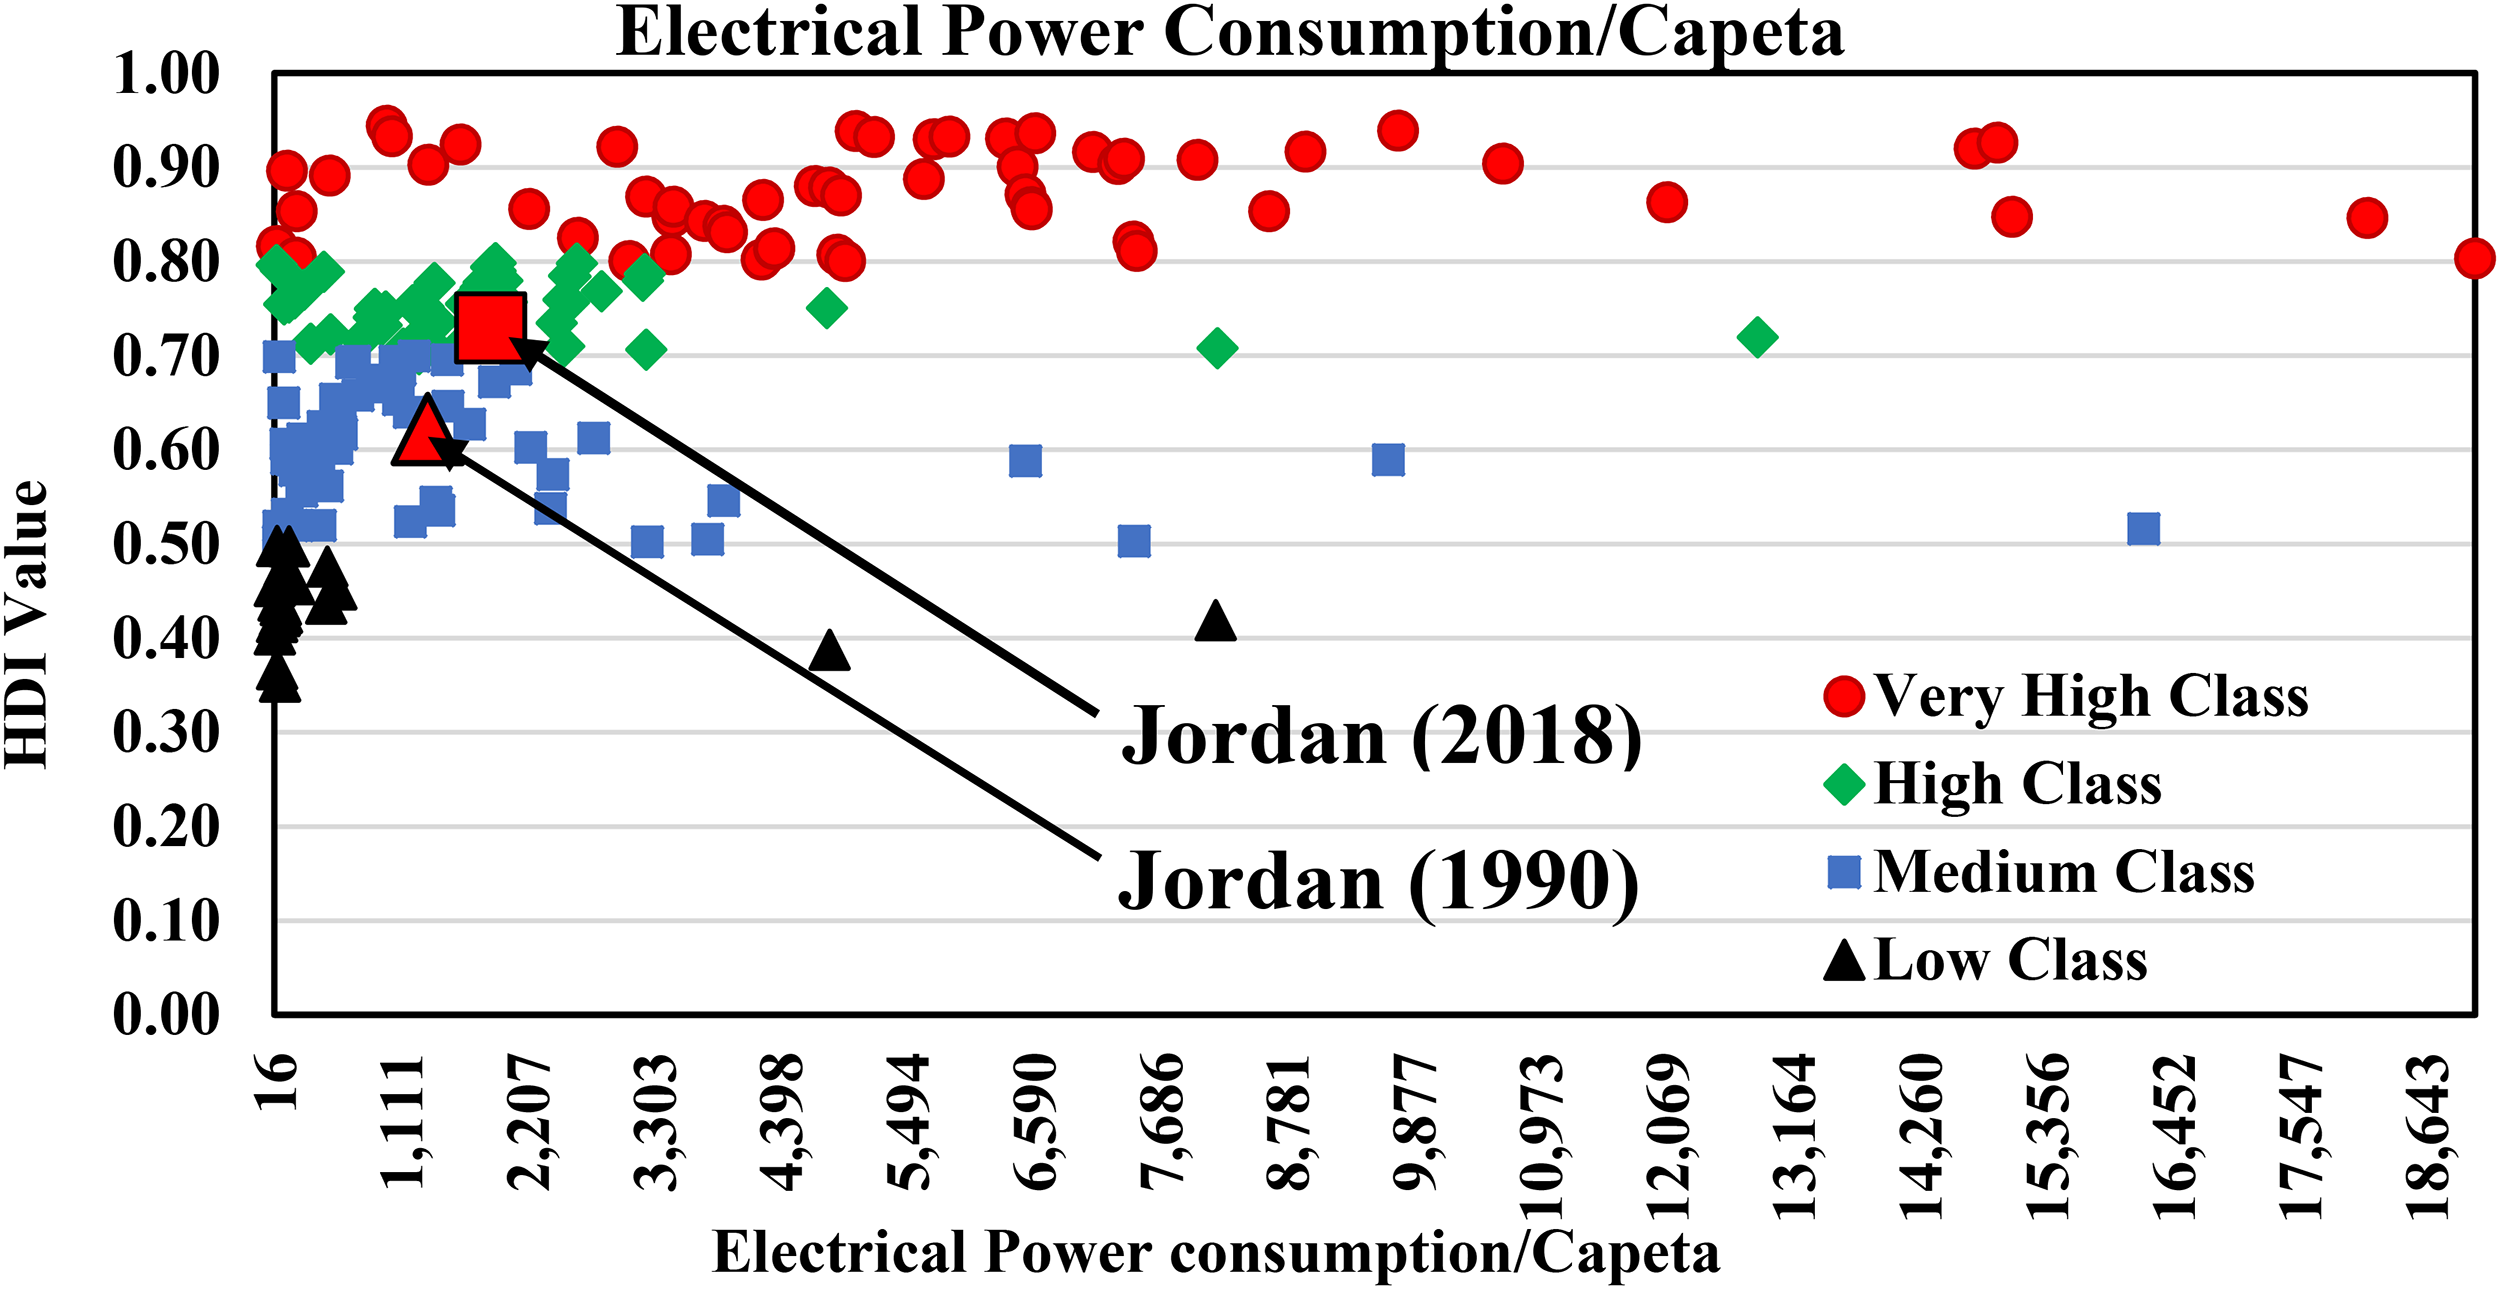
The relationship between the Human Development Index (HDI) and the electrical power consumption/capita around the world.
As Figure 4 shows, countries with high levels of electric energy consumption achieved higher levels of human development index. Figure 4 classifies the countries into 4 classes: Very High Class with HDI equals 0.8 or above, High Class with HDI between 0.7 and 0.8, Medium Class with HDI between 0.5 and 0.7, and Low Class with HDI below 0.5. Figure 4 shows Jordan was progressed by the years from Medium Class with 1322 kWh/capita and 0.622 HDI in 1990 to High Class with 1865kWh/capita and 0.723 HDI in 2018. From 1990 and 2018, Jordanian's GNI increase from 5880$/capita to 8268$/capita, an increase of 40.6 percent, and life expectancy increased from 69.9 years to 74.4 years, an increase of 6.44 percent (The World Bank Group, 2020). Figure 4 shows the identical relationship between the power consumption per capita and the HDI. Results show energy power consumption has a direct effect on the environmental and health dimensions as well as HDI. It also shows that similar quality of life can be achieved despite different energy consumption levels because the HDI is the geometric mean of three-dimensional indices; education, health, and income as defined by equation (1) (The World Bank Group, 2020). More use of renewable energy in SWHs means more saving and more progress in human quality of life and high HDI. More creation of renewable energy methodologies means more developments in our income, education, and quality of life and less dependence on conventional power, and more reduction in CO2 emissions, which results in higher HDI.
Figure 5 shows the average annual global horizontal solar radiation in Amman year round, based on a statistical inquiry of weather reports from January 1, 1980 to December 31, 2016 with ranges between 3.2–8.6 kWh/m2 (Jordan, Human Development Report, 2019). There are two types of SWH mainly used in Jordan, Flat-plate thermal solar collector and Evacuated-Tube Collectors. The second's is widespread in Jordan due to their comparatively high-efficiency absorption of solar radiation despite weather fluctuations of wind speeds and temperatures.
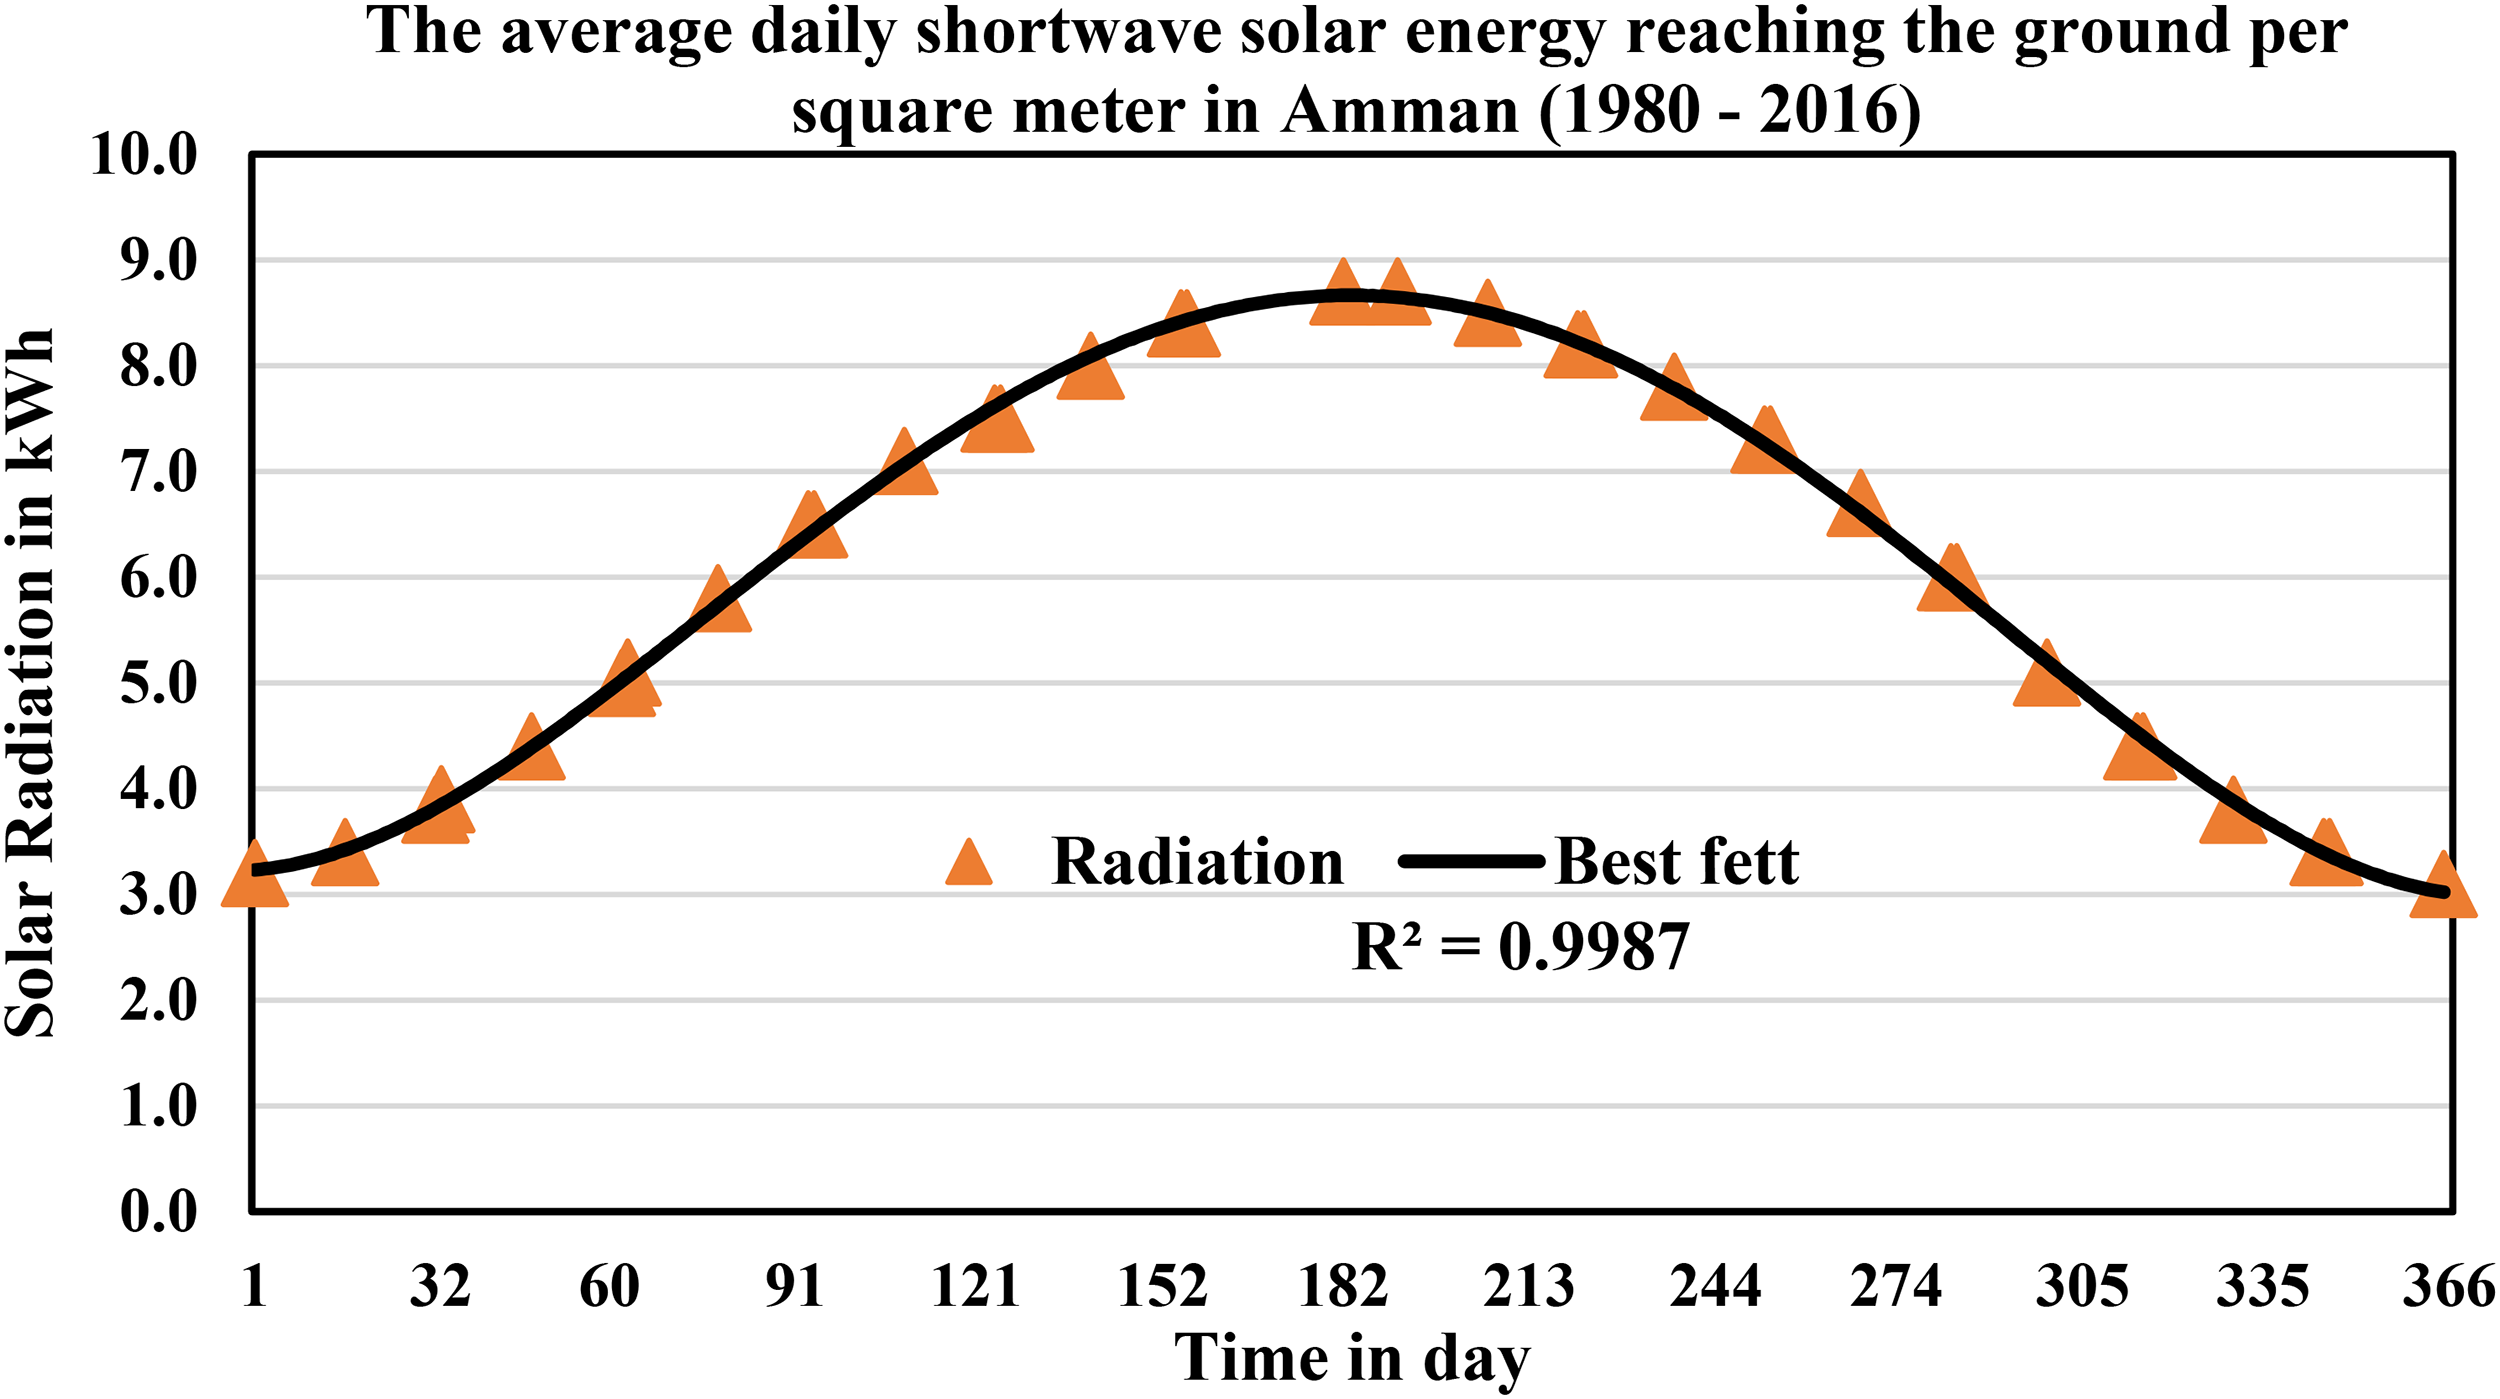
Average annually global horizontal solar radiation in Amman (Jordan, Human Development Report, 2019).
The study area is in the southeast of Amman within a 25 km radius around the University of Al-Zaytoonah. It is placed at an elevation point of 790 meters above sea level. It is located at 31° 42′ 57″ North latitude and 35° 47′ 38″ East longitude. According to the weather of Jordan, the outside design temperature in winter is low and the water can’t be used without heating.
The main purposes of the statistical survey were to study and evaluate the explanations of what makes Jordan lacking in installing solar water heaters, the types of buildings as well as the threatening of its future. Table 2 below summarizes the data collected by 16 references which include the number of flats and the number of solar water heating systems in these flats for various flat areas. Table 2 shows that the percentage of households that installed SWHs is 33 percent, regardless of the class, income, and housing differences between the members of the target sample.
Descriptive statistics obtained for the SWH from the targeted households in the sample areas.
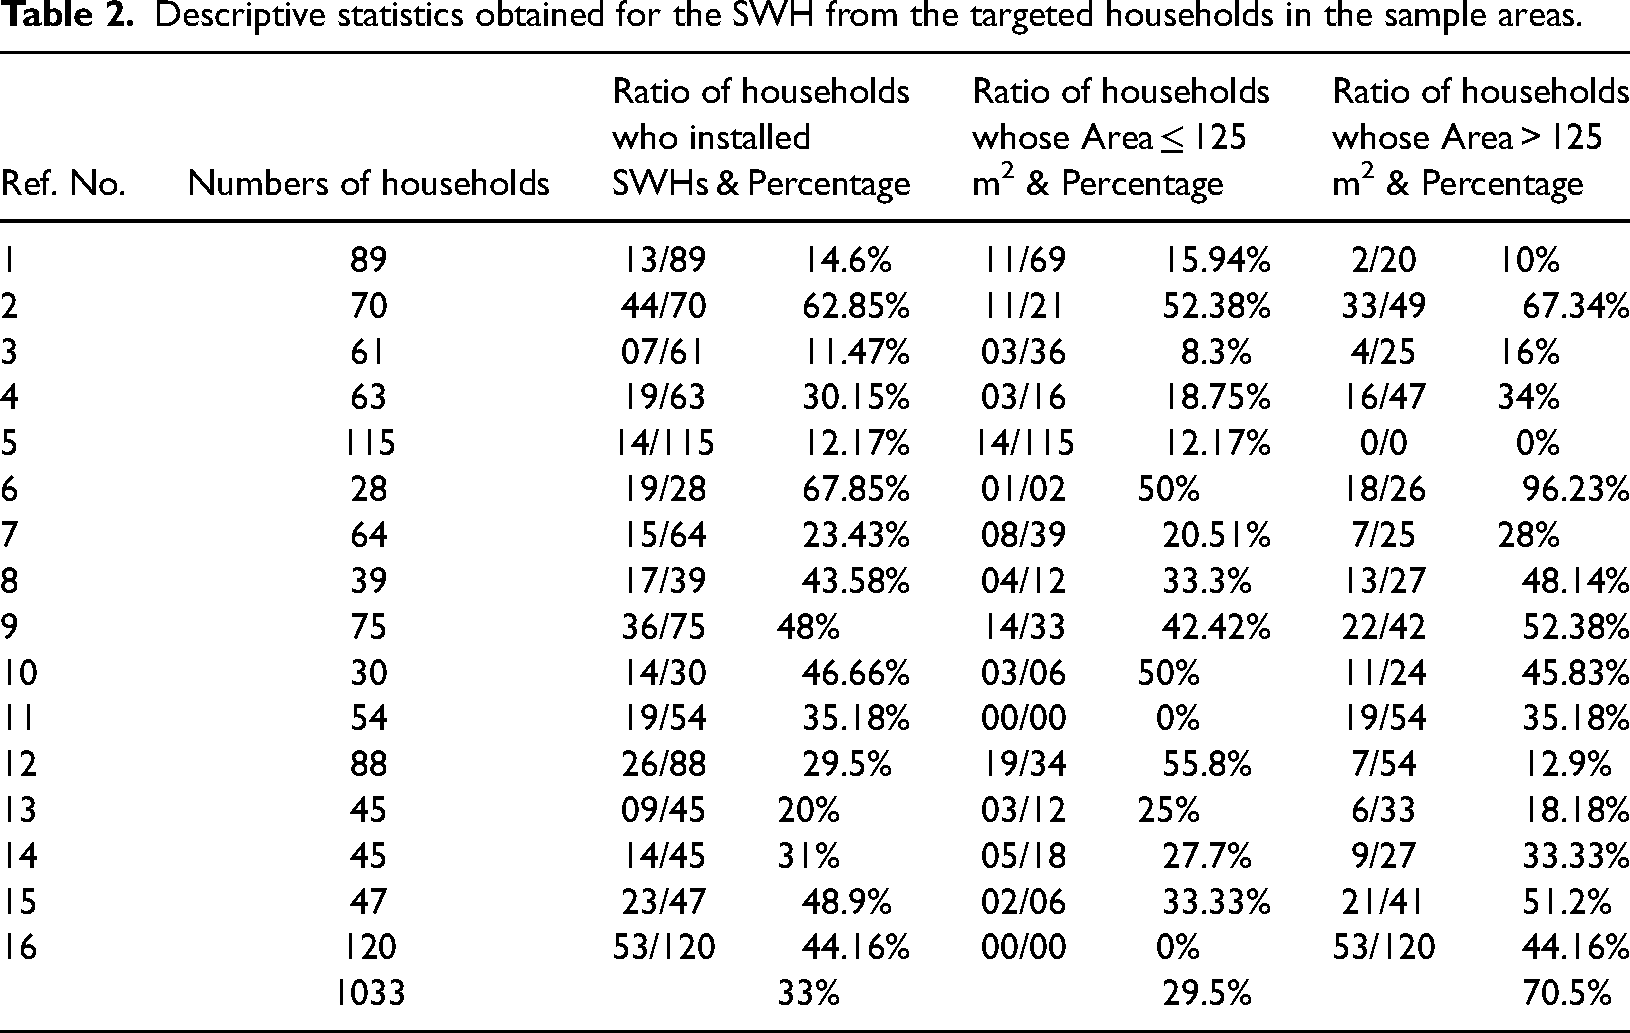
From Table 2, it is known that most families using solar water heaters were of large apartments “A > 125 m2 “, which has been designed for six or more members living at the same house. Although the number of large apartments to small apartments is comparatively small, it has 70.5% of the total numbers of SWHs installed. This percentage value is much greater than that of “A < 125 m2 “ Despite the smaller flats were more in numbers the study showed the percentage of residents who used SWH is less. This is due to two reasons: Firstly the large flats have large numbers of members that economic capability of the larger flats to afford installing solar water heaters more than the owners of the smaller households. This is due to three reasons: Firstly, large apartments contain more individuals, which makes installing SWHs in their households more feasible. Secondly, the purchasing power of large apartment owners is higher than that of small apartment owners. Thirdly, the government supports large apartments > 125 m2 by ordering energy-related legislation as mandatory law approved by the government in 2013.
As suggested by (Average Weather in Amman, Jordan, Year Round – Weather), the daily required of hot water can be classified according to the need of persons as the following: The daily consumption of each of the first two members of the family is 50 to 75 L/day and 30 to 50 L/day for each additional person
The energy required to heat the amount of water in equation (2) is:
The data of equations 2 and 3 based on the solar radiation given in Figure 5.
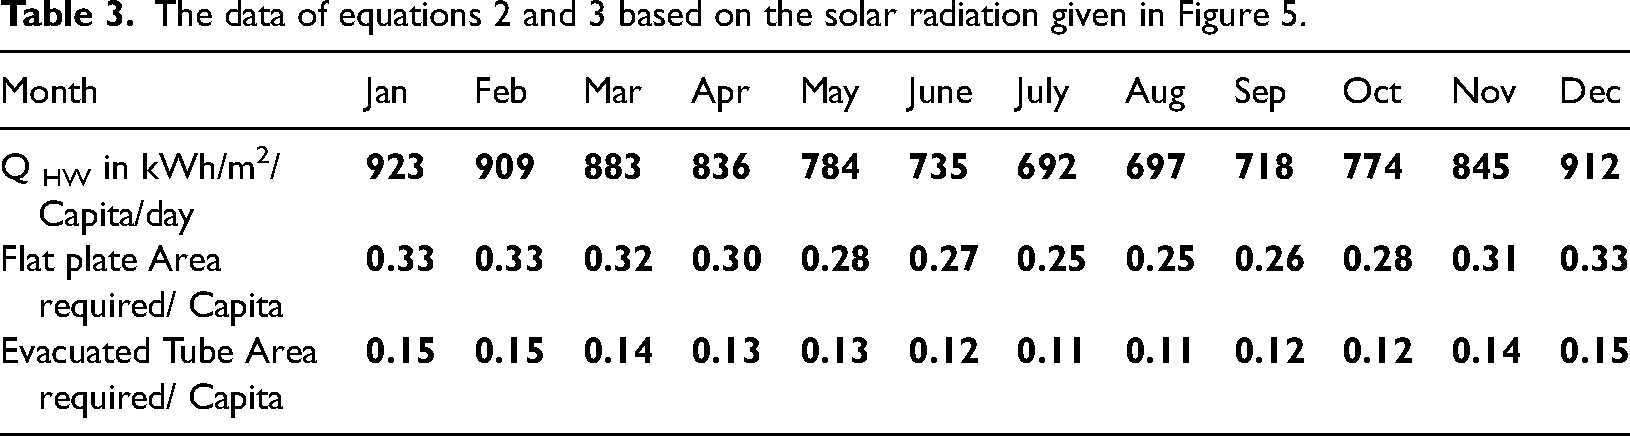
The yearly required energy to heat the water will depend on the solar collector efficiency and solar radiation intensity,
To calculate the average area of solar panels per capita, the following equation is used: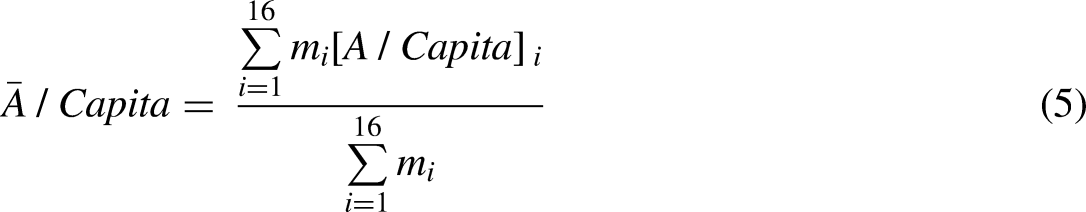
Descriptive statistics obtained for the households in the illustrated areas.
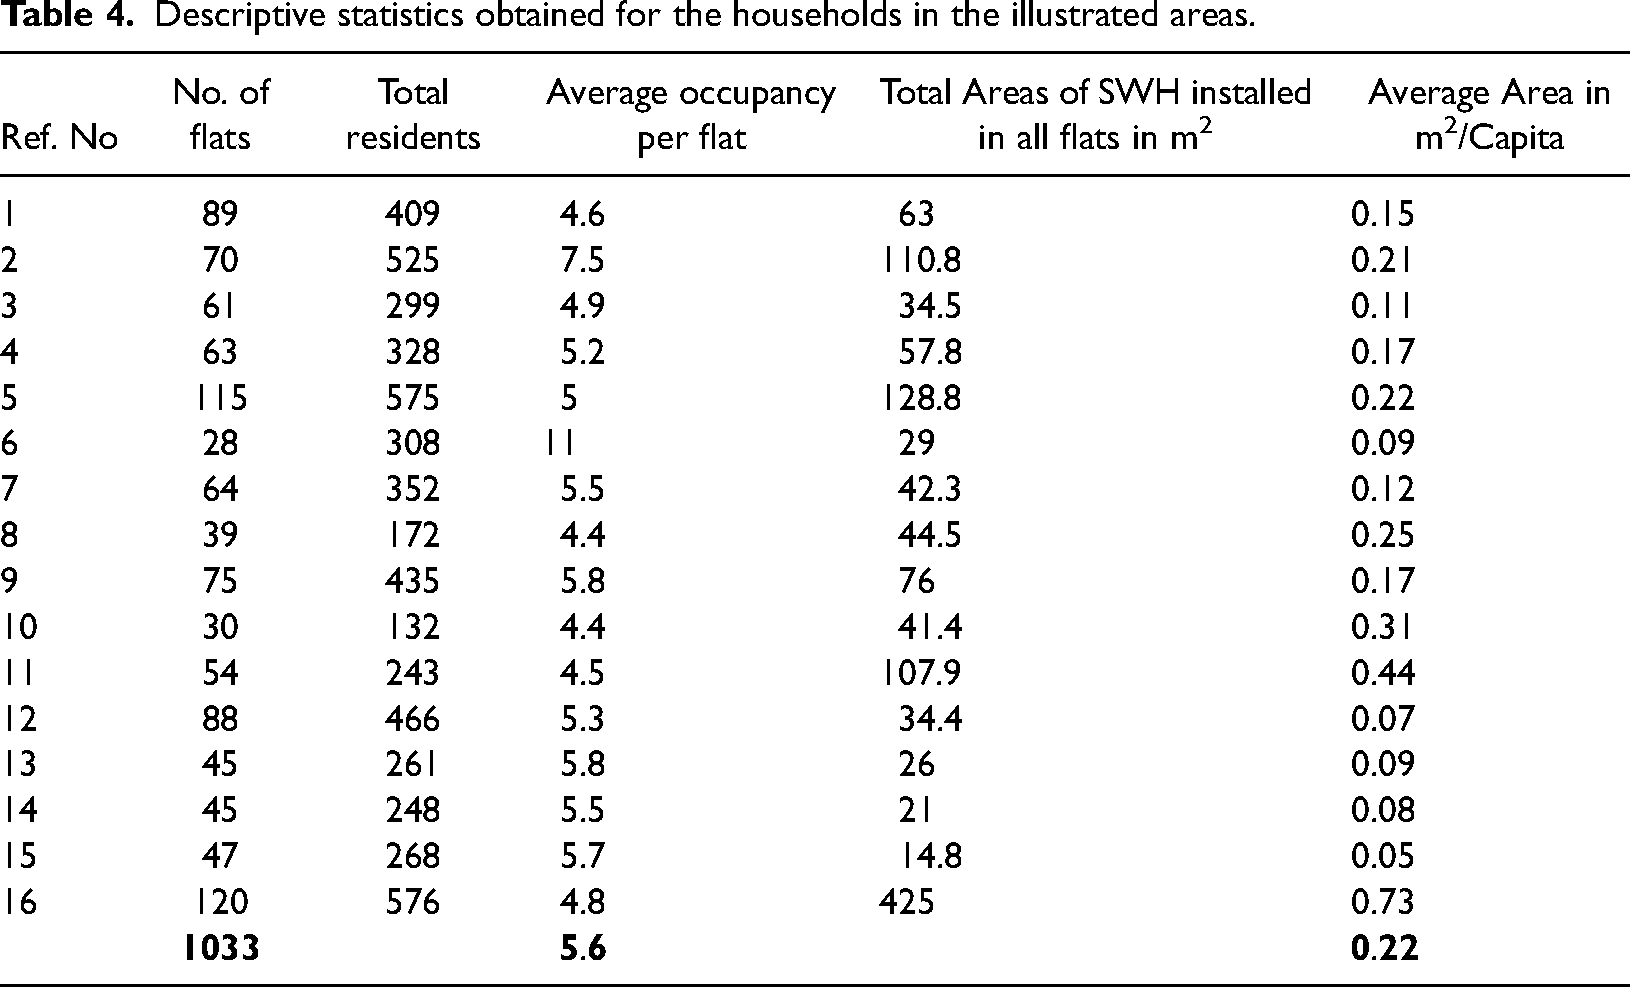
By comparing this result with the value obtained from the statistical analysis listed in Table 4, with an average of 0.22 m2/Capita, it is clear how the two values are identical. There is a clear difference between the average values of the required design Area/Capita depending on the location of the suggested area, type of solar heater collector and time, which is clearly shown in Figure 6. In crowded multistory buildings, where the permitted areas are limited, evacuated tube solar collectors are recommended.
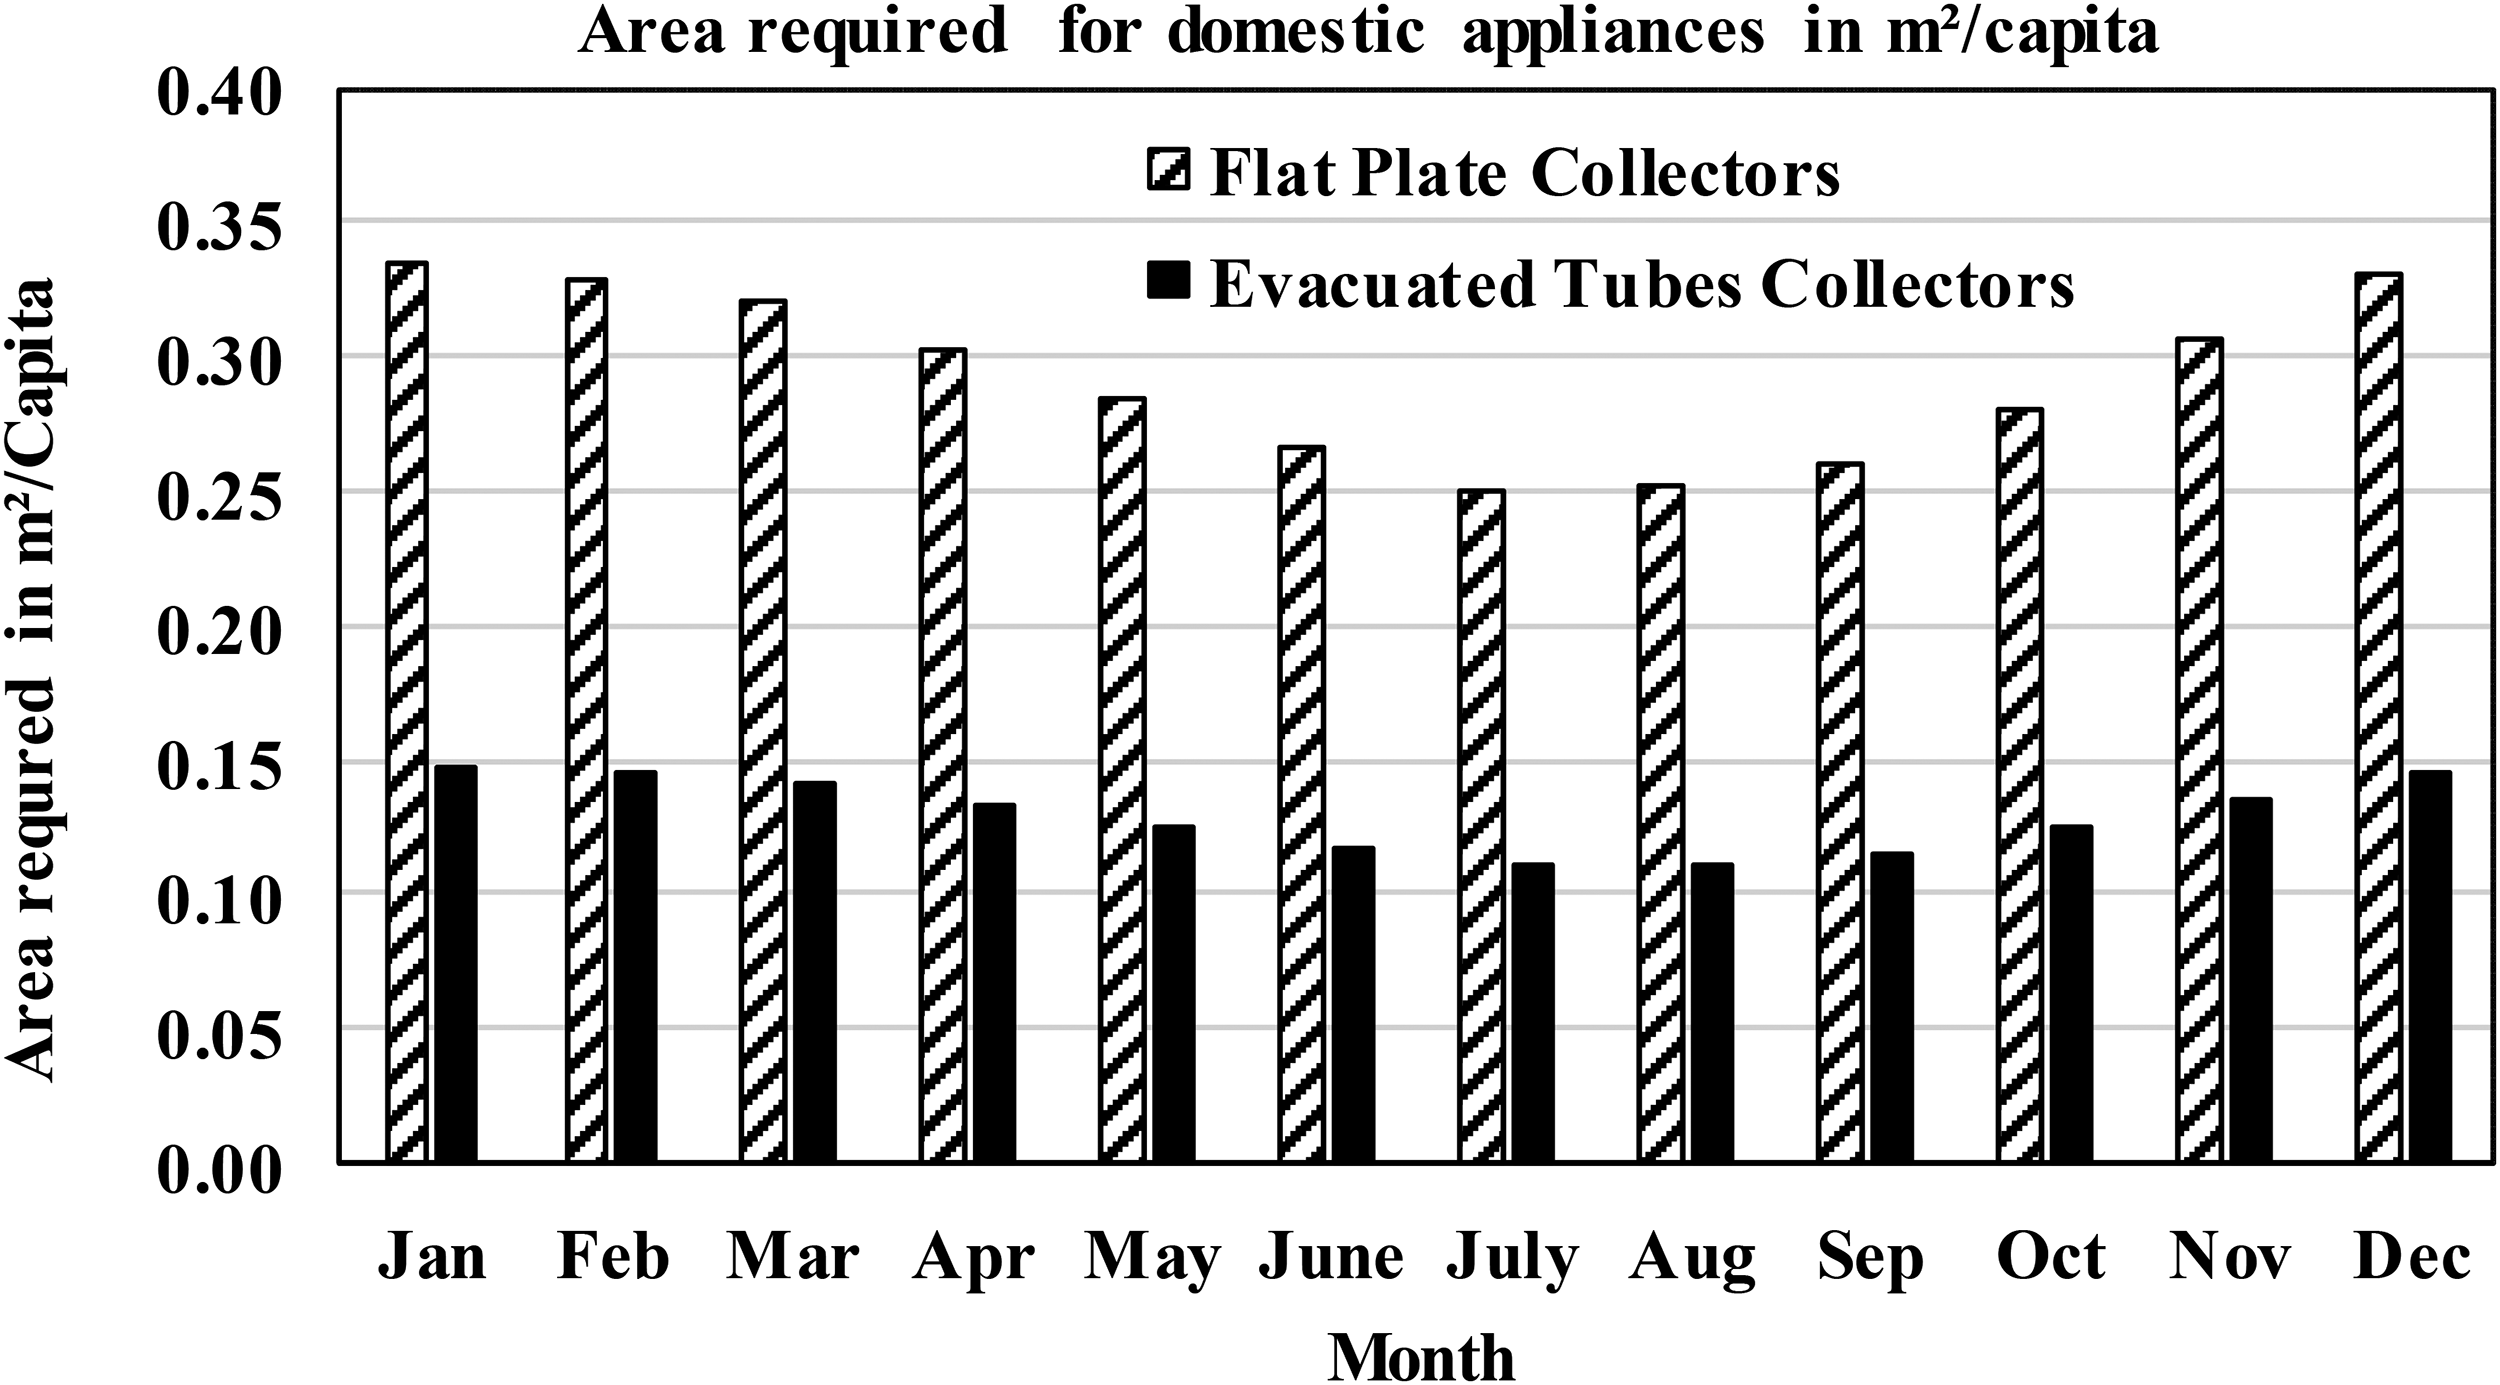
Area required for both types of solar water heater with time variation.
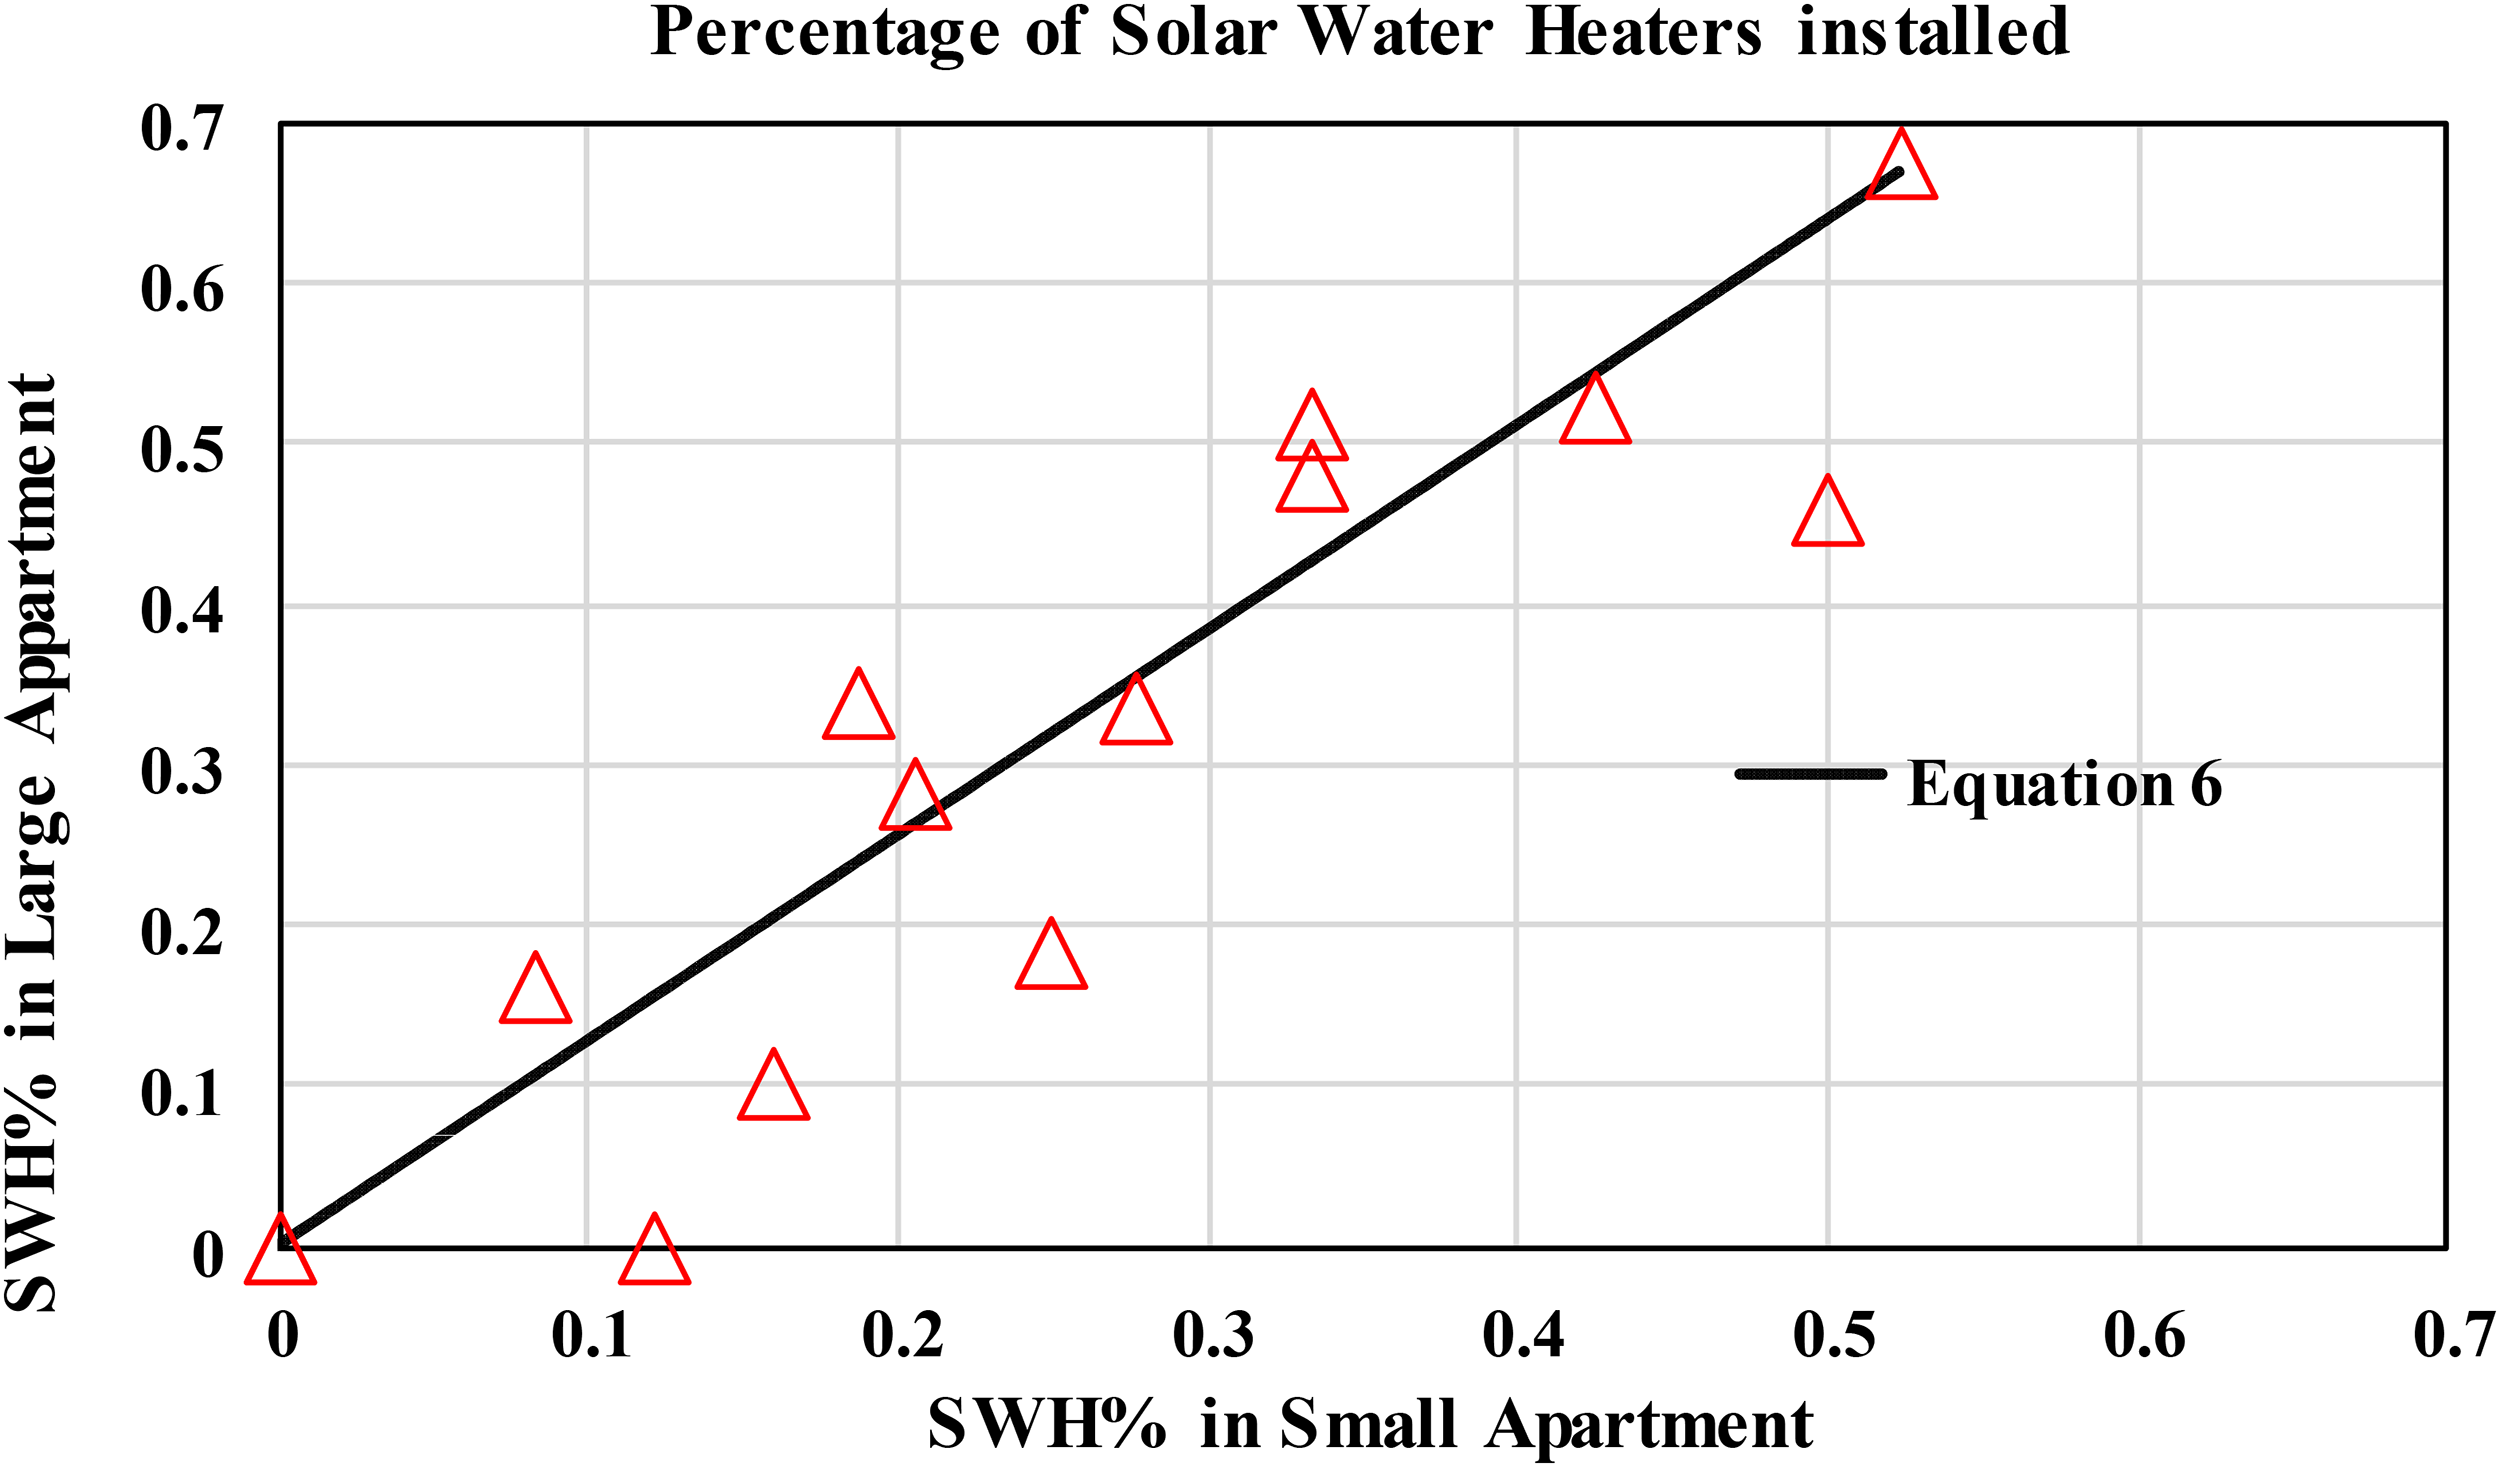
In this survey, apartments were classified into two categories: apartments with an area of less than 125 m2 and apartments with an area of greater than 125 m2. For apartments with an area of fewer than 125 m2, according to the Jordanian code, it is designed for a family of fless than six members. Based on equation 3, the average daily domestic hot water used with this category is 285 Liter. For apartments with an area greater than 125 m2, according to the Jordanian code, it is designed for a family of greater than or equal 8 members. Based on equation 3, the average daily domestic hot water used with this category is 365 liter. The relationship between these categories is predicted as:
The average annually global horizontal solar radiation in Amman year-round.
Sixty-four percent (63.48%≈ 2/3) of Jordan's population were living in the “Greater Amman Corridor”. This corridor includes Amman. Zarqa, Al-Balqa and Madaba. Its subtotal population is 6.045 Million related to 9.523 Million of the total population of Jordan in 2016, 82.6% of them are in the urban areas (Bamisile et al., 2017). As the remaining is (36.52% ≈ 1/3), the estimated average of SWH installation percentage predicted for the whole country is (0.6348 × 0.22 + 0.3652 (0.22 × 1/3) = 0.166 m2/Capita). Compare to Cyprus where SWHs taking up an average area of 1.0 m2/Capita (The Evolution of the Solar Water Heaters Market in Lebanon 2012 2017 and beyond, 2019), the estimated value is too low. The same estimation can apply to % of SWH = (0.6348 (33%) + 0.3652 (33 × 1/3) = 24.96%). This indicated that 24.96% of the Jordanian families are installing SWHs. Compare this value with China (70%), the USA, and Turkey, the estimated value is too low (Elaboration of data by United Nations). Estimations show that 75.04% of Jordanians are not installing SWHs in their households, which is in good agreement with the conclusions of (Meegoda et al., 2019).
Conclusions
The main objective of the present work was to estimate the use of SWHs in Jordanian households and their impact on the Human Development Index (HDI). The survey was conducted by 16 students. The available studies related to this investigation in the world and neighboring countries are considered for comparison. The number of households covered by the survey was 1033, and the total number of residents participating was 5597. The data collected was analyzed to estimate the total energy consumption and total area of the solar collectors per capita. The following are the main concluding comments obtained:
Despite the excellent natural conditions of solar radiation in Jordan, the Jordan's demand for domestic hot water using solar energy is still lacking. Despite smaller households were more in Jordan their percentage rate in using solar water heaters is less. The rise in the electricity prices in Jordan has made the demand for Photovoltaic cell installation has a high priority compared with the solar water heaters installations. The results of this study show that the curves of per capita energy consumption and HDI for Jordan's development indicators are identical. Significant growth in the use of solar water heaters increases the per capita share of electrical energy, which pushup Jordan's classification from Medium Class with (0.622) to High Class (0.729) in the Human Development Index. More use of renewable energy in solar water heaters means less dependence on conventional power and more reduction in CO2 emissions, which means more developments in human quality of life and high HDI. Predictions of solar water heaters characteristics using analytical equations compared with the statistical data give significant agreement.
Footnotes
Declaration of conflicting interests
The author(s) declared no potential conflicts of interest with respect to the research, authorship, and/or publication of this article.
Funding
The author(s) received no financial support for the research, authorship, and/or publication of this article.