
Abstract
This paper focused on the endogenous and exogenous factors that affect China's sustainable energy system (SES). 19 Endogenous factors, from economic sustainability dimension, social sustainability dimension, environmental sustainability dimension and energy security dimension assessed China's SES by entropy method-analytic hierarchy process-criteria importance through intercriteria correlation method (EM-AHP-CRITIC). We used urbanization, foreign direct investment and industrialization as exogenous variables and explored the extent of their long-term and short-term impacts on China's SES by autoregressive distributed lag-error correction (ARDL-ECM) model.
Keywords
Introduction
As the largest developing country, China is the world's largest energy producer and consumer and the world's largest carbon emitter. In 2018, CO2 emissions in China reached 10.313 billion tons (World bank, 2021). In addition, global warming and severe domestic air pollution are forcing the energy system in China to transform from current fossil fuel-based to clean energy-based (Bolwig et al., 2019), and finally, a sustainable energy system (SES) (Li and Taeihagh, 2020). The SES is critical to the success of China's long-term sustainable development goals.
As more attention paid to energy security and climate change, SES has attracted global attention. Sustainable energy is one of the guiding principles of sustainable development strategy on human energy consumption (UN. Secretary General, 1987; Sáez-Martínez et al., 2016). The concept of sustainable energy was first formally proposed by Munasinghe (1994), who believed that sustainable energy development could finally be realised through implementing a series of energy management policies from either the supply side or demand side. After that, Santoyo-Castelazo and Azapagic (2014) expanded energy sustainability into a three-dimensional concept with environmental, economic and social aspects. The International Organization for Standardization (ISO) developed a sustainability initiative involving energy use, clean water, pollution, and other issues (Antunes et al., 2014). Energy sustainability has become a guiding concept, including economy, environment, technology, security, and other aspects (Munasinghe, 1994; Santoyo-Castelazo and Azapagic, 2014; Sáez-Martínez et al., 2016). In general, research on SES has experienced three evolutions in different periods: from the year 1974 to 1985, focusing on energy security and taking economic benefits into account; from the year 1986 to 1998, focusing on economic benefits and environmental performance, taking energy security into account; and after the year 1999, focusing on energy security, as well as social-economic benefits and environmental performance (Despeisse et al., 2012). A meaningful way to achieve the SES is the energy transition (Bolwig et al., 2019; Chen et al., 2019). In the past 20 years, scholars (Benasla et al., 2019; Bolwig et al., 2019; Gales et al., 2007; Hong et al., 2019) conducted energy transition-related research and formed a conceptual understanding of this topic (Chen et al., 2019). For example, Liu et al. (2021) and Li et al. (2021a, 2021b) predicted short-term renewable energy generation. Safari et al. (2019) qualitatively analyzed the role of natural gas in the decarbonization process of the energy system by taking Iran, Norway, the United Kingdom and India as examples. Nawab et al. (2019) quantified the energy-water nexus to manage ecological assets to a more sustainable solution from a consumption-based approach. However, environmental and social costs in the transition process are slowing the global energy transition process (Sareen and Haarstad, 2018). For example, Wei and Chen (2020) took Guangzhou city as an example and found that only technological advancement in the building and transportation infrastructure exceeds the pace of the average urban economy, could the energy and carbon footprints of new planned projects be reduced.
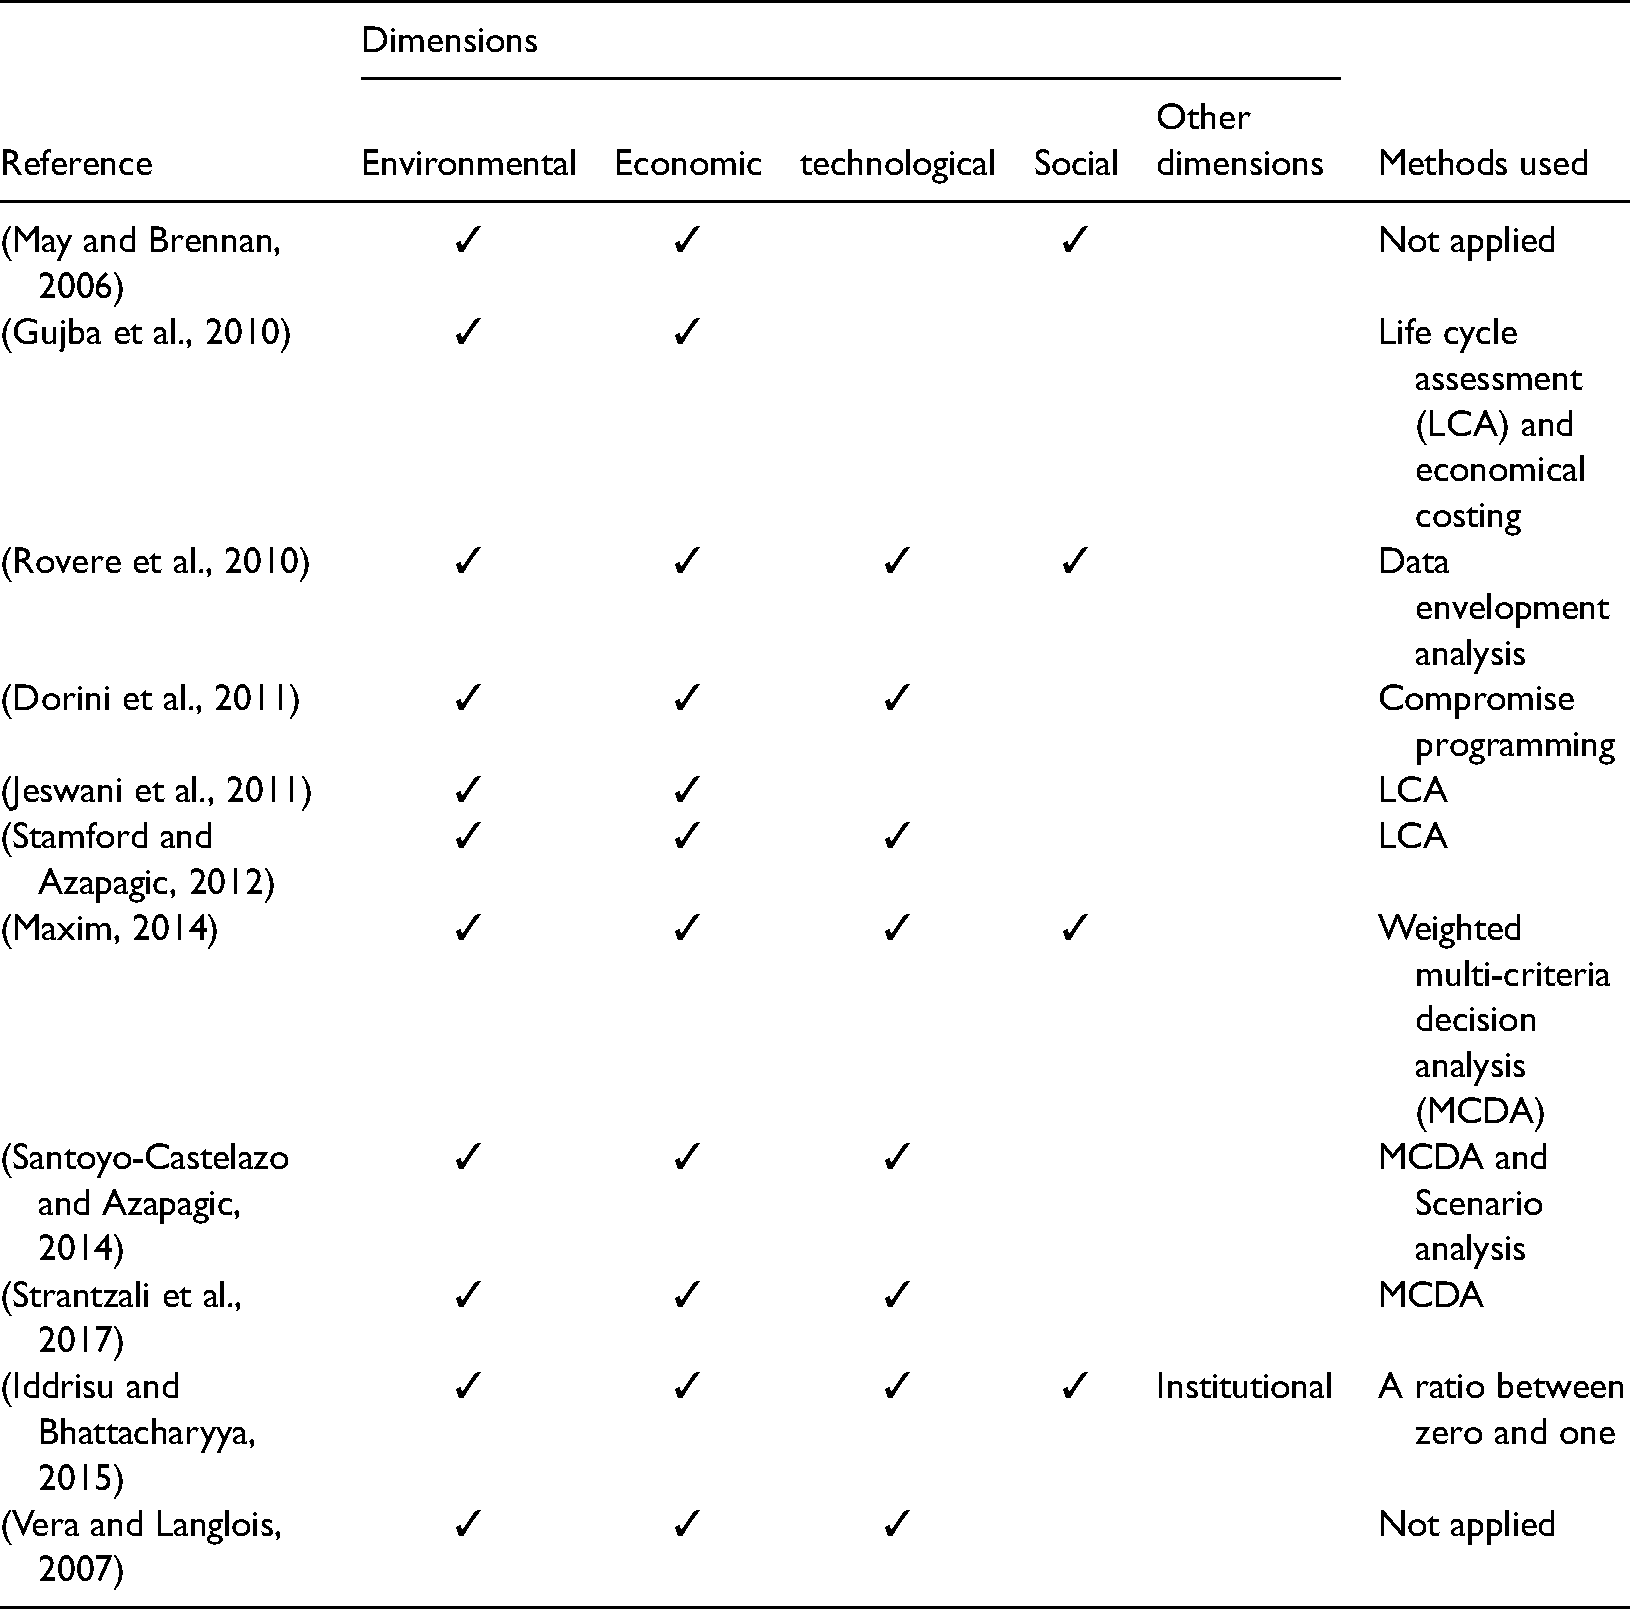
To the best of our knowledge, currently there are no standardized methods available for assessing the sustainability of energy system (Maxim, 2014), and researchers usually tailor their methods to specific goals (Angelis-Dimakis et al., 2012). We summarize the typical literature shown in Table 1. With the transformation of the power system as a research goal, existing researchers (Dorini et al., 2011; Gujba et al., 2010; Jeswani et al., 2011; Maxim, 2014; May and Brennan, 2006; Rovere et al., 2010; Santoyo-Castelazo and Azapagic, 2014; Stamford and Azapagic, 2012) conducted in-depth studies on the process of replacing traditional energy by renewable energy in specific countries or regions. These studies usually focused on the economic and environmental impacts of the transition (Gujba et al., 2010; Jeswani et al., 2011), and some studies also took social impacts (May and Brennan, 2006; Santoyo-Castelazo and Azapagic, 2014) and technological level (Dorini et al., 2011; Maxim, 2014; Rovere et al., 2010) into consideration. World Economic Forum (2020) built an energy transition matrix from the global perspective focusing on energy access and security, environmental sustainability, economic development and growth. Some scholars regarded SES as a target and evaluated the level of sustainable energy development from the environmental, technological, and economic dimensions (ESMAP, 2018; Fang et al., 2018; Iddrisu and Bhattacharyya, 2015).
Summary of representative literature on the sustainable energy system (SES).
Since energy sustainability evaluation usually needs to incorporate elements of environmental, social, economic and technological aspects, multi-standard decision (MSDA) (Maxim, 2014; Santoyo-Castelazo and Azapagic, 2014; Strantzali et al., 2017) analysis is widely used in SES evaluation, with the combination of other approaches such as grey relational analysis (Strantzali et al., 2017), entropy method (EM) (Fang et al., 2018), and analytic hierarchy process (AHP) method (Solangi et al., 2019).
Not seeking the specific energy transition process, we, in this paper from the status quo of China's sustainable energy development, focus on the endogenous and exogenous factors that affect the sustainability of China's energy system. Endogenous factors are applied to construct China's SES model and to evaluate the sustainability of China's energy system from economic, social, environmental, and national energy security dimensions. Furthermore, the autoregressive distributed lag-error correction (ARDL-ECM) model is used to analyze the impact of external factors. Exogenous factors are independent of those within the SES evaluation indicator system. They do not directly but indirectly influence SES through related endogenous factors. Existing studies focus on the nexus between carbon emissions and urbanization, foreign direct investment (FDI) and industrialization (Ding and Li, 2017; Franco et al., 2017; Li et al., 2021a, 2021b; Zhang and Zhou, 2016). Based on the existing research and data availability, we mainly select three variables, namely urbanization, FDI, and industrialization, as independent variables to investigate their impacts on SES in China.
The rest parts of this paper are arranged as follows. Section 2 introduces the current situation of China's SES. The method is described in Section 3, and in Section 4 the main results are given and discussed. Conclusions in Section 5 end the paper.
Investigation on the status quo of SES in China
Energy reserve status
According to BP (2020), primary energy is relatively rich in China, and the reserves of oil, natural gas, and coal are among the highest in the world. At the end of 2019, proved reserves of oil, natural gas, and coal in China ranked 14th, 6th, and 4th of the world total, respectively. As the population grows in China, energy exploration and mining technology improvement cannot meet the growing energy demand (Fang et al., 2018). From 1990 to 2005, the reserves-to-production (R/P) of oil in China dropped from 15 to 11, followed by a regrowing trend since 2006 and reached 18.7 in 2019. R/P of natural gas in China has shown a continuous downward trend since 1990 (65.3). In 2019 the ratio was 47.3, a decrease of 27.57% compared to 1990 but a slight increase due to shale gas production from 2015. Compared with oil and natural gas energy, China's coal resources are relatively prosperous. In 2019, the R/P of coal was 37, higher than oil and slightly lower than natural gas. However, compared to the world's R/P coal (132) ratio, coal in China is still meagre.
Energy supply
China has formed a relatively complete energy production and supply system, including coal, oil, natural gas, and renewable energy (hydropower, nuclear power, wind power, and solar power). According to the National Bureau of Statistics of China (NBS, 2021), the total primary energy production in China in 2019 was 3.97 × 10⁹ tons of standard coal (tsc), an increase of 5% compared to the previous year (Figure 1(a)). In 2019, and raw coal production was 2.73 × 10⁹ tsc, increased by 6% than 2018. Crude oil production was 2.74 × 10⁸ tsc with a 1.5% increase compared to 2018. The output of natural gas was 2.34 × 10⁸ tsc, which was 10% higher than in 2018. The interannual variation of different energy varieties was differentiated. For example, the total energy production experienced continuous growth until 2015 and then declined in 2016, then increased again in these recent years. In terms of different types, raw coal production declined in 2014, reached a lower value in 2016, and rebounded in the past three years. Crude oil production fell below 3 × 10⁸ tsc from 2016 but increased slightly in 2019. Natural gas exploration and development continued to increase, and therefore, its total production has continued to increase. Hydropower, nuclear power, wind power and solar power were growing continuously during the observation period.
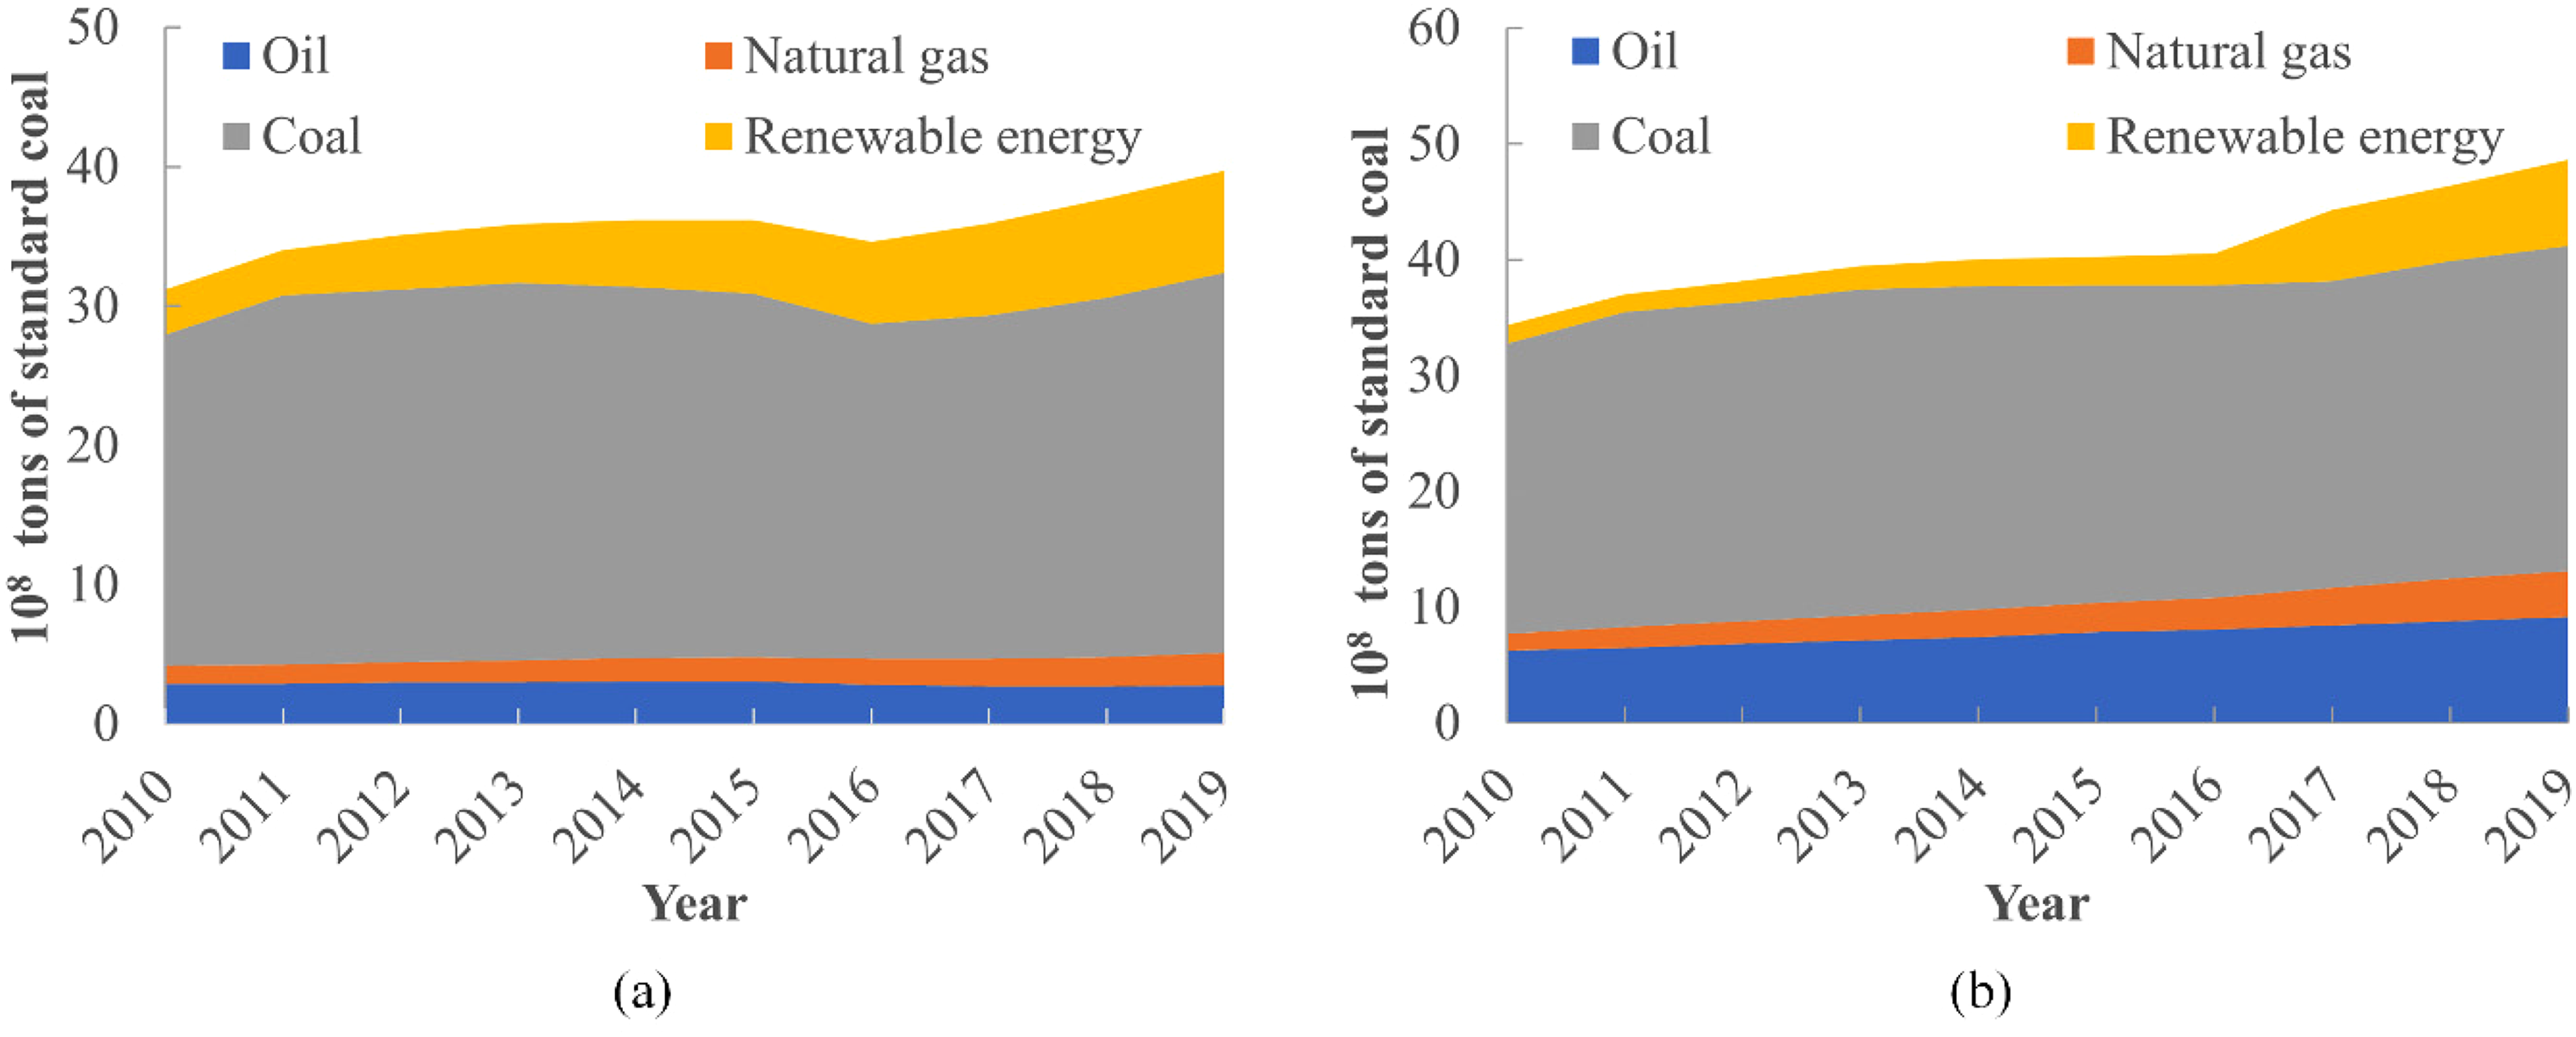
China's primary energy production and composition (a) and primary energy consumption and composition (b) from 2010 to 2019. Renewable energy includes hydropower, nuclear power, wind power and solar power.
Energy consumption
According to the NBS (2021) preliminary statistics, the total energy consumption was 4.86 × 10⁹ tsc in 2019, increasing 5% over the previous year. Among them, coal consumption accounted for 57.7% of total energy consumption, with a 2% increase compared to the previous year. Consumption of natural gas, hydropower, nuclear power, wind power, and solar power accounted for 23.4% of total energy consumption, increasing 10.9% compared to 2018. Since 2010, the total energy consumption has continued to rise, and in 2019 the total energy consumption increased by 41% compared with 2010. The proportion of coal consumption had a downward trend, with 72.7% in 2010 and falling to 57.7% in 2019. Nevertheless, it is still China's primary energy source in the short term (Figure 1(b)). Compared with other countries’ primary energy consumption structure globally, coal has a prominent position in China's primary energy consumption structure (BP, 2020). The proportion of clean energy consumption (natural gas plus renewable energy) in total energy consumption increased from 9% in 2010 to 23.4% in 2019. From the energy efficiency perspective, China's energy consumption per 10,000 yuan of GDP in 2019 dropped by 2.6% compared to the previous year.
Energy trade and external dependence
In 2019, China imported 5.06 × 10⁸ tons of crude oil and exported 8.1 × 10⁵ tons, increasing 113% and −73% respectively compared with 2010, resulting in a continued increase of net imports. China imported 6.8 × 10⁷ tons of natural gas (approximately 9.46 × 10¹⁰ cubic meters) in 2017, a year-on-year increase of 28.3% compared to 2010. At the same time, the export was 2.44 × 10⁶ tons (about 3.5 × 10⁹ cubic meters), down 1.7% year-on-year compared to 2010. So the dependence on natural gas continued to rise. China imported 2.9 × 10⁸ tons of coal in 2019 with an increase of 83%, while coal exports dropped significantly by 68% compared to 2010.
According to the current status of domestic primary energy production and consumption and future development trends, the increasing dependence on energy imports poses a threat to the sustainable development of China's energy system.
Energy prices
As shown in Figure 2, global crude oil price, natural gas price, and coal price illustrated momentum upward. Crude oil price rose from an average of 28.37 US dollars per barrel (US$/ barrel) in 2000 (the average price of Dubai, Brent, Nigerian Forcados and West Texas Intermediate) to 62.4 US$/ barrel in 2019, an average annual growth rate of 4%. The natural gas price represented by the OECD countries CIF price was increasing steadily, from 4.83 US dollars per million British thermal units (US$/MBtu) in 2000 to 10.82 US$/ MBtu in 2019, an increase of 124%. Global coal price rose from US$33.24 per ton (t) in 2000 to 88.49 US$/t in 2019. The rising energy prices is a full manifestation of the increasingly acute contradiction between energy supply and demand.
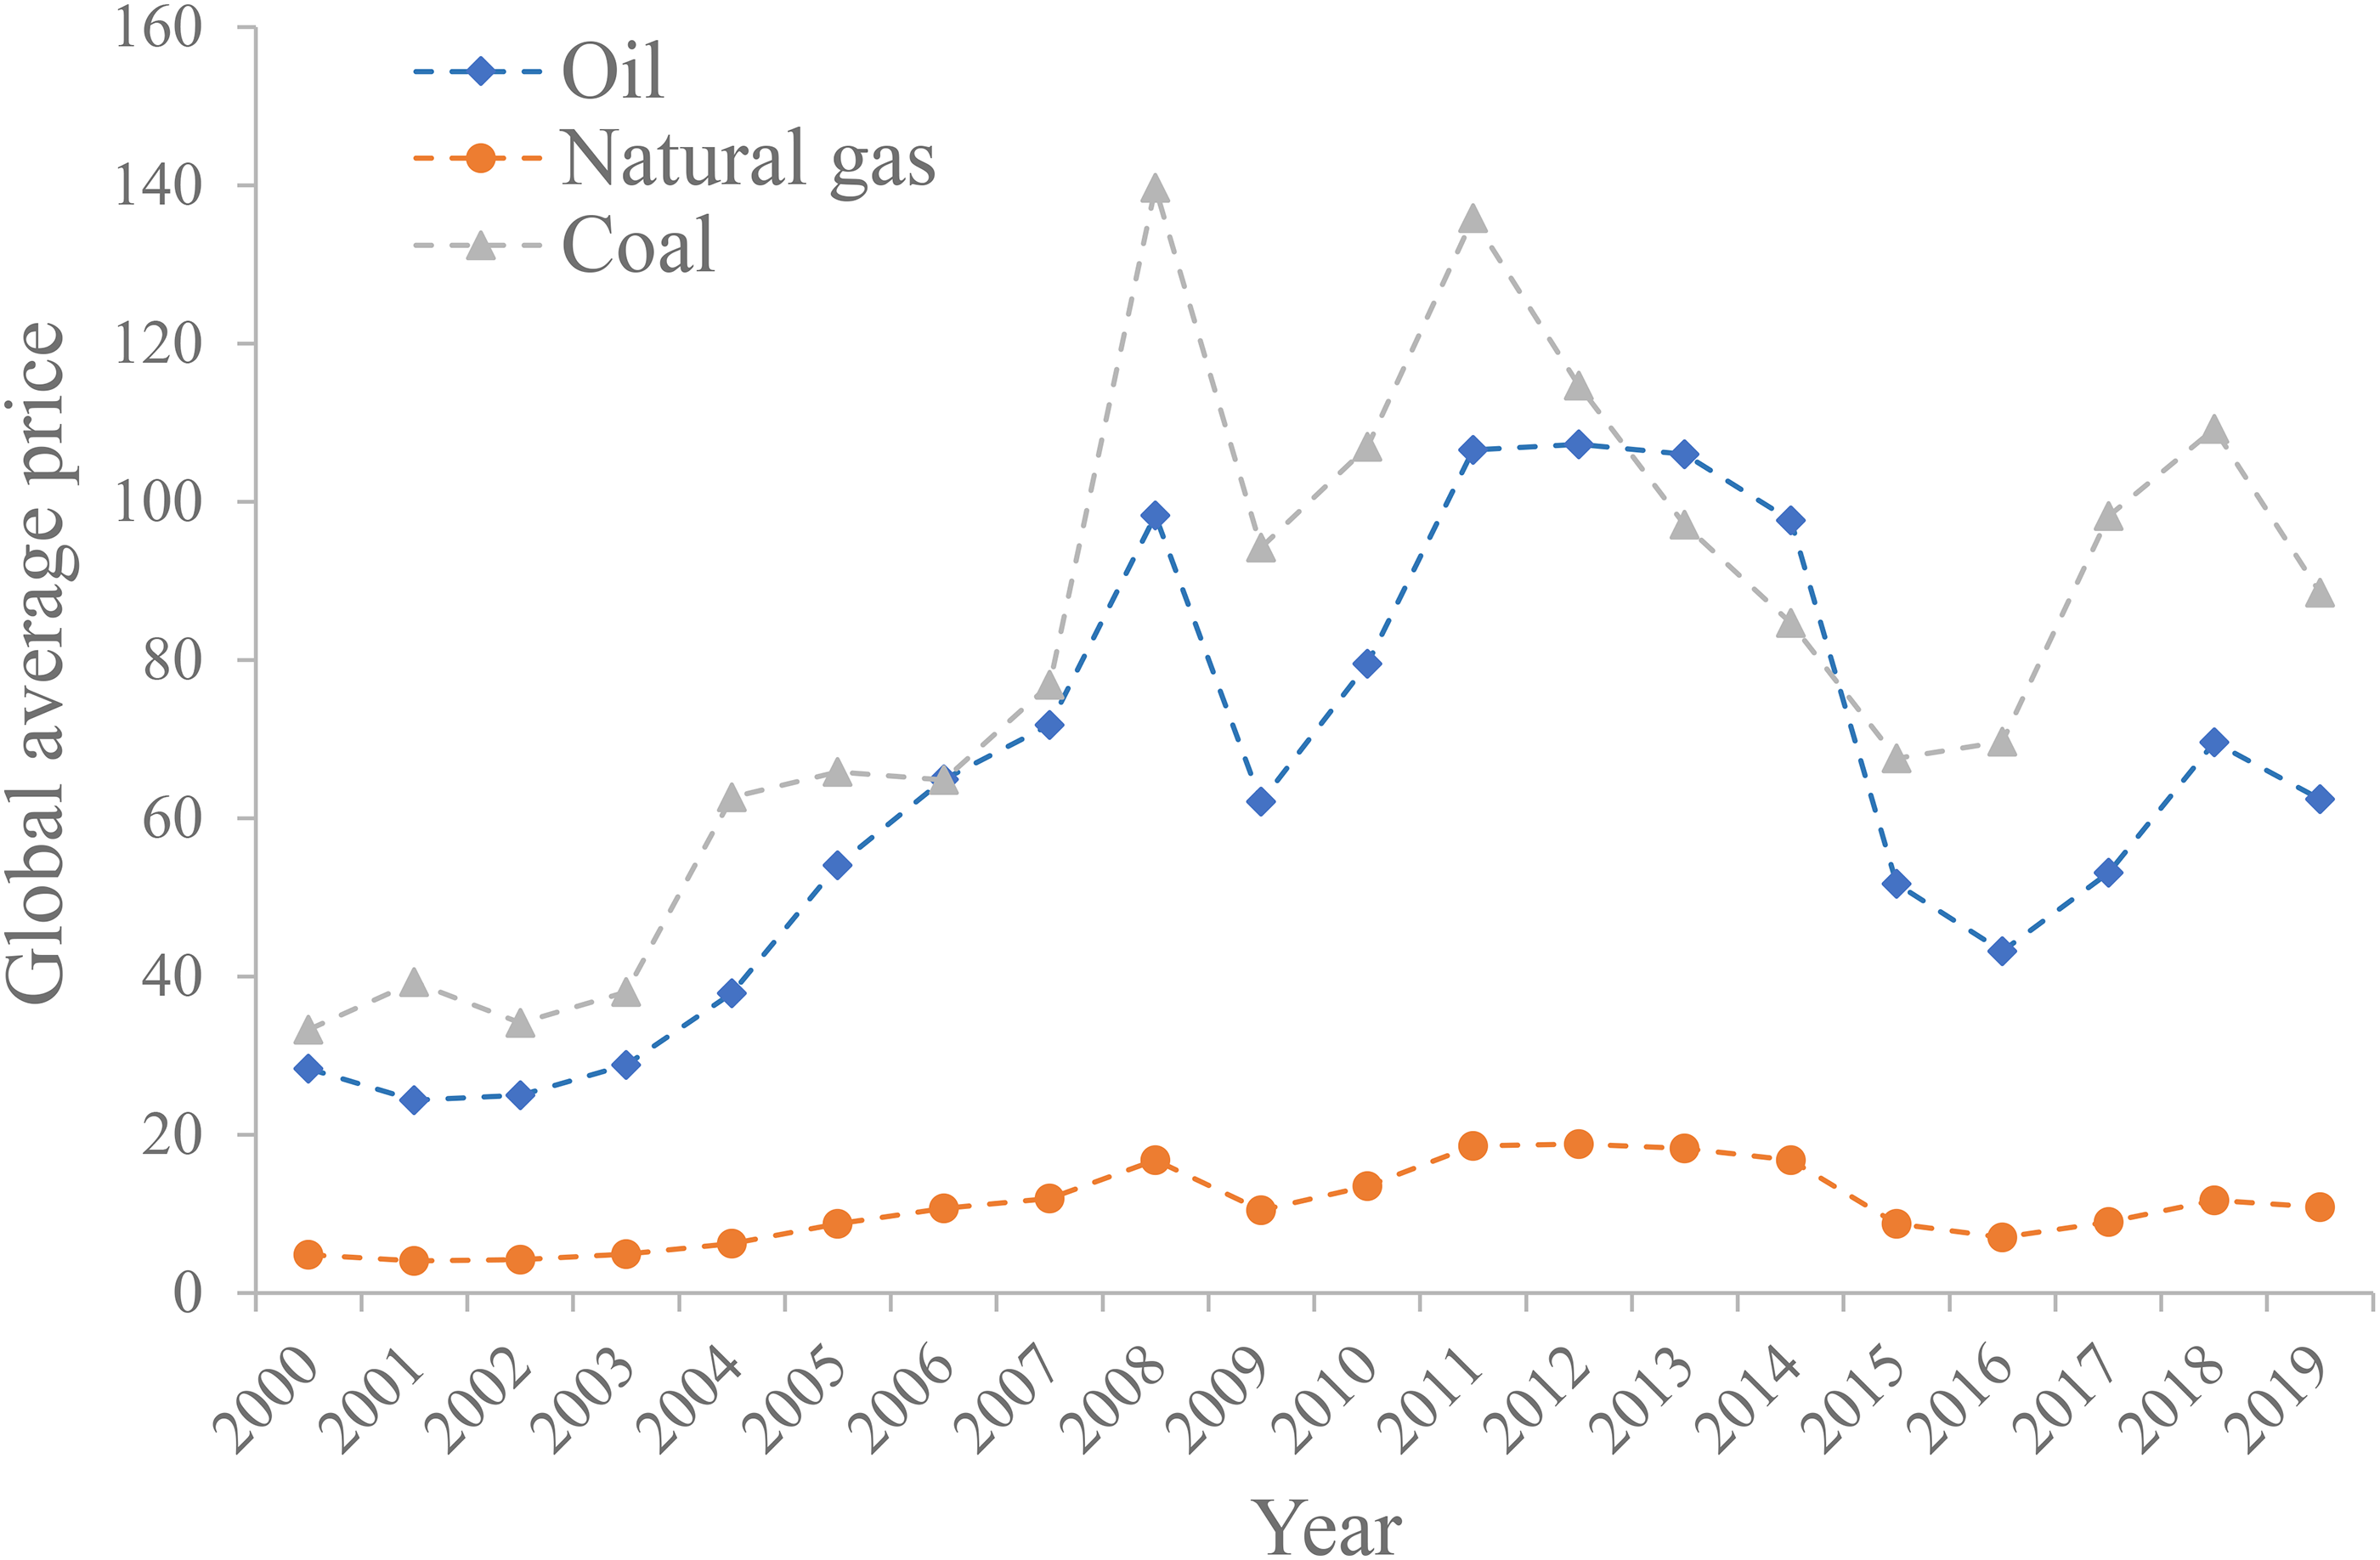
Global primary energy price. The unit for the spot price of oil in US dollars per barrel, natural gas in US dollars per million Btu, and coal in US dollars per ton. Global oil price is the average spot price of Dubai, Brent, Nigerian Forcados and West Texas Intermediate. Global natural gas price is the average price of the OECD. The global coal price is the average price of Northwestern Europe, the Appalachian spot coal price index in Central America, Japan steam spot CIF price, China Qinhuangdao spot price, and Japan coking coal import CIF and the Asian market price.
Environmental pressure
China's environmental protection pressure has gradually increased with the rapid growth of total energy consumption and the continuous increase of CO2 emission (Yu et al., 2018a; Zhou et al., 2020). In 2010, China's total energy consumption was 3.12 × 10⁹ tsc, and the total CO2 emissions were about 8.47 billion tons (World Bank, 2021). Researchers predicted that carbon emissions would be peaked around 2022 to 2028 (Yu et al., 2018a; Yu et al., 2018b), with 11.21–11.56 Gt CO2 (Yu et al., 2018a). Considering that 18 of the 20 most polluted cities globally are in China (Lozano Gracia and Soppelsa, 2019), premature deaths and diseases caused by air pollution threaten the realization of sustainable development.
Methodology
Constructing SES evaluation indexes
SES requires the overall consideration of economy, society, environment and energy security. Economic sustainability provides a solid foundation for the SES. Economic competitiveness improves sustainable energy use from “open source” and “cutting expenditure”. “Open source” requires to provide more capital and technology to ensure the sustainable development of energy from the perspective of enhancing supply capacity. “Cutting expenditure” requires improving energy efficiency and reducing energy intensity. Social sustainability manifests in the improvement of living standards and education levels. Environmental sustainability provides material and environmental support for the realization of an SES. It is an essential prerequisite for sustainable energy development. Energy security indicates the degree to which energy supply satisfies demand.
Combining with the status quo of sustainable energy development in China, we construct a comprehensive evaluation index system for China's sustainable energy system (see Table 2), composed of a target layer, a dimension layer, and an indicator layer. The target to achieve SES in China is specified in the dimension layer, which is decomposed to economic, social, environmental, and national energy security. Nineteen indicators are given in the indicator layer, and they reflect the implementation effects of different dimensions in terms of quantity and degree of change. The definition, quantification, coding, and direction of each indicator are shown in Table 2.
China's SES evaluation indexes and their weights by different methods.
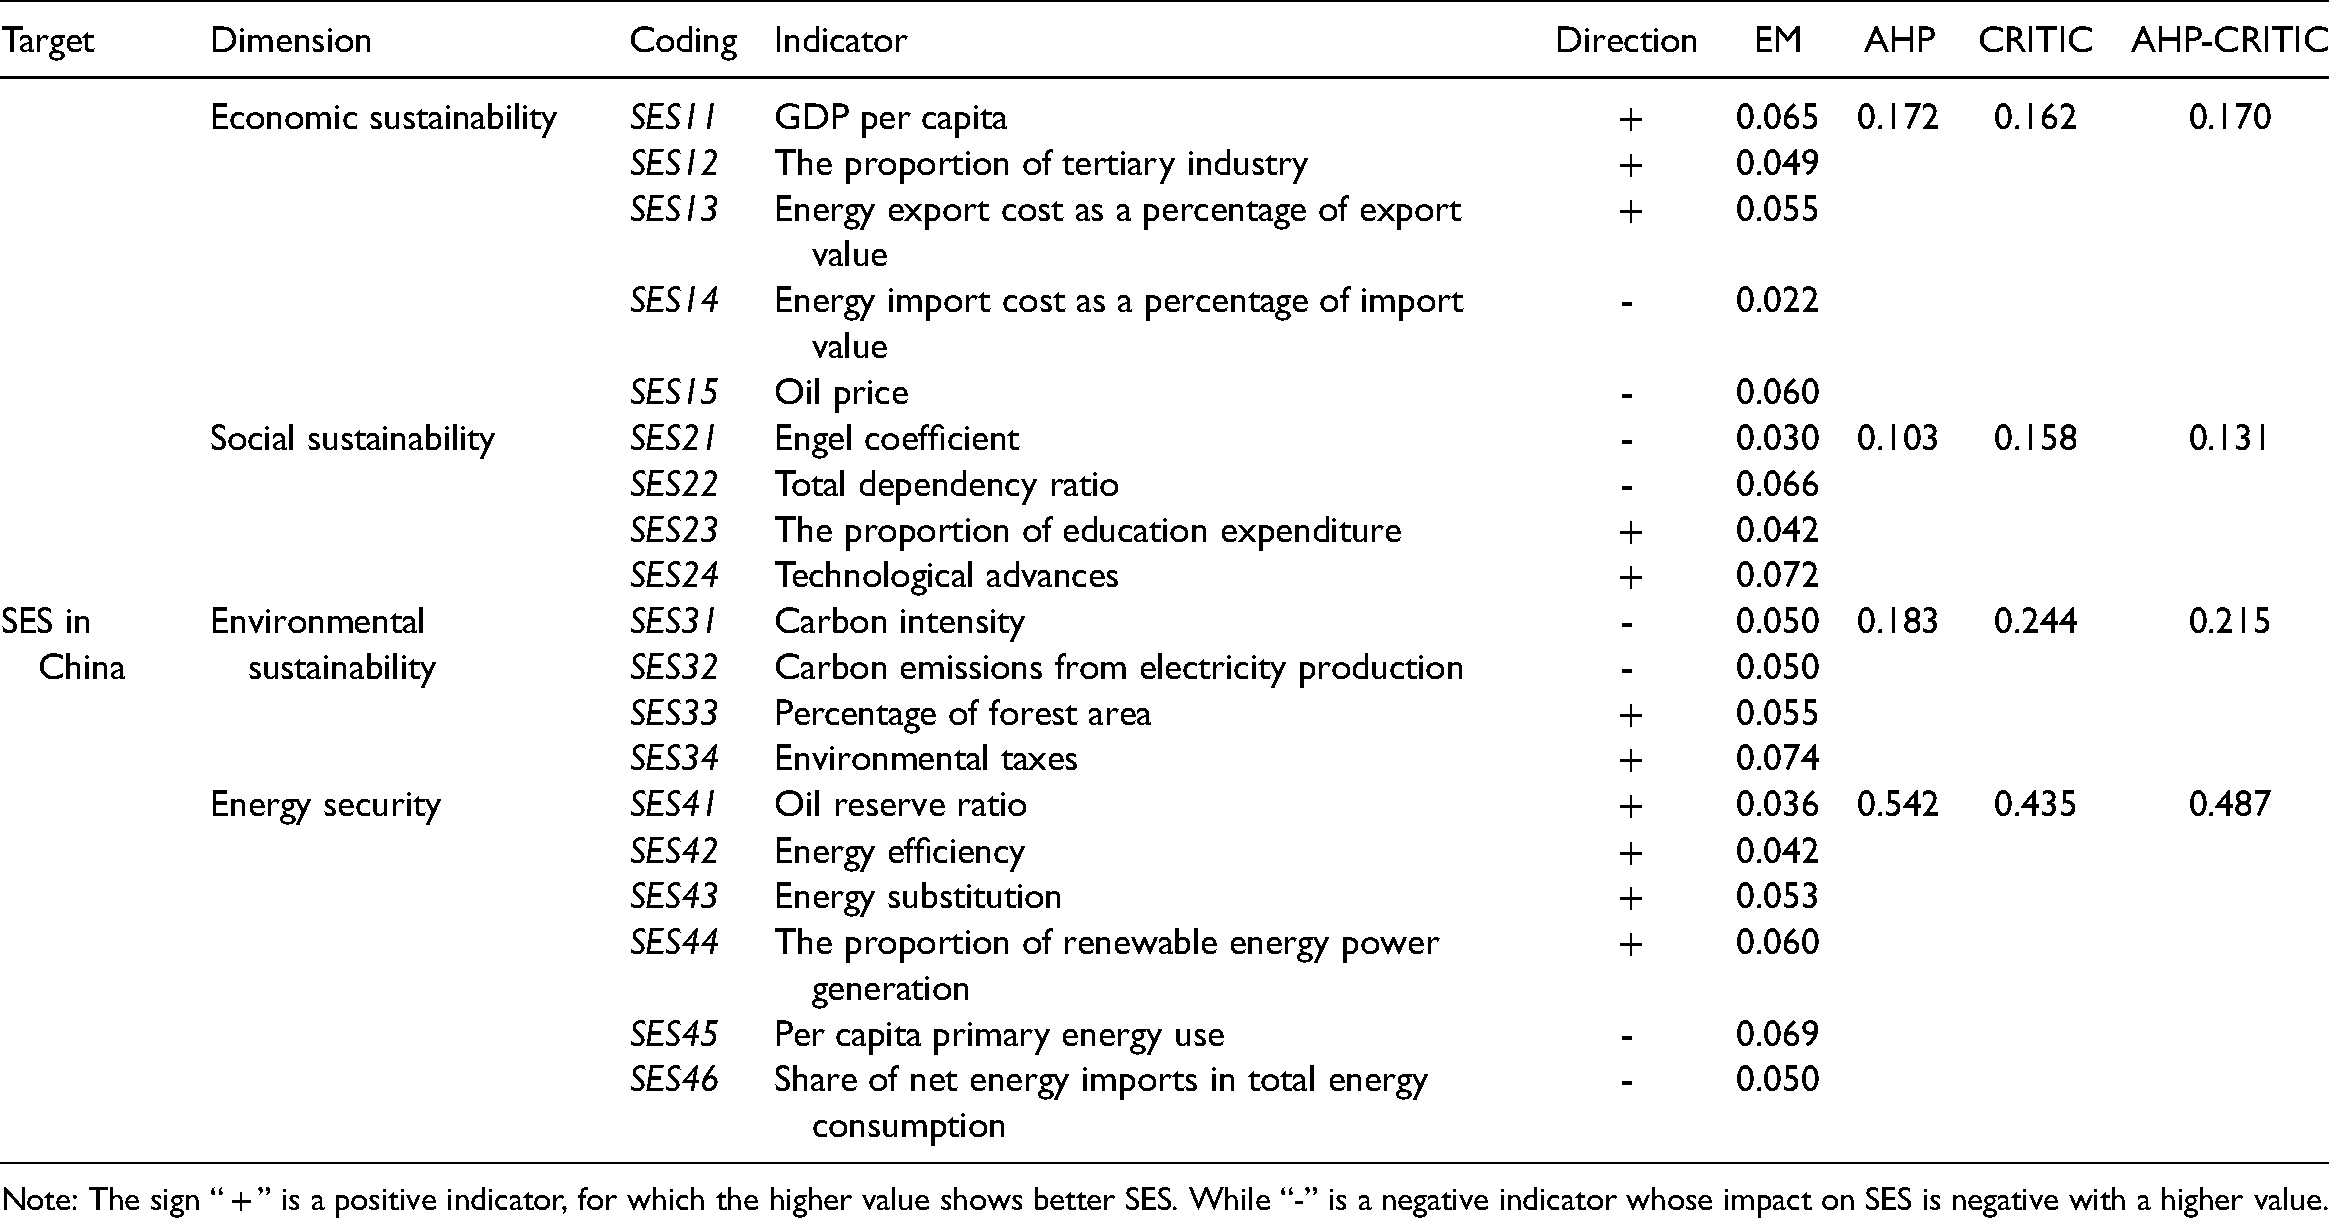
Note: The sign “ + ” is a positive indicator, for which the higher value shows better SES. While “-” is a negative indicator whose impact on SES is negative with a higher value.
Evaluating the sustainability of China's energy system
We adopt the idea of combining objective and subjective empowerment to determine the weights of indexes. The entropy method (EM) is used to determine the weights of the indicators at the indicator layer, and the subjective methods (Analytic Hierarchy Process (AHP)) and the objective method (CRITIC method) are used to obtain the weights at the dimension level. The principle of Lagrangian extremum is then applied to weight the optimal combination.
Determining the weight of each index in the indicator layer
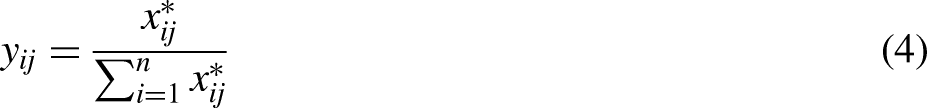
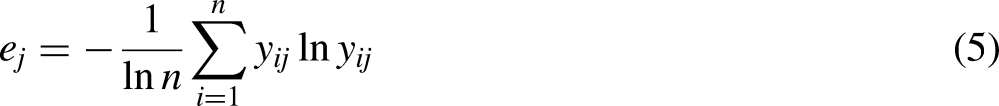
We use the EM to determine the weight of each index in the indicator layer. Due to different dimensions of the indicators, direct use of the original data produces misleading results. Therefore the original data is standardized according to Equation (1) and (2) for positive and negative indicators, respectively.


Calculating the weight of each dimensional layer element
We use a subjective method AHP and an objective method CRITIC, to obtain weights of dimension-level indicators. The results from these two methods are then combined from the below-mentioned process.
Firstly, from the normalized matrix (Y(yij))mn of the indicator layer, we construct the nth order non-negative positive definite matrix (Z(gij))mn.
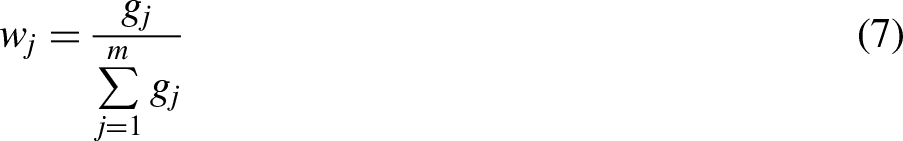
Secondly, reorganize the objective weight 

Analyzing the influence of exogenous factors on SES
The exogenous factors affecting the SES are independent of the SES evaluation indicators. Therefore, exogenous factors do not directly affect the availability of SES. We mainly focus on three variables: urbanization, foreign direct investment (FDI), and industrialization to study their external impact on the SES. The salient feature of urbanization is the shift of population from rural to urban areas, resulting in a decrease in the number of people employed in agriculture, while an increase in the number of employees in the secondary and tertiary industries. This continuously expands economic activities, so as energy consumption. On the other hand, urbanization changes people's lifestyles, which positively contributes to energy efficiency. Therefore, we propose two hypothesizes:
Since 2001, China has gradually integrated into the international industrial transfer system. By 2018, China ranked the second among countries (regions) in attracting foreign investment in the world, attracting US$138.1 billion in foreign investment, a year-on-year increase of 1.5% (MOC, 2019). The process of undertaking industrial transfer increases energy consumption, which may negatively impact social and environmental development (Iamsiraroj and Ulubaşoğlu, 2015; Reiter and Steensma, 2010), thereby affecting sustainable energy system. On the other hand, however, FDI positively affects technology upgrading and job creation (Asiedu, 2006; Hans Martin and Anguelov, 2018), which promote the SES. So FDI is considered to play an essential role in the sustainable development of developing countries (Aust et al., 2020), and we assume that:
China is at the peak of industrialization, with invested mountains of energy (Liu and Bae, 2018). Although the proportion of high-energy-consuming industries has reduced due to adjustment of China's industrial structure in recent years, the industrial sector still accounts for a large proportion of the industrial structure (Lin and Zhu, 2017), so the decline in energy consumption will be in the short term not apparent. So we assume that
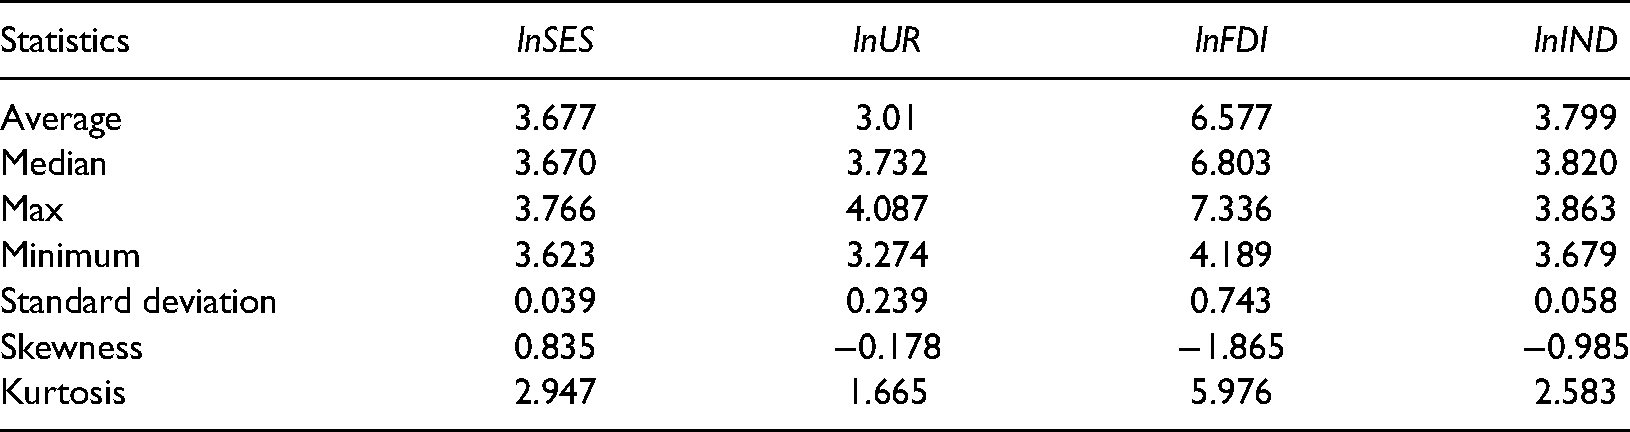
We use the ratio of urban population to total population to quantify urbanization, denoted by UR. FDI stands for foreign direct investment, and the ratio of manufacturing output value to GDP quantified the level of industrialization, expressed by IND. When evaluating the exogenous factors affecting China's SES, we expand China's SES value calculated by the evaluation index system by 100 times to make the dimensions of each variable consistent, and use their logarithmic value for analysis. The descriptive statistics of all variables are in Table 3.
Descriptive statistics for all variables in the ARDL model.
Existing studies focusing on the relationship of multiple time series variables mostly use vector auto regression (VAR) and vector error correction model (VECM) models. These two models require time series to be single integers of the same order. We analyze the impact of UR, FDI, and IND on SES in China using the autoregressive distributed lag (ARDL) model. Compared with the traditional cointegration model, the ADRL model has the following advantages: firstly, it does not require strict stationarity of the sequence, and does not require that all variables have the same single integer order; secondly, it does not test by the method of the simultaneous equation, and the dynamic error model derived from the ARDL method integrates both short-term dynamics and long-term equilibrium information; finally, ARDL model is suitable for sample estimation with a smaller volume.
We assume that UR, FDI and IND have a long-term equilibrium relationship with China's SES, as shown in Equation (10)
According to Equation (10), the dynamic unrestricted error correction model (UECM), shown in Equation (11), can be derived from the ARDL model,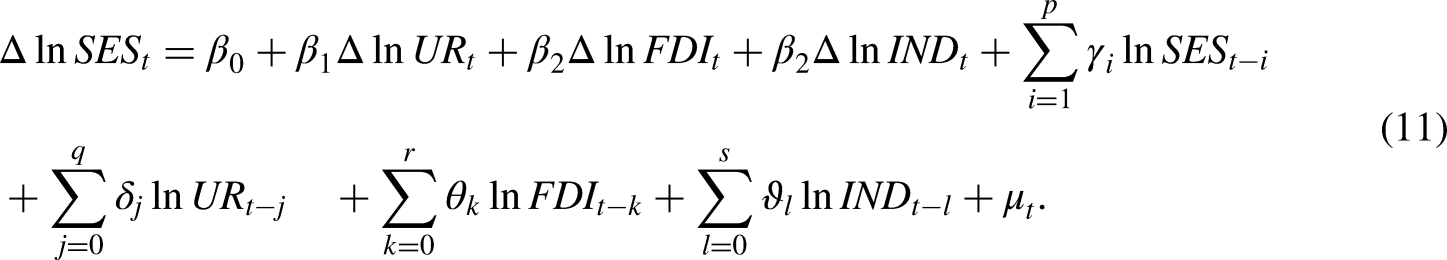
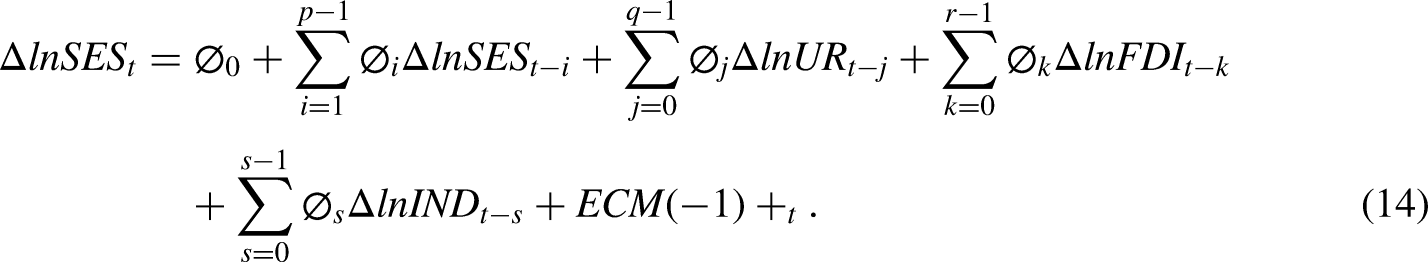
After determining the long-term equilibrium relationship between UR, FDI, and IND and SES, the ARDL(p, q, r, s) model is used to construct this relationship using Equation (12):

Main results
Weights of indicators
The index weights obtained from the EM-AHP-CRITIC method are shown in Table 2. Arranged the values obtained by EM method, top five indicators are environmental taxes (SES34), technological advances (SES24), per capita primary energy use (SES45), Total dependency ratio (SES22) and GDP per capita (SES11), and two of which belong to the social sustainability dimension, another three are, respectively, for the environmental sustainability dimension, energy security and economic sustainability dimension.
The ranking in the dimensional level obtained by the AHP method shows that energy security contributes the greatest to SES in China, and the weights of the energy security dimension (0.542) are much greater than the value of the environmental sustainability dimension (0.183), and the economic sustainability (0.172), while the social sustainability dimension (0.103) has the smallest weight. The values obtained by the CRITIC method are different from the AHP method (see column 8 of Table 2). However, the weights of dimensions in descending order obtained by the two methods show no difference: energy security, environmental sustainability, economic sustainability, and social sustainability. The different weights values indicate the importance of the combination of subjective and objective empowerment methods. The Lagrangian extreme value optimization method (see column 9 of Table 2) balances the values of the weights when the subjective weighting method or the objective weighting method is used alone.
Results for China's SES
Based on the above-identified EM-AHP-CRITIC method, the results of China's SES are shown in Figure 3. Since 1990, the score of China's SES showed an upward but fluctuated trend till 2007. After 2008, the score increased significantly due to the improvement of the energy security dimension. The value of the environmental sustainability dimension did not fluctuate significantly, while the score of the social sustainability dimension continued to grow from 1990 to 2018. The energy security dimension declined from 2001 to 2005 and increased after 2006. The values in the economic sustainability dimension increased before in 2017 and slightly decreased after that. In general, the contribution of the energy security dimension is the highest
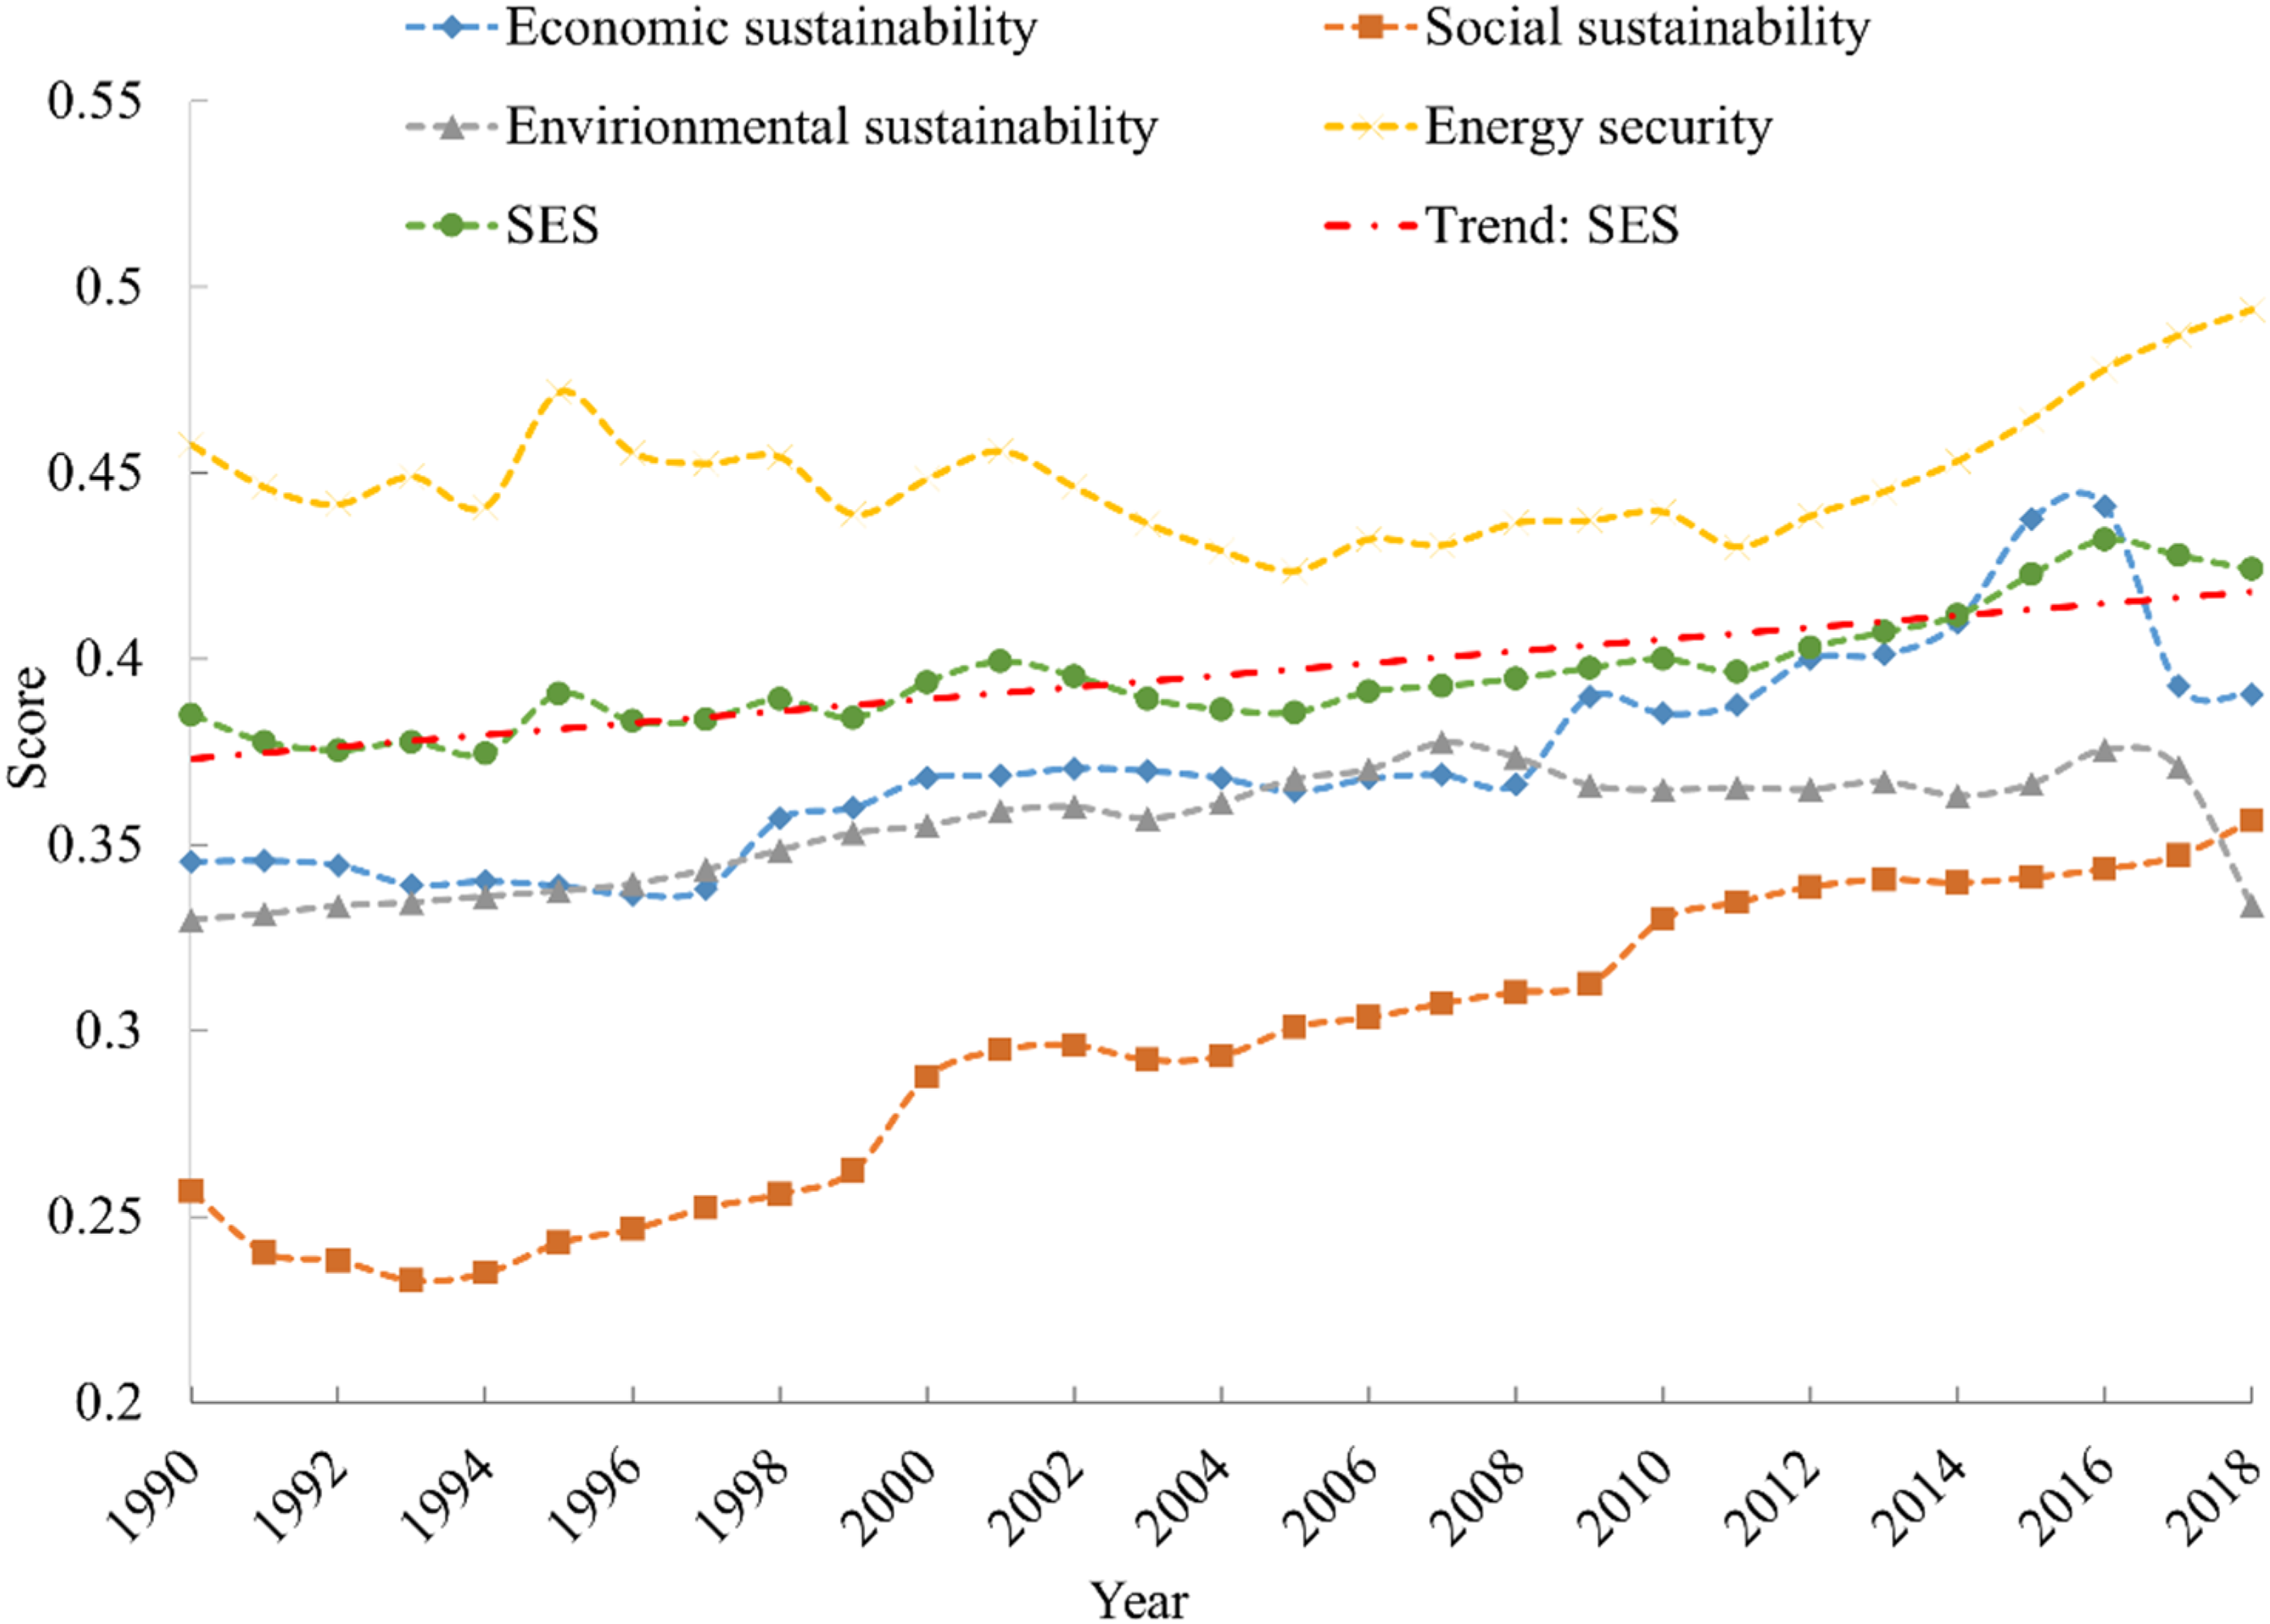
The scores of China's SES and its four dimensions from 1990 to 2018.
In the economic sustainability dimension (see in Figure 4(a)), the indicator SES11 contributed the most The value of this indicator increased, which indicated that the increase in per capita income significantly improved the sustainability of China's ES. The contribution of the indicator SES14 was the smallest and with a downward trend, reflecting the reduced impact of energy import costs on economic sustainability. The indicator SES15's contribution to the dimension of economic sustainability fluctuated the most From 1990 to 2000, SES15 had a relatively high contribution to the economic dimension, but after 2001, it fluctuated. The contribution rates of the indicators SES12 and SES13 to the economic sustainability dimension showed a small range of fluctuations.
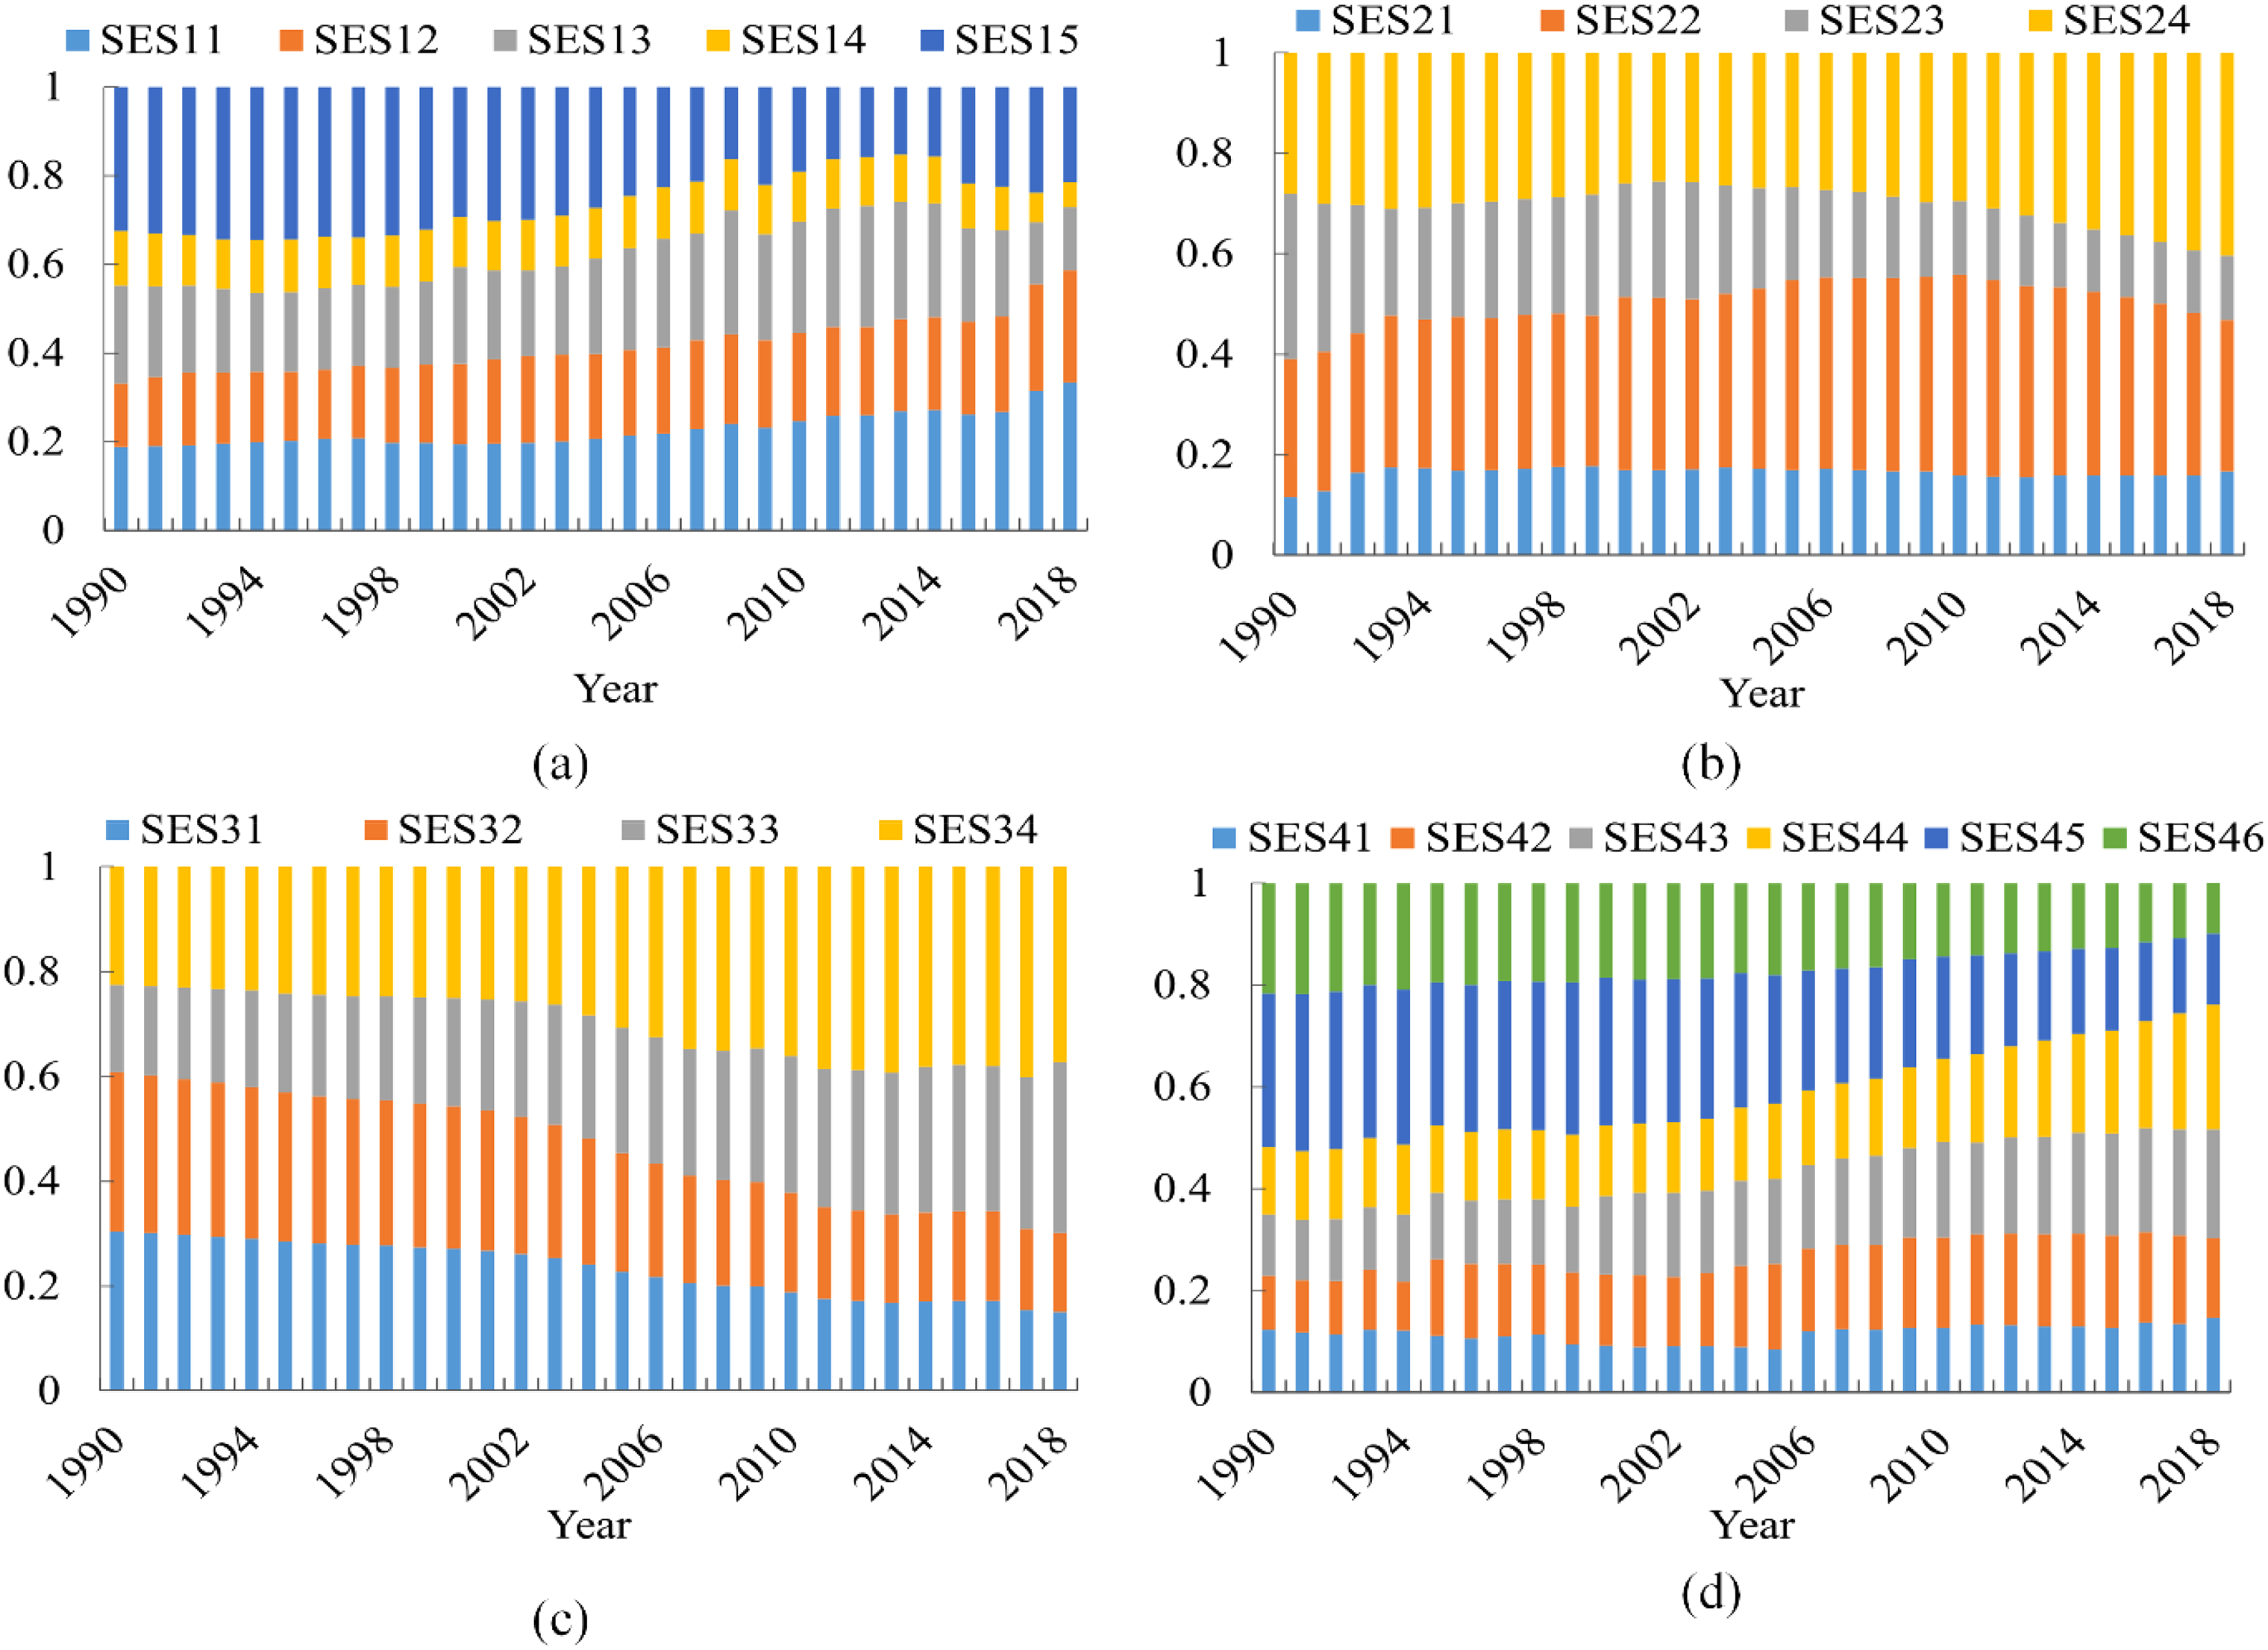
Inter-annual change in the contribution rate of each indicator in different dimensions.
In the social sustainability dimension (see Figure 4(b)), the contribution of the indicator SES23 showed a downward trend, from a contribution rate of 32.9% in 1990 to 12.7% in 2018. On the other hand, the contribution rate of the indicator SES24 increased, with an increase of 44.1% in 2018 compared to 1990, indicating that technological progress played an increasingly important role in social sustainability. Change of indicator SES22's contribution to the social sustainability dimension was similar to SES24. The contribution of indicator SES21 to the social sustainability dimension was stable.
In the dimension of environmental sustainability (Figure 4(c)), the contribution of indicator SES34 increased the most, with an increase of 1.7% between 1990 and 2018. The contribution of indicators SES31 and SES32 showed a downward trend, but indicator SES33 increased.
In the dimension of national energy security (see Figure 4(d)), the contribution of indicator SES45 illustrated a downward trend, dropping from 30.2% in 1990 to 14% in 2018. Contributions of both indicators SES44 and SES43 showed trends upward. In 2018, the contribution of indicator SES44 was as high as 24.5%. The contribution of indicator SES42 was stable.
Exogenous factors of China's SES
We performed the DF-GLS unit root test as shown in Table 4. The original sequence of lnFDI was significant at a 10% significance level, and was the stationary sequence I(0). lnSES, lnUR, and lnIND were not stationary series, but their first-order difference series were significant at a 10% significance level, and they were all first-order single integers. We selected the maximum lag order third-order and used the ARDL model for the marginal cointegration test Each variable in the model rejected the null hypothesis at the 10% significance level, indicating that lnSES, lnUR, lnFDI and lnIND had a long-term cointegration equilibrium relationship. Therefore we studied the impact of UR, FDI and IND on China's SES.
DF-GLS unit root test results.
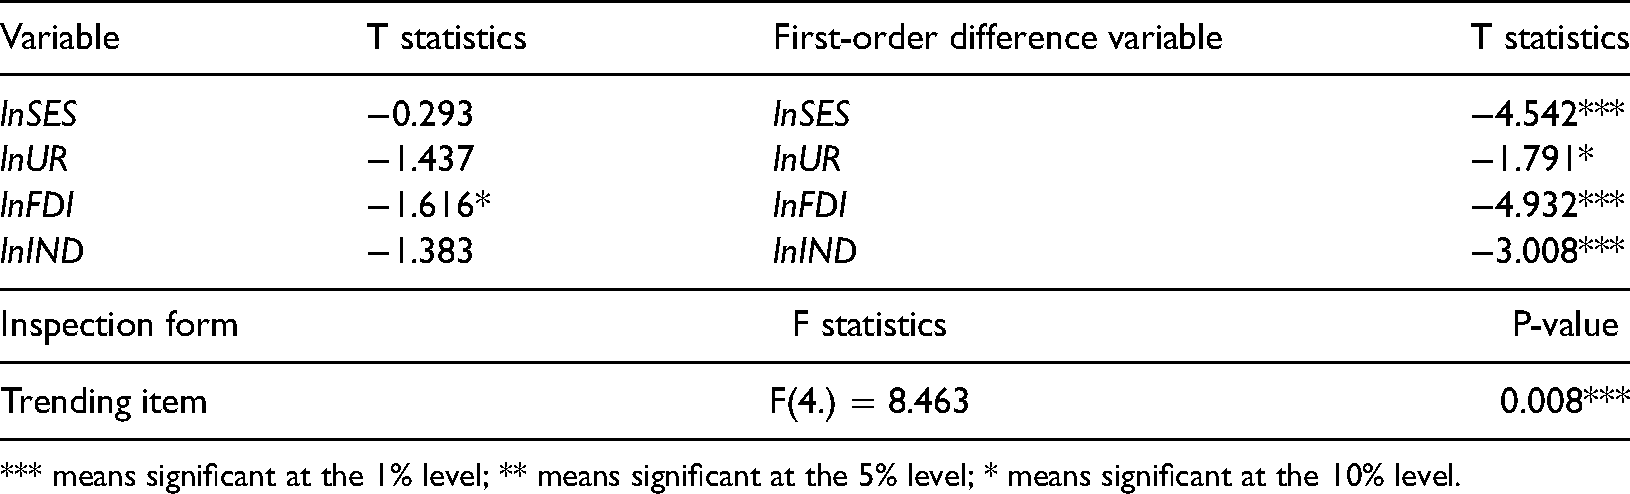
*** means significant at the 1% level; ** means significant at the 5% level; * means significant at the 10% level.
According to the principle of minimum standard deviation, a model that does not contain a trend term was selected to estimate ARDL (3,0,2,1) in both the long and short term. The results were in Table 5. In the long run, FDI and IND significantly affected China's SES in opposite directions, while UR had a positive but insignificant impact on SES. Therefore, we rejected H1a and H1b; that was, the increase of UR in China in the long term did not significantly impact SES. We accepted the original hypothesis H2 because the coefficient of SES and FDI was positive at a 5% significant level, indicating that the long-term FDI improved China's energy sustainability. While studies from Ahmad and Du (2017) and Graham and Krugman (1995) believed that FDI had a minor role in the economic growth of a country, neither to the sustainable energy system. Mwilima (2003) and Kumar and Pradhan (2002) were in line with our result that FDI contributed to SES by stimulating economic growth. One possible explanation was that the Chinese government strictly guided the industries that FDI can enter in China. The introduction of FDI can effectively avoid monopoly and improve the energy efficiency of regulated industries, resulting in an improved SES.
Parameter estimation of ARDL model.
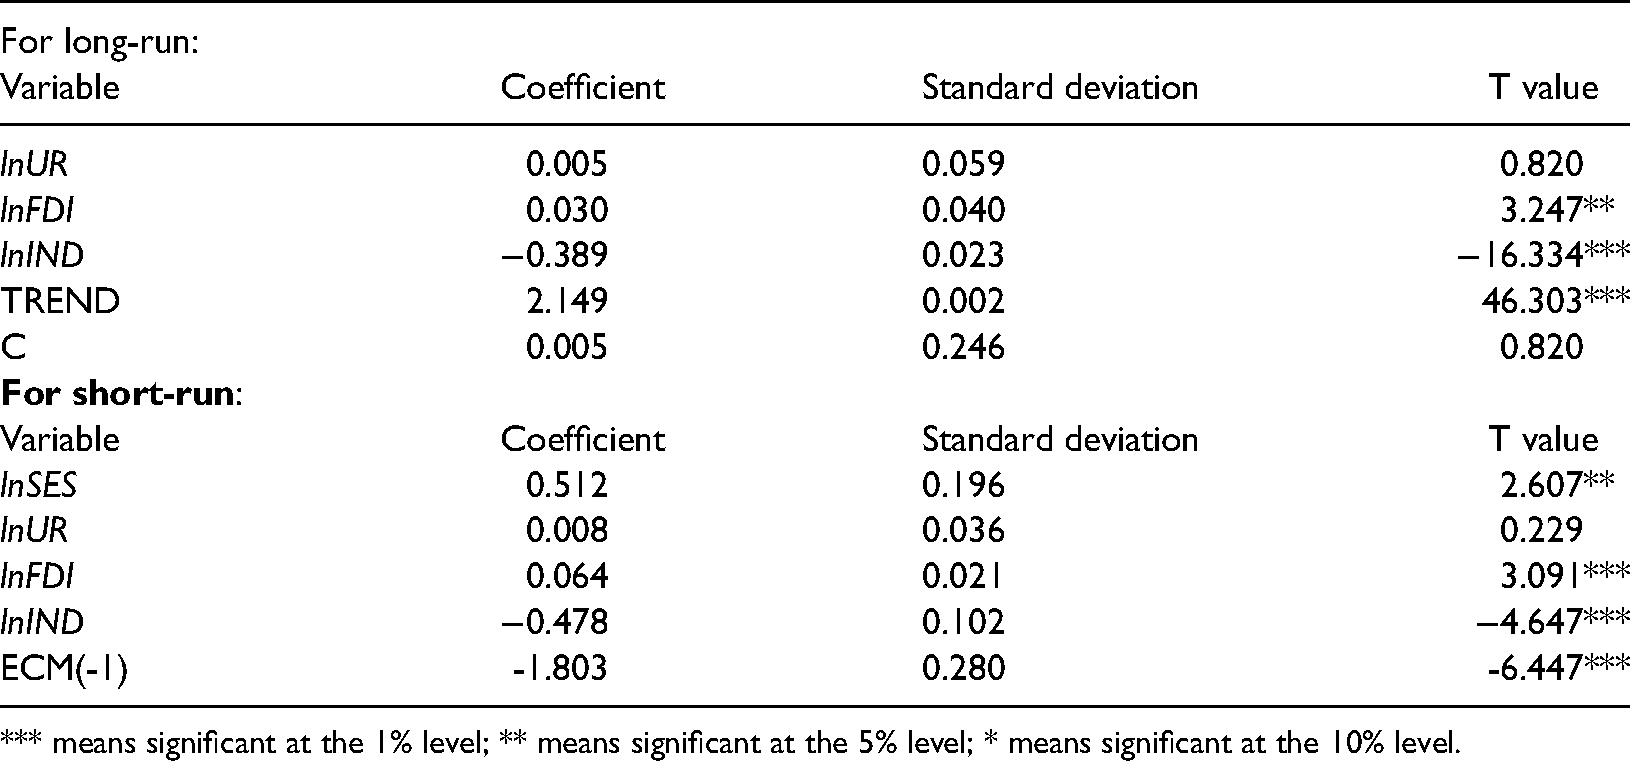
*** means significant at the 1% level; ** means significant at the 5% level; * means significant at the 10% level.
Contrary to the effects of FDI, IND decreased China's SES for a long time at 1% significance, showing the reverse relationship between the secondary industry and SES development. Comparing the absolute values of the coefficients of IND and FDI on SES, which was 0.389 and 0.03 respectively, we found that the domestic industrial structure had a much more significant effect on China's SES than FDI. This aligns with the states that domestic firms better understand the domestic market than FDI (Graham and Krugman, 1995).
The coefficient estimation results of the short-term ECM model showed that UR coefficients had a positive but insignificant impact on China's SES, while FDI and IND both had significant influence, from the positive and negative direction, respectively. The error correction coefficient was −1.803 at a 1% significance level. The absolute value of the error correction term reflected the speed of the adjustment towards the long-run equilibrium.
Robustness test
To ensure the robustness of our results, we tested the stability of the ARDL model. Here we chose the CUSUM and CUSUMSQ to test the stability of the model, and the results were shown in Figure 5. The red and green solid lines in Figure 5 represented the upper and lower bounds at a 5% significance level. The fluctuation values of CUSUM and CUSUMSQ were shown as the solid blue line. Thus, the constructed ARDL (1,1,0,1) model coefficients were stable at the 5% significance level.
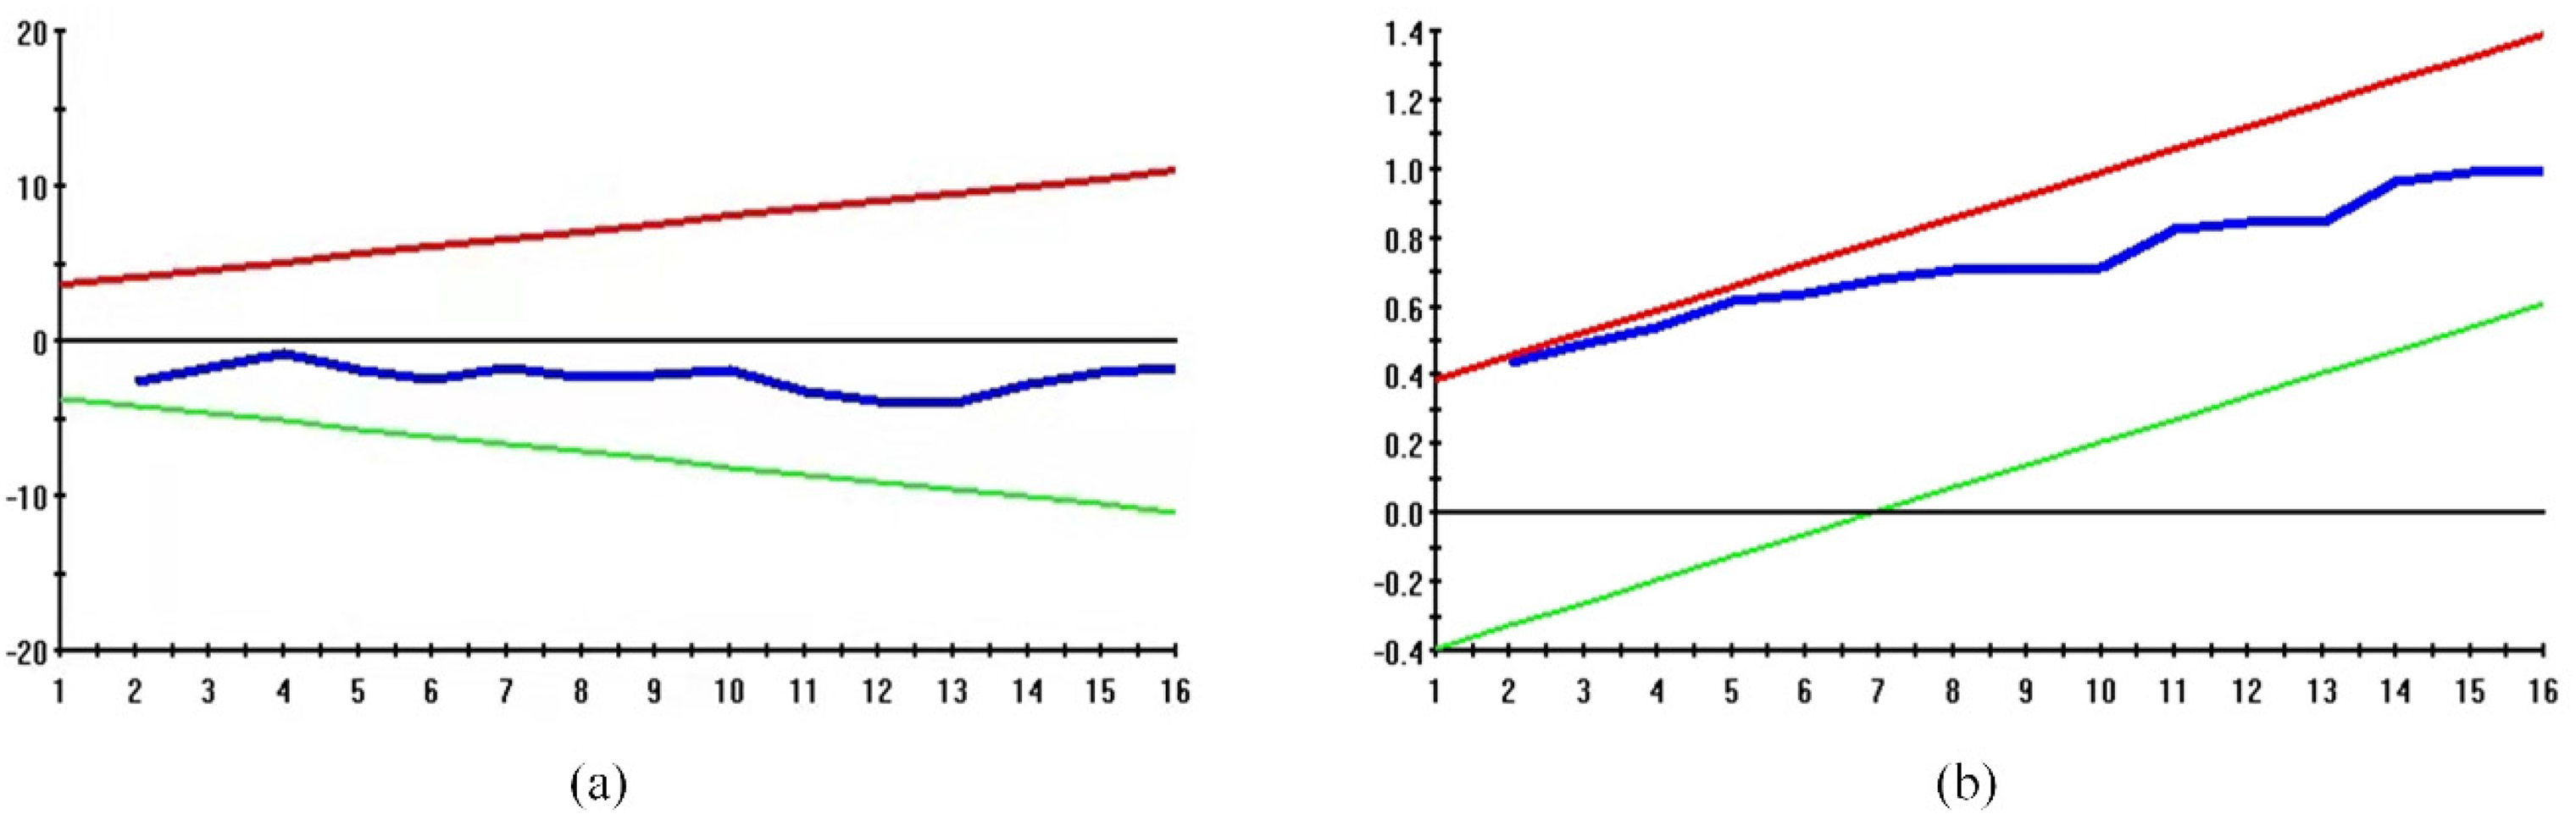
Results for recursive cumulative sum of residuals (CUSUM) (a) and recursive cumulative sum of squared residuals (CUSUMSQ) test (b).
Conclusions
This Paper analysed the endogenous and exogenous factors of SES for China. First, we evaluated China's SES situation from the aggregated economic, social, environmental, and energy security dimensions with 19 endogenous factors using the EM-AHP-CRITIC model from 1990 to 2018. China's SES showed a significant upward trend since 1990, which was mainly due to the improved energy security. Energy structure adjustment plays a crucial role in realising China's SES because energy security is related to the transition to low-carbon energy, such as renewable energy generation. And then, the ARDL-ECM model was used to analyze the long-run and short-run impact of urbanization, foreign direct investment and industrialization on China's SES. The results of the ARDL-ECM model indicated urbanization in China in the long term and short-run had positively related to SES, but not statistically significant. On the other hand, the foreign direct investment did well to China's SES, which might be related to China's introduction of foreign investment has improved the energy efficiency of relevant industries. On the other hand, the over-reliance of the national economy on the secondary industry worsen China's SES, as illustrated by the significant negative effect of industrialization on China's SES. In addition, the absolute value of the impact of industrialization and foreign direct investment on China's SES showed that the domestic industrial structure had a much more significant effect on China's SES than foreign direct investment.
We believed that evaluating the factors affecting the sustainability of China's energy system can provide theoretical support for the formulation of energy development plans and the implementation of carbon emission reduction policies for China and other countries. The above results implied that the development dividends brought by urbanization could not significantly promote the sustainable use of energy. Future policies should focus on improving people's lifestyles and advocating low-carbon life. China has become the world's second-largest recipient of foreign direct investment. Since the adjustment of the domestic industrial structure has a significantly higher increase in China's SES than that of foreign direct investment, the Chinese government should continuously optimize its industrial layout to control the total energy consumption through production, trade, transportation, and consumption, and improve energy conservation and energy use efficiency to adjust the energy consumption structure. While from the supply side, China must rely on technological progress to accelerate renewable energy development such as solar, wind, and biomass energy, aiming to promote the diversification of energy production structures and ultimately establish China's sustainable energy structure.
Considering the regional differences in China, one potential research direction of our manuscript is to compare the sustainability of energy systems at different development levels in China from the perspective of Chinese urban agglomerations or east, middle and west regions. Another way is by combining IPAT decomposition methods to focus on the influence mechanism of exogenous factors on China's SES.
Footnotes
Declaration of conflicting interests
The author(s) declared no potential conflicts of interest with respect to the research, authorship, and/or publication of this article.
Funding
The author(s) disclosed receipt of the following financial support for the research, authorship, and/or publication of this article: This research was supported by the National Natural Science Foundation of China under Grant [71991482]; the National Social Science Foundation of China under Grant [19ZDA112], China Scholarship Council under Grant [201906410051], and the Fundamental Research Funds for National Universities, China University of Geosciences(Wuhan) under Grant [2201710266].
Supplemental material
Supplemental material for this article is available online.