
Abstract
Wind energy systems show tremendous potential toward the reduction of greenhouse gas (GHG) emissions; however, the rate of generation of this mode of clean energy remains predominantly intermittent, since it is produced by constantly changing natural drivers, such as wind availability and wind velocity. In this work, a novel framework is proposed which combines a modular process simulator, and a Python environment, to calibrate the operation, and perform a sensitivity analysis of a compressed air energy storage system (CAES) system. Six operational variables are identified via various Monte-Carlo simulations, and a SOBOL analysis of the results highlight three key variables that significantly influence the two primary outputs of a CAES system: the LCOE and the exergy destroyed. Our results successfully identify two novel design metrics that can inform D-CAES design and optimization, for future simulation and experimental works targeted toward wind energy capture and storage.
Keywords
Introduction
Renewable energy sources are expected to grow worldwide to mitigate GHG emissions from conventional power plants (IEA, 2020), which generate around 25% of GHGs (Dai et al., 2022). Renewable technologies are sustainable options for energy systems; wind energy contributed a third of the total green energy generated in 2018 (Dong et al., 2022). However, wind-based technologies face a key challenge of the expected variability of wind speed, which accounts for an imbalance between energy generation and consumption (Meng et al., 2019). Thus, targeted energy storage technologies have been developed to manage this mismatch (Pfeiffer et al., 2021). While distributed generation might be considered as a feasible alternative to energy storage; nevertheless, the location of wind farms and consumption are typically mutually exclusive (Leahy et al., 2021). Some feasible wind storage techniques include pumped-hydroelectric energy storage (PHES), underground pumped-hydroelectric energy storage (UPHES), compressed air energy storage (CAES), battery energy storage (BES), and flow battery energy storage (FBES). Some important parameters to be considered for the selection of an adequate storage technology are: (i) the power capacity, as this represents the maximum instantaneous output provided by the energy storage device, (ii) the energy storage capacity, which is the net amount of electrical energy that a device can store, (iii) the device efficiency, which is measured as the quantity of electricity recovered, and (iv) the response time, that is, the time required by the device to start releasing its stored power (Leahy et al., 2021). For BES devices, additional key operating parameters are the charge-to-discharge ratio and the depth-of-discharge.
Among these various techniques, PHES is the largest and fastest responding wind storage technology, as compared to other counterparts. A PHES is ideal for load-leveling applications; however, this system requires two large reservoirs within proximity to operate, which is a major drawback of this technology. UPHES storage technology operates in a similar manner as PHES, but for a UPHES, the facilities are intentionally designed with various reservoirs kept at different levels. UPHES is definitely a cost-effective and reliable option, but it is not as mature as its predecessor, the PHES. On the other hand, CAES system is a facility with a generator, a high-pressure turbine, a low-pressure turbine, and a power train motor that drives a compressor, which can successfully compress air into the cavern. The CAES system can be used as large-scale storage such as PHES and UPHES, and offers several advantages: (i) quick response time, (ii) efficiencies ranging from 65% to 80%, (iii) relatively low maintenance, and (iv) relatively low capital cost of approximately $450/kW. The major drawback of these facilities is that the require the presence of an underground reservoir in proximity to the location where a power plant can be built. Owing to the necessary geological conditions necessary for such underground reservoirs, and specifically, salt domes, the United States and the European Union are more likely to conduct research on this type of technology. Lastly, BES is an established energy storage technology, and EV’s second-hand lithium-ion batteries have recently been utilized as energy backup. The primary drawbacks of these systems include issues with their performance and lifespan, as well as higher initial costs when compared to other energy storage solutions (Leahy et al., 2021).
Wind farms are typically coupled with CAES systems because they operate at grid-scale capacity, therefore only requiring an underground cavern to store compressed air, thus achieving efficiencies of up to 80% (Meng et al., 2019). A CAES system stores energy during peak production hours at a lower cost (Soltani et al., 2021). Typically, there are two types of CAES designs: (i) the adiabatic CAES (A-CAES), which stores the released heat during the compression process in a thermal energy storage system, for reusing it later during the expansion process, and (ii) the diabetic CAES (D-CAES), which burns fossil fuel with the compressed air, prior to its expansion in a gas turbine (Chen et al., 2020a). Presently, there are only two CAES plants in the world, both having diabetic designs. One of these D-CAES is located in Huntorf, Germany (commissioned in 1978, 320 MW power) and the other one is in McIntosh, US (commissioned in 1981, 110 MW power). Both these plants operate without any heat storage, using natural gas as a heat source for discharging. Future D-CAES research and development areas include the successful upgradation of existing plants by optimizing heir operations, and/or incorporating Thermal Energy Storage (TES) devices, where only a portion of the required energy is delivered. On the other hand, an A-CAES system will effectively store the generated excess heat during the compression process above ground, which can be reused to heat the air during the expansion process.
Research efforts in recent years have been conducted for simulating and CAES processes, including the optimization of design and operation of combined cooling, heating, and power (CCHP) systems, with a focus toward minimizing costs (Chen et al., 2020b); performance evaluation of the value of energy storage while considering various services at a time (Das et al., 2018); varied analyses such as the simulation of caverns to evaluate their efficiencies under varying operating conditions and/or configurations, plant performance, integration of CAES with other systems (Najjar and Abudaker, 2016), and energy and exergy analysis (Chen et al., 2021). While ongoing research (supported by simulations) shows the benefits of this tool toward optimizing configurations and operating costs to maximize efficiency while minimizing energy consumption and costs, these tools have almost exclusively been demonstrated for A-CAES systems, which is still considered as mature technology, and is an area that is still evolving. In reality, one is more likely to encounter the D-CAES system and mode of operation. Therefore, in this work, we successfully perform a sensitivity analysis to evaluate the impact(s) of input operating parameters on output model responses on D-CAES systems. Our work is supplemented with an exergy analysis, to evaluate the merits of energy conversion in existent D-CAES systems, which provides further insights optimizing existing plants, and contributes toward enhancing the corpus of knowledge in this field, on how to enhance potential new plant designs. The D-CAES system is modeled and simulated using a coupling strategy, implemented between the process simulator AVEVA PRO/II and a Python simulation environment. Wind velocity data is obtained from a wind farm in Northern Ireland (Chen et al., 2020a). The process simulations (charge and discharge) include a train of compressors, turbines, heat exchangers, and combustion reactors. Air is stored and released from a cavern, and characteristic curves of associated rotatory equipment are provided as input parameters (Meng et al., 2019). The resultant coupled simulations allow for accurate estimations of the airflow intake, economic evaluation, and exergy analysis. A sensitivity analysis (under uncertainty) is performed against six identified process variables, to evaluate the relative strengths and limitations of the proposed D-CAES design. Lastly, impacts of the reduction of the destroyed exergy and the cost of electricity generation are critically assessed. In Section 2, we present the methodological framework for simulating and optimizing the D-CAES plant, while Section 3 presents the results of our simulation model, the sensitivity analysis, and discusses some major insights and results arising from our work. Finally, in Section 4, we summarize our key conclusions regarding the benefit of such an integrated framework, and also identify steps for future research in this domain.
Methodology
In this section, we detail out the framework employed for the process simulation, performance evaluation, and calibration/sensitivity analysis performed for the D-CAES.
Process description
A D-CAES system is an energy storage technology utilizing compressed air and cavern storage (although other mediums such as depleted gas fields are also under development). During actual operation, the electricity available is utilized to compress air in a cavern at high pressure, at depths of hundreds of meters typically. The released air is heated via combustion and expanded to power a gas turbine, to produce electricity which may be stored as energy, and utilized when required. The D-CAES system presented here considers the interaction between the generated wind energy and the grid demand, as illustrated in Figure 1. The system depicted in the figure comprises of two sections: charging and discharging. The charging section operates when wind power exceeds the grid demand, and the power so generated can be used for compressing and storing air in a cavern. The input air stream for this section is at standard atmospheric conditions (1 bar and 293 K). The air stream enters a compressor train (simulated here as a low-pressure axial compressor, i.e. LPC, and three high-pressure centrifugal compressors, i.e. HPC) and four heat exchangers. Ammonia is chosen as the coolant for our system. The compressed air stream is stored in a cavern at 323 K, between 43 and 66 bars. The discharge section operates when the wind power generated is less than the grid demand, and the cavern air stream generates electricity through turbines. For this case, the air stream from the cavern is preheated (to 557 K) with residual heat from the turbine outlet steam. The preheated air passes into a combustion chamber, where it mixes with methane. The product resulting from the high-temperature combustion is expanded in turbines to generate electricity.
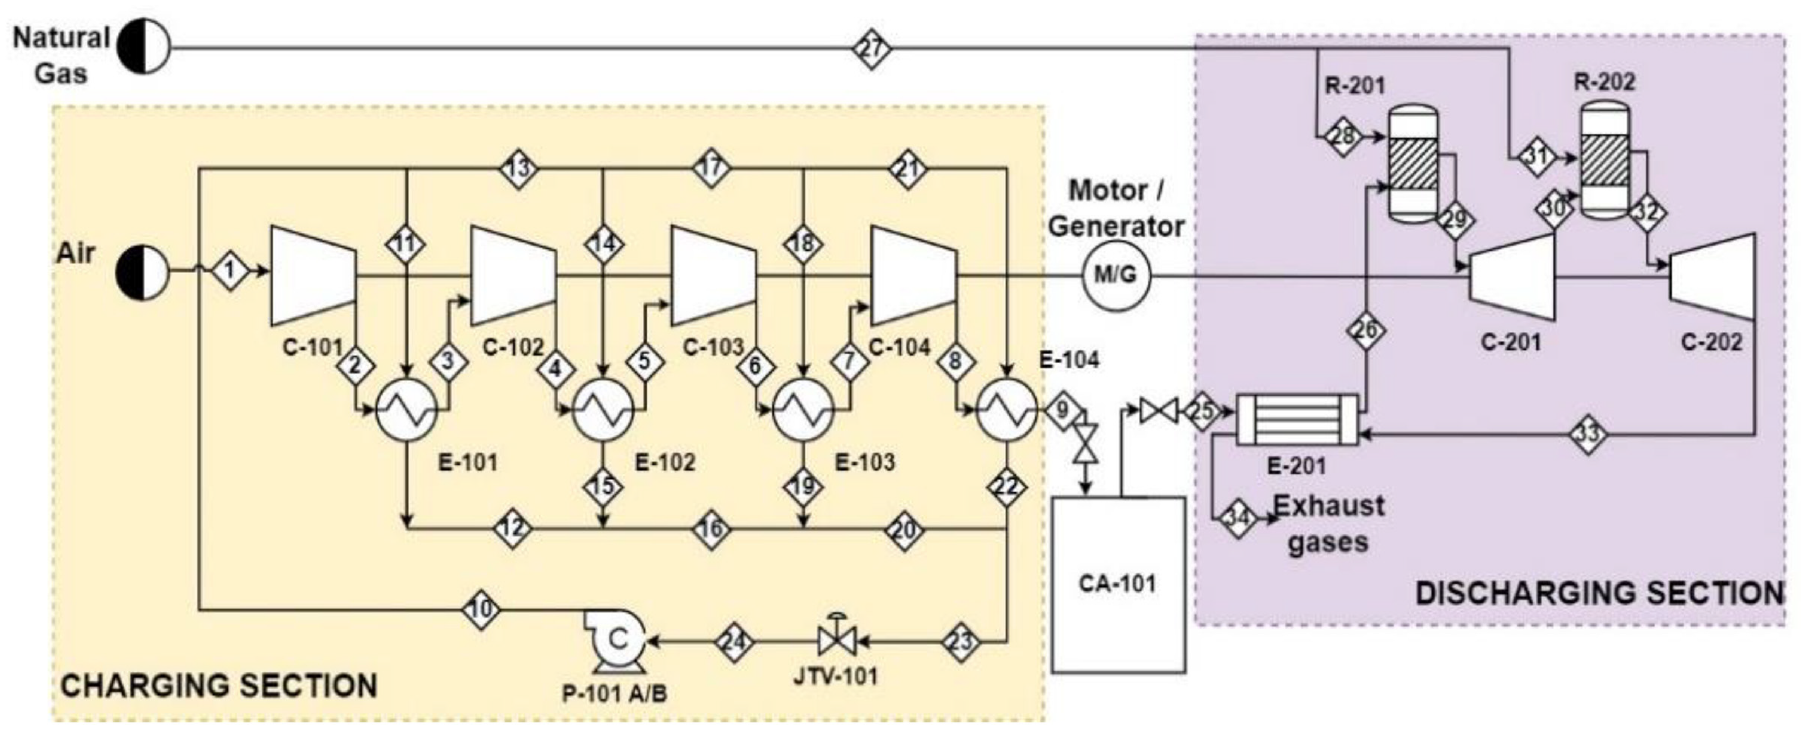
Schematic diagram of the CAES system studied in this work.
Base case and process simulation
The D-CAES system for our simulations considers as input the wind power data of a Northern Ireland plant, which assumes a constant demand of 110 MW (Meng et al., 2019). Based on the wind power in an hourly resolution (over 24 hours, as per Meng et al., 2019), the energy available for charging and discharging sections is calculated by considering the difference between the energy generated, and the energy to be supplied to the grid. Current industrial practice is to sample data every 10 minutes, to account for large variations of wind speed that could occur during this time. The wind information resolution was consciously chosen to be 1 hour, since it is assumed that any local temporal variations in the generated wind profile would be eliminated (or at the least, minimized) over such a timescale. Consequently, our simulation results are likely to be far more representative, and would contain minimal noise disruptions. Such a choice also works in our model’s favor, since it demonstrates consistency of our proposed model over much larger timescales.
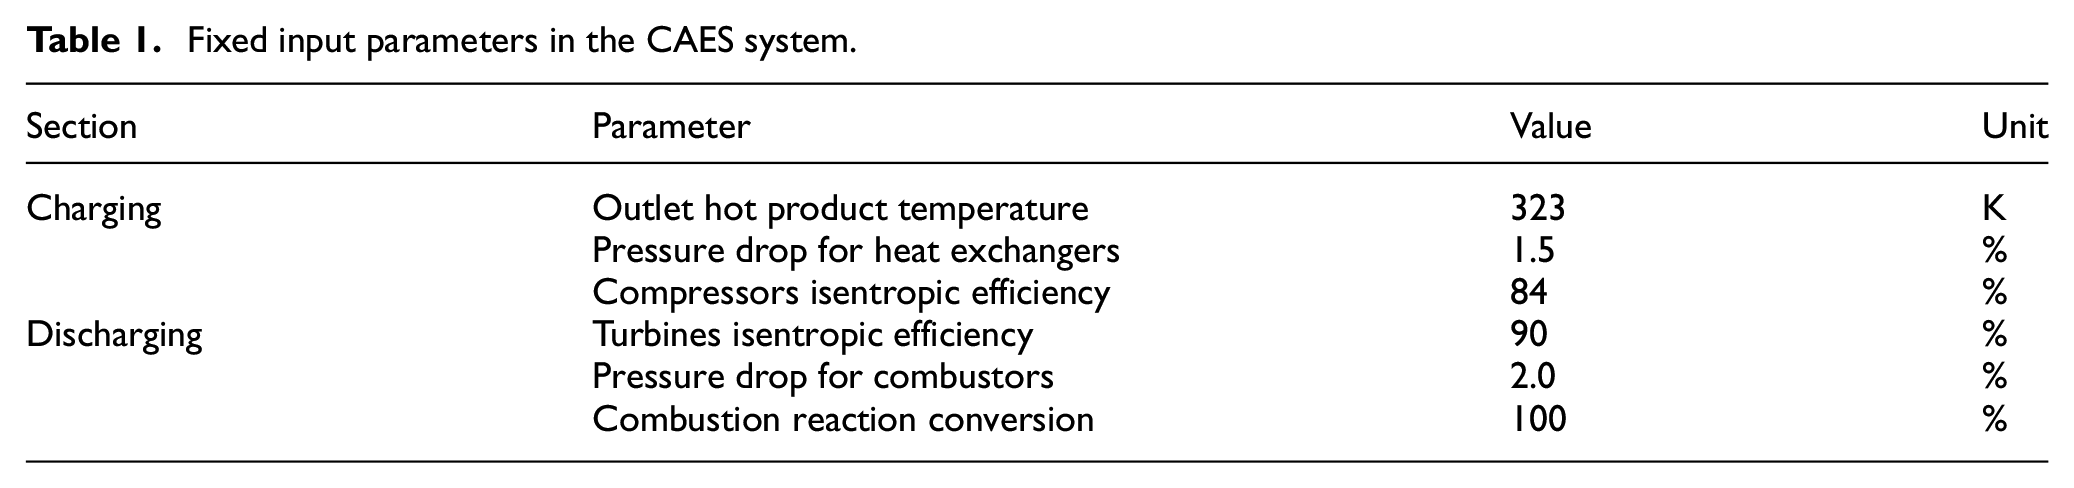
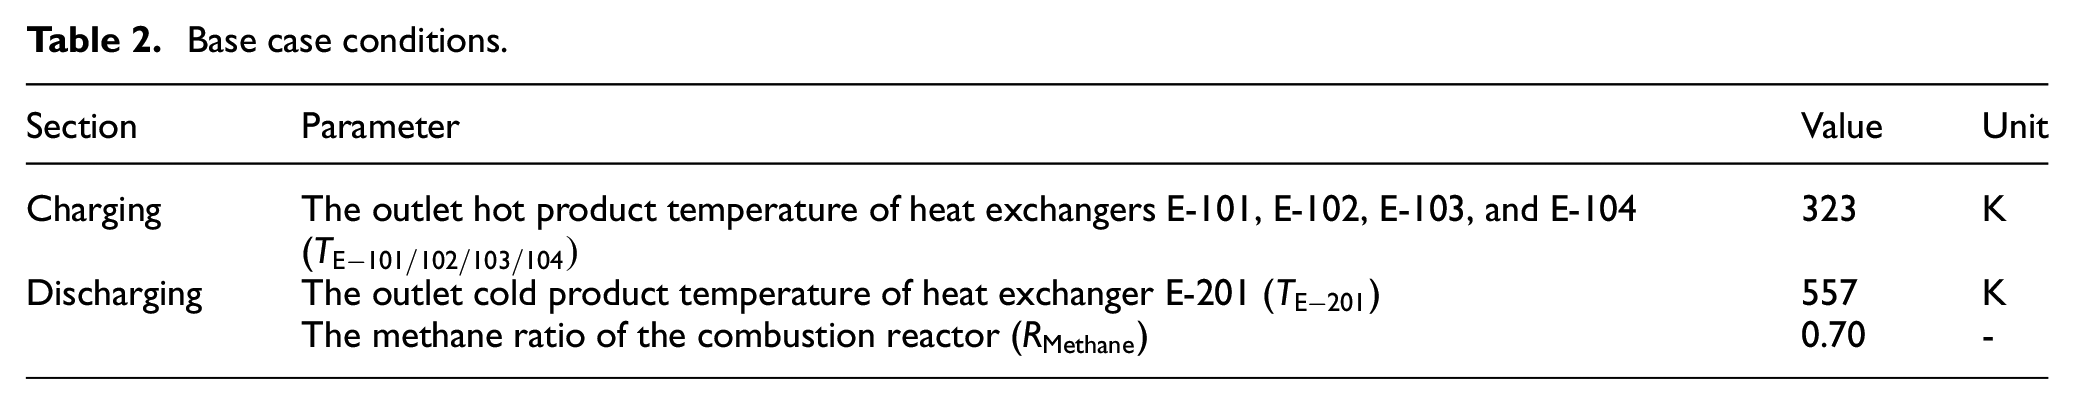
The system is modeled under steady state conditions, using AVEVA PRO/II. The thermodynamic model describing the system was chosen to be Soave-Redlich-Kwong, modified in conjection with Peng-Robinson (SRKM01), as the system works with real and nonpolar compound. The process parameters considered for our simulations are summarized in Table 1. Heat exchanger areas are estimated by considering the design heuristics proposed by Hall (2017). For compressors and turbines, the pressure ratios are based on the mathematical model developed by Briola et al. (2016), using the characteristic curves proposed by Meng et al. (2019). Polynomial equations, fitted from data generated by the characteristic curves, are bounded by a range of airflows and (dimensionless) turbomachine shaft speeds. These ranges suitably define the maximum and minimum mass flow rates of air which may be fed to each section. The equations are incorporated into the simulation using a Calculator module, as configured in Fortran 77. The temperature of the heat exchangers and methane ratio of the combustion reactor for the base case are listed in Table 2. The outlet hot product temperature of the heat exchangers E-101/102/103 and 104 (TE-101/102/103/104), the outlet cold product temperature of the heat exchanger E-201 (TE-201), and methane ratio of the combustion reactor (Rmethane) are 323 K, 557 K, and 0.70, respectively. To evaluate the performance of the CAES system, the exergy destroyed and the levelized cost of electricity were estimated as suitable efficiency indicators.
Fixed input parameters in the CAES system.
Base case conditions.
Levelized cost of electricity
The levelized cost of electricity (LCOE) is defined as the current average net cost of electricity generation incurred for a generator, over its lifetime. This cost estimate metric allows an evaluation of the economic advantage of a system over the power grid, representing the average revenue per unit of electricity generated which would be required to recover the costs of constructing and operating the system, during an assumed duty cycle and financial lifetime. Equations (1)–(4) are used to define the LCOE according to the procedure of Turton et al. (2018), as follows.


Here,
Destroyed exergy
The second system performance indicator this work utilizes, is the destroyed exergy. This metric measures the quality of the design and also identifies crucial points which allow a more efficient use of energy, thereby increasing sustainability and reducing environmental impacts caused by the environment (Kim et al., 2011). Exergy is an attribute of the energy quality, and quantifies the minimum work that is required for a system to obtain a given thermodynamic state, from an initial set of environmental conditions. Exergy destruction refers to exergy being destroyed due to irreversibilities within a system; this approach allows for rating the fundamental units of system, related to entropy generation. Consequently, an exergy destruction analysis therefore accurately allocates the amount of primary energy that is consumed by the major components of a system. The corresponding set of equations for the exergy analysis are shown as follows:


Here,
Computational framework
Figure 2 presents the computational framework which integrates the process simulation software AVEVA PRO/II combined with a Python environment, through a Python COM interface. This framework allows one to calibrate operations, and perform a sensitivity analysis of the D-CAES system. The CAES process simulation (under steady state conditions) is developed in AVEVA PRO/II, including the charging and discharging sections. The simulation is completed by a set of input functions in Fortran, including compressors and turbine settings. The operating conditions are generated from the process simulation, which feeds the calibration algorithm in Python, which interacts with the operating curves of rotating equipment as well as utilizes the required inputs to calculate the destroyed exergy and the LCOE. These calculated results are returned back to the simulation environment, where a set of optimal operating decisions are made in Fortran, which consequently updates the simulation flowsheet and streams.
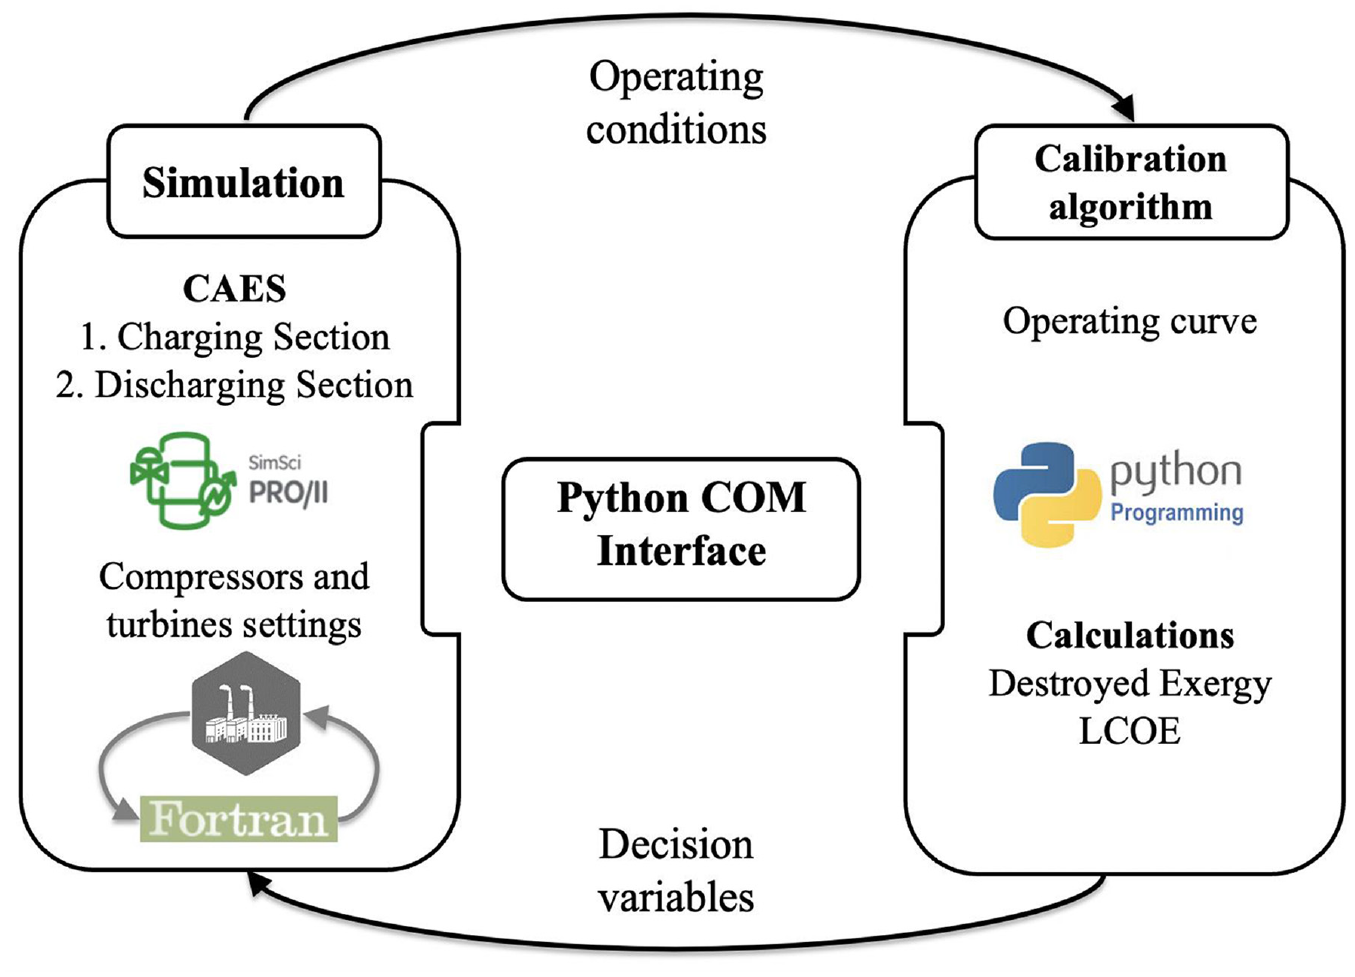
Framework integrating AVEVA PRO/II combined with a Python environment, using the Python COM interface.
Operating curves
Figure 3 shows the power generated by the wind farm data obtained by Meng et al. (2019) with a constant demand of 110 MW. The energy available for the charging and discharging section is the difference between the generated energy, and the energy that is supplied to the network (110 MW). The lower and upper energies for the charging section is between 20.5 and 80.5 MW, while the upper and lower energies for the discharge section is between 28.6 and 96.5 MW. Due to a lack of information about the mass flow of air entering the wind farm, we built an operating curve for each of the charging and discharging sections. The operation curve for the charging section indicates the relationship between the mass flow of the air supplied and the compressor work. In contrast, the operating curve of the discharging section provides the relationship between the mass flow of the air supplied, and the turbine power. The interconnection between the AVEVA PRO/II interface and the Python COM interface allows for an evaluation of different air mass flows in each section, to obtain their corresponding energy. The mass flow range for the charging section varies between 48.5 and 158.5 kg/s (with an increment of 10 kg/s), while the air mass flow range in the discharging section varies between 44 and 94 kg/s (with an increment of 10 kg/s).
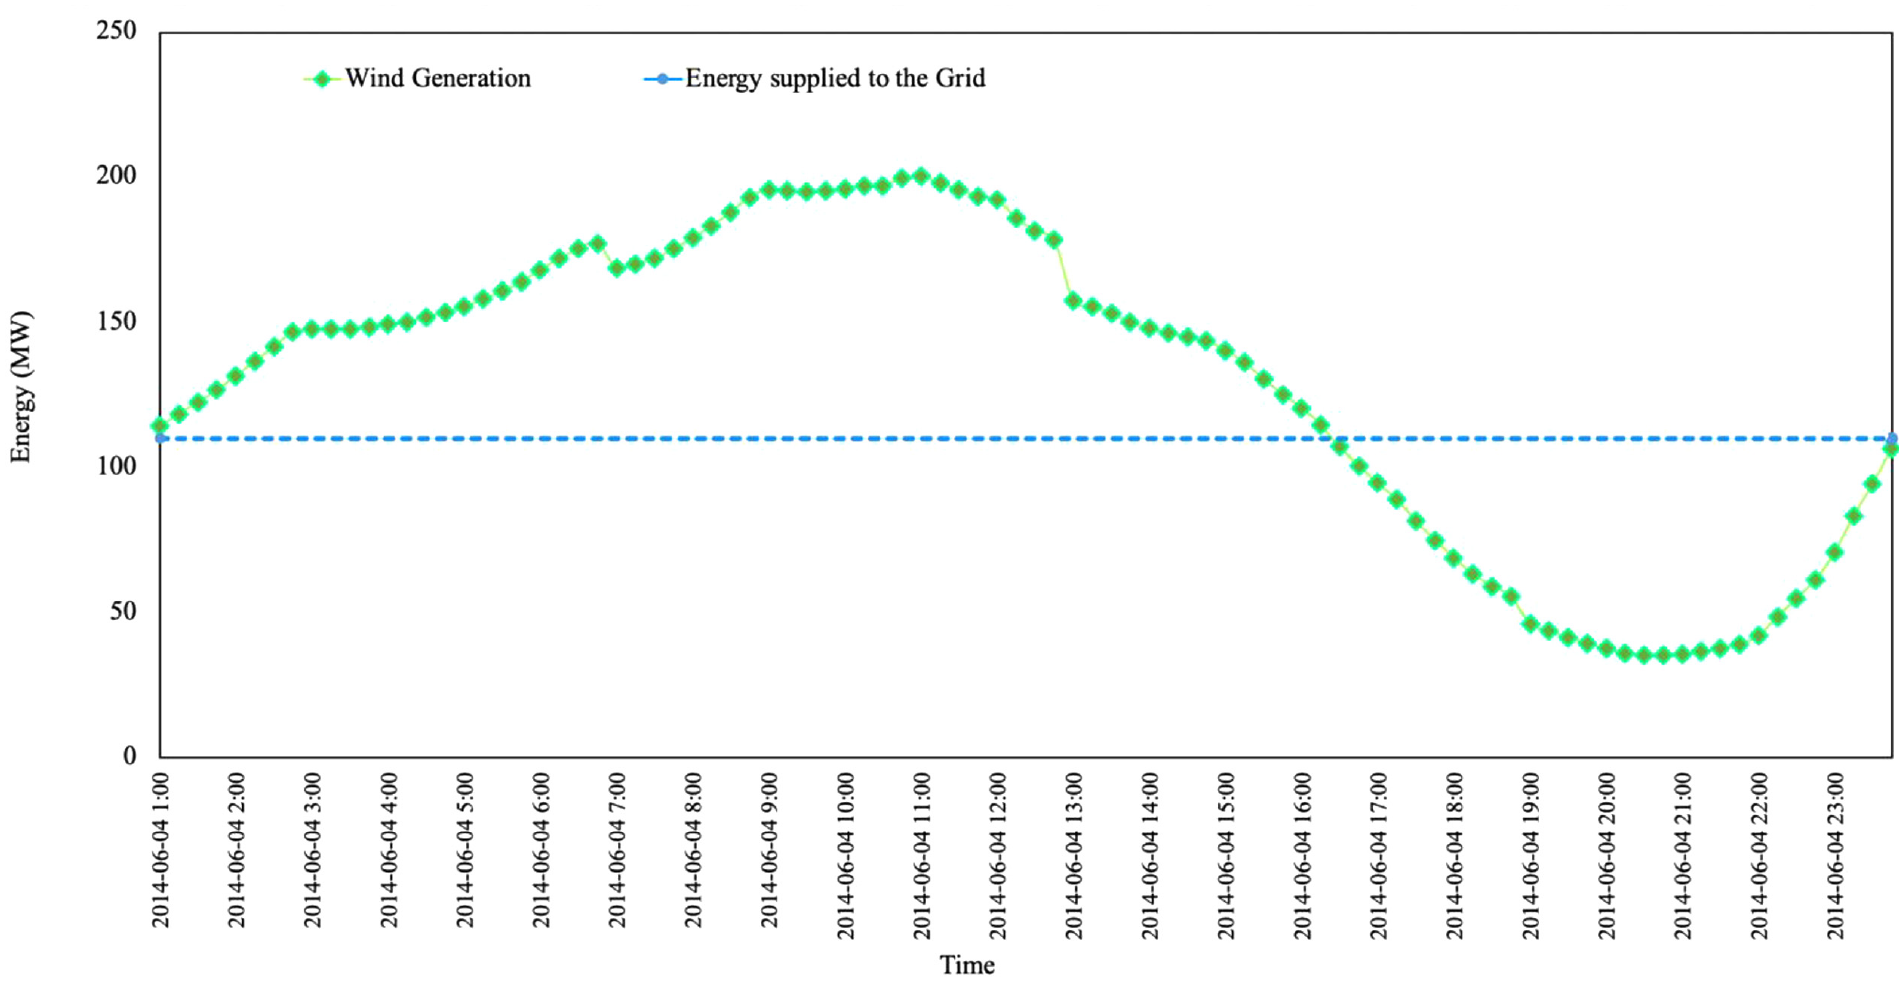
Wind power generation profile at hourly resolution. Data as obtained from the work of Meng et al. (2019).
Calibration curves
Calibration curves were developed to determine the air mass flows required for each section, according to the available energy (refer to Figure 3). The required air mass flow for the available energy was estimated by interpolation of operating curve data, performed using the method of cubic splines, via the SciPy Python library (Virtanen et al., 2020).
SOBOL analysis
A SOBOL analysis is performed to explore the impacts of relevant system variables against outputs of interest; these are represented by SOBOL indices. SOBOL analysis is a variance-based global sensitivity analysis methods that employs Monte-Carlo simulations. The procedure decomposes the variance of the model’s output into fractions that may be attributed to inputs, quantitatively providing and, hence, ordering the relative significance or contribution of individual inputs on a collective input. Using the SALib sensitivity analysis library in Python, we generated 986 uniform random samples of the following six process variables: the outlet hot product temperature of heat exchangers E-101, E-102, E-103, and E-104 (
XGBoost
An additional secondary analysis was performed using the XGBoost (eXtreme Gradient Boosting) library on Python, to identify the importance of the variables identified in the CAES system. This library relies on the scalable distributed gradient-powered decision tree methodology, and is generally used for regression and classification problems (Chen and Guestrin, 2016). Using XGBoost, we performed a decision tree regression model for the LCOE and Exergy objective functions, using the 986 datapoints previously generated from Monte-Carlo simulations. The robustness of the regressions is ensured with a coefficient of determination (R2) attaining a value close to 1, and a mean square logarithmic error (MSLE) close to 0. Finally, the relative importance if the variables in each response was determined through the “Feature Importance” function of the XGBoost library (Brownlee, 2018; Yao et al., 2022). To summarize, our analysis makes it possible to determine the impact of each variable on the model indicators (LCOE and exergy).
Results
We now present the main results of the SOBOL sensitivity analysis for the responses (LCOE and Exergy) of the D-CAES system, and a comparison between the analysis results of SOBOL and XGBoost.
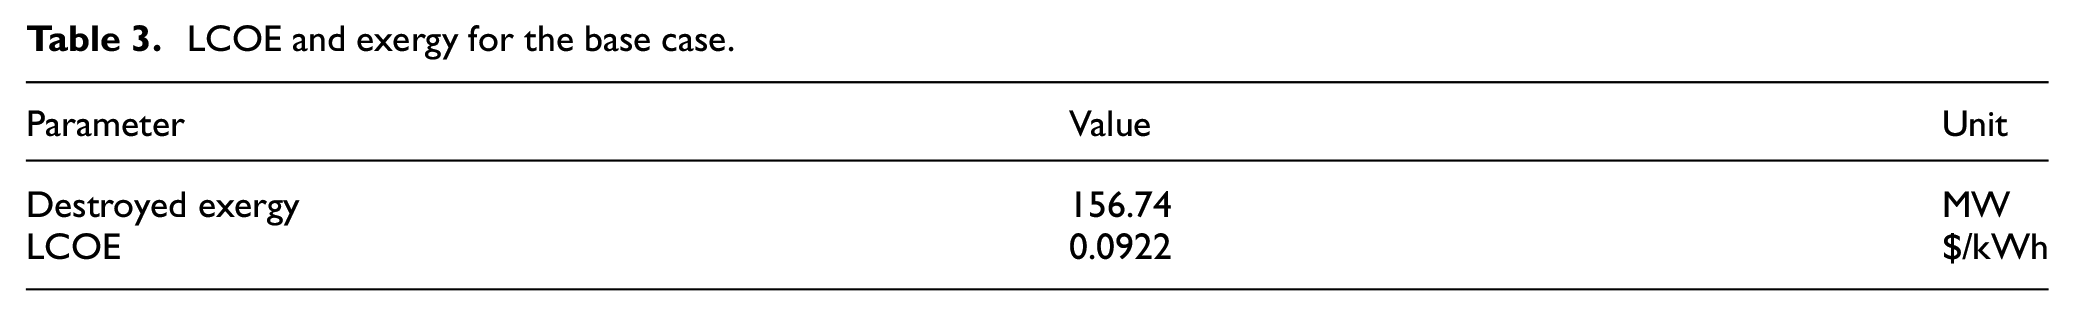
LCOE and exergy for base case
This section includes the results of the dry LCOE and Exergy for the conditions described in Table 2. The outlet hot product temperature of heat exchangers E-101, E-102, E-103, and E-104 (
LCOE and exergy for the base case.
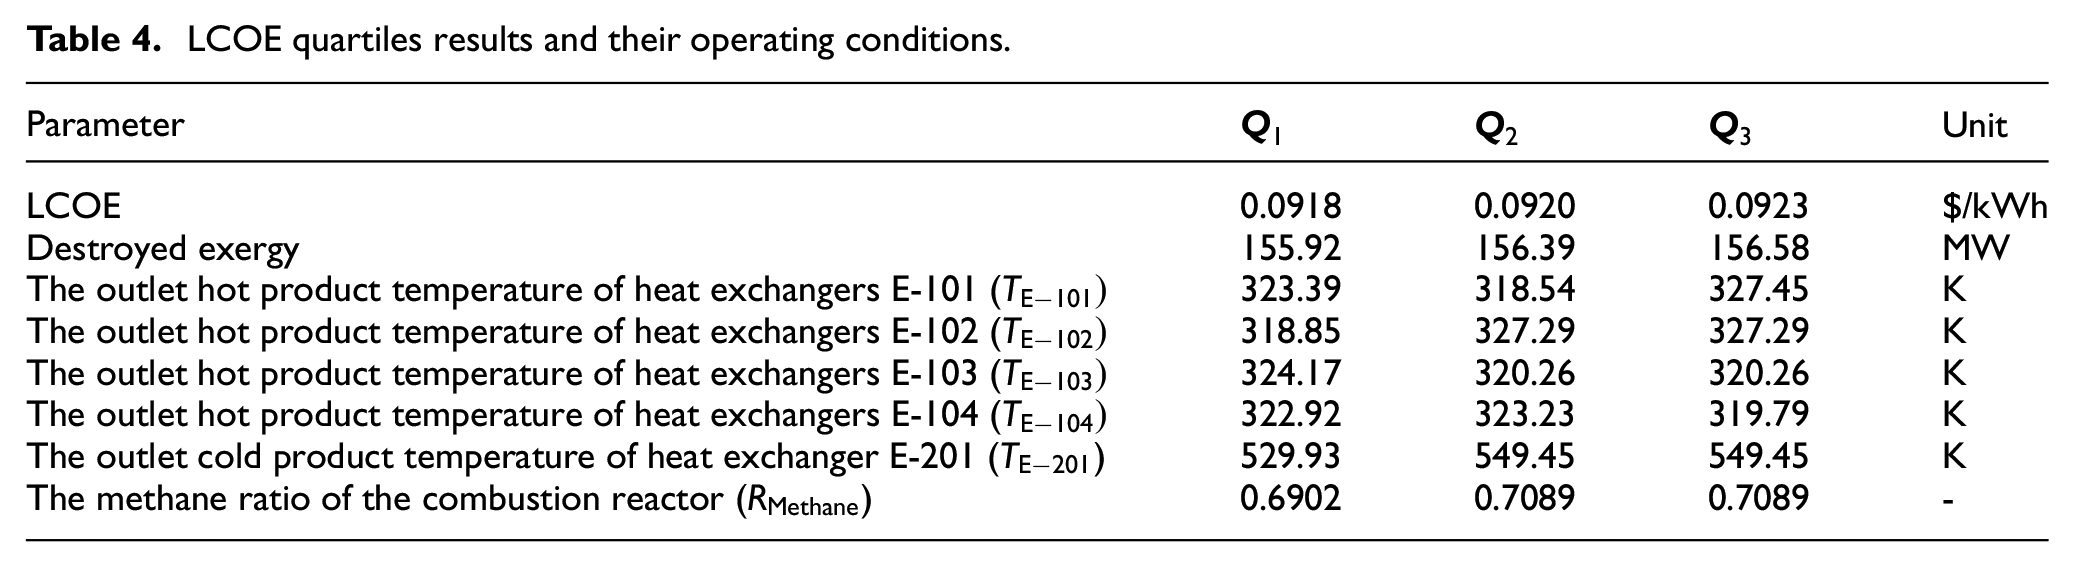
LCOE quartiles results and their operating conditions.
Sensitivity analysis for LCOE
Figure 4(a) shows the contribution of the input variables in the LCOE function, using a bar chart. The two output parameters arising from the SOBOL method are: (i) the first order sensitivity index (S1) depicted by blue bars and (ii) the total-order sensitivity index (ST) depicted by red bars. S1 indicates the influence or significance of a variable individually, thereby eliminating any effects or interactions between variables, while ST shows the combined, synergistic influence of variables, thus incorporating the effects between them. Our results show that three variables significantly influence the LCOE: the outlet hot product temperature of E-104, the outlet cold product temperature of E-201, and the methane ratio
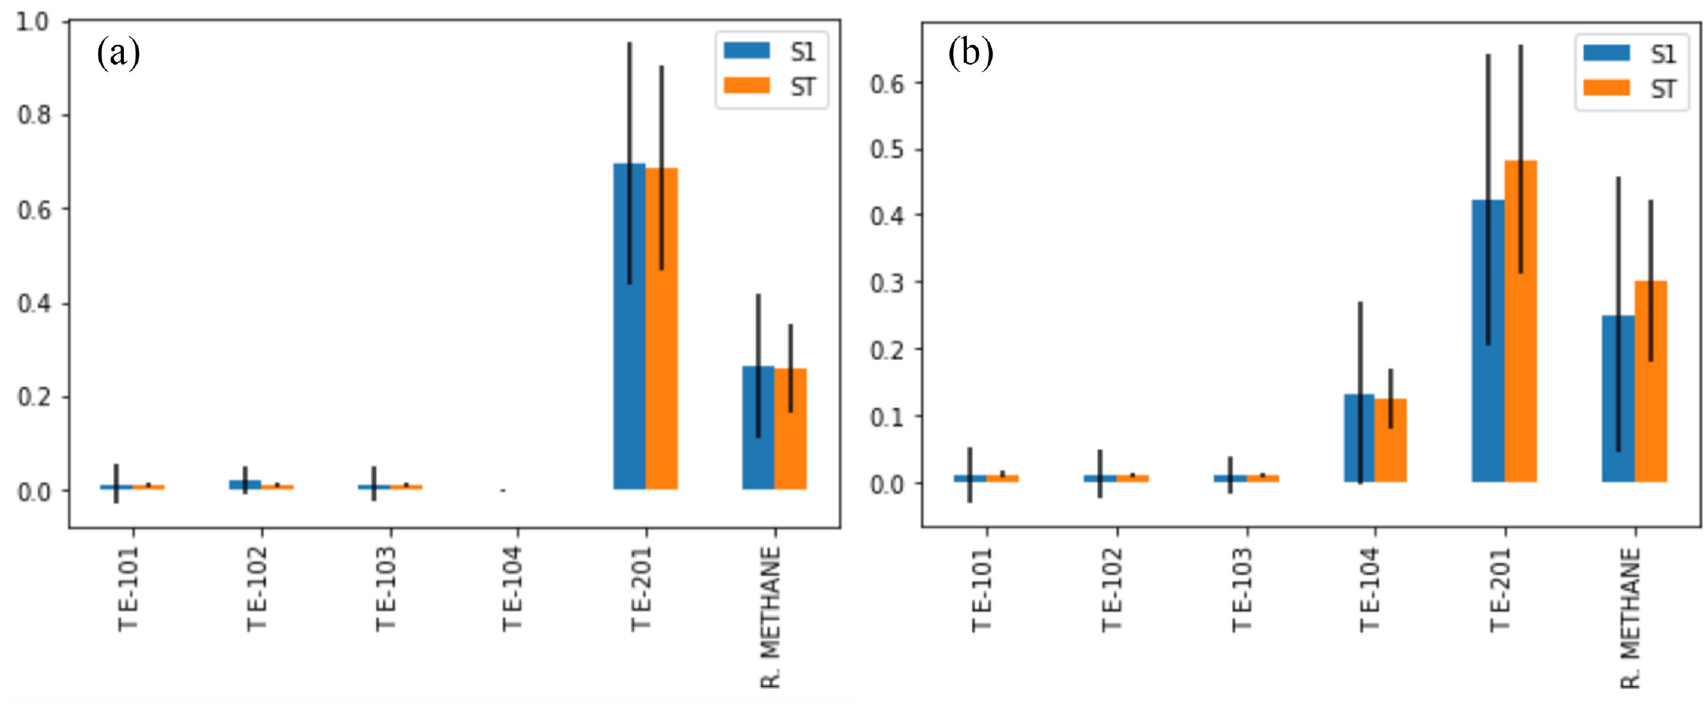
Impact of the six operational variables on model responses for: (a) the LCOE and (b) the destroyed exergy.
Sensitivity analysis for destroyed exergy
Figure 4(b) depicts that two variables greatly influence the destroyed exergy: these are the outlet cold product temperature for E-201, and the methane ratio
Comparison between the results of the SOBOL and XGBoost method
Figure 5(a) summarizes the contribution of the input variables in the LCOE function, by comparing results between the SOBOL method (yellow bars) and XGBoost (green bars). The results from both approaches are convergent, and indicate that the variables with the greatest impact toward the LCOE objective function are: the outlet product temperature of E-104, the outlet cold product temperature E-201, and the methane ratio
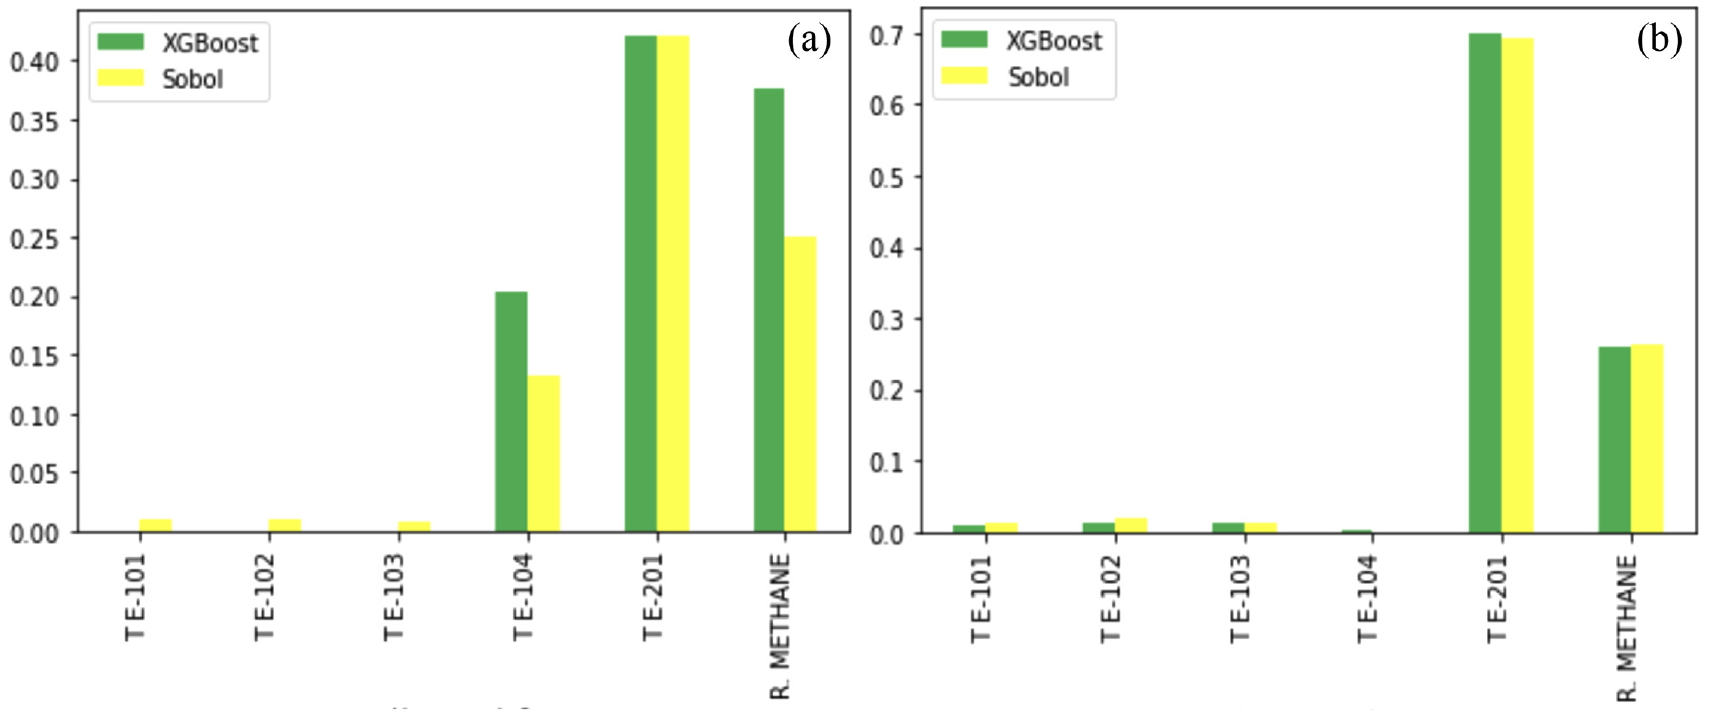
Comparison of the impact of the six operational variables between SOBOL and XGBoost: (a) the LCOE and (b) the destroyed exergy.
Conclusions
A detailed sensitivity analysis evaluation has been performed, which allows for exploring the influence between input variables and model responses. We studied a D-CAES system using SOBOL indices and Monte-Carlo simulations. These simulations were carried out by connecting Python and AVEVA PRO/II via the Python COM server. This integrated framework can handle different processes or phases of a process in AVEVA PRO/II in Python, possibly combining simulation results with appropriate scientific computing techniques. The main influential variables for this CAES system correspond to the outlet temperature of the cold product, that is, E-201, and the methane ratio (
Footnotes
Appendix A
Table of abbreviations.
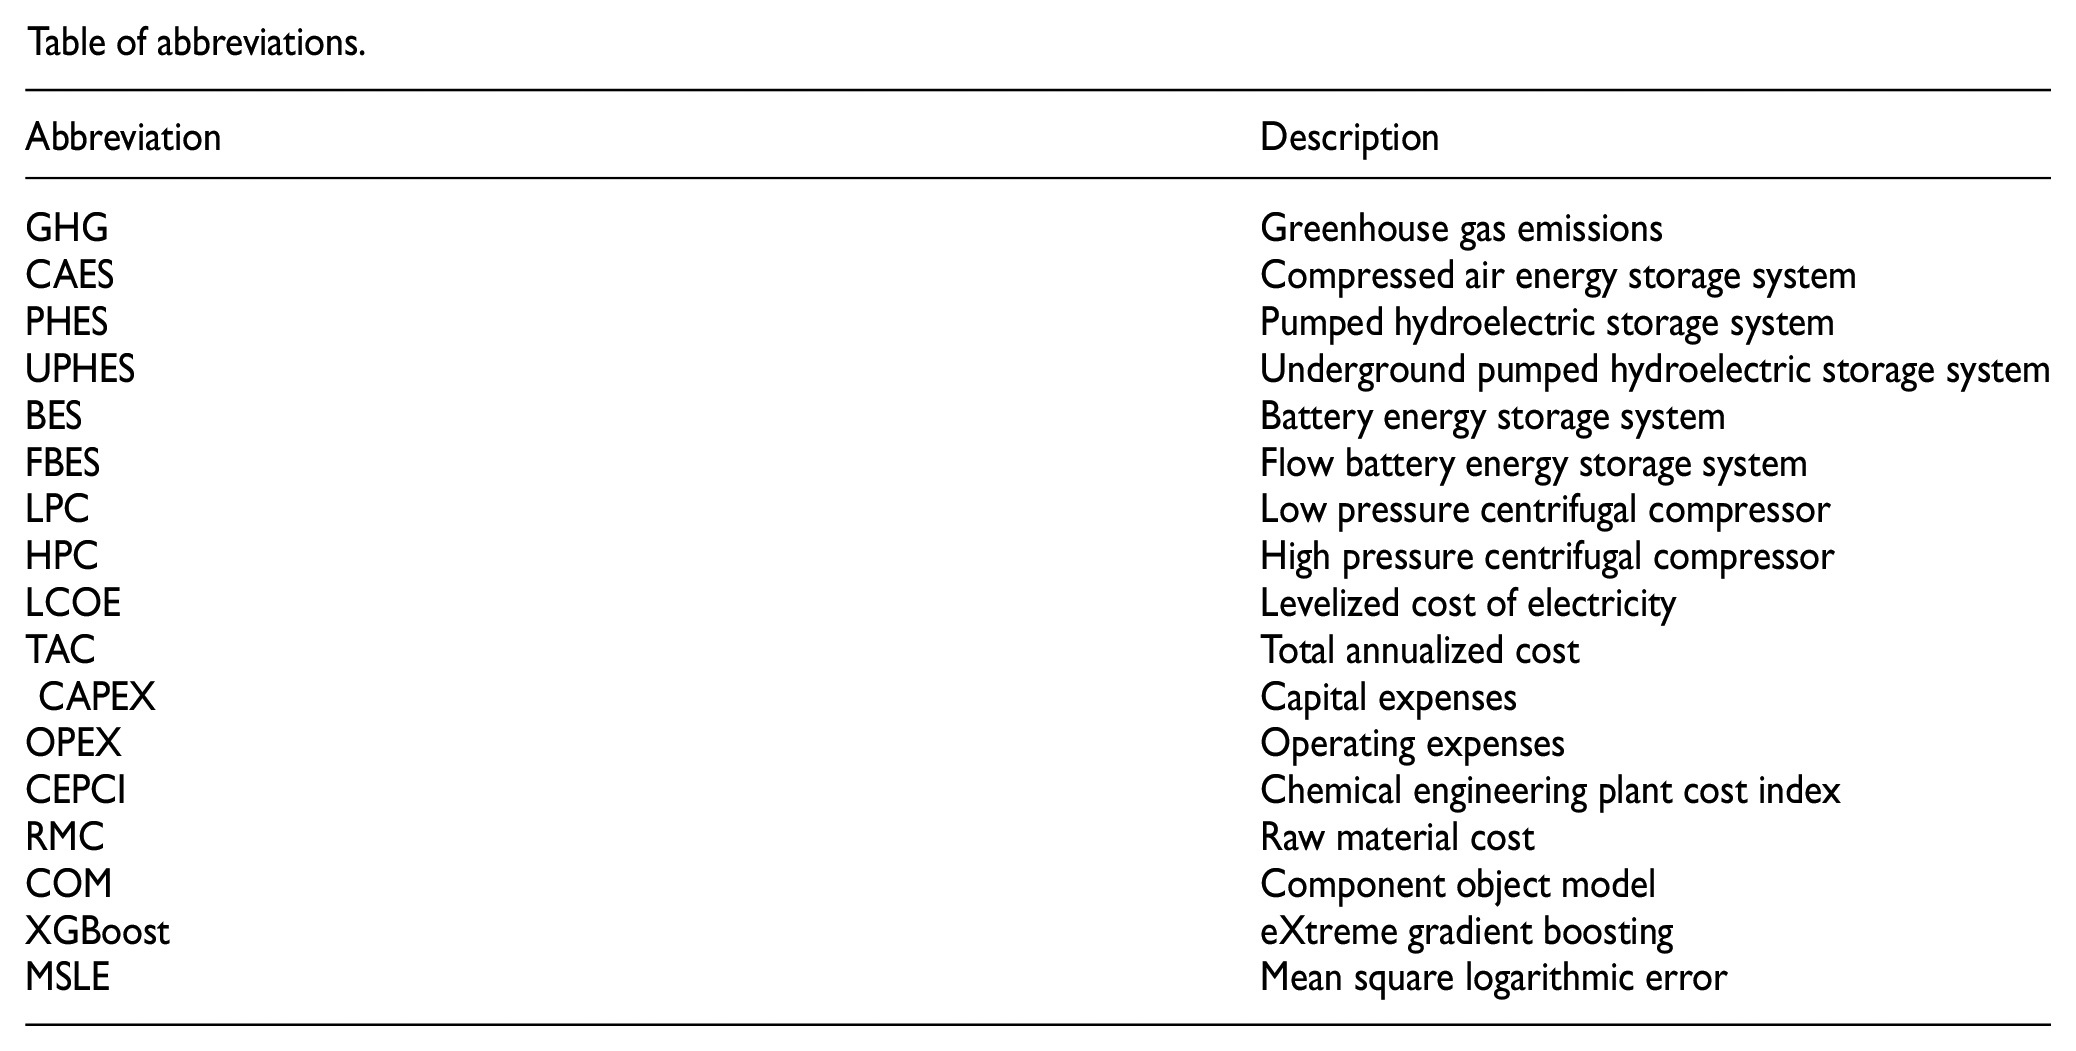
| Abbreviation | Description |
|---|---|
| GHG | Greenhouse gas emissions |
| CAES | Compressed air energy storage system |
| PHES | Pumped hydroelectric storage system |
| UPHES | Underground pumped hydroelectric storage system |
| BES | Battery energy storage system |
| FBES | Flow battery energy storage system |
| LPC | Low pressure centrifugal compressor |
| HPC | High pressure centrifugal compressor |
| LCOE | Levelized cost of electricity |
| TAC | Total annualized cost |
| CAPEX | Capital expenses |
| OPEX | Operating expenses |
| CEPCI | Chemical engineering plant cost index |
| RMC | Raw material cost |
| COM | Component object model |
| XGBoost | eXtreme gradient boosting |
| MSLE | Mean square logarithmic error |
Declaration of conflicting interests
The author(s) declared no potential conflicts of interest with respect to the research, authorship, and/or publication of this article.
Funding
The author(s) received no financial support for the research, authorship, and/or publication of this article.
ORCID iDs
Data availability
Data will be made available on request.