
Abstract
An unprecedented year has past with Covid-19 lockdown. It has underscored the importance of reliable and uninterrupted power supply. Microgrid ensures reliability and continuity of power supply in a local region with its own local generation and load despatch system, thereby reducing or eliminating the need of a central generator. A microgrid is capable of autonomous operation or it can be connected to a central ac grid that it separates from during disturbances. In this paper results of a microgrid simulation model is presented. Here microgrid system uses two renewable sources namely, solar PV and wind generator along with a battery feeding an inverter supplying load. The system is modeled and implemented using Matlab/simulink environment. The simulation model consists of mono-crystalline solar PV panel of 2.5 kW and a wind turbine emulator having PMDC as wind generator of 1 kW rating as micro sources. For stabilisation of the system a battery bank of 48 V, 100 Ah is also provided. The system is designed to supply a maximum load of 2.5 kW. The system autonomy is approximately two hours for rated load of 2.5 kW. Stability of the system was tested during load variations. The voltage and frequency were found to be stable during load variations. The performance of the inverter to provide constant output voltage of 400 V is good and the output frequency of the inverter is also maintained at 50 Hz. The output voltage conforms to IEC 60038 Standards. An energy management scheme is also developed and simulation results show effectiveness of the scheme.
Introduction
The world has been through a lot of difficulties during the last year with the outbreak of pandemic. Lockdown was imposed which drastically changed the lives of people all around in a short span of time. Uninterrupted and reliable power supply played the key role along with communication network in sustaining the world through these difficult times. Nothing works without power supply and communication network – which also need power supply to accomplish its task (Kumar, 2021). This has paved way to digitalization which is now irreversible. Changes have come in all walks of life like health care, marketing, business, communication, educational system, banking, social media, etc. (Abbas et al., 2019a, 2019b, 2019c; Abbasi et al., 2021a, 2021b, Hussain et al., 2019, 2021a, 2021b).
Main drawback of conventional sources is that they are exhaustive in nature, and not eco-friendly. So renewable power sources like solar, wind, geo-thermal, tidal, bio-mass, etc., are made use of to generate electricity. Non despatch-ability and dependence on climatic conditions are the main drawback of such resources. This creates serious problem of variation in voltage at the point of common coupling (PCC) due to power deficiency and surplus of power (Phuangpornpitak et al., 2013) Also there are issues in optimal operation of such hybrid power system (HPS) by meeting all system limitations and inconsistent characteristic of load requirement. A combination of voltage stabilization method, storage system, and optimization algorithm can assist to resolve these issues. Currently, a large amount of study is conducted in this field. The modeling of wind turbine, battery and solar panel has been done and a novel method based on fuzzy control is made use of for energy management and enhancement of battery life cycles is reported in Pecas et al. (2006). Paper (Amin and Mohammed, 2011) explained the implementation of wind power resource along with storage and control scheme i.e., energy management system (EMS) is made use of for levelling the power variations. The book (Sumathi et al., 2015) describes how to model solar panel, wind turbine and lead acid battery and new control strategy is used for power control of HPS using LabVIEW Software. Paper (Chacraborty et al., 2009) explains the modeling and optimal operation of grid connected renewable energy source (RES) along with storage device. Book (Camacho et al., 2013) discussed about modeling and controlling of each generating unit, VSC control and EMS for efficient energy management of HPS. Paper (Sumathi et al., 2015) presented the modeling of PV, Wind, Storage device and control technology used for maintaining dc bus voltage. Qin et al. (2015) presented the droop control and power control employed using VSC Control. For Optimal generation of PV, Wind and storage device a rule-based technology is implemented in paper (Mahmood et al., 2015). Studies based on particle swarm optimization (PSO) technique are conducted on VSC control for optimal operation and to maintain dc bus voltage (Rezk and Eltamaly, 2015). Paper (Kou et al., 2015) presented the VSC control and controlling of PV and storage system for efficient energy management in islanded mode. In papers (Pecas et al., 2006; Qin et al., 2015) modeling and control part is done and in papers (Mamatha et al., 2014; Pecas et al., 2006; Phuangpornpitak et al., 2013) EMS is implemented and simple model of battery is considered.
The power management strategy is designed so that both the fuel cell and the battery use the droop control approach to share the peak load, when the power available from the PV unit and the microturbine is inadequate to match the load (Mahmood et al., 2015). This might deplete the battery prematurely. Instead, it is recommended that the battery only be used during transients (Mahmood et al., 2015), and to supply the deficit power only after the load increases beyond the total capacity of the other generating units.
Sections that follows gives the design and implementation of individual blocks of the microgrid. The second section details the micro grid system description, addresses the solar PV source modelling and design and addresses wind energy conversion system. The third section details the inverter control logic. The fourth section discusses implementation of the overall system in simulation. The fifth section gives results and inferences. In the next section paper is concluded in the following section limitations of the work is mentioned and references is given at last.
Micro-grid system description
A microgrid presents quite a few merits over a conventional power supply constituting of central generation, long distance energy transmission over a network of high voltage lines, then distribution through medium voltage networks (Sumathi et al., 2015). It offers opportunities to tailor the quality of power delivered to meet the requirements of consumers. It also creates a more favourable environment for energy efficiency and small-scale renewable generation investments (Kumar et al. 2020a).
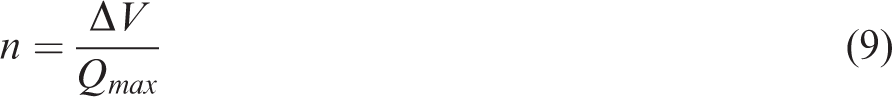
In this paper simulated results of a microgrid simulation model shown in Figure 1 is presented. The simulation model consists of mono-crystalline solar PV panel of 2.5 kW and a wind turbine emulator having PMDC as wind generator of 1 kW rating as micro sources. For stabilisation of the system a battery bank of 48 V, 100 Ah is also provided. The system is designed to supply a maximum load of 2.5 kW. The system autonomy is approximately two hours for rated load of 2.5 kW. The design of each component is given in detail in the sections to follow.
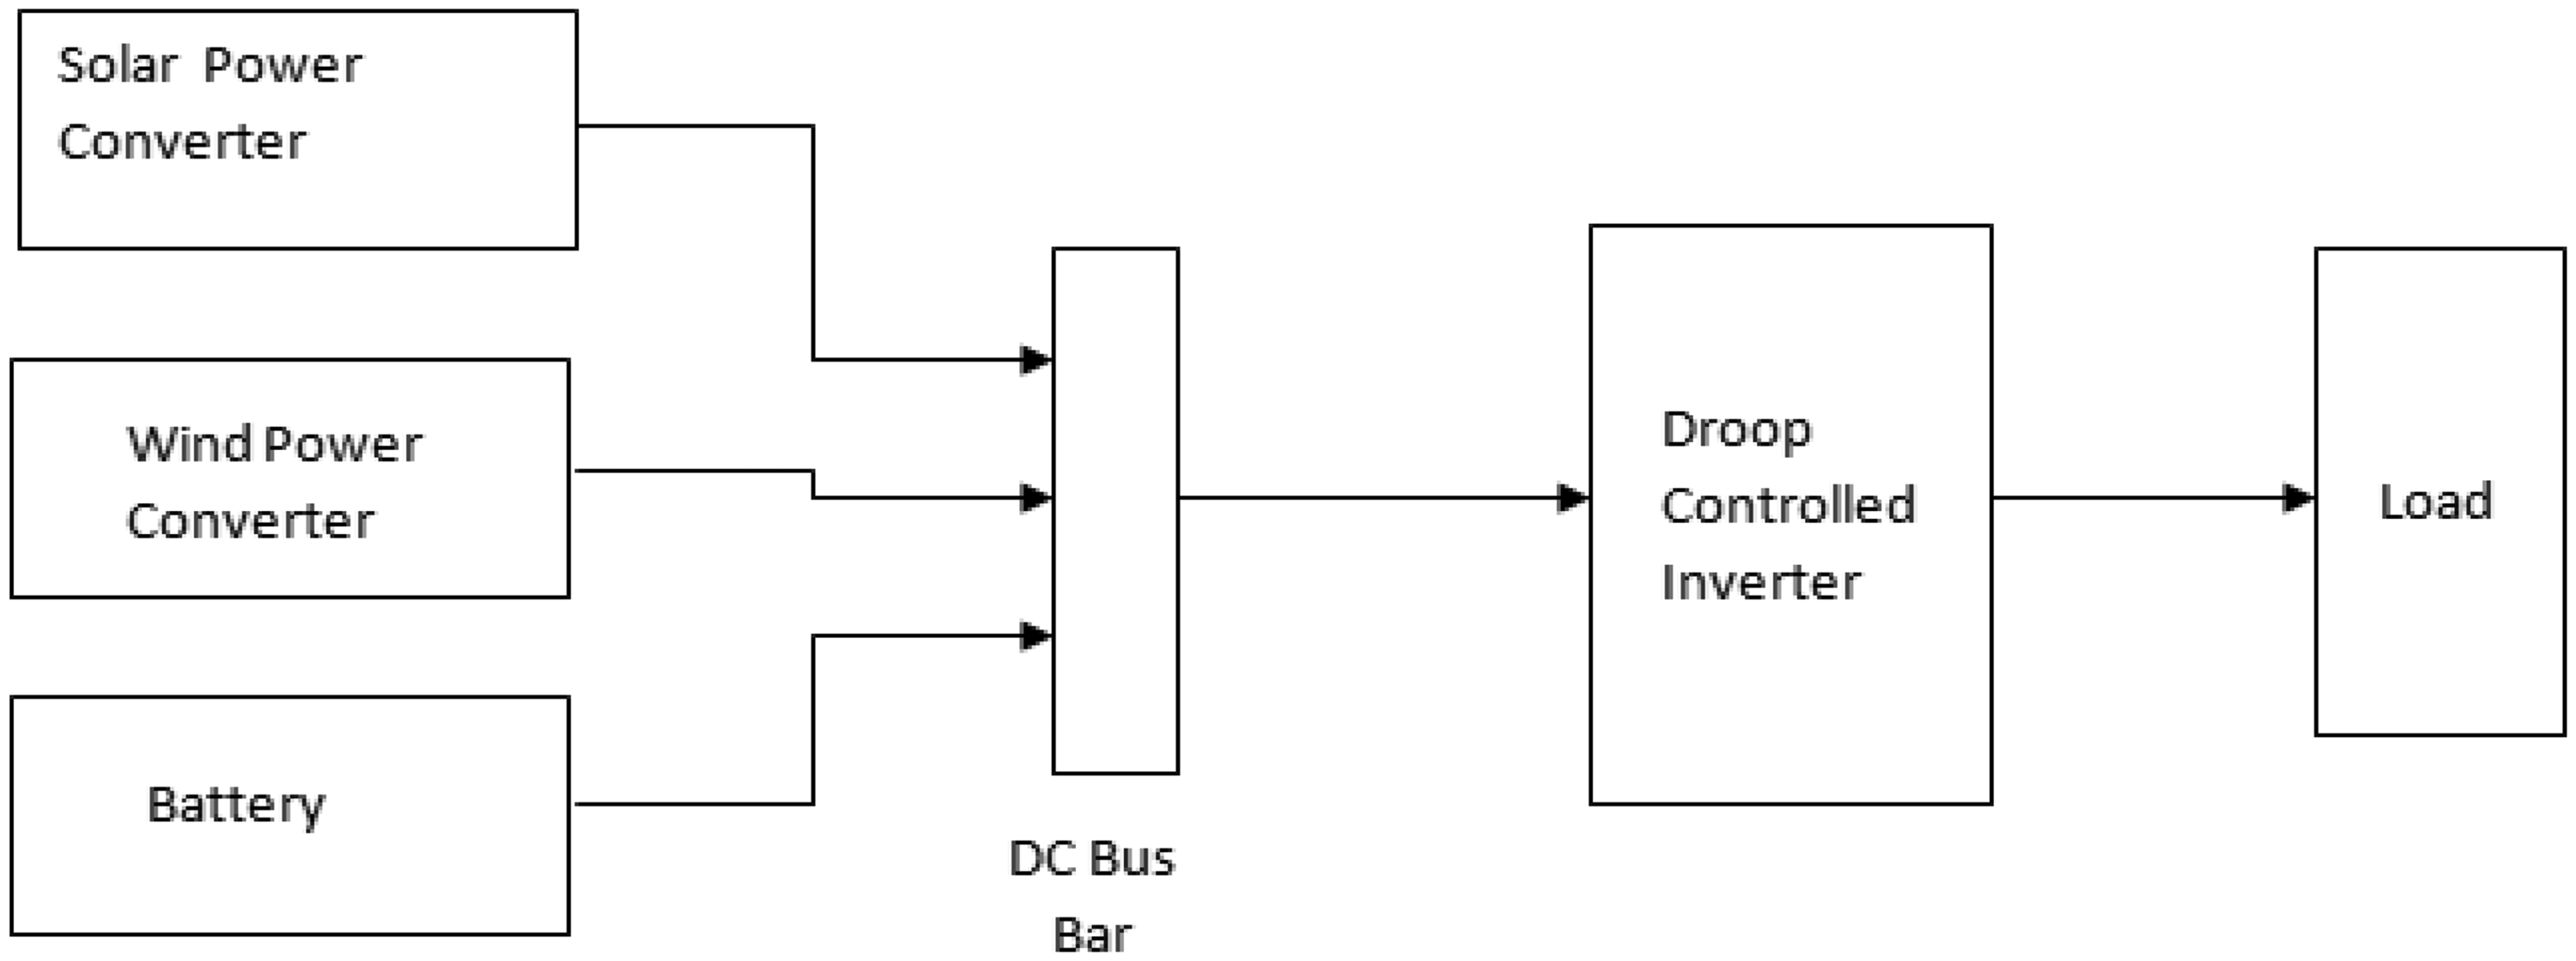
System block diagram.
In recent years, a large number of techniques have been proposed for tracking the maximum power point (MPP) (Pecas et al., 2006; Phuangpornpitak et al., 2013; Sumathi et al., 2015). Hill climbing and perturb and observe (P&O) methods are widely applied in the MPPT controllers due to their simplicity and easy implementation. Incremental conductance (INC) method, which is based on the fact that the slope of the PV array power versus voltage curve is zero at the MPP, has been proposed to improve the tracking accuracy and dynamic performance under rapidly varying conditions (Rezk and Eltamaly, 2015). The INC MPTT algorithm usually uses a fixed iteration step size, which is determined by the accuracy and tracking speed requirement. Thus, the corresponding design should satisfactorily address the trade off between the dynamics and steady state oscillations. To solve these problems, a modified INC MPPT with variable step size is used in this paper (Liu et at., 2008). The step size is automatically tuned according to the inherent PV array characteristics. If the operating point is far from MPP, it increases the step size which enables a fast tracking ability. If the operating point is near to the MPP, the step size becomes very small that the oscillation is well reduced contributing to a higher efficiency. In (Liu et al., 2008), the design principle of the modified variable step size INC MPPT is presented on the basis of uniform irradiance for PV array.
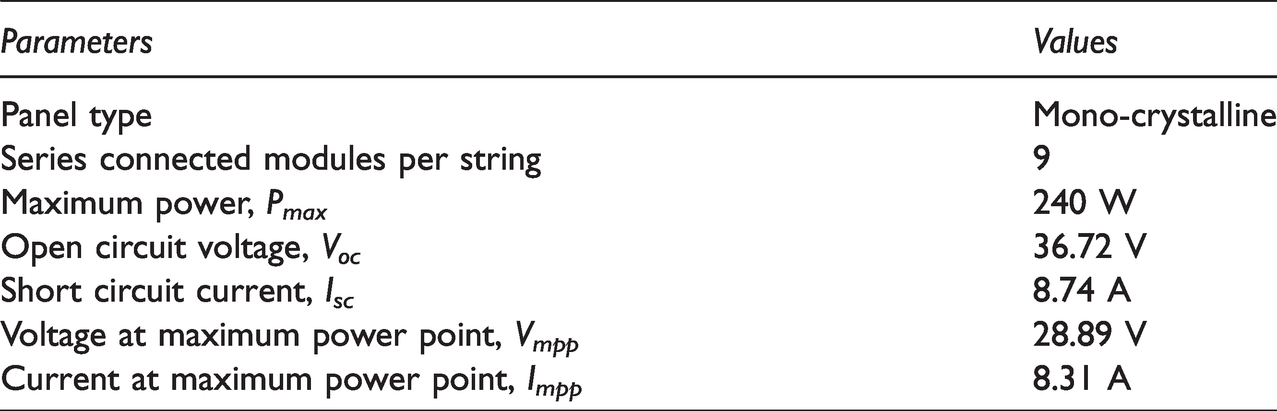
A 2.5 kW Solar PV system is simulated in MATLAB/Simulink. The specifications of the Solar panel are given in Table 1. To design 2.5 kW PV system nine modules are connected in series to form a string. The available power from solar PV system depends on irradiation and temperature. The maximum power can be extracted from solar PV system by operating the panels output to match the load means that changing the level of operating voltage and current (Kumar et al., 2020b).
Specifications of solar panel.
The DC-DC boost converter is used for feeding the power to inverter (Kumar et al., 2020a). In the circuit, the switch is ON during the period, t ≥ TON ≥ 0, the ON period being TON. The output voltage is zero if no battery (back emf) is connected in series with the load. The current from the source (is) flows in the inductance L. The value of current increases linearly with time in this interval, with (di/dt) being positive (Uma siva Jyothi et al., 2013). The equation corresponding to the ON mode is

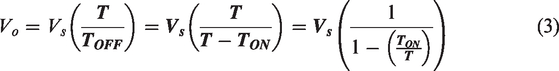
The switch, S is put OFF during the period, T ≥ t ≥ TON, the OFF period being TOFF = T – TON is the time period. As the current through L decreases, with its direction being in the same direction as shown (same as in the earlier case), the induced emf reverses, the left hand side of L being negative. So, the induced emf (taken as –ve in the equation given later) is added with the supply voltage, being of the same polarity, thus, keeping the current (iS = iO) in the same direction.
The equation corresponding to OFF mode is
Therefore the average value of the output voltage is

The inductance and capacitance values are calculated by using Table 2

Required parameters to calculate boost inductance.
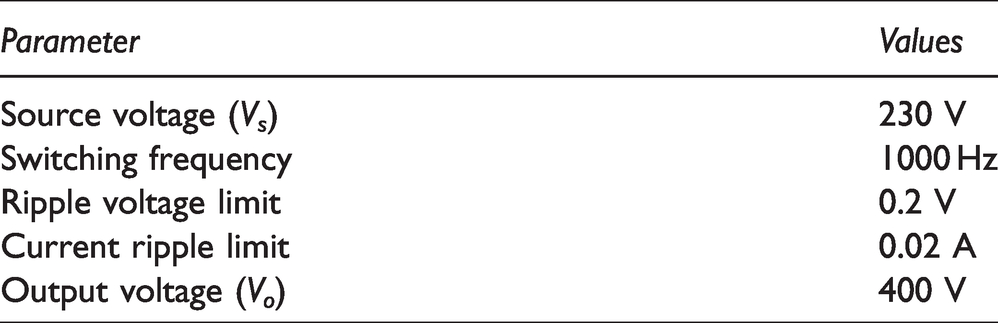
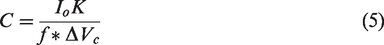
From the equations (4) and (5) the obtained Inductance and capacitance values are L = 1.091 mH and C = 9.4 µF with permissible change in current ΔI value of 10% output current Io, permissible change in voltage value of 10% of output voltage Vo.
Many research and development in wind energy conversion system (WECS) have shown their excellent potential for remote areas located so far from power stations and distribution networks which are uneconomical to install (Tan and Panda, 2011; Mesemanolis et al., 2013; Babu et al., 2018; Kim et al., 2015). A practical approach for stand-alone power generation is to use a variable speed PMDC driven wind turbine to create an autonomous system. PMDCs are used widely in stand-alone WECS because of its advantages: higher reliability, less maintenance and more effectiveness (Mohod and Aware, 2011; Saleh and Ahshan, 2012; Singh and Singh, 2012). Besides, it is suitable for variable speed operation, which provides 10–15% higher energy output, lower mechanical stress and less power fluctuation compared with constant speed operation. A system of variable speed PMDC wind turbine has more flexibility because it can adapt wind variations (Chan et al., 2004; Amin et al., 2011; Rupesh and Kulkarni, 2015; Babu et al., 2018).
The simulation model Permanent Magnet DC Machine is having name plate rating of 1 kW, 120 V, and 500 r/min. The PMDC generator is capable of generating power at variable speed inputs. It also generates at low wind speed. Since the generated voltage is DC it can be converted to AC through an inverter. In order to make the DC voltages compactable for producing 440 V AC supply, the input DC voltage is level shifted using a DC to DC converter.
Droop controlled inverter for voltage and frequency stability
Droop concept is used to control the voltage source inverter to balance the load and generation during autonomous mode of operation. In the Microgrid, the droop control strategy simulates the droop characteristics of traditional power system, by changing the output of active and reactive power to control the frequency and amplitude of the output voltage, so that Microgrid system can work on stabilize voltage point in island operation mode (Song and Nam, 1999; Bejvl et al., 2013). During islanded operation, when the unbalance of active power and reactive power occur, the frequency and voltage will fluctuate. As a result, the Microgrid will experience a blackout without any effective controller. If the system is transferred to the islanded mode when importing power from the grid, then the generation needs to increase power to balance power in the islanded mode (Qin et al., 2015).
The frequency droop characteristics and voltage droop characteristics are shown in Figures 2 and 3, respectively.
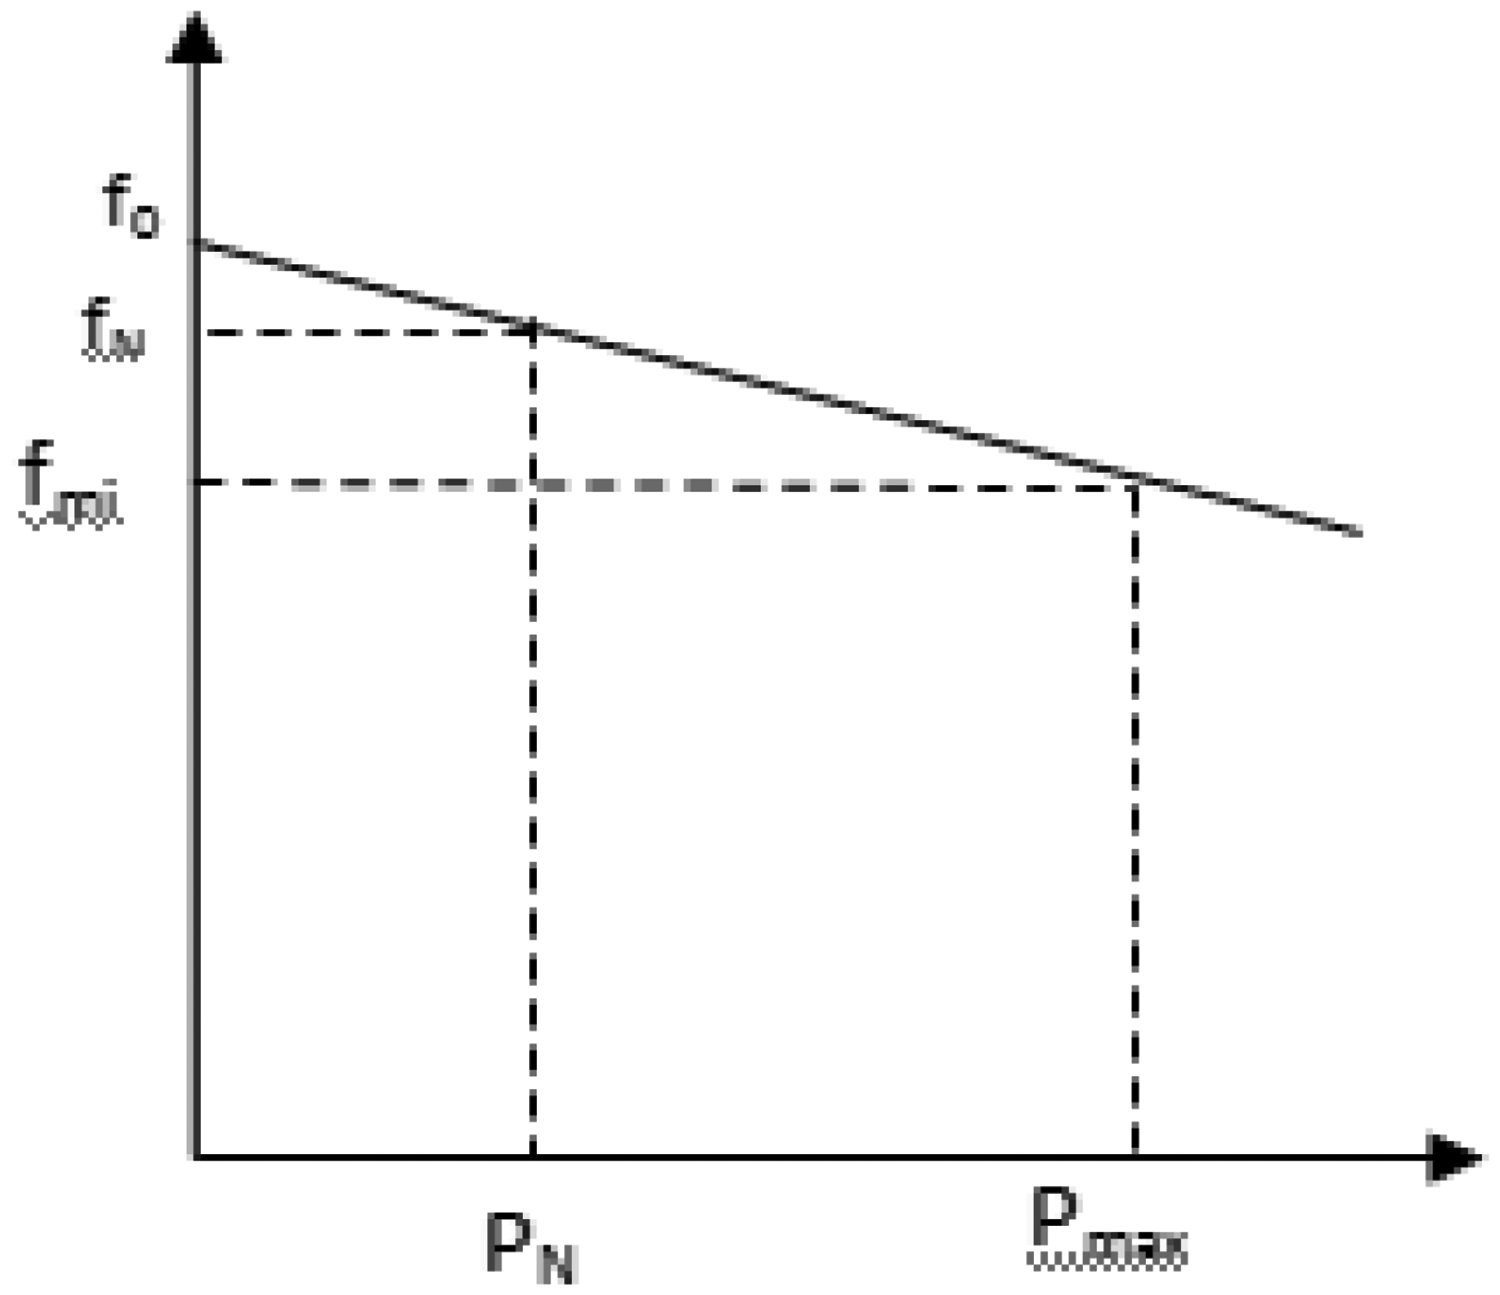
Frequency droop characteristics.
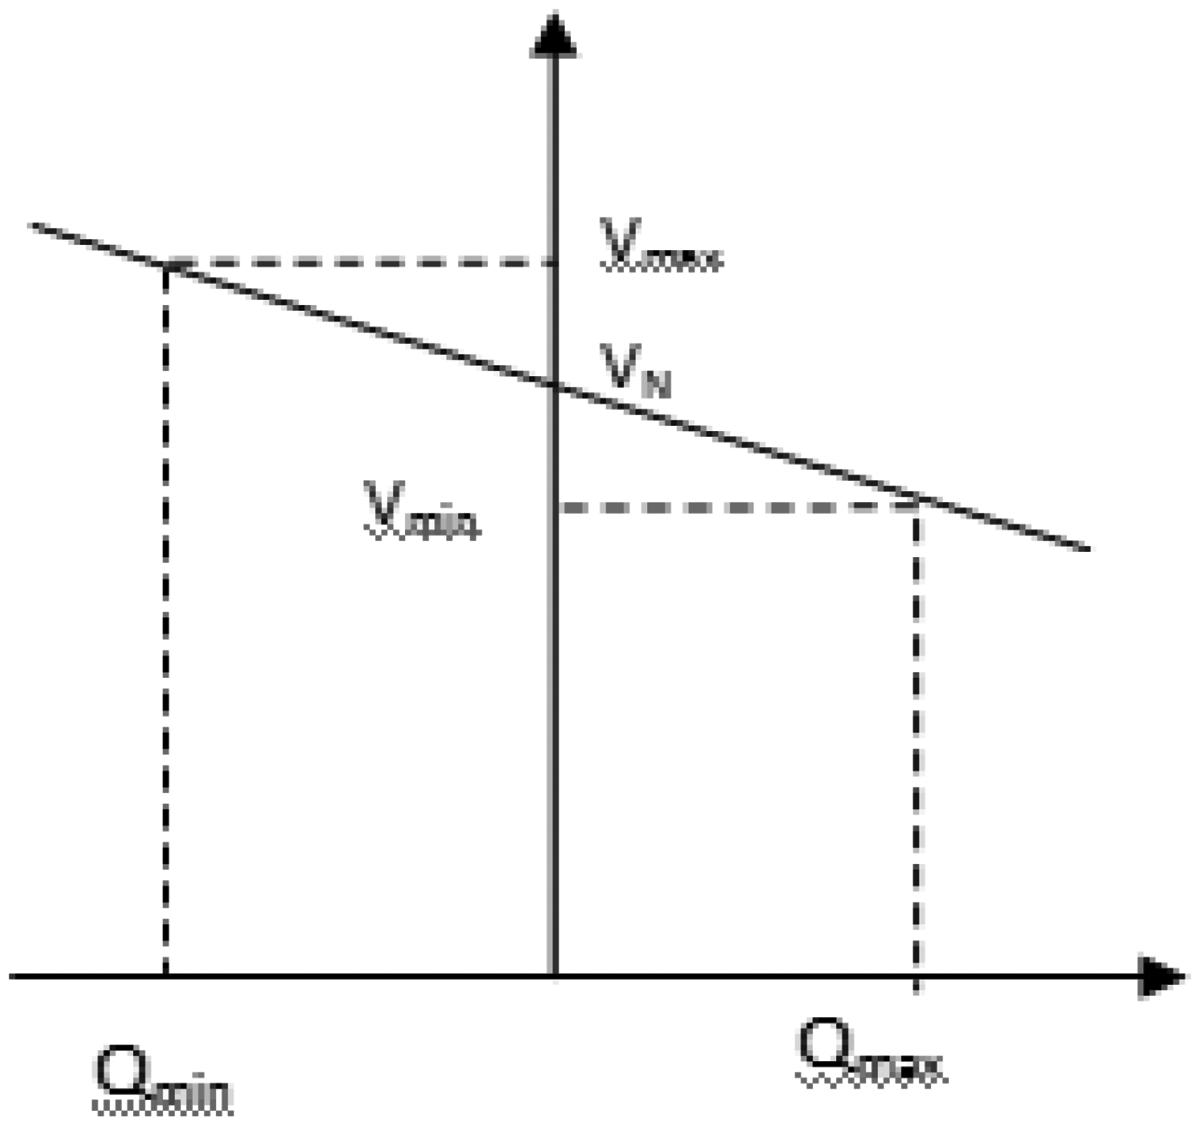
Voltage droop characteristics.
In Figure 2, f0 denotes the no-load frequency, fN denotes the nominal frequency and fmin is the minimum frequency. PN is the nominal active power output and Pmax is the maximum power output. In Figure 3, Vmax and Vmin denote the maximum and minimum voltage of the system respectively. VN denotes the rated voltage. Qmin and Qmax denote the minimum and maximum output reactive powers.
The active and reactive powers are calculated from the three phase AC voltage and current quantities. Using the actual active and reactive power issued by the inverter, and the reference active and reactive power, the output reference value of voltage and frequency is calculated. The output reference values of voltage and frequency can be calculated using the following equation

In equation (6), 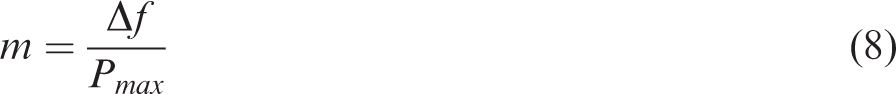
In equation (8),
This control loop usually consists of two control units one is voltage control and the second is current control. If the grid is operating with stiff voltage then there is no need for voltage regulation. If the grid is weak and the voltage stiffness is low then voltage regulation is needed and this is critical for high quality power injection. Most of the Microgrids based on renewable energy sources have low voltage stiffness, therefore they need voltage regulation. Similarly, a current controller is responsible for the characteristics of injected current. It is highly desirable that inverter current should be free from low order harmonics.
Voltage control loop can be used in two conditions, when the voltage regulation is needed in a grid connected mode where the grid has low voltage stiffness. Secondly, in an autonomous mode where the Distributed Generation (DG) units are connected near the sensitive loads and high voltage quality is needed. In autonomous mode, power quality is also determined by the inverter output voltage (Camacho et al., 2013; Chakraborty et al., 2009). There should be low total harmonic distortion under different load conditions because harmonic distortion in current due to non-linear load can easily affect the output voltage of the inverter. There should be fast recovery in case of load variation and disturbances in networks with low voltage dip.
The current control loop is responsible for injecting current. In Voltage Source Inverter (VSI) based DG units current control units are applied with high bandwidth to have accurate current tracking normally 10 times higher bandwidth than voltage control unit and also to have fast dynamic response as much as possible. Recent investigations have shown that small disturbances in voltage can increase THD level in injected current which can lead inverter system to instability. So the current control loop should be fully capable to deal with disturbances (Mahmood et al., 2015).
The output of the voltage and current control loop gives the reference modulating signal. The three phase modulating signal generated is compared with the triangular carrier signal. When the modulating signal is greater than the carrier signal, Insulated Gate Bipolar Transistor (IGBT) conducts. When the modulating signal is less than the carrier signal, IGBT turns off. The generated pulses are given to the inverter to trigger the switches.
This section discussed the methodology used for the proposed microgrid system to stabilize the voltage and frequency during autonomous mode of operation. The block diagram of droop control technique was discussed in detail.
Overall simulation block diagram of microgrid
Solar and wind based micro grid system is simulated. It consists of battery unit for power backup. Solar and wind are connected with the boost converter. Boost converter connected with the solar is controlled using variable step incremental conductance MPPT to attain maximum power from PV and also to get constant voltage for load. Variable step incremental conductance MPPT decides the duty ratio of boost converter with the input variables of voltage and current. Boost converter connected with the Wind is controlled using PI controller. Battery charging is done through buck converter fed from DC bus. Battery discharging occurs through boost converter.
Solar, wind and battery are connected to DC bus which supplies three phase inverter. Three phase inverter is designed with droop control. Based on the load demand and available renewable energy solar, wind or both supplies load are decided by source selector. When renewable energy can’t meet the load battery discharging is activated. When renewable energy is greater than load battery charging is activated. When renewable energy and battery are insufficient to meet the load grid is connected to the load mean time battery charging is also activated.
In the block diagram given in Figure 4 all the three possible sources are first modelled and the power generated is conditioned to give a constant dc output which is connected to the common bus bar feeding power to the droop controlled inverter. There are four converter connected to the dc bus bar namely solar converter, wind converter, battery discharge converter, and battery charging converter.
Overall system block diagram.
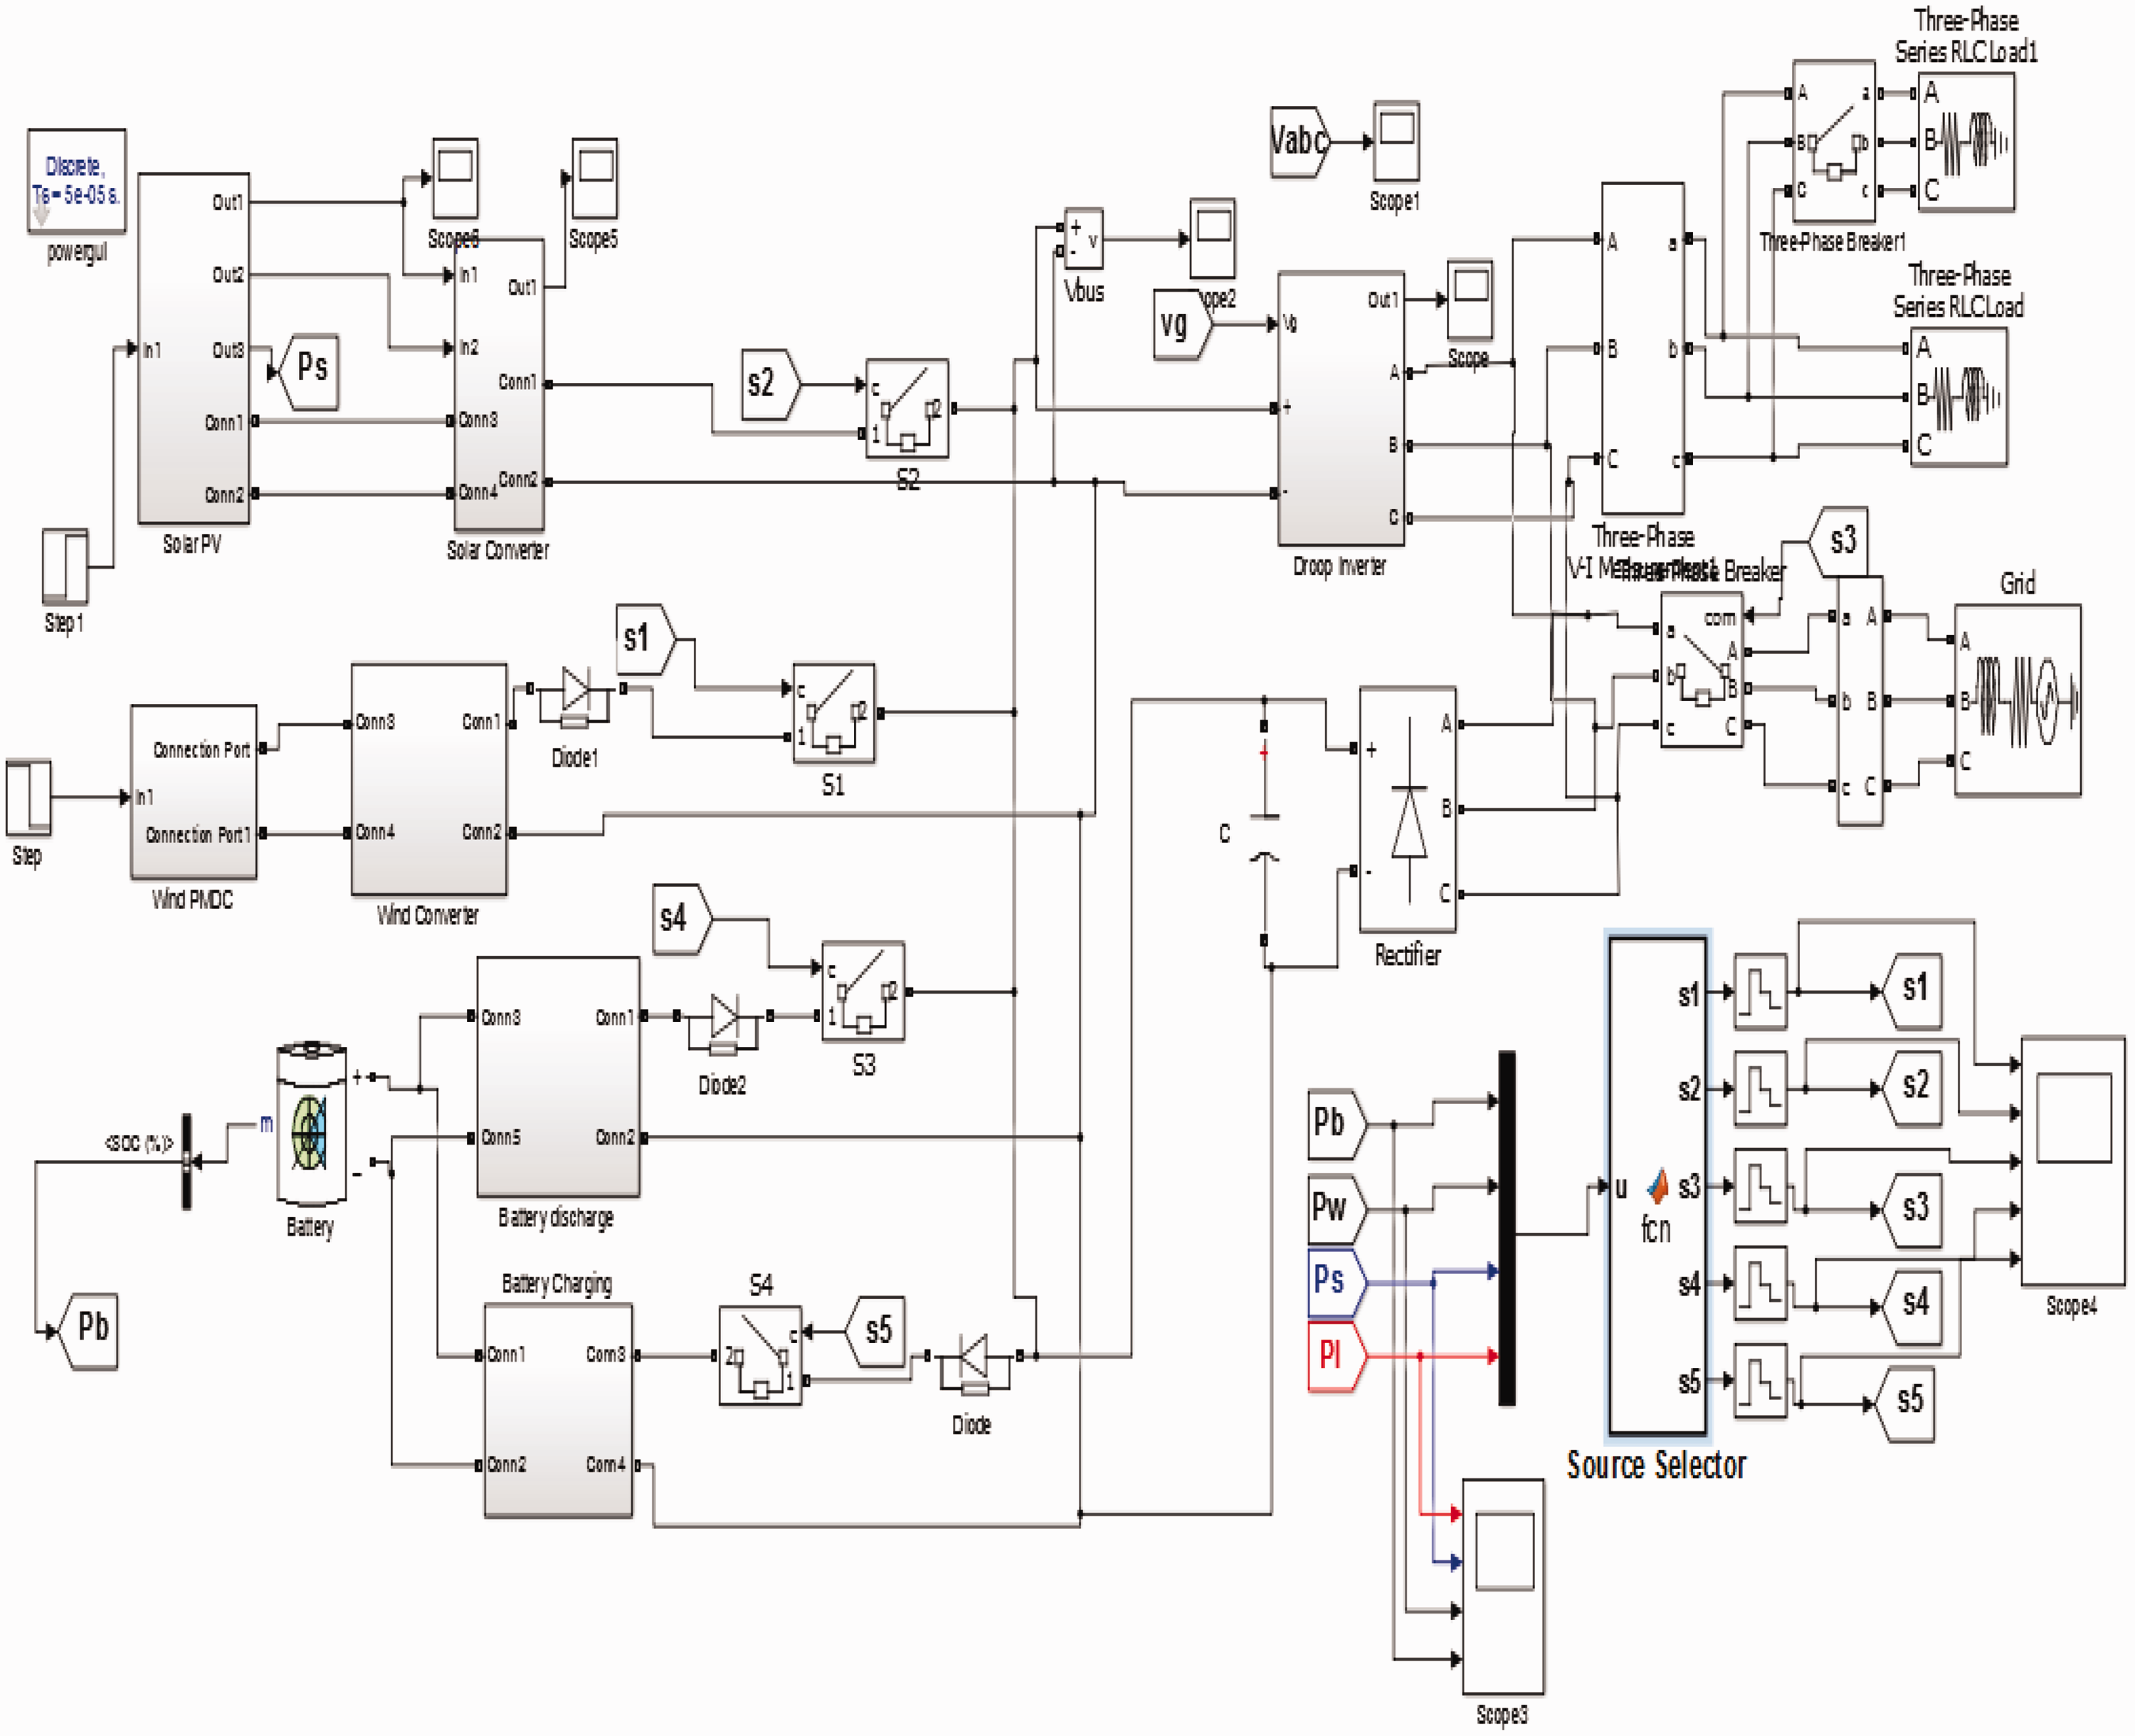
Solar converter in Figure 5 includes boost converter with the variable step incremental conductance method to extract the maximum power from the solar panel. The input to the solar converter is obtained from solar PV array. The model design and explanation is given in “Micro-grid system description” section.
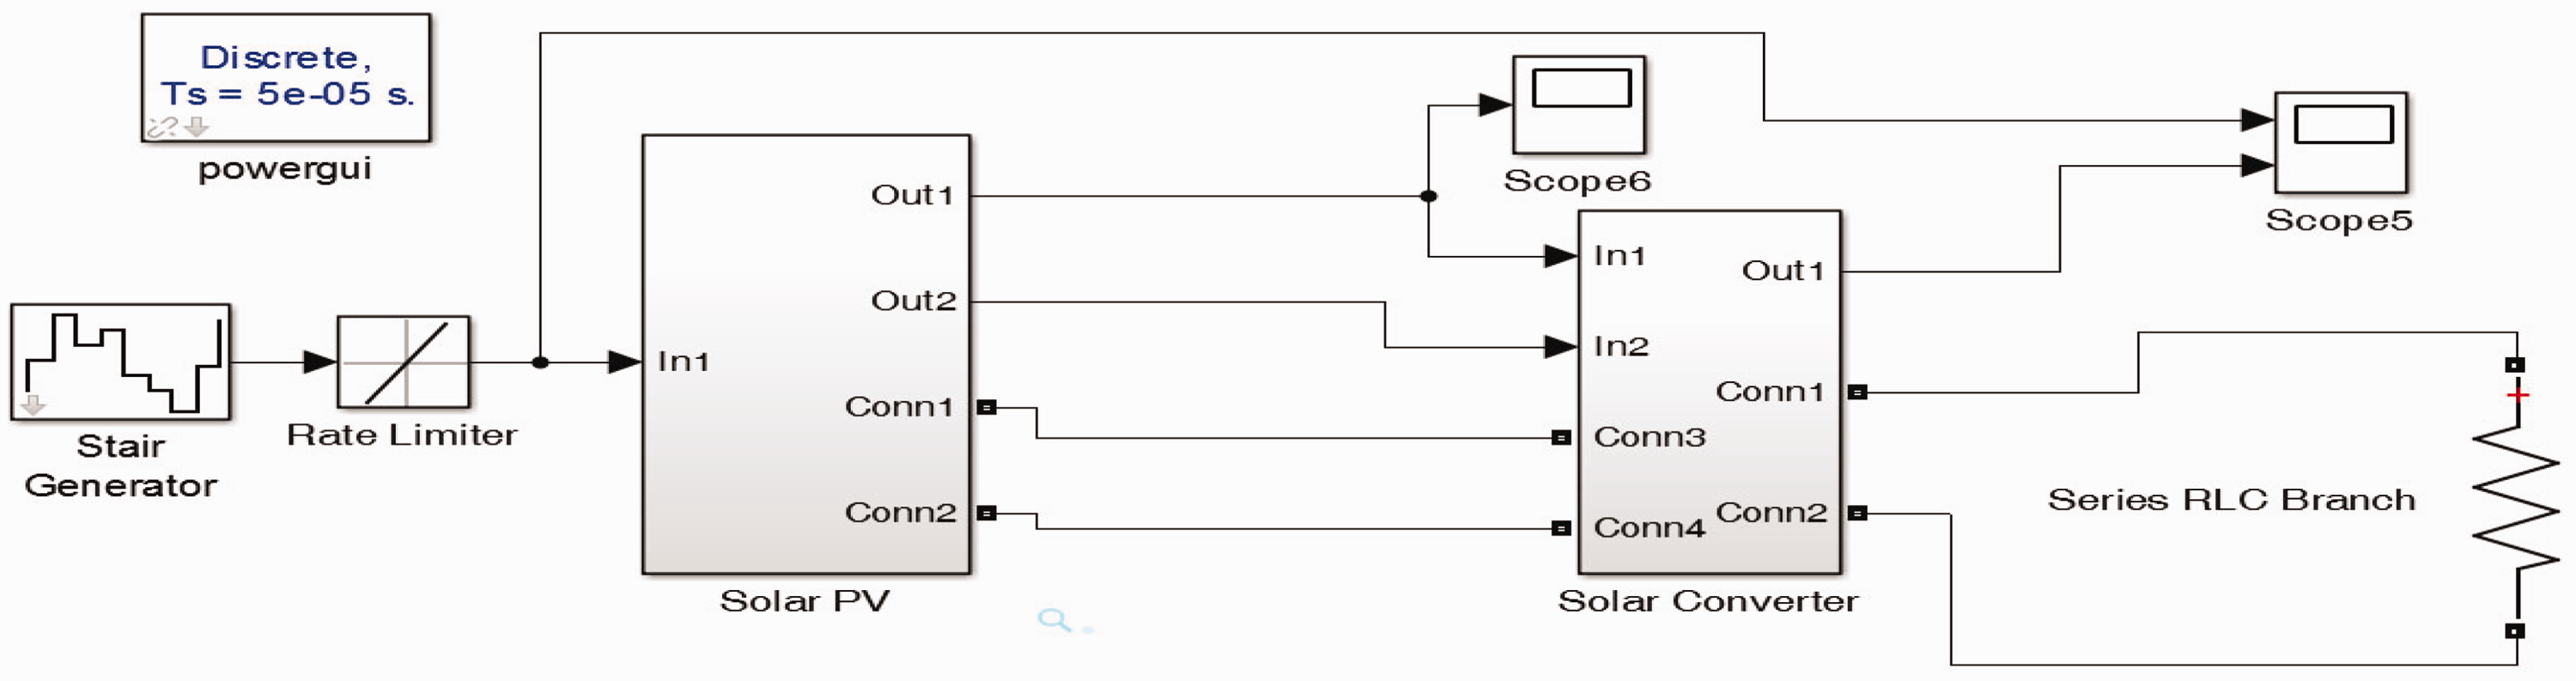
Solar PV simulation block diagram.
The response of wind energy system is slower to the solar system owing to inertia of machine it takes 0.5 s to provide a stabile power output for change in input torque. The wind converter block diagram in Figure 6 also includes a boost converter having PI controller to provide a constant dc to the dc bus bar. The input to the wind converter is obtained from PMDC generator. The modelling and explanation for wind converter is given in “Droop controlled inverter for voltage and frequency stability” section.
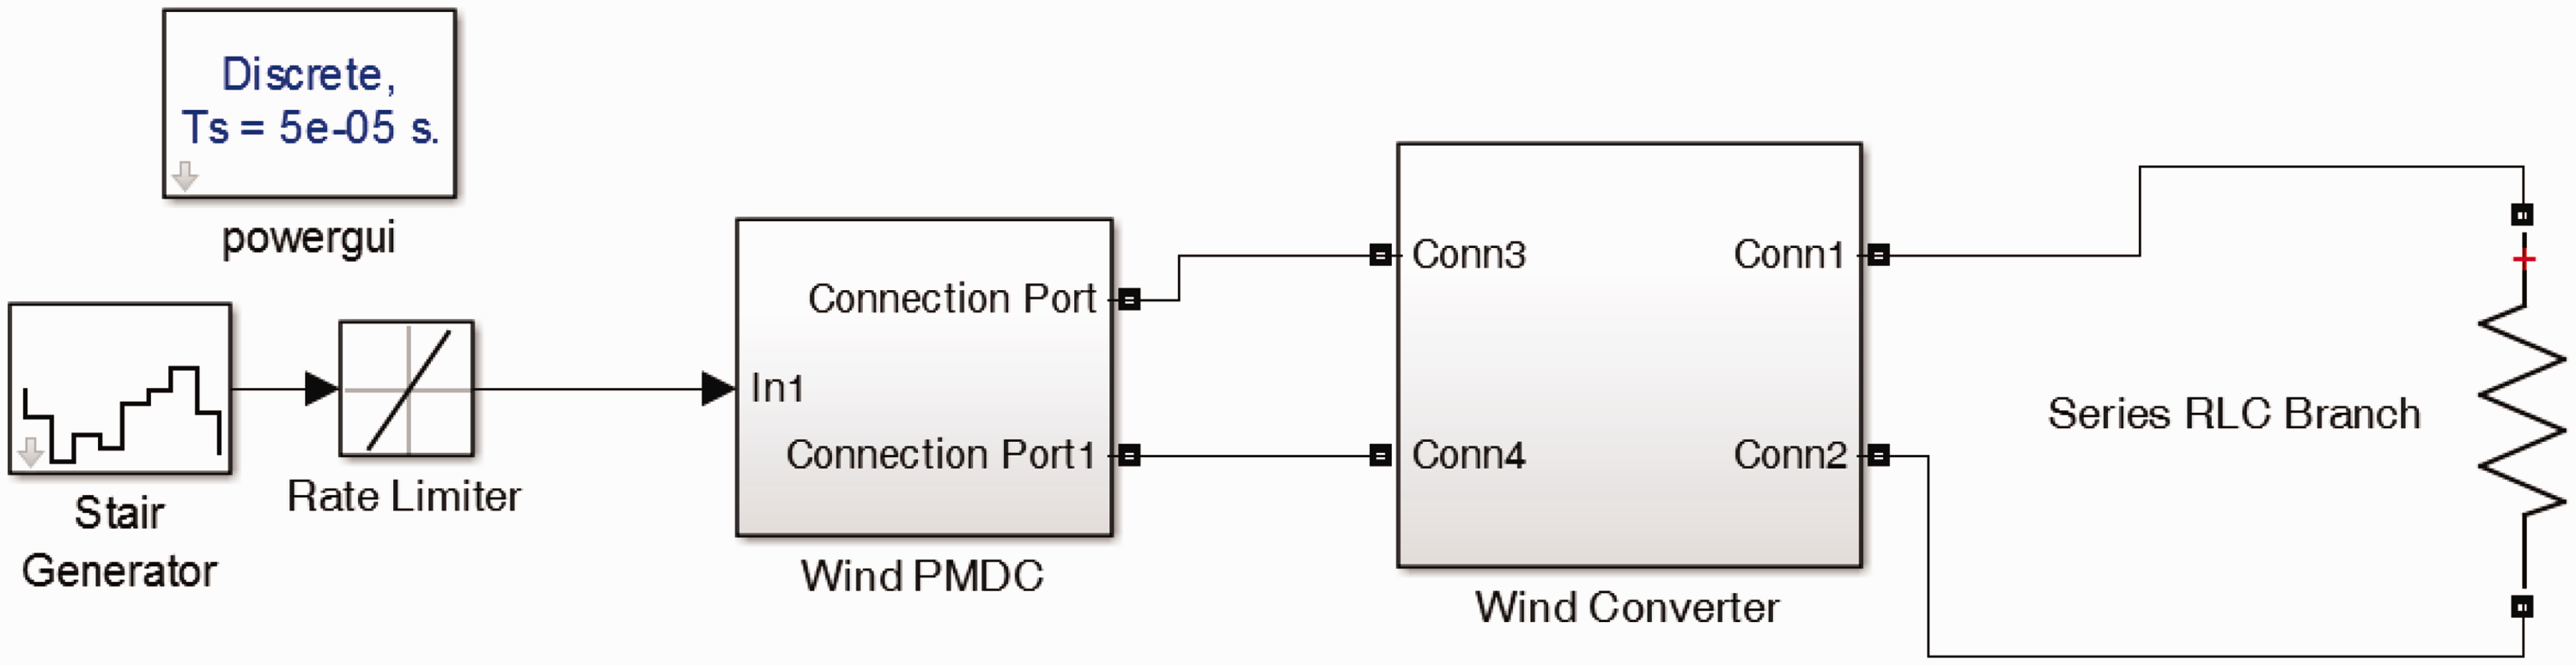
PMDC wind energy conversion system.
For battery charging and discharging as shown in Figure 7 two separate converters are used. When the renewable power is more than sufficient to meet the load the excess power can be used to charge the battery. When the renewable power is lower than the load demand the battery is discharged. The battery is charged by buck converter and is discharged by boost converter.
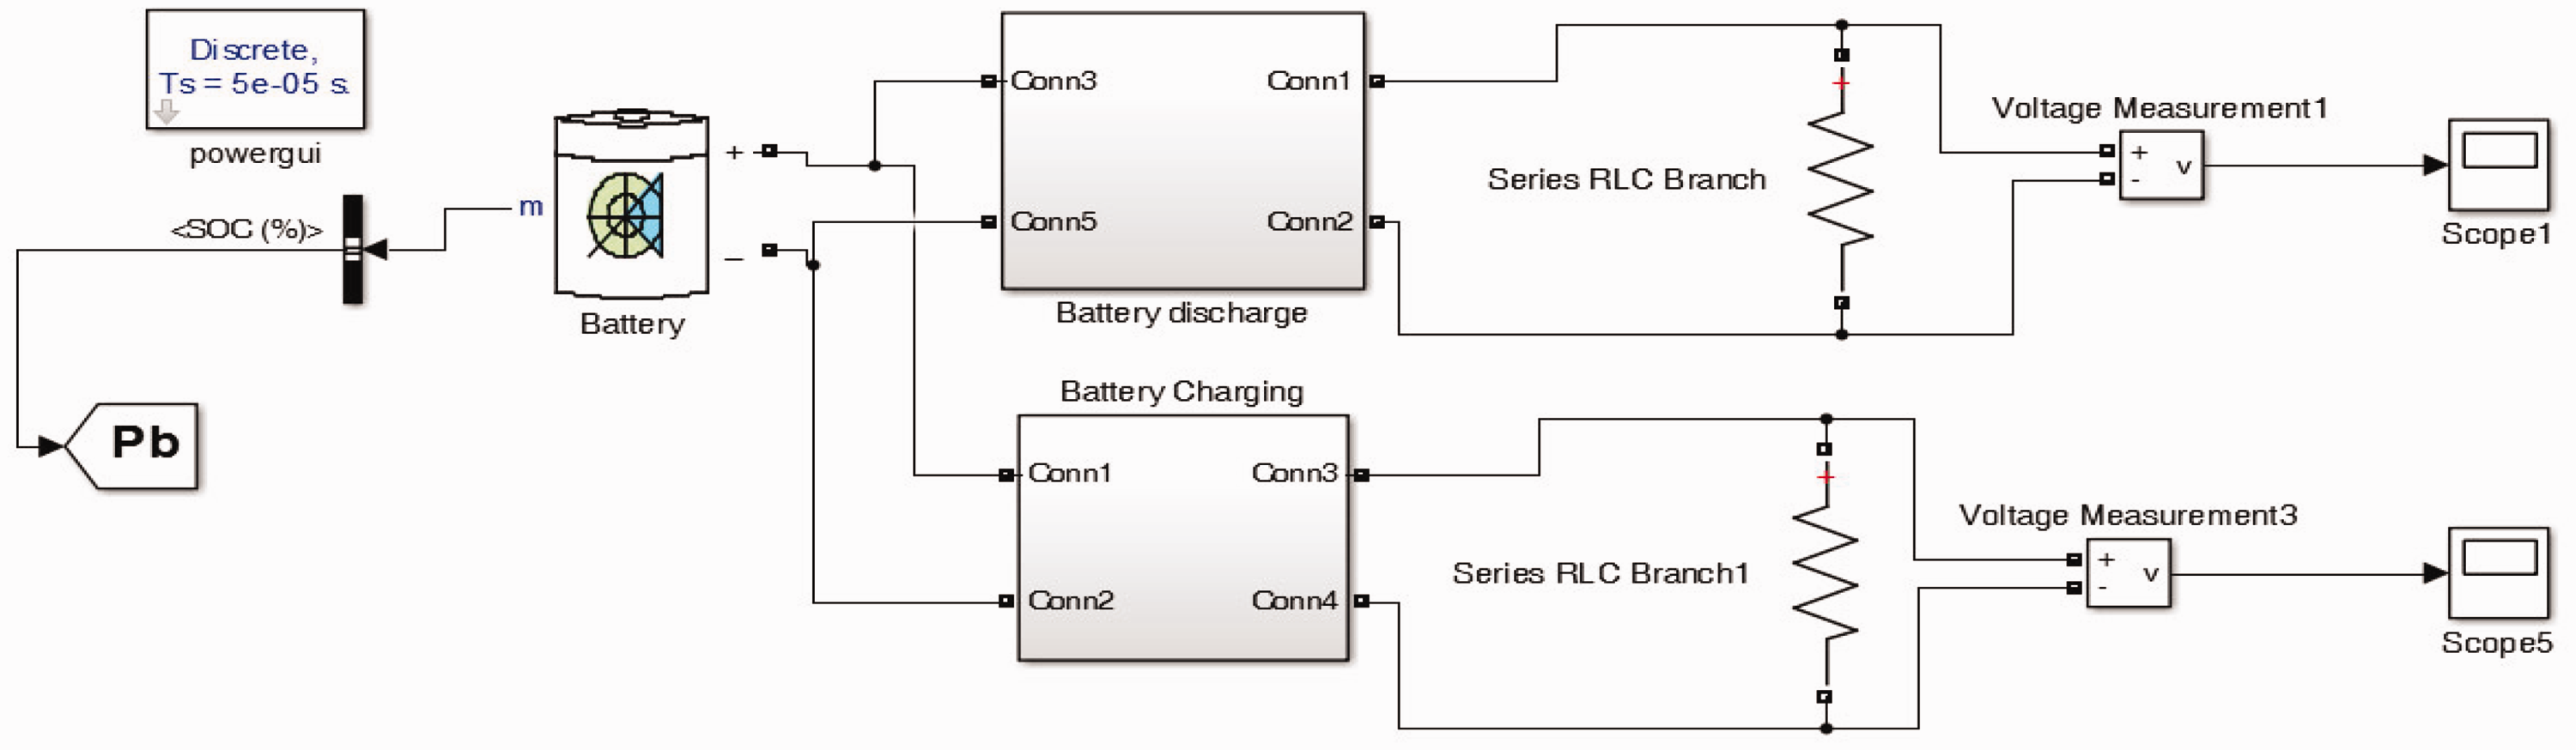
Battery charging/discharging arrangement.
In the overall block diagram this block is represented as source selector. The role of this block is to switch in or out the various renewable sources according to the power availability and load demand. In real life scenario if a source selection is made when both solar and wind are available the priority is given to wind power due to the fact that there are over voltage issues associated with wind generators at no load, where as there are no such issues associated with solar on no load. But in this simulation since solar form major source for the load and gives stability to the system, solar power is given priority.
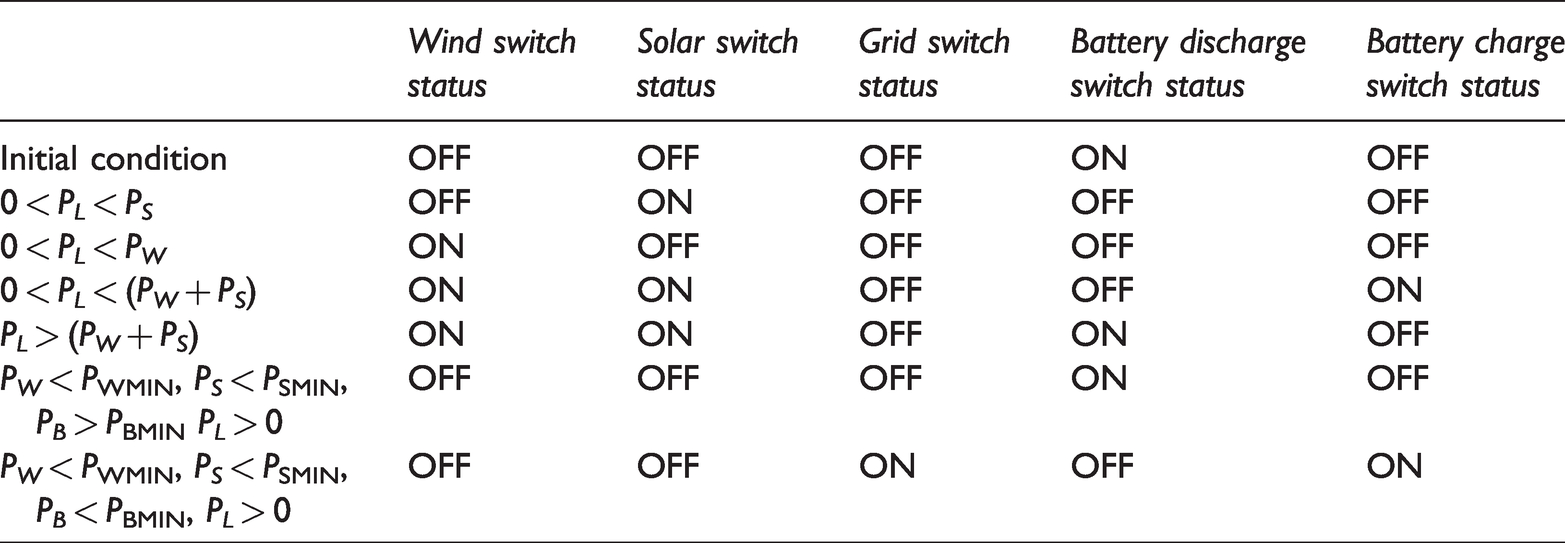
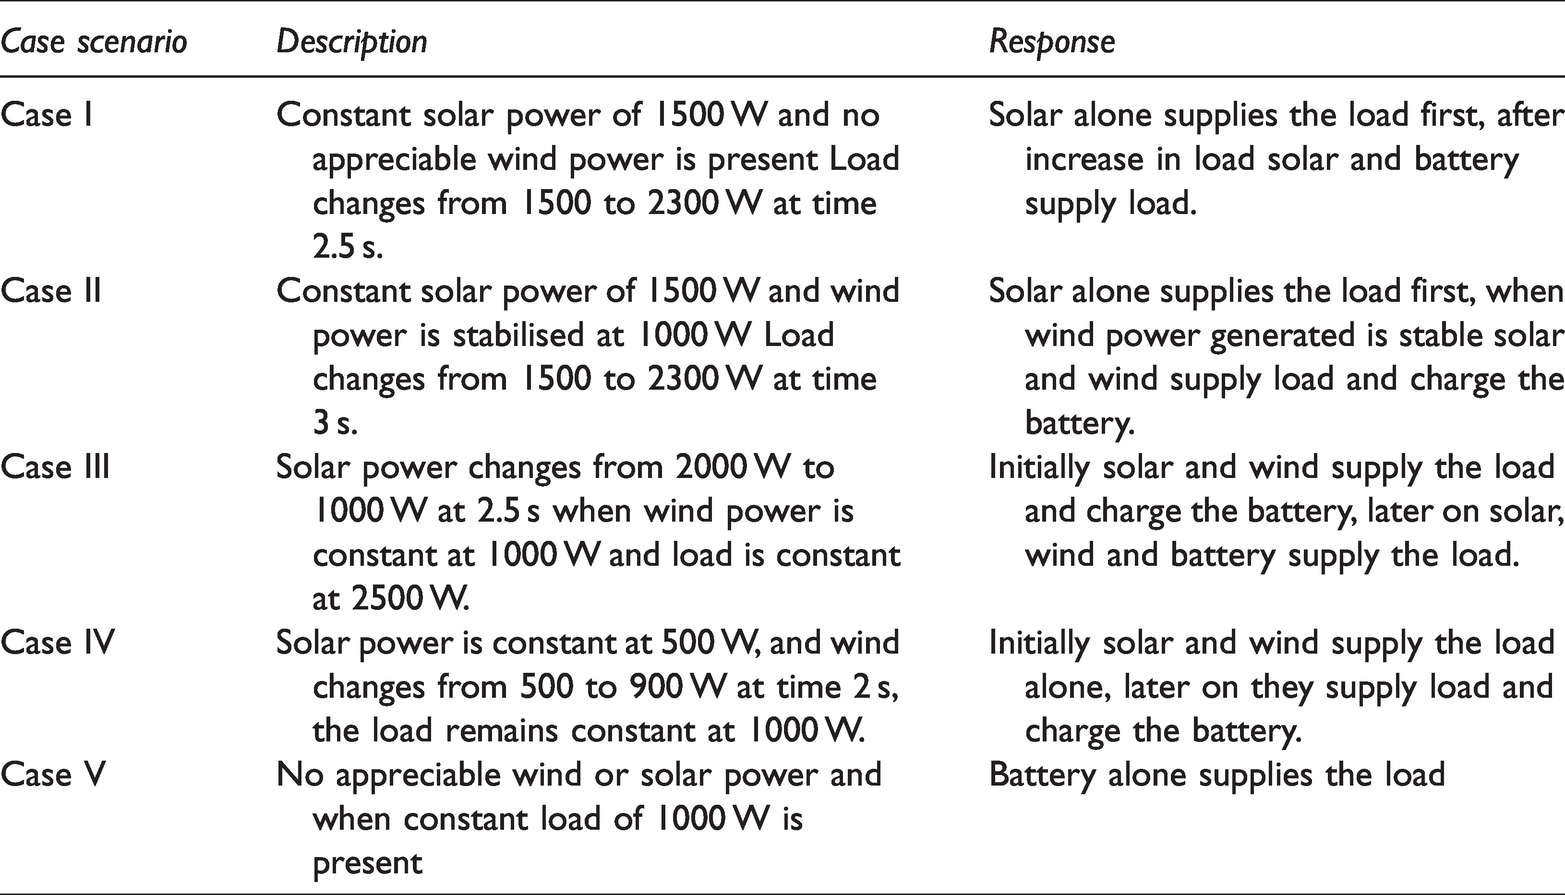
The overall system is initially started with battery power. Table 3 gives the switch status of the system under different source and load conditions. If the renewable power is sufficient to meet the load then the switches are turned on accordingly. If it is more than load demand then the battery is put to charging mode according to its state of charge. If the renewable are not sufficient enough to meet the load then battery is used to support the load. If even with the battery the load is not met then grid power is used. The battery can be charged using renewable sources or the grid. The different case scenarios under study are shown in Table 4.
Switch status for different source and load conditions.
Different case scenarios.
Simulation results and inference
The solar converter output voltage for variable irradiation condition, which is given to the common dc bus bar is shown in Figure 8. As can be seen from the plot the output voltage of the boost converter is a constant voltage irrespective of variation in irradiance.
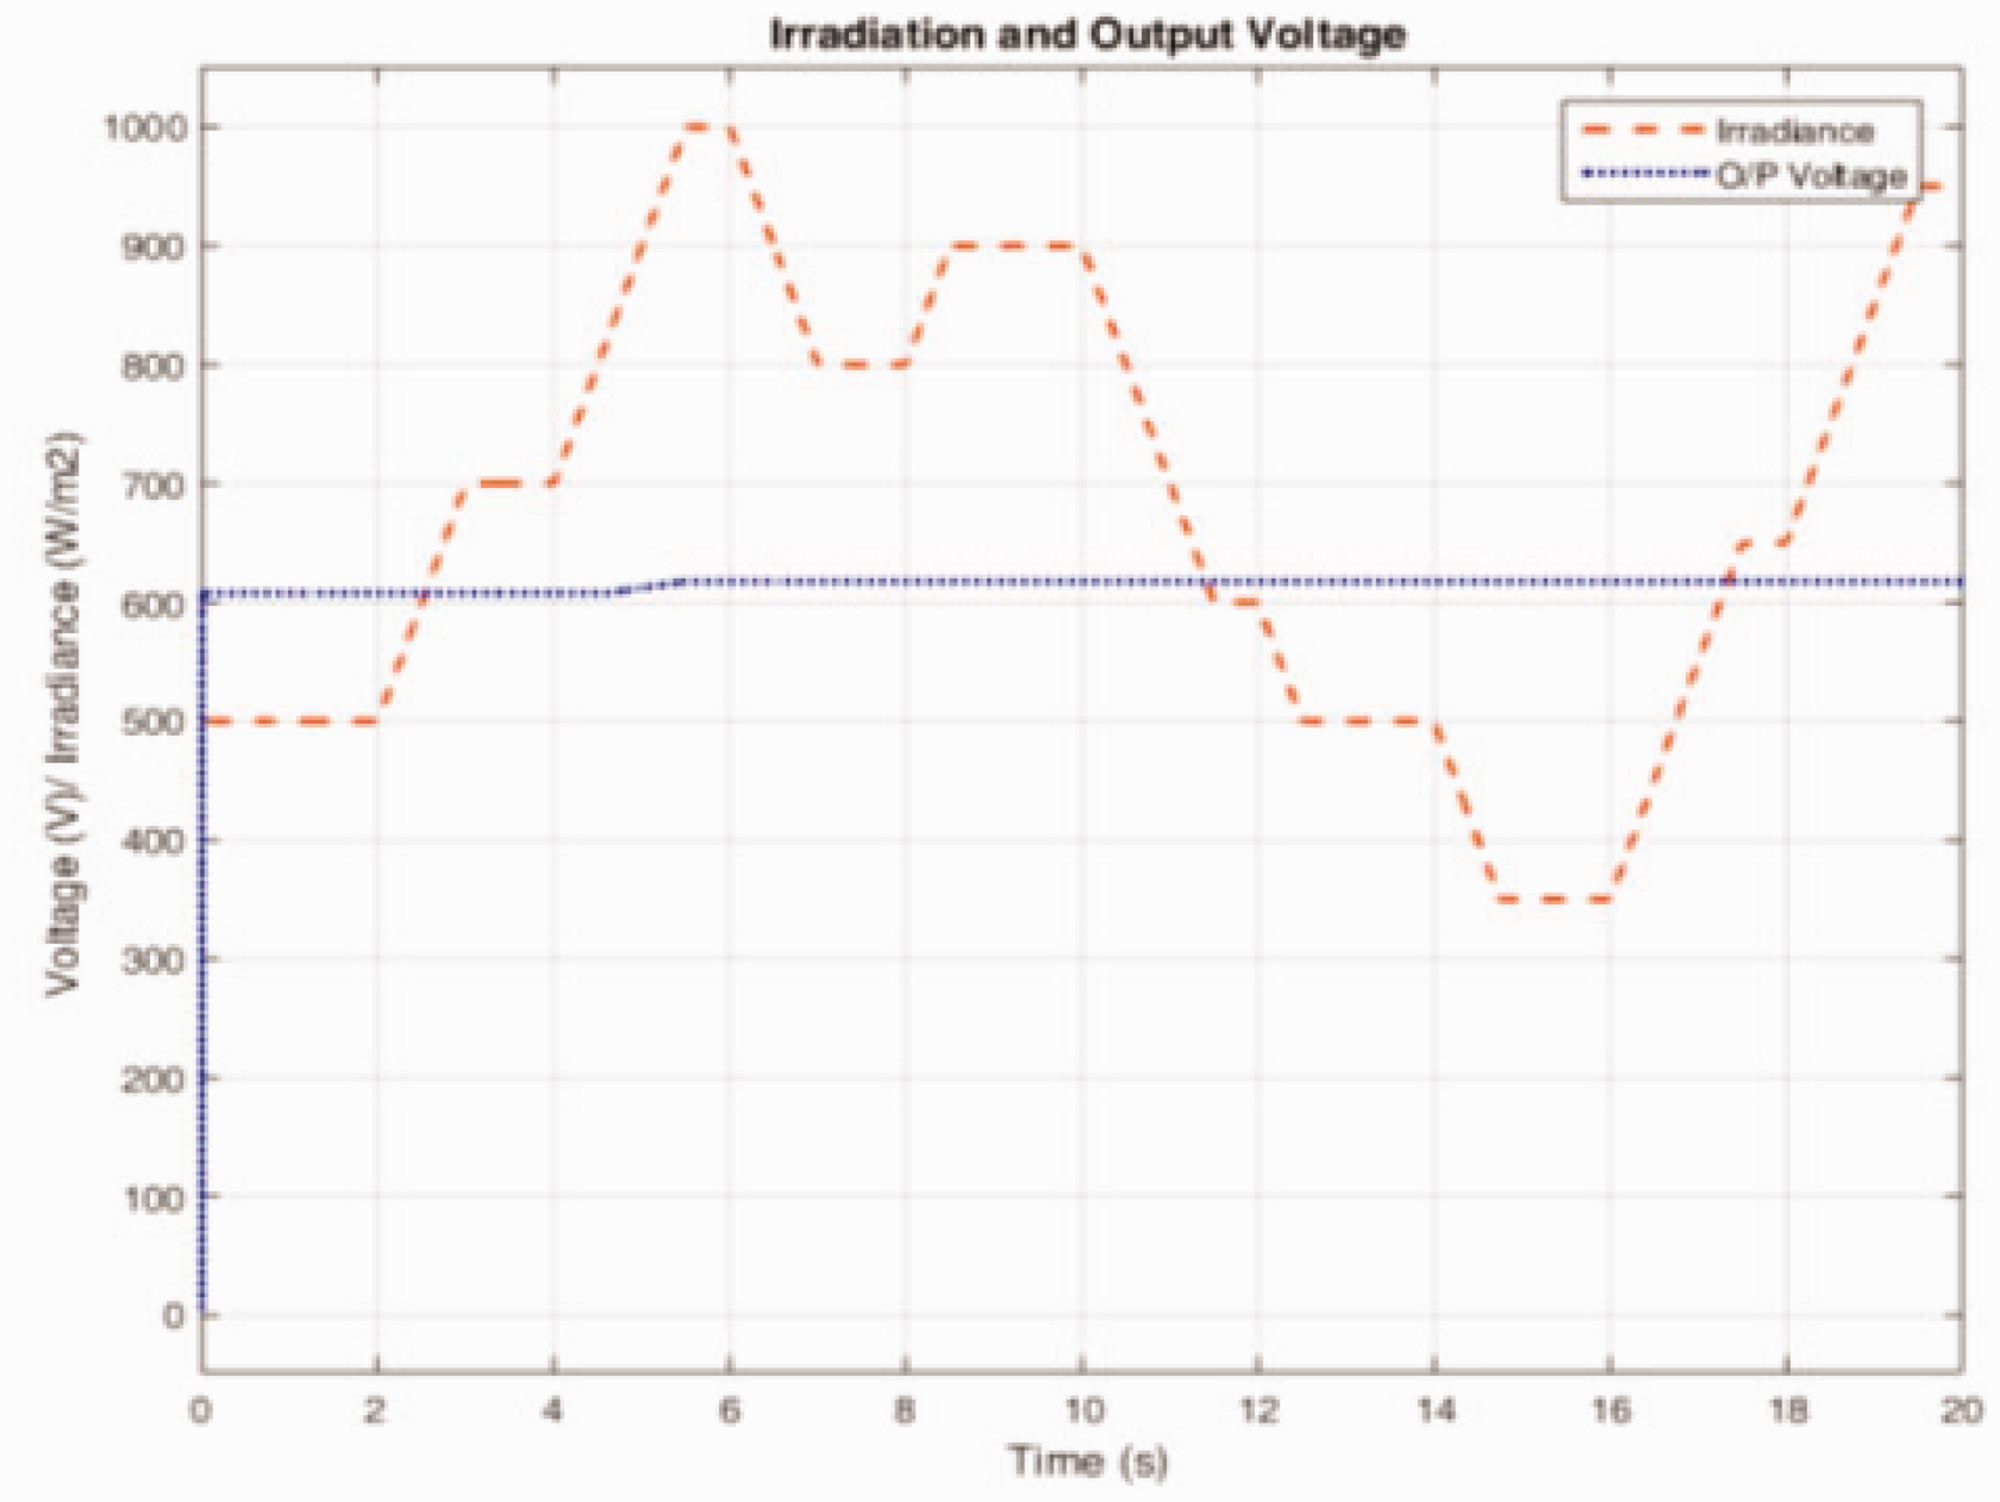
Solar converter output voltage for variable irradiance condition.
The solar boost converter is a variable step incremental conductance MPPT based controller. The wind energy power converter also includes a boost converter having PI controller to provide a constant dc to the dc bus bar output voltage. The input to the wind converter is obtained from PMDC generator. The torque generated by a wind turbine for varying wind velocity is calculated based on the equations given in “Droop controlled inverter for voltage and frequency stability” section. The appropriate input torque is applied to PMDC generator corresponding to wind speed varying from 3 to 9 m/s as given by Table 4 in “Droop controlled inverter for voltage and frequency stability” section. Negative torque is applied for the generator action as shown in Figure 9.
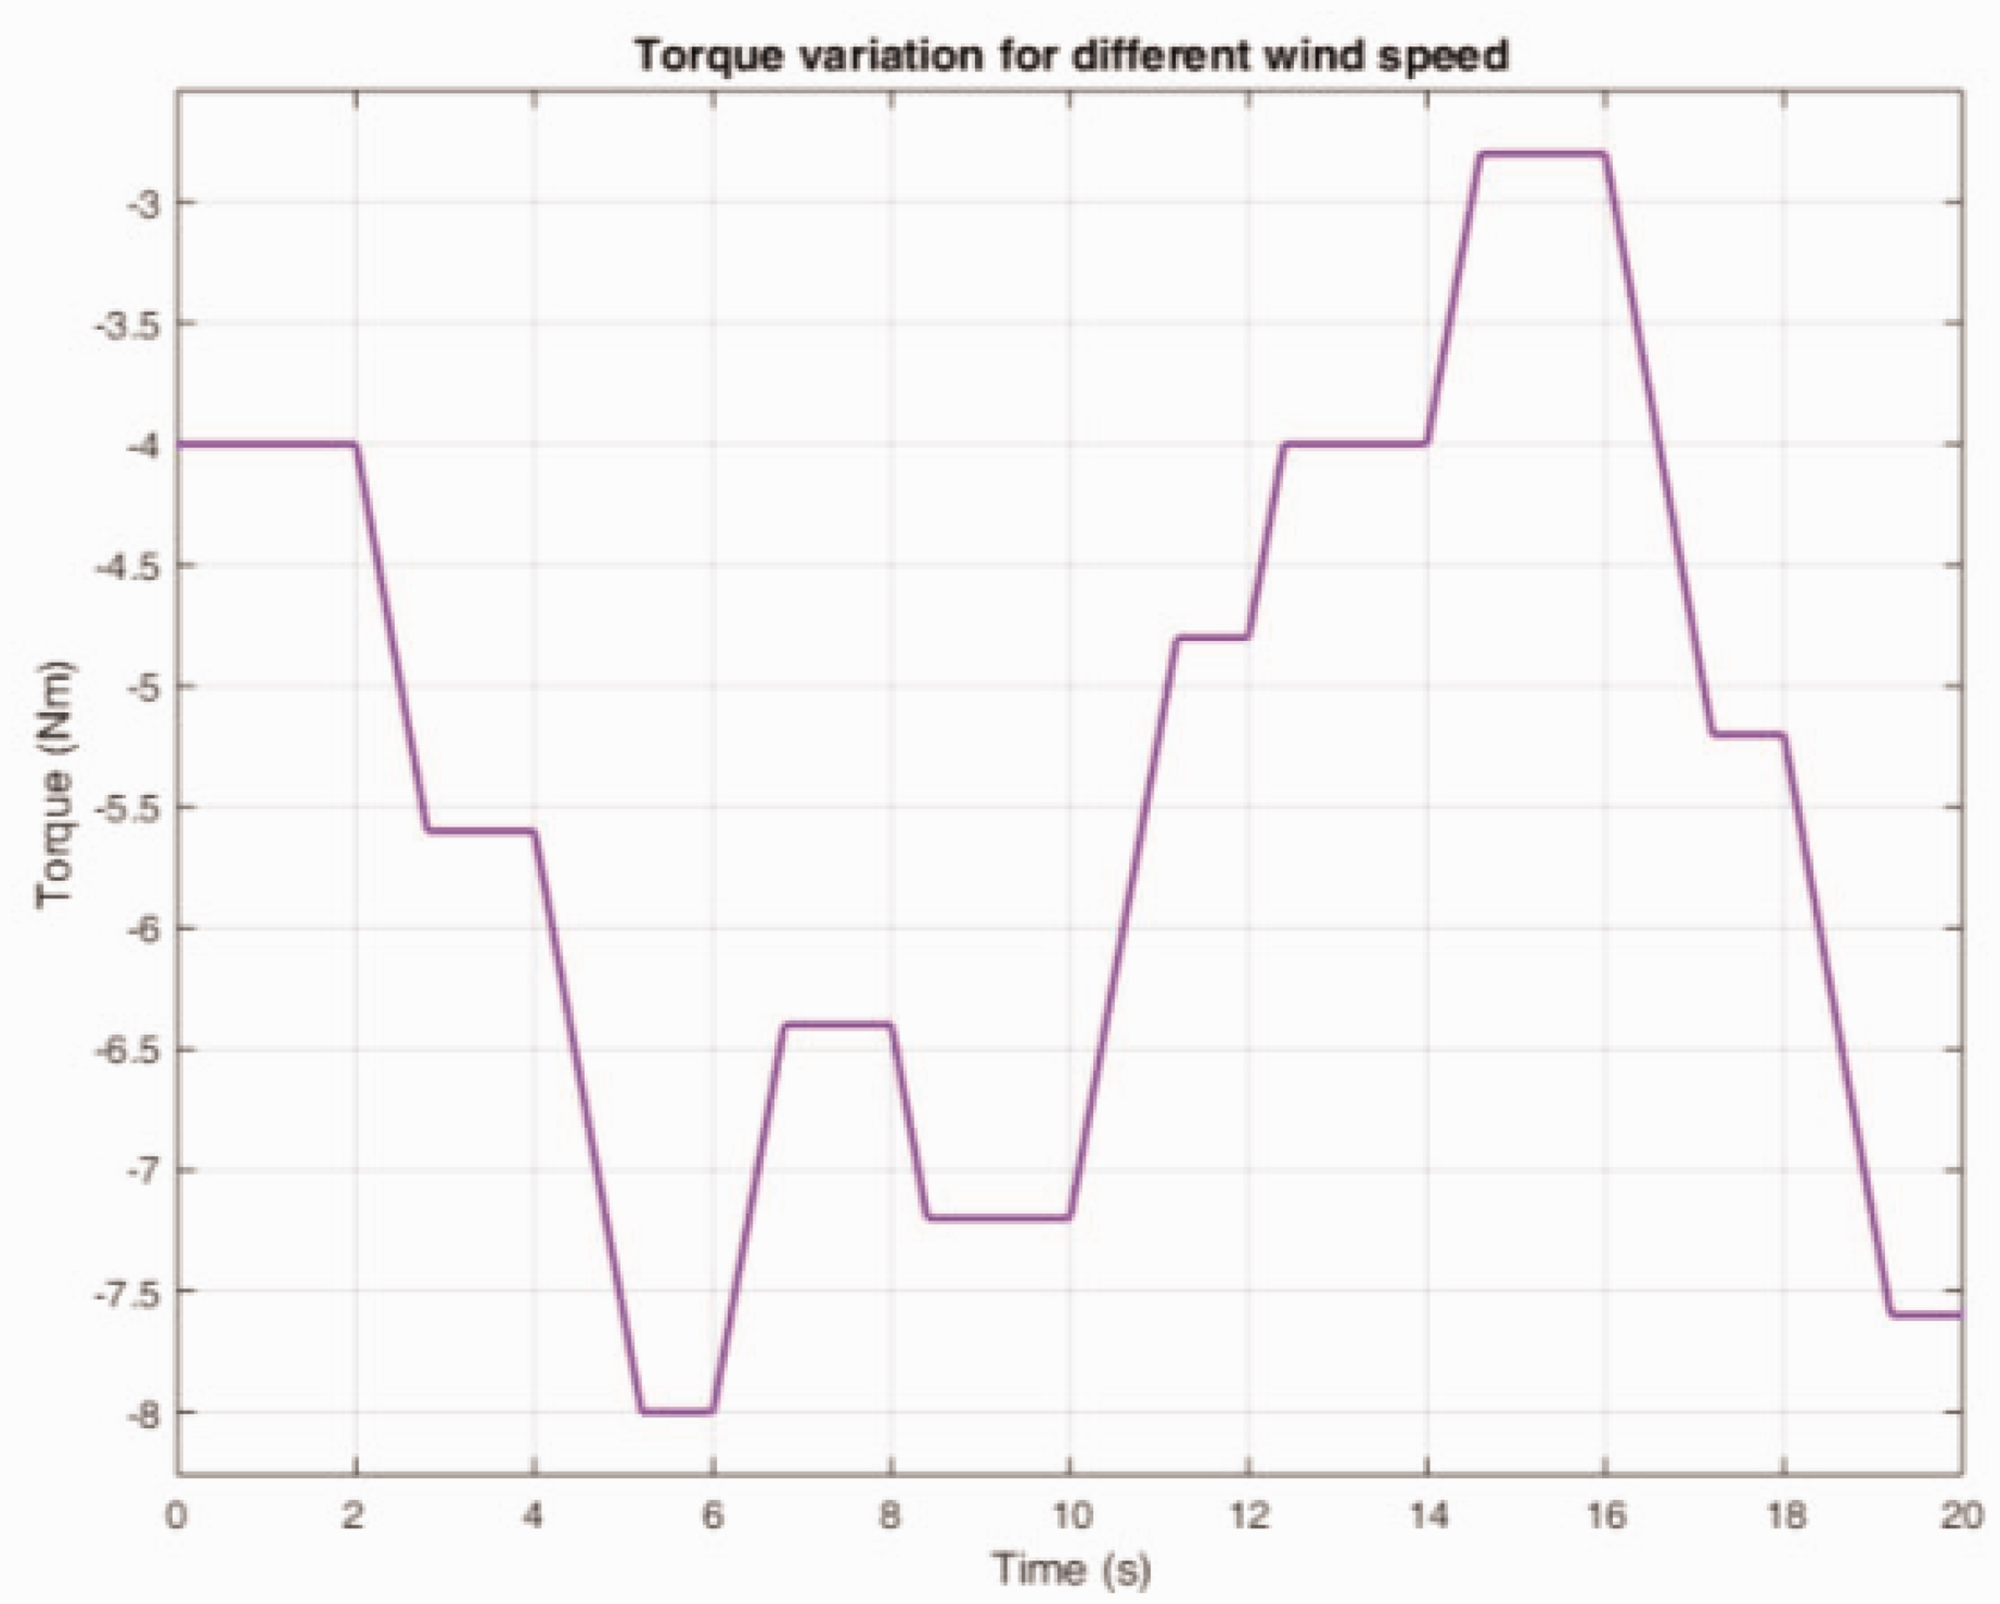
Variable torque applied to PMDC generator.
Voltage generated by PMDC for varying input torque and output voltage of boost converter is given in Figure 10.
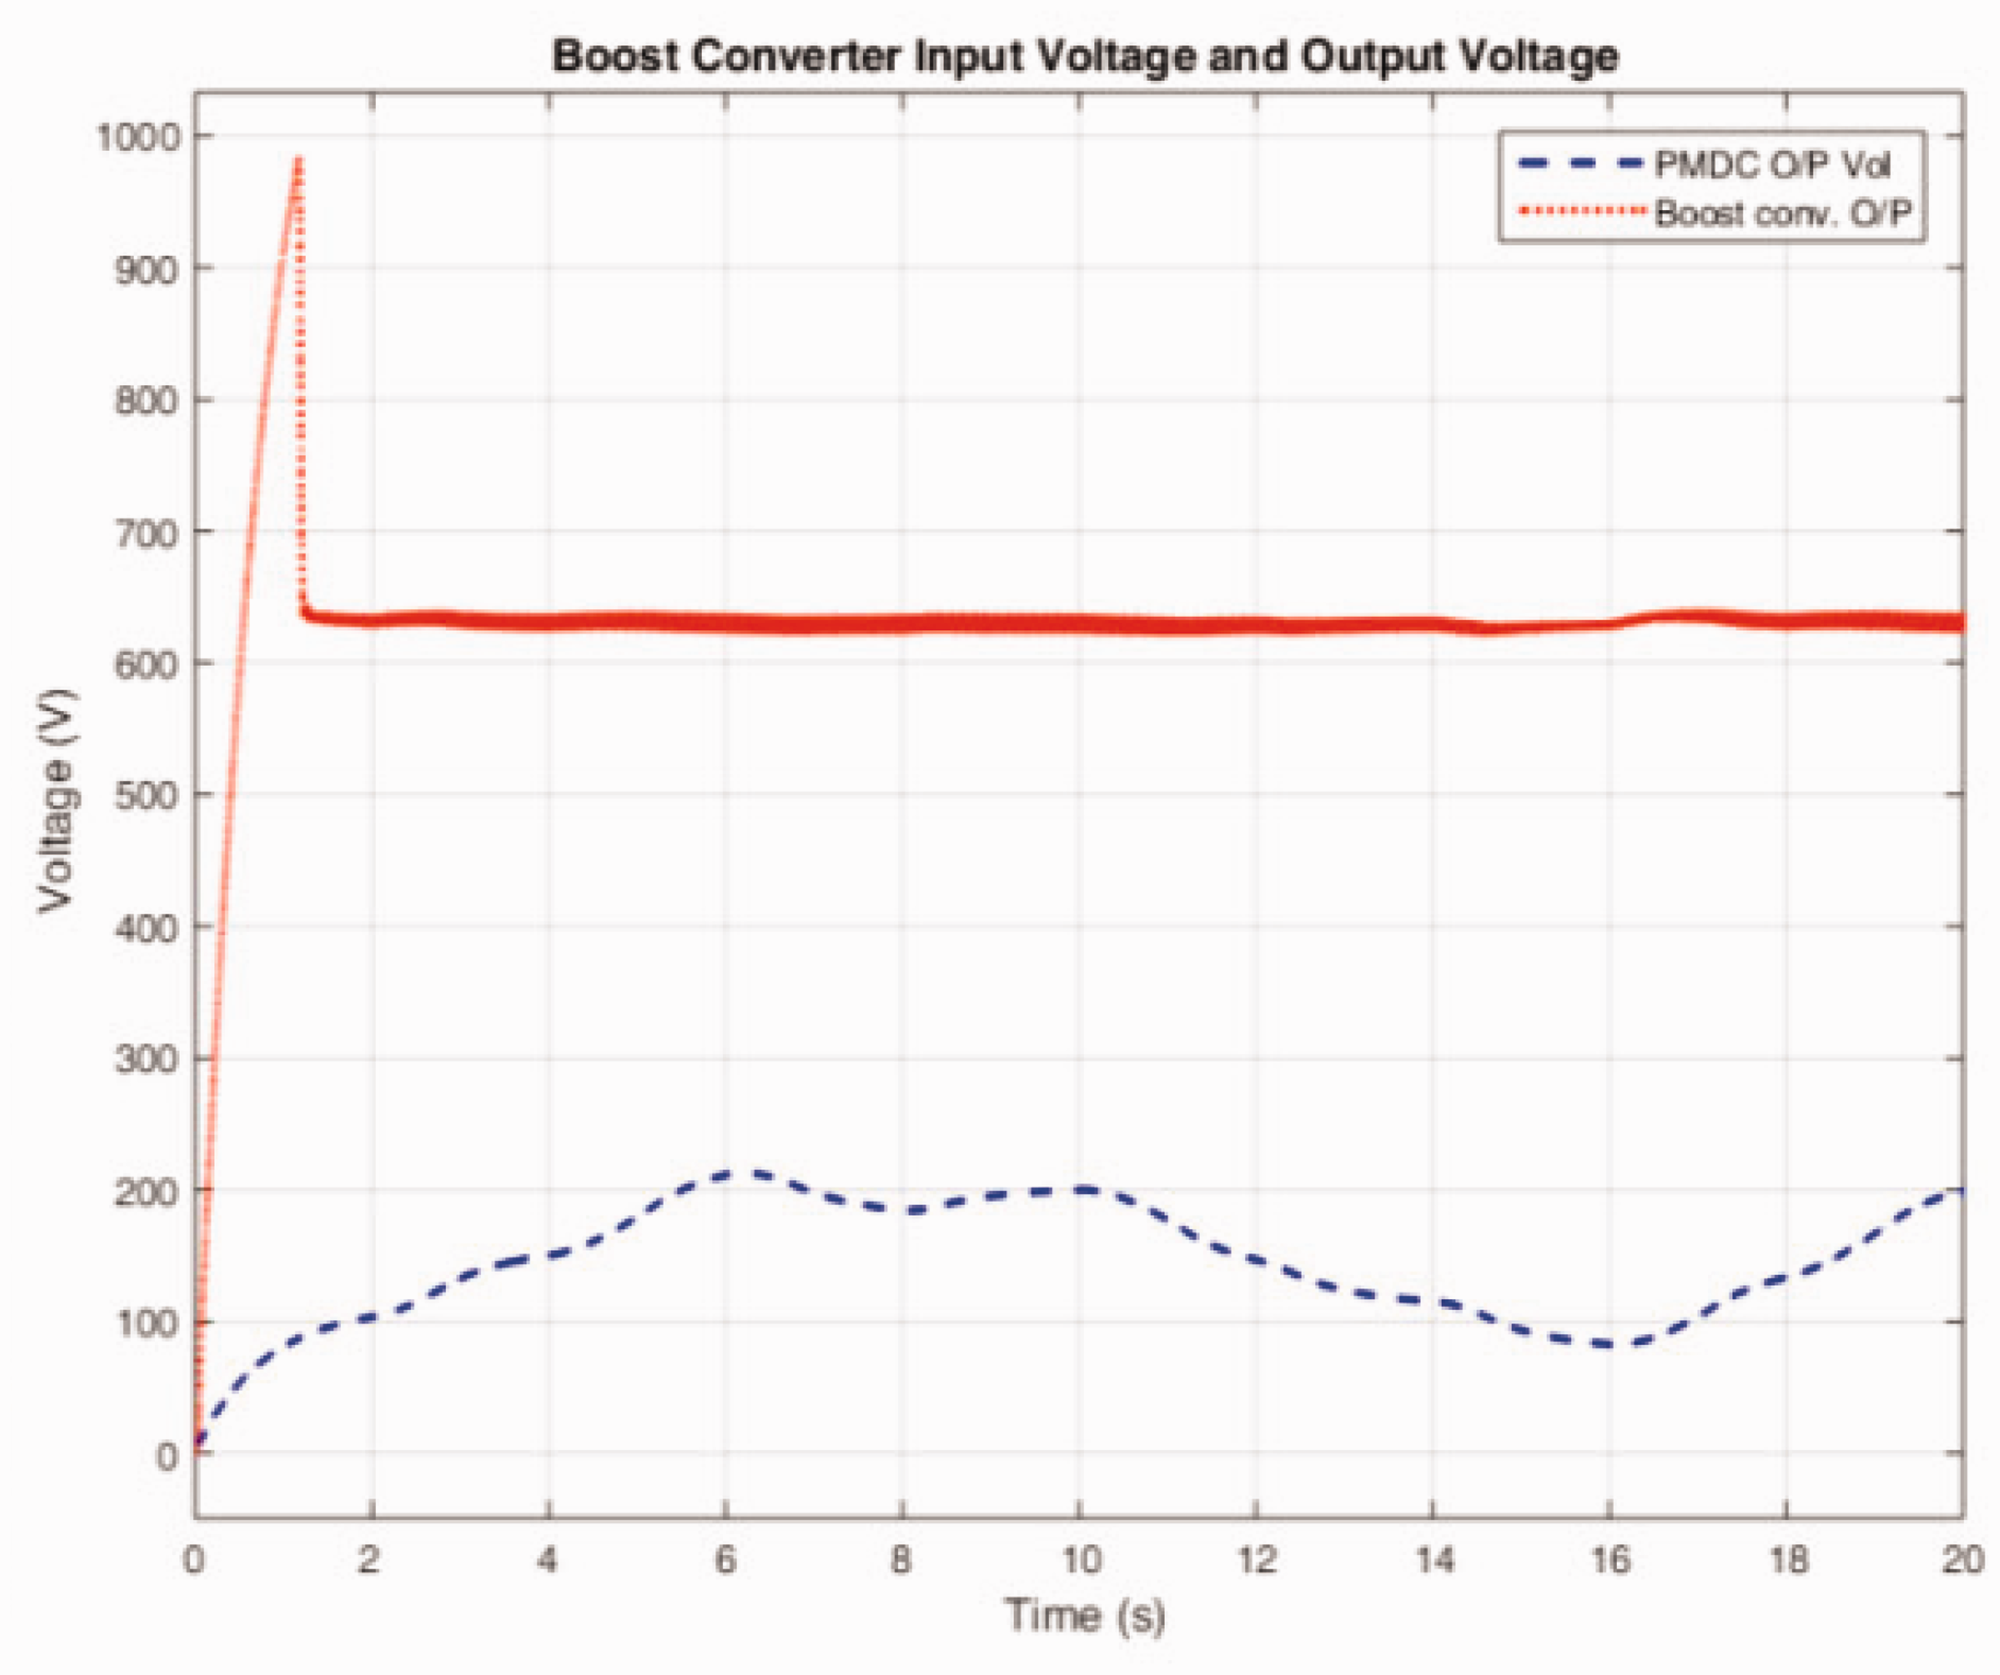
Output voltage of wind energy converter for variable wind velocity.
The Figure 11 shows the DC bus voltage given to inverter. The inverter is given a constant dc voltage irrespective of varying power at input side. The battery power gives the power stability if the load power is higher than renewable power, the battery power is supplied to meet the load. If load power is lower than renewable power then the battery is charged to give power stability.
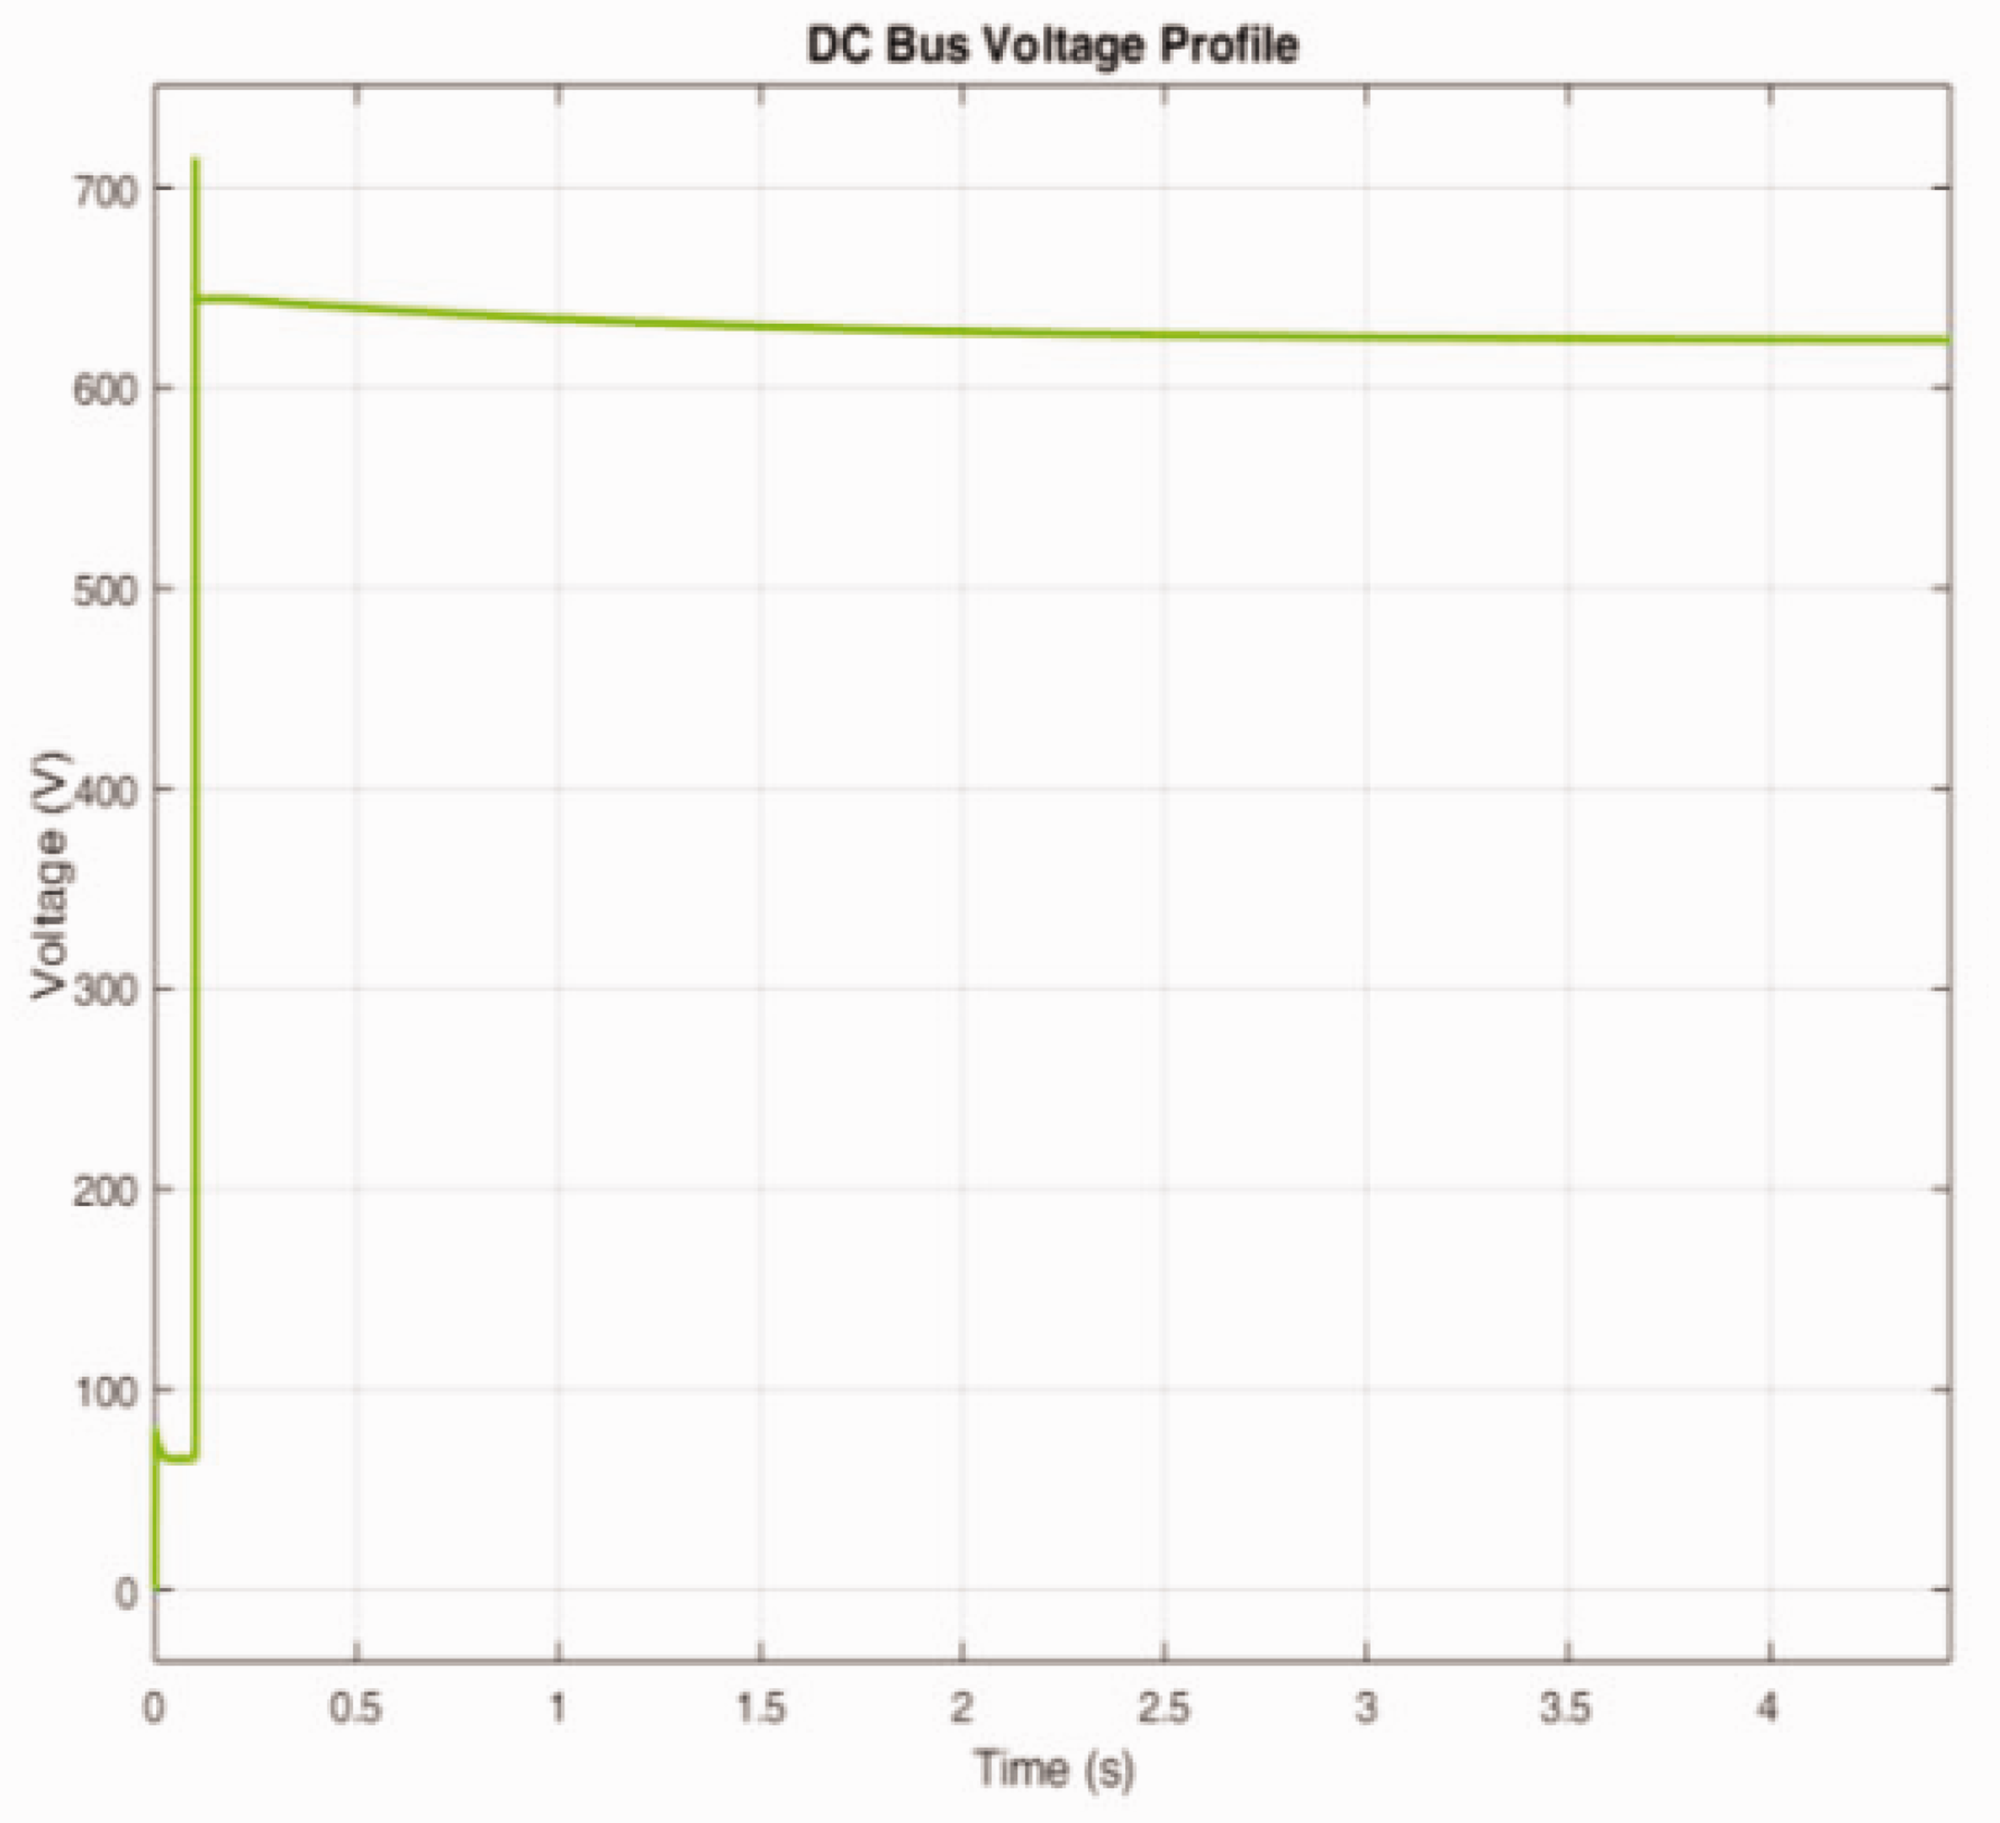
DC bus voltage fed by solar, wind and battery boost converter.
This steady dc bus voltage is applied to the droop controlled inverter. Depending on the power requirement of the load and the power available with the sources the power flow is controlled.
The Figure 12 shows inverter output voltage given to load. Figure 13 shows the FFT analysis of voltage waveform of the load. The THD is found to be 4.93% which is within the permissible limit.
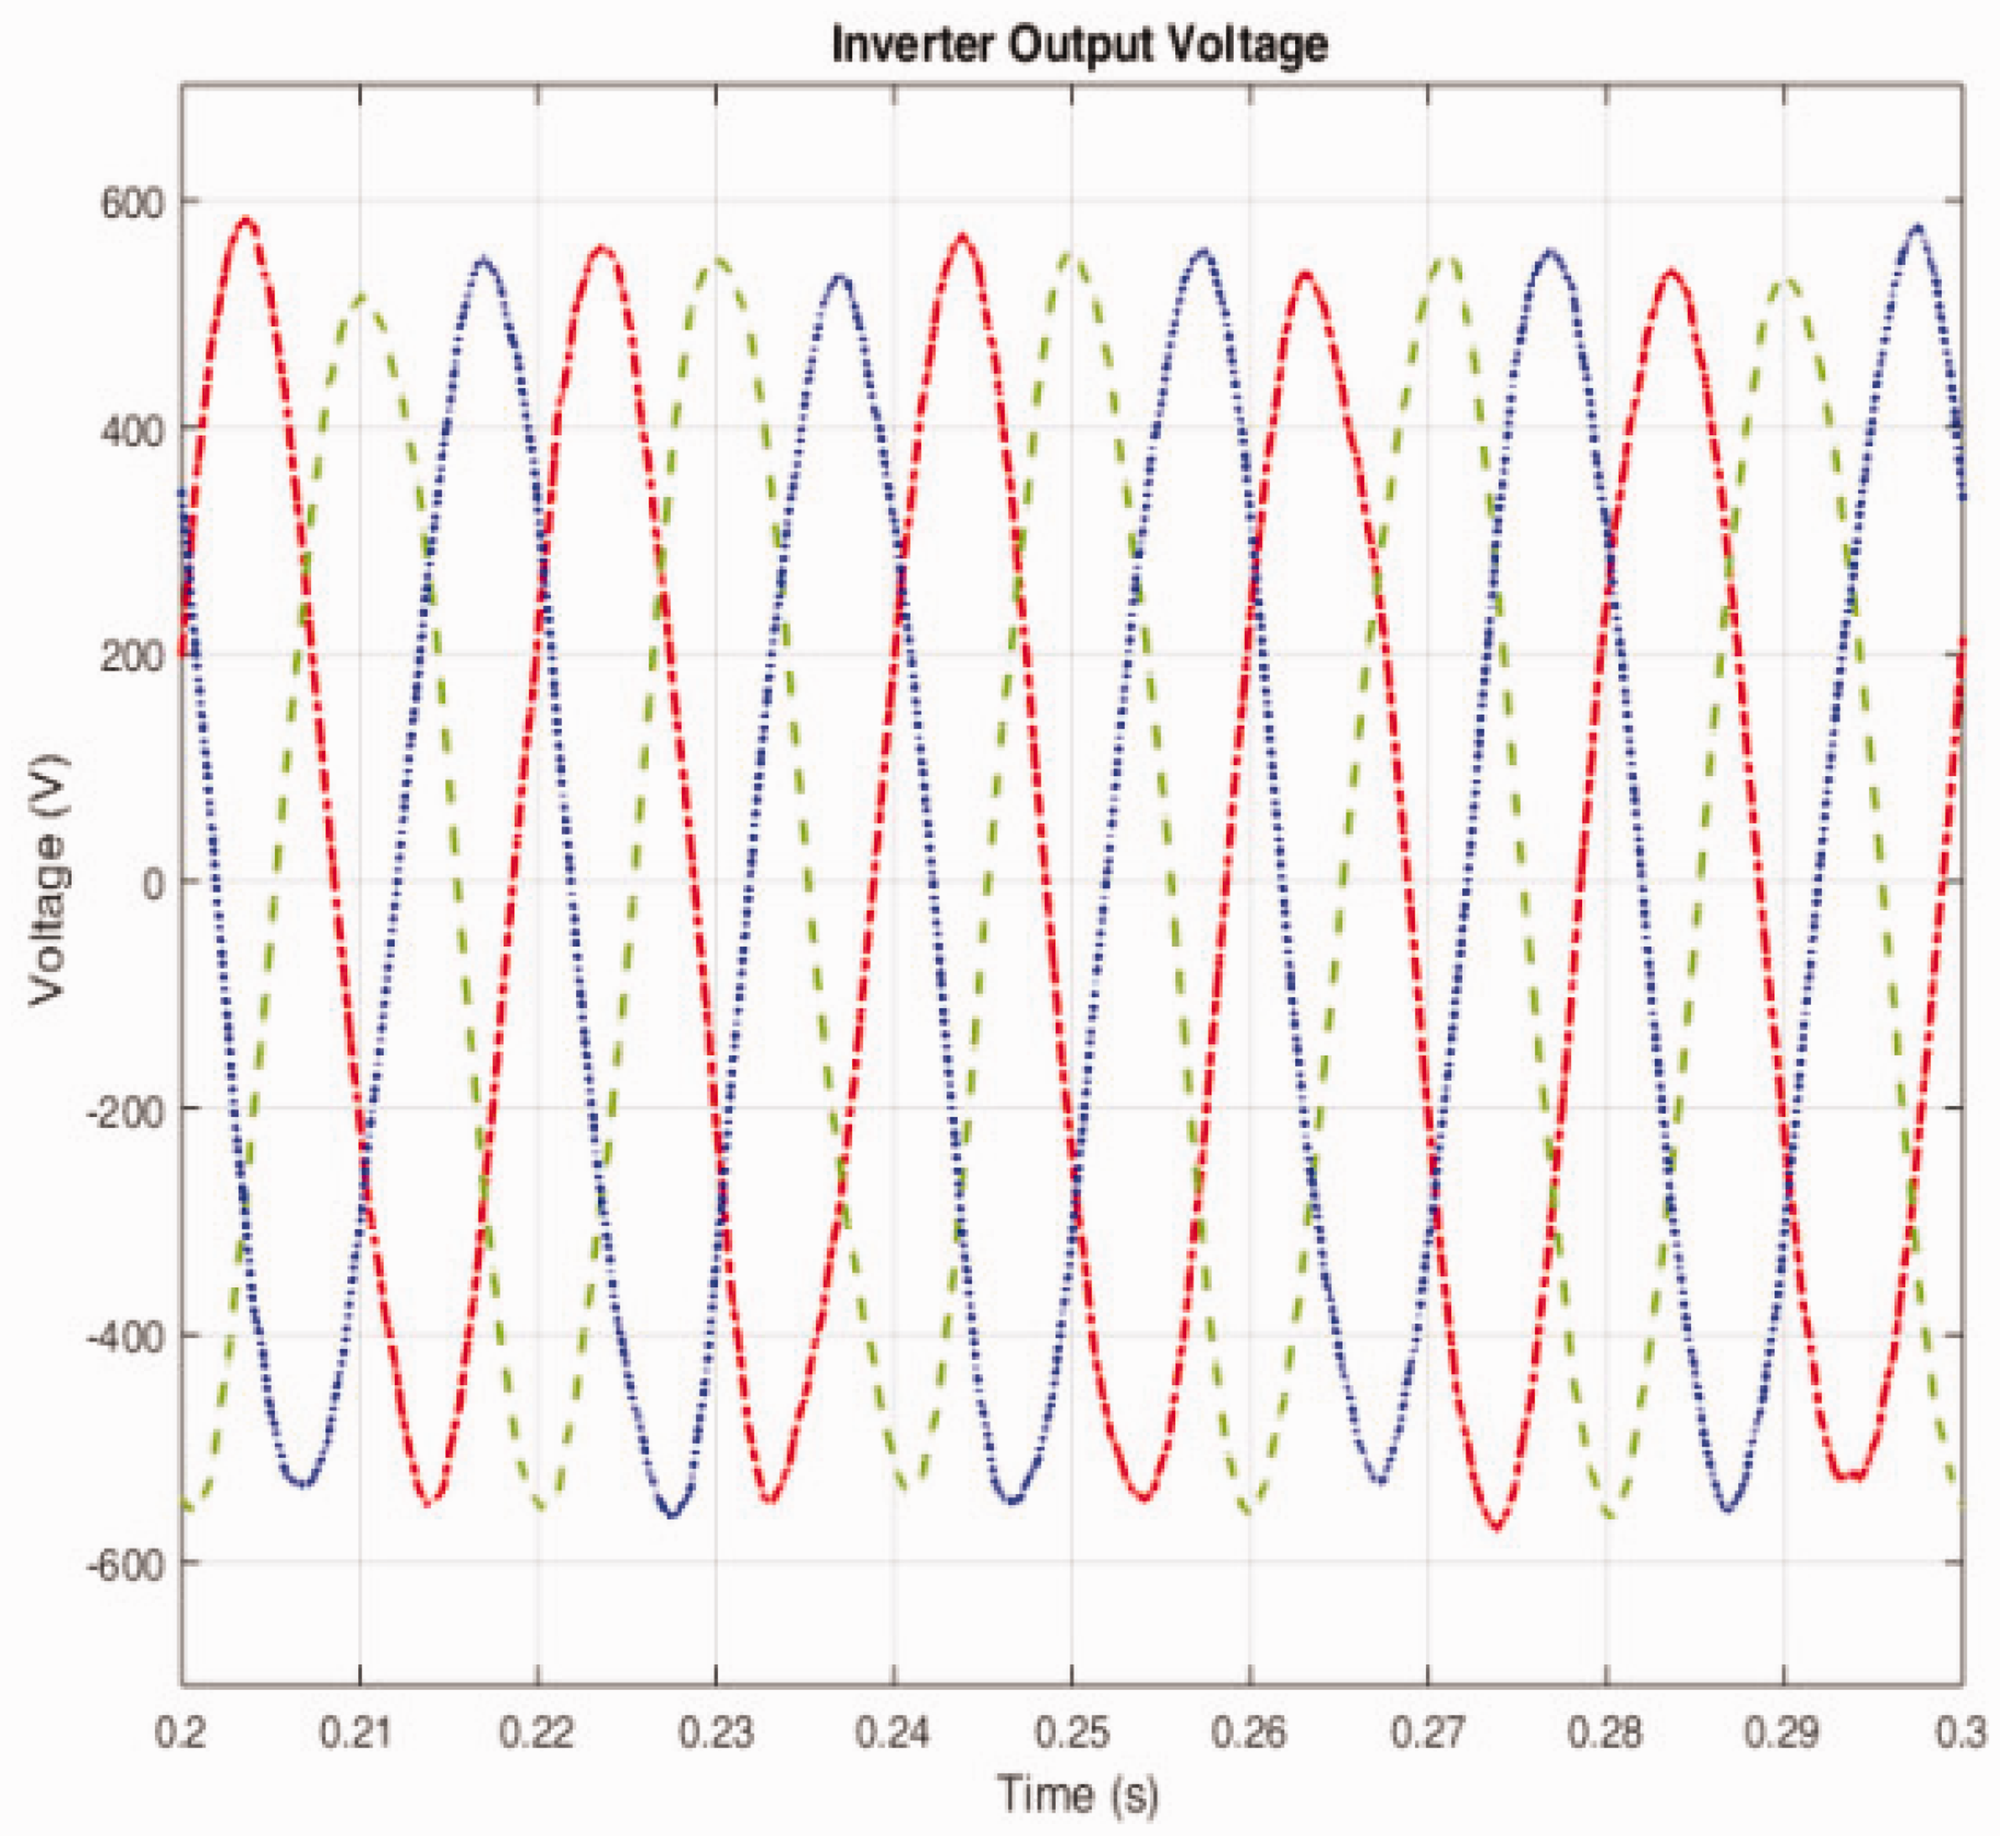
Output load voltage.
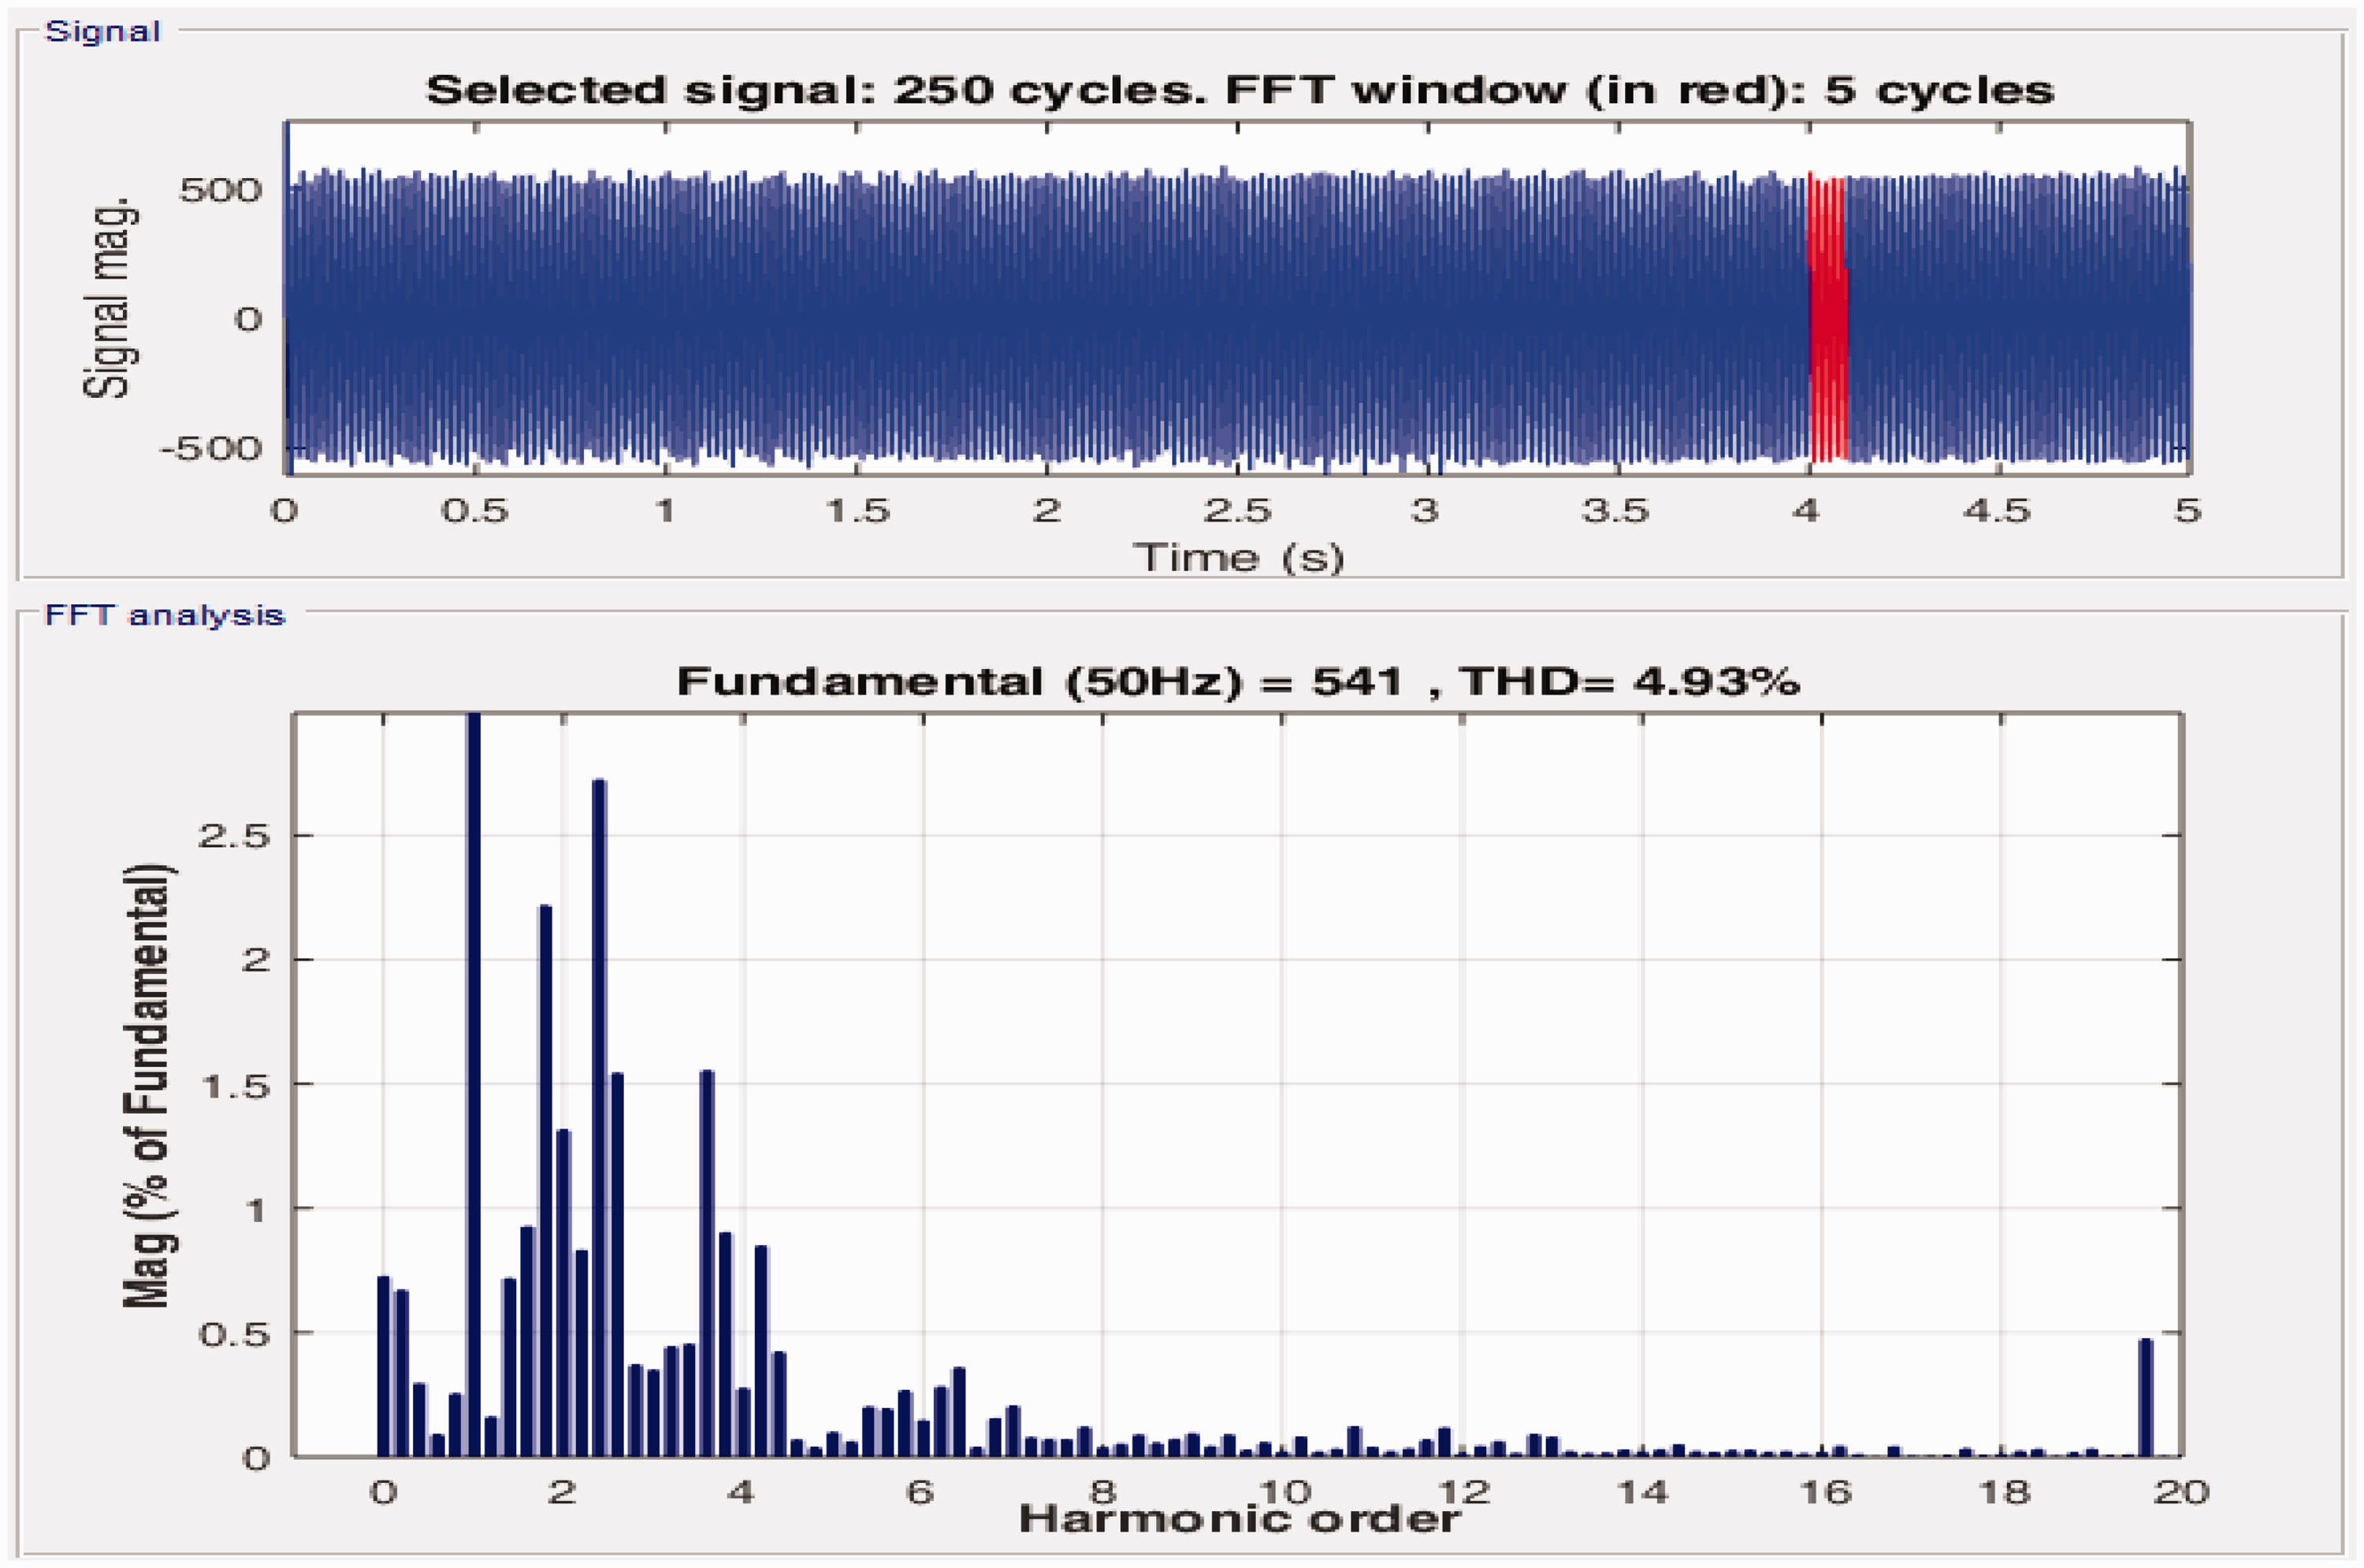
FFT analysis of load voltage waveform.
Figure 14 shows the load current waveform for a change in power from 1500 to 2300 W at time 2.5 s. Figure 15 shows the expanded current waveform with distortions, the FFT analysis of this current waveform is given in Figure 16.
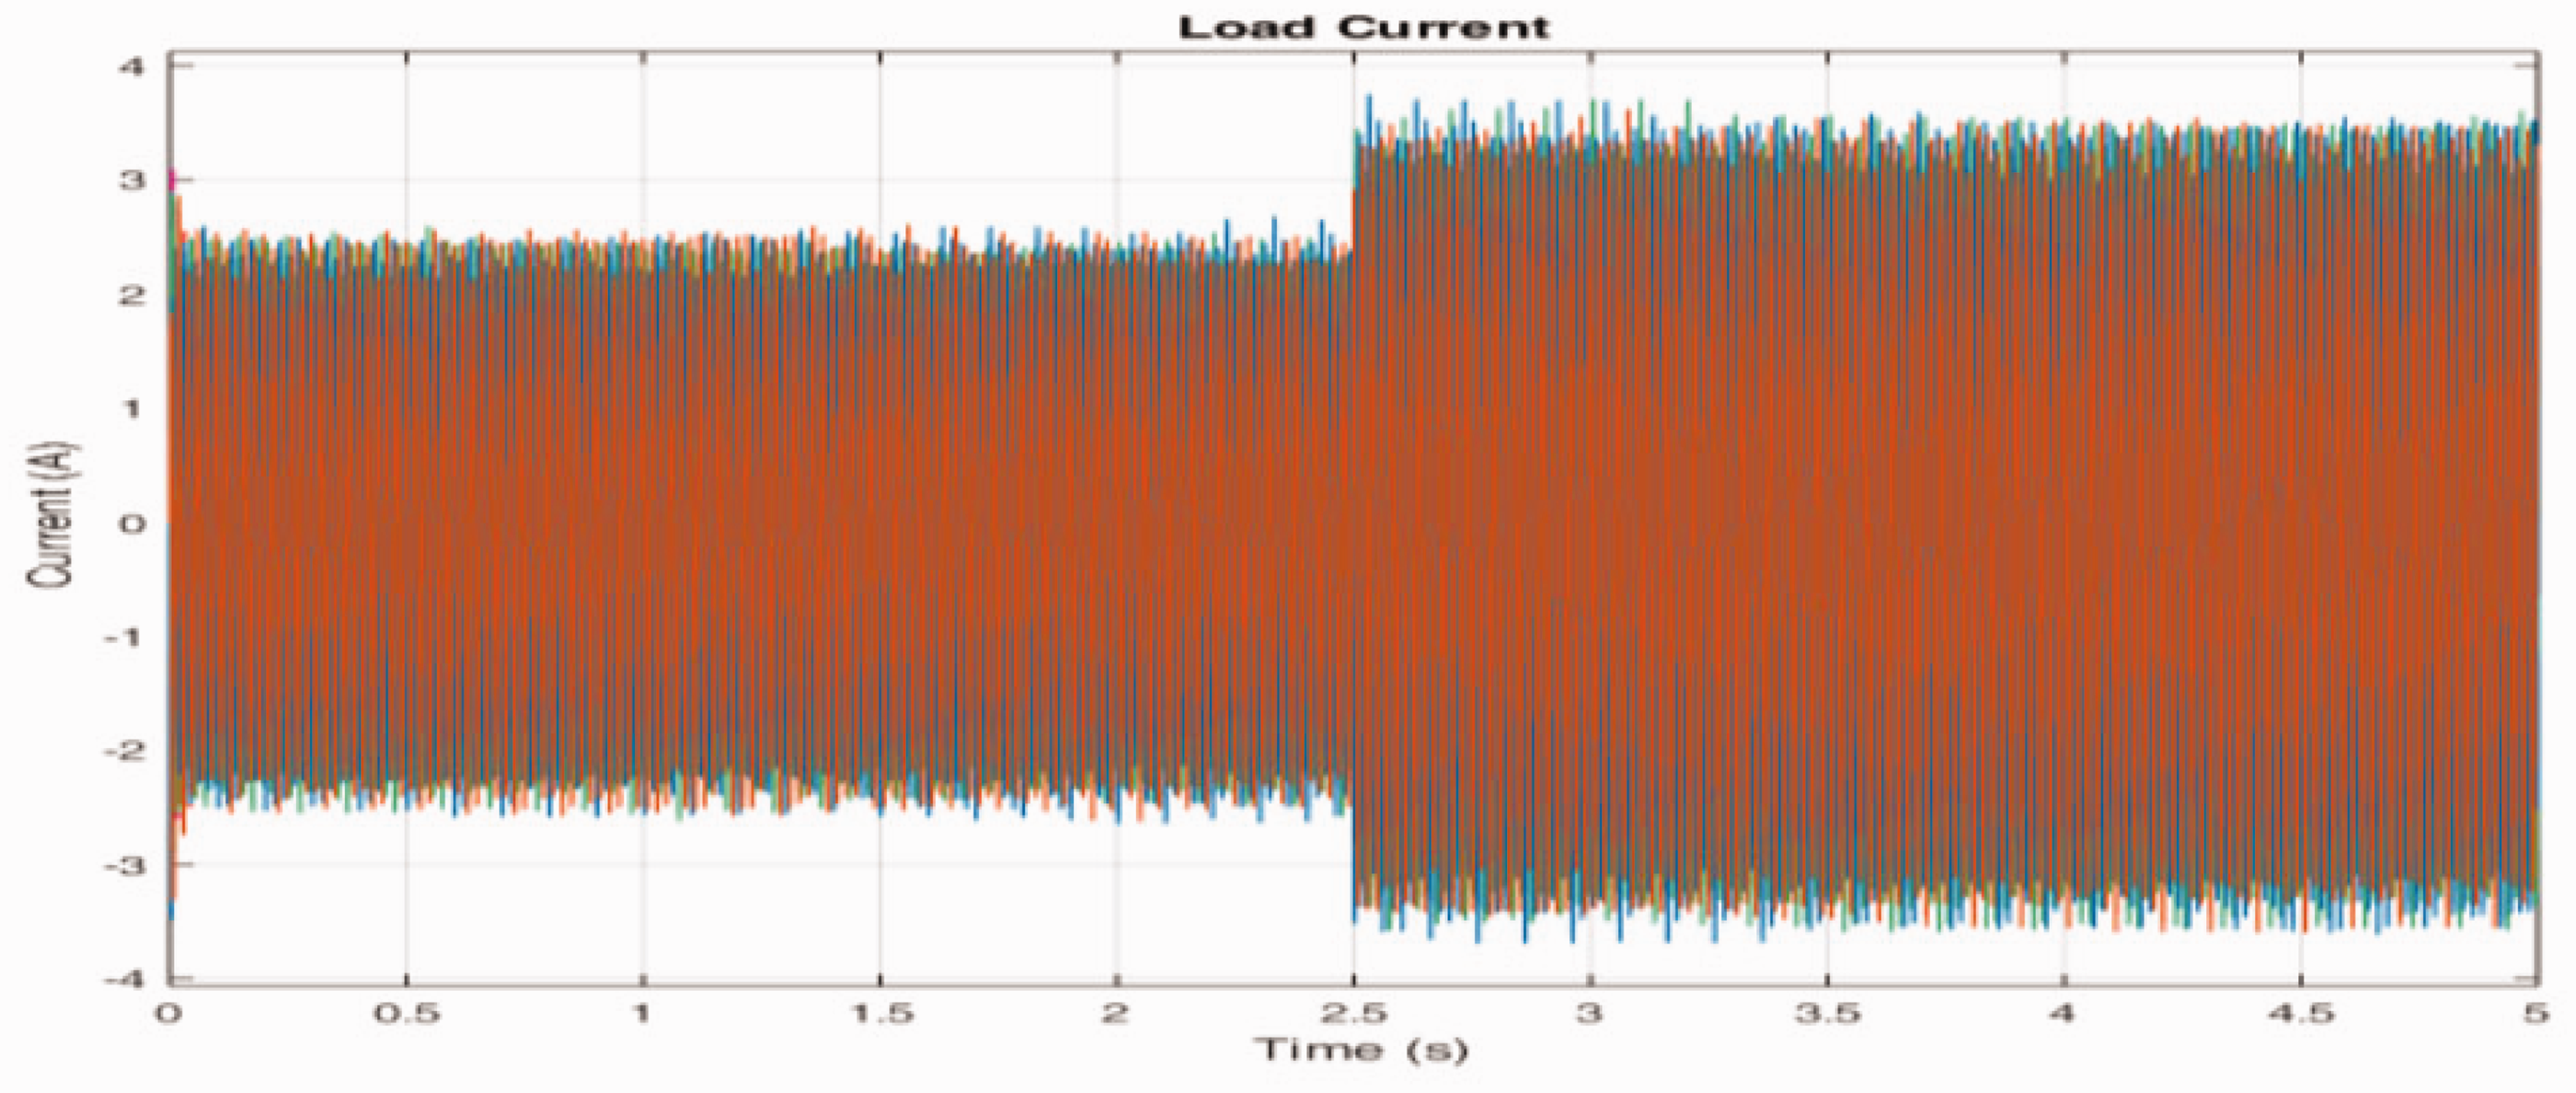
Load current waveform showing the load change.
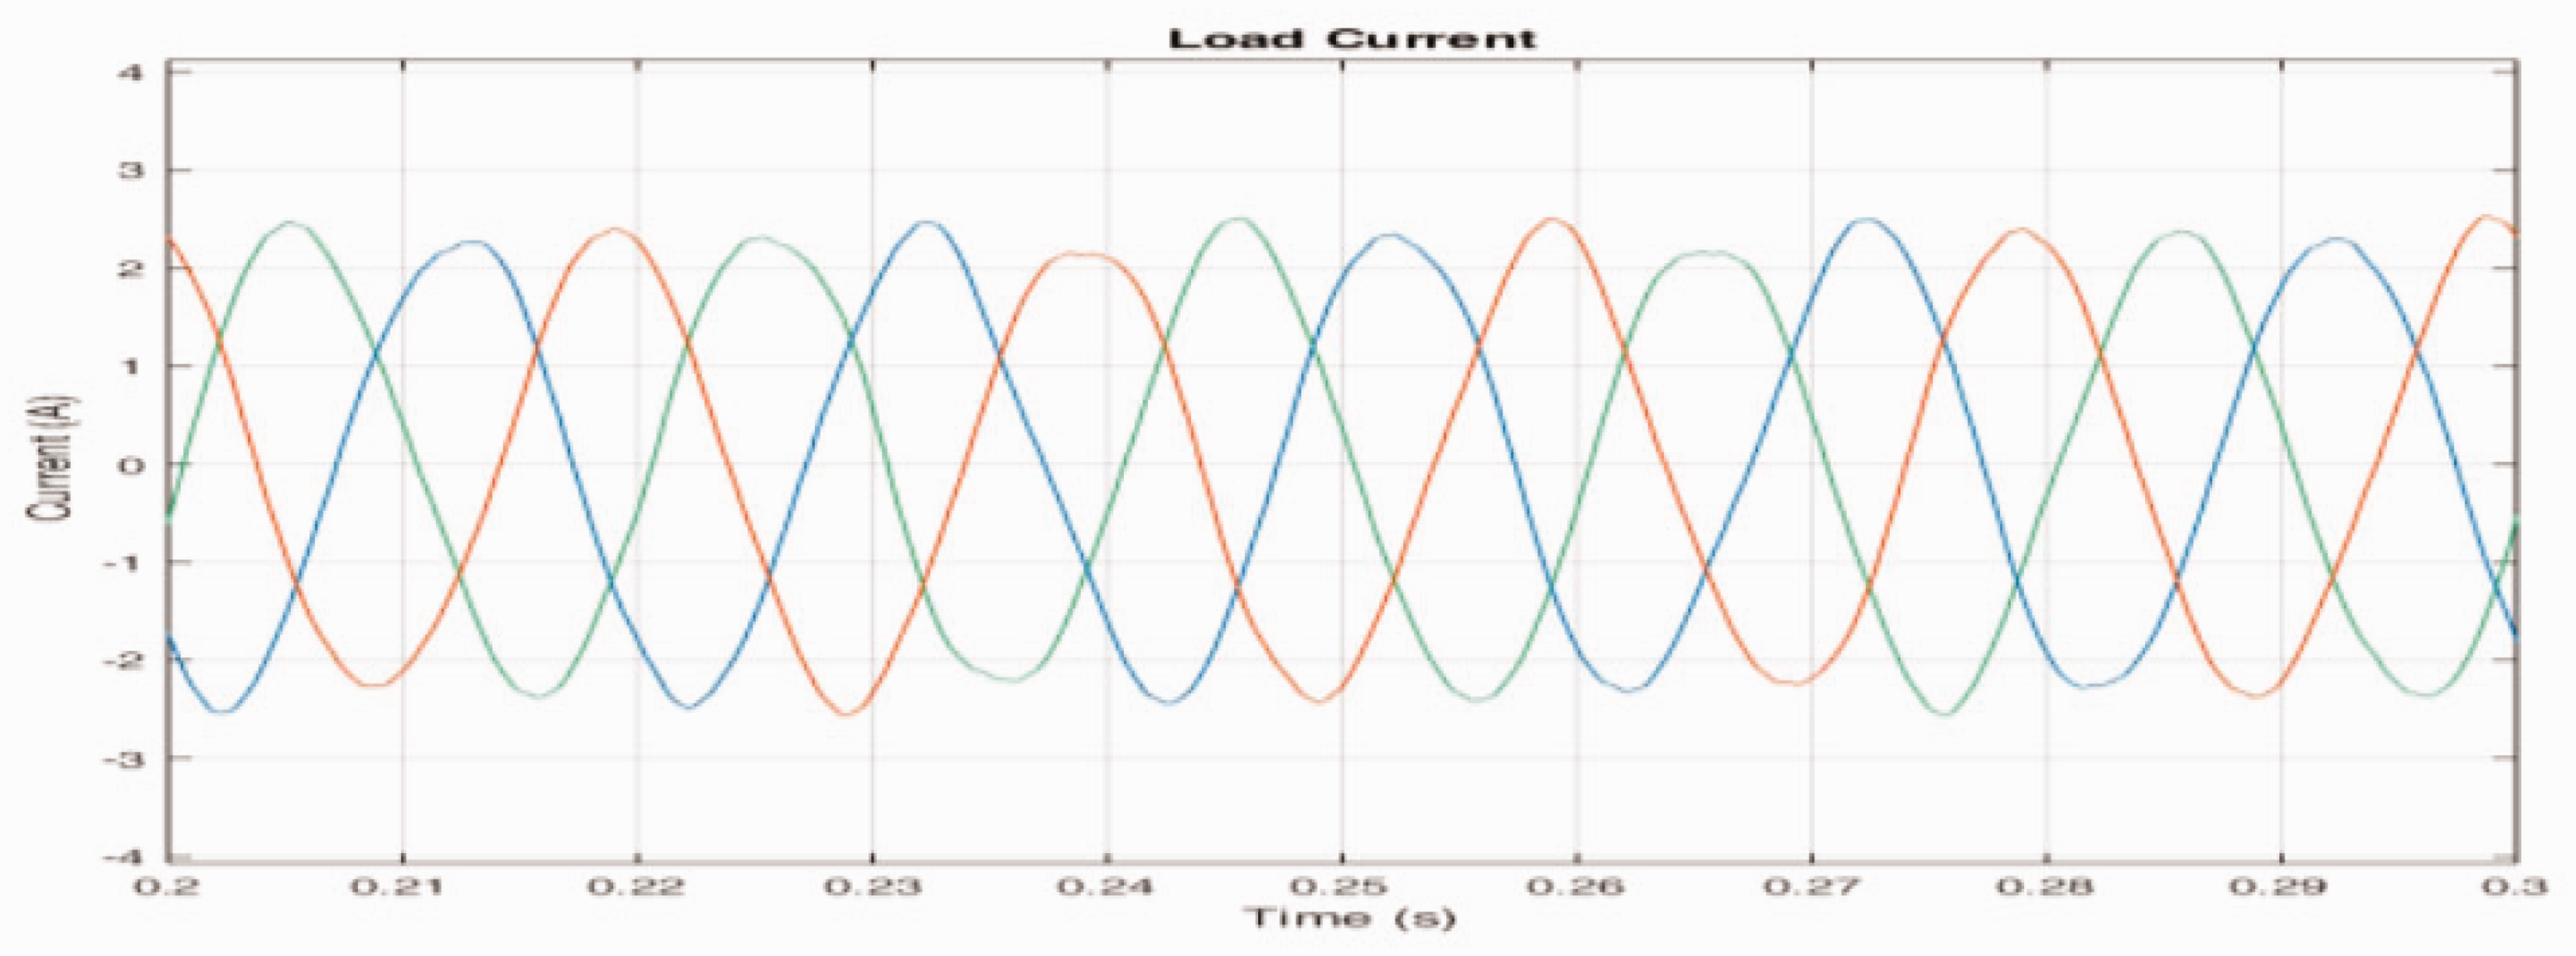
Load current waveform.
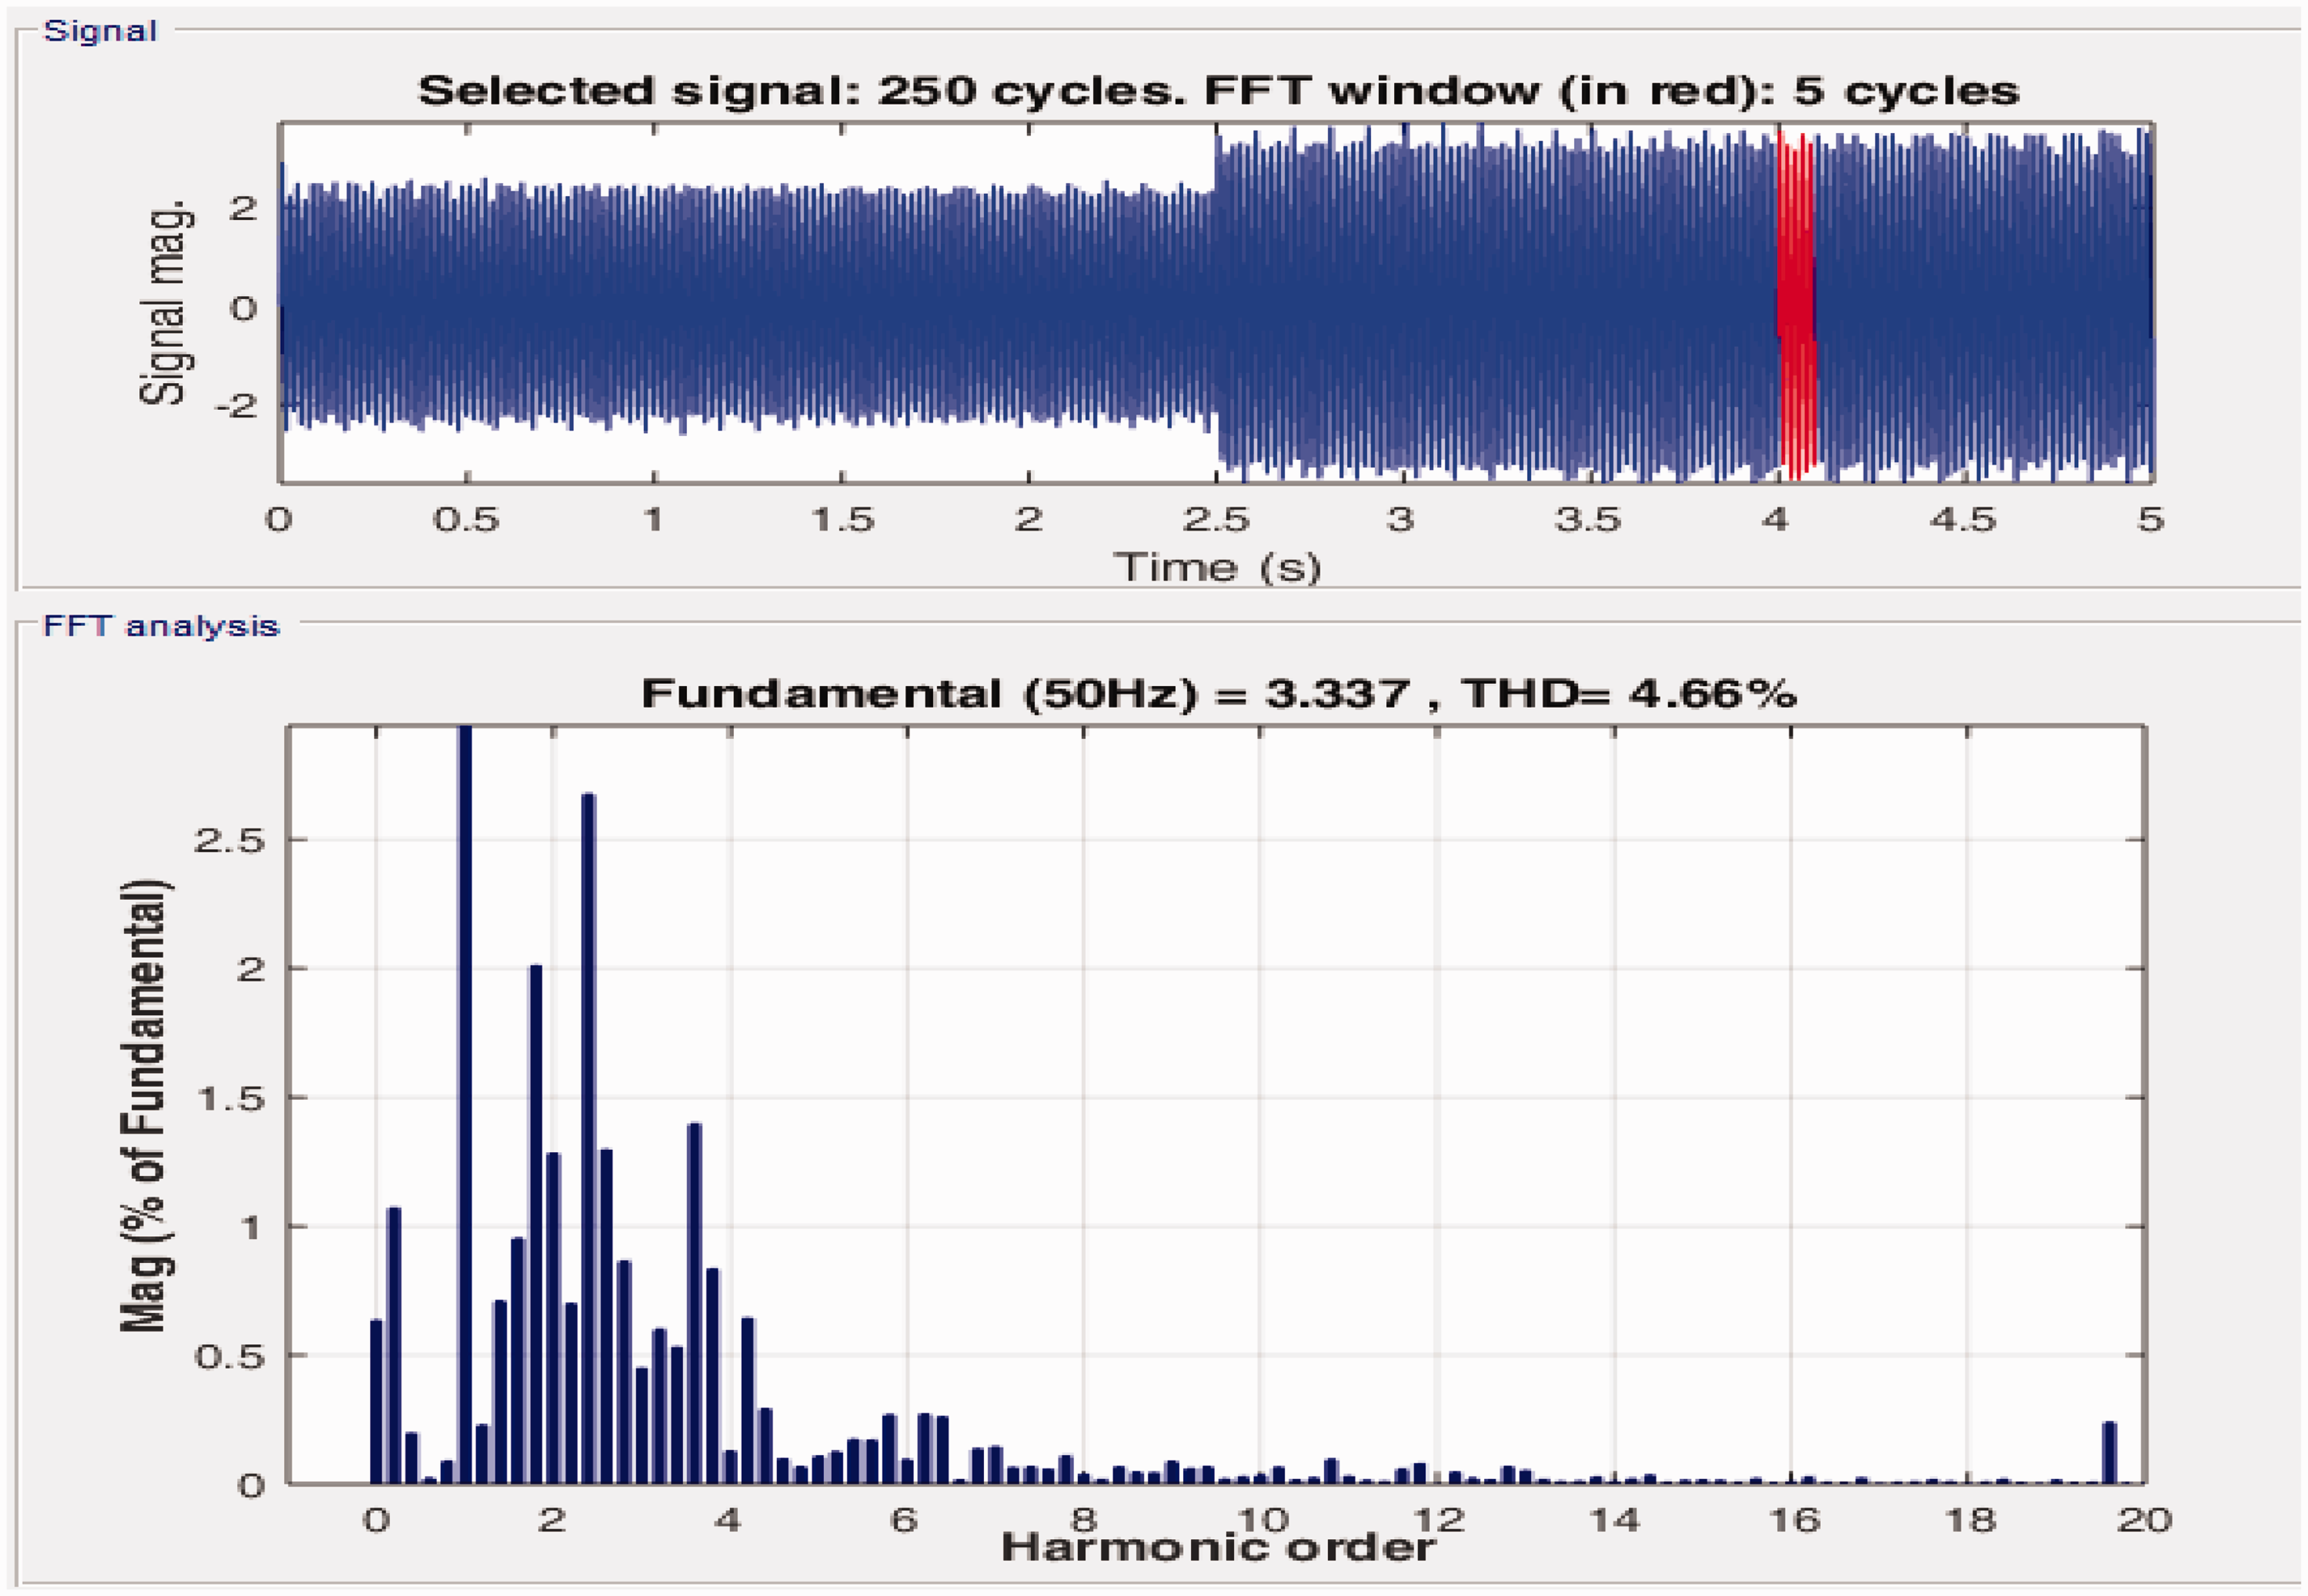
FFT analysis of load current.
Figure 16 shows the FFT analysis of voltage waveform of the load. The THD is found to be 4.66% which is within the permissible limit.
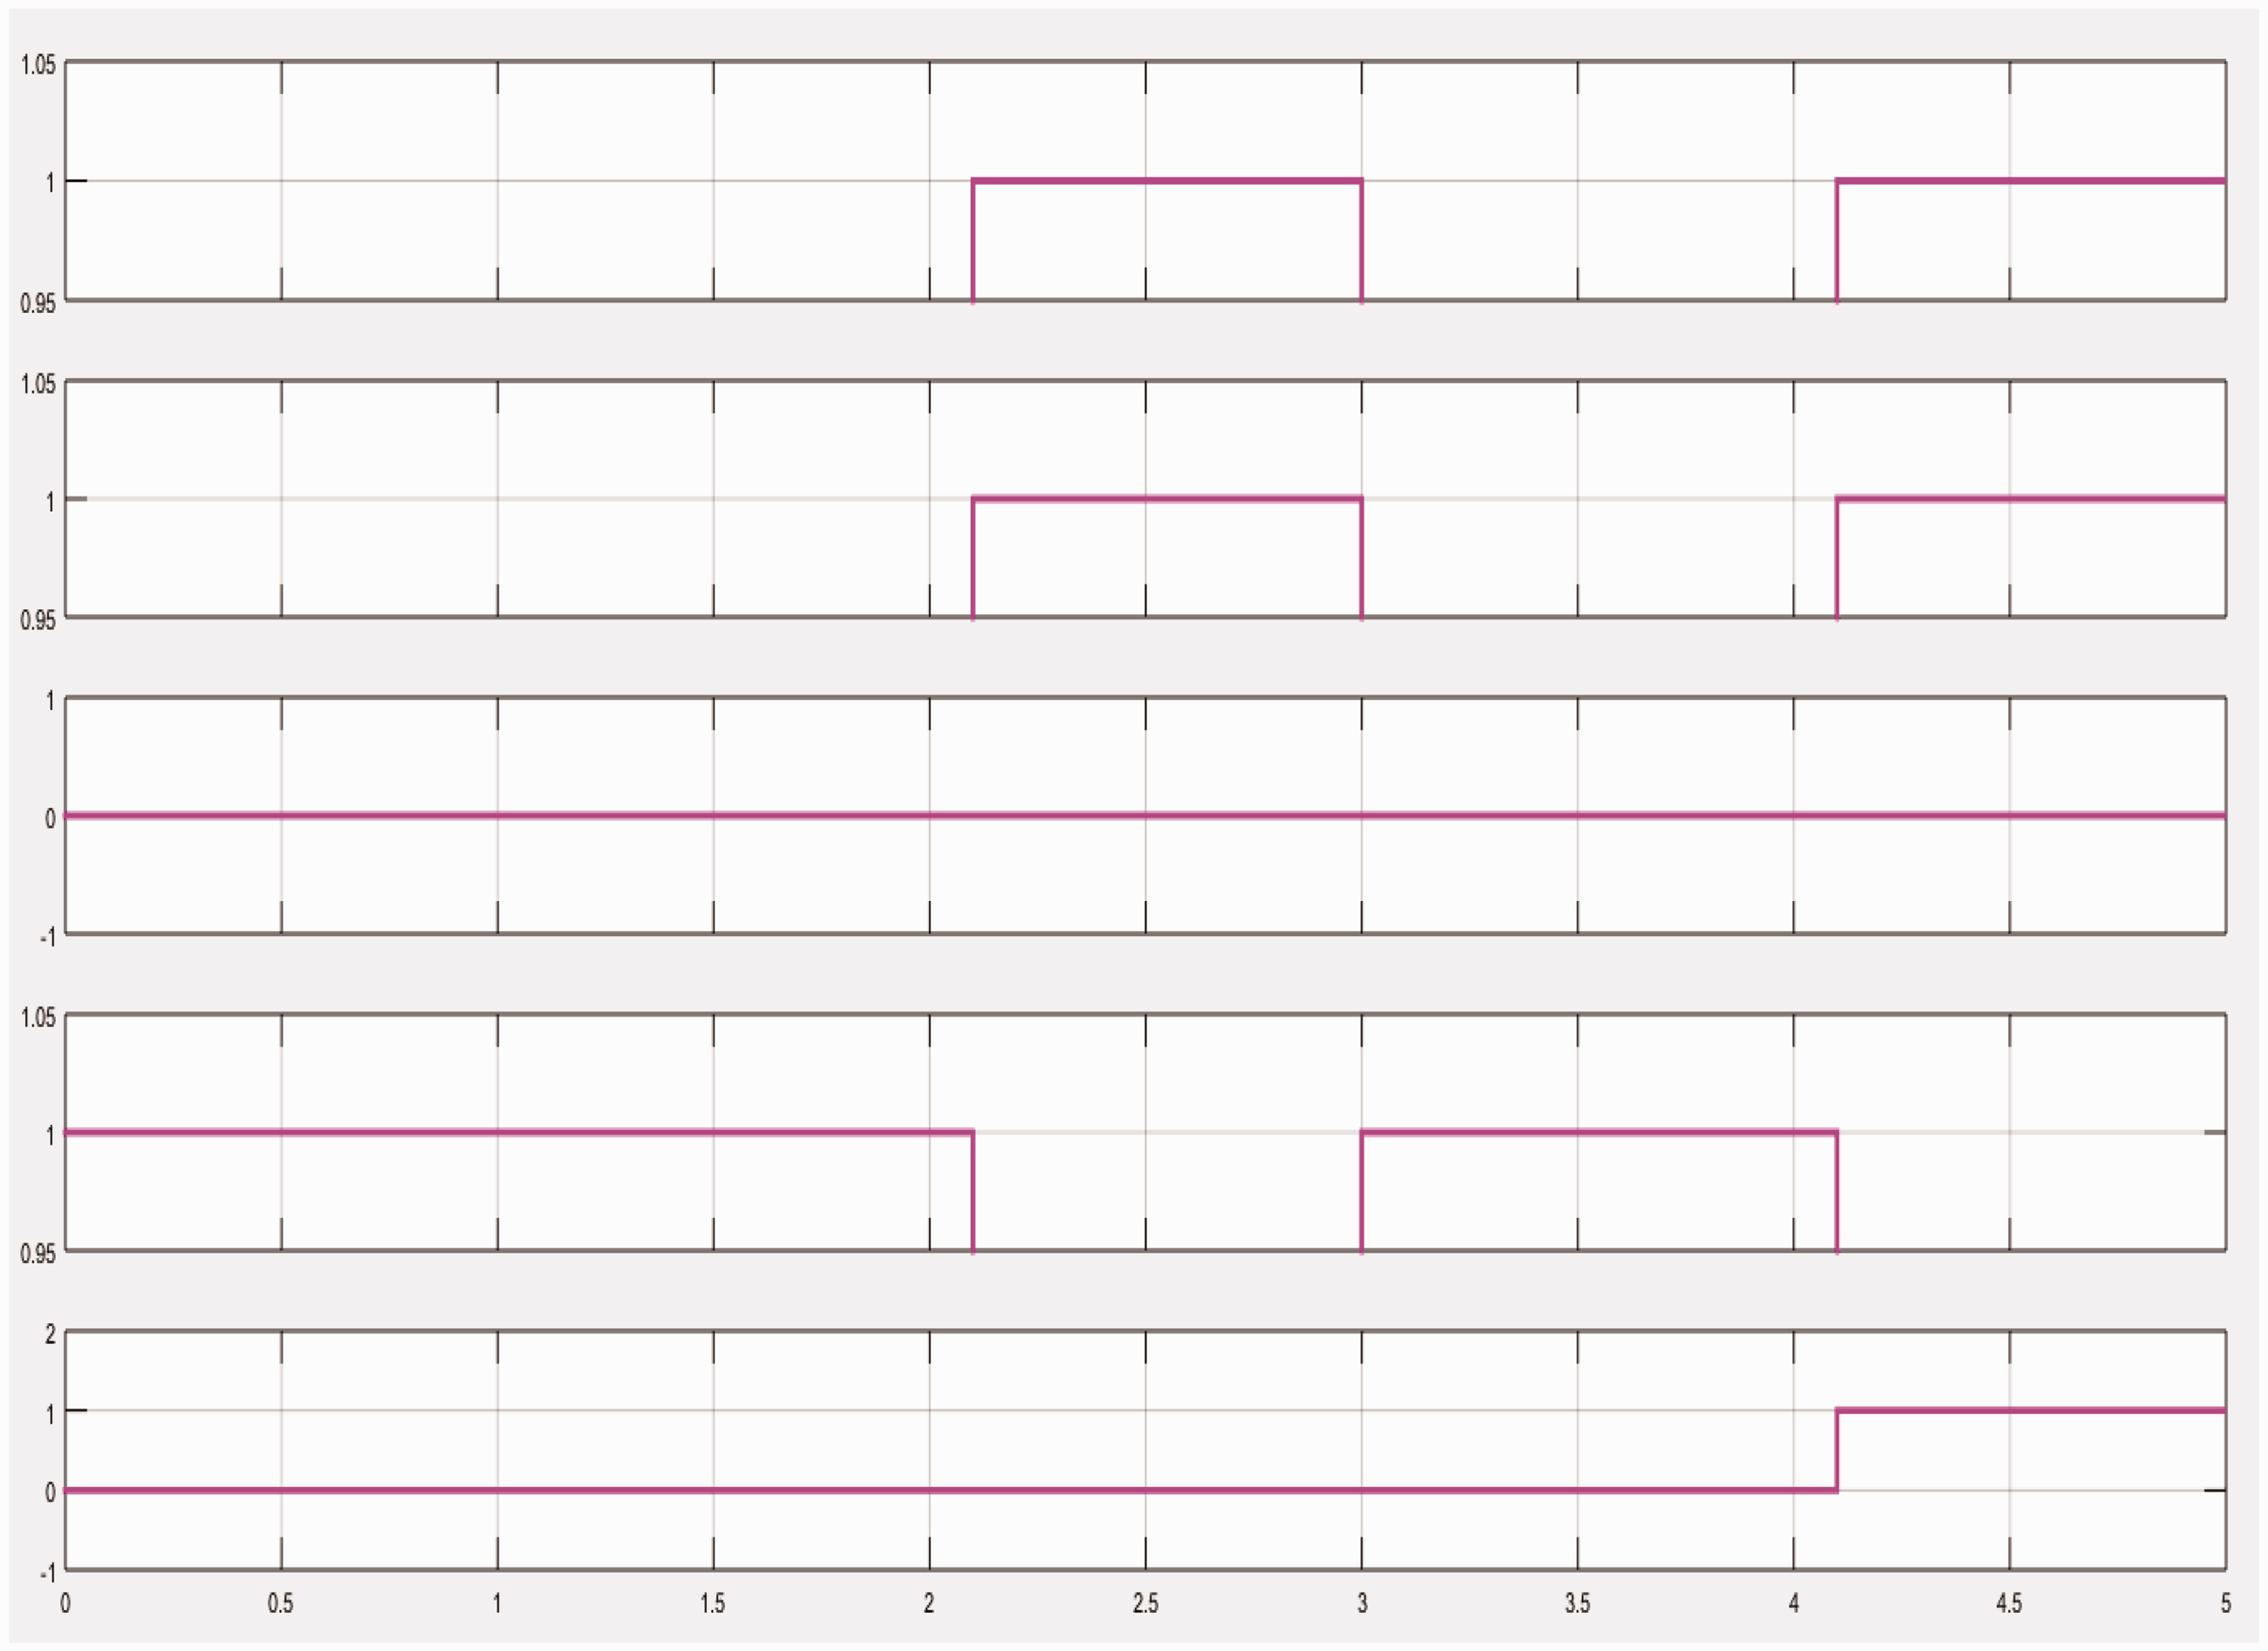
Figures 17 to 21 shows the source power and load power waveforms and switch status for case I scenario of Table 4.
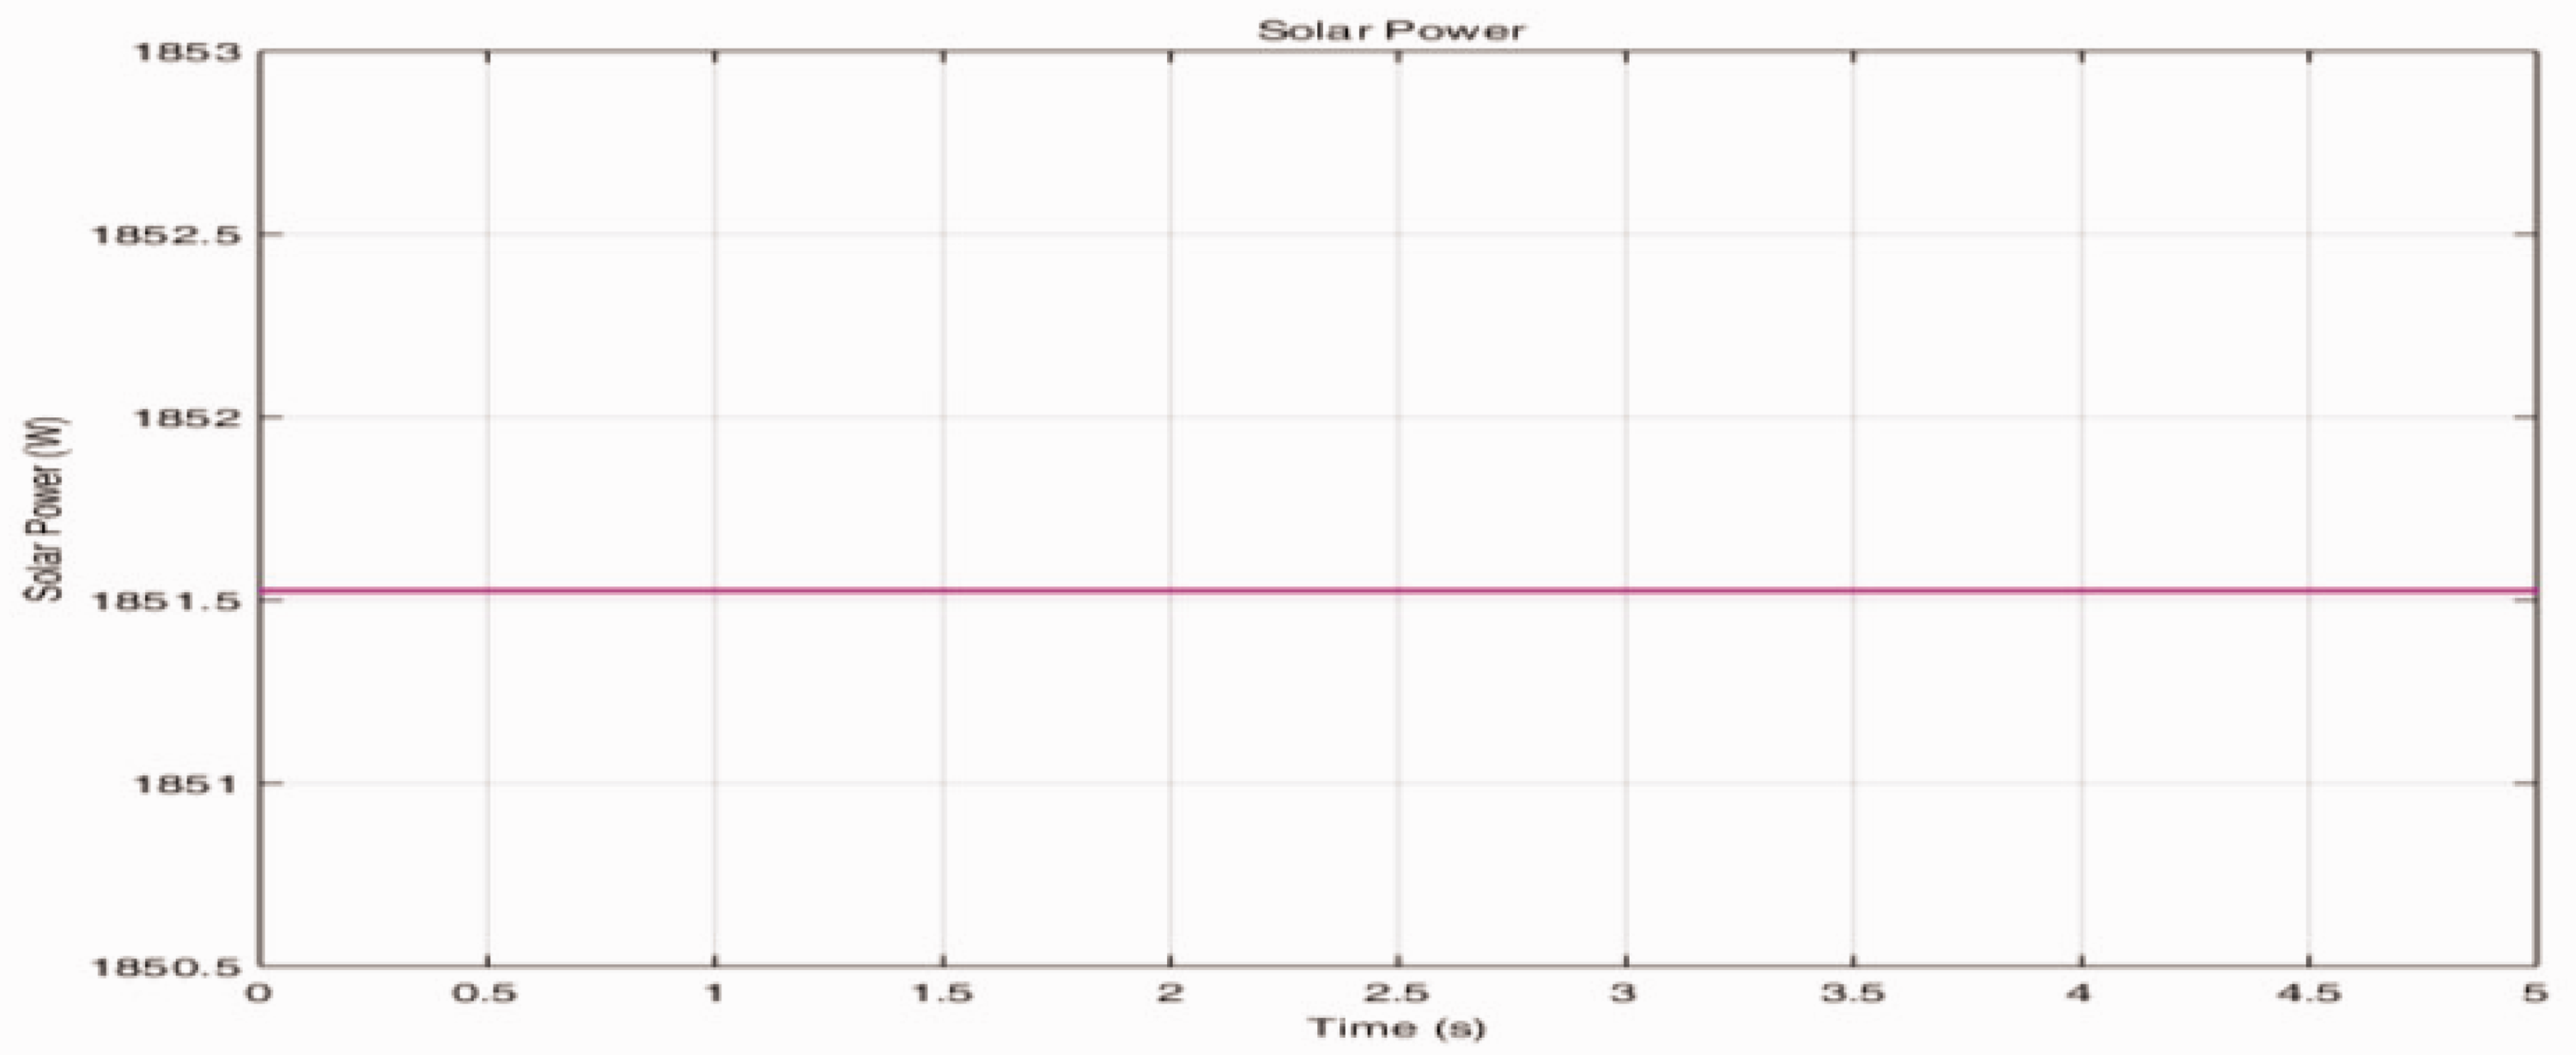
Solar power.
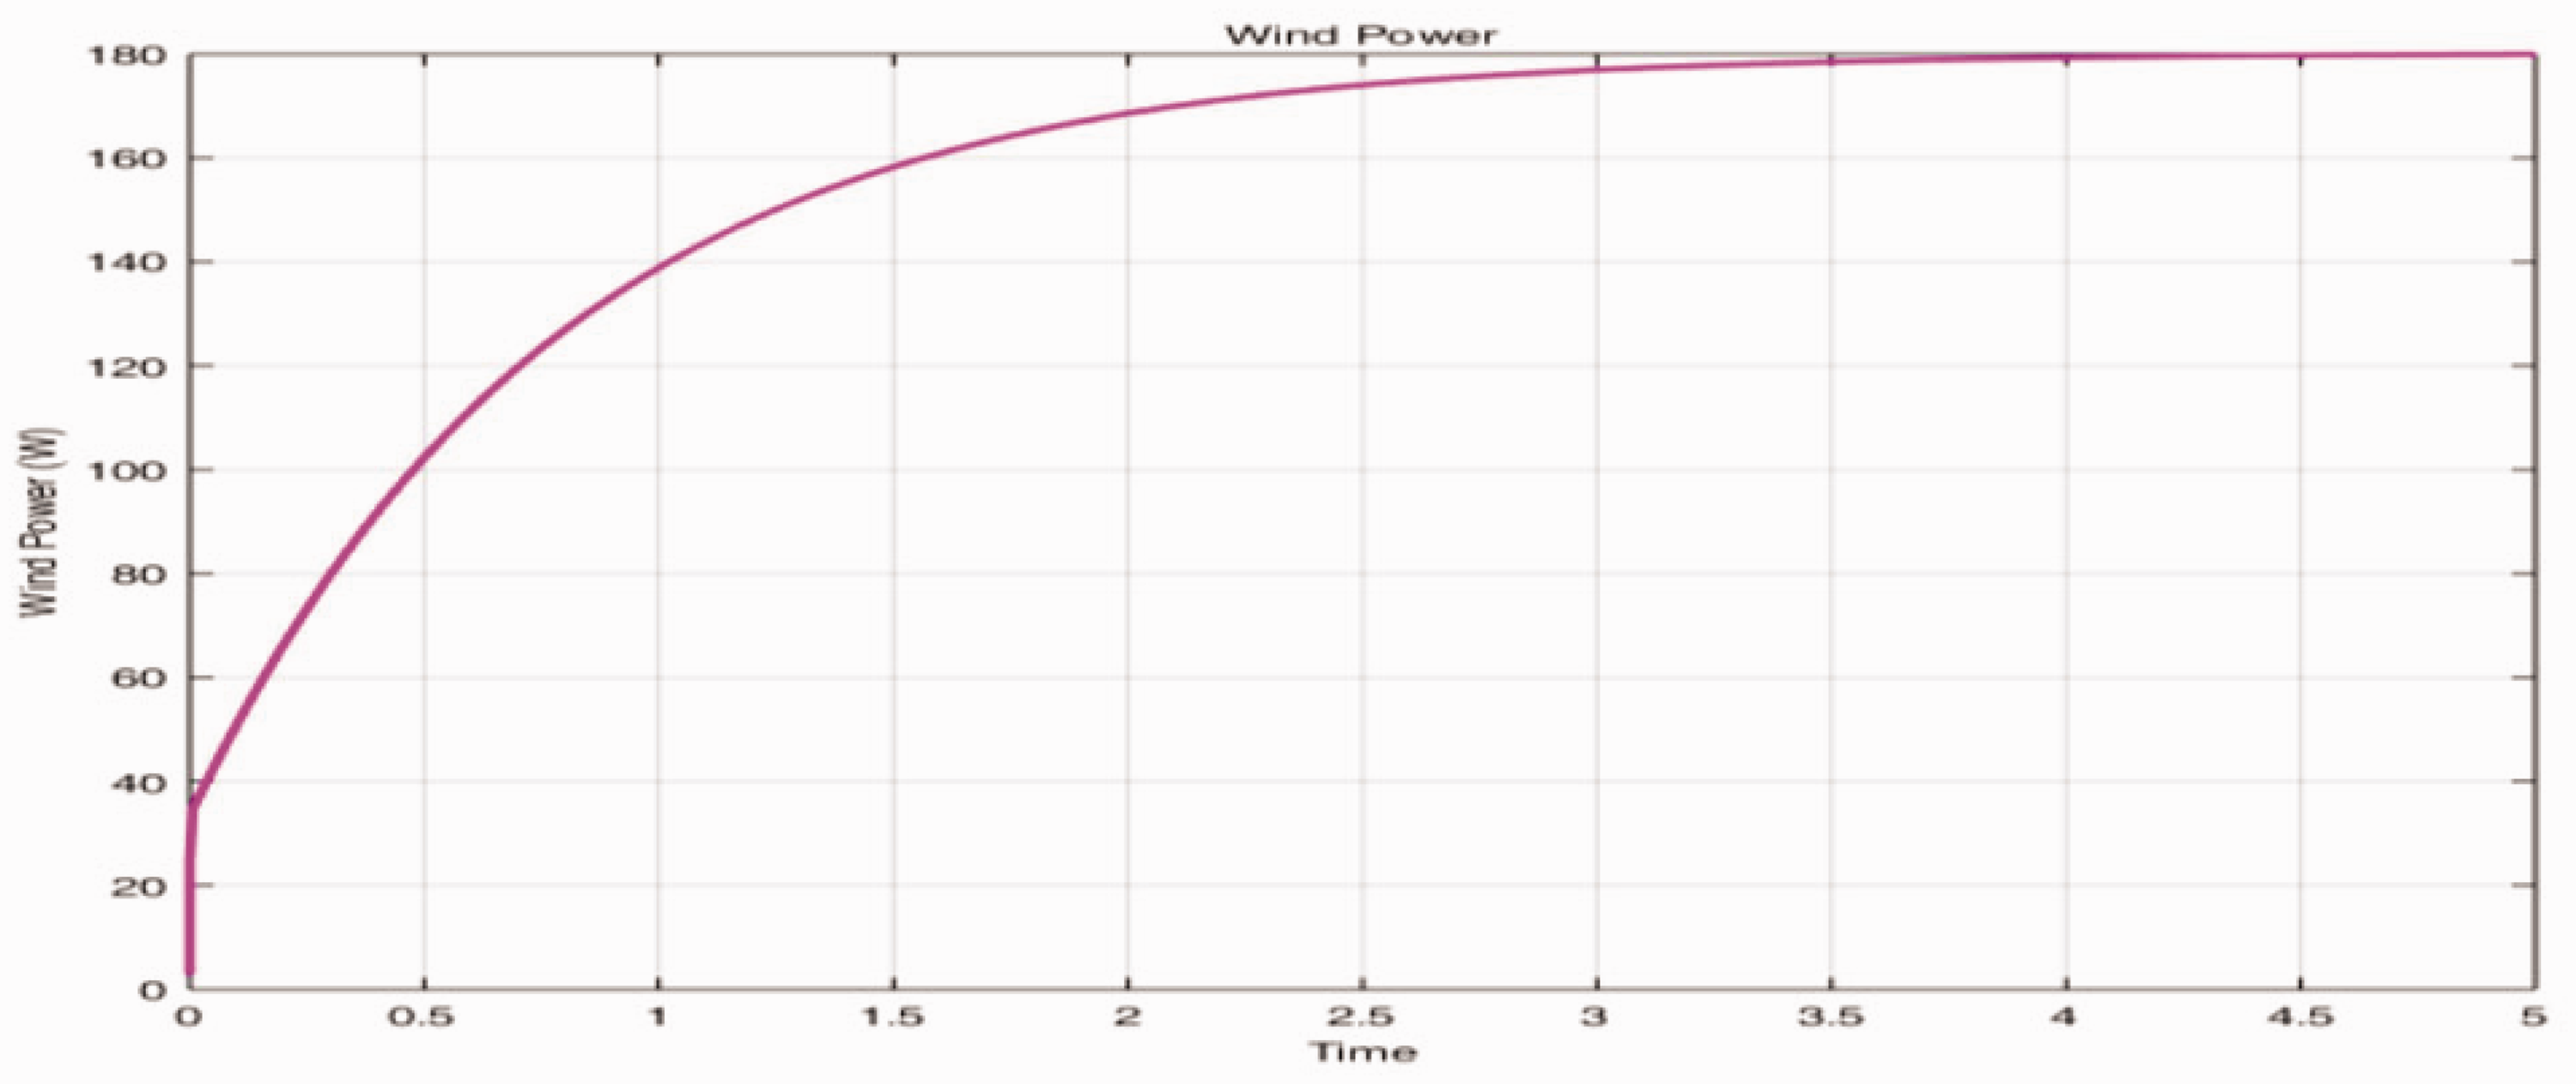
Wind power.
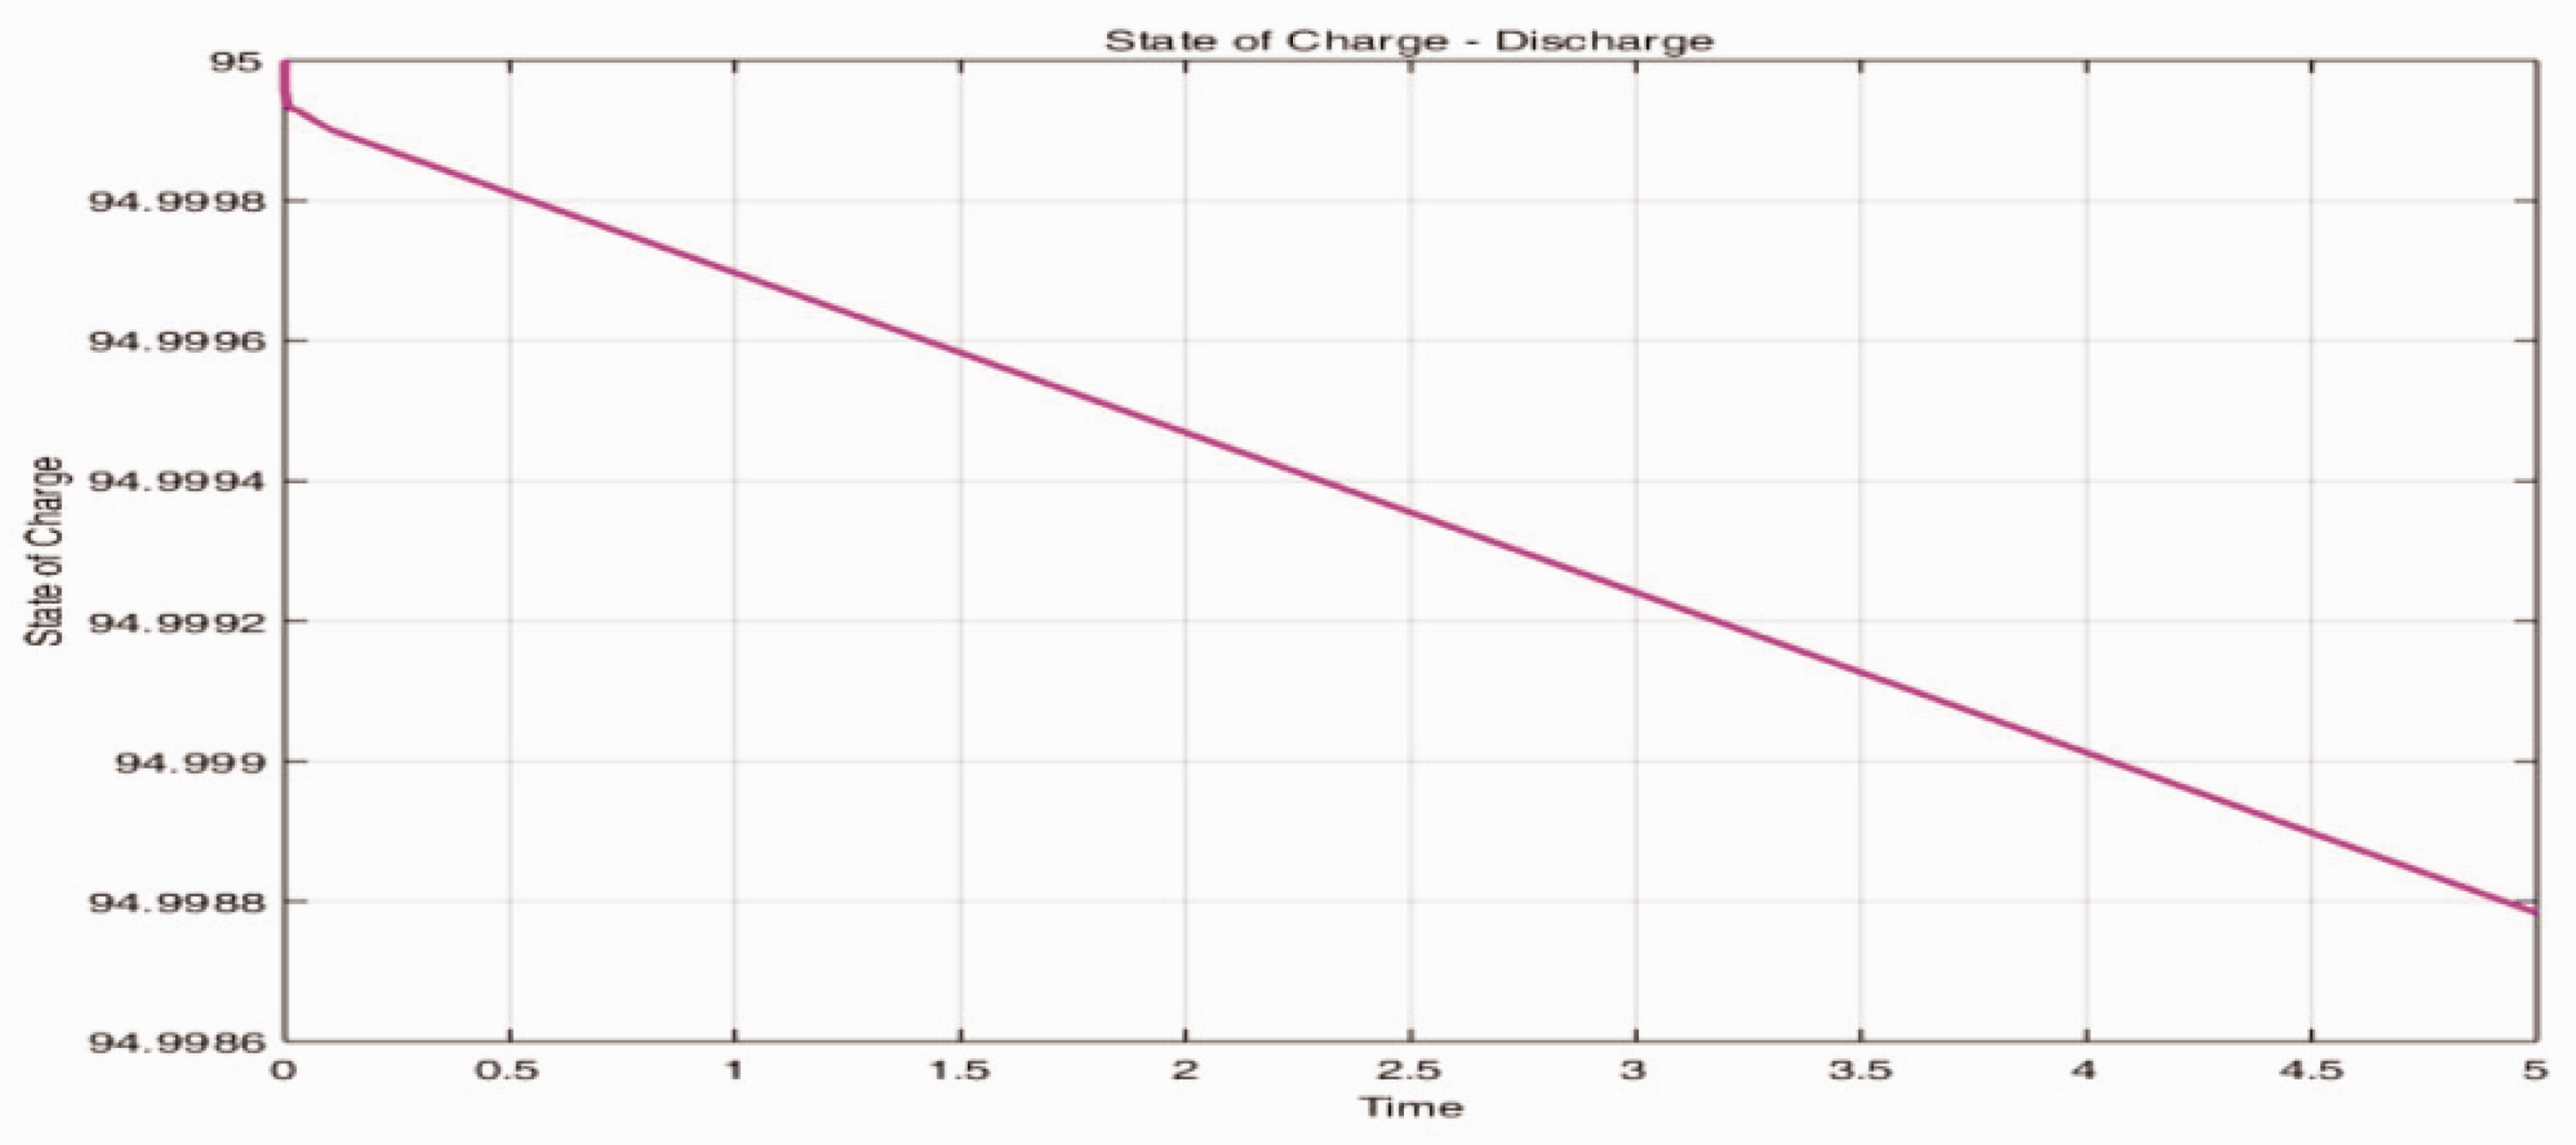
Battery power.
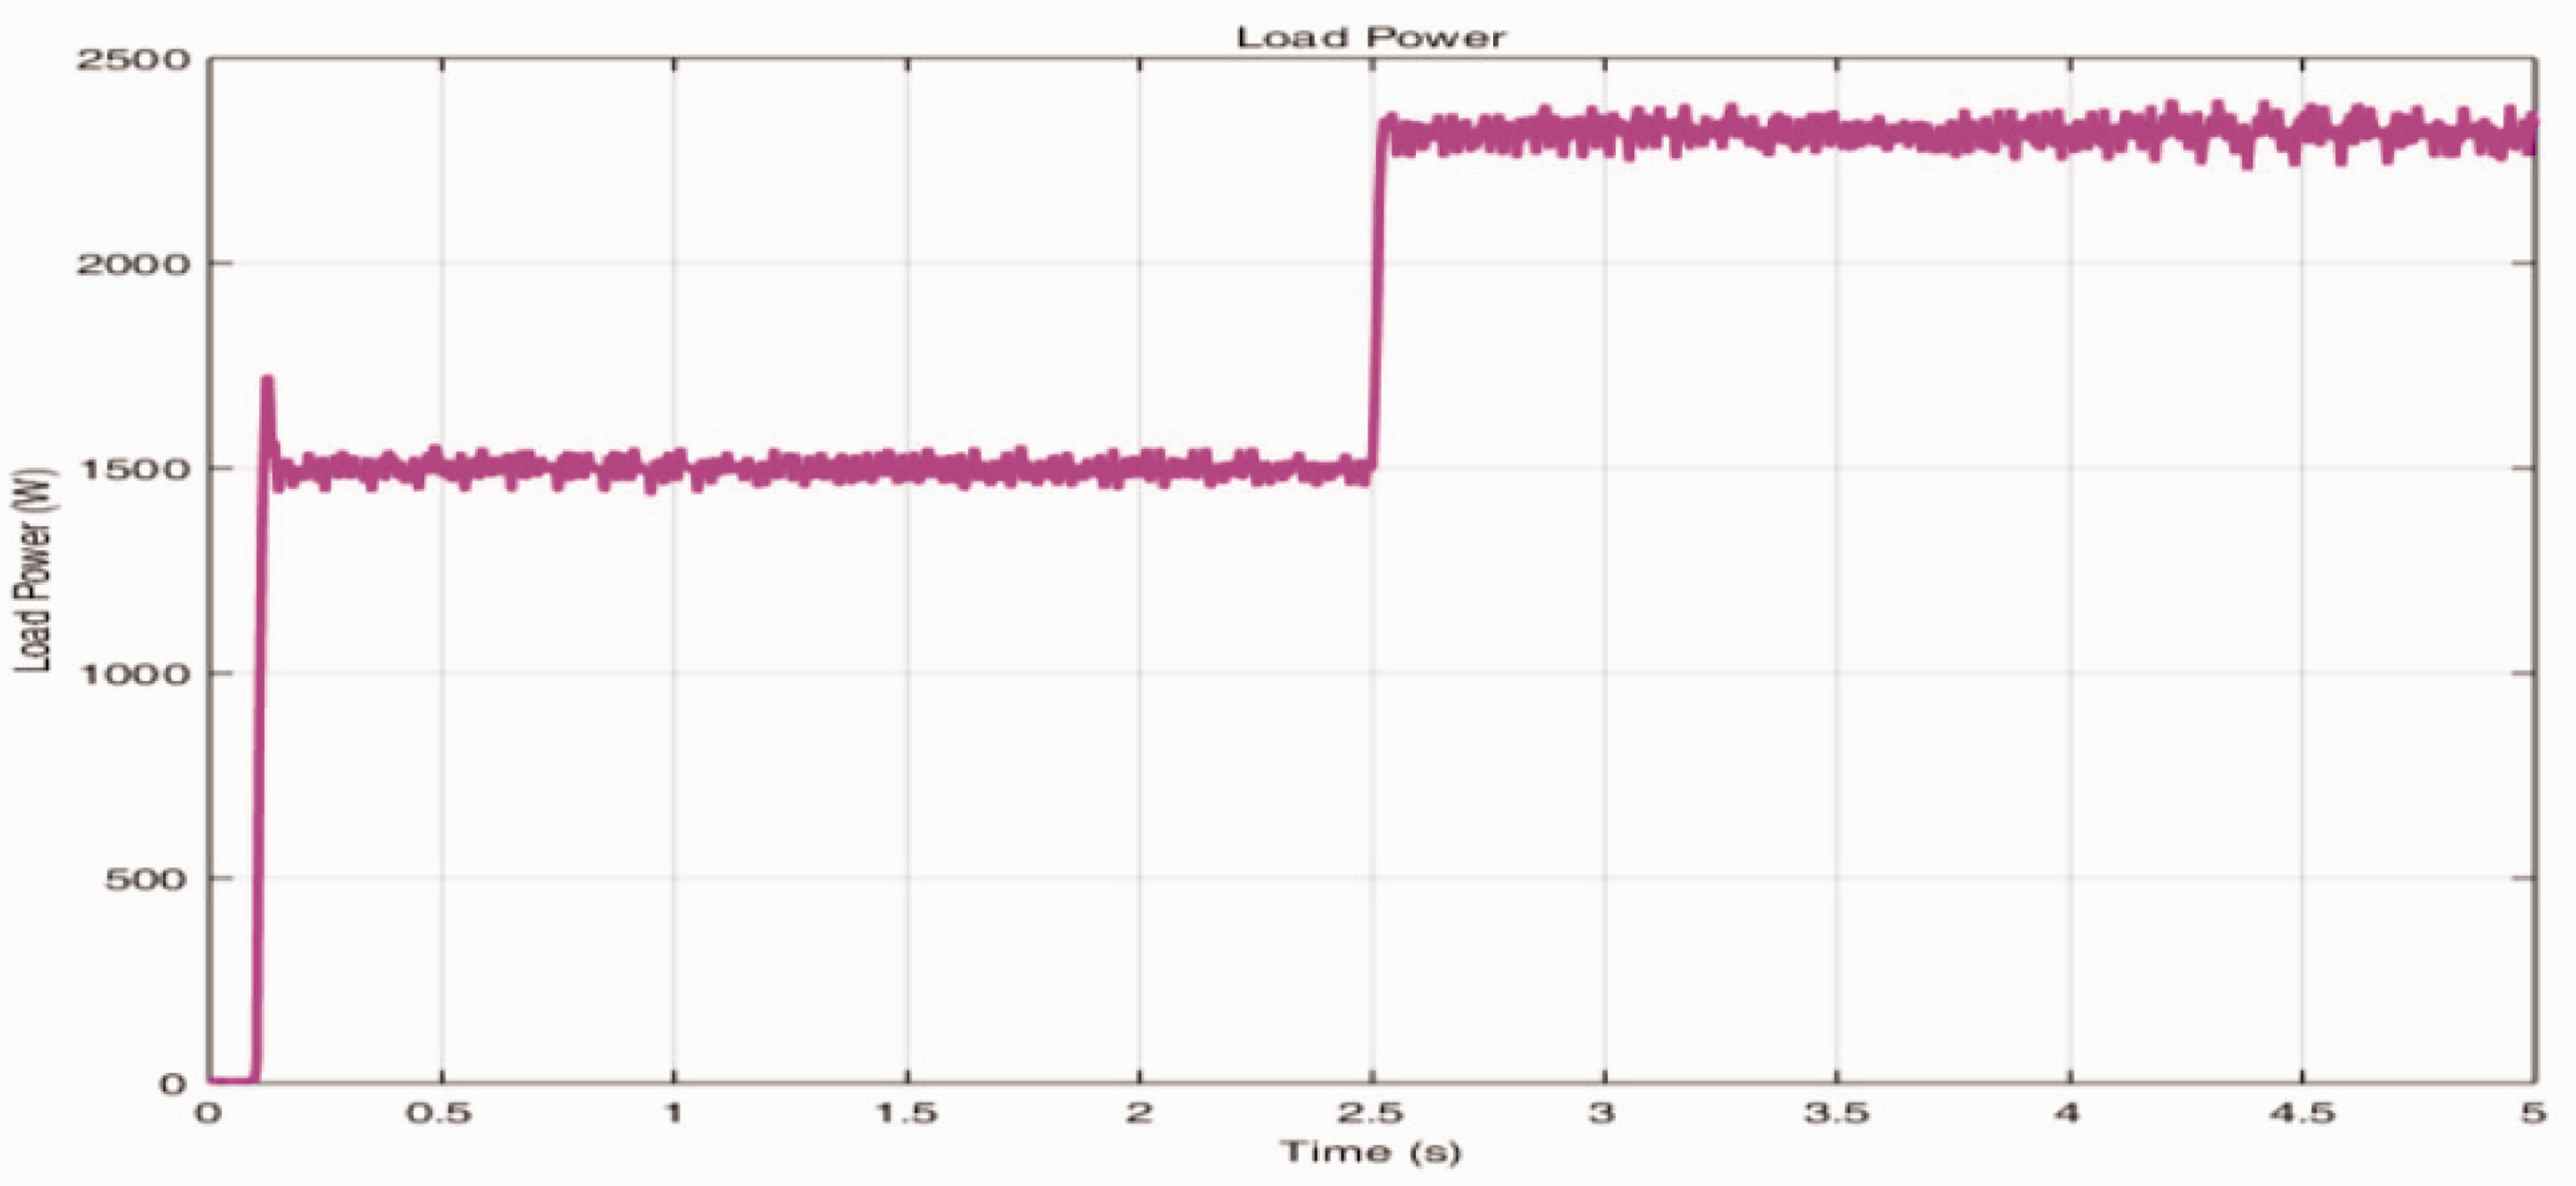
Load power.
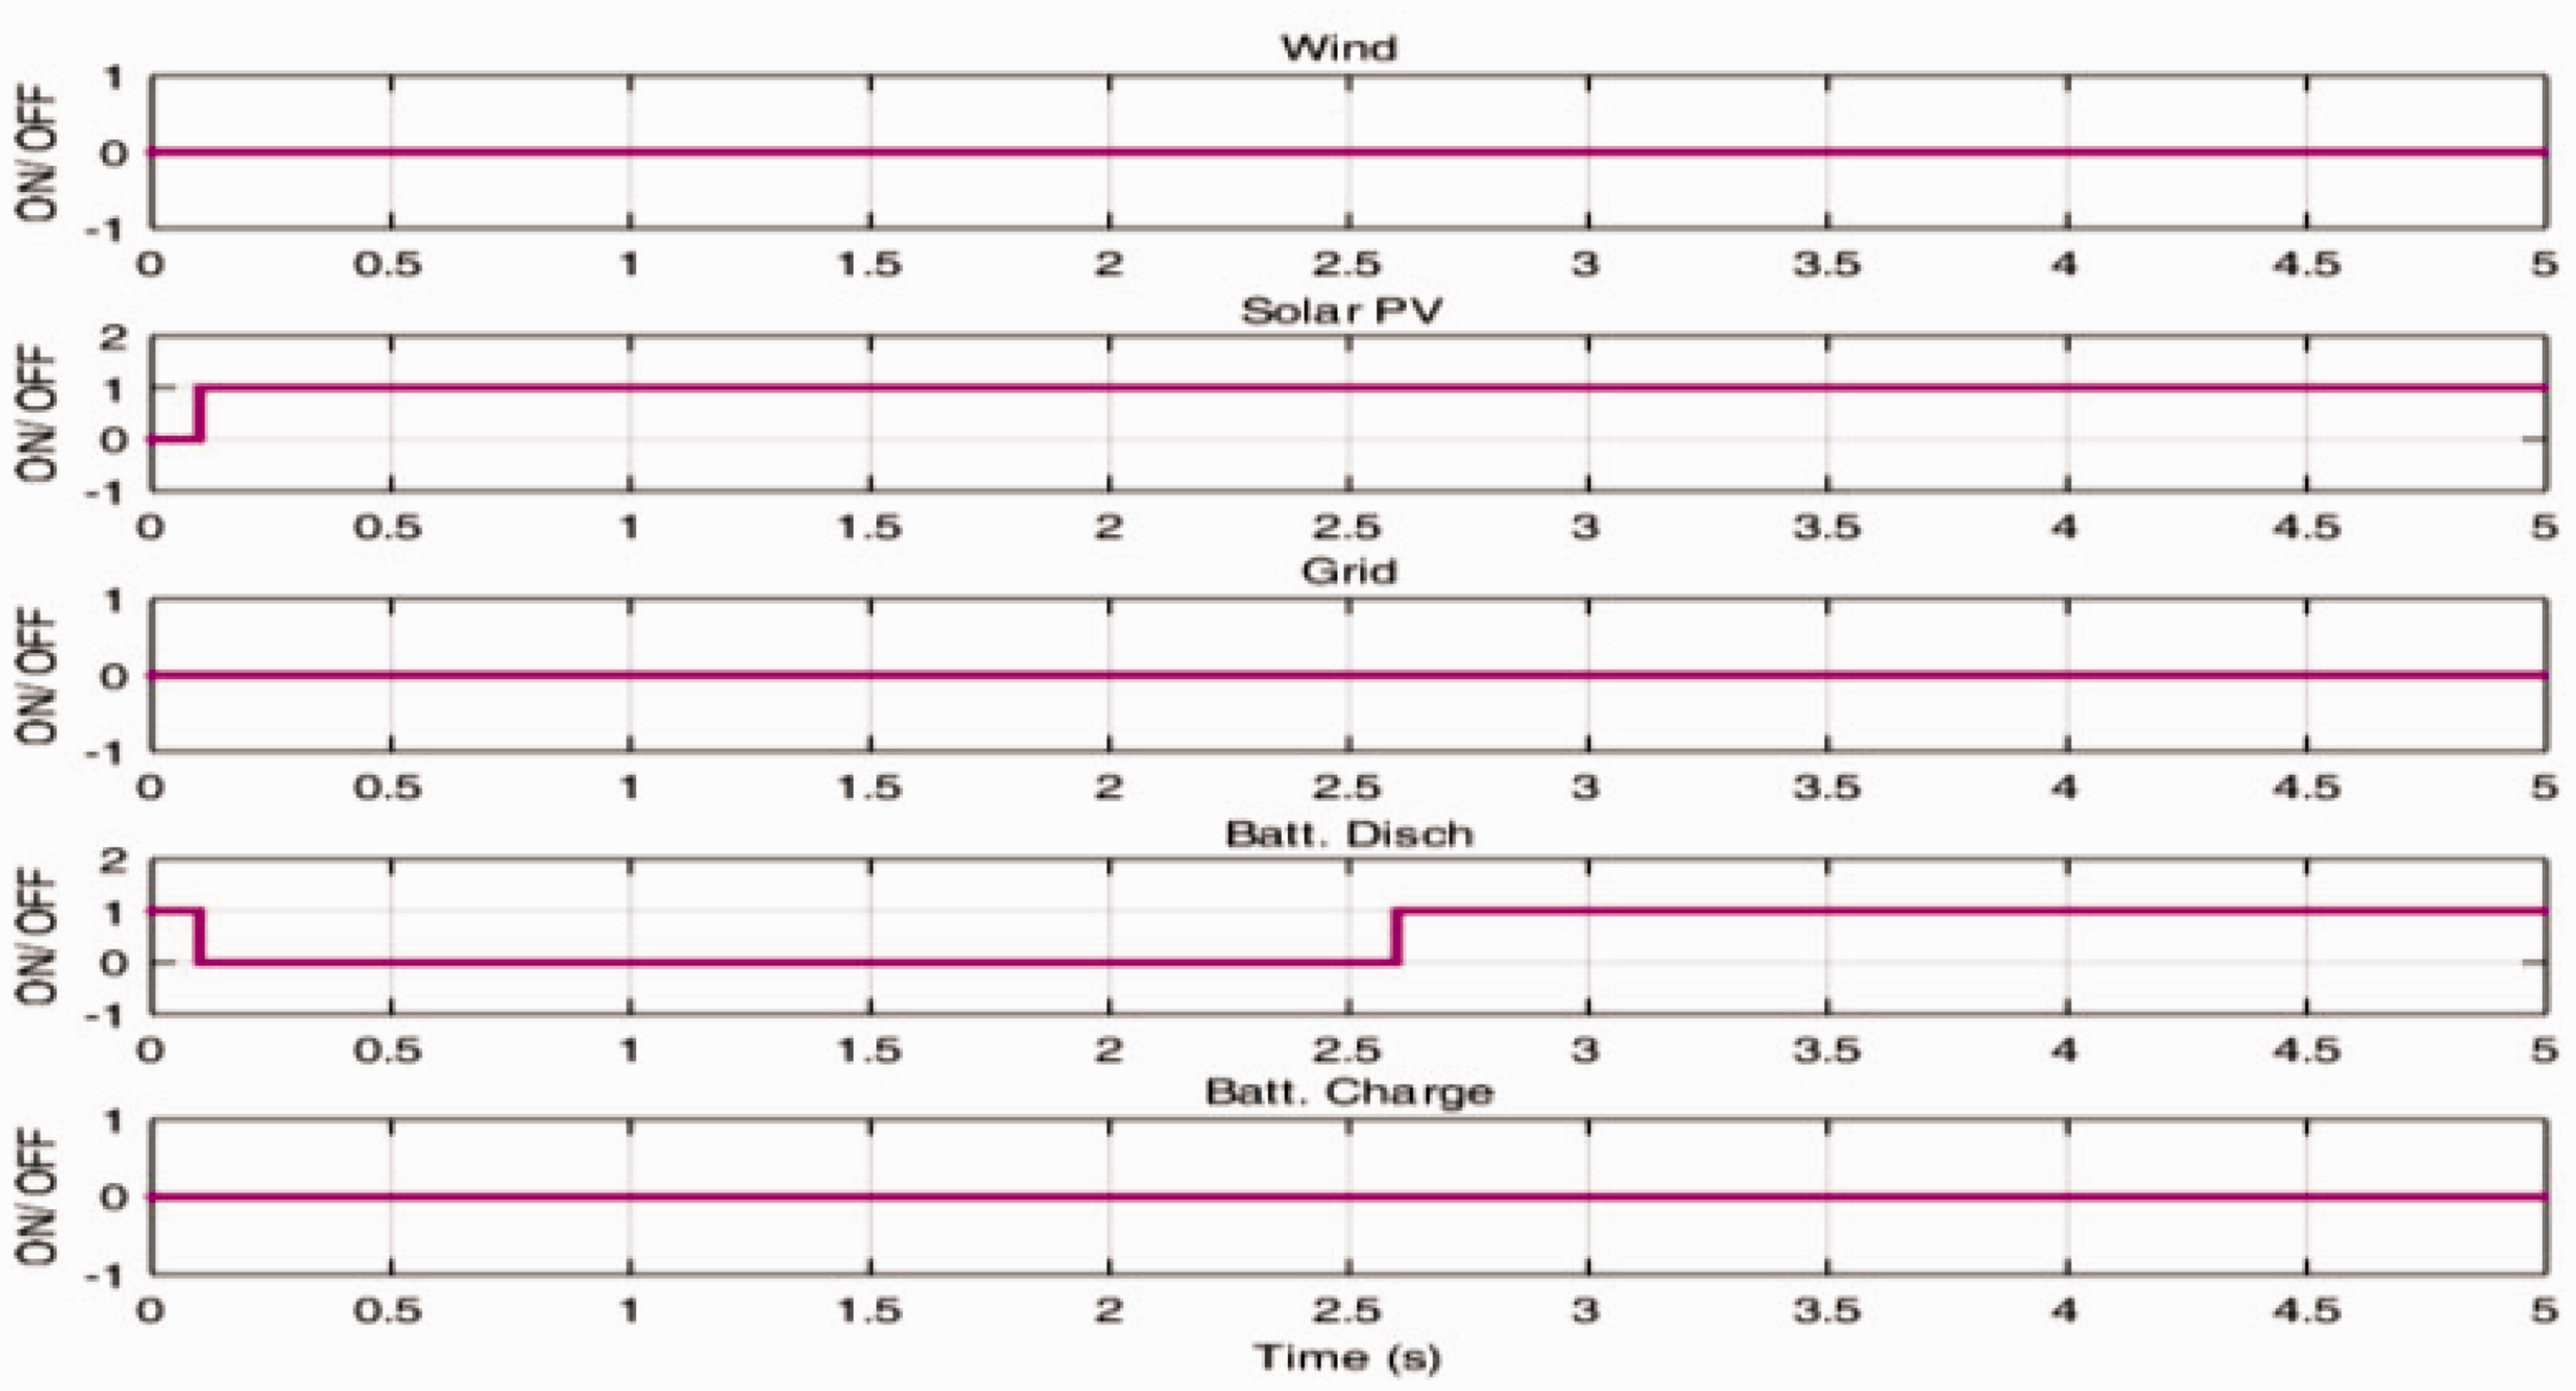
Switch status for Case I in Table 4.
Figures 22 to 26 shows the source power and load power waveforms and switch status for case II scenario of Table 4.
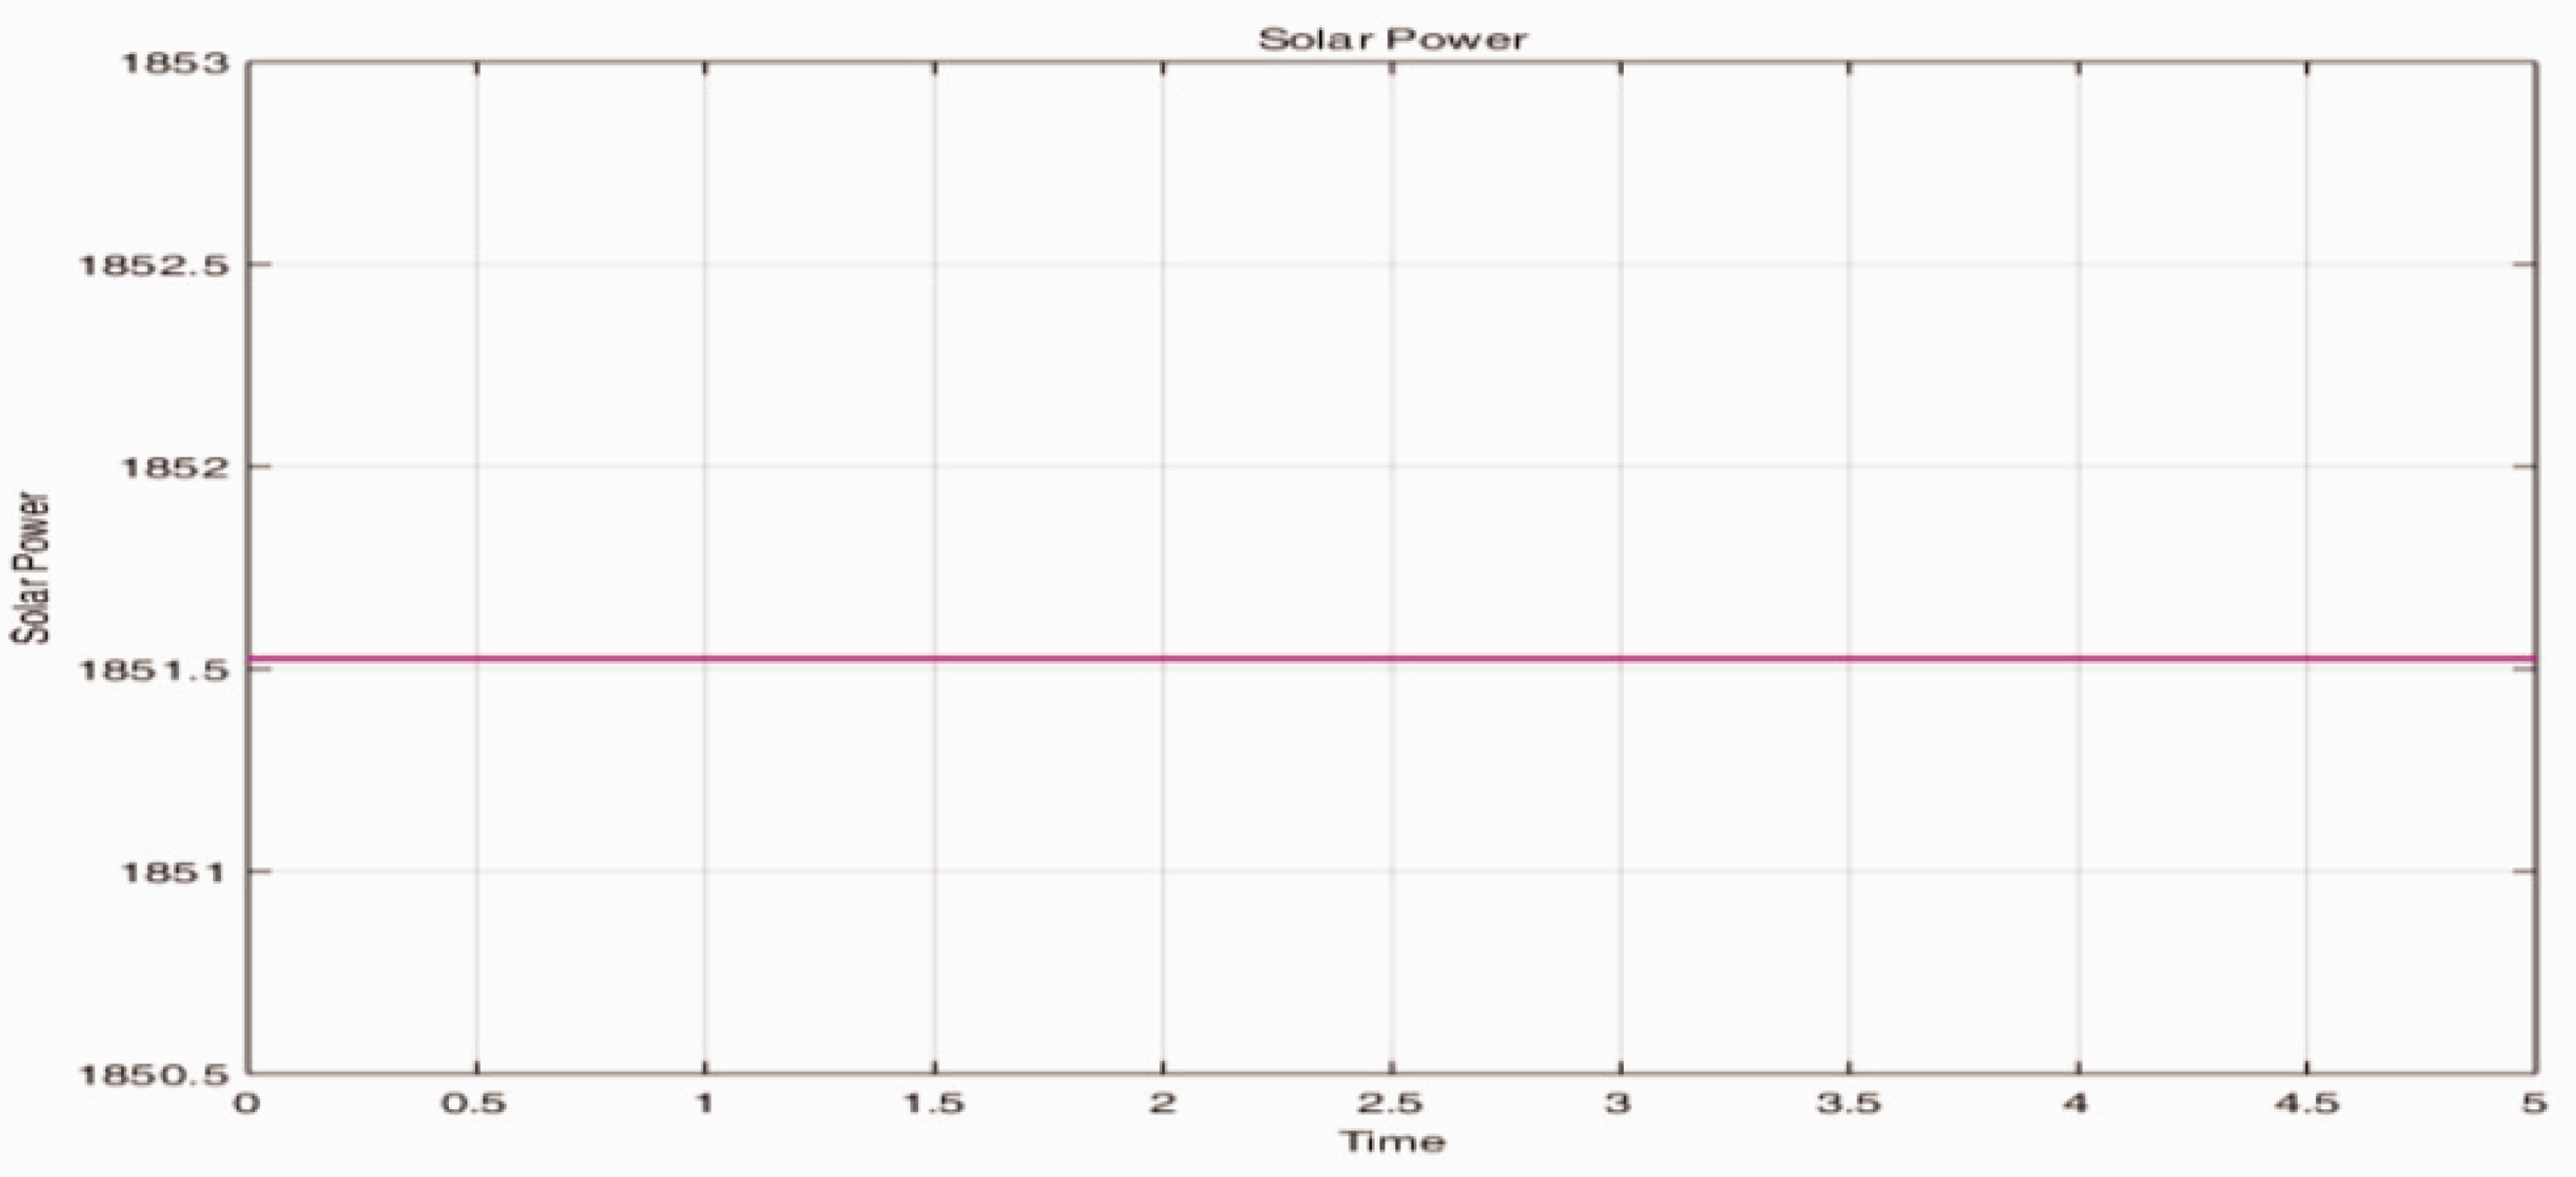
Solar power.
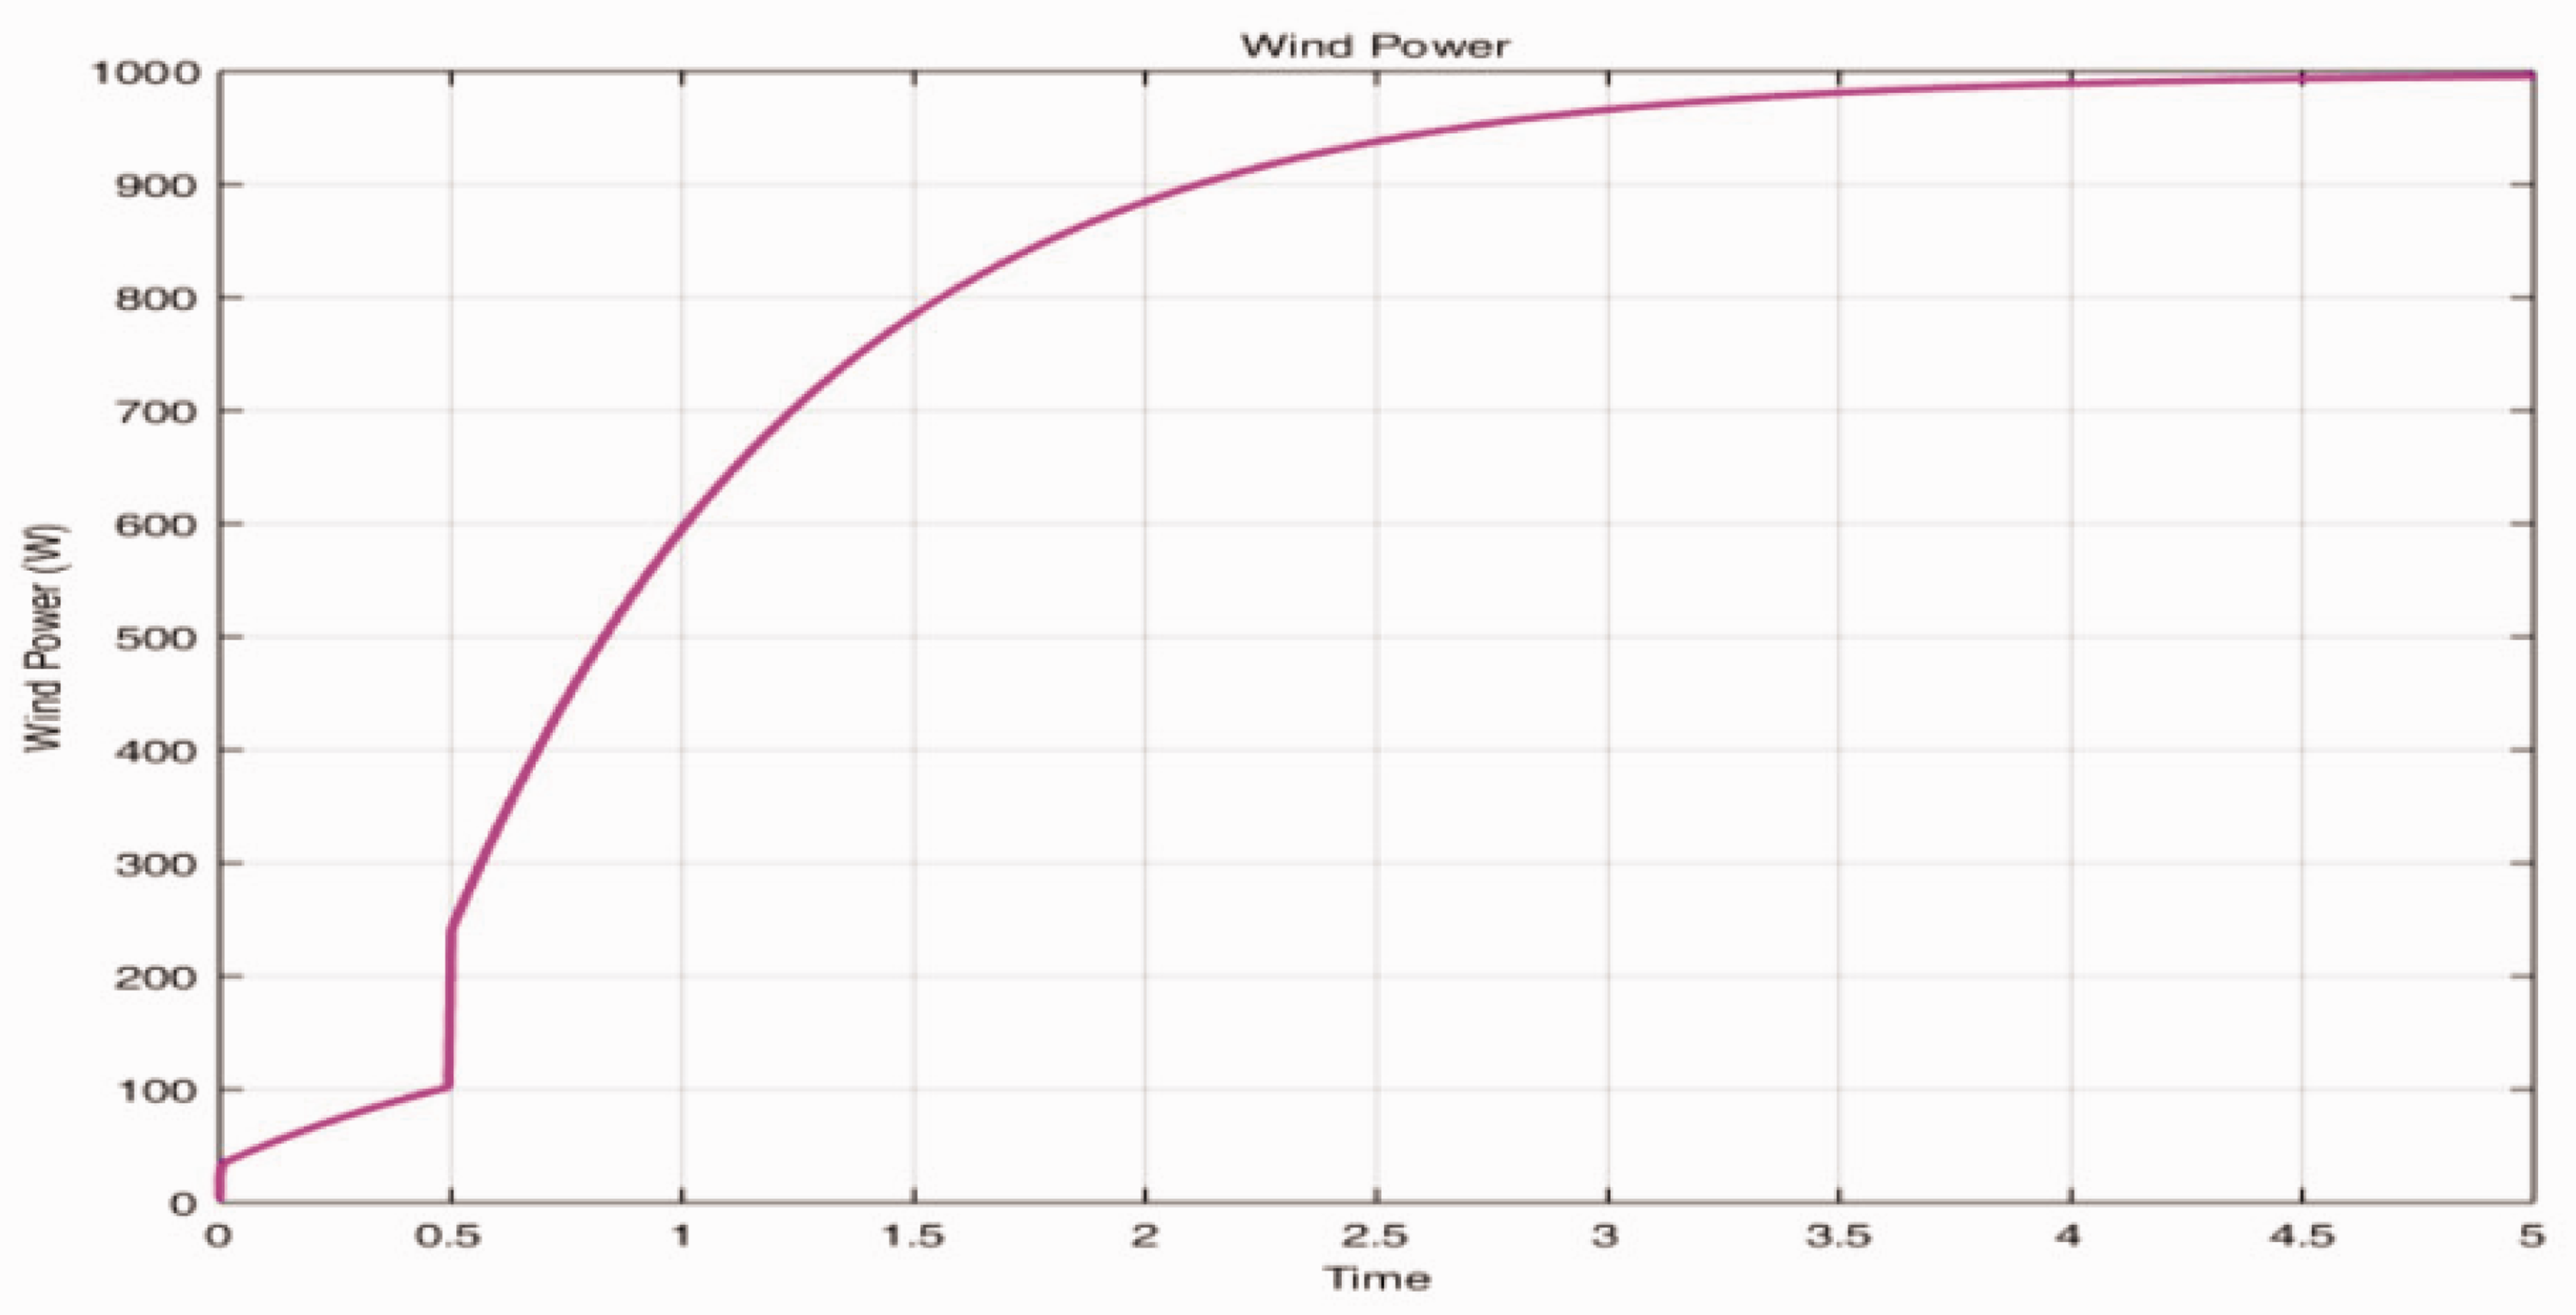
Wind power.
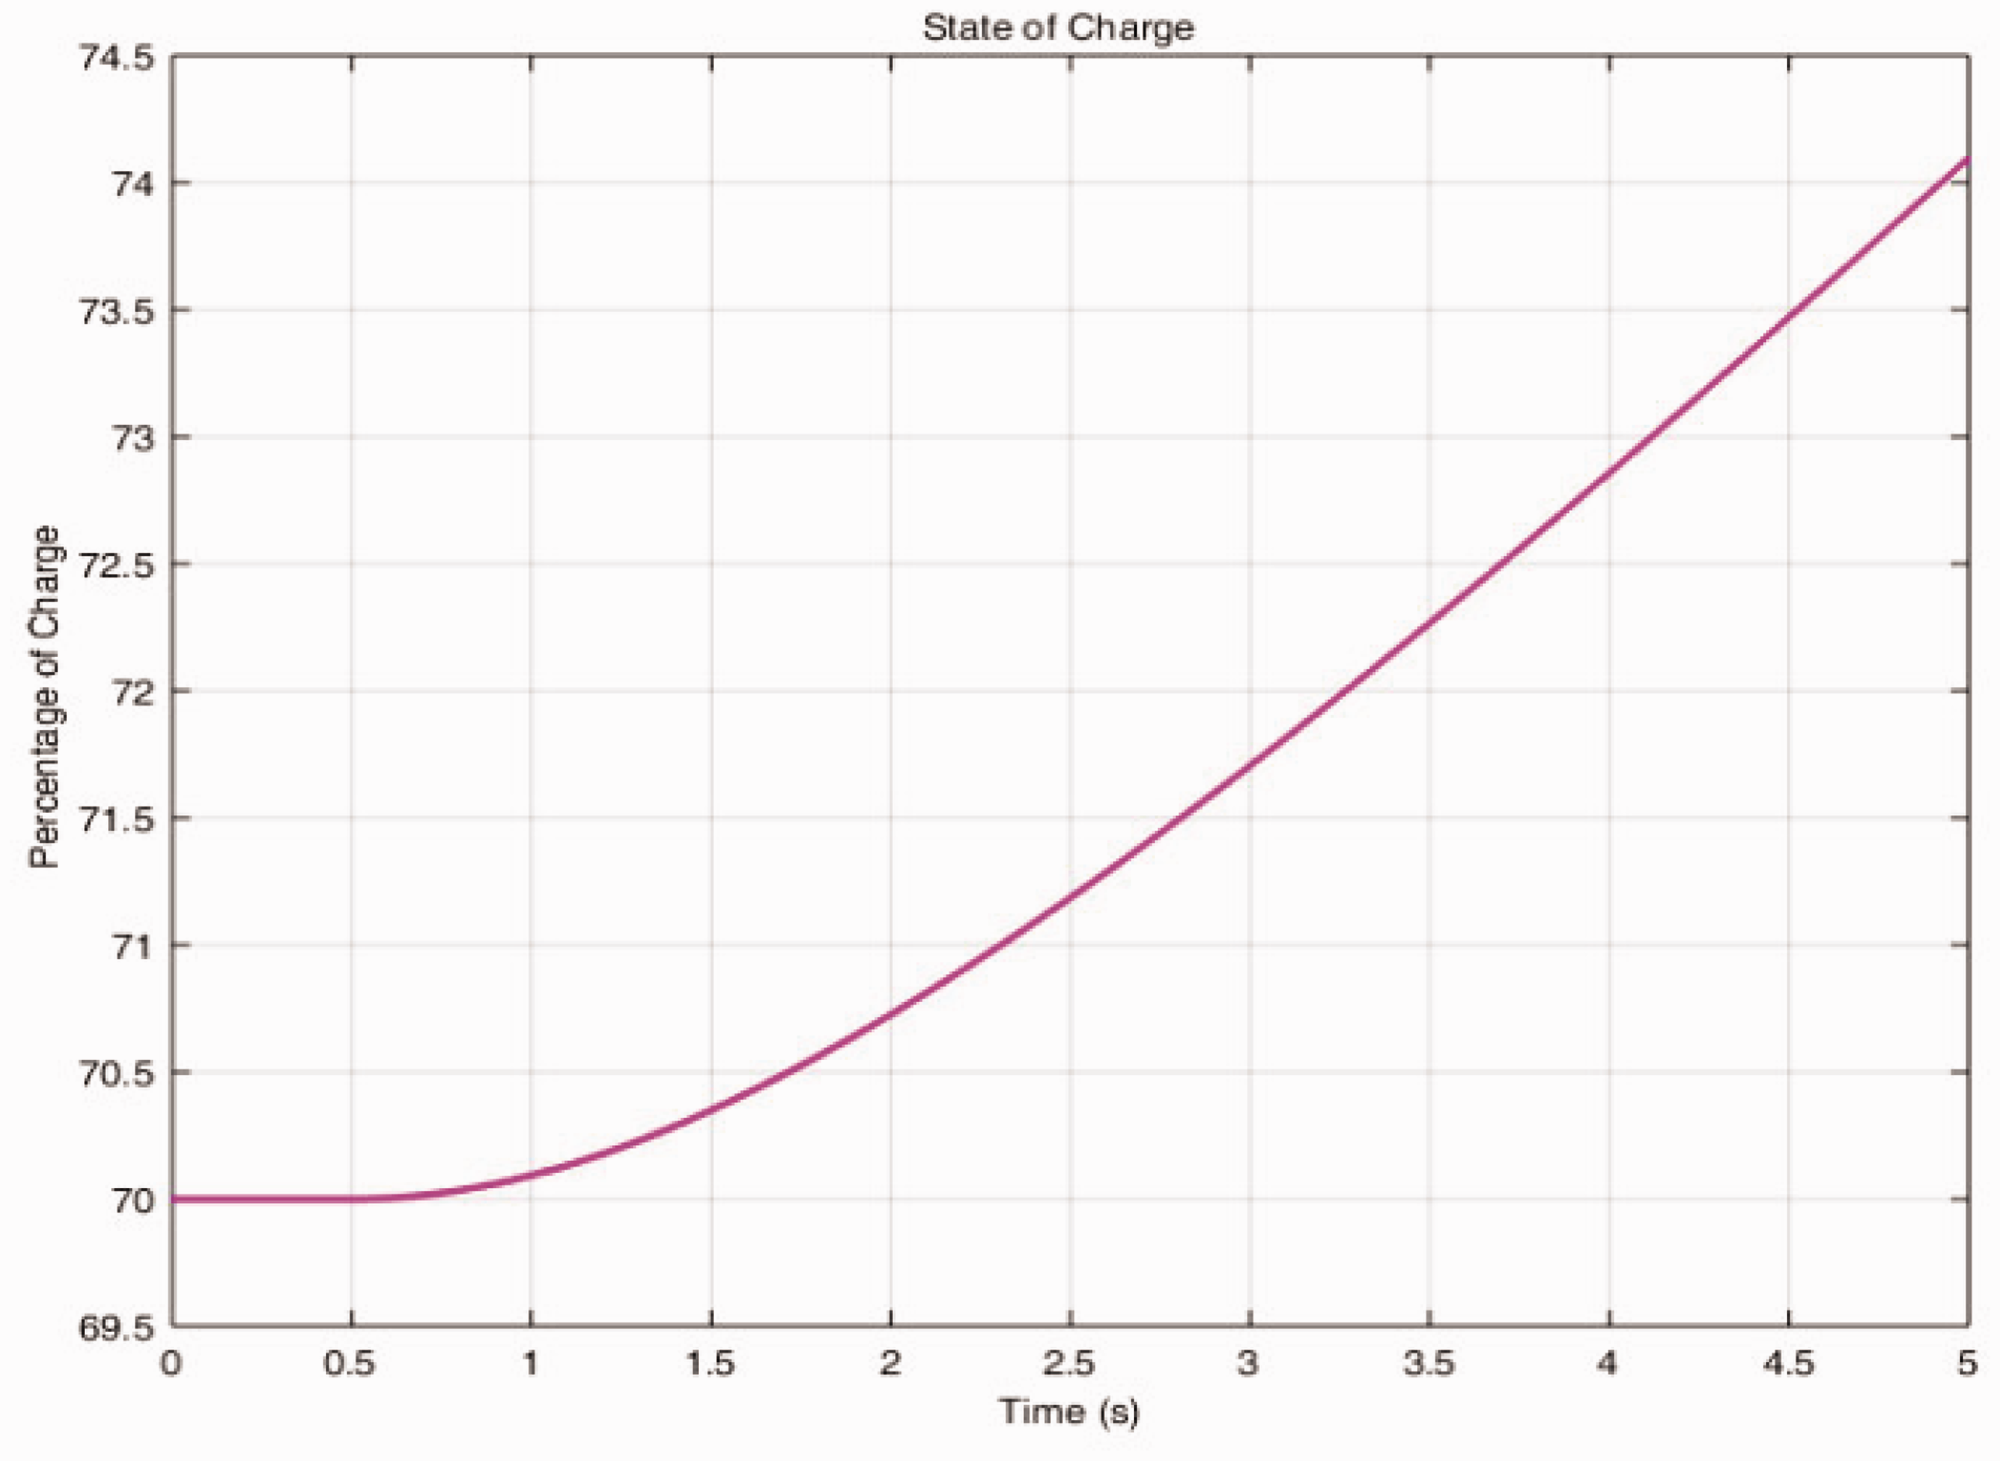
Battery power.
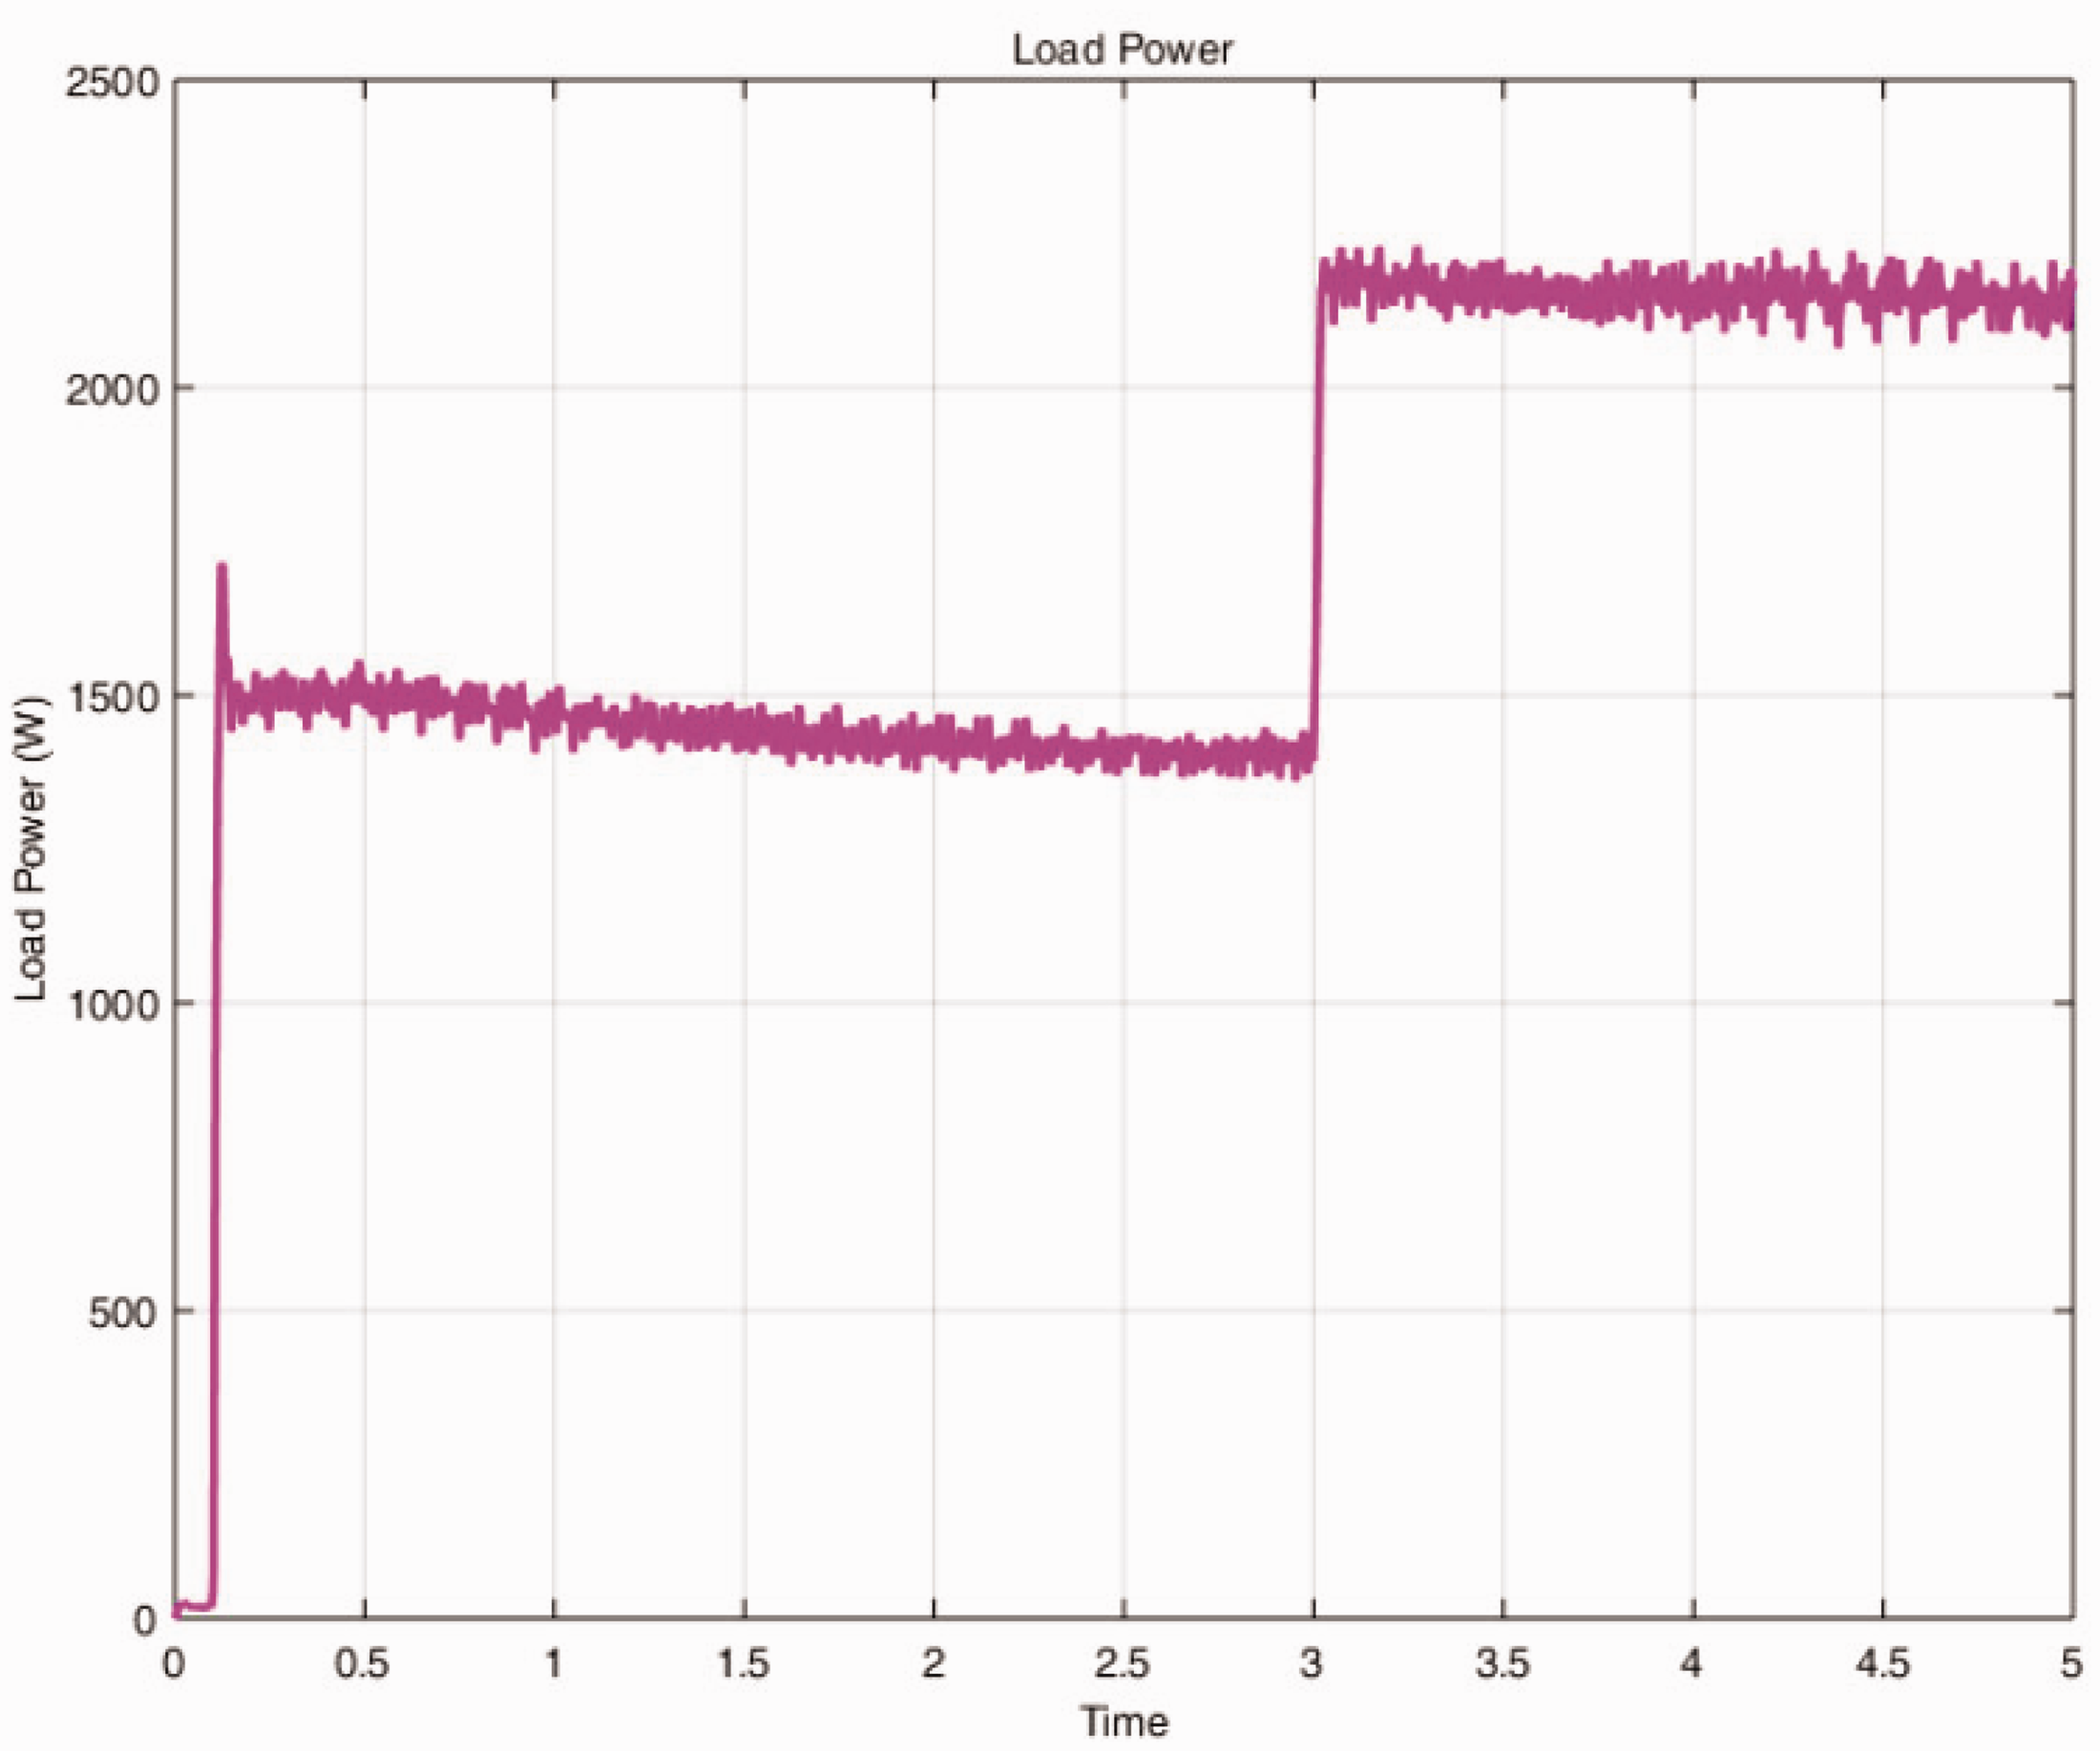
Load power.
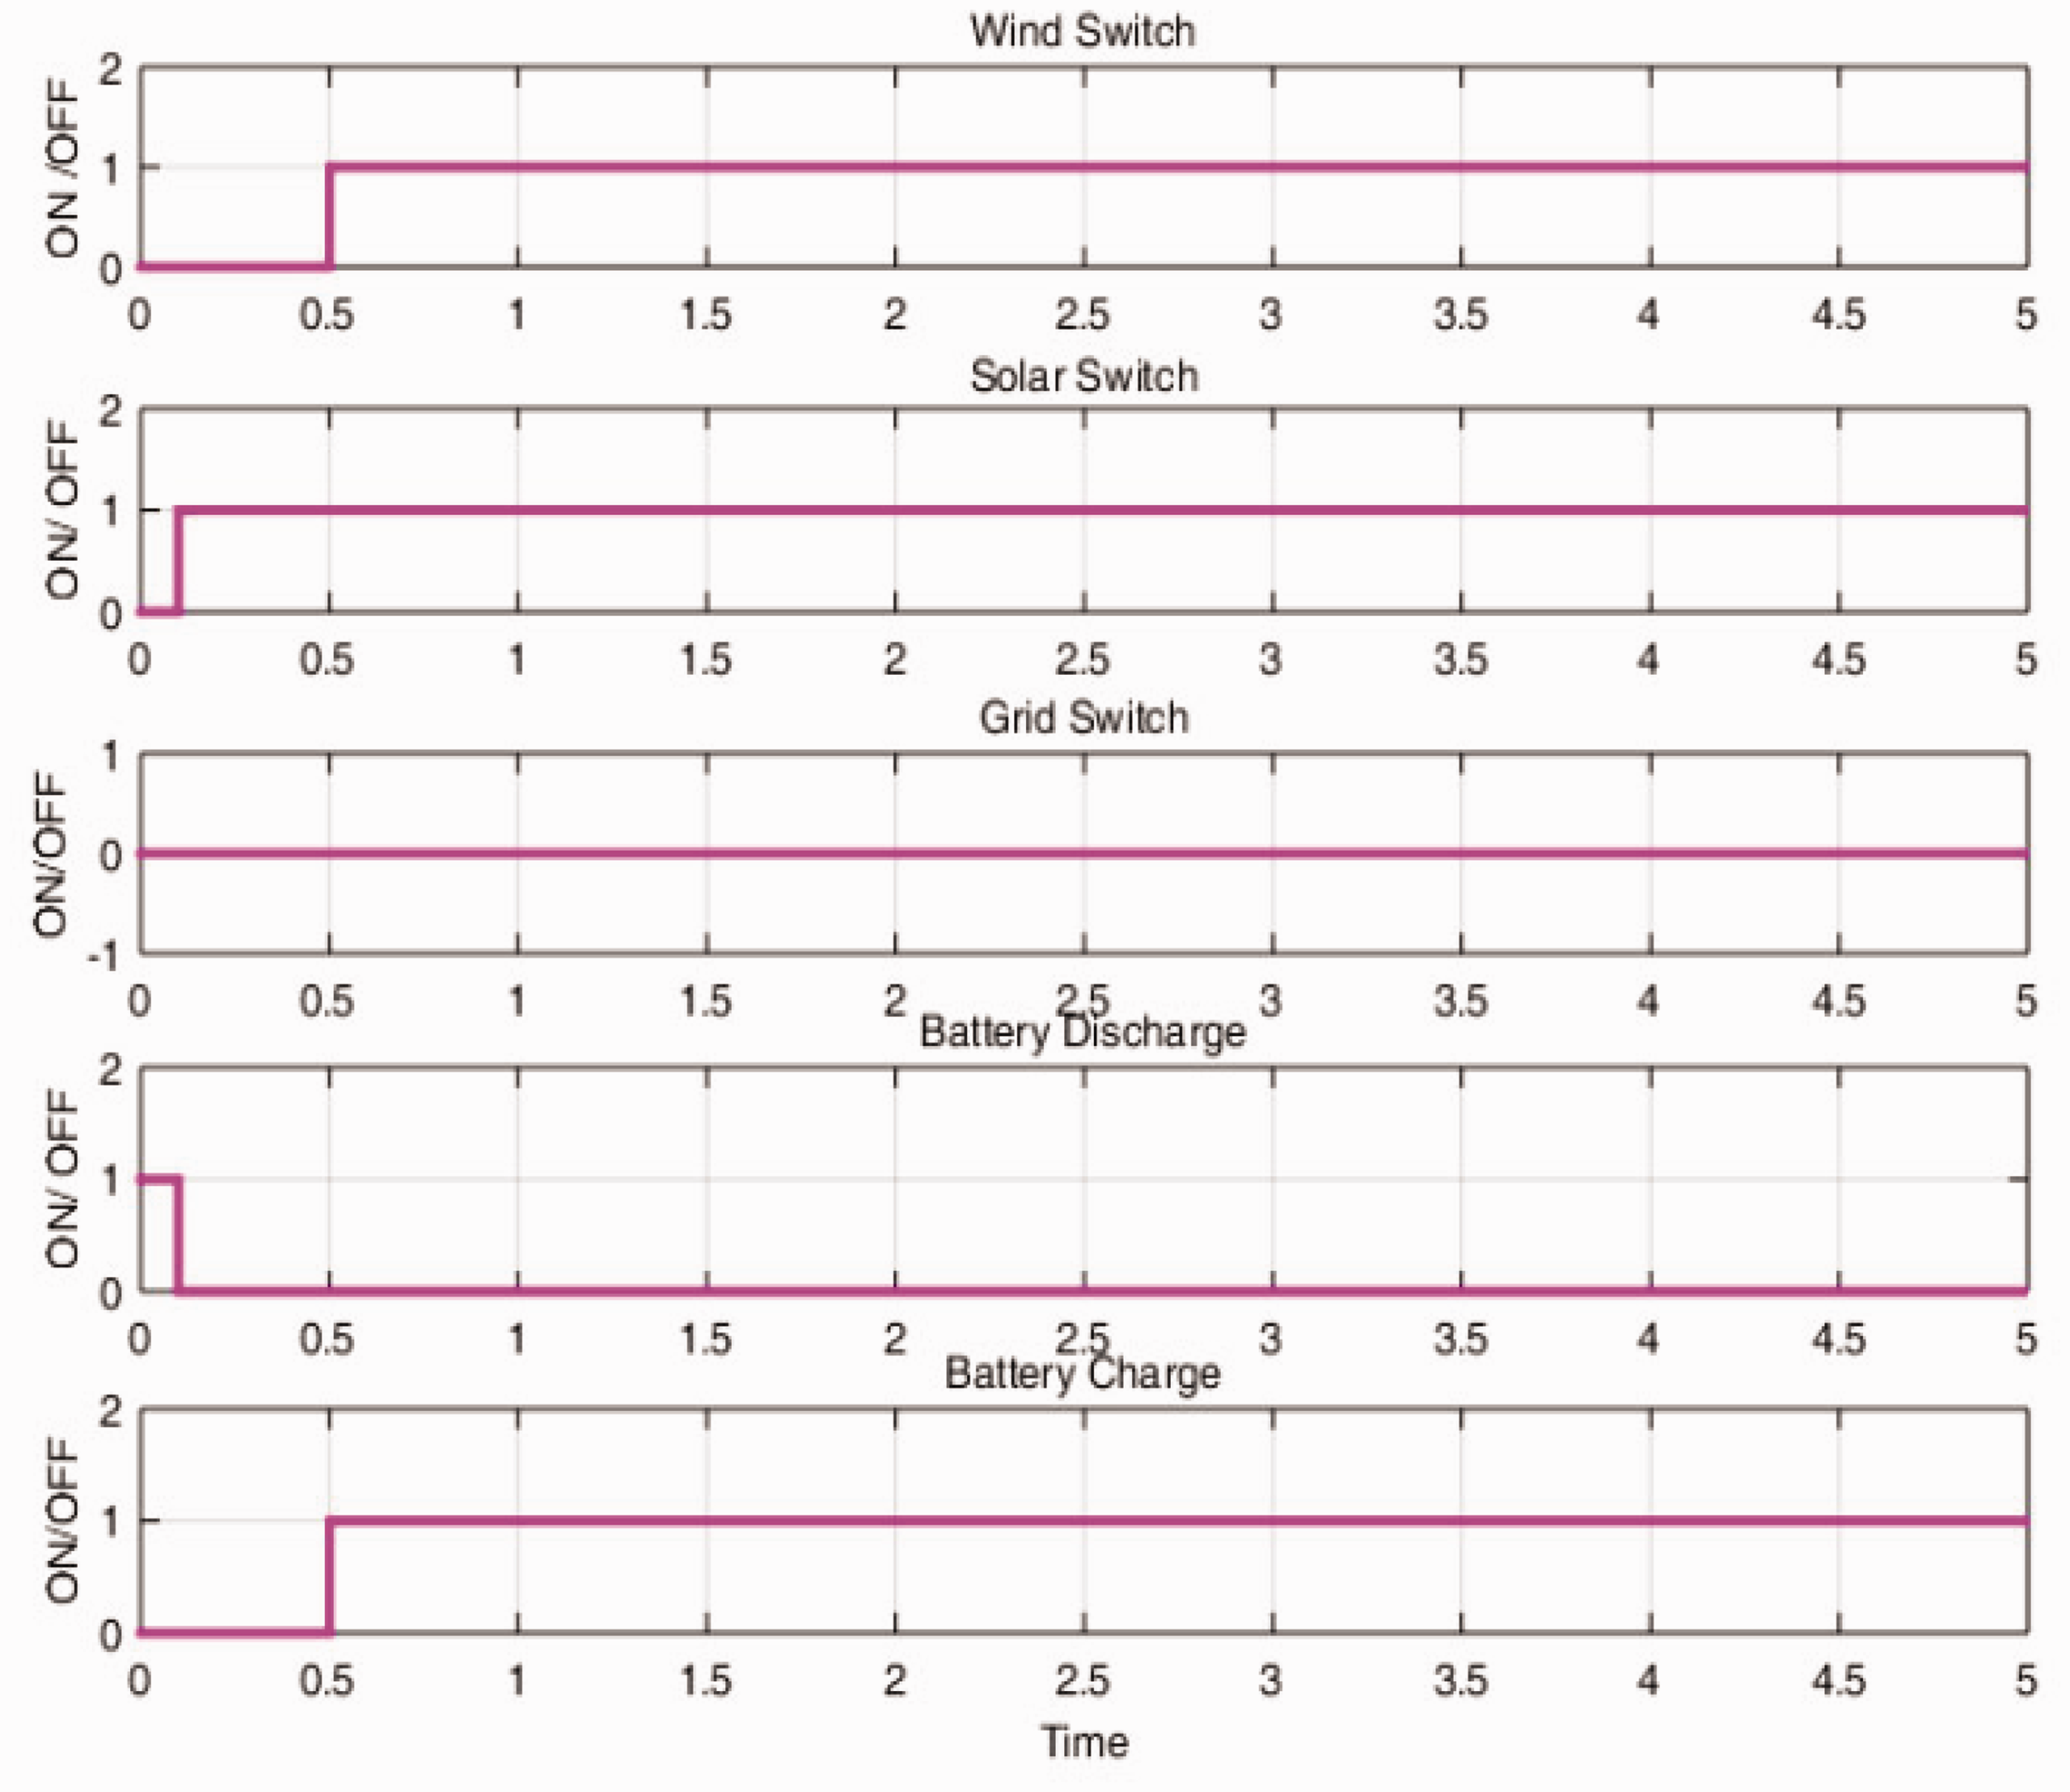
Switch status for Case II in Table 4.
Figure 27 shows the switch status when solar power changes from 2000 to 1000 W at 2.5 s when wind power and load is constant at 1000 and 2500 W, respectively.
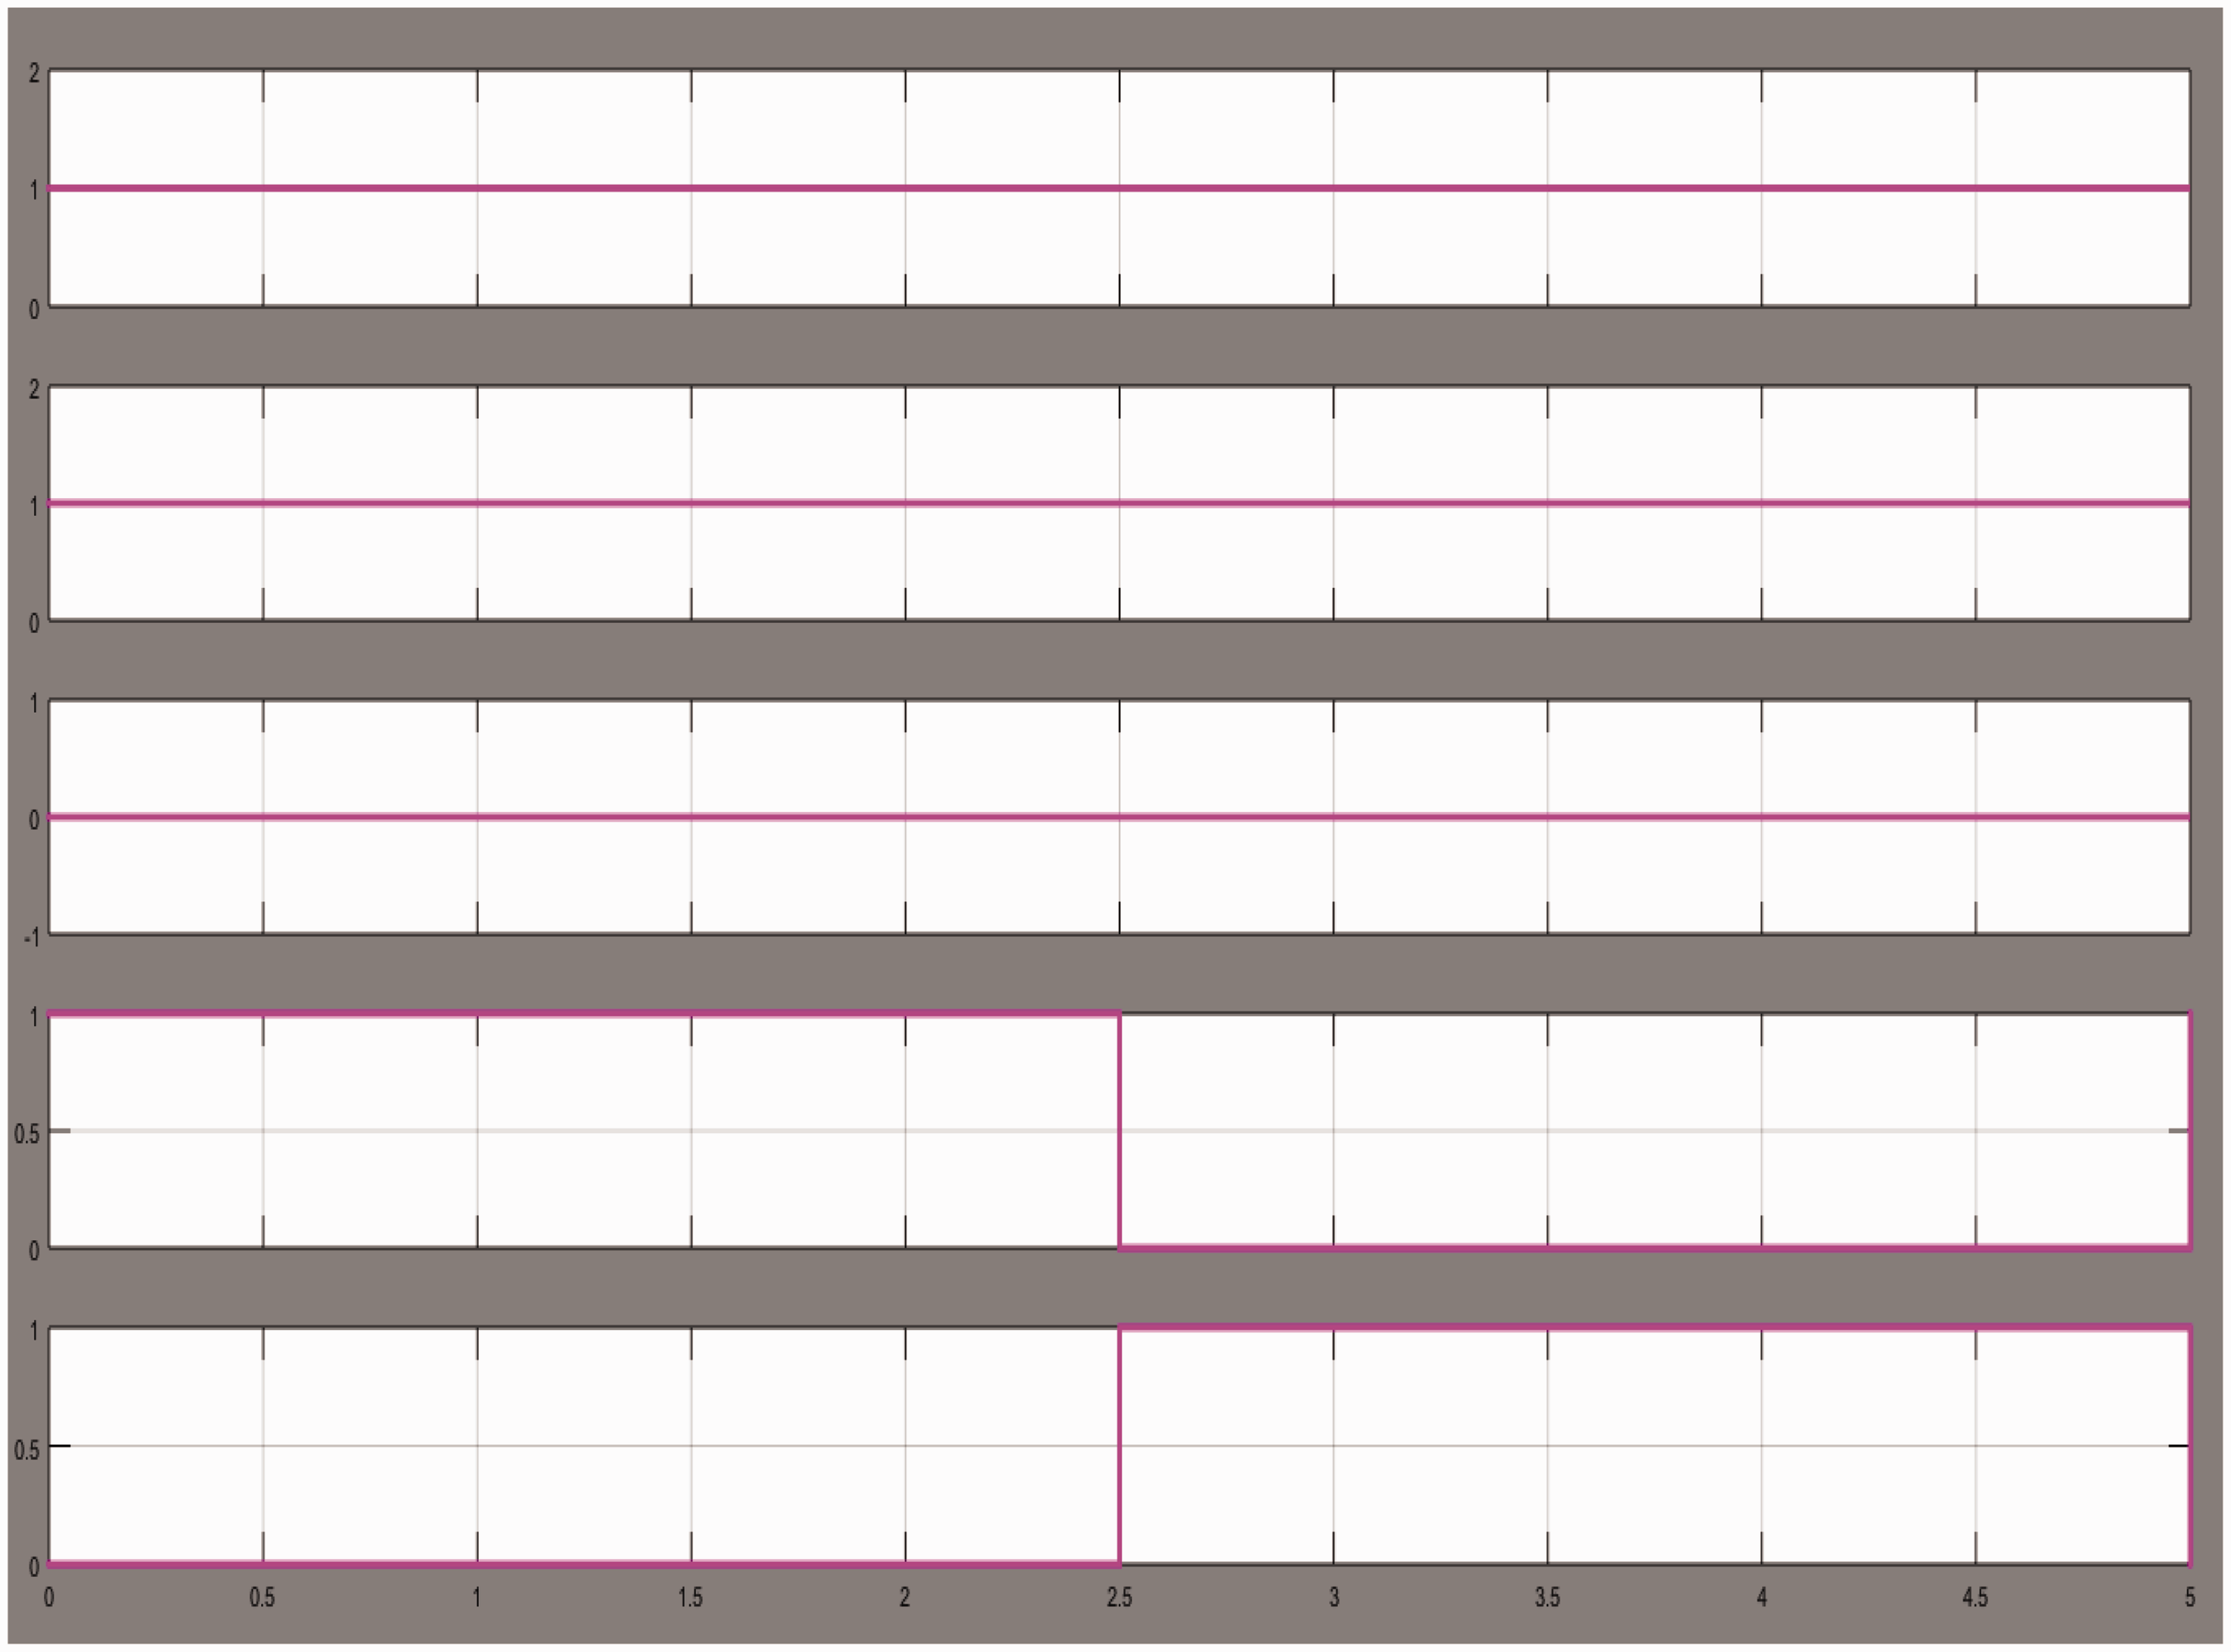
Switch status for Case III in Table 4.
Figure 28 shows the switch status when solar power is constant at 500 W, and wind changes from 500 to 900 W at time 2 s, the load remains constant at 1000 W.
Switch status for Case IV in Table 4.
Figure 29 shows the switch status when no appreciable wind or solar power is generated and when constant load of 1000 W is present. Battery is discharged to meet the load in such a condition.
Switch status for Case V in Table 4.
Conclusion
The Microgrid system using two renewable sources namely, solar PV and wind generator and a battery feeding an inverter supplying a load, is modeled and implemented using Matlab/simulink environment. From the results it can be seen that the load is supplied with a stable voltage at constant frequency irrespective of load change. It can also be seen that the variation in input power due to uncontrollable nature of source is also effectively controlled by the inverter control technique. The droop control technique is used to stabilize the voltage and frequency of the inverter during autonomous mode of operation.
Droop Control Technique is implemented for inverter to improve the voltage and frequency stability of a Microgrid during autonomous mode of operation. The Microgrid is designed using three sources; i.e., Solar PV, Wind Generator and Battery. The total capacity of the designed microgrid is 2.5 kW. Solar PV and Wind Turbine Generator were designed for 2 kW and 1 kW each. Lithium Ion Battery (four in number) with a capacity of 12 V, 100 Ah, connected in series is used to form the battery bank. Parallel RL loads were varied at different time intervals to test the stability of the microgrid system.
Stability of the system was tested during load variations. The voltage and frequency were found to be stable during load variations. The output voltage of the inverter was found to be stable at 400 V and the output frequency of the inverter was also maintained at 50 Hz. The output voltage conforms to IEC 60038 Standards, voltage: 400 V ± 10%, 50 Hz, three-phase supply. The THD in current waveform is found to be 4.66% and THD in voltage waveform is 4.93%, which is also within the permissible level.
The energy management system is also implemented for efficient source selection. It controls the power flow between local generation and load requirement. The battery bank provides inertia to the system by acting as the buffer between local generation and load requirement. The solar source is considered as the primary source or main source, as it is the source with highest rating in the simulation model which is being considered.
Limitations
As the simulation model has many complex subsystems, the time taken for completing one run of simulation after any system change takes long. The time taken for completion of simulation has to be reduced by optimizing solution and integration techniques.
The simulation results have to be validated. Hardware implementation of the simulation model is to be done. And the work has to be verified experimentally.
Footnotes
Declaration of conflicting interests
The author(s) declared no potential conflicts of interest with respect to the research, authorship, and/or publication of this article.
Funding
The author(s) disclosed receipt of the following financial support for the research, authorship, and/or publication of this article: This work is funded by WOS-A, KIRAN DIVISION, Ministry of Science & Technology, Dept. of Science & Technology, Government of India.