
Abstract
Characteristics of complex gas-water distribution affect the efficient exploration of tight gas. The paper aims at tight sandstone gas-water distribution characteristics of He8 Member in Sulige Gas Province (SGP), describes thickness and TOC of source rocks from Benxi Formation in Carboniferous to the Second Member of Shanxi Formation in Permain, evaluates its hydrocarbon generation potential, discusses its controlling effect on tight sandstone gas-water distribution, and determines the threshold values of Ro and HGI of commercial gas flow wells. Research shows that the coal-measure source rock has the characteristics of extensive and superimposition. The coal seam and dark mudstone is the lithology of source rock, and its Ro is chiefly distributed 1.2% ∼ 2.1% in the stage of high mature thermal evolution, which is mainly type III kerogen. Among them, the thickness of coal seam is mainly ranged from 5 ∼ 15 m with an average of 9.32 m, and its average TOC is 64.08% and the distribution of HGI is (1∼36) ×108 m3/km2. No.8 and No.5 coal seams are relatively stable. The extent of thickness of dark mudstone is mainly between 10m and 30m with an average of 21.2m, and its average TOC is 2.11%, HGI is between (0.2∼10)×108m3/km2. Gas reservoir of He8 Member is tight sandstone lenticular reservoirs with the large-area quasi-continuous distribution. When the gas testing production is less than 1 × 10⁴m3/d, the controlling effect of Ro and HGI are relatively obvious, and its controlling effect is obviously weakened with the increase of gas production. When Ro is more than 1.6%-1.7%, or HGI is larger than 15 × 108m3/km2, the decreasing trend of water/gas ratio is evident, especially in commercial gas flow wells (including high producing gas flow wells). In comparison, the controlling effect of HGI is stronger than Ro. 1.33% and 8 × 10⁸ m3/km2 are the threshold values of Ro and HGI for commercial gas flow wells, respectively.
Keywords
Introduction
Tight sandstone gas is a kind of unconventional oil and gas resources with the highest utilization degree and the most realistic under the current technology, and it is also an important part of natural gas resources in the world. Whether San Juan, Alberta, Uinta, Piceance, Green River basins in North America, or Ordos, Sichuan, Songliao, Tarim basins in China, a series of important breakthroughs have been made in the research and exploration of tight gas (András et al., 2012; Dai et al., 2019; Law and Curtis, 2002; Li et al., 2012; Masters, 1979; Shanley et al., 2004; Sun et al., 2019; Zhao et al., 2019; Zou et al., 2015). However, with the deepened of tight gas exploration and development, the problems of formation water output of tight sandstone with low porosity and permeability, strong heterogeneity, nanoscale pores and high water saturation have gradually emerged (Clarkson et al., 2012; Lai et al., 2018; Nie et al., 2021; Qiao et al., 2020). For example, the water/gas ratio of tight sandstone gas reservoirs in the Piceance Basin in the United States exceeds 1.2m3/104m3, and the proportion of producing wells reaches 27.2% (Wei et al., 2017); the water/gas ratio of the Upper Paleozoic in the western Ordos Basin in China exceeds 1m3/104m3 (Zhou et al., 2016); and the daily water production of some wells exceeds 100 m3 (Wu et al., 2020). These conditions lead to low productivity and no production of gas wells, which seriously restricts the expansion of gas bearing scale of tight gas.
The accumulation theory of “broad and gentle slope structure, extensive hydrocarbon generation, large area charging, micro-nanometer pore features, coupled transport between pores and fractures, and near migration and accumulation” effectively guided the early exploration of tight gas (Fu et al., 2013; Nelson, 2009; Qiao et al., 2020; Schmitt et al., 2015; Xu et al., 2012; Yang et al., 2008, 2012; Zhao et al., 2012; Zou et al., 2012), but the complex distribution of gas and water in tight sandstone is beyond the reach. With the improvement of geological theory and the increase of exploration degree, the condition of source rock is considered to be an important aspect to control the formation of tight sandstone gas. Zhao et al. (2010) believed that tight gas is “source controlled”, and its enrichment is mainly controlled by the the range of gas source rock, main sand body, tectonic setting and fracture development. Yang and Zhu (2013) thought that the overlapping tight gas reservoirs in Sichuan Basin have the characteristic of “Three-Yuan controlling” from source, phase and location. Dai et al. (2012) reckoned that source rock condition plays an important role in controlling the gas-water distribution of tight sandstone in the western Sulige Gas Field, and the gas enrichment areas are distributed in the high maturity values. Zhao et al. (2016) considered that the large area distribution of high quality source rock is the most important factor to control the formation and distribution of large tight sandstone gas. Fu et al. (2016) demonstrated that the maturity and hydrocarbon generation intensity(HGI) of source rock are the key factors for the difference in gas enrichment between Shenfu Block and Linxing Block in the eastern margin of Ordos Basin. Liu et al. (2019) analyzed that source rock condition is the main controlling factor of natural gas accumulation in the western Sulige Gas Field. Li et al. (2019) showed that the dispersed hydrocarbon supply is the root cause of the widely distributed tight sandstone gas. Zhang et al. (2018) discussed the formation mechanism and the distribution law of tight gas in low HGI area of Tianhuan Depression in the Ordos Basin. These studies have macroscopically emphasized the importance of gas source condition for tight gas accumulation, but there are few studies on the specific control of tight sandstone gas and water distribution. Sulige Gas Province (SGP) is one of the largest tight gas producing areas in the world, and also an example of tight gas exploration and development. However, the complex gas-water distribution affects the production of single well and the deployment of producing wells (Dai et al., 2012; Wang et al., 2012; Wei et al., 2017; Zhou et al., 2016), which restricts the efficient exploration and development of tight gas. For this, based on the predecessors' research results in view of source rocks, using a large number of drilling, logging, testing, laboratory analysis data, the paper describes the thickness, TOC and Ro of coal seam and dark mudstone of the Benxi Formation in Carboniferous (C2b), Taiyuan Formation (P1t) and Shan2 Member of Shanxi Formation (P1s2) in Permian, evaluates its hydrocarbon generation potential, analyses the controlling effect of Ro, HGI on gas-water distribution of the fourth Member of Lower Shihezi Formation in Permian (He8 Member), and then determines the threshold values of commercial gas flow wells. The aim is to enrich the main controlling factors of gas-water distribution of tight sandstone and provide a theoretical basis for fine exploration and development of tight gas.
Geological setting
The Ordos Basin is a large petroliferous basin in central China, which is distributed in five provinces including Shanxi, Shaanxi, Gansu, Inner Mongolia Autonomous Region and Ningxia Hui Autonomous Region, and divided into 6 first-order tectonic units, namely Yishan Slope, Tianhuan Depression, Western Overthrust Belt, Jinxi Flexure Belt, Yimeng Uplift and Weibei Uplift. There are 12 tight sandstone gas fields in Upper Paleozoic such as Sulige, Wushenqi, Yulin and Mizhi, as well as Lower Paleozoic Jingbian Carbonate Gas Field (Figure 1(a)), and nine of them are more than 100 × 108 m3 in reserves (Dai et al., 2019; Fu et al., 2019; Peng et al., 2019). In 2020, the natural gas production in the basin has reached 445.31 × 10⁸m3. SGP is located in the northwest of Yishan Slope (Figure 1(a)), and is the first discovered tight gas area in Upper Paleozoic in the basin and the highest proved reserves tight gas area in China at present. The main gas producing formation are He8 Member and the first member of Shanxi Formation (Shan1 Member) in Permian, and its third-grade reserves areas are over 4 × 10⁴km2. The tectonic feature of SGP is stable during the process of basin evolution. During the Early Paleozoic, it was located in the ridge and east wing of the central Palaeo-uplift. After the Caledonian movement uplifted, East-dipping gentle slope tectonic pattern continued until Jurassic. The uplift amplitude in the eastern part of the basin was stronger than that in the western part due to the Yanshan movement and Himalayan movement, then the western dipping monoclinal structural framework was formed and has been extended to the present day (Liu et al., 2020; Shu et al., 2019). The stratum are developed in the Lower Paleozoic Cambrian and Ordovician, the Upper Paleozoic Carboniferous and Permian, the Mesozoic Triassic, Jurassic, Cretaceous and the Cenozoic Quaternary, while the Silurian, Devonian, Paleogene and Neogene are missing. He8 Member is the studied producing layer in the paper, which is vertically divided into the upper part (He8u) and the lower part (He8l) (Figure 2). Its top surface is a relatively gentle westward dipping monocline structure with a distribution range of -1000 ∼ -2500m (Figure 1(b)). The gas test results of He8 Member are diverse and the gas - water distribution is complex.
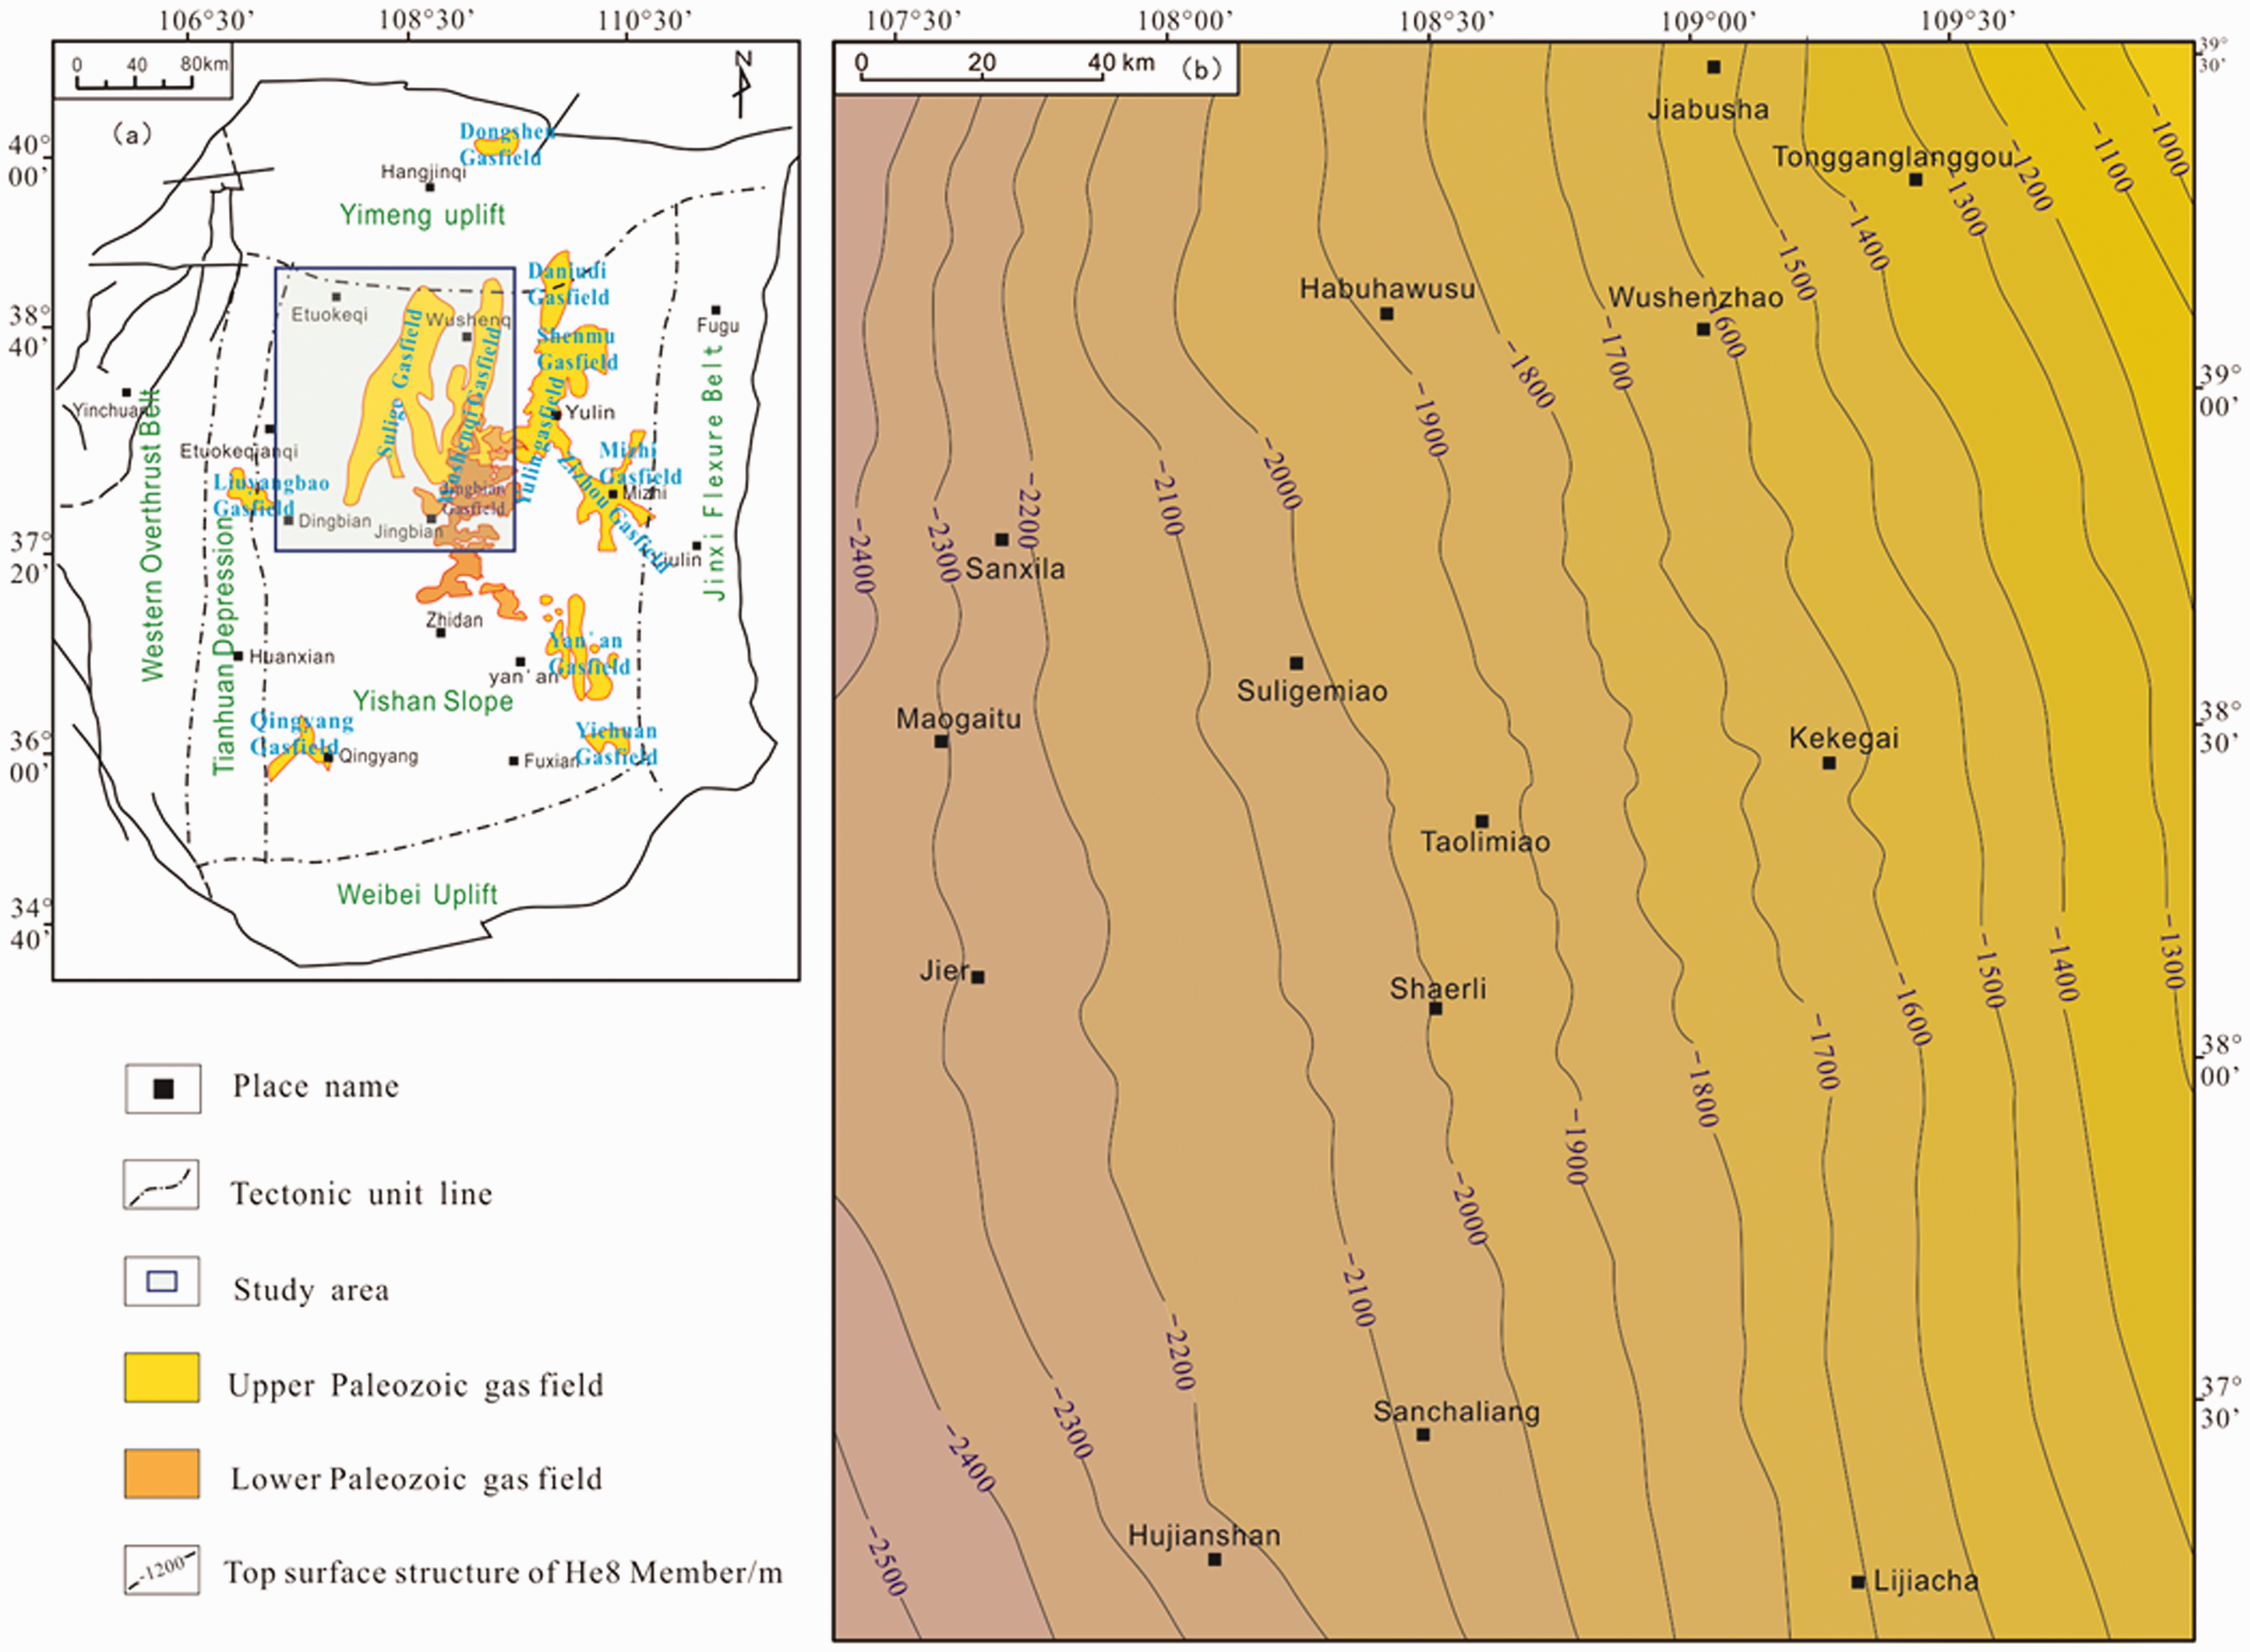
Map of location of SGP (a) and the top surface structure of He8 Member (b).
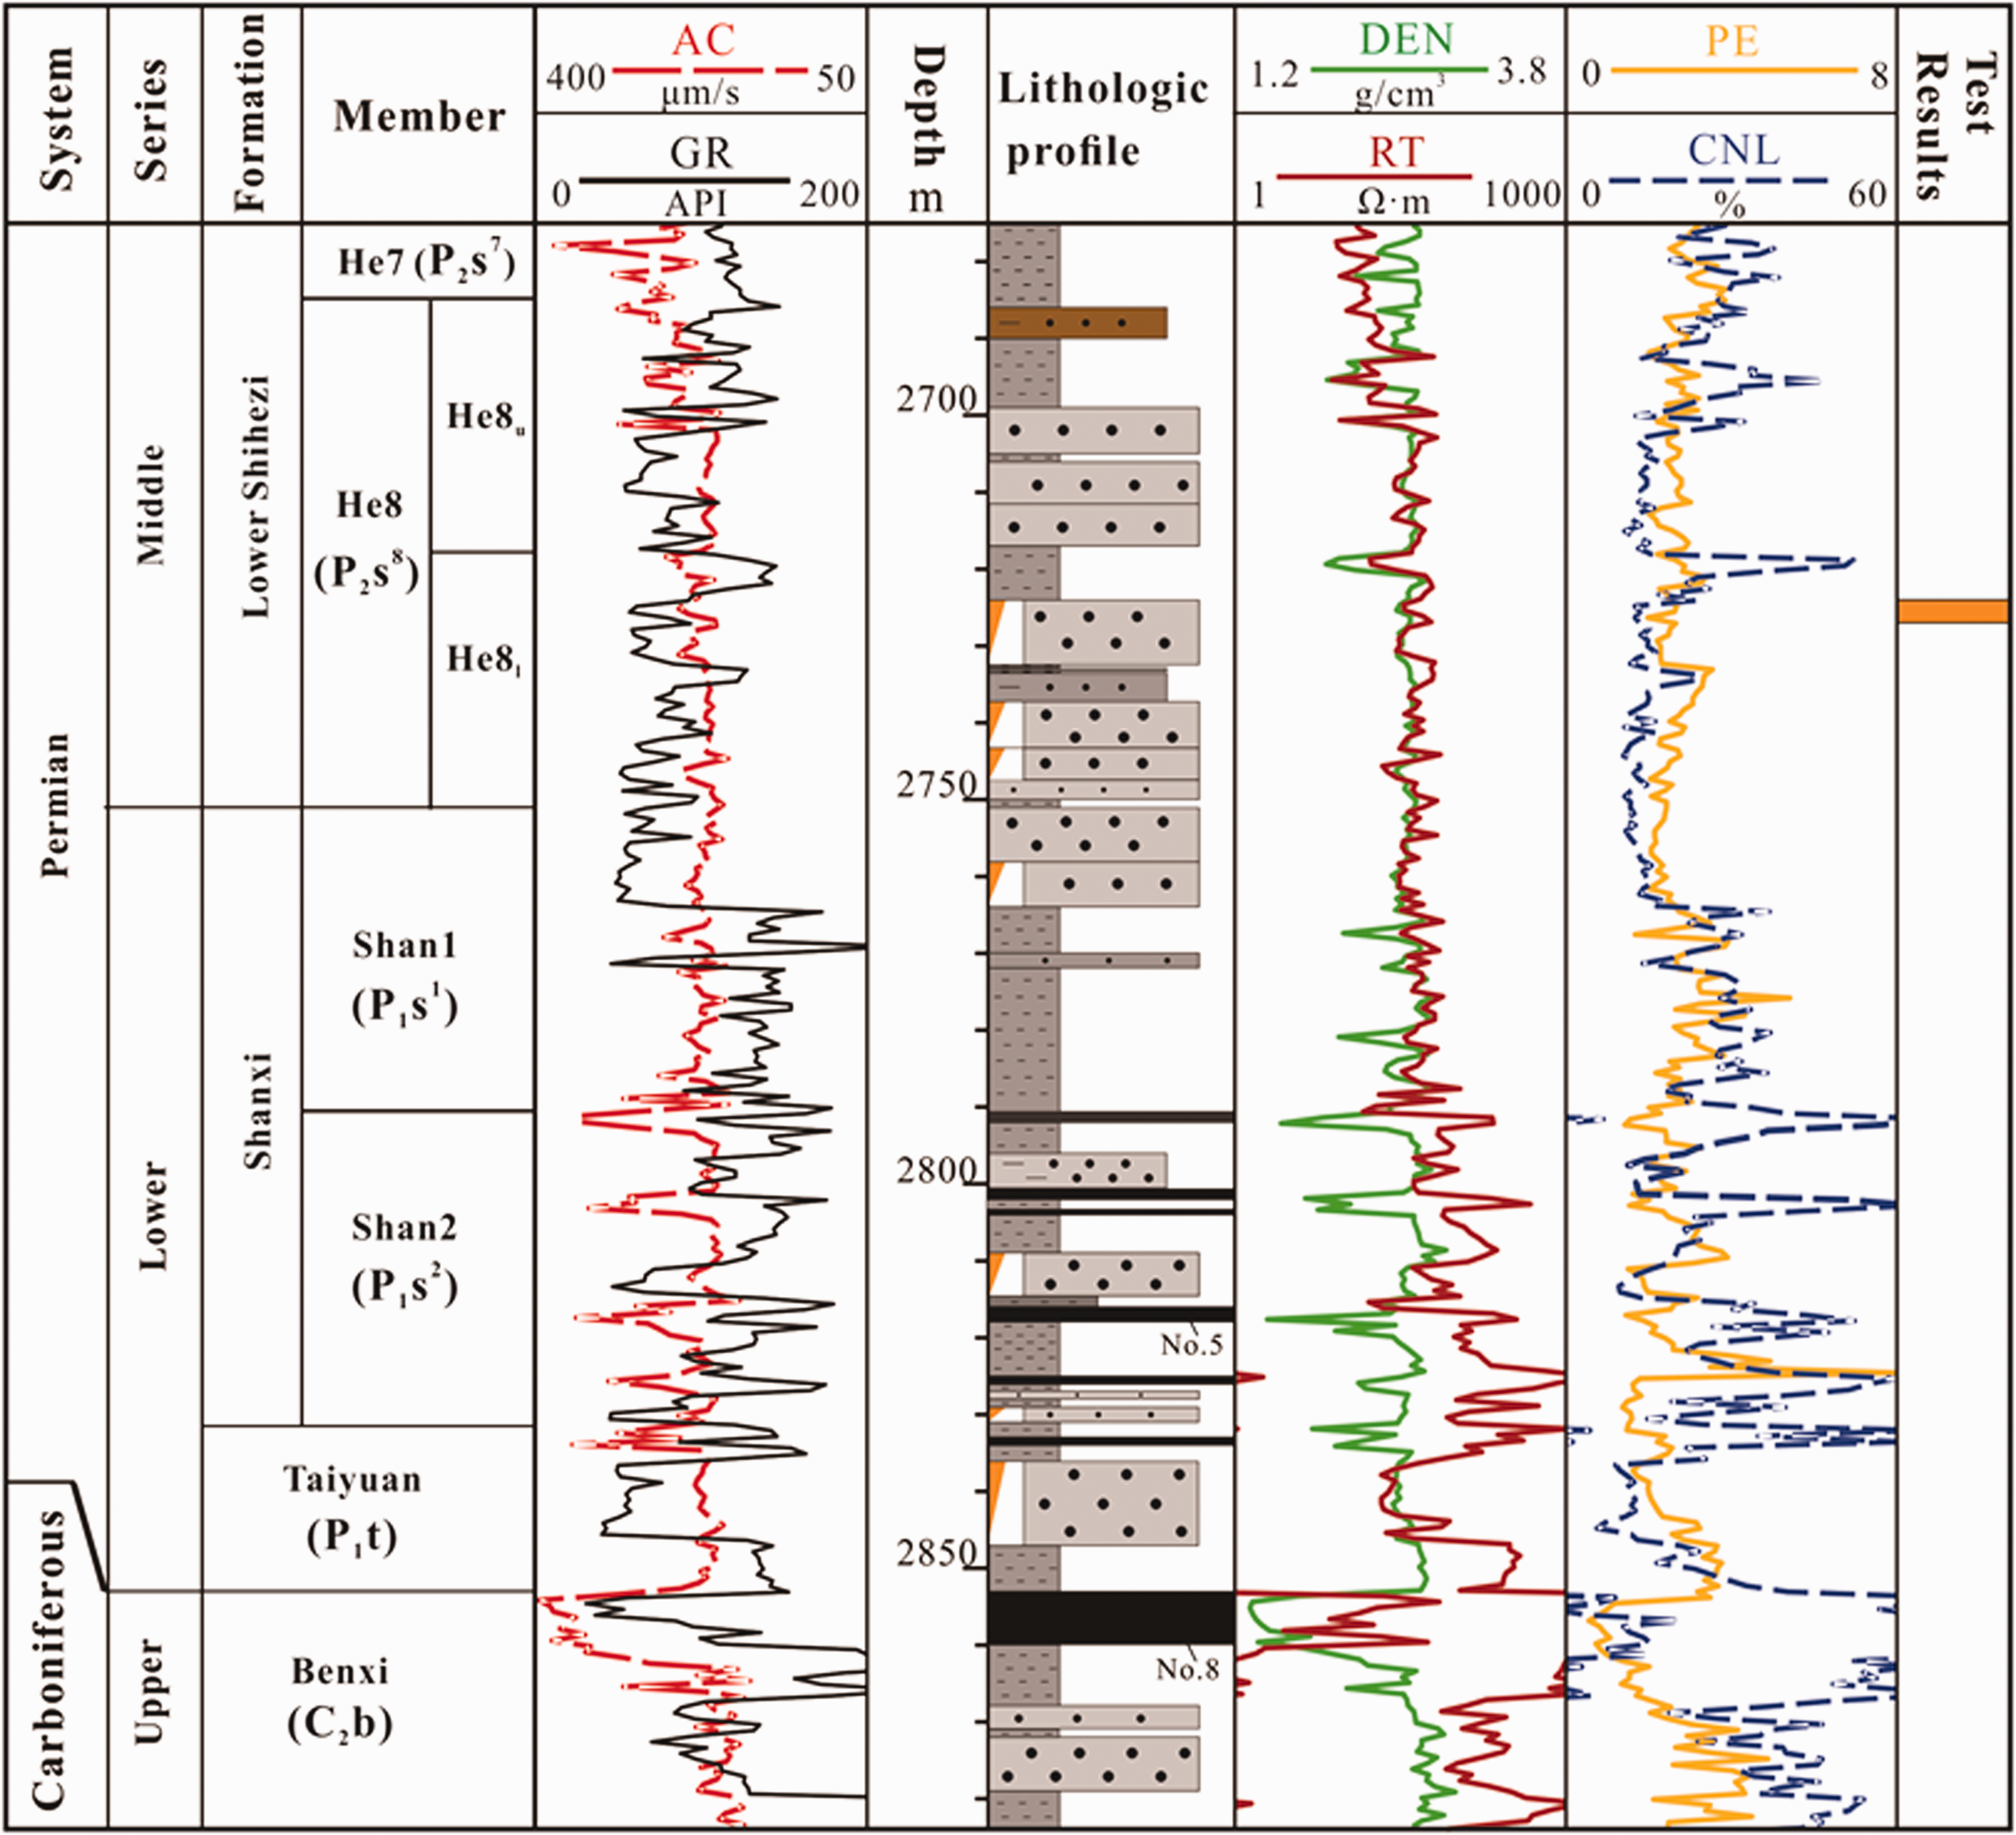
Column diagram from Benxi Formation to He8 Member of Well T33 in SGP.
Data and methods
Drilling reports and logging curve from 403 wells, core observation around 562.68m from 25 wells, TOC, bitumen chloroform “A” and S1+S2 of coal seam about 35 samples from 18 wells, dark mudstone TOC data of 85 samples, Ro of 90 sample, kerogen maceral of 109 samples, gas porosity and permeablity of 10158 samples from 332 wells and gas test results from 553 wells are collected from Petrochina Changqing oilfield Company.
Thickness of coal seam and dark mudstone
Combined with the drilling core data, the coal seam and dark mudstone are identified on the logging curve, and its thickness is calculated. The typical electrical characteristics of coal seam of “three high and three low” in logging response, namely high acoustic time difference (AC), high resistivity (RT), high compensated neutrons (CNL), low natural gamma(GR), low density (DEN) and low photoelectric absorption interface index (PE) (Figure 2). The response characteristics of dark mudstone are high spontaneous potential(SP), high GR and low AC.
TOC logging interpretation method
Using ΔlgR method, resistivity curve and density curve can determine the position of source rock. If the resistivity curve and density curve overlap at the position of fine-grained non-source rocks, the two curves will have a certain interval at the position of source rock, namely the amplitude difference (LgR) (Figure 2). LgR is related to the abundance of organic matter in source rock, and the two factors have a positive correlation trend. The TOC calculation formulas of Benxi Formation - Taiyuan Formation and Shan2 Member were obtained through multiple regression fitting analysis of RT, GR and DEN logging values using measured data points of source rock positions.

Results and discusses
The conditions of coal-measured source rock
The thickness of source rock
Coal seam and dark mudstone from Benxi Formation to Shan2 Member are the main lithology of source rock in SGP (Dai et al., 2019; Liu et al., 2019; Wang et al., 2021; Yu et al., 2019; Zhao et al., 2014). Coal seams are distributed in all 3 sets of stratum, but their formation environment and scale are different. The sedimentary environment of Benxi Formation is coastal marsh or lagoon, so the cumulative thickness is large and the distribution scale is stable. The Taiyuan Formation developed in the peat flat facies of tidal flat, so its thickness is relatively thin due to several sets of thin bedded limestone. The wetland and swamp environment in Shanxi Formation developed the relatively limited coal seams because of affected by multiple sets of argillaceous stratum (Wang et al., 2016; Yu et al., 2019). According to the lithologic assemblage and logging response of coal seam, 10 sets of coal seams have been identified and subdivided on the longitudinal from Benxi Formation to Shanxi Formation, which showed the “extensive” distribution on the whole and strong heterogeneity. Dark mudstones are mainly distributed in Taiyuan Formation and Shanxi Formation. The coal seam of Shan1 member is thin in thickness and has poor continuity, which is mainly distributed by lens body and interlayer. The mudstone is mainly grey-green with very low TOC. So it is invalid source rock.
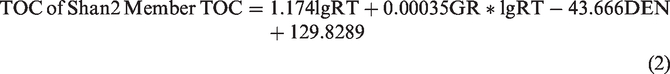
According to the statistics of the thickness of coal seams (N = 403), the cumulative thickness is 1.76–25.9 m with an average of 9.32 m, which is mainly distributed in 5–15 m accounting for 79.7% of the total (Figure 3(a)). The No.8 coal seam at the top of Benxi Formaiton and the No.5 coal seam of Shan2 Member is the relatively stable (Figure 2). Among them, the coal seam of Benxi Formaiton ranges from 0.5 to 13.7 m with an average of 4.51m, and the drilling penetration rate reaches 92.9%. The coal seam size of Taiyuan Formation is relatively small, and the distribution range is 0.2 ∼ 17.5 m with an average of 2.2 m. The coal seam of Shan2 Member is distributed in the range of 0.3 ∼ 11.1m with an average of 2.72 m. The plane distribution of coal seam presents a north-south banded on the whole, the thick in the east and north parts while the thin in the west and south parts (Figure 4(a)). The accumulated thickness of dark mudstone ranges from 2 to 58 m with an average of 21.2 m, and the main distribution range is between 10 and 30 m accounting for 75.6% of the total (Figure 3(b)). Among them, the dark mudstone thickness of Shan2 Member is stable with an average of 18.68 m, while the mudstone of Benxi Formaiton - Taiyan Formation is thin with limited development scale. The thickness distribution of mudstone is different from that of coal seam. The thickness of dark mudstone is larger in the southeast, up to 50m, and gradually decreasing in the north and west (Figure 4(b)).
Histogram of thickness, TOC, and Ro of coal seam and mudstone from Benxi Formaiton- Shan2 Member in SGP (a. Coal seam thickness; b. Dark mudstone thickness; c. TOC of coal seam; d. TOC of mudstone; e. TOC of logging interpretation; f. Ro).
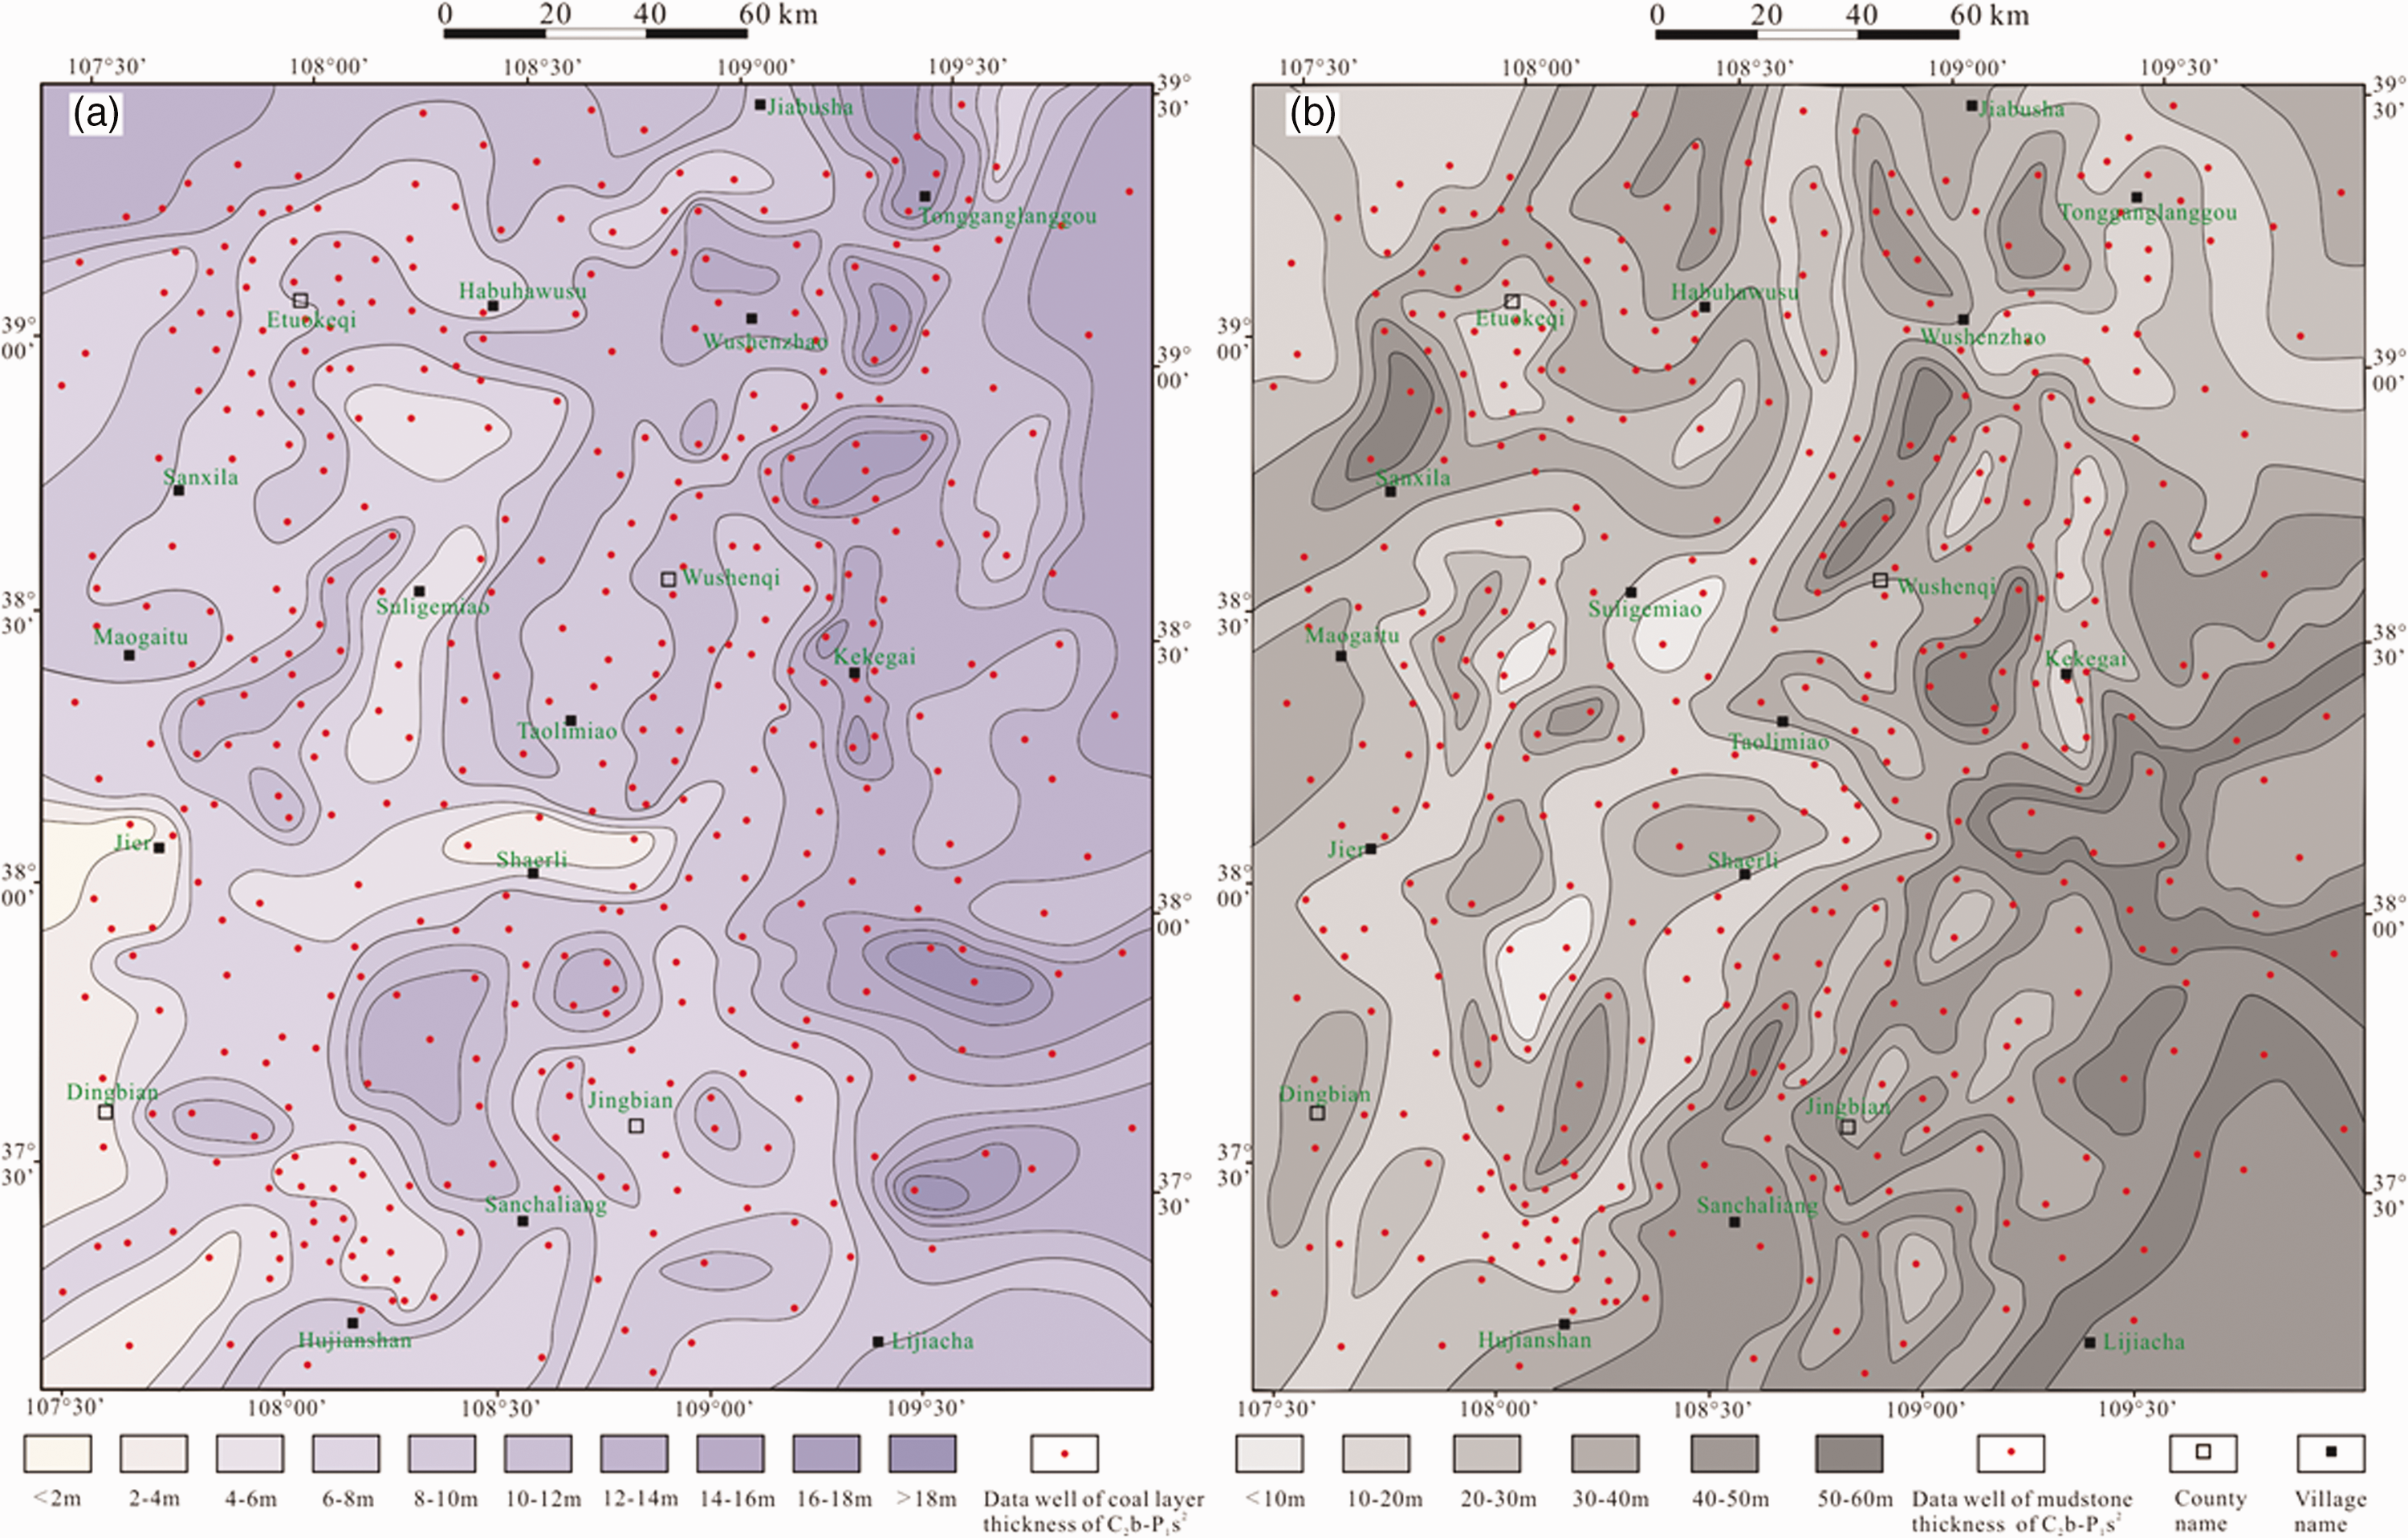
Contour map of the thickness of coal seam (a) and dark mudstone (b) of C2b - P1s2 in SGP.
Geochemical characteristics of source rock
Abundance of organic matter
The TOC of coal seam from Benxi Formaiton to Taiyuan Formation is slightly higher than that of Shan2 Member. The TOC distribution of coal seam ranges from 40.37% to 91.32% with an average of 64.08% (N = 35). The chloroform asphalt “A” ranges from 0.1657% to 2.4991% with an average of 0.8012%. S1+S2 is between 9.07 mg/g and 191.99 mg/g with an average of 71.26%. Among them, the TOC of Benxi Formaiton - Taiyuan Formation ranges from 41.1% to 91.32% with an average of 67.1%, even distribution of 40%–90% (Figure 3(c)), while the TOC of Shan2 Member ranges from 40.37% to 78.67% with an average of 61.21%, the peak value of 50%–60% (Figure 3(c)). According to the statistics of geochemical parameters of dark mudstone and carbonaceous mudstone (N = 85), the TOC of dark mudstone ranges from 0.75% to 5.11% (Figure 3(d)) with an average of 2.11%, and less than 2.5% is accounting for 72.94% (Figure 3(d)). The TOC of carbonaceous mudstone is significantly higher than dark mudstone due to the influence of carbonaceous composition, and the latter is ranged from 6.56% to 34.74% with an average of 17.23% (N=20).
There are 17 samples about TOC of coal seam from Benxi Formaiton to Taiyuan Formation and 18 samples from Shan2 Member, which are insufficient to effectively control the SGP. ΔlgR is currently more mature of the important methods for the calculation of TOC, both have achieved good application of multiple basin at home and abroad (Hu et al., 2016; Kamali and Mirshady, 2004; Passey et al., 1990; Wang et al., 2017). The logging interpretation TOC using ΔlgR method and the measured TOC have a relatively high coincidence rate, correlation coefficients are 0.8426 in Benxi Formaiton to Taiyuan Formation and 0.8394 in Shan2 Member (Figure 5). Based on calculation TOC of coal seam from 122 wells, the logging interpretation TOC of the former ranges from 36.56% to 94.04% with an average of 65.74%, and the main peak ranges from 50% to 70% accounting for about 60% (Figure 3(e)). The TOC of the latter is ranged from 33.98% to 74.57% with an average of 58.21%.
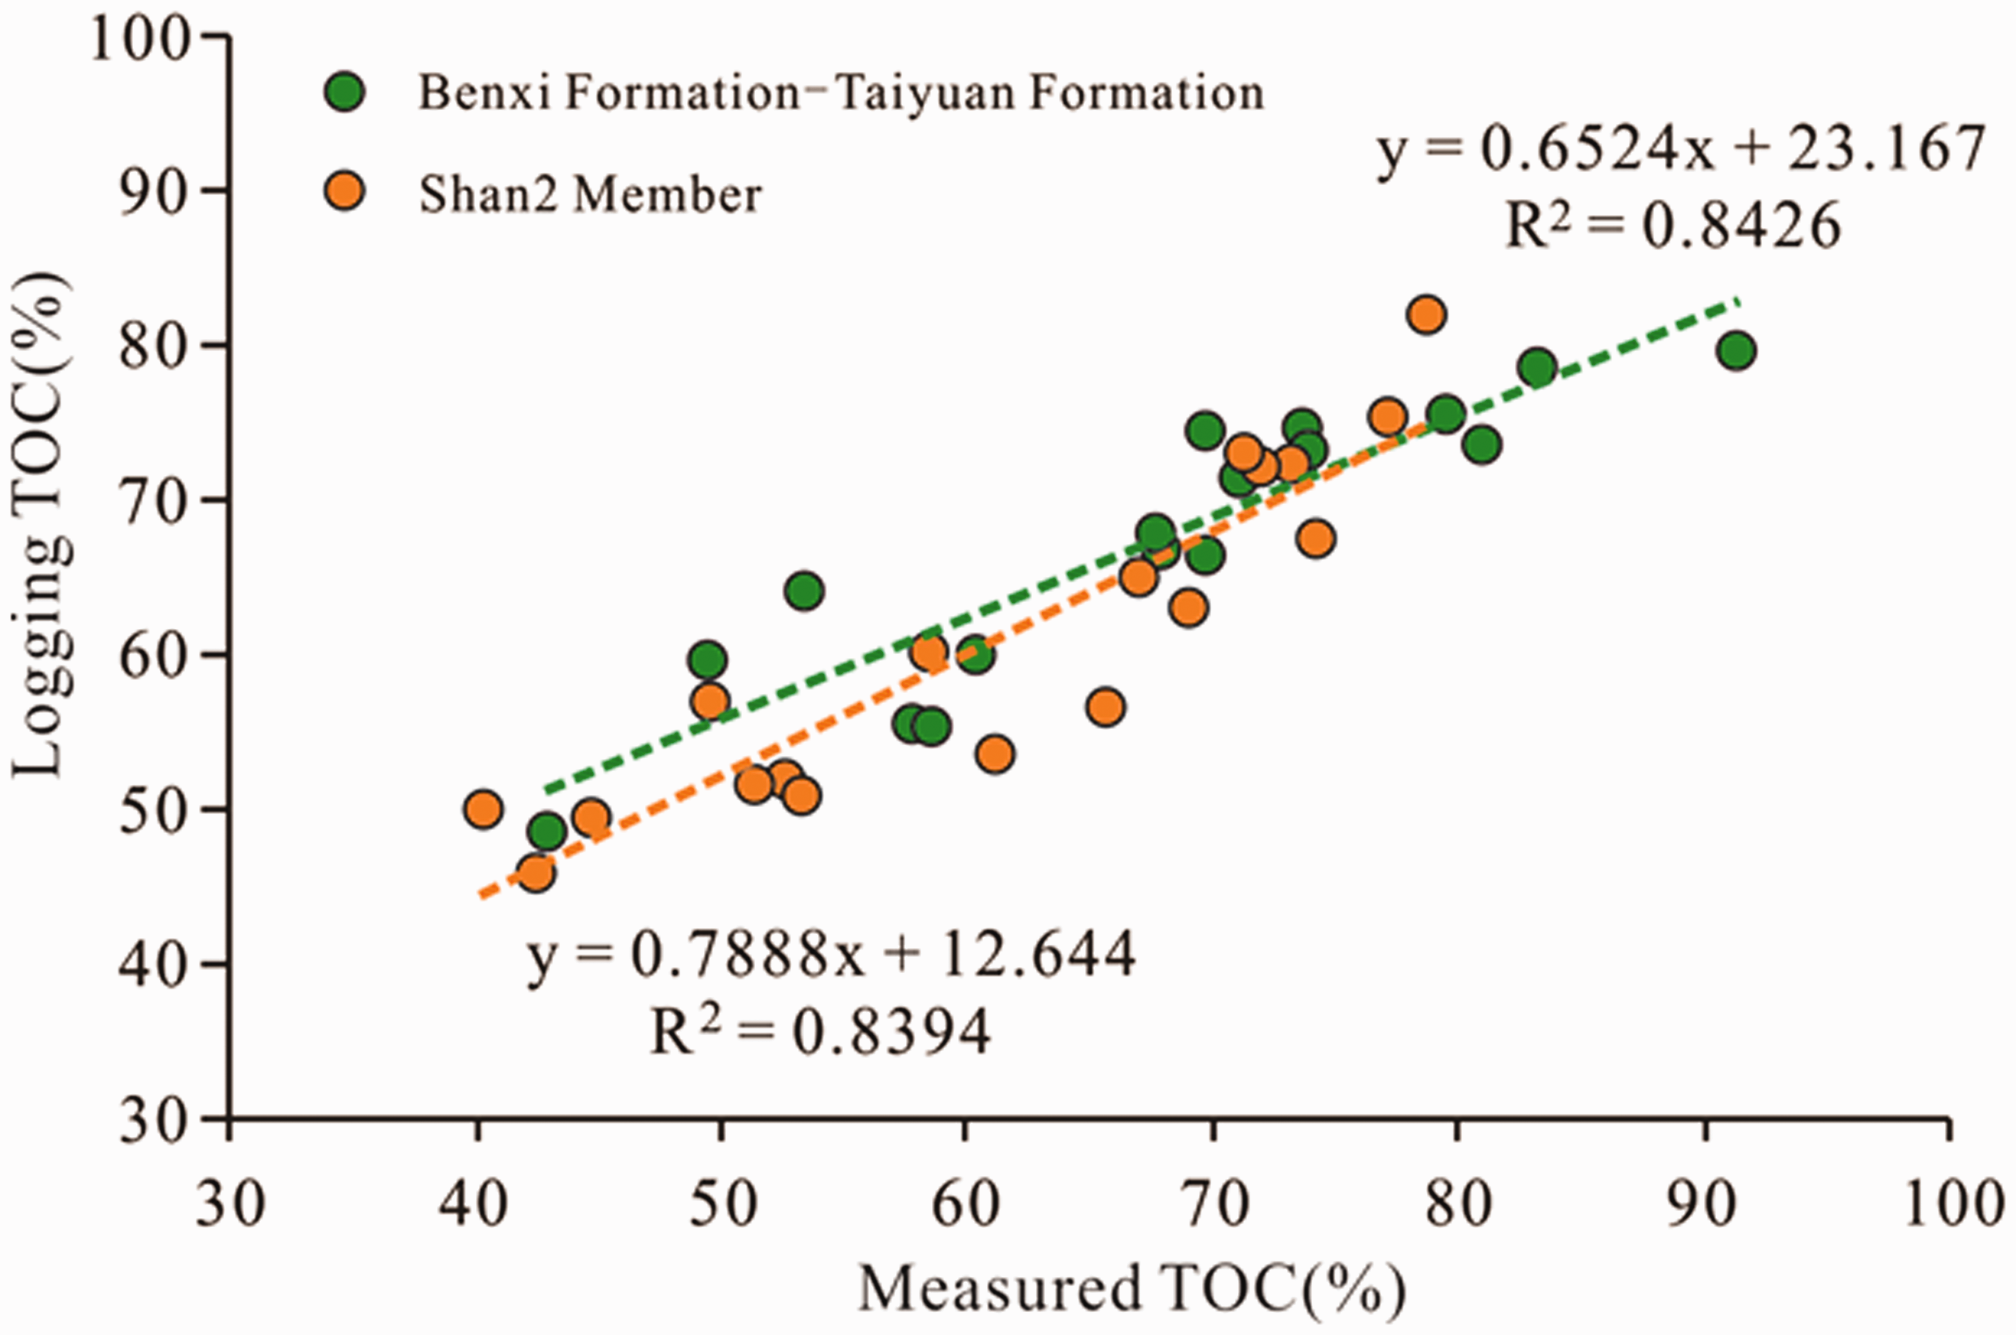
Relationship of measured TOC vs. logging TOC from Benxi Formaiton to Taiyuan Formation and Shan2 Member.
Type of organic matter
The type of kerogen is mainly III kerogen, containing II2 and II1 kerogen. Through observation and identification of microscopic electron microscope, vitrinite is the absolute dominant component in the macerals of coal seam, and the range is between 79.76% and 97.2%. The dark mudstone is also dominated by vitrinite, with the content of more than 50% accounting for 76.7% followed by inertinite. According to the maceral content calculation, 62.5% of kerogen type index was less than 0, and 23.2% was between 0 and 40.
Degree of thermal evolution of organic matter
The thermal evolution degree of source rocks is in the stage of maturity to over maturity, and chiefly in high maturity. According to the analysis of measured source rocks Ro data (N = 90), the distribution range of Ro is 0.86% ∼ 2.69% with an average of 1.61%, and the mainly distribution is 1.2% ∼ 2.1% accounting for 81.1% (Figure 3(f)). The Ro of organic matter of different regions have differences. The higher area is distributed in the central and southeastern areas on the whole, especially more than 2.0% in Jingbian- Wushenqi areas and reached 2.6% partly, and gradually decrease the trend to the north of the east, much less than 1.8%, locally less than 1.0%. In addition to the local highs of more than 2% in the west of Etuoleqi and the north of Dingbian (Figure 6).
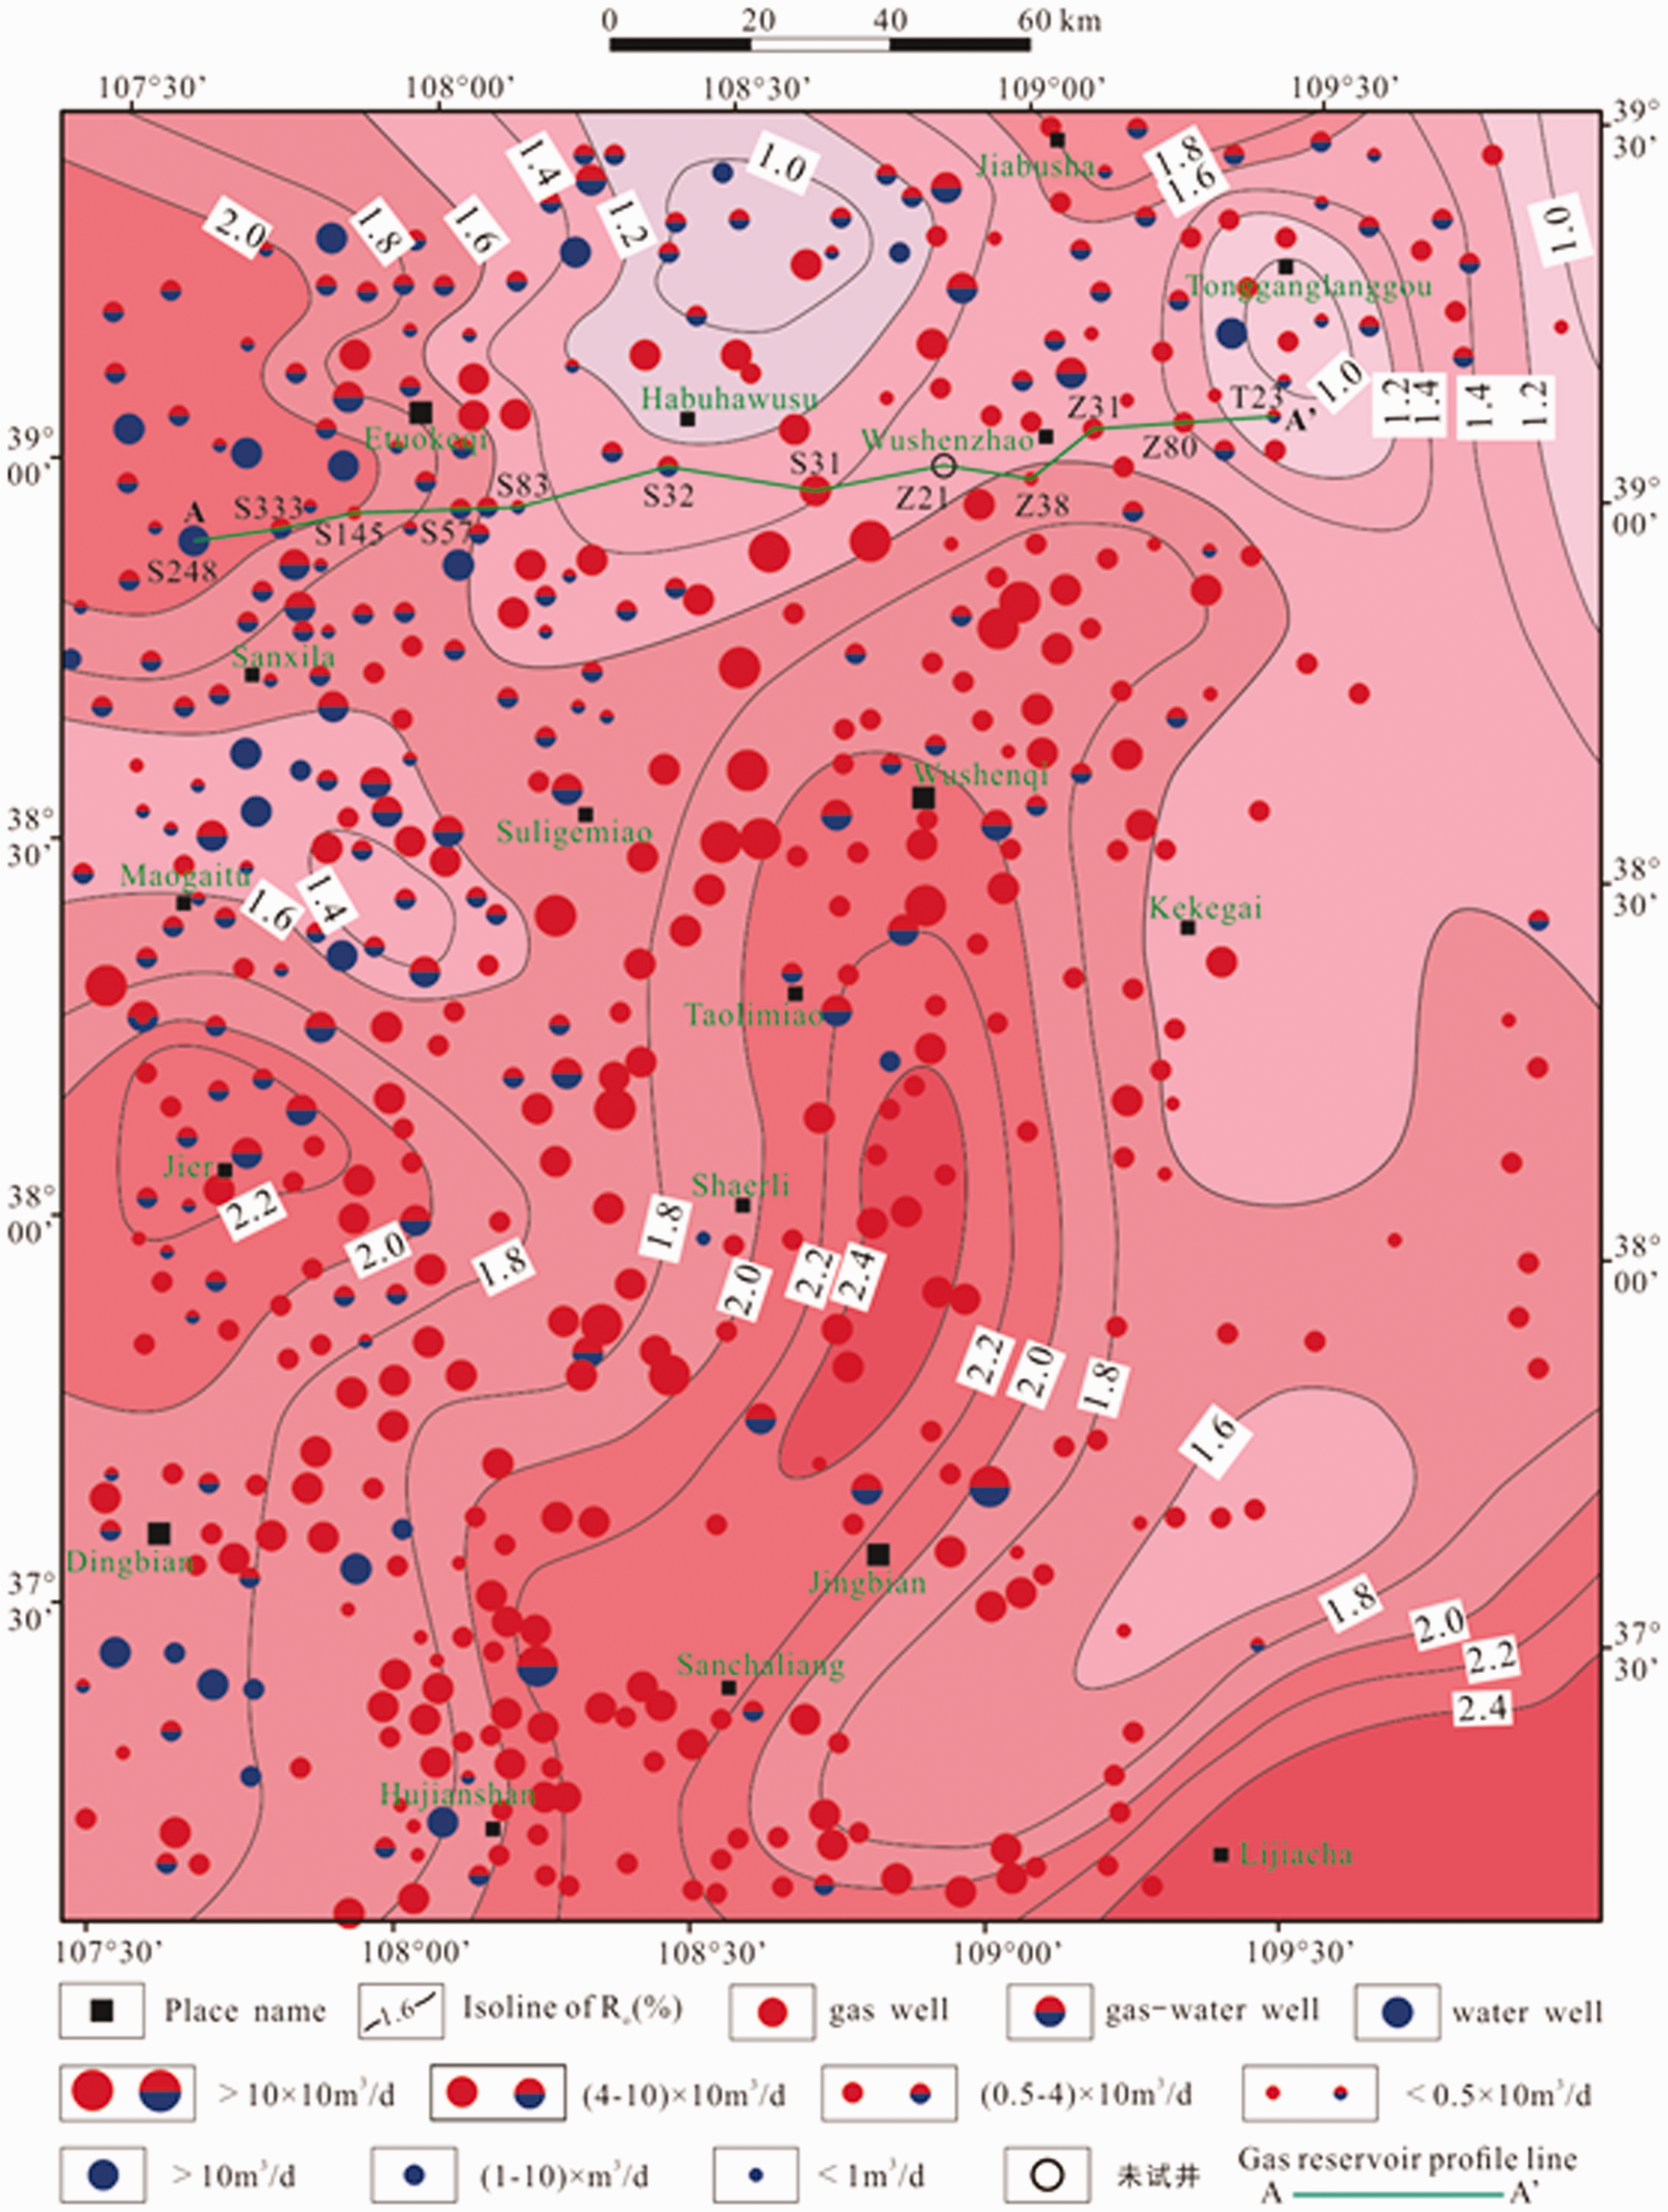
Map of Ro contour of source rock and gas-water distribution of He8 Member in SGP.
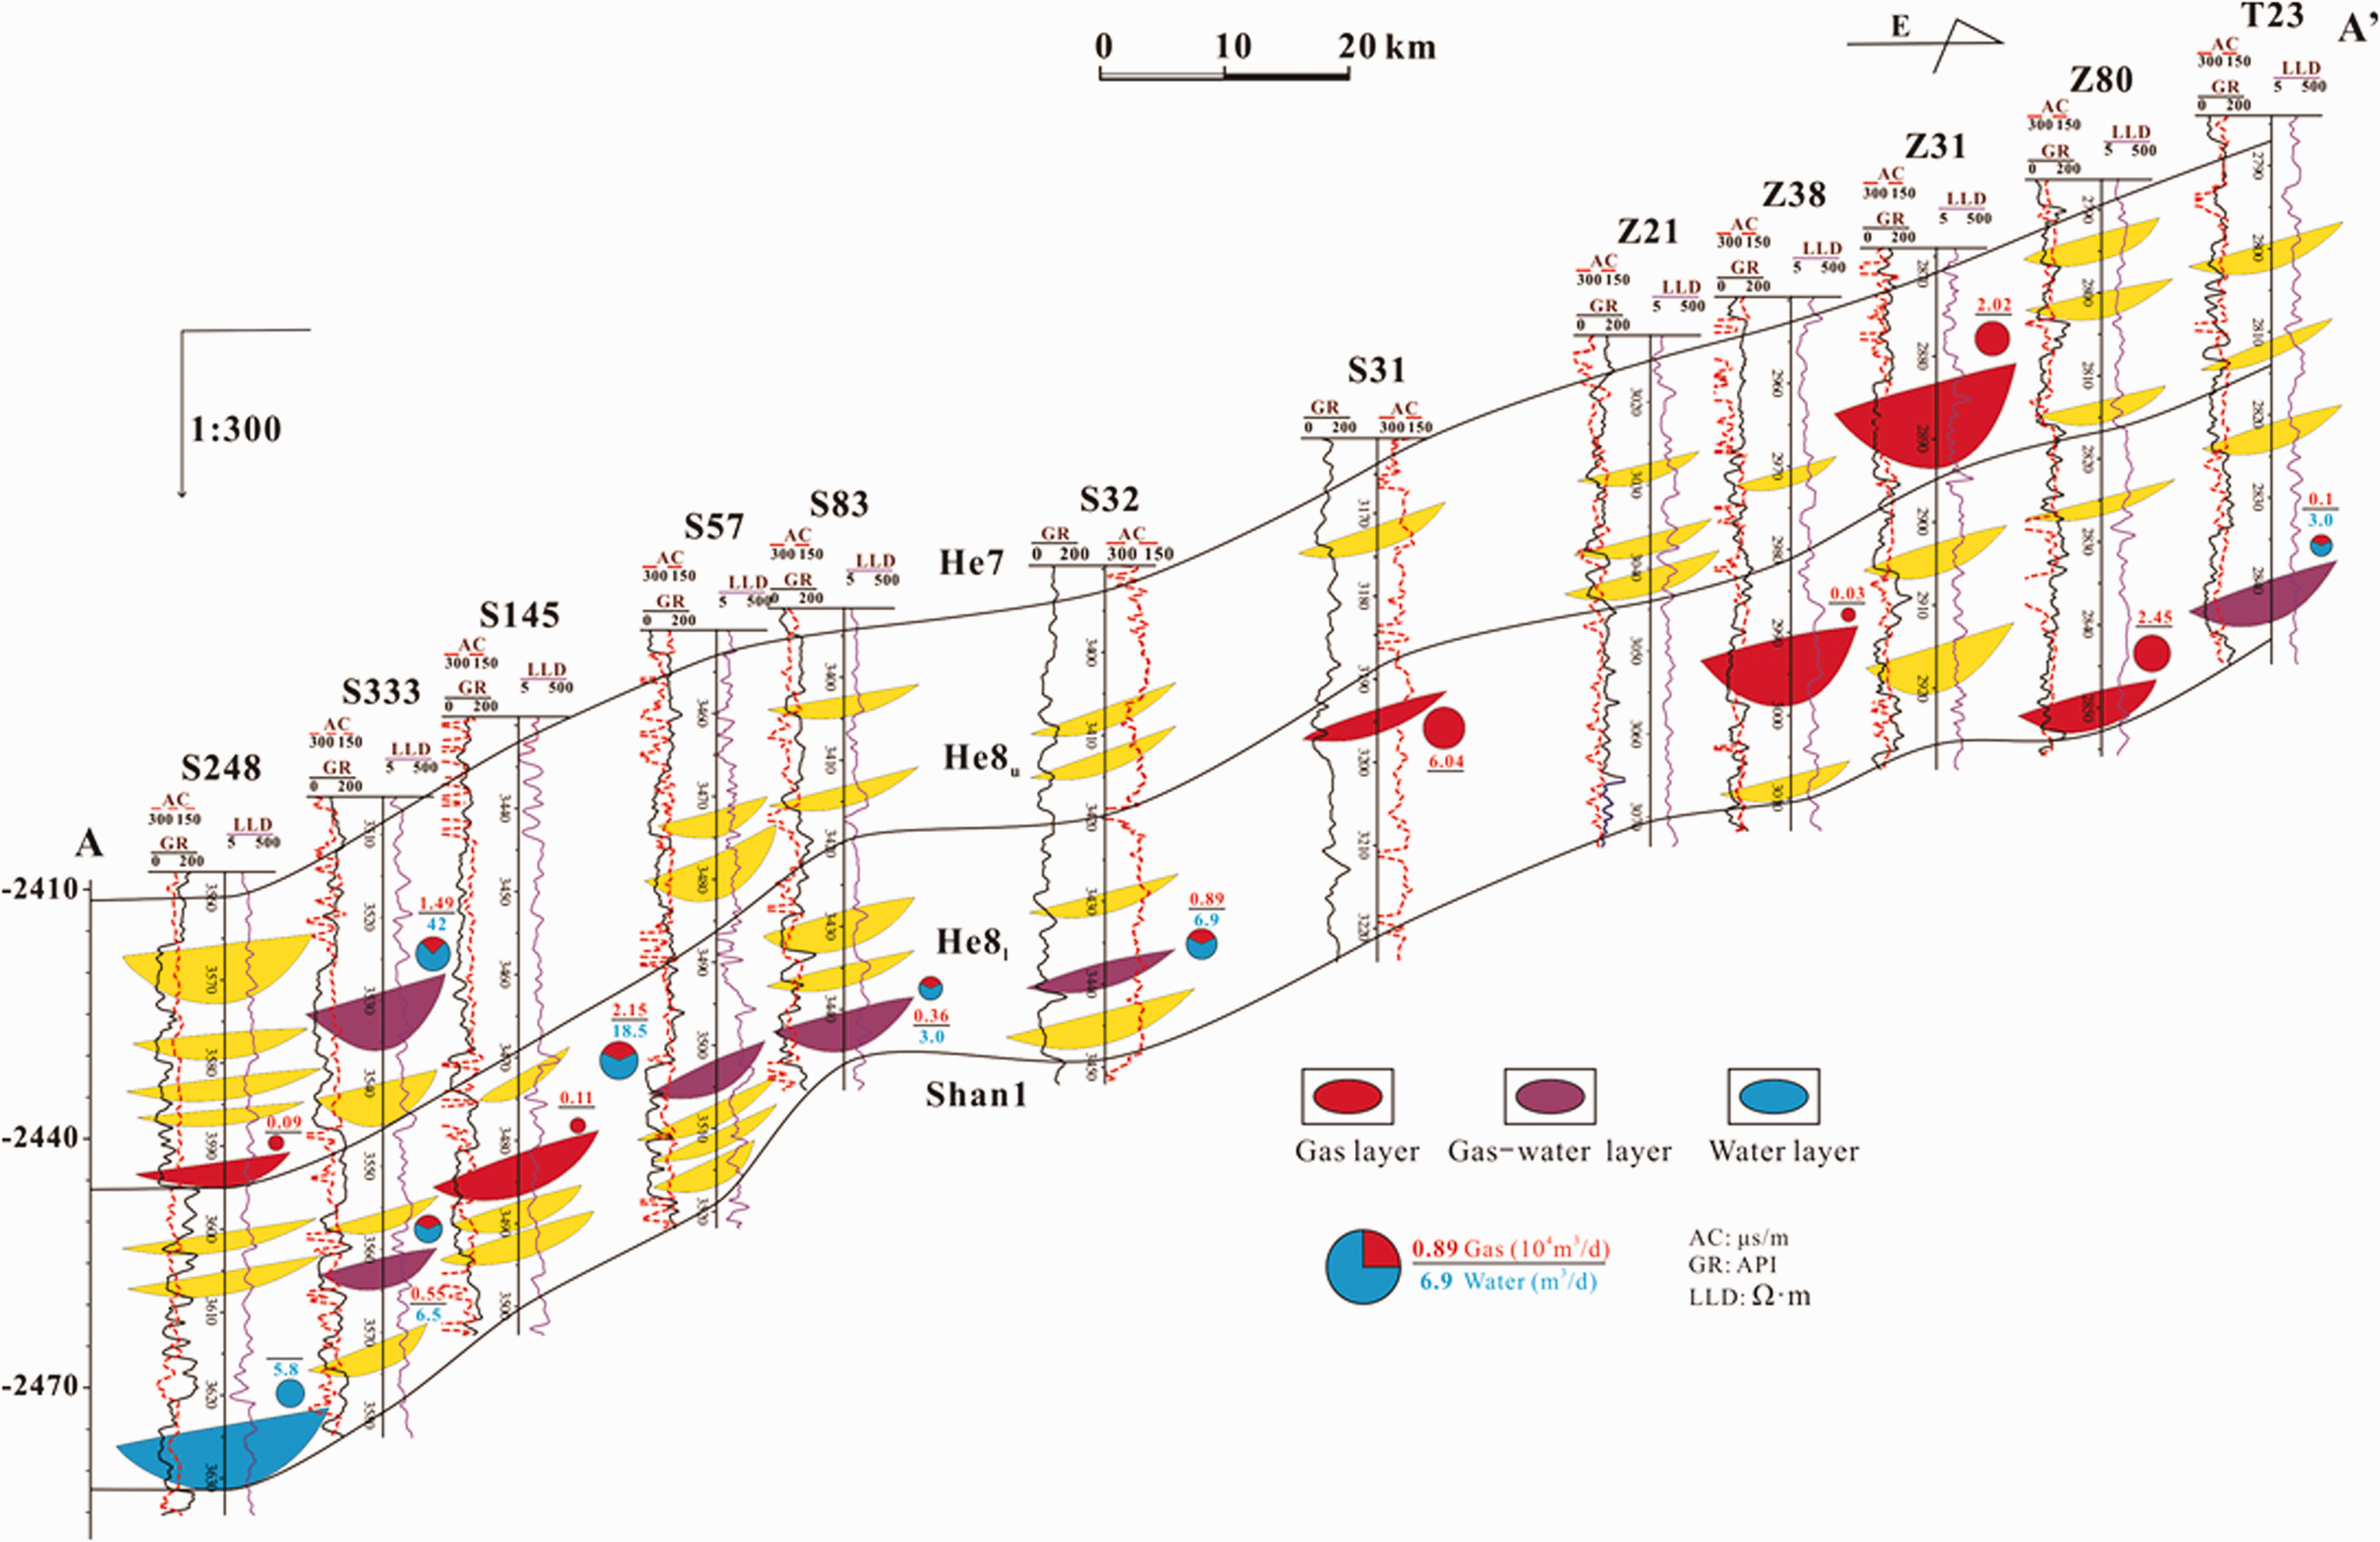
Profile of gas reservoir of He8 Member in SGP.
Gas reservoir characteristics of He8 Member
Distribution of gas and water
The gas-water distribution from southeast to west and north of He8 Member in SGP shows a trend of decrease of pure gas producing wells and gas production, and increase of gas-water co-producing wells and water producing wells and water production. Among the gas test results (N = 553) of the exploration well in He8 Member, pure gas producing wells accounted for the highest proportion and reached 60.3% of the total, mainly distributed in the central and southeastern part. Gas-water co-producing wells and pure water producing wells accounted for 35.1% and 4.5%, respectively, mainly distributed in the western and northern part (Figure 6). According to the gas production, the gas producing wells were divided into four types: high producing gas flow well (> 10 × 104m3/d), commercial gas flow well (4-10 × 104m3/d), low producing gas flow well (0.5–4 × 10⁴m3/d) and gas showing well (< 0.5 × 10⁴m3/d) (Figure 6). Among them, low producing gas flow wells are the most by accounting for 53.0%, followed by commercial gas flow wells accounting for 27.3%, which is mostly distributed in the southeast, gas showing wells is accounting for 16.1%, and high producing gas flow wells is 3.6%, mostly distributed at the central of the gas zone. The water production and water/gas ratio of He8 Member are significant in the west and north, and sporadic in the east and central of the gas zone. Among them, the water production ranges from 0 to 160 m3/d (N = 219), and the main body ranges from 2 to 30m3/d with an average of 11.2 m3/d. The distribution of water/gas ratio ranges from 0 to 650m3/104m3, showing a significant increasing trend from the middle to the west and north, especially in the northwest of the gas province (Figure 6).
The type of gas reservoir
There are three different understandings about the accumulation types of tight gas reservoirs. One is that tight gas reservoir belongs to deep basin gas (Law, 2002) and has continuous accumulation type (Schmoker, 2002). The second type is considered as conventional lithologic reservoir (Guo et al., 2018), which belongs to discontinuous distribution characteristics. The third understanding is that tight gas accumulation belongs to quasi-continuous accumulation characteristics, that is, it is different from continuous hydrocarbon accumulation, and also different from conventional type, showing differences about 10 aspects (Zhao et al., 2017, 2019). In this paper, it is considered that the tight gas reservoir of He8 Member belongs to tight sandstone gas reservoir, which is characterized by the quasi-continuous gas accumulation type.
The sand bodies of gas reservoir are fluvial channel facies, channel bar and delta distributary channel sand bodies of fluvial delta sedimentary facies. Due to the frequent migration of the main fluvial channel and the support of shallow delta water bodies, as well as the segmentation of sand bodies by fine sediments such as bay facies mudstone and flood plain facies argillaceous siltstone, the sand bodies appear to be present sheet distribution features, but their development scale is limited. Among them, the width of single sand body is about 400 ∼ 600m, and the length range is 800 ∼ 1200 m. The sealing argillaceous rocks and the main sand body together form the lithologic trap of large-area distributed sandstone lens, which shows the characteristics of plane contiguous and longitudinal superposition (Figure 7), namely large-area quasi-continuous distribution. The gas reservoir porosity of He8 Member is 6% ∼ 12%, and its average and median are 8.78% and 8.83%, respectively. The main permeability ranges from 0.1 to 1 × 10⁻³μm2 by accounting for 76.3%, and the average and median permeability are 1.39 × 10⁻³μm2 and 0.38 × 10⁻³μm2, respectively. There is no obvious edge-bottom water phenomenon in the gas reservoir, and the formation water is mostly stored and produced together with natural gas, or distributed as an isolated lens.
Controlling effects of source rock conditions on gas-water distribution of He8 Member
Controlling effects of source rock Ro on gas-water distribution
Through the analysis of the gas test results of He8 Member and the source rock Ro on the superposition mapping, it is found that the distribution of Ro has a good correspondence with the gas test results. The high Ro value areas in the central and southern regions are mainly pure gas producing wells and commercial gas flow wells, while the proportion of producing wells and gas-water co-producing wells in the north and west regions with low Ro is obviously more. And the boundary of Ro between the two is roughly 1.6%–1.8%.
The controlling effect of source rock Ro on the gas production of He8 Member has stages (Figure 8(a)). With the increase of Ro, the low-value envelope curve of gas test production tends to increase, especially when the Ro of pure gas producing wells is greater than 2.1%, the relatively high production wells increase obviously. The high-value curve increases first and then decreases, and the Ro corresponding to the inflection point of peak production is about 1.7%. When the gas test production is less than 1 × 10⁴m3/d, the gas test production increases with the increase of source rock Ro. When the gas production is greater than 1 × 10⁴m3/d, the gas production first increases and then decreases with the increase of source rock Ro. When the Ro of the source rock is low, the natural gas generated by the source rock is first charged into the larger pores of the tight sandstone, because the small charging force can overcome the capillary resistance of the larger pores, and the production will increase significantly, showing an obvious controlling effect. With the increase of source rocks Ro, natural gas gradually enters the smaller pores, there may be a weak upward trend because the controlling effect of other reservoir-forming conditions is aggravated, such as physical property, fractures of reservoir (Li et al., 2019; Zhao et al., 2010). Therefore, compared with the low Ro, the controlling effect of higher Ro on natural gas is obviously weakened.
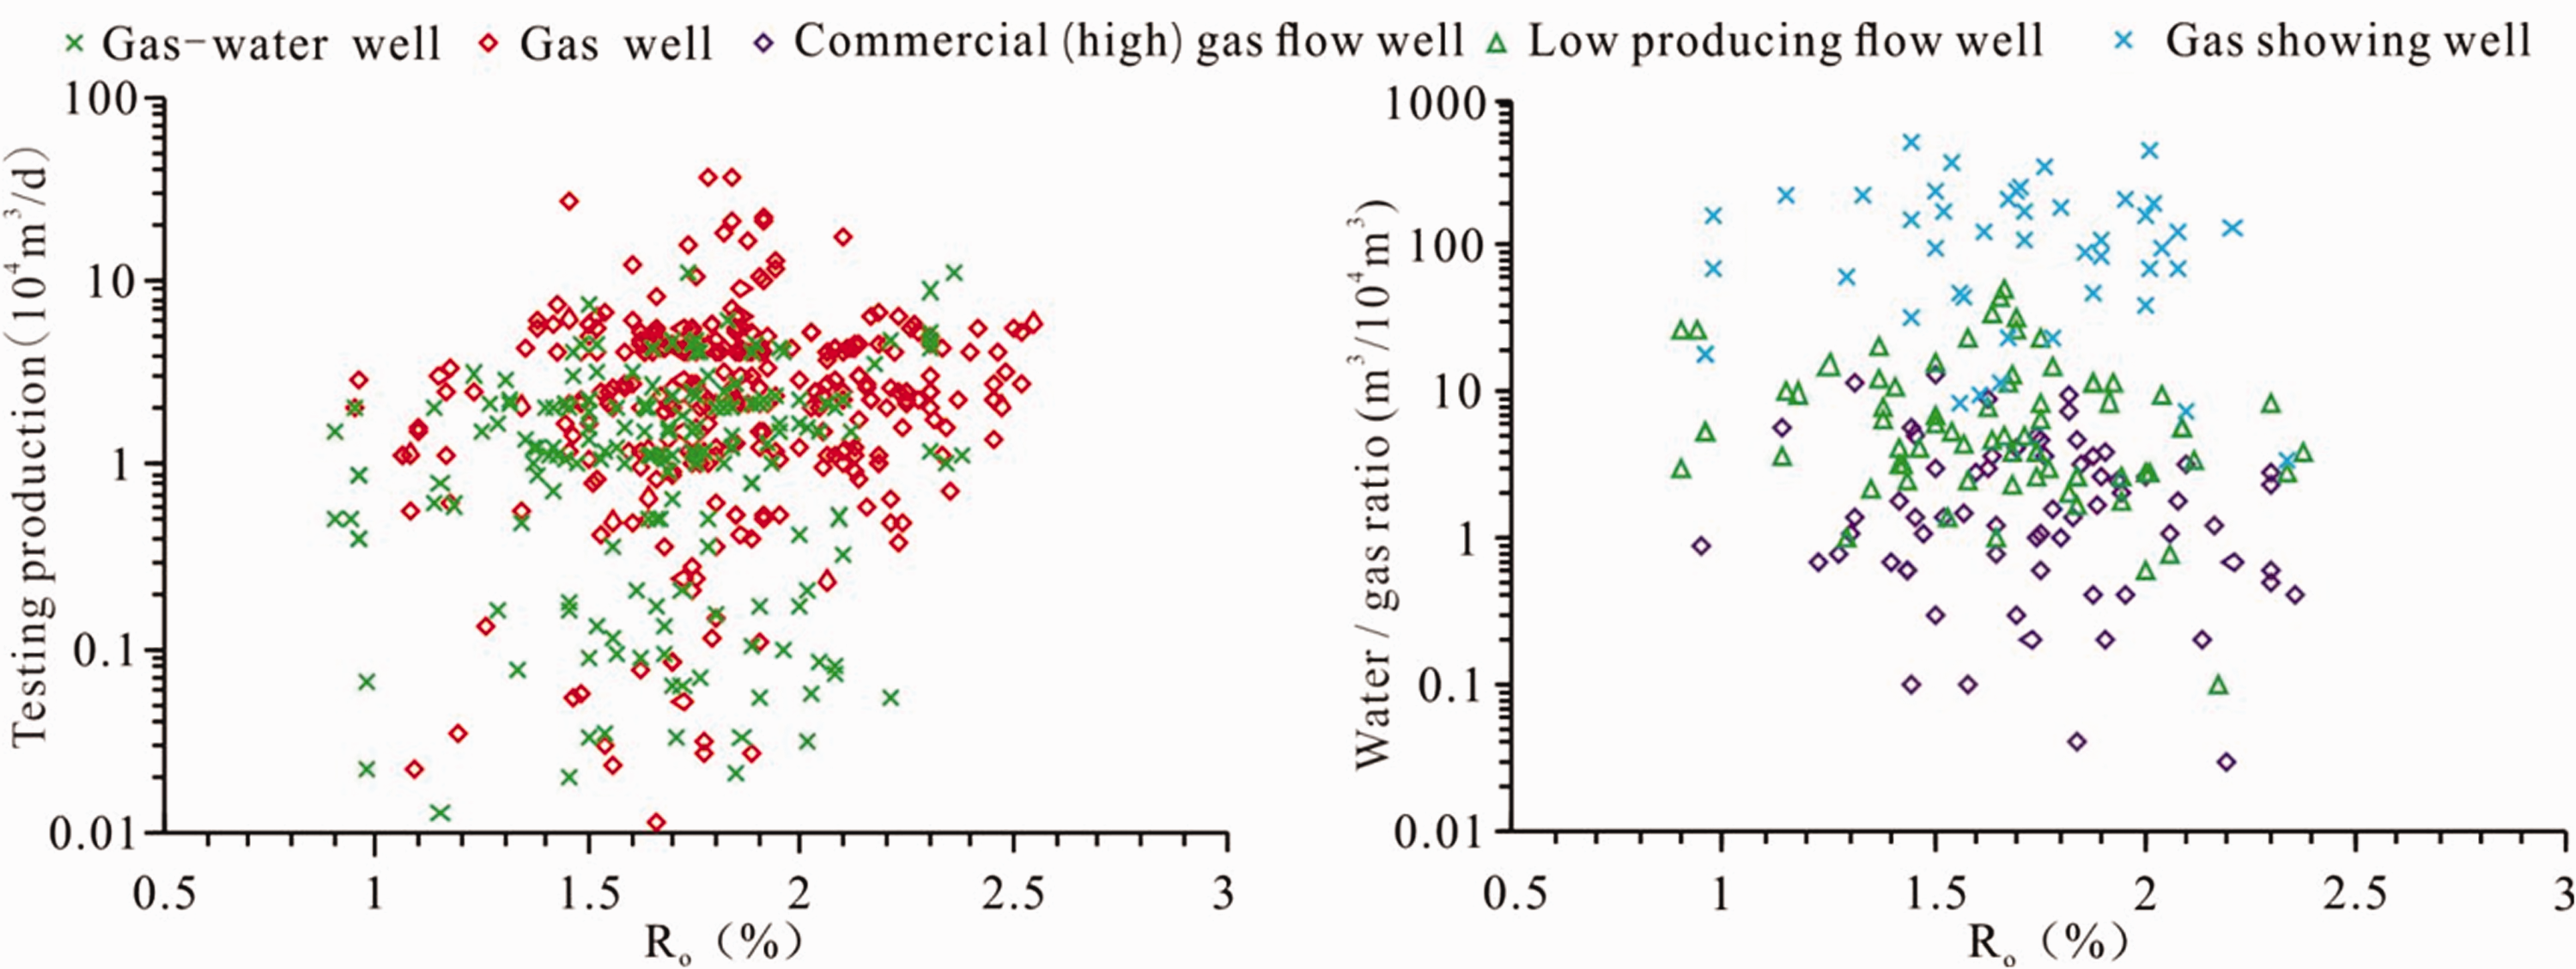
Relationships of Ro of source rock vs. test results and water/gas ratio of He8 Member in SGP.
There is a relatively good correlation between Ro and water/gas ratio on the whole in He8 Member (Figure 8(b)). With the increase of Ro in the source rocks, both the envelope lines with high and low water/gas ratio show a decreasing trend. When Ro is less than 1.6%-1.7%, the natural gas can only replace part of the formation water in the larger pores, and the mixed layer state of natural gas and formation water is formed in the tight reservoir, so the water-gas ratio changes fewer. When Ro is greater than 1.6%-1.7%, most of the formation water in the larger pores is driven out with the increase of natural gas charging force, and the formation water content in tight sandstone reservoir decreases obviously, and it is mainly the occurrence state of bound water and free gas. In other words, with the increase of Ro, the water/gas ratio shows a decreasing trend.
Controlling effect of source rock HGI on gas-water distribution
The hydrocarbon generation potential of source rock is directly related to the hydrocarbon enrichment degree in the basin, which is mainly controlled by the parameters such as the lithology, thickness, hydrocarbon generation rate, abundance of organic matter, type of organic matter and degree of thermal evolution of source rocks (Atul et al., 2019; Hunt, 1996; Sykes and Snowdon, 2002; Tissot and Welte, 1984). The HGI of source rock is a comprehensive parameter to evaluate the hydrocarbon generation ability of source rock, which is related to the lithology, thickness, TOC and the hydrocarbon generation rate of hydrocarbon generation simulation experiment. Its calculation formula is as follows:

Where, Ggas is the gas generation intensity of source rock, 108 m3/km2;
H is the thickness of source rock, m;
ρrock is the density of source rock, t/km3; 1.4 × 10³kg/m3 for coal seam, 2.6 × 10³kg/m3 for dark mudstone,
TOC is the total of organic carbon, %;
r is the gaseous hydrocarbon yield of source rock, m3/tTOC.
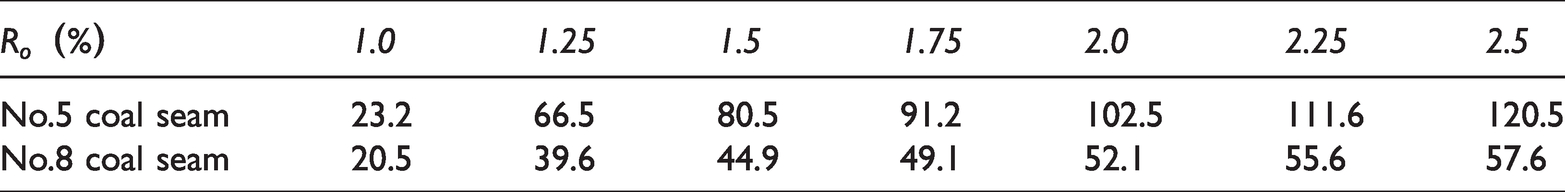
Coal seam methane hydrocarbon yield (r) was obtained through the closed autoclave pyrolysis experiment method (Yang et al., 2016) (Table 1). The gaseous hydrocarbon yield rate of No.5 coal seam in Shan2 Member is significantly higher than that of No.8 coal seam in Benxi Formation because of the differences in the hydrogen content under the microscope (Yang et al., 2016). Combined with logging interpretation of TOC, the HGI range of coal seam is (1 ∼ 36) ×108 m3/km2 with an average of 12.8 × 10⁸ m3/km2, and the range of dark mudstone is (0.2 ∼ 10) ×108 m3/km2 with an average of 3.9 × 10⁸ m3/km2. The HGI range of coal-measure source rocks is (3 ∼ 40) ×108 m3/km2 with an average of 16.7 × 10⁸ m3/km2, and the main range is (10 ∼ 26) ×108 m3/km2. The maximum is mainly distributed in the central Wushengzhao - Taolimiao - Balasu - Sanzhaoliang area (Figure 9). The controlling effect of HGI on the gas-water distribution in the plane is similar to that of Ro.The high value areas in the southeast are mainly pure gas producing wells and commercial gas flow wells, while the number of water wells of the low HGI areas in the west and north increase significantly.
Hydrocarbon production rate of No.5 coal in Shan2 Member and No.8 coal in Benxi Formation (kg/tTOC)(Yang et al., 2016).
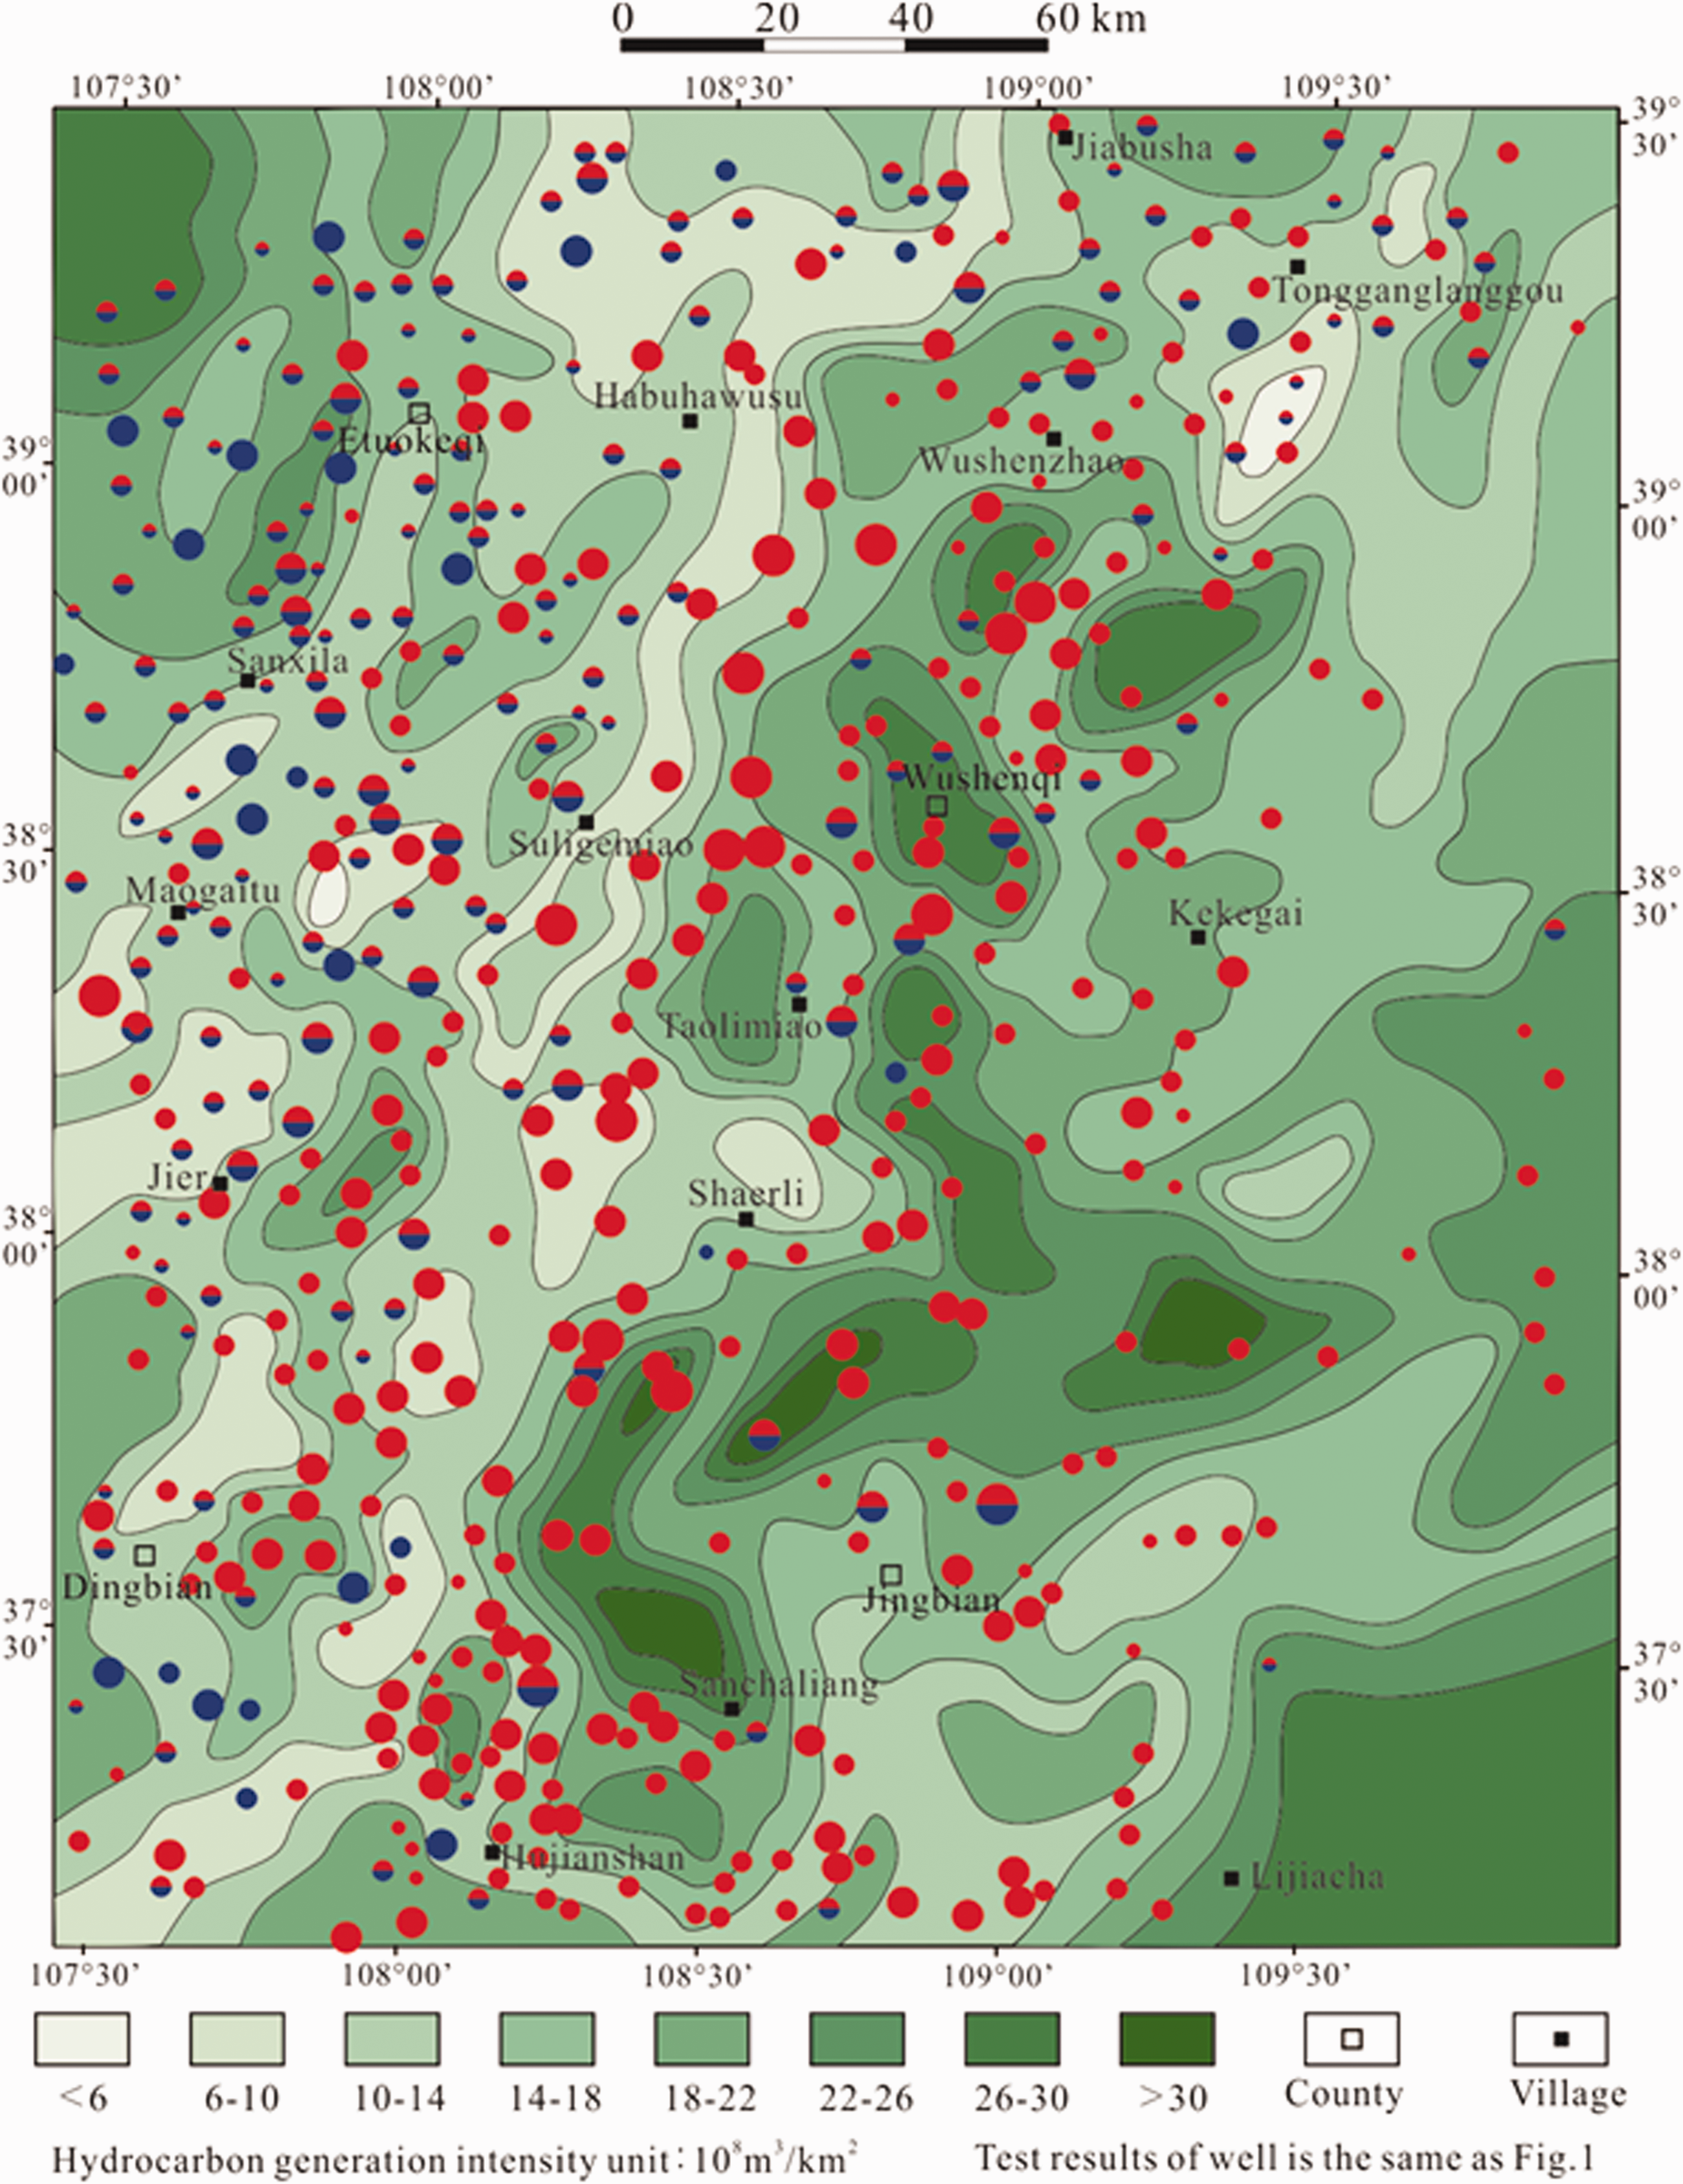
Superposition of HGI of source rock and gas-water distribution of He8 Member in SGP.
The HGI of source rocks is positively correlated with the gas production of He8 Member (Figure 10(a)). With the increase of HGI, the low-value envelope curve of gas test production showed a significant increase trend, while the high-value curve showed a trend of first increase and then decrease. The HGI corresponding to the inflection point of the peak production was about 15 × 108 m3/km2. When the gas test production is less than 1 × 10⁴m3/d, the production increases obviously with the increase of source rock HGI. When the production is greater than 1 × 10⁴m3/d, the production first increases and then decreases with the increase of HGI of source rocks. These results indicate that the HGI has an obvious controlling effect on the gas production when the source rock conditions are insufficient, while the source rock conditions are relatively sufficient, the controlling effect of HGI on the gas production is weakened.
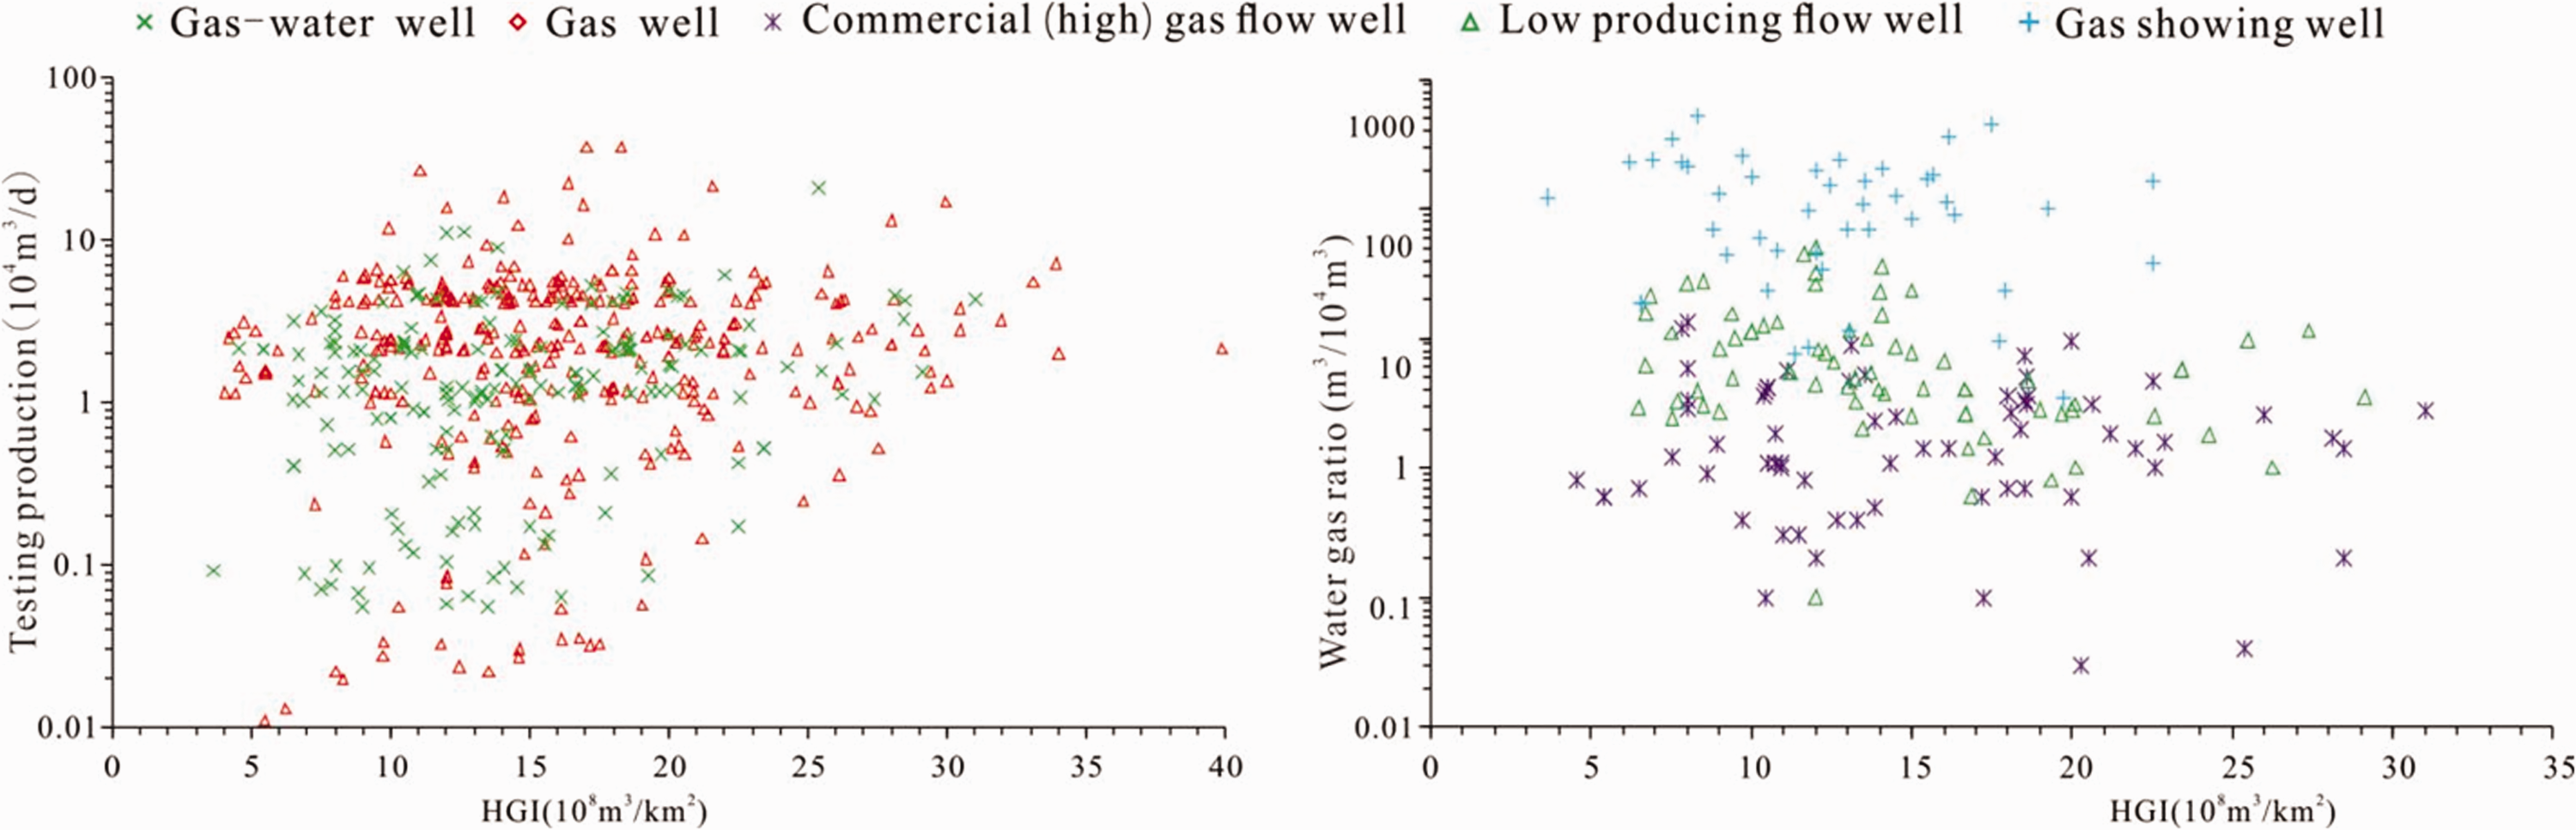
Relationships of HGI of source rock vs. test production and water/gas ratio of He8 Member in SGP.
The HGI of source rock has an obvious negative correlation with the water/gas ratio of He8 Member (Figure 10(b)). both the envelope curves with high water/gas ratio and with low water/gas ratio show an obvious decreasing trend with the increase of HGI. When the HGI is less than 15 × 108 m3/km2, the weak HGI of the source rock can only replace part of the formation water in the tight reservoir, and the water/gas ratio shows a certain decreasing trend. When the HGI is greater than 15 × 108 m3/km2, with the increase of HGI, most of the formation water in the large pores is driven out, and the remaining formation water mainly occurs in the state of bound water. Then, the water/gas ratio has a relatively obvious decreasing trend. According to the analysis of different oil test production of gas-water co-producing wells, the decreasing trend of commercial gas flow wells (including high producing gas flow wells) is the most obvious, followed by low producing flow gas wells. Comparatively speaking, HGI plays a stronger role than Ro on controlling natural gas and gas-water distribution.
Threshold values of commercial gas flow wells
The lower limit standard of coal- measure source rocks for forming large and medium gas fields is also changed due to the deepening of exploration and the refinement of source rock evaluation. Dai et al. (1996) analyzed the gas source conditions of large and medium-sized gas fields at home and abroad, especially the large gas fields in Russia, and concluded that the HGI of source rocks forming large and medium-sized gas fields was over 20 × 108m3/km2. Yang and Wei (2007) believed that the HGI required by the formation of low permeability gas reservoirs was reduced through the research on large gas fields of the Upper Paleozoic in the Ordos Basin, and accordingly proposed that the HGI could be reduced to 16 × 108m3/km2. Zhao et al. (2011) thought that the lower limit of HGI for the formation of large tight sandstone gas field could be reduced to 11 × 108m3/km2 through the analysis of Upper Paleozoic tight sandstone in Ordos Basin, and then it was determined to be 10 × 108m3/km2 (Cao et al., 2013; Zhao et al., 2012, 2016). Fu et al. (2016) confirmed that 10 × 108m3/km2 could be used as the lower limit of HGI in the eastern margin of Ordos Basin. However, the lower limits of commercial gas flow wells are not involved. Based on the above understanding of large tight gas fields, the threshold values of commercial gas flow well is determined by the intersection relationship between Ro and HGI of coal seam source rock and pure gas producing well of He8 Member in SGP. Through the intersection relationship between pure gas producing layers of He8u and He8l and Ro, HGI respectively (Figure 11), the Ro and HGI values of commercial gas flow wells in He8u are 1.33% and 8 × 10⁸m3/km2, respectively, and the corresponding values of He8l are 1.38% and 9 × 10⁸m3/km2. The determination of lower limit of commercial gas flow wells is conducive to the refinement of tight gas exploration and provides a theoretical basis for further development.
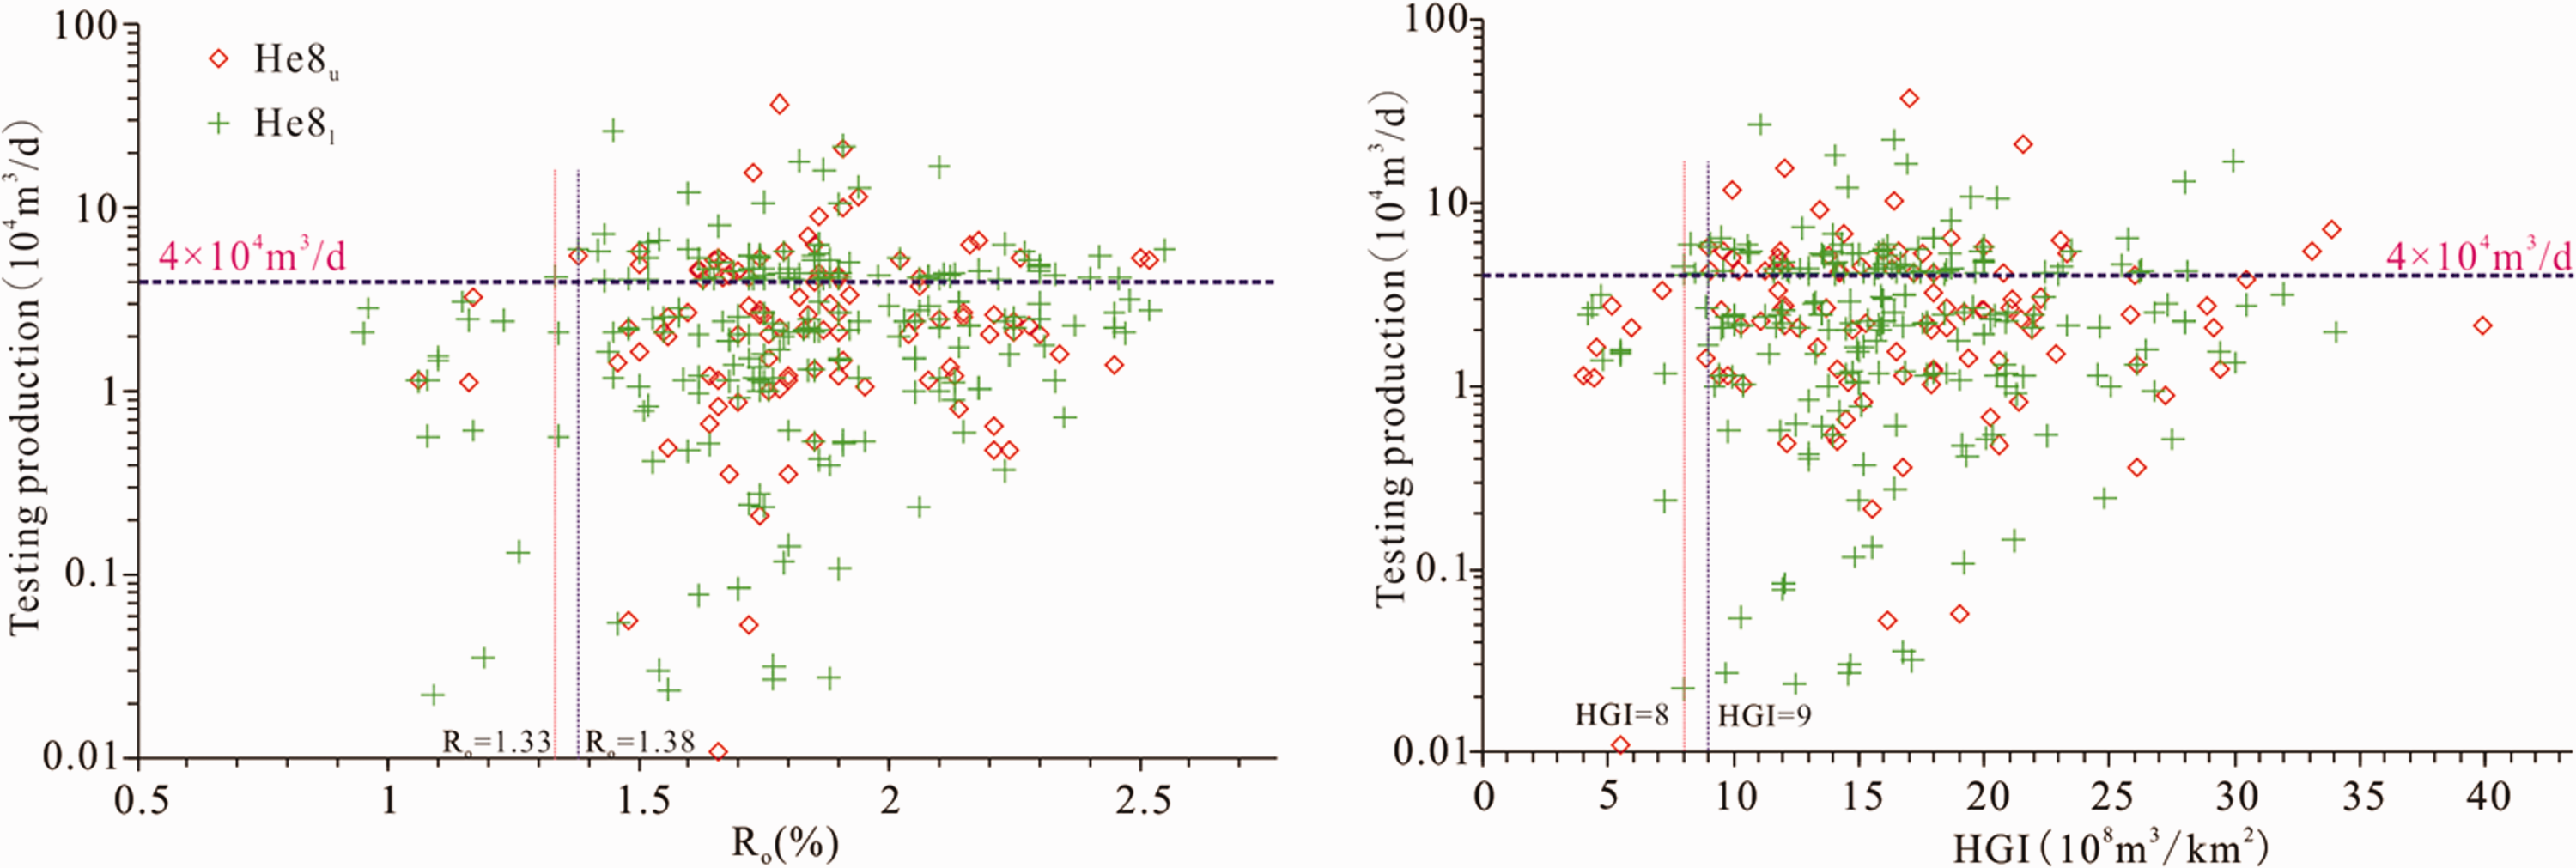
Relationships of Ro, HGI vs. Test production of He8u and He8l in SGP.
Conclusion
The coal-measure source rock from Benxi Formation to Shan2 Member in SGP has the characteristics of extensive and superimposition. The average total thickness of coal seam is 9.32m, showing thick in the east and north, thin in the west and south. The thickness of the coal seam in Benxi Formation is the highest and reaches 4.51m. The dark mudstone of Shan2 Member is most developed in the southeast. The average content of logging TOC of Benxi Formation and Taiyuan formation is 65.74% and that of Shan2 Member is 58.21%. The average Ro of source rocks is about 1.6%, which is in the stage of high maturity. The HGI is mainly between (10∼26) ×108m3/km2 with an average of 16.7 × 10⁸m3/km2. The hydrocarbon generation capacity of the eastern area is obviously better than that of the western area. The gas reservoir of He8 Member belongs to tight sandstone lenticular gas reservoir, which shows the characteristic of the large-scale quasi-continuous distribution. The control effect of source rocks on production has stages. When the gas test production is lower than 1 × 10⁴m3/d, Ro and HGI of source conditions have the obviously controlling effect on the gas production. when the production is more than 1 × 10⁴m3/d, the controlling effect of Ro and HGI is weakened. When Ro is more than 1.6%-1.7%, or HGI is more than 15 × 108m3/km2, the decreasing trend of water-gas ratio is evident, especially in commercial gas flow wells (including high producing gas flow wells). HGI plays a stronger role than Ro on controlling natural gas and gas-water distribution. The threshold values of Ro and HGI for commercial gas flow wells are 1.33% and 8 × 10⁸m3/km2, respectively.
Footnotes
Acknowledgements
The authors are also thankful to the reviewers of this manuscript for their constructive comments and suggestions.
Author contributions
Weitao Wu: Conceptualization, Methodology, Writing - original draft, Writing - review & editing, Formal analysis. Chen Mengna: Investigation, Data Statistics, Formal analysis and Writing - original draft. Ning Li: Supervision, Software, Formal analysis and Data Statistics. Yi Wang: Validation, Software and Data Statistics. Jingzhou Zhao: Supervision, Methodology, Writing - review. Xinshan Wei: Supervision, Validation, Conception.
Declaration of conflicting interests
The author(s) declared no potential conflicts of interest with respect to the research, authorship, and/or publication of this article.
Funding
The author(s) disclosed receipt of the following financial support for the research, authorship, and/or publication of this article: This work was funded by the National Science and Technology Major Project of China (Project No: 2016ZX05050).