
Abstract
To understand the pore structure and fractal characteristics of tight gas reservoirs, thin sections, nuclear magnetic resonance, rate-controlled mercury injection, microcomputed tomography scanning, and field emission scanning electron microscopy investigations under laboratory conditions were conducted on a suite of core samples from the Middle Permian Shihezi Formation of Sulige area in the Ordos Basin, China. The investigated tight gas sandstones comprise three types of pores, i.e. residual intergranular pore, secondary dissolution pore, and micropore. The pore–throat size distribution is extremely wide and multiscale (10 nm–400 μm) co-existing in tight gas reservoirs. The submicron- and micron-scale pore–throats with radius above 0.05 μm, which are characterized by combining rate-controlled mercury injection with nuclear magnetic resonance, are considered to be the effective pores and throats that dominated the reservoirs flow capacity. Tight gas sandstones have stage fractal characteristics, and the intrusion pressure of approximately 1 MPa is regarded as an inflection point. Fractal dimension is negatively correlated with permeability, average throat radius and mainstream throat radius, positively correlated with heterogeneous coefficient, while there are no obvious relationships with porosity and average pore radius. Additionally, the percolation characteristics of tight gas reservoirs can be characterized by fractal structure. When the pore structure does not follow the fractal structure (i.e. intrusion pressure is lower than 1 MPa), the mercury intrusion saturation is dominated by pores; in contrast, the mercury intrusion saturation is almost solely dominated by throats. This research sheds light on the pore–throat size distribution of tight gas reservoirs by identifying the role of multiple techniques and the relationships between the pore structure parameters and percolation characteristics of tight gas reservoirs and fractal dimension.
Keywords
Introduction
Tight sandstone gas is considered an important and the most realistic alternative resource to be developed on a large scale in China (Yu et al., 2014; Jia et al., 2012; Zou et al., 2015). Tight sandstone is commonly characterized by strong heterogeneities and poor reservoir quality (Higgs et al., 2007; Holditch, 2006; Sharif, 2007; Surdam, 1997; Zou et al., 2015). The eighth member of the Middle Permian Shihezi Formation (P2h8) is the main tight sandstone gas exploration and exploitation interval, in which trillions of cubic feet of gas reservoirs were found in the Sulige area of Ordos Basin (Zou et al., 2015). Understanding the morphology, size, and size distribution of the pore–throat is a primary objective leading to a better investigating of reservoir quality and percolation characteristics of tight sandstones (Clarkson et al., 2012; Tsakiroglou and Payatakes, 2000). Therefore, improving the knowledge of the complex pore structure of tight sandstones is of great importance.
As with other unconventional oil and gas reservoirs (Clarkson et al., 2012; Ghanizadeh et al., 2015; Ross and Bustin, 2009; Zhang et al., 2016), tight sandstone gas reservoirs typically exhibit a wide pore–throat size distribution (PSD), and the conventional methods for characterizing the pore structure are restricted. Nowadays, a combination of various methods is utilized to describe the morphology, size, and other characteristic parameters of pore, throat, and cracks in tight sandstones (Bustin et al., 2008; Clarkson et al., 2012; Gao and Andy Li, 2016). Pressure-controlled mercury injection (PMI) can only obtain the throat radius distribution, and the same capillary-pressure curve may correspond to a diverse pore–throats system. However, rate-controlled mercury injection (RMI) can separate the total capillary-pressure curve into the throat capillary-pressure curve and the pore capillary-pressure curve, and therefore obtain the unique distribution of pore–throat system (Yuan, 1990; Yuan and Swanson, 1989; Zhao et al., 2015). It should be noted that RMI failed to characterize pore–throats lower than 0.12 μm because of the limitation of the applied intrusion pressure. Therefore, RMI must be combined with other techniques to determine the entire PSD of tight gas reservoirs. Currently, nuclear magnetic resonance (NMR) (Gao and Andy Li, 2016; Li et al., 2015), microcomputed tomography (micro-CT) scanning (Bai et al., 2013; Zou et al., 2015), and field emission scanning electron microscope (FE-SEM) methods (Jiao et al., 2014; Zhao et al., 2015; Zou et al., 2011) are widely applied to investigate pore structure of tight reservoirs especially for the identification of submicron and nanoscale pores, and achieved good results.
It is difficult to directly characterize the complexity and heterogeneity of pore–throat systems by experiments, but the introduction of fractal dimension makes it easier and more effective. The fractal dimension (D), which was proposed by Mandelbrot in 1975, has been widely applied as an important petrophysical parameter to characterize the complicated geometric forms such as pore surface roughness and structural irregularity (Angulo et al., 1992; Ge et al., 2015; Giri et al., 2012; Hu et al., 2016; Katz and Thompson, 1985; Mandelbrot, 1982; Omar et al., 2015; Pfeifer and Avnir, 1983; Sakhaee-Pour and Li, 2016; Schlueter et al., 1997). Fractal dimension varies from 2 to 3, and values closer to 3 indicate a rather rough pore surface (Hu et al., 2016; Li and Horne, 2006). Several methods have been applied to research the fractal characteristics of the pore structure of sedimentary rocks including PMI (Buiting and Clerke, 2013), small (ultra-small) angle neutron scattering (Anovitz et al., 2015; Clarkson et al., 2012), thin-section (Ge et al., 2015), scanning electron microscopy (SEM) (Carracedo et al., 2009; Krohn, 1988), and gas adsorption porosimetry (Katz and Thompson, 1985; Larraz, 2002; Ono et al., 2009; Wang et al., 2015a). However, less attention has been paid to the fractal characteristic of the pore structure on the basis of RMI data.
Tight sandstones from the Middle Permian Shihezi Formation in the Ordos Basin are among the most important tight gas reservoirs in China and have been researched because of their great tight gas potential. Previous studies indicated that there has been no systematic research regarding the pore structure and fractal characteristics of tight gas sandstones in Ordos Basin (Ding et al., 2016). Here, we attempt to bridge this gap, and the mission of this paper is to (1) clarify the pore types of tight gas reservoirs, (2) determine the overall PSD by integrating multiple techniques, (3) elucidate the fractal characteristics of tight gas reservoirs using RMI data, and (4) discuss the relationships between pore structure parameters and percolation characteristics of tight gas reservoirs and fractal dimensions.
Geological setting
The Ordos Basin, located in north-central China (Figure 1(a)), was formed on the North China Craton (Hanson et al., 2007; Yang et al., 2014). The basin is located between 34°00′ to 41°20′ N and 105°30′ to 110°30′ E with an area about 25 × 104 km2, which is further divided into six first-class tectonic units (Figure 1(a)) (Duan et al., 2008). The study area is located in the northern Ordos Basin and spans an area of approximately 3.0 × 10⁴ km2. Strata in the study area are relatively flat lying or dip gently to the west (Figure 1(b)), and the internal fracture is undeveloped (Ding et al., 2016).
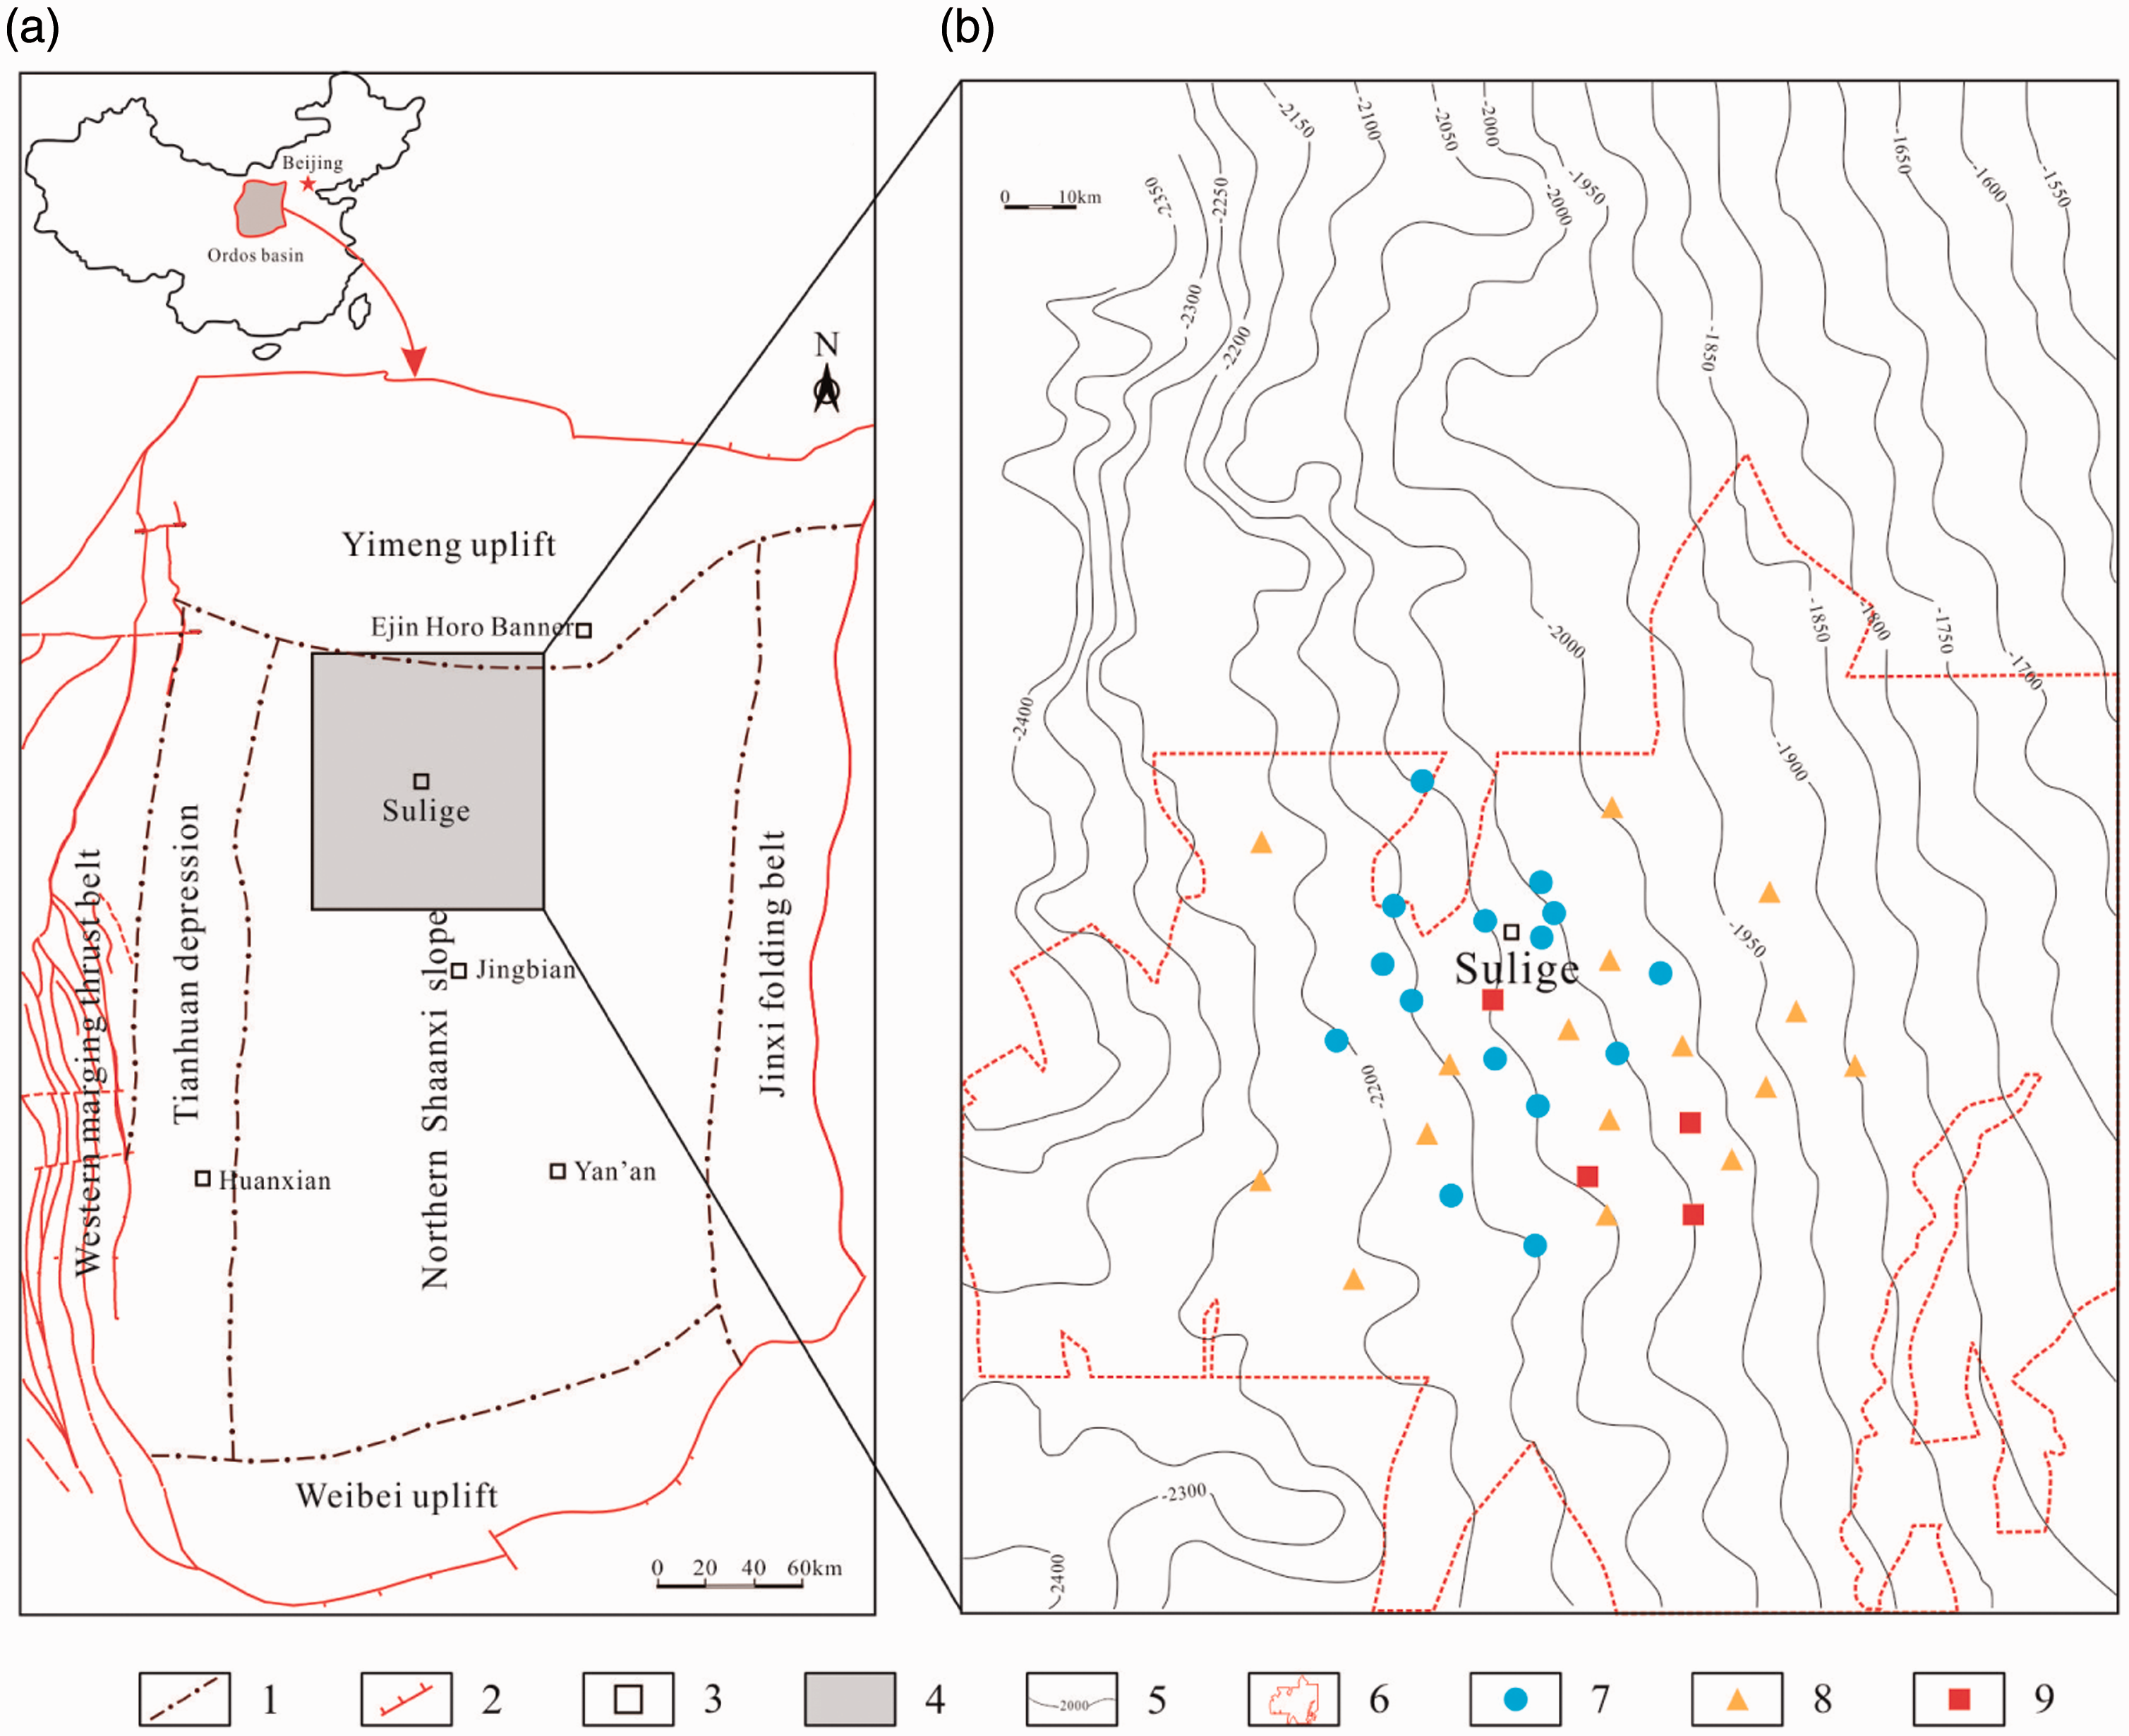
(a) Simplified tectonic map of the Ordos Basin showing the location of the study area. (b) Index map of the study area including the Sulige gas field and structure contours at the top of the Permian (modified from Ding et al., 2016). 1: Tectonic unit boundary; 2: fault; 3: place name; 4: study area; 5: contour of Permian top (m); 6: Sulige gas field; 7: wells with porosity–permeability data; 8: wells with porosity–permeability data and RMI and thin section and FE-SEM; 9: wells with porosity–permeability data and RMI and thin section and NMR and micro-CT.
Carboniferous strata consist mainly of thin shallow-marine limestone and thick fluvial-deltaic deposits that are overlain by fluvial Permian strata (Figure 2) (Ding et al., 2016; Hanson et al., 2007; Yang et al., 2014). The Shanxi Formation, Shihezi Formation, and Shiqianfeng Formation constituted the Permian stratigraphy succession of Ordos Basin (Yang et al., 2014). The Shihezi Formation of this study is sandstone mixed with mudstone and is subdivided into eight members namely P2h8 to P2h1 from the bottom to the top (Figure 2). Among them, the P2h8 is the primary gas-bearing unit and the primary exploration target, which was dominated by medium-coarse grained quartz sandstones deposited in the braided river (Ding et al., 2016). The P2h8 member in the investigated study area shares a similar burial history, with a thickness of 50 to 70 m. The gas source rocks consist of the Taiyuan Formation and Shanxi Formation’s coal seams and carbonaceous mudstones (Hanson et al., 2007; Yang et al., 2014). Because of the intense compaction and cementation, the P2h8 reservoirs were tight before a continuous gas-charging during the late Jurassic – early Cretaceous period.
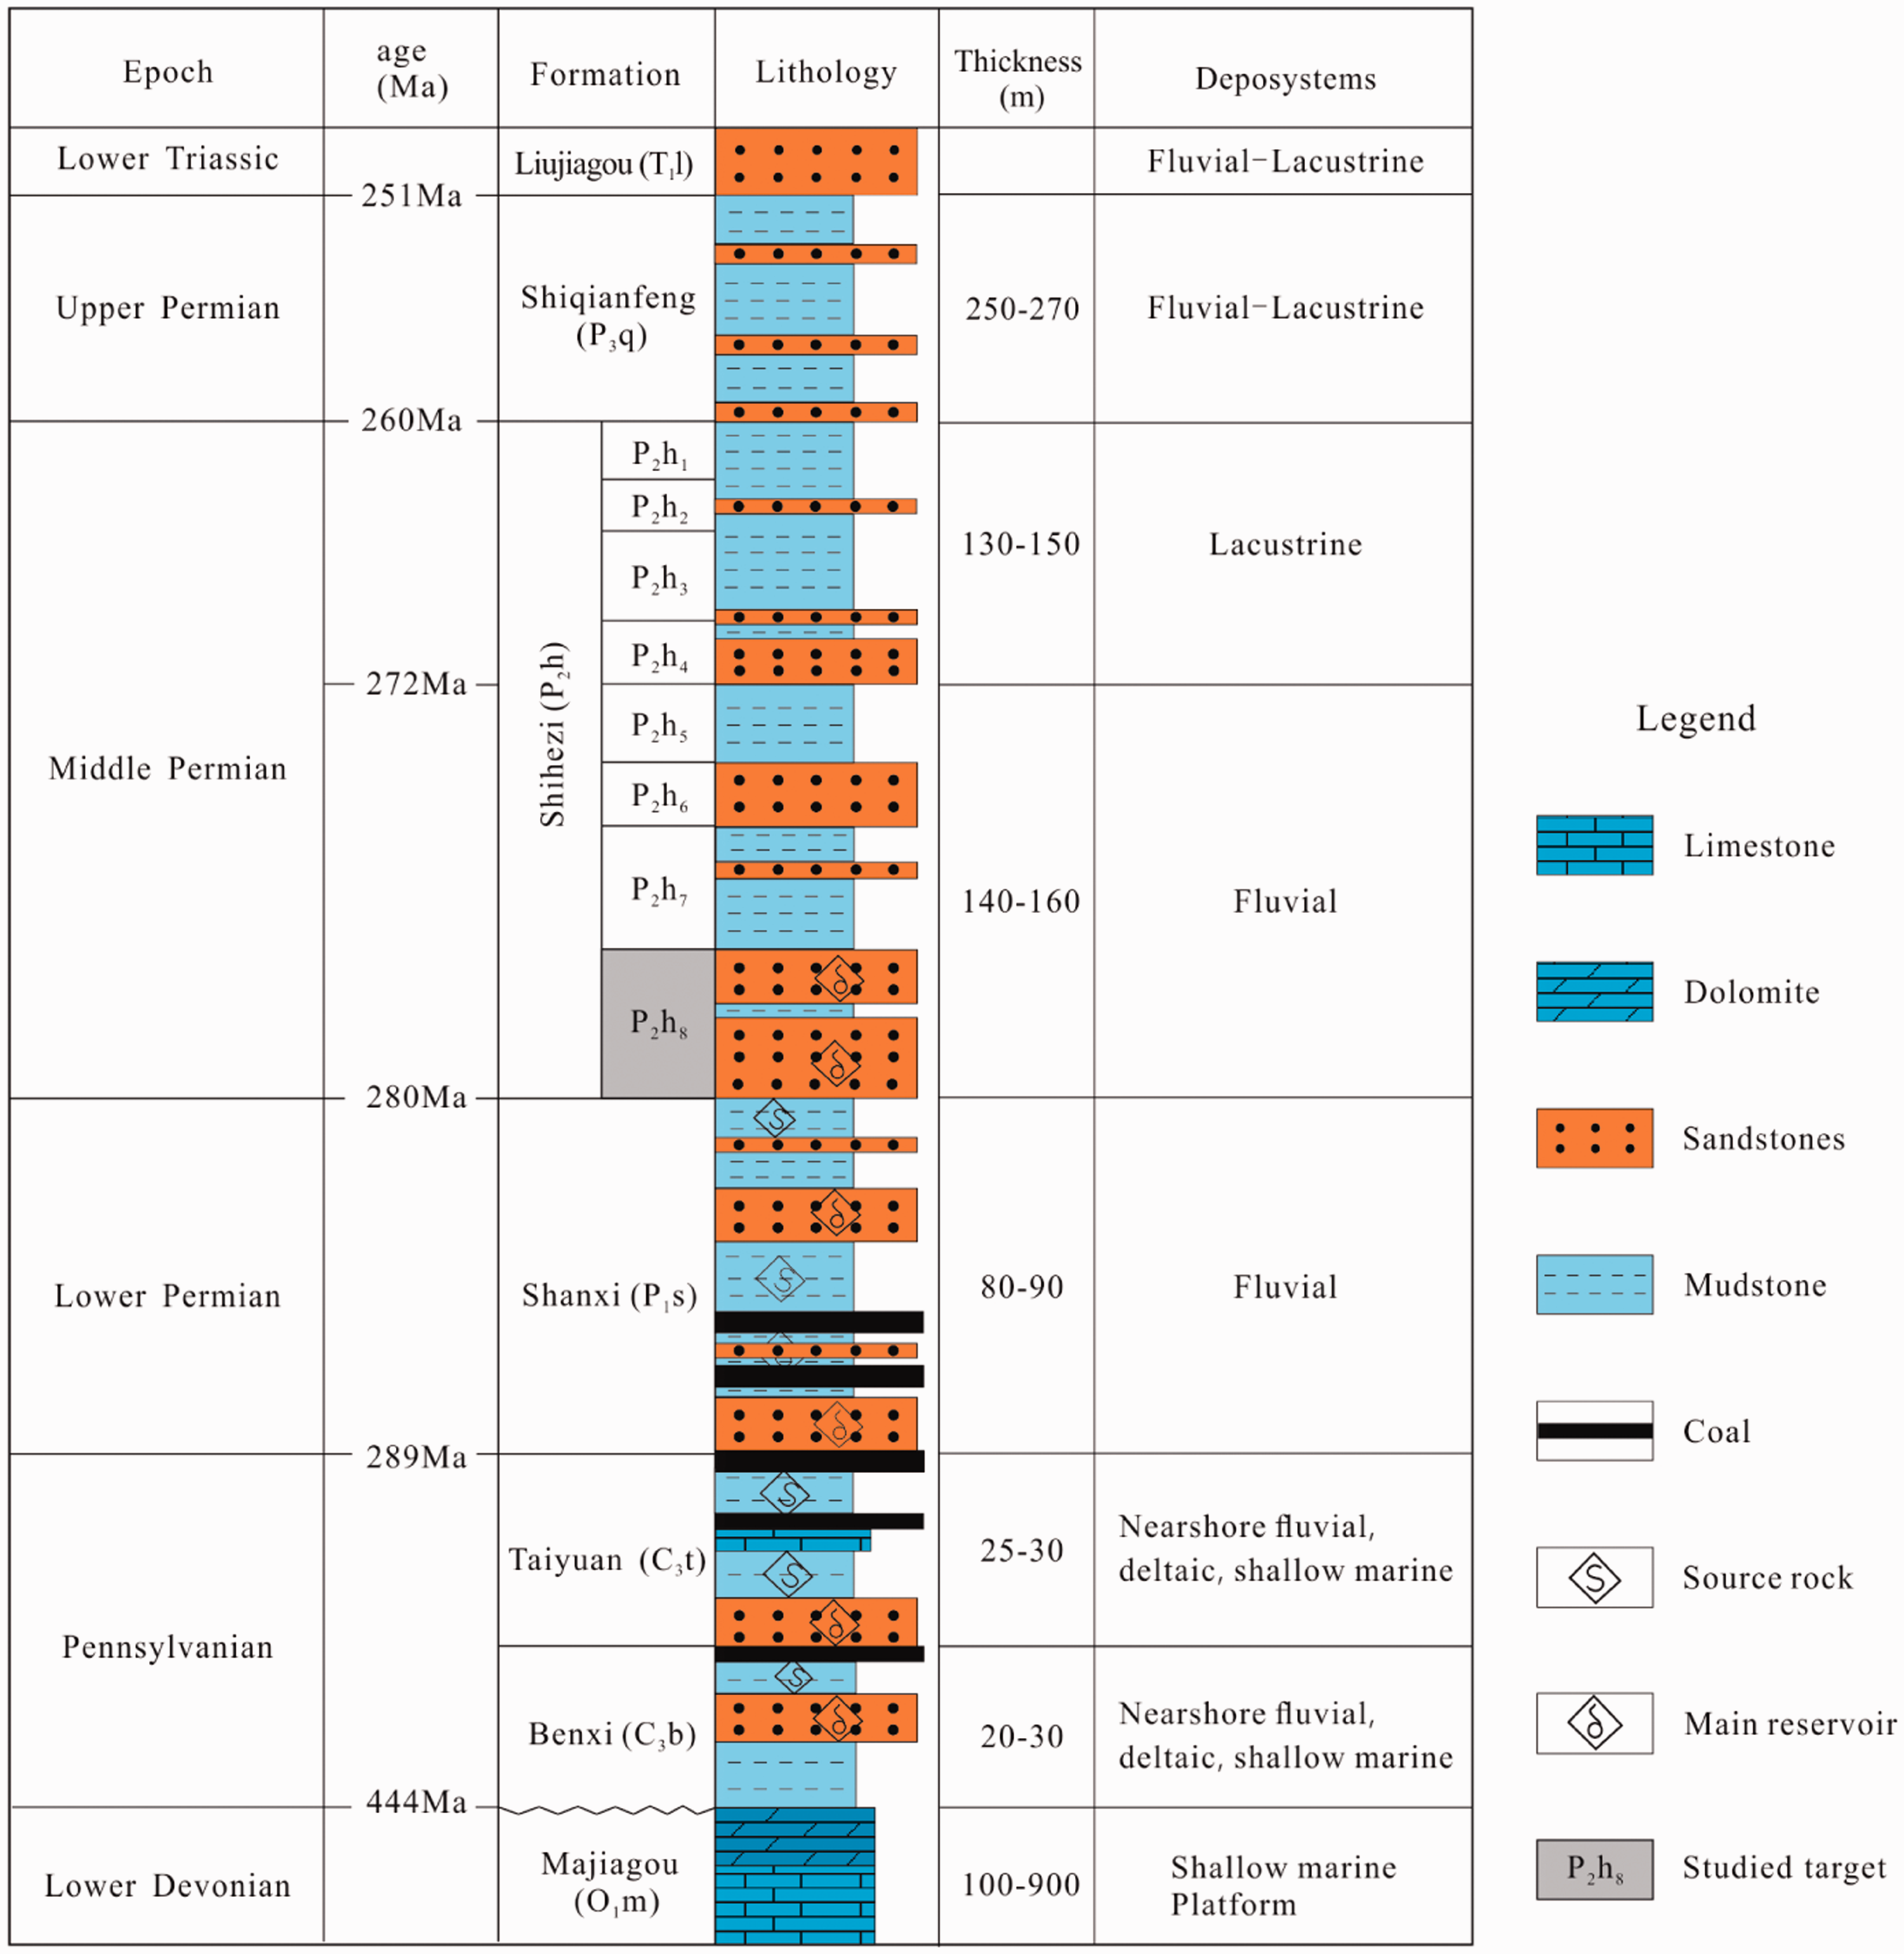
Schematic stratigraphy, source rock, and reservoir of the Upper Paleozoic in the Sulige area of Ordos Basin (modified from Hanson et al., 2007; Zhao et al., 2014).
Dataset and methods
Sample collection and preparation
Twenty core samples used for experiments were drilled from key wells in the Sulige area of Ordos Basin (Figure 1). All core samples are grayish medium-coarse grained quartz sandstones and were cut into standard core plugs with 2.54 cm (1 in) diameter and 5 cm length. Before experiments, each core plug had been cleaned and was dried under the vacuum at 110°C for 24 h. Firstly, the porosity and permeability of each core plug was measured. Then all core plugs were split into several sub-plugs for NMR, micro-CT, RMI, FE-SEM, and thin-sections experiments, which were used to properly characterize the pore structure (pore types, sizes, and sizes distribution) of tight sandstones. The RMI and FE-SEM experiments were conducted on each sample, and samples Slg-5, Slg-13, Slg-18, and Slg-19 were selected for NMR and micro-CT analyses to compare the results by RMI.
Experimental methods
Porosity and permeability analysis
The porosities and permeabilities of 20 samples were measured. These measurements were directly performed on core plugs, which were placed in the permeameter and injected with nitrogen as the measuring medium at confining pressures of 100 and 200 psi, following the People’s Republic of China Petroleum and Natural Gas Industry Standard (SY/T) 5336-1996. Additionally, porosities and permeabilities data of 825 P2h8 sandstone samples measured under the same experimental conditions were collected from the Research Institute of Petroleum Exploration & Development of Changqing Company, PetroChina.
Thin section analysis
Casting thin sections of selected samples, with red epoxy resin to highlight the pores, were conducted to analyze types and contents of pores. For the thin section porosity, more than 300 points were conducted on each thin section in order to ensure a standard deviation of 5% or less (Stanton and Wilson, 1994; Zhou et al., 2016).
NMR analysis
In order to carry out comparative analysis, samples Slg-5, Slg-13, Slg-18, and Slg-19, which were cut from the core plugs and cut to 1 cm in length and 2.5 cm in diameter, were taken for NMR analysis. NMR measurements were conducted using a RecCore-04 analyzer with a centrifugal apparatus (PC-1) (Manufacturer, Chinese Academy of Sciences, Langfang, China). NMR T2 distribution spectrum can well disclose the pore distribution characteristics and can be converted into the PSD (Li et al., 2015; Yao et al., 2010). Meanwhile, T2 distributions at saturated water and irreducible water (i.e. centrifuge capillary-pressure of 2.85 MPa) conditions were utilized to obtain the movable fluid saturation (Smf) and irreducible fluid saturation (Sif), which were used to analyze the effective PSD in tight gas reservoirs.
Micro-CT and RMI measurements
As with the NMR experiment, micro-CT scans is a nondestructive technique. Therefore, following the NMR experiments, samples Slg-5, Slg-13, Slg-18, and Slg-19 were immediately dried for micro-CT measurements, which were conducted using a μCT system phoenix nanotom m (Manufacturer, GE Sensing & Inspection Technologies GmbH, Wunstorf, Germany). Through three-dimensional (3D) reconstruction technology, much more information about pore structure characteristics can be obtained (Fu et al., 2015; Shearing et al., 2011).
After the CT scans, the each selected sample was taken for RMI experiment at a temperature of 23°C and a quasi-static constant speed of 0.00001 ml/min, which was conducted using an APSE-730 instrument manufactured by the American Coretest Systems, Inc. The pore quantity and throat quantity can be obtained by identifying the pressure fluctuation change during the intrusion process (Figure 3), i.e. the throat is distinguished from increasing intrusion pressure and the pore can be identified according to the sudden decreases of intrusion pressure (Yuan and Swanson, 1989; Yuan, 1990). The throat radius was computed by the Washburn equation and the pore radius was calculated as a radius of equivalent spheres (Washburn, 1921; Yuan, 1990; Zhao et al., 2015). Because the maximum intrusion pressure applied is 900 psi, RMI can characterize the pore–throats with radii above 0.1 μm.
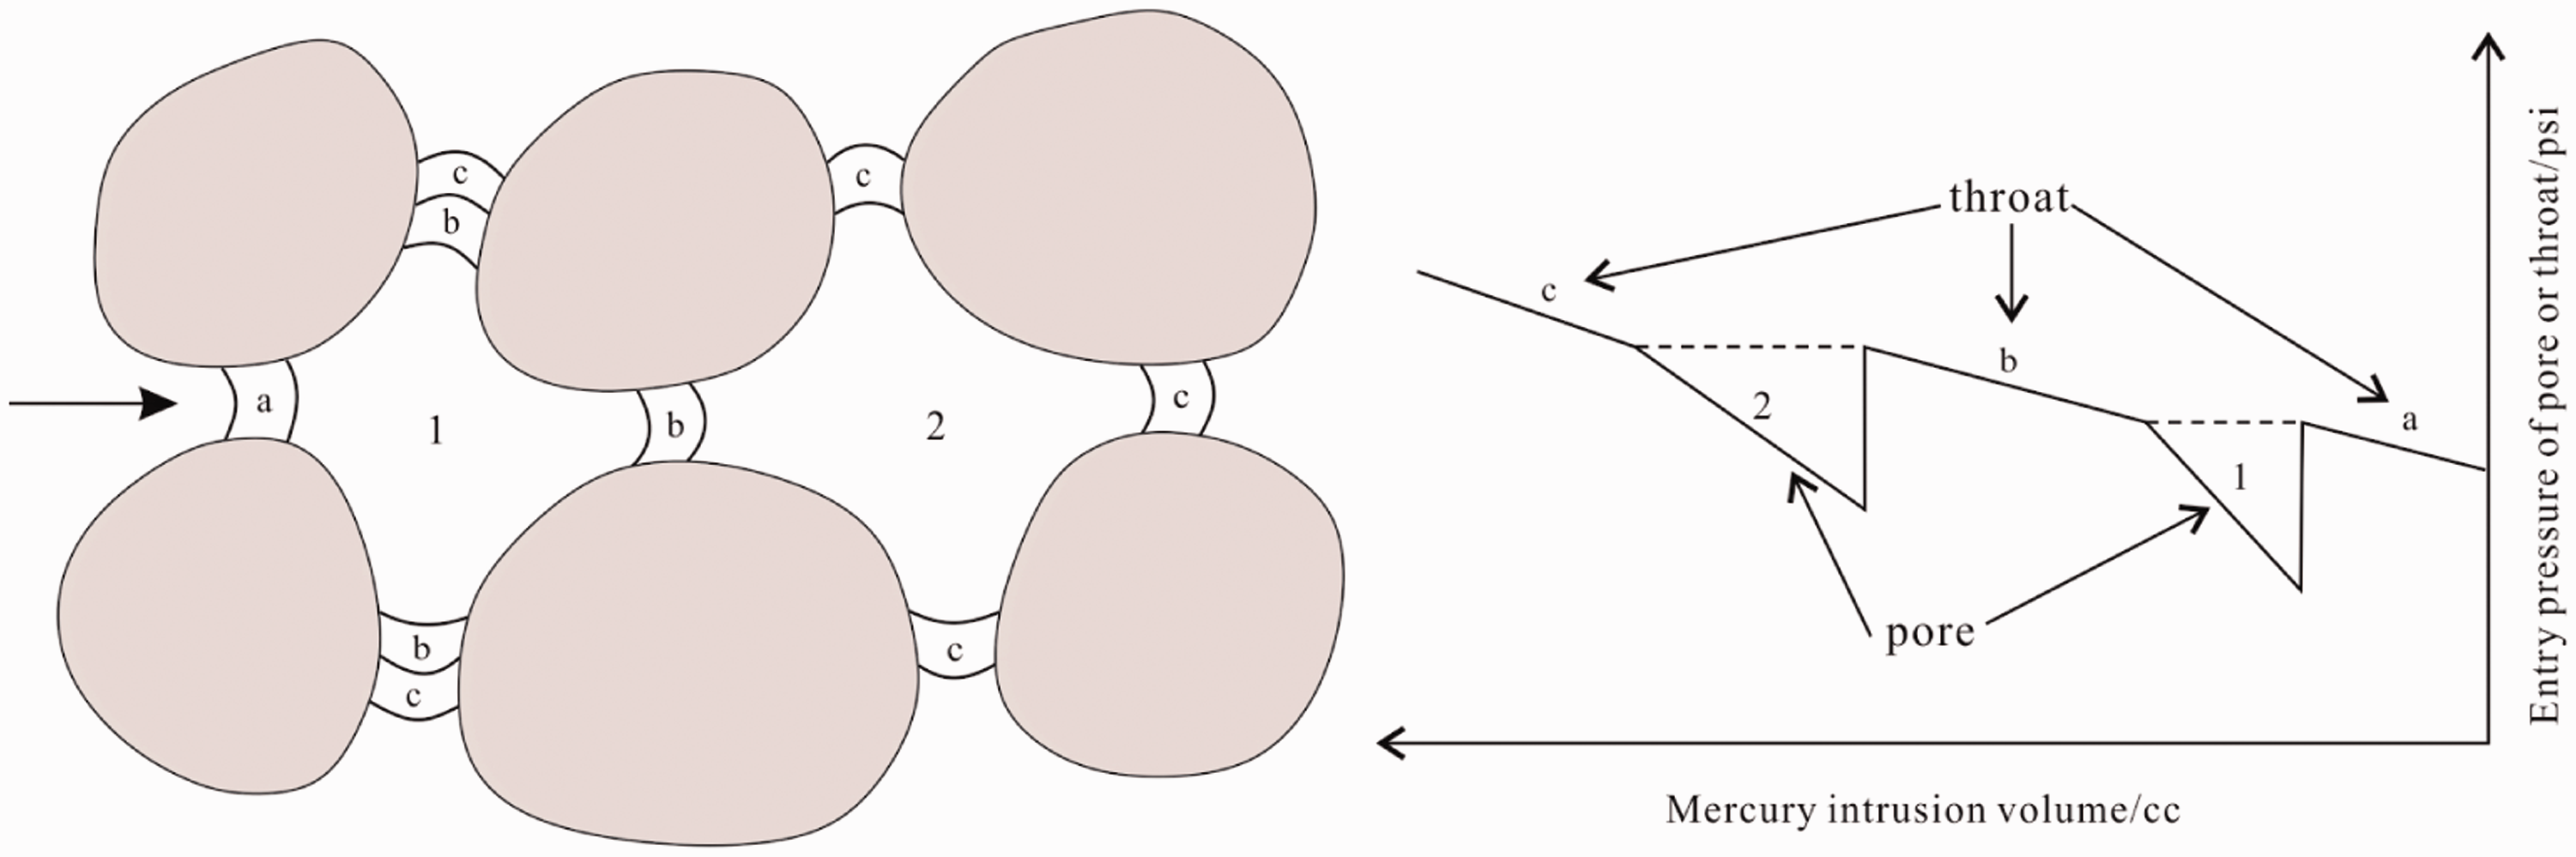
Schematic diagrams of rock micro-structure and capillary-pressure fluctuations (modified from Yuan, 1990).
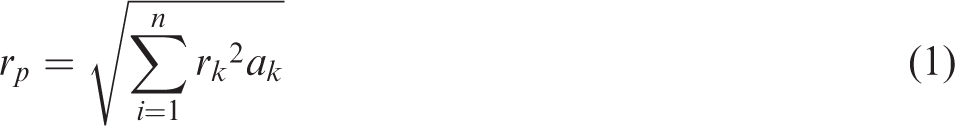
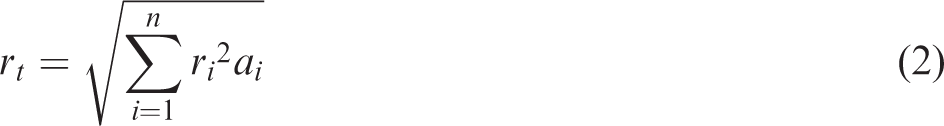
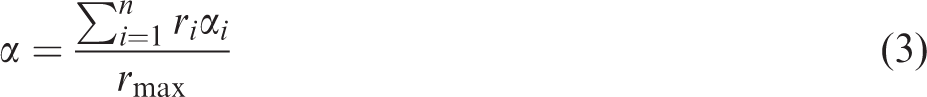
More pore structure parameters can be disclosed by RMI, including average pore radius (rp), average throat radius (rt), mainstream throat radius (rm), and heterogeneous coefficient (α). Among them, rm is determined as a throat radius that corresponds to the 80th percentile of the cumulative permeability contribution curve (Yao and Liu, 2012), and rp, rt, and α can be computed using the following equations in order
FE-SEM analysis
FE-SEM analysis with 0.1 nm to micron grade ultra-high resolution was conducted using the Quanta 200FEG. Each sample, cut into 2 mm in diameter and 1 mm in thickness with 10 nm carbon film, was evaluated at a humidity level of 35% and a temperature of 24°C (Wang et al., 2015b). FE-SEM micrographs can realistically provide important information on the space morphology, size, and pores connectivity. Because FE-SEM failed to provide quantitative data (Loucks et al., 2009), point counts were used to determine the PSD of tight gas sandstone.
Fractal methodology
There have been many models proposed to calculate fractal dimension using capillary-pressure curves. However, the fractal model, which was proposed by Angulo et al. (1992), is commonly considered to be the most effective and widely used method for characterizing the pore structure of porous materials (Broseta et al., 2001; Lai and Wang, 2015; Li, 2010; Li and Horne, 2006), and the equation can be expressed as follows

Arranging equation (4)

The RMI technique can obtain the capillary-pressure curves of total (pore and throat as a whole, hereinafter called “pore–throat” for short), pore, and throat, respectively. Their mercury saturation (SHg) and capillary pressure (Pc) can be derived from the corresponding capillary curve. Then, fractal dimensions can be obtained as the following equation: D = 2+λ.
Results
Porosity and permeability
As a whole, the reservoir properties in the P2h8 member are quite poor (Figure 4). Under laboratory pressure conditions, the core porosity ranged from 0.19% to 22.98% with an average of 8.29% (Figure 4(a)), and permeability varied from 0.001 mD to 49.768 mD with an average of 0.923 mD (Figure 4(b)). Hence, the P2h8 sandstones pertain to the typical tight gas reservoirs with extremely low porosity and permeability. Moreover, the porosity and permeability of P2h8 reservoirs also showed a weak correlation (Figure 4(c)).
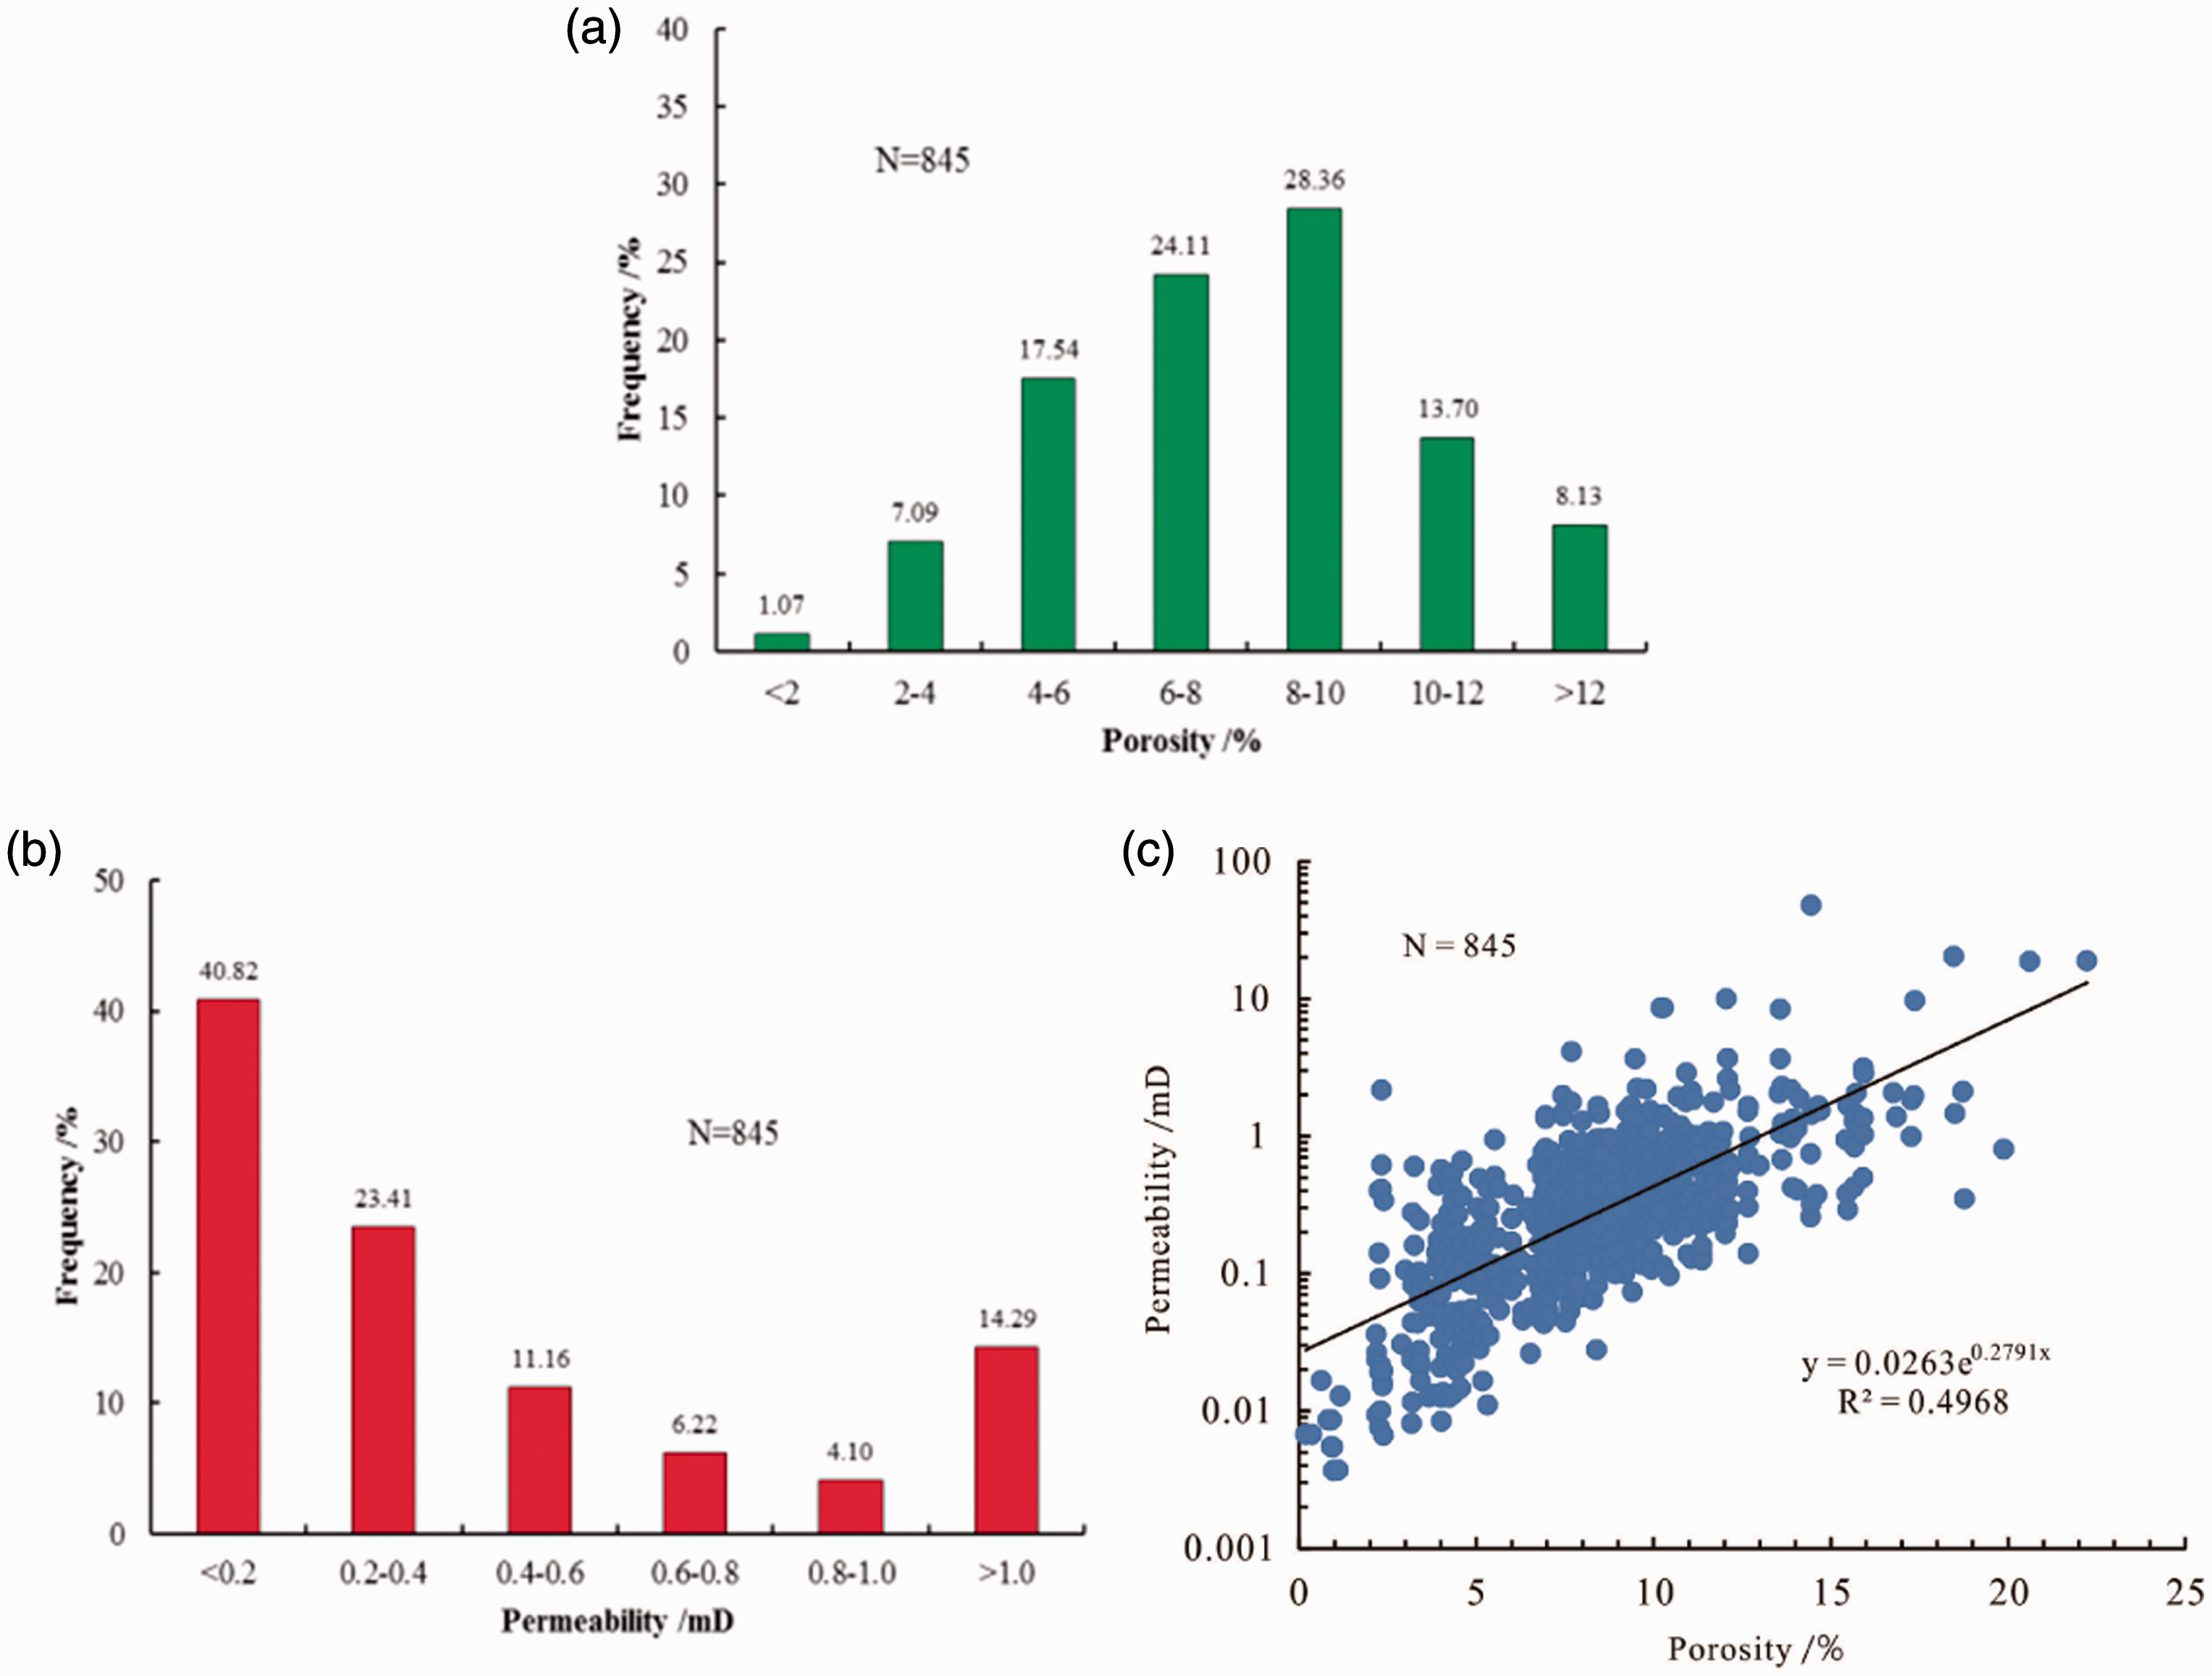
The reservoir property characteristics of P2h8 sandstones: (a) porosity distribution; (b) permeability distribution; and (c) the relationship between porosity and permeability.
Thin-section porosities of the studied samples were presented in Table 1. As shown in Table 1 and Figure 5(a), the measured core plug porosity has a positive correlation with the thin-section porosity, which was dominated by the secondary dissolution pores. It should be noted that micropores are difficult to be identified under the petrographic microscope, which caused the thin-section porosities samples were lower than core plug porosities. In addition, it is also evident from Figure 5(b) that the thin-section porosity appeared to be positively correlated with the measured plug permeability, i.e. as the measured plug permeability increased, the thin section porosity increased, which is consistent with the conclusion of Figure 4(c).
Detailed characteristic parameters of the selected tight sandstone samples.
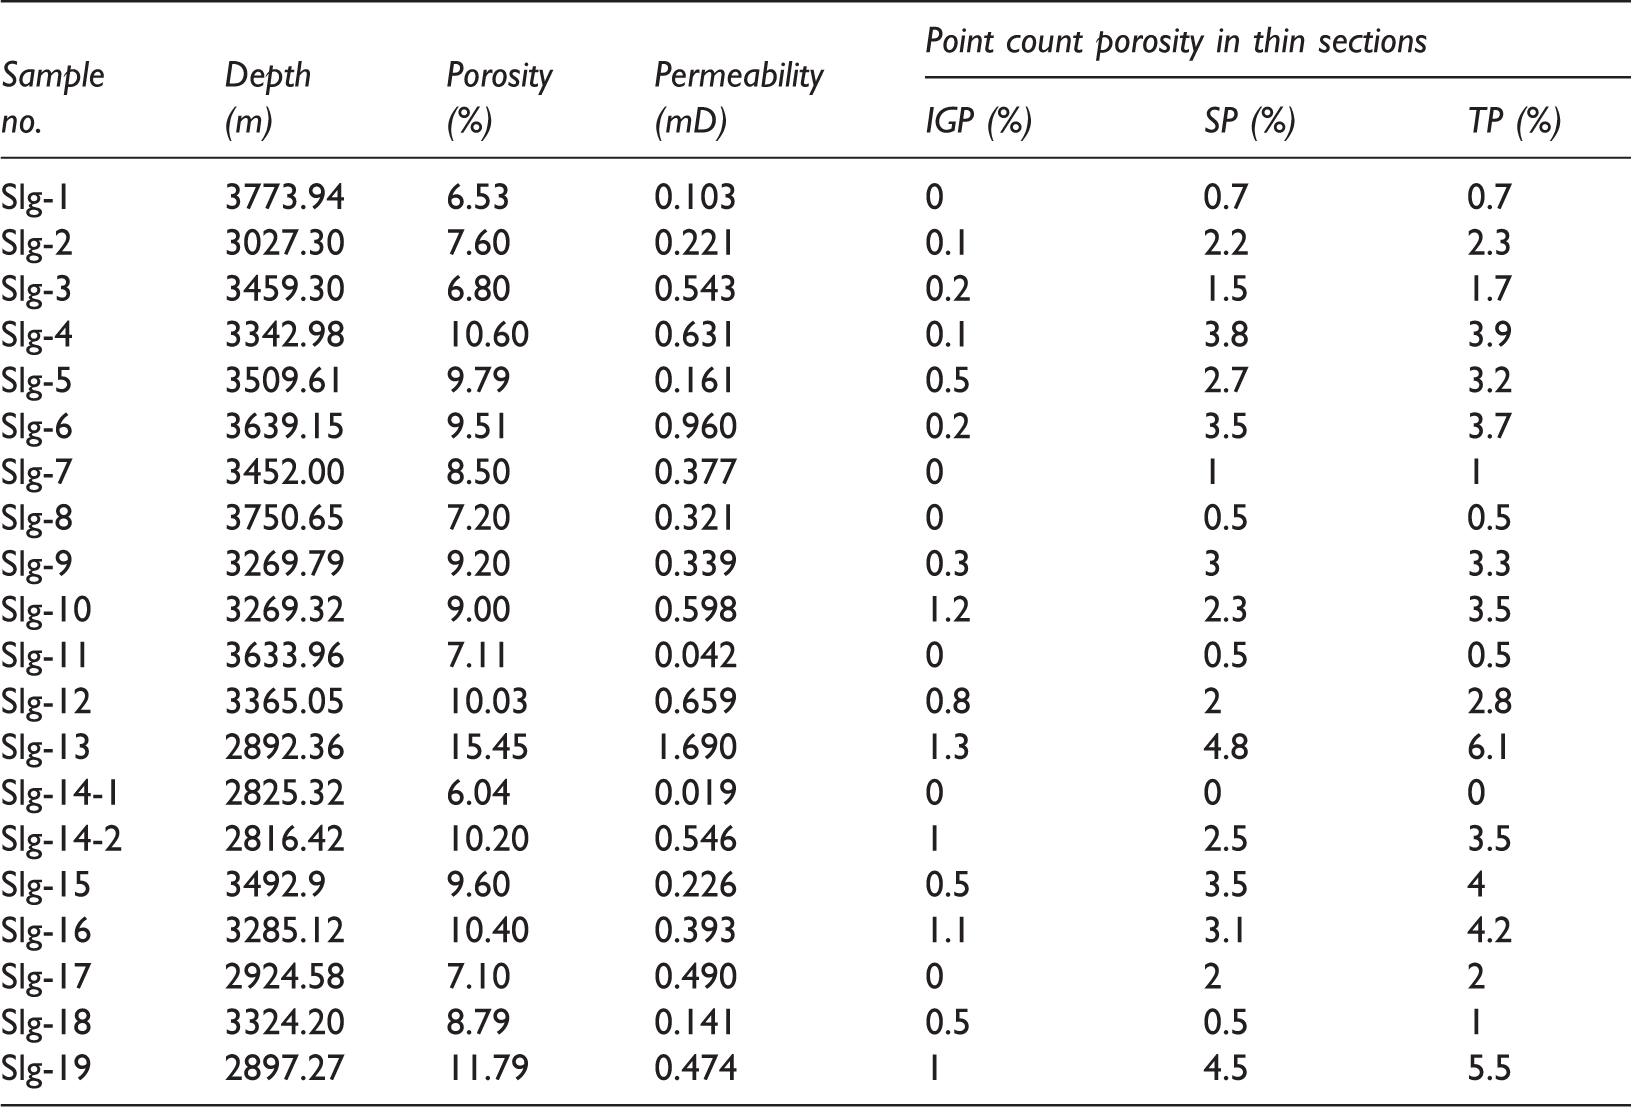
Note: IGP, SP, and TP represent intergranular porosity, secondary porosity, and total porosity, respectively.
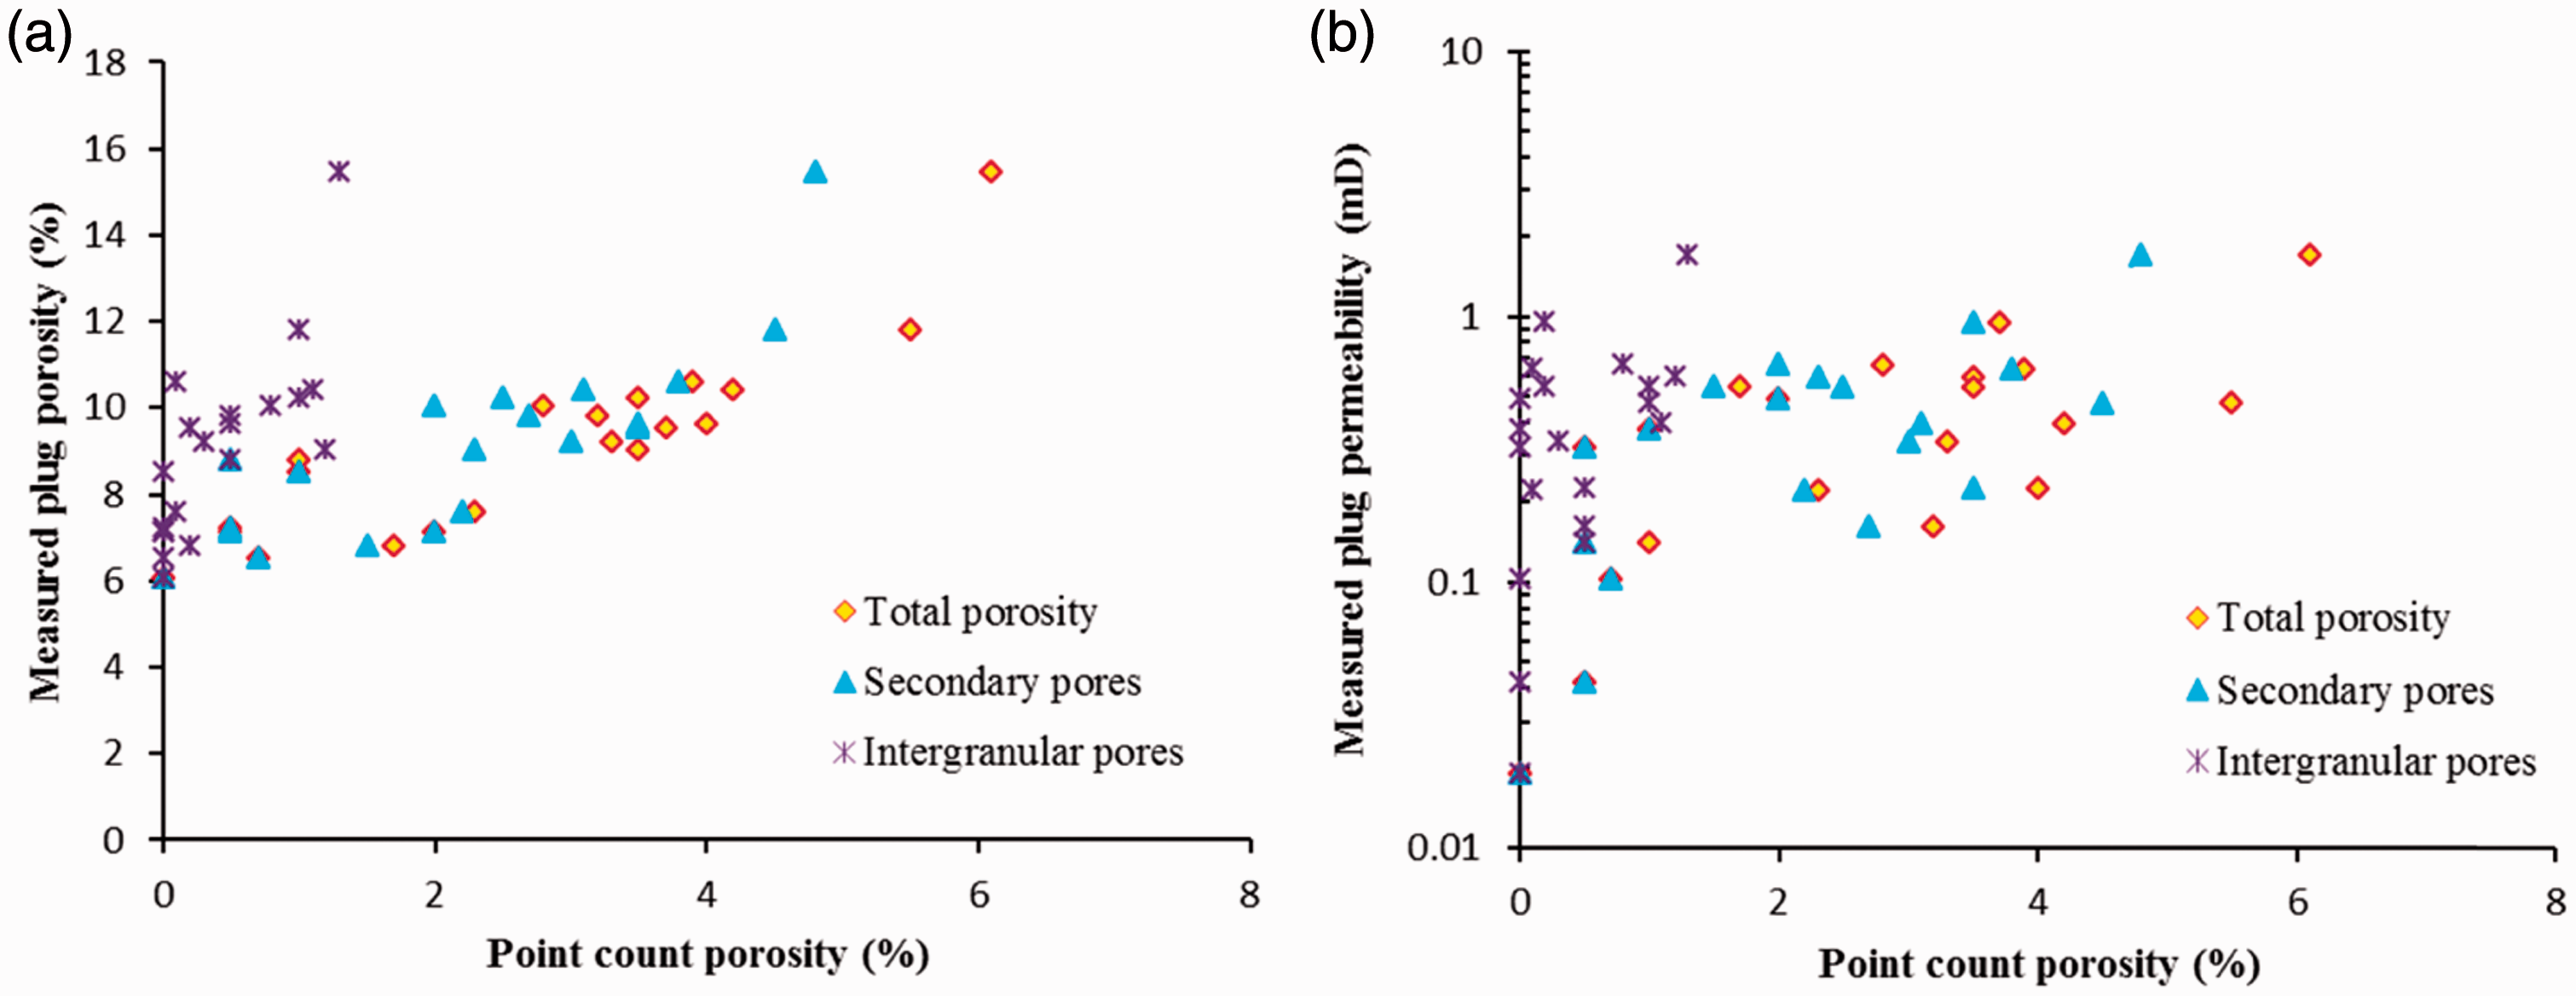
(a) Relationship between the thin-section porosity and the measured plug porosity. (b) Relationship between the thin section porosity and the measured plug permeability.
Pore types
Thin section, SEM, and FE-SEM revealed the presence of three types of pores in the tight sandstone reservoirs, namely, residual intergranular pores, secondary pores, and micropores, all of which contributed to the porosity. Residual intergranular pores have been remained after diagenesis process (compaction and cementation) where cement (e.g. quartz overgrowth) incompletely filled the pores between grains (Figure 6(a) and (b)) or where fibrous illite coated on the intergranular pore walls (Figure 6(c)). Residual intergranular pores are typically triangular or polygonal in shape and their sizes were generally more than 50 μm. Secondary pores were mainly correlated with feldspars dissolution, which have enlarged the intergranular pores or formed new intragranular pores (Figure 6(d) to (f)). Secondary pores are typically irregular with pore sizes ranging from 2.2 to 400 μm in radius. The development of micropores was mainly correlated with diagenetic clay minerals, including pseudo-hexagonal plate kaolinite (Figure 6(g)), fibrous illite (Figure 6(h)), etc. The pore sizes associated with clay minerals were between 0.1 and 10 μm. Overall, the tight gas reservoirs showed a multiscale PSD ranging from several nanometers to hundreds of microns.
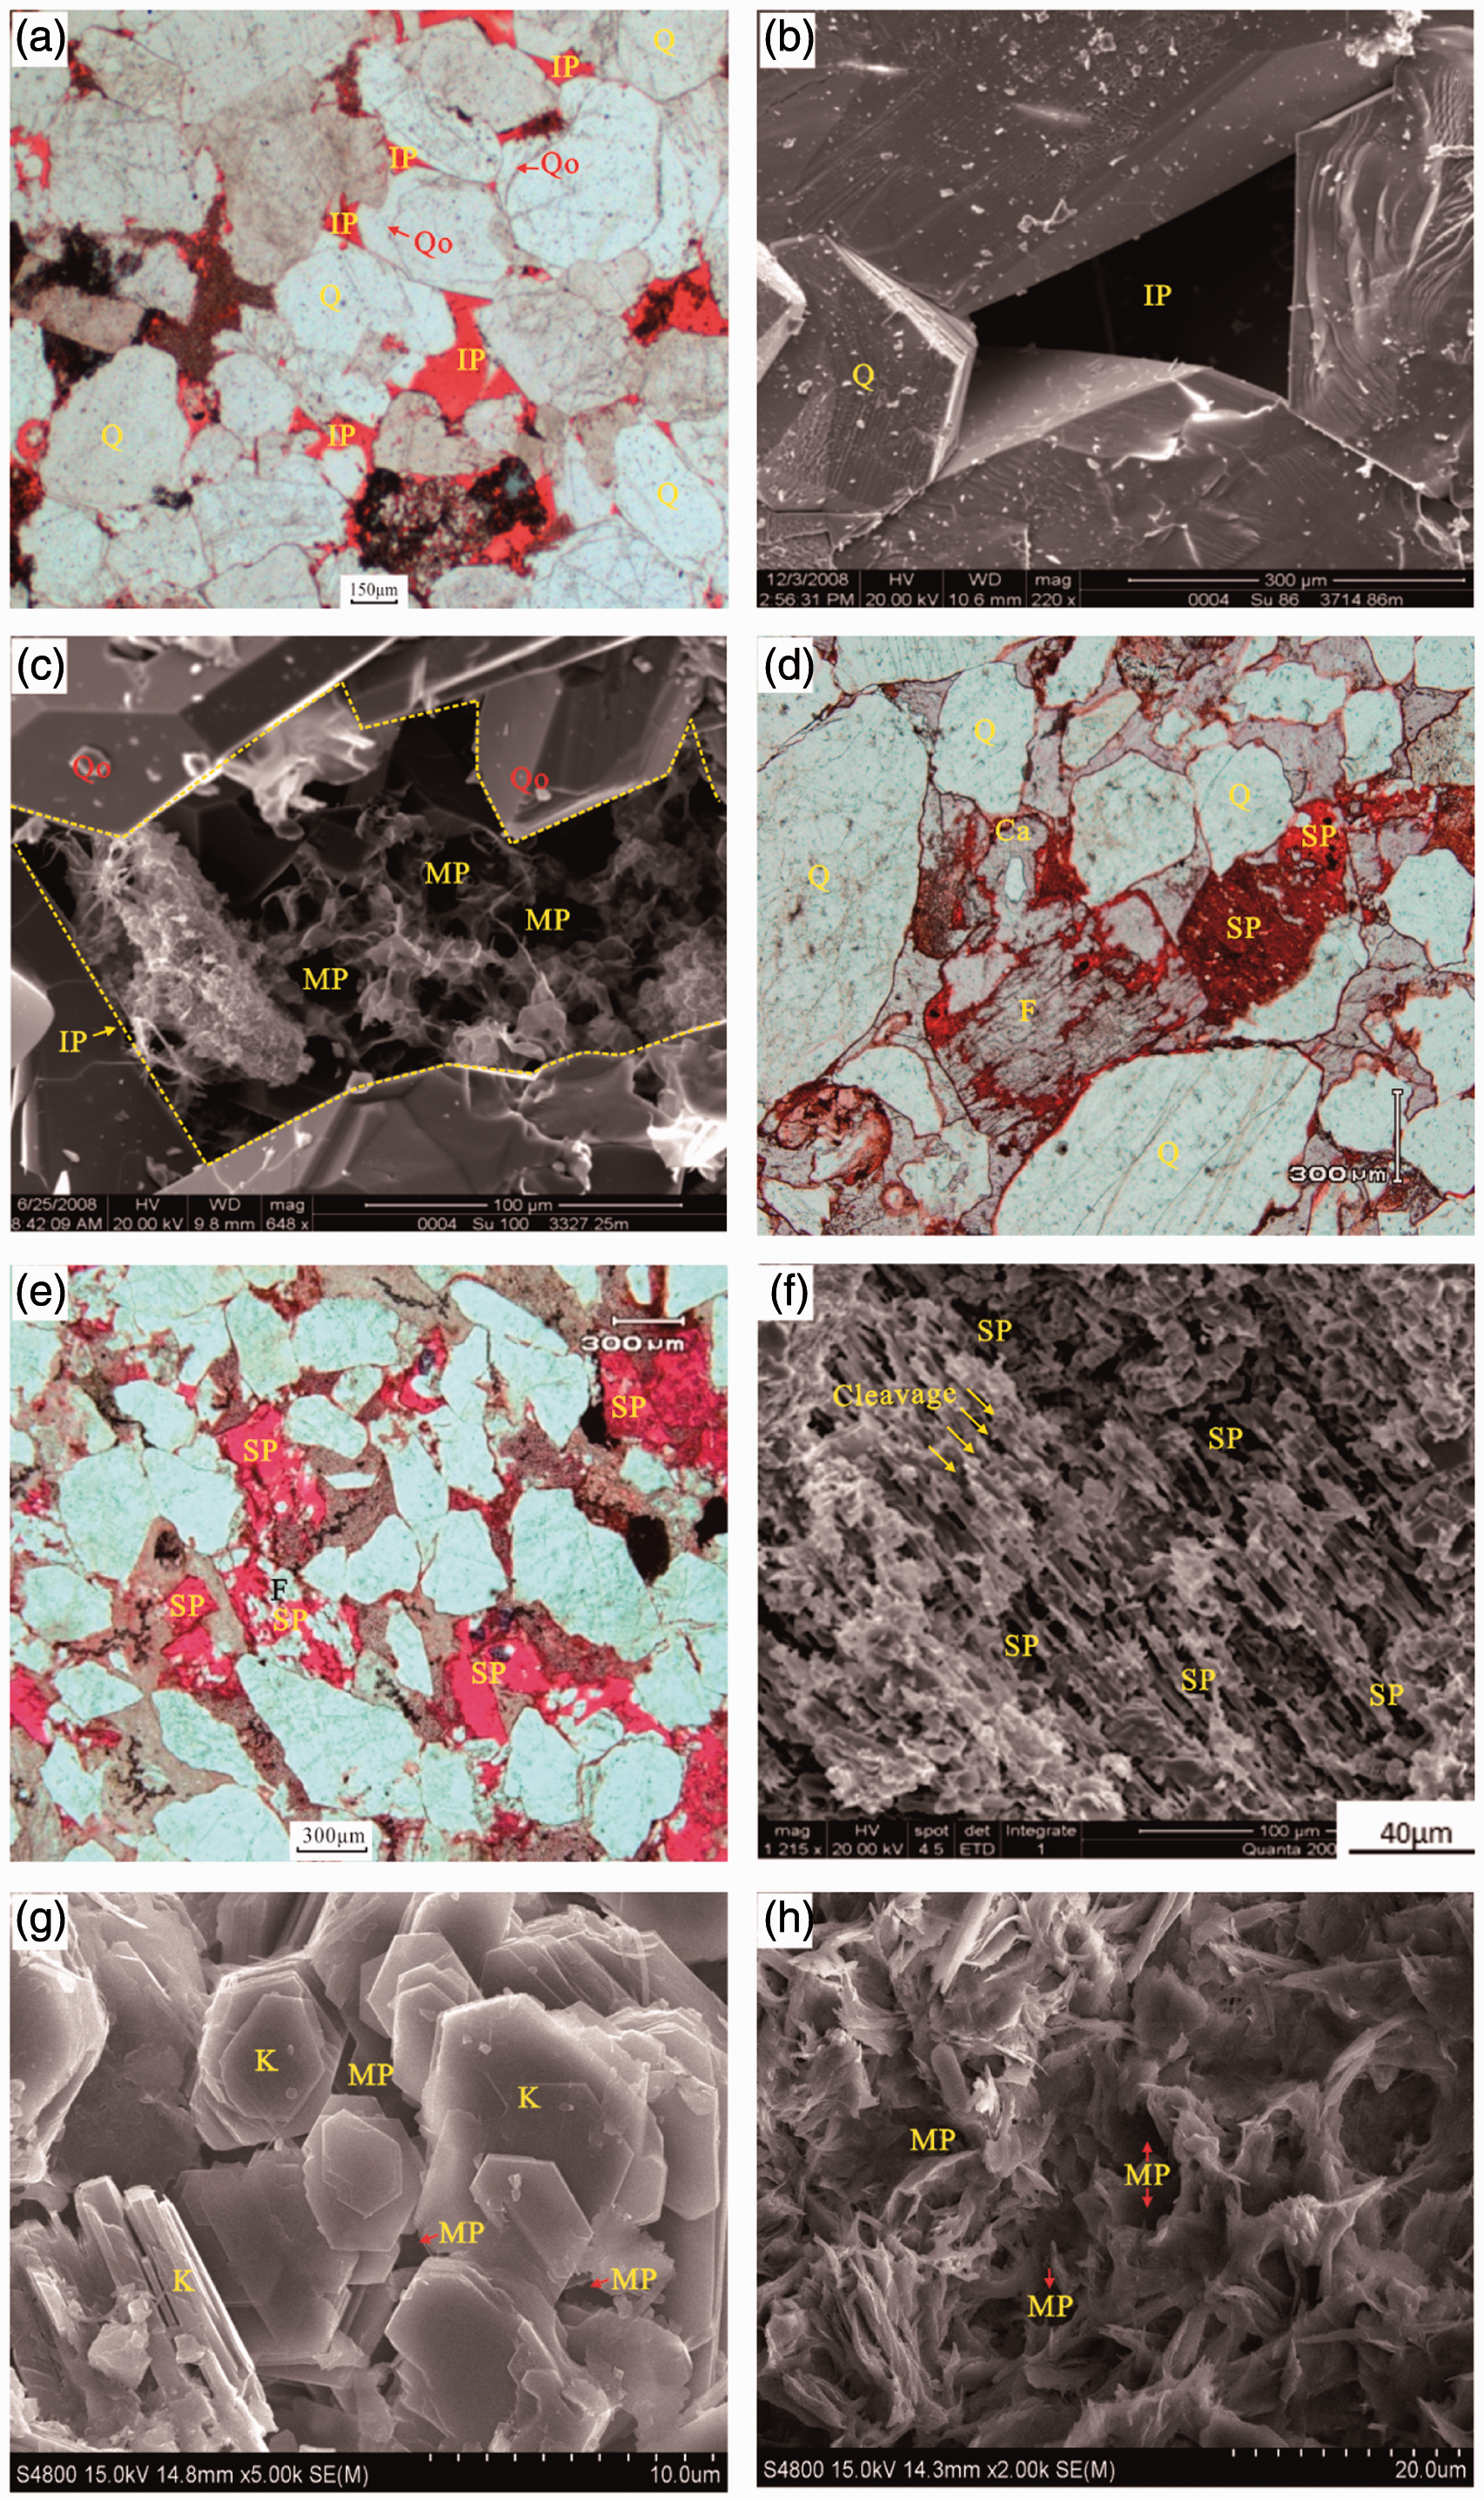
Photomicrographs displaying pore types in the P2h8 sandstones. (a) The most grains are quartz, and quartz overgrowth are found in some quartz grains; red epoxy resin represents residual intergranular pores. Sample Slg-10, 3269.32 m, PPL. (b) SEM image showing the residual intergranular pore with typically triangular. Sample Slg-10, 3269.32 m. (c) SEM image showing the micropores between fibrous illite, which occurred in the residual intergranular pore (yellow dotted line). Sample Slg-13, 2892.36 m. (d) Feldspar dissolution pores. Sample Slg-4, 3342.98 m, PPL. (e) Dissolution pores. Sample Slg-14-2, 2816.42 m, PPL. (f) SEM image of feldspar dissolution pores along cleavage planes. Sample Slg-14-2, 2816.42 m. (g) FE-SEM image of the micropores from pseudo-hexagonal plate kaolinite aggregates. Sample Slg-5, 3509.61 m. (h) FE-SEM image showing the micropores between fibrous illites. Sample Slg-18, 3324.20 m. Q: quartz; Qo: quartz overgrowth; F: feldspar; Ca: calcite; K: kaolinite; IP: intergranular pore; MP: micropore; SP: secondary dissolution pore; PPL: plane polarized light.
Pore–throat size distribution
PSD from RMI
Nine typical samples are shown in Figure 7, which were created by normalizing the number of pores and throats, and other detailed characteristic parameters are tabulated in Table 2. Samples with different permeability showed a similar pore size distribution and carried an important pore sizes distribution with the pore radii of 70–200 μm (Figure 7(a)). The throat size distribution (TSD) was ranging from 0.1 to 10 μm with the majority between 0.3 and 1.5 μm and the TSD differences amongst the samples were clearly displayed in Figure 7(b): as the permeability increased, the throat peak radius moved to the right and increased. What is more, the pore to throat ratio distributions of tight sandstone samples showed a broad realm, ranging between 10 and 1000 (Figure 7(c)). It also indicated that the investigated tight gas reservoirs were characterized by huge heterogeneity. According to the size classification scheme of low permeability reservoirs by Li (2003), the pores of tight gas reservoirs comprise macropores (radius > 100 μm) and mesopores (50–100 μm); throats is composed of micro-throats (0.025–0.5 μm), micro-fine throats (0.5–1.0 μm), fine throats (1.0–2.0 μm), meso-throats (2.0–4.0 μm), and coarse throats (r > 4.0 μm). While the maximum intrusion pressure of RMI is 900 psi, the pore–throats radius <0.12 μm failed to be characterized.
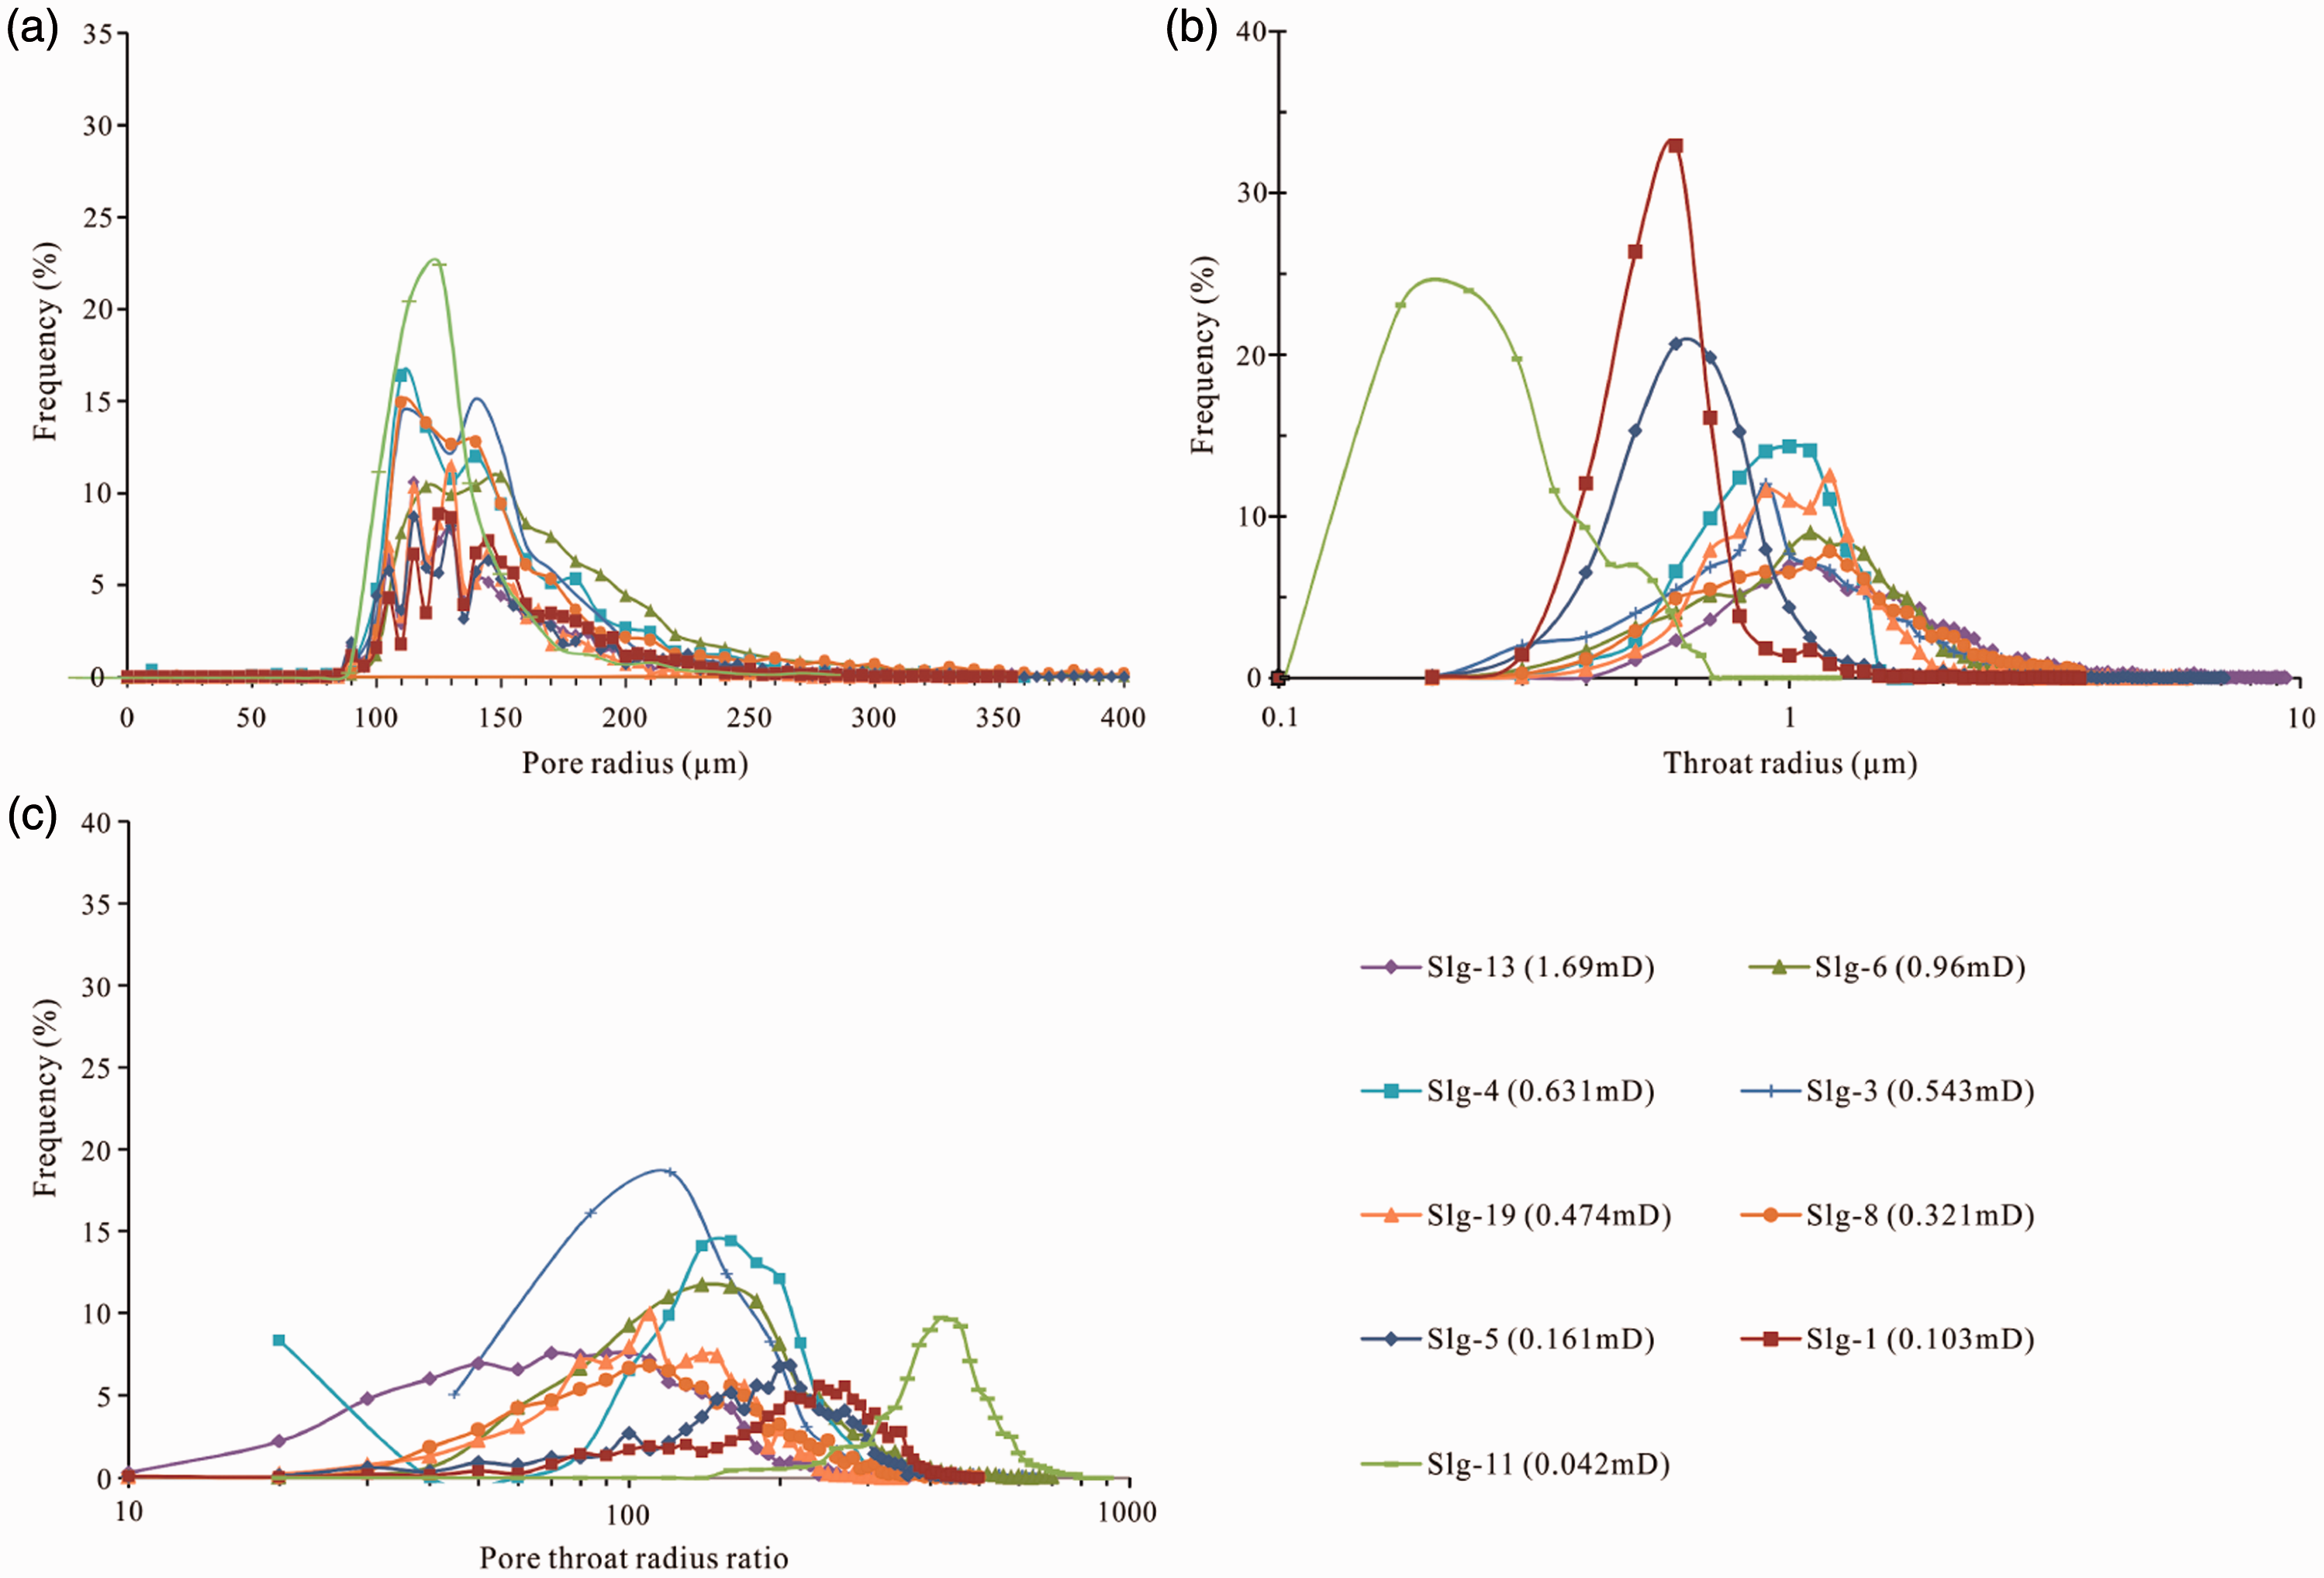
Characteristic parameters distribution of RMI. (a) pore, (b) throat, and (c) pore to throat ratio.
Pore structure parameters of the studied tight sandstone samples.
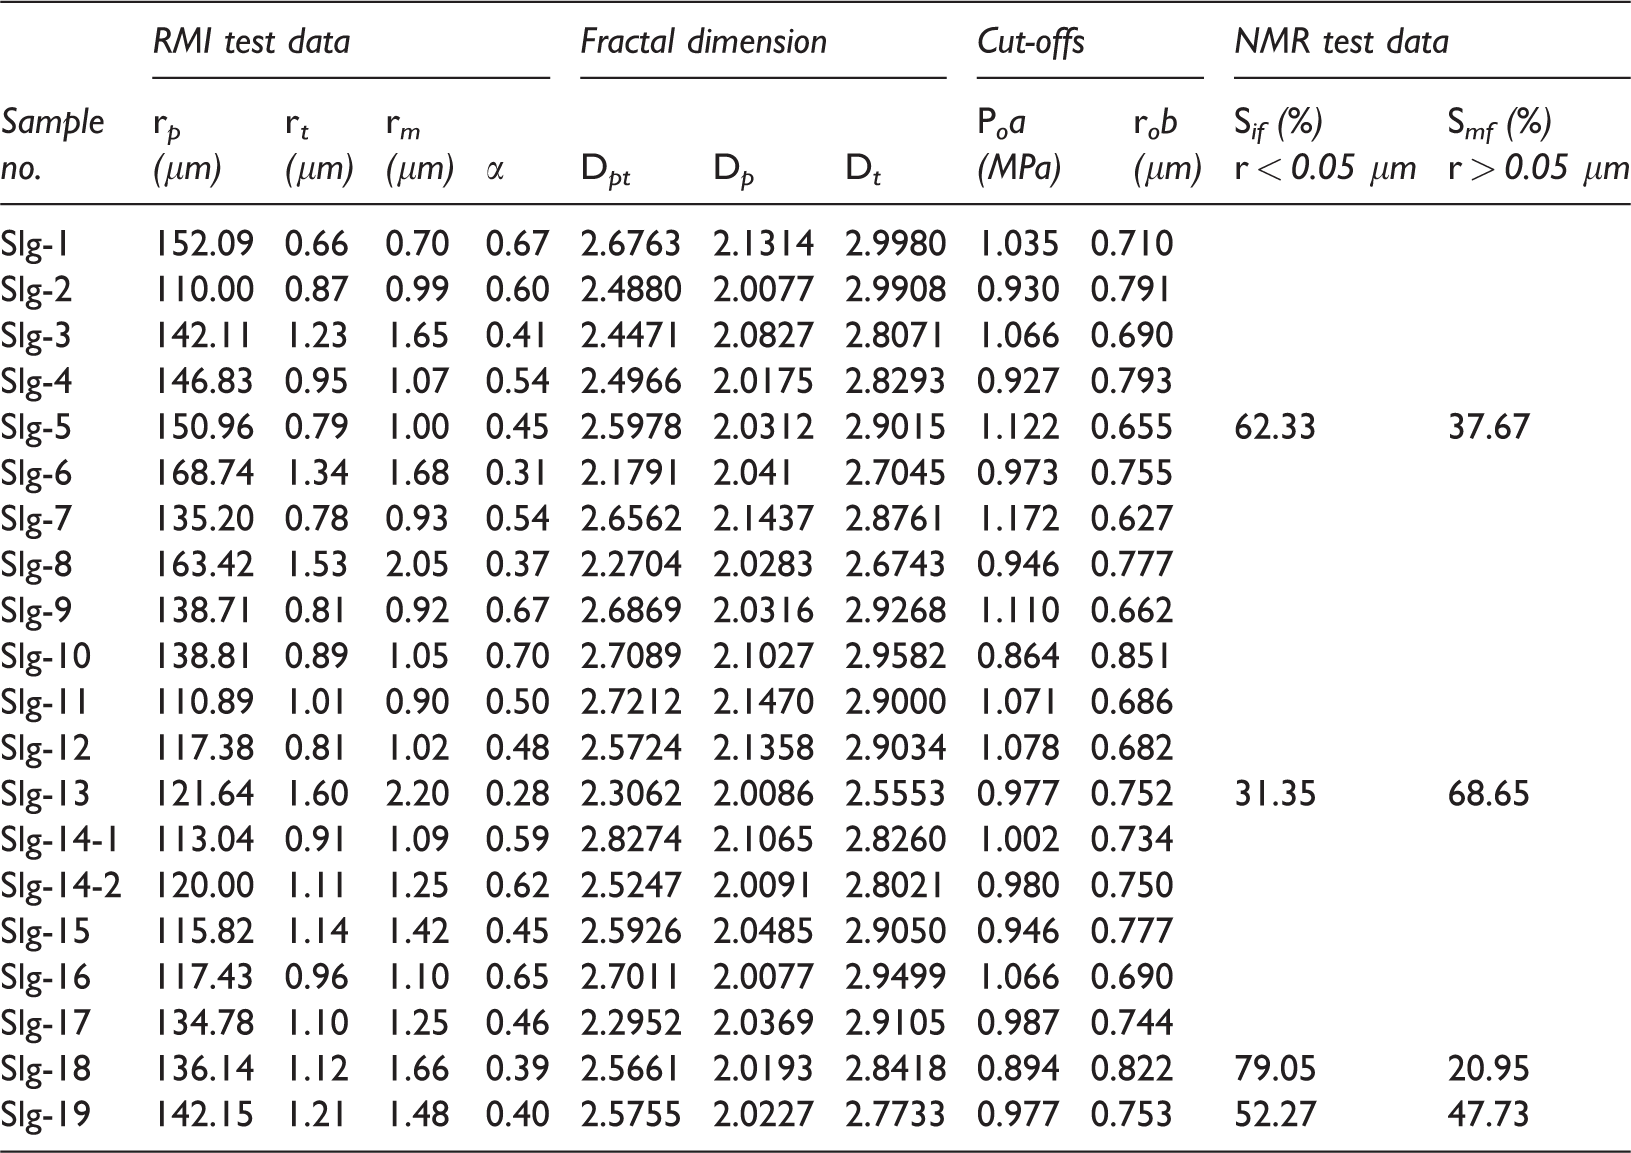
rp, rt, rm, and α represent average pore radius, average throat radius, mainsream throat radius, and heterogeneous coefficient, respectively. NMR: nuclear magnetic resonance; RMI: rate-controlled mercury injection.
aPo is the pressure corresponding to the fractal inflection point.
bro is the throat radius at capillary pressure Po.
PSD from NMR
As defined by Ren et al. (2015), nanopores have widths < 0.1 μm, submicron pores have widths from 0.1 to 1 μm, and micron pores have widths > 1 μm. NMR T2 spectra of four samples (i.e. Slg-5, Slg-13, Slg-18, and Slg-19) have similar bimodal behavior (P1 and P2) (Figure 8). Based on the previous studies (Li et al., 2015; Yao et al., 2010), NMR T2 spectra of these samples were converted into the PSDs. As shown in Figure 8, a wide PSD occurred in the tight sandstone samples with size ranging from nanoscale to macroscale. The irreducible water in tight gas reservoirs mainly existed in pores connected by the nanoscale throats (radius < 0.05 μm) (read on the red part in Figure 8). Overall, irreducible water saturation (Sif) decreased with increasing permeability of samples, and the fluid in the pores (read on the P2 part) was almost drained out. The average Sif and Smf of tight sandstone samples were 56.25% and 43.75%, respectively. The Smf was dominated by submicron–micron throats with radius of greater than 0.05 μm and pores interconnected by these throats, which were very significant to the fluid flow in the reservoirs. However, the nanoscale pore–throats with radius of less than 0.05 μm dominated the adsorption pores, which were not conducive for the movability of the fluid (Yao et al., 2010).
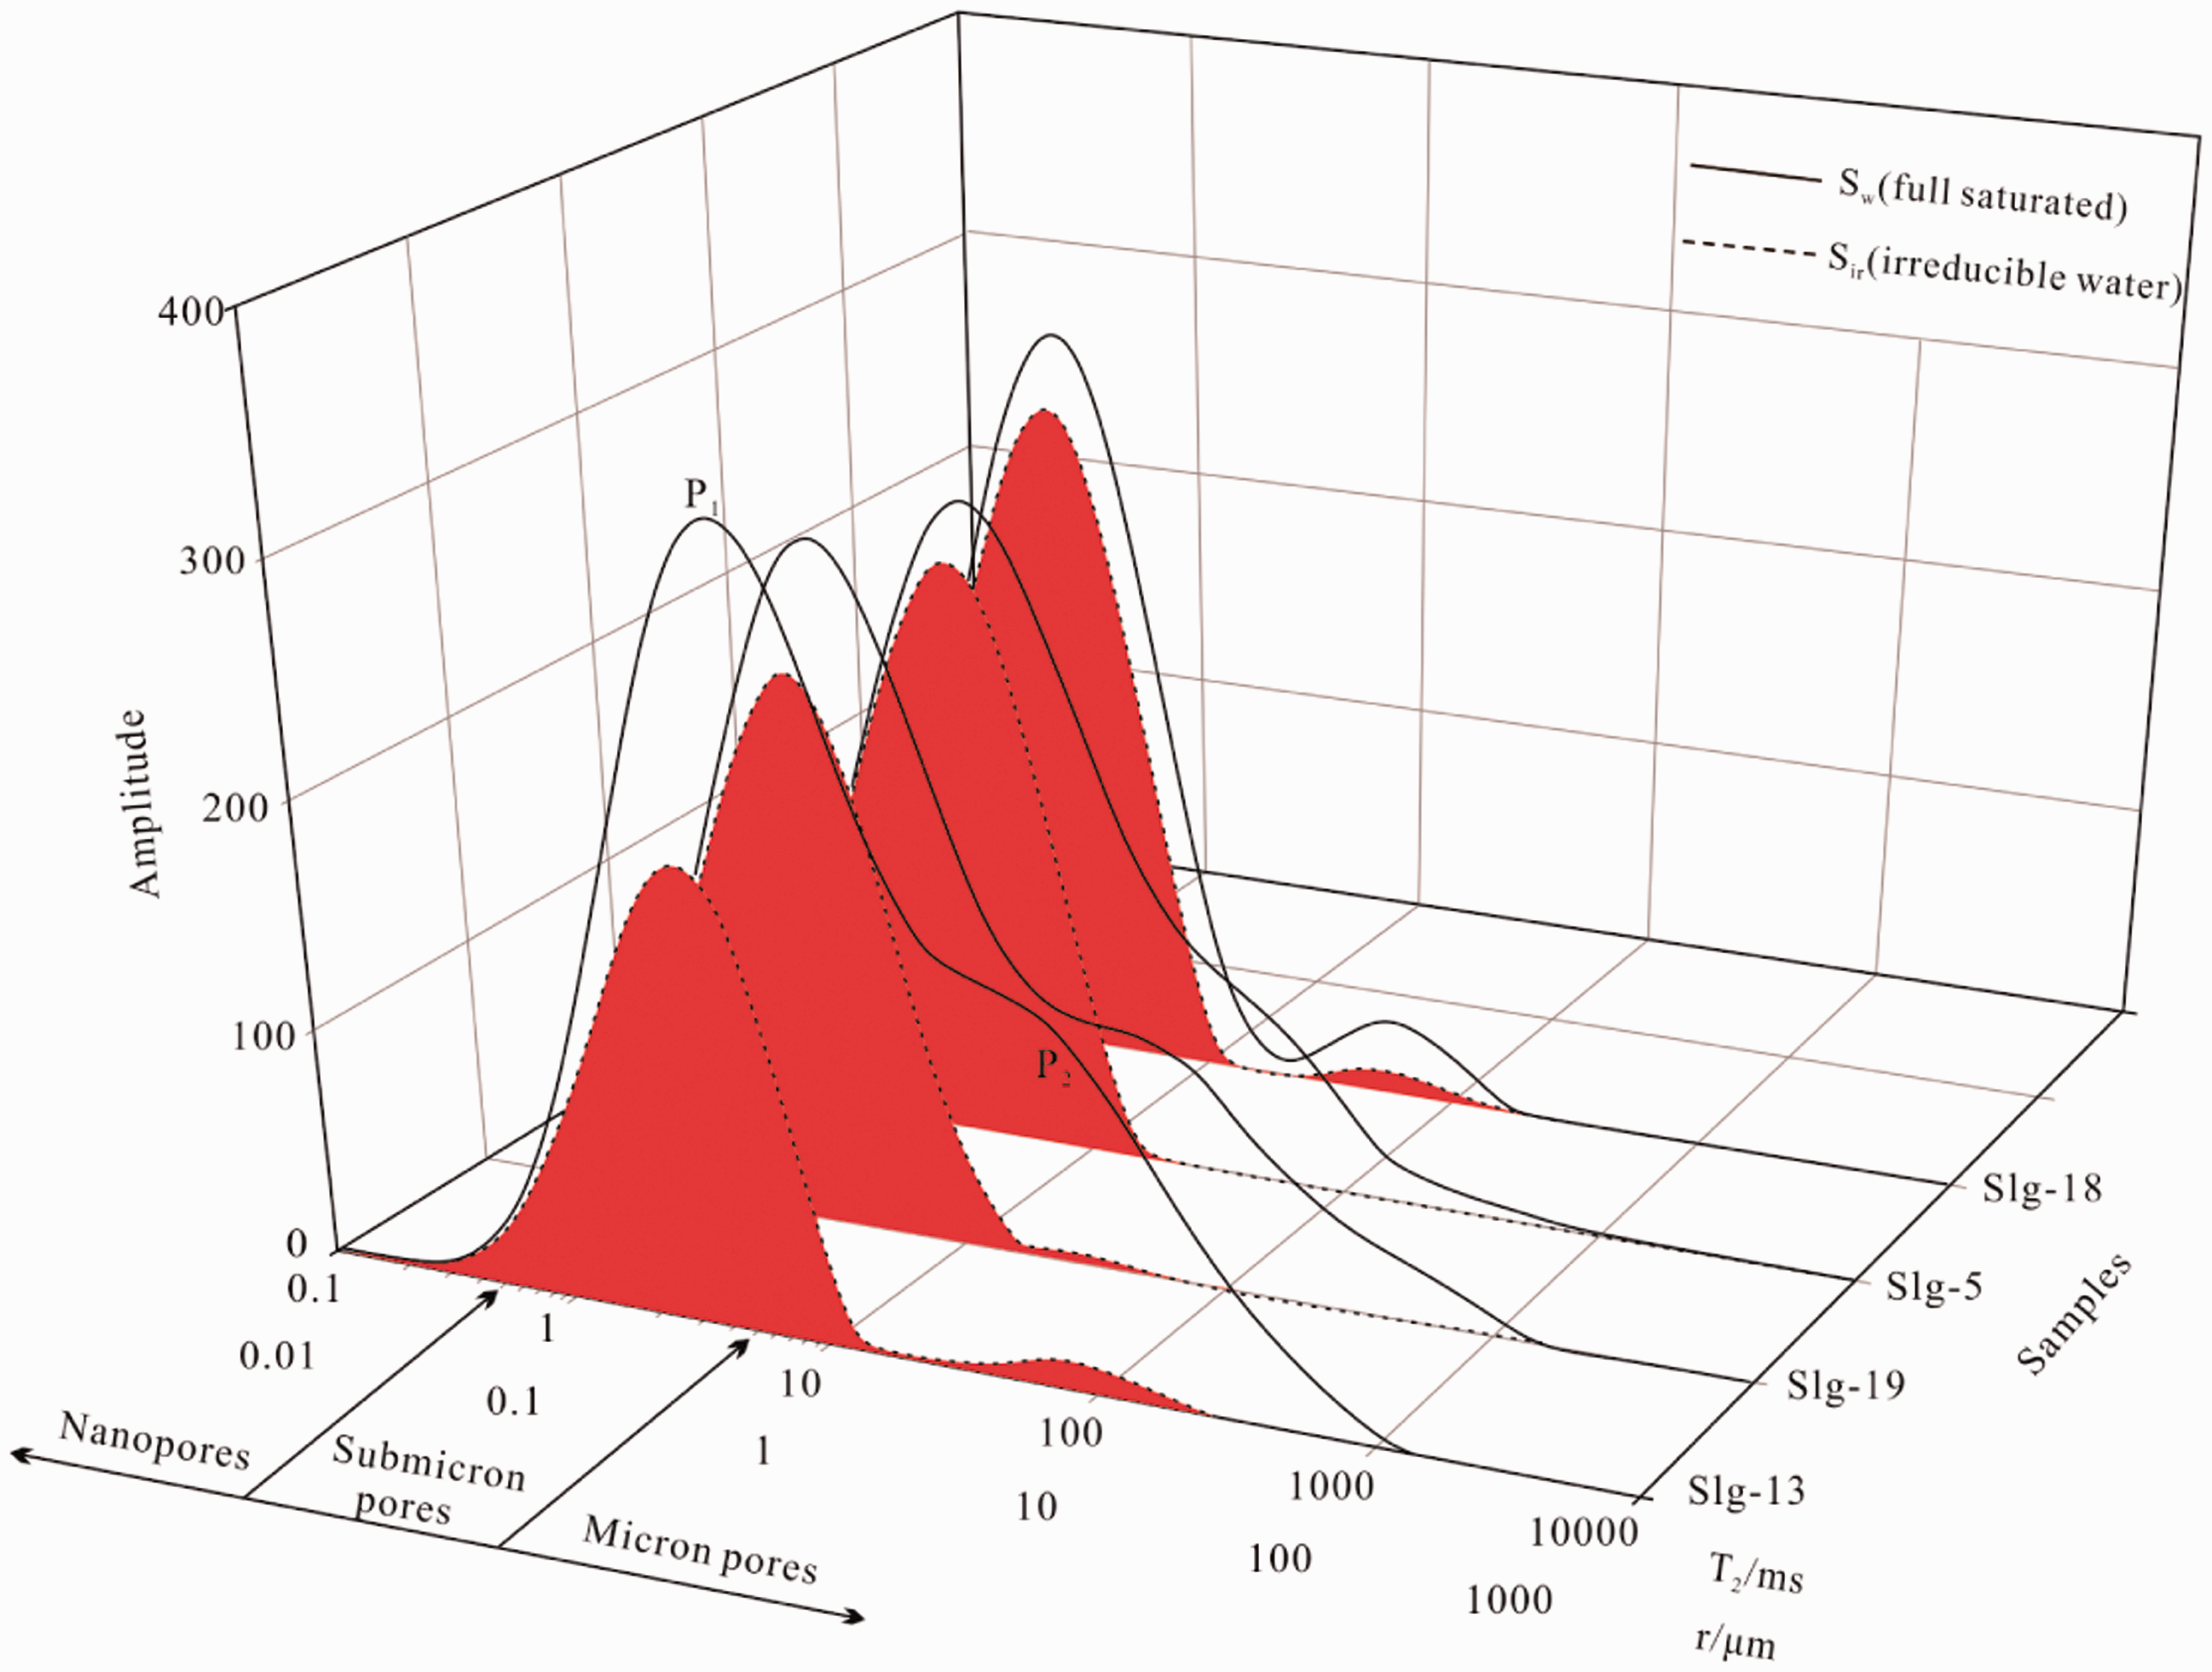
Pore–throat size distributions of tight sandstone samples from NMR experiment.
PSD from micro-CT
The 3D characteristics of pore structure for comparison samples were analyzed using micro-CT scanning, and three typical samples are displayed in Figure 9. As shown in two-dimensional (2D) grey scale CT scanning images (Figure 9(a) to (c)), multiscale pores existed in tight sandstones, which agreed with the result of thin-sections analysis. As shown in Figure 9(e), segmented 3D pore distributions were mainly coded by orange and blue, which represented interconnected pore–throat systems and therefore had relatively better pore connectivity in tight gas reservoirs (Fu et al., 2015). Various colors of pores were dispersed in the space, suggesting that samples had relatively poor pore connectivity (Figure 9(d) and (f)). Therefore, we found that the sample Slg-13 had the best pore connectivity, followed by Slg-5 and Slg-19, which also explained why sample Slg-13 had a better physical property and a larger Smf than the other two samples (Table 1 and Figure 8). The PSDs of samples were extracted from the corresponding CT scanning images (Figure 9(d) to (f)), which are illustrated in Figure 10(a). The pore distributions were uniform in radius, ranging between 7.0 μm and 200 μm. The image resolution of micro-CT was approximately 7 μm, indicating that pore–throats with radius of less than 7 μm in tight sandstones were beyond the characterization range.
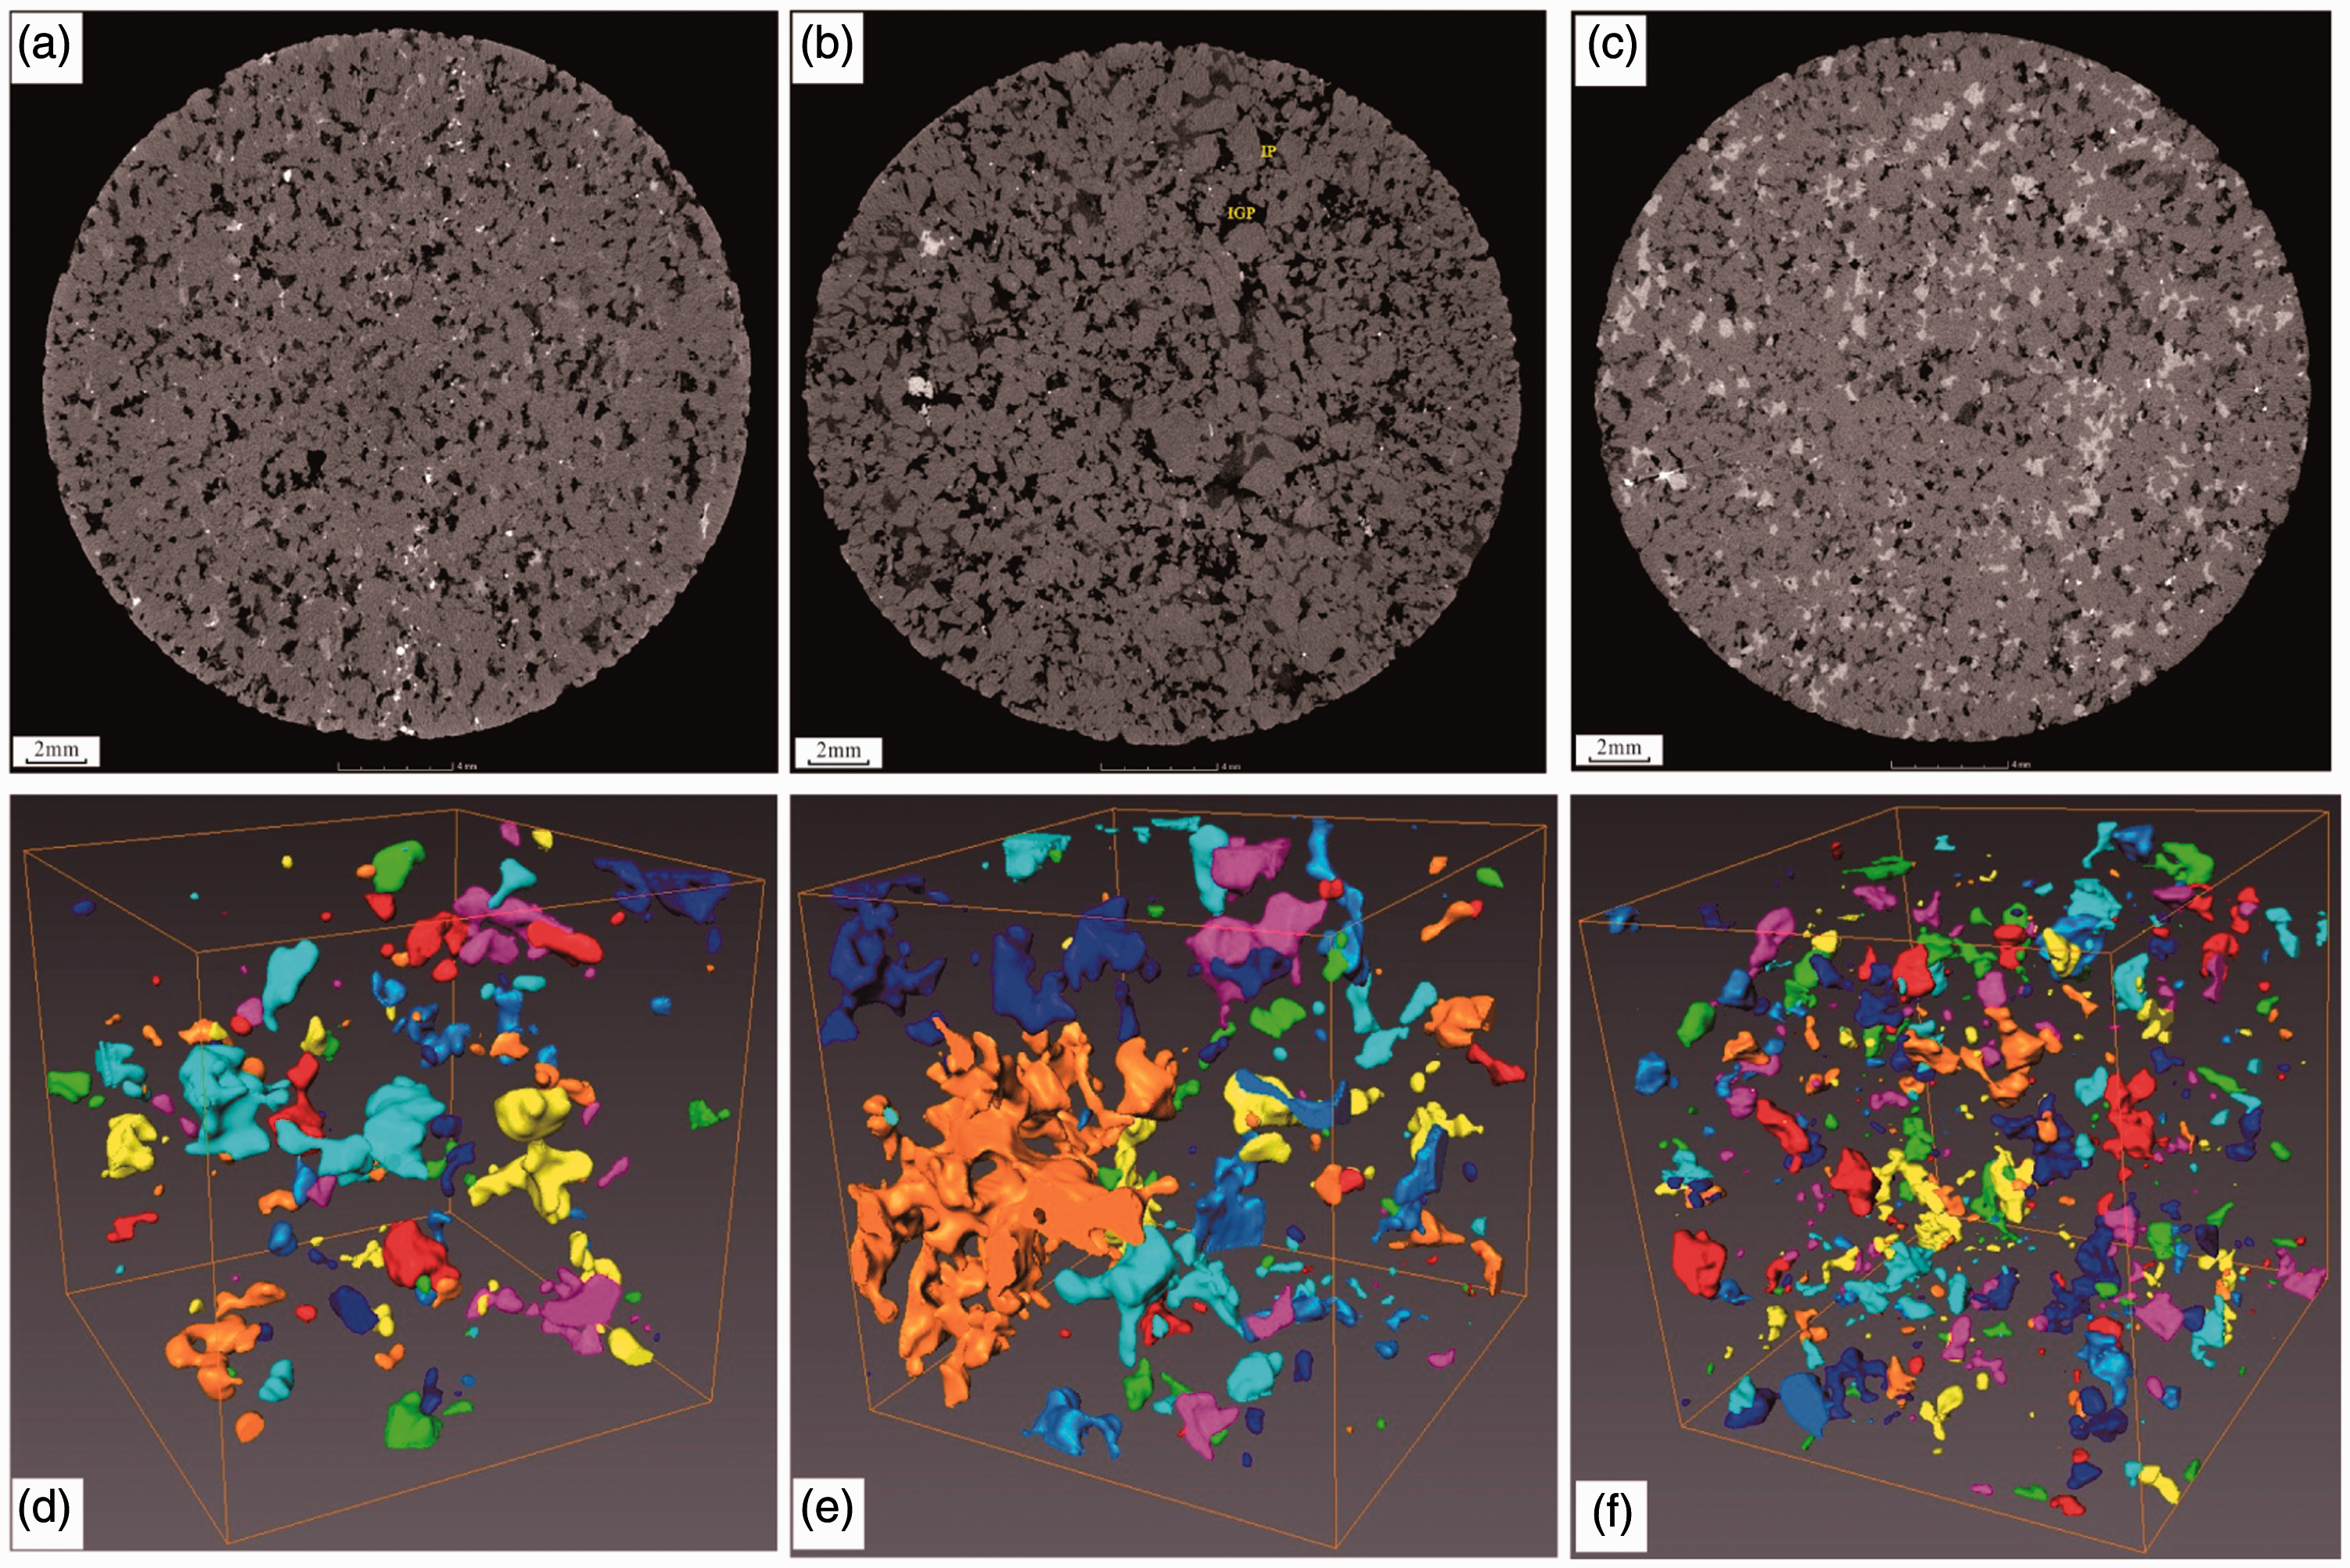
(a–c). Grey scale CT scanning image (dark black represents pores) cross-section for samples (a) Slg-5, (b) Slg-13, and (c) Slg-19. (d–f). Segmented three-dimensional characteristics of pore structure for samples (d) Slg-5, (e) Slg-13, and (f) Slg-19, respectively.
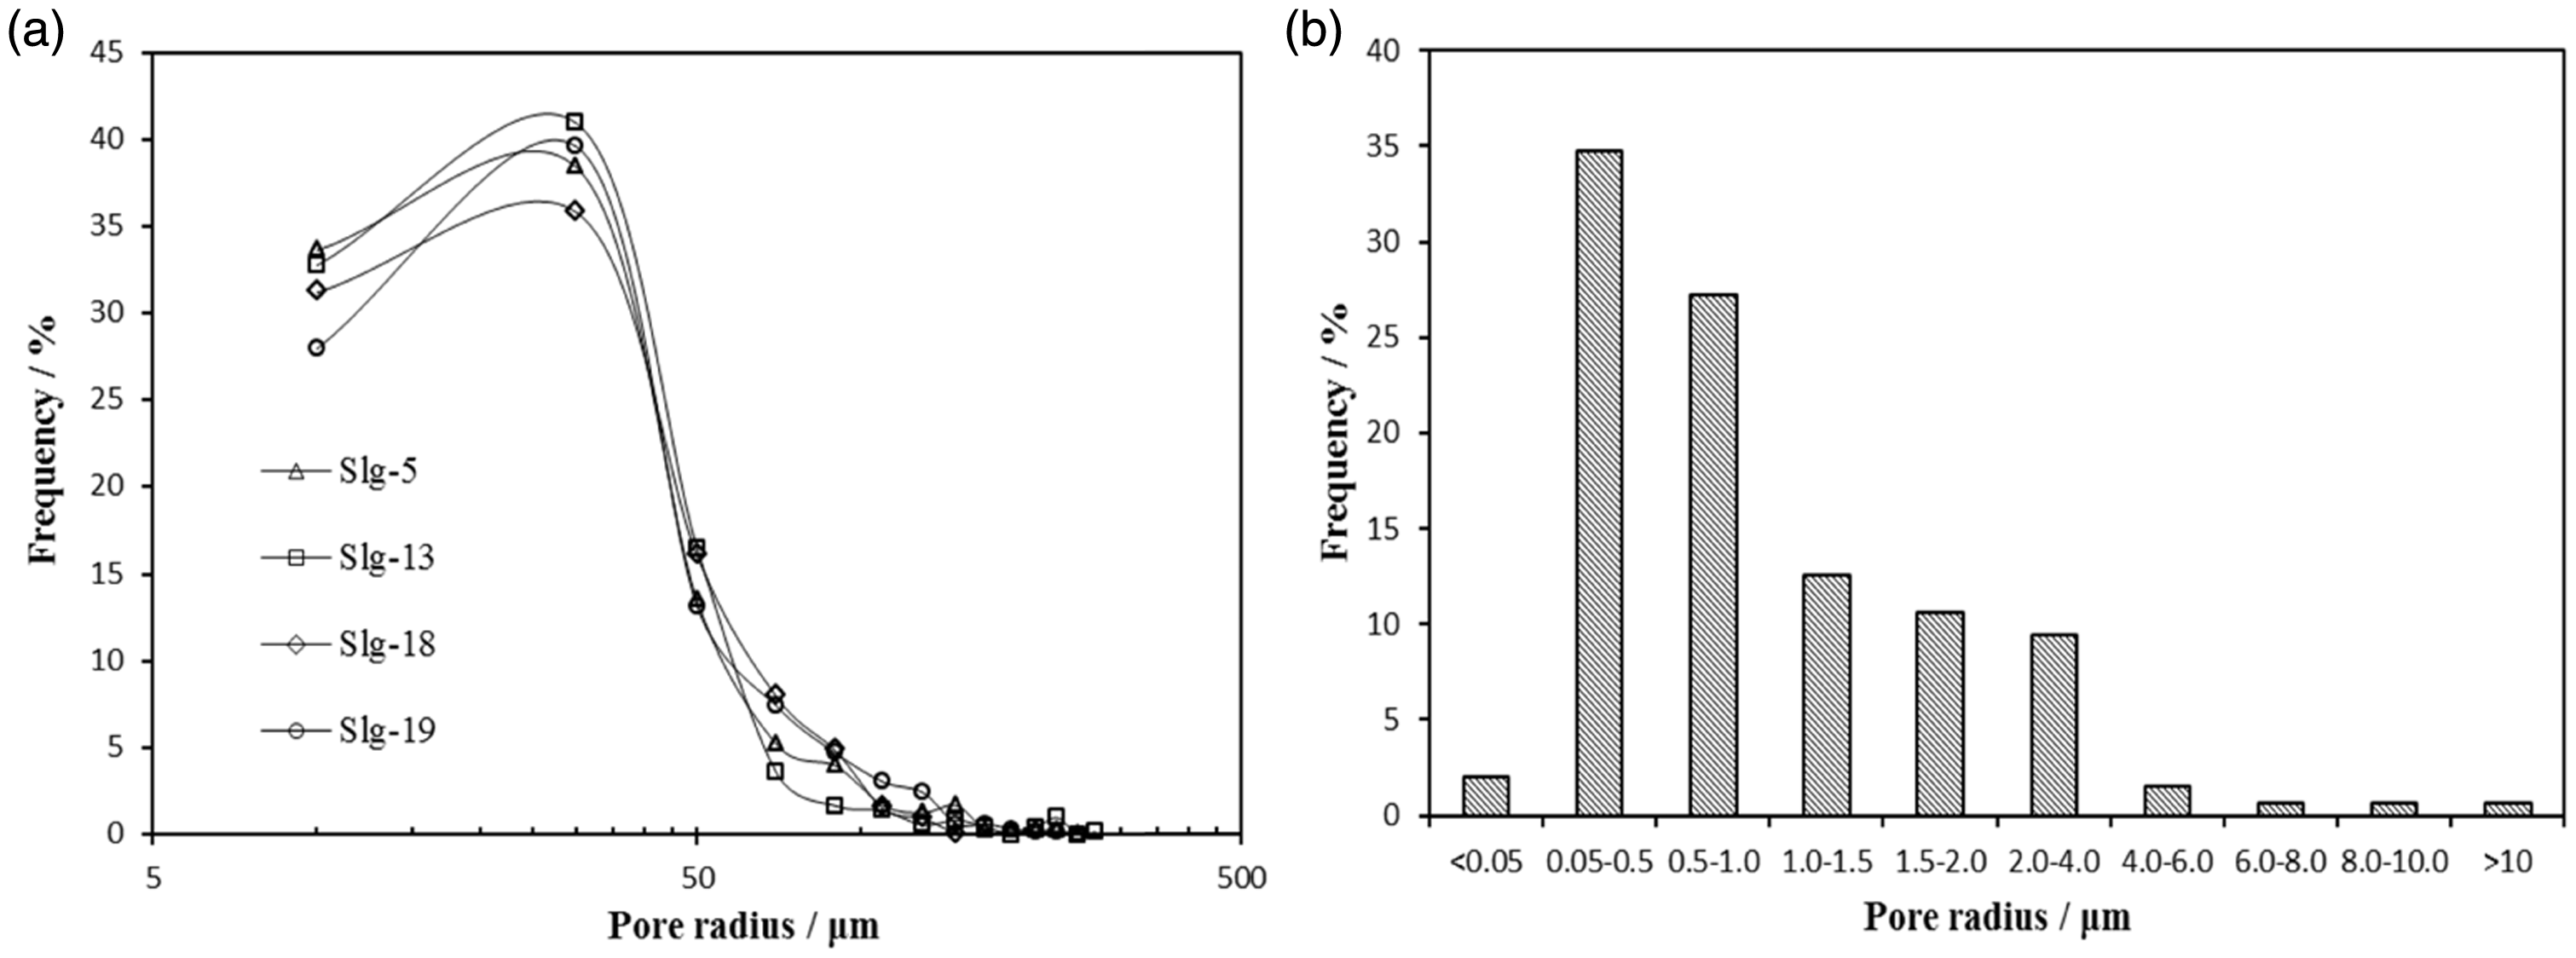
Pore size distribution from (a) micro-CT experiment and (b) FE-SEM experiment (20 samples).
PSD from FE-SEM
FE-SEM analysis found that the pores in tight sandstone samples were dispersedly distributed and the PSD ranged from 0.05 to10 μm, with the majority between 0.05 μm and 4 μm (Figure 10(b)). FE-SEM previously failed to probe pores larger than 10 μm, which resulted from the limitations of the experimental sample size and magnifications. The FE-SEM results signified that many nanopores and micropores were commonly tubular and irregular in shape. Although some of these pores had relatively better connectivity, it was difficult to distinguish the pores from the throats (Bai et al., 2013).
Fractal dimensions from RMI
All selected samples were analyzed by equation (5), and the computed fractal dimensions are listed in Table 2. Fractal structure of pore–throat system had a distinct cut-off on the fractal curve of lg(Pc) vs. lg(SHg), i.e. fractal curve was divided into two parts at the average capillary pressure of 1 MPa (Figure 11 and Table 2). For example, the fractal curve slopes of pore–throat, pore, and throat of sample Slg-6 at capillary pressure above 1 MPa were 0.1791, 0.041, and 0.7045, respectively, and these values for sample Slg-6 at the capillary pressure of less than 1 MPa were 3.7855, 3.9087, and 2.9568, respectively (Figure 11(a)). It is noteworthy that the fractal dimensions should be less than or equal to 3 (Li, 2010). For the pore systems within the capillary pressure of less than 1 MPa, the fractal dimensions were commonly greater than 3, which deviated from the definition of fractal dimension and were considered to be invalid and meaningless (Katz and Thompson, 1985; Pfeifer and Avnir, 1983), i.e. the pore–throat system did not conform to the fractal structure. In contrast, the pore–throat system had the fractal structure, and the fractal dimensions were less than 3 that provided more realistic results. Figure 11 suggested that Dpt, Dp, and Dt represent the fractal dimensions of pore–throat, pore, and throat, respectively. Dpt, Dp, and Dt are shown in Figure 11 and tabulated in Table 2. Table 2 shows the ranges of Dpt, Dp, and Dt from 2.1791 to 2.8274 (av. 2.5445), from 2.0077 to 2.1470 (av. 2.0580), and from 2.5553 to 2.9980 (av. 2.8517), respectively. Therefore, pore–throat systems of tight gas reservoirs had good fractal characteristics when capillary pressure is greater than 1 MPa, corresponding to pores with radii less than 0.7 μm. The Dpt was less than Dt except for the sample Slg-14-1 that may be caused by the ultra-lower permeability with ultrafine and complexed pore structure, indicating that the TSD of tight sandstone samples was more complicated.
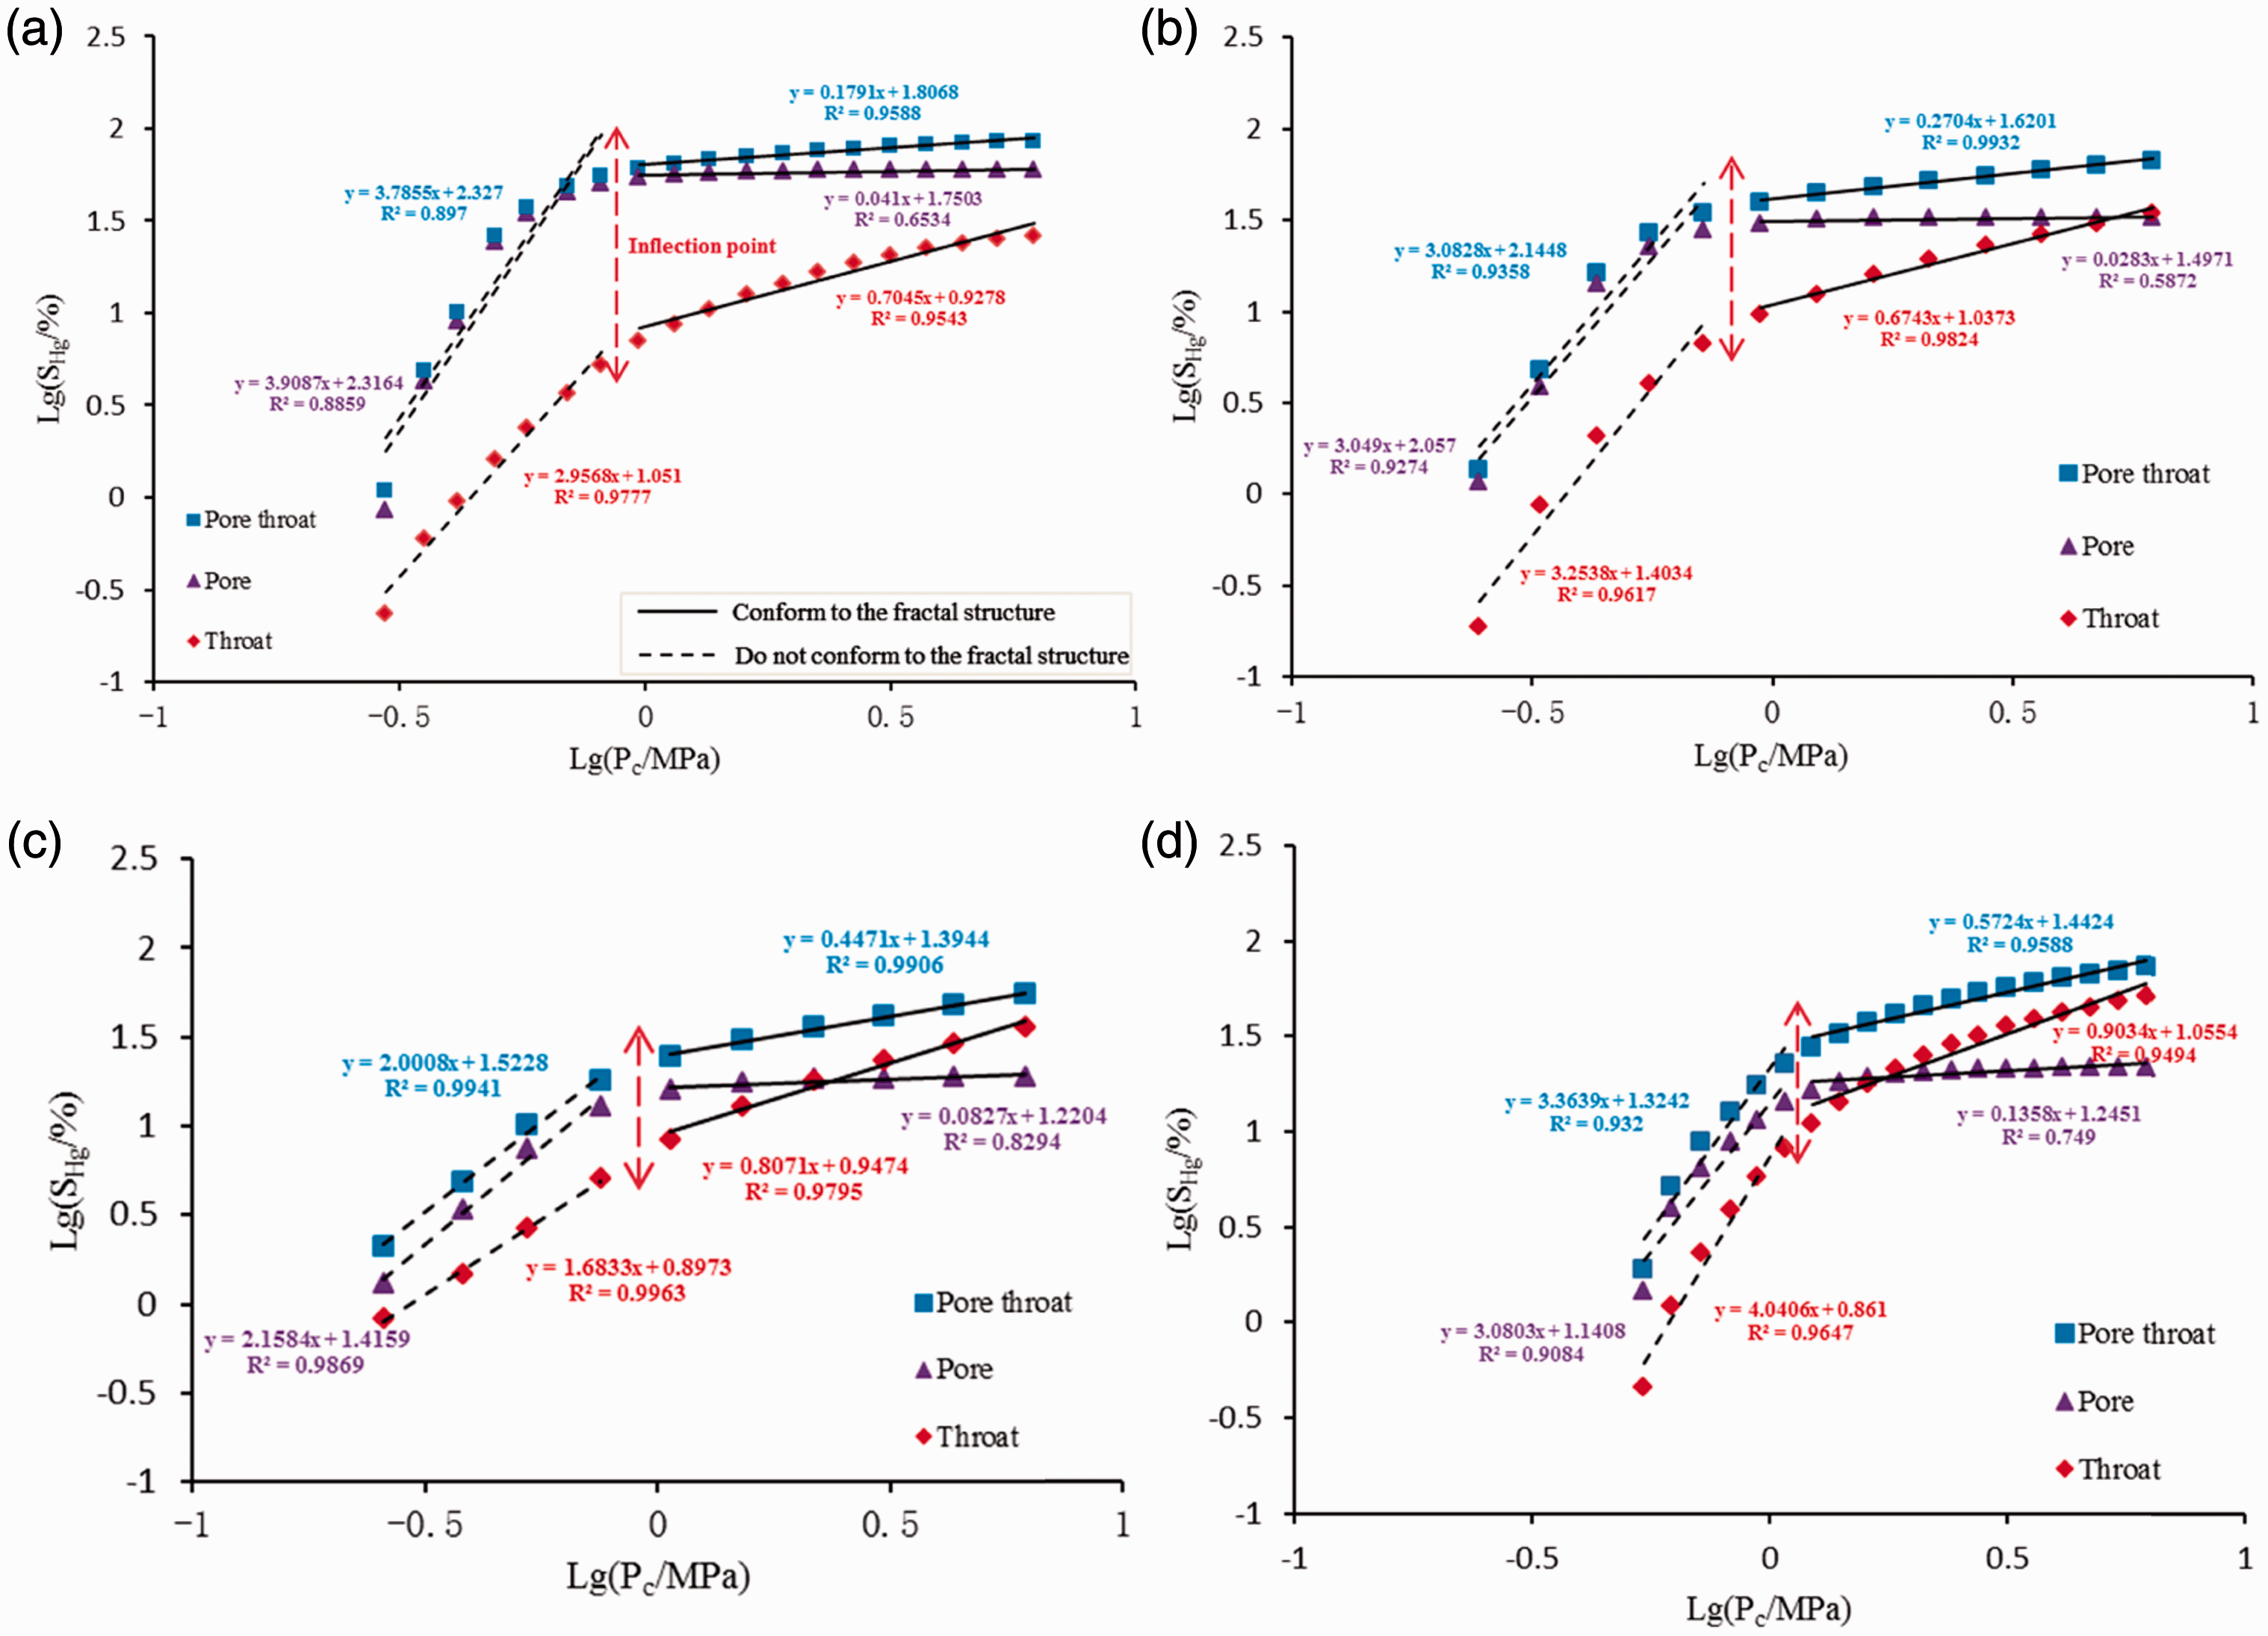
Plots of lg (SHg, %) vs. lg (Pc, MPa) of tight sandstone reservoirs for samples (a) Slg-6, (b) Slg-8, (c) Slg-3, and (d) Slg-12.
This conclusion was not consistent with the results by Shi et al. (2009) who suggested that the pore of low permeability sandstones did not conform to the fractal structure, and only the throat does. However, this study found that the pore structure has phased fractal characteristics, i.e. there is a fractal inflection point. Within the scope of fractal scales, the pore–throat, pore, and throat all have fractal structure (Table 3 and Figure 11).
Comparison of RMI, NMR, µCT, and FE-SEM in characterizing PSD of tight gas reservoirs.
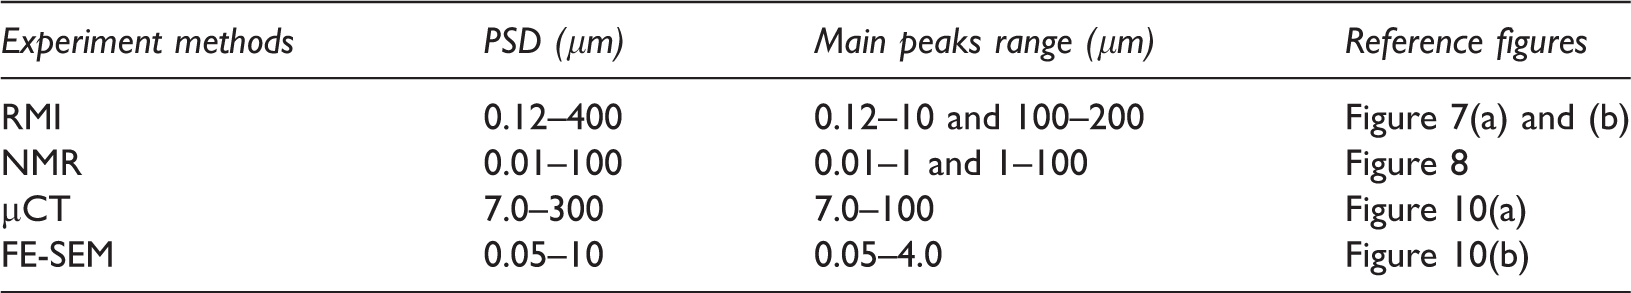
FE-SEM: field emission scanning electron microscope; NMR: nuclear magnetic resonance; PSD: pore–throat size distribution; RMI: rate-controlled mercury injection.
Discussion
The overall and effective PSD
As noted above, the PSD of tight sandstone samples was investigated by various experiments and the results are concluded in Table 3. The integration of the abovementioned four experiments was utilized to determine the overall PSD of tight gas reservoirs. As shown in Table 3, the investigated tight sandstone samples showed a relatively broad and multimodal PSD ranging from 10 nm to 400 μm in radius, which was characterized by three main peaks that reflected various types of pores in tight gas reservoirs. The first peak covered 100–200 μm with a mode of approximately 150 μm and was characterized by RMI data (Figure 7(a)). Pores of these sizes were allied with residual intergranular pores and complete-dissolution pores in grains. The second peak was characterized by an integration of NMR and micro-CT data and spanned 7–100 μm with a mode of approximately 25 μm, which was linked with a portion of micropores and dissolution pores (Figures 8 and 10(a)). The third peak covered 0.01–10 μm with a mode of approximately 0.25 μm and was characterized by an integration of RMI, NMR, and FE-SEM data (Figures 7(b), 8, and 10(b)). Pores within this size range were commonly composed of micropores, as demonstrated by Nelson (2009). Compared to NMR and micro-CT results, RMI-derived pores with size ranging between 10 μm and 70 μm were rare. The reason for this discrepancy might be associated with the shielding effect of these pores connected by smaller throats (Kaufmann et al., 2009), which inhibited mercury from entering the pores. RMI only measures interconnected pore–throat systems, while both NMR and micro-CT can also characterize inaccessible pore–throat systems. Different from the other methods used in this study, although the pore size distribution from FE-SEM is relatively narrow (Figure 10(b)), FE-SEM enables a large number of nanopores intuitively. The difference may be caused by the limitations of the experimental conditions.
NMR results displayed that a large amount of fluid was trapped in the nanopores (Figure 8). In the real sense, the Smf of tight gas reservoirs was dominated by submicron and micron pore–throats, and the Sif was commonly controlled by the throats with radius of less than 0.05 μm and pores interconnected by these throats (Figure 8). The RMI-derived PSD was mainly composed of the throats with radius above 0.1 μm and pores connected by these throats (Figure 7(a) and (b)), which were considered to be effective pores and throats that dominated the flow capacity of tight gas reservoirs. However, for the submicron–micron pores controlled by throats with radii of 0.05–0.1 μm, which were beyond the characterization range of RMI. NMR can describe a relatively wide PSD than RMI, but NMR-derived PSD cannot be subdivided into small pore increments because of its limited resolution. In future research, combining RMI with NMR and other feasible experiment methods to complement the effective PSD appears to be necessary.
Relationships between fractal dimensions and pore structure parameters
The fractal dimension increases with increasing the heterogeneity of pore–throat system, which has been well proved in previous studies (Lai and Wang, 2015; Li, 2010; Li and Horne, 2006). Because Dp of all investigated samples was close to the lowest value 2, the relationships between Dp and pore structure parameters were not discussed here.
The constructed relationships between the fractal dimensions (Dpt and Dt) and reservoir properties, average pore radius, average throat radius, mainstream throat radius, and heterogeneous coefficient are shown in Figure 12. Both Dpt and Dt showed negative correlations with the permeability, average throat radius, and mainstream throat radius (Figure 12(b), (d), and (e)): as the Dpt and Dt increased, the permeability and throat radius values decreased and the pore structure became more complicated, which were consistent with the results by Ma et al. (2012) and Lai and Wang (2015). However, these did not agree with the result by Shi et al. (2009) who suggested that the fractal dimension poorly correlated with permeability and throat radius of low permeability sandstones and only the TSD followed the fractal structure. The fractal dimension showed a positive relationship with the heterogeneous coefficient (Figure 12(f)): as the fractal dimension increased, the heterogeneous coefficient became larger and the pore structure was more complex. This rule has also been found in the investigation of pore structure in other sandstone reservoirs (Zhang et al., 2007). In addition, no apparent relationships existed between fractal dimension and porosity and average pore radius (Figure 12(a) and (c)), which were not consistent with the work by Shi et al. (2009). The reason for the abovementioned discrepancies was that the pore structure complexity of different sandstone reservoirs also differs. The pore structure differences between sandstone reservoirs were driven by the initial mineralogy and subsequent diagenesis (Simaeys et al., 2017), which may lead to multiple PSD and therefore affect the relations between fractal dimensions and pore stature parameters. Figure 12 also signified that the correlation coefficients R2 between Dt and pore structure parameters were higher than that between Dpt and pore structure parameters, indicating that the Dt is the optimal representative for quantitatively investigating the complexity and heterogeneity of pore structure in tight sandstone gas reservoirs.
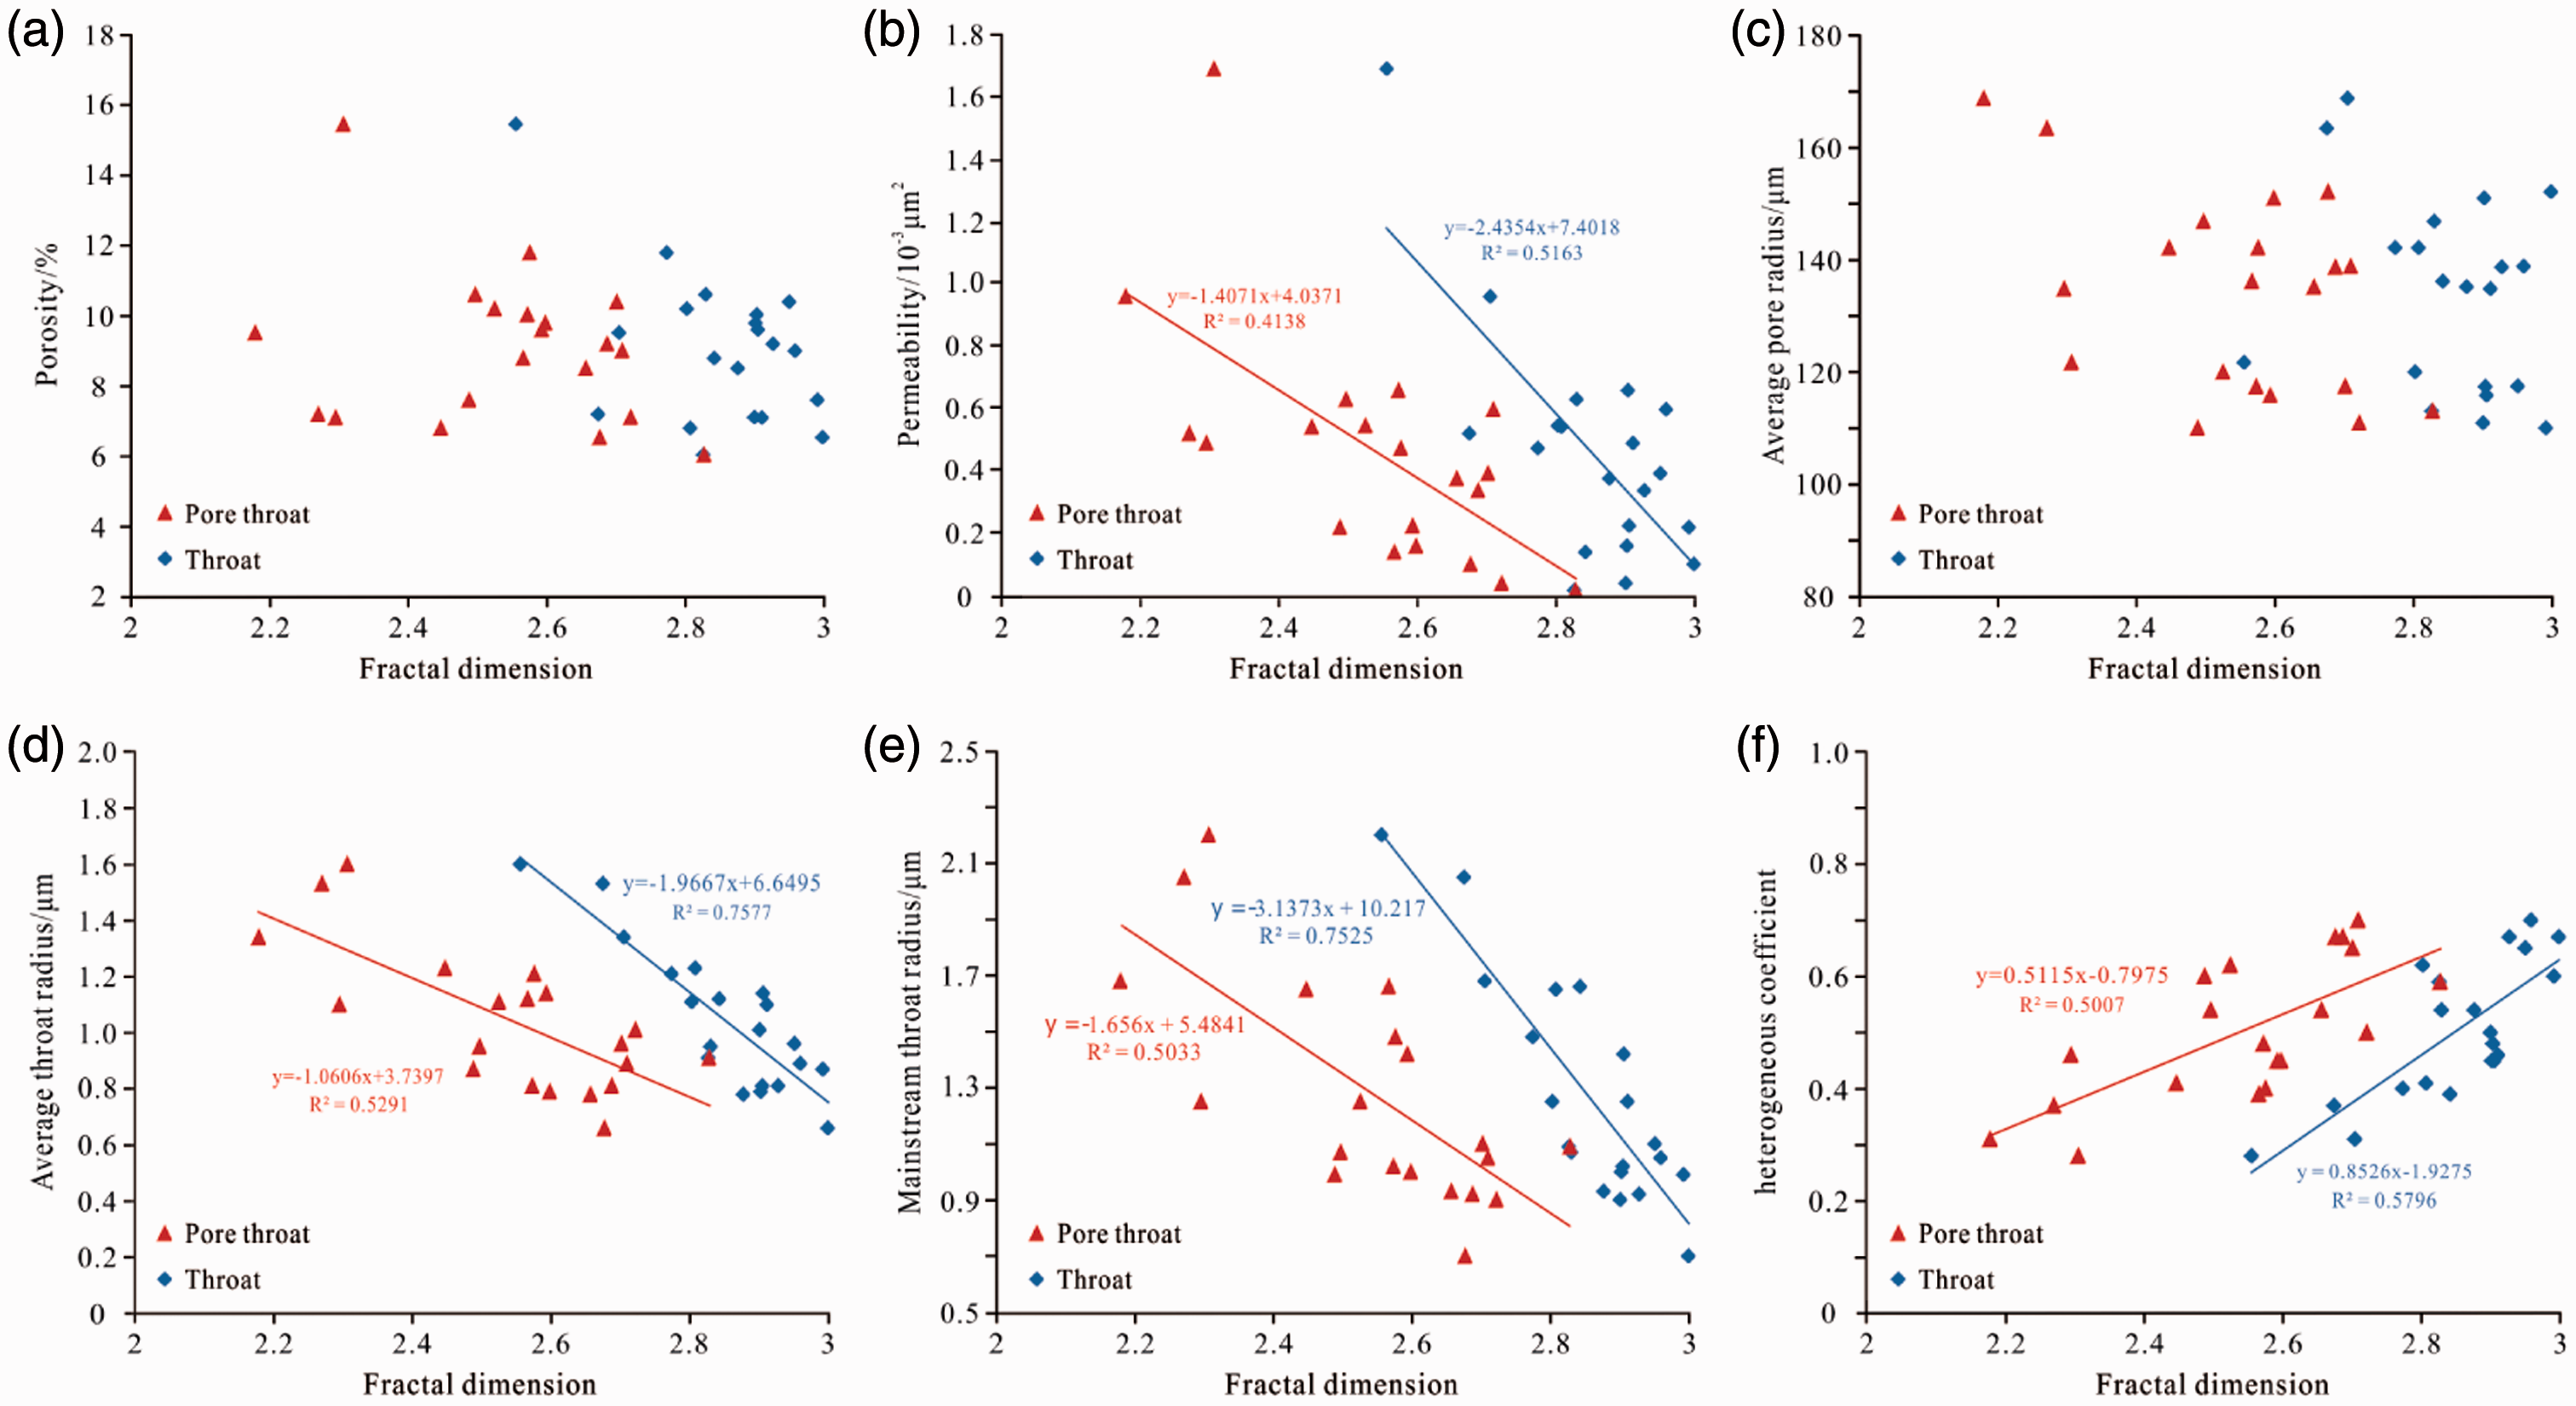
Relations between fractal dimension and pore structure parameters. (a) porosity, (b) permeability, (c) average pore radius, (d) average thorat radius, (e) mainstream throat radius, and (f) heterogeneous coefficient.
Relationships between fractal structure and percolation characteristics
To elaborate the relationship between fractal structure and percolation characteristics of tight gas reservoirs, the incremental mercury saturation curves of samples are illustrated in Figure 13. It should be noted that the injection pressure of approximately 1 MPa (Po) on the incremental mercury injection curve can be regarded as an inflection point (Figure 13), which is also consistent with fractal inflection point. When the injection pressure is lower than Po, the pore–throat systems do not conform to the fractal structure and the tendency of the overall intrusion curve followed the tendency of the pore intrusion curve (i.e. left part of point Po in Figure 13). In other words, the incremental mercury saturation of tight gas reservoirs was dominated by pores. When the injection pressure is greater than the Po, the pore–throat systems follow the fractal structure and the trend of the overall intrusion curve is in accordance with that of the throat intrusion curve (i.e. right part of point Po in Figure 13). The incremental mercury saturation of tight gas reservoirs was almost entirely contributed by throats.
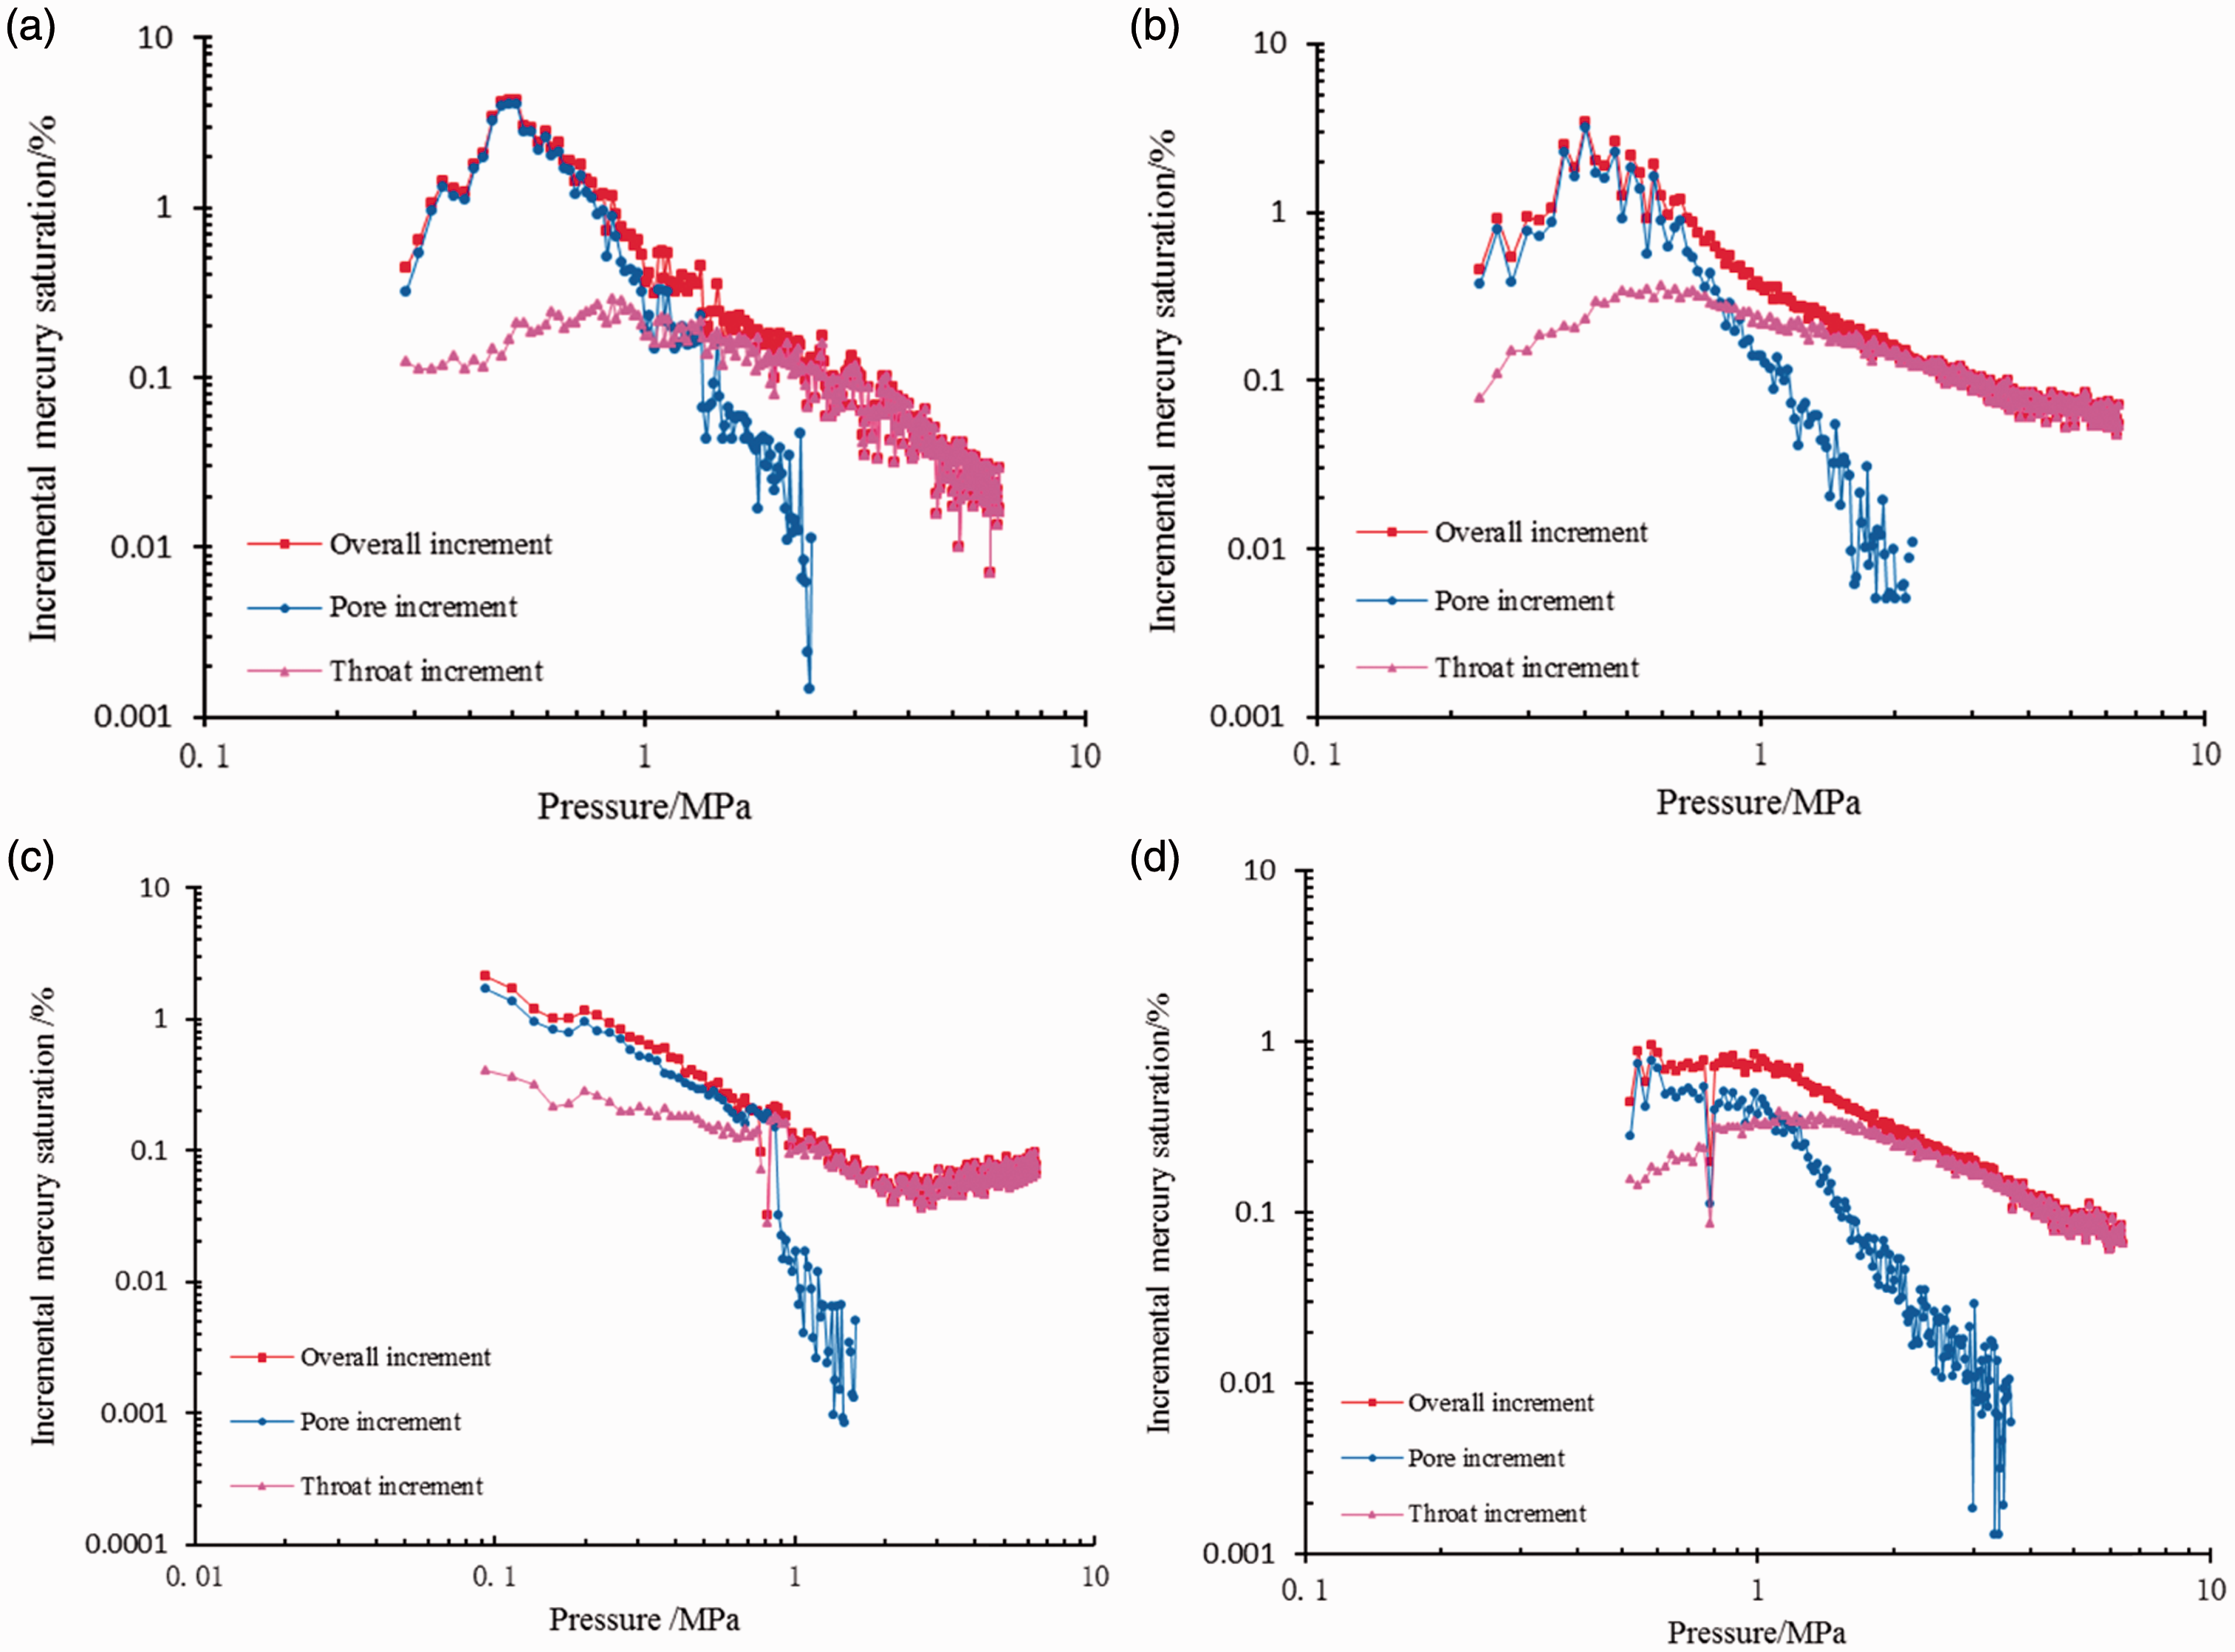
The incremental mercury saturation curves of tight sandstone gas reservoirs for samples (a) Slg-6, (b) Slg-8, (c) Slg-3, and (d) Slg-12.
The average throat radius of samples at injection pressure Po is approximately 0.7 μm (Table 2). During the early phase of mercury injection, the pores connected by throats with radius of greater than 0.7 μm were saturated first (Figure 13), suggesting that it has more large pores and relatively better pore–throat connectivity (e.g. Figure 6(d) and (e)). However, the pore–throat systems do not follow fractal characteristics because of the various scales of the pores with huge heterogeneity in tight gas reservoirs. With increasing intrusion pressure, the total cumulative mercury saturation is gradually dominated by throats (Figure 13), indicating that tight sandstones had more small pores and fine pore structure (e.g. Figure 6(f) to (h)). Although it is difficult to distinguish these small pores from the throats at the late phase of mercury injection, the pore–throats system is relatively uniform and less complex, and therefore tends to have fractal characteristics.
The percolation characteristics of tight gas reservoirs in Sulige area can be interpreted by fractal structure. When the pore structure does not follow the fractal structure, the mercury intrusion saturation is dominated by pores. In contrast, the mercury intrusion saturation is almost solely dominated by throats. Therefore, the fractal dimension can be regarded as the crucial parameter in delineating the percolation characteristics of tight gas reservoirs. This finding may provide reference for the investigation of percolation characteristics of tight gas reservoirs with similar sedimentary background in other areas.
Conclusions
In this work, the characteristics and fractal analysis of pore structure in tight sandstone gas reservoirs were investigated, and we arrived at the following conclusions:
The Permian P2h8 sandstones belong to typical tight sandstone gas reservoirs with a range of porosity from 0.19% to 22.98% (av. 8.29%) and permeability from 0.001 mD to 49.768 mD (av. 0.923 mD). Three major pore types are identified, i.e. residual intergranular pores, secondary dissolution pores, and micropores, and size ranges of these three pore types differ significantly. The PSD is extremely wide and multiscale (10 nm–400 µm) co-existing in tight gas reservoirs. The multimodal PSD consists of three peaks. The first peak covered 100–200 µm, and pores of these sizes were allied with residual intergranular pores and complete-dissolution pores in grains. The second peak spanned 7–100 µm and was linked with a portion of micropores and dissolution pores. The third peak, with pore sizes between 0.01 and 10 µm, was commonly composed of micropores. The submicron- and micron-scale pore–throats with radius above 0.05 µm are considered to be the effective pores and throats that dominated the flow capacity of tight gas reservoirs. Fractal dimension is negatively correlated with permeability, average throat radius, and mainstream throat radius, positively correlated with heterogeneous coefficient, while there are no obvious relationships with porosity and average pore radius. When pore structure follows the fractal structure, the mercury intrusion saturation is dominated by throats. In contrast, the mercury intrusion saturation is almost solely dominated by pores.
Footnotes
Acknowledgements
The authors thank Dr Ehsan UI Haq for his guidance on the article. Hao Wu is sincerely grateful to the anonymous reviewers and the Associate Editor (Prof. Dr Yuzhuang Sun) for their constructive comments.
Declaration of conflicting interests
The author(s) declared no potential conflicts of interest with respect to the research, authorship, and/or publication of this article.
Funding
The author(s) disclosed receipt of the following financial support for the research, authorship, and/or publication of this article: This study was jointly supported by the National Natural Science Foundation of China (Nos. 41672098 and 41602133) and National Science and Technology Major Project of China (Nos. 2016ZX05007-003 and 2016ZX05006-006).