
Abstract
This study focus on saturation evaluation of Chang 8 tight sandstone reservoir in Longdong West area of Ordos Basin, China. An improved saturation calculation method was proposed based on the equivalent rock capillary bundle theory. Firstly, according to characteristics of reservoir pore structure and rock conductivity, the conductive space of reservoir rock is equivalent to the parallel conductive of micro capillary bundle representing the micro pores and the coarse capillary bundle representing the macro pores. Then, the variable cementation index(m) saturation model was deduced by using Poiseuille flow equation and Darcy's law. During the calculation of model parameters, the T2 spectrum data of nuclear magnetic resonance (NMR) was used to calculate the equivalent radius of reservoir micro pores and macro pores, which ensured the ability of model popularization and application. Finally, the proposed saturation calculation method is applied to reservoir evaluation of the study area, and compared with the classical Archie saturation model. The application effect shows that the calculated saturation from the proposed variable m model is much closer to the sealed coring data than that from classical Archie model, and the average relative error of saturation calculated by the variable m model is within 7%, which proves that the proposed saturation calculation method is applicable and effective.
Introduction
With the depletion of conventional oil and gas resources, low porosity and low permeability reservoir represented by tight sandstone has become the main target of oil and gas exploration and development (Jia et al., 2016; Li et al., 2020a; Zou et al., 2012). Saturation is one of the key parameters during reservoir interpretation, because it can directly indicate the oil and gas bearing property of the formation. However, different from the conventional reservoirs, tight sandstone reservoir is characterized by low porosity, low permeability, complex pore structure and high heterogeneity, which makes the conductive law of reservoir complicated, and the saturation evaluation is facing great challenges (Gao et al., 2019; Li et al., 2018; Zheng et al., 2020).
In order to adapt to the complex reservoir characteristics of tight sandstone, researchers have made a lot of exploration and attempts to improve the accuracy of reservoir saturation evaluation (Li et al., 2020b; Shao et al., 2016; Tang et al., 2018; Zhou et al., 2019). According to the construction method of the saturation model, it can be roughly divided into three categories: one is to modify and improve the saturation model on the basis of Archie formula. Second is to re-establish the new saturation equation based on equivalent medium theory and reservoir pore structure characteristics. Third is to use some advanced intelligent algorithms or genetic algorithms to build saturation prediction model. For the tight sandstone reservoir, using the static Archie formula parameters obtained from the experimental data usually have poor effect and low accuracy during the calculation of reservoir saturation (Liu et al., 2013; Pan et al., 2020; You et al., 2016). To improve the applicability of Archie saturation model, researchers try to find and establish the relationship between Archie formula parameters and logging curves or reservoir parameters to construct the saturation model with variable Archie index. This method improves the accuracy of saturation calculation to a certain extent and achieved good results in some areas (Luo et al., 2015). However, it does not explain the effect of rock pore structure on electrical conductivity in essence, which has a strong regional dependence (Guo et al., 2018; Worthington and Pallatt, 1992). With further understanding of the conductive mechanism of tight sandstone reservoir, the saturation model based on the characteristics of rock pore structure has gradually become an important research area for logging interpretation and evaluation of low porosity and low permeability reservoir (Shanley and Cluff, 2015; Zhang et al., 2017, 2018). Shang et al. (2008) proposed the equivalent rock component saturation model by dividing the rock pore throat into parallel connection and series connection pores, which effectively reduced the influence of additional conductivity of reservoir on saturation. Li et al. (2012) constructed the dual porosity component saturation model based on the pore structure characteristics, which has been well applied in the evaluation of low porosity and low permeability reservoirs in two Eastern oilfields of China. Hu et al. (2017) established a trapezoidal pore saturation model by attributing the conductivity of tight sandstone reservoir to the parallel connection of straight pores with constant cross-section and trapezoidal pores with variable cross-section. Previous researches have shown that the nuclear magnetic resonance(NMR) logging has great advantages in revealing reservoir pore structure characteristics (Liu et al., 2018; Wu et al., 2020). And proper introduction of NMR logging data during the calculation of reservoir saturation can effectively improve the evaluation accuracy (Chelsea et al., 2020; Li et al., 2019; Romero et al., 2018).
In these years, the Chang 8 Member of Yanchang Formation in Longdong West area, Ordos Basin, China, is exploring and developing (Liu et al., 2014). However, the complex pore structure and strong heterogeneity makes the saturation evaluation difficult (Pratama et al., 2017). In this research, an improved saturation calculation method was proposed based on the equivalent rock capillary bundle theory. According to the analysis of reservoir pore structure and rock conductivity characteristics, the conductive space of reservoir rock is equivalent to the parallel connection of micro pores and macro pores. And the variable cementation index m saturation calculation method was established based on the equivalent rock capillary bundle theory. In order to ensure the popularization and application of this method, the NMR T2 spectrum data was used to calculate the equivalent radius of reservoir micro pores and macro pores. This proposed saturation calculated method is a deformation application of the classical Archie model to some extent. But it considered the reservoir pore structure characteristics, and introduced the NMR logging data during the saturation calculation. The application effect shows that the proposed saturation calculation method is more suitable than the classical Archie model.
Reservoir characteristics
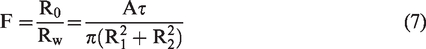
Longdong West area is located in the southwest of Ordos Basin. The Chang 8 Member of Yanchang Formation in Longdong area is a typical tight sandstone reservoir with low porosity and low permeability. Based on the statistical results of porosity and permeability of 206 cores in the study area, the porosity is mainly distributed betweeen 4% and 10%, with an average of 7.2%, and the permeability is mainly distributed between 0.01mD and 0.3mD, with an average of 0.21mD (Figure 1).
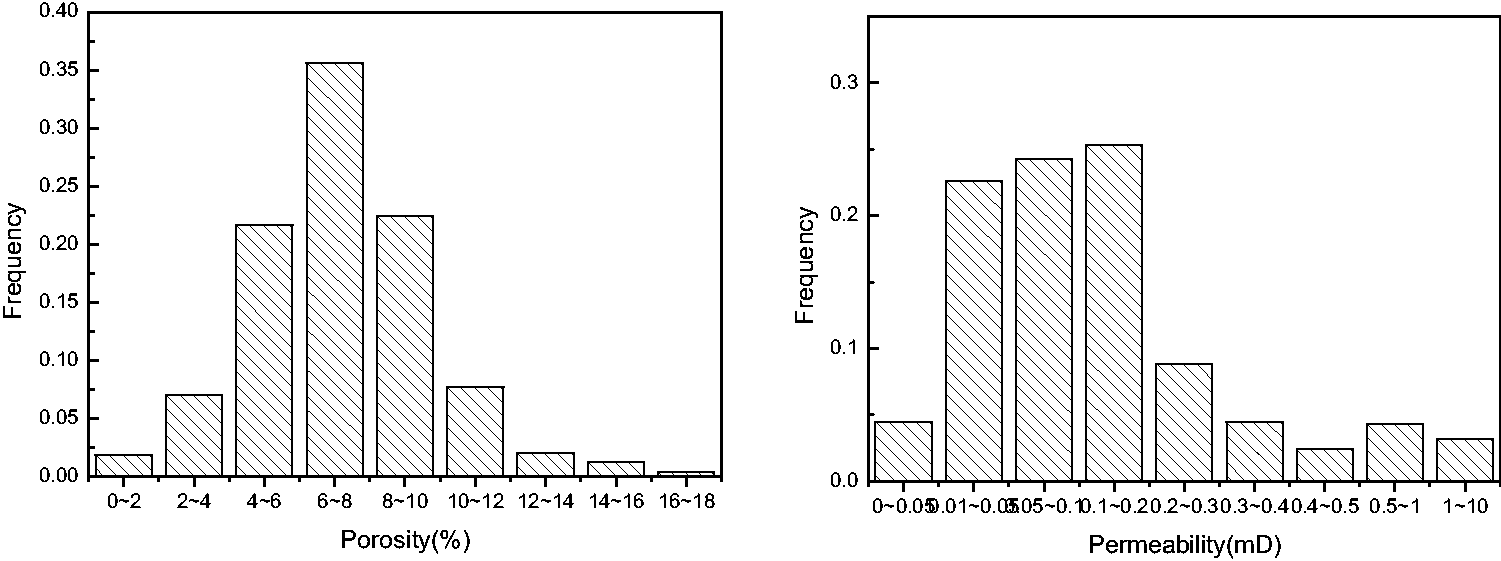
The relationship between porosity and permeability.
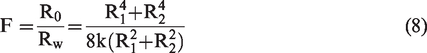
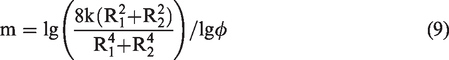
Complex sedimentary conditions and diagenesis make the pore structure of Chang 8 tight sandstone reservoir complex. According to the analysis results of rock thin section observation from 38 rock samples, the pore types of Chang 8 tight sandstone reservoir in the study area is mainly primary intergranular pores, followed by dissolved pores and intercrystalline pores (Figure 2). In addition, a large number of clay minerals filling pores reduced the pore throat radius and increased the content of micro pores (Figure 3a). Mercury injection experiment results show that the pore radius of the reservoir has obvious bimodal distribution characteristics, indicating that the reservoir has dual pore structure and conductive fluid exists in the macro pores and micro pores (Figure 3b).
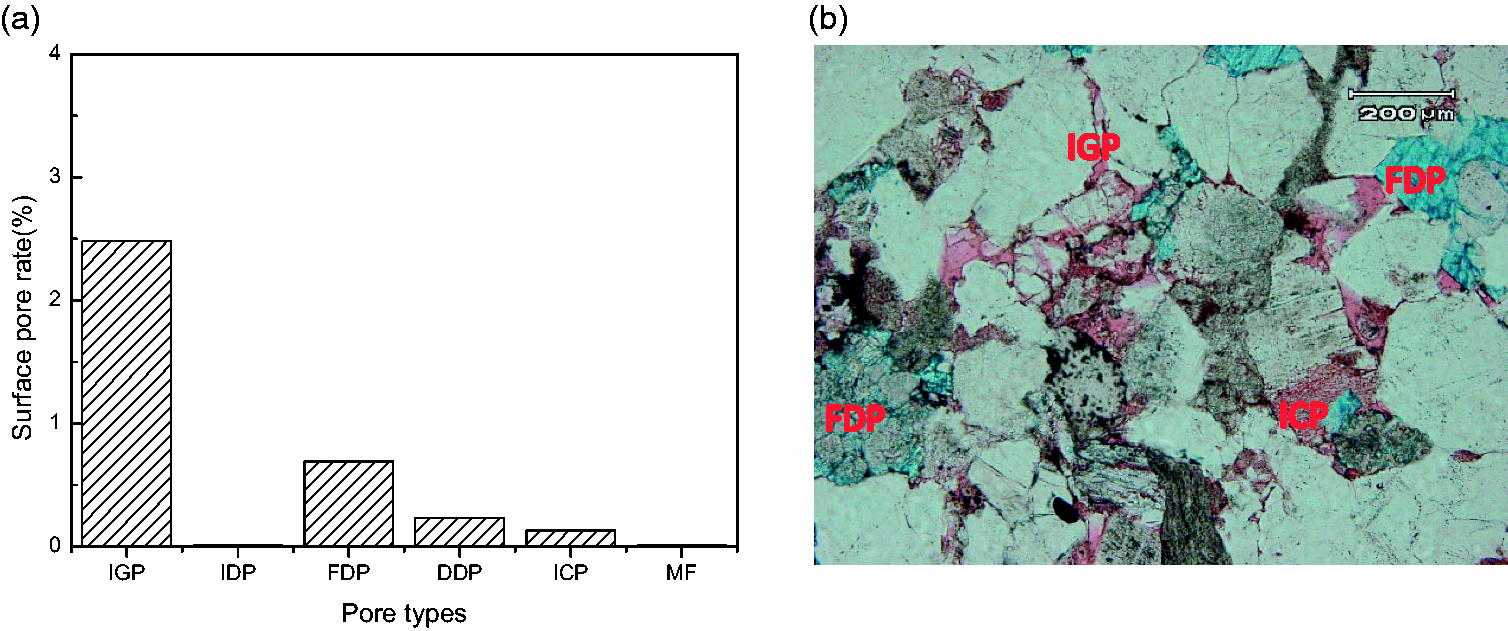
Reservoir rock pore strctures characteristics. (a) Distribution histogram of different pore types (b) Pore types under the thin section.
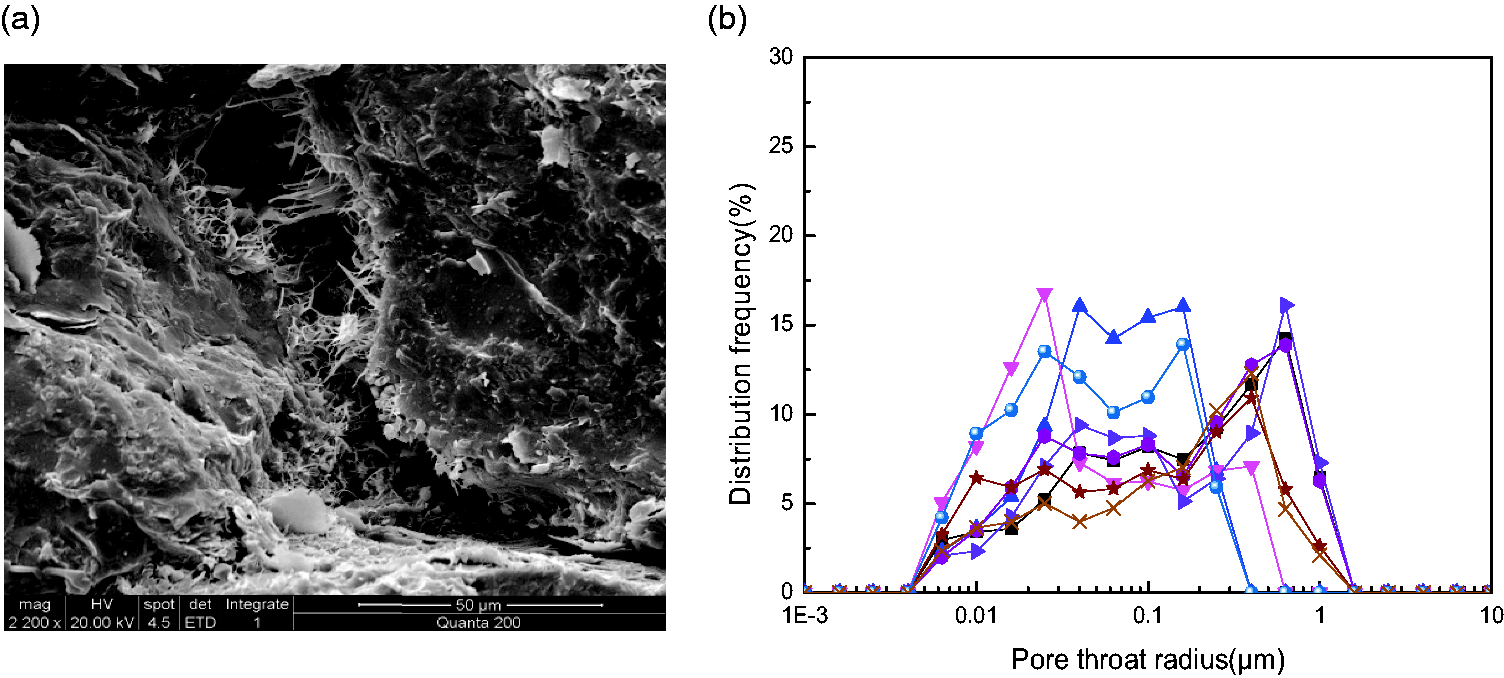
Clay minerals fill the pores and the pore throat radius shows a bimodal distribution characteristics based on the mercury injection experiment. (a) Clay mineral fills the pores (b) Pore throat radius distribution characteristics.
Figure 4 shows the reservoir electrical conductivity characteristics based on rock-electric experiment of 16 cores. It can be seen that in the double logarithmic coordinate system, the linear relationship between water saturation and resistivity increase rate is better than that between porosity and formation factors. According to the second Archie formula, the saturation index n of the study area is approximately 2.0. However, there is a large error of the cementation index m obtained by power exponent fitting of porosity and formation factor according to the first Archie formula. And it is necessary to establish a more effective saturation model based on the pore structure characteristics.
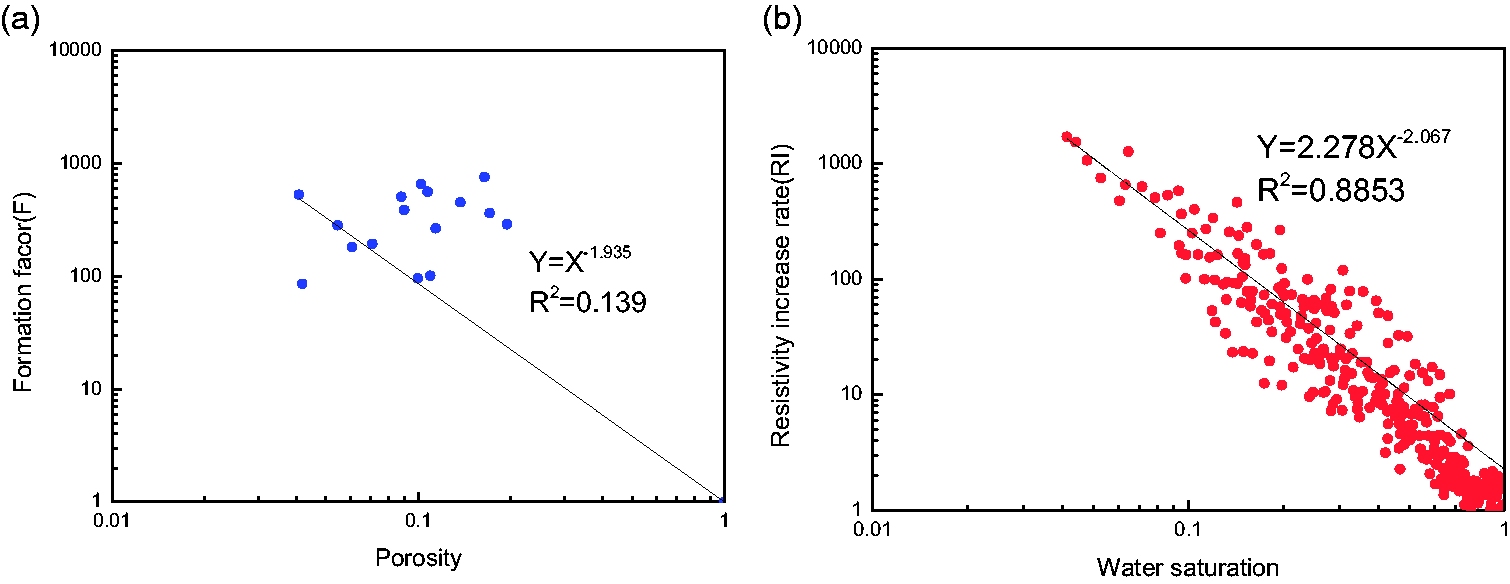
Reservoir electrical conductivity characteristics based on the rock-electric experiment of 16 cores: (a) The relationship between porosity and formation factor; (b) the relationship between water saturation and resistivity increase rate.
Variable m saturation calculation model
Model derivation
Dullien first proposed the basic concept of rock capillary bundle model in 1975, and it gradually become one of the important models to characterize porous media later(Adebayo, 2019; Ju et al., 2012). Capillary bundle model is to assume that pore space of rock is composed of a series of parallel unequal diameter and disconnected capillaries. The larger the pore is, the thicker the capillary radius is, and the smaller the pore is, the smaller the capillary radius is (Figure 5).
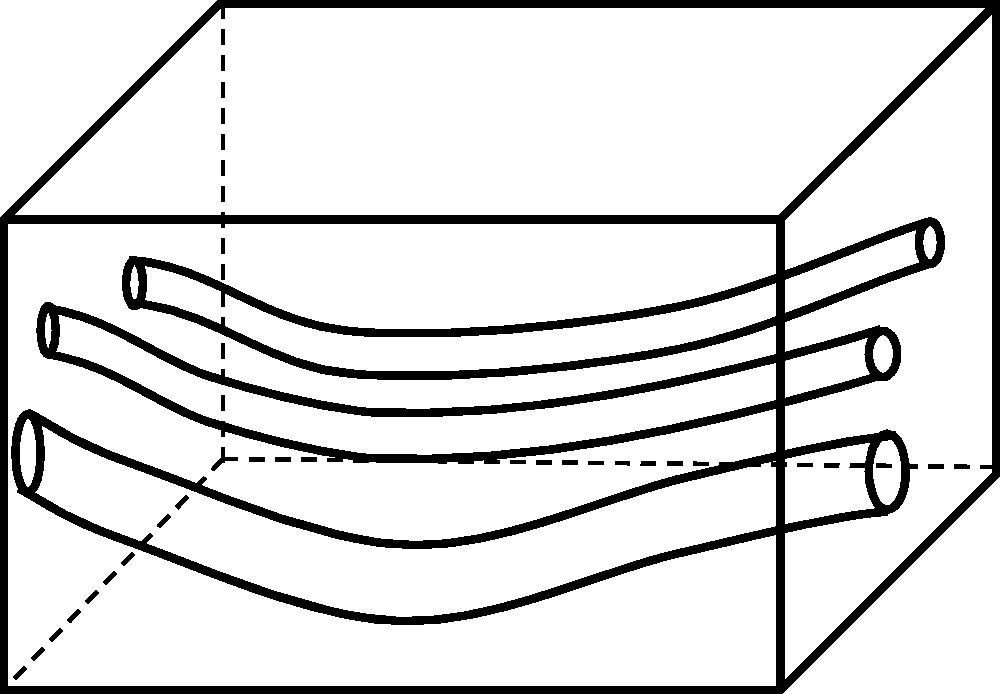
Schematic diagram of parallel unequal diameter capillary bundle theory.
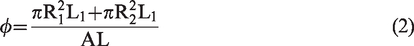
Based on the parallel unequal diameter capillary bundle model, rock pore space is equivalent to two parts: micro capillary bundle represents micro pore and coarse capillary bundle represents macro pore. Assuming that the cross-sectional area of the whole rock is A. The equivalent capillary bundle radius of the small pore is R1, and the equivalent capillary bundle radius of the macro pore is R2. The capillary lengths of the two pore space are the same, both are L1, and the total length of the whole rock is L. The specific equivalent rock capillary model is shown in Figure 6.
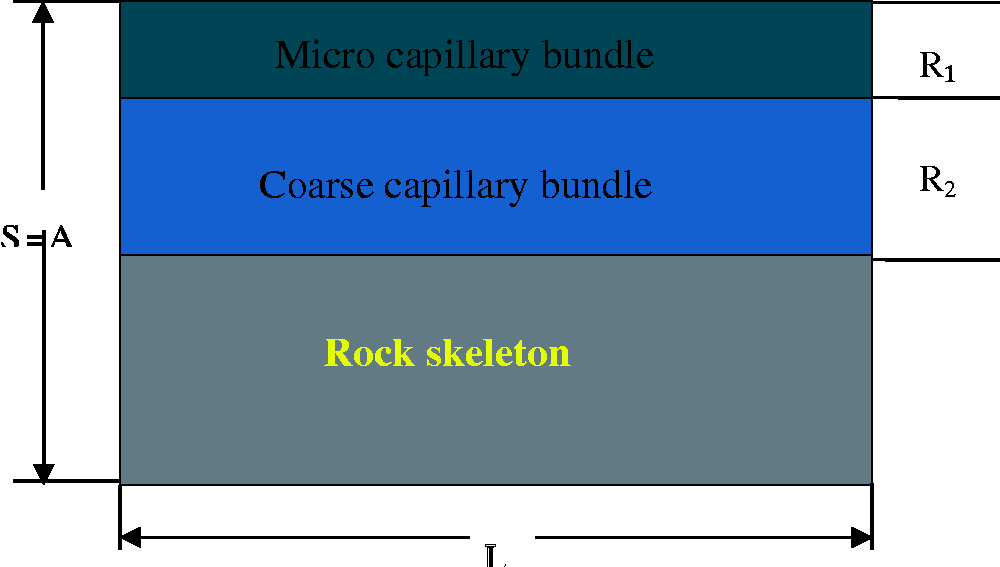
The equivalent rock capillary model.
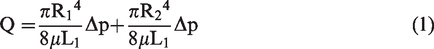
According to Poiseuille equation, the total flow through the core is expressed as the sum of the flow through the equivalent micro capillary bundle and the flow through the equivalent coarse capillary bundle, that is
According to Darcy's theorem
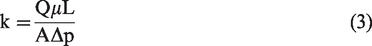
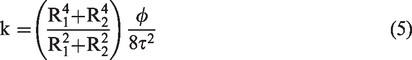
Since the capillary of the actual core is not parallel but curved, that is, the length of the capillary
It is considered that the rock skeleton and dry clay are non-conductive, so the resistance of water-saturated pure rock is equal to the parallel resistance of large pore and small pore, that is
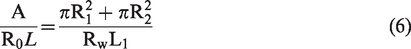
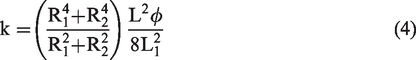
Substituting equation (2) and equation (5) into equation (7) and simplifying it, we can get the following equations
Based on Archie’s first formula
According to equation (9), the formation cementation index m is changing with the reservoir porosity, permeability and pore throat radius, instead of a constant value, which is more consistent with the characteristics of tight sandstone reservoir.
Calculation method of model parameters
Rock equivalent pore throat radius R1 and R2
The calculation of equivalent pore radius of micro pore and macro pore is the key to ensure the popularization and application of the proposed variable cementation index m saturation model. Mercury injection experiment is the most direct method to obtain the rock pore size, and the relationship between capillary pressure and pore throat radius for air-mercury system can be expressed as follows (Purcell, 1949)
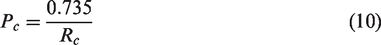
Figure 7(a) and (b) are the characteristics of NMR T2 spectrum distribution and mercury injection curves of 11 representative cores, respectively. The red solid dot is the average value of T2 spectrum distribution data and mercury injection data, which were used to reflect the comprehensive pore structure characteristics of reservoir in our study area.
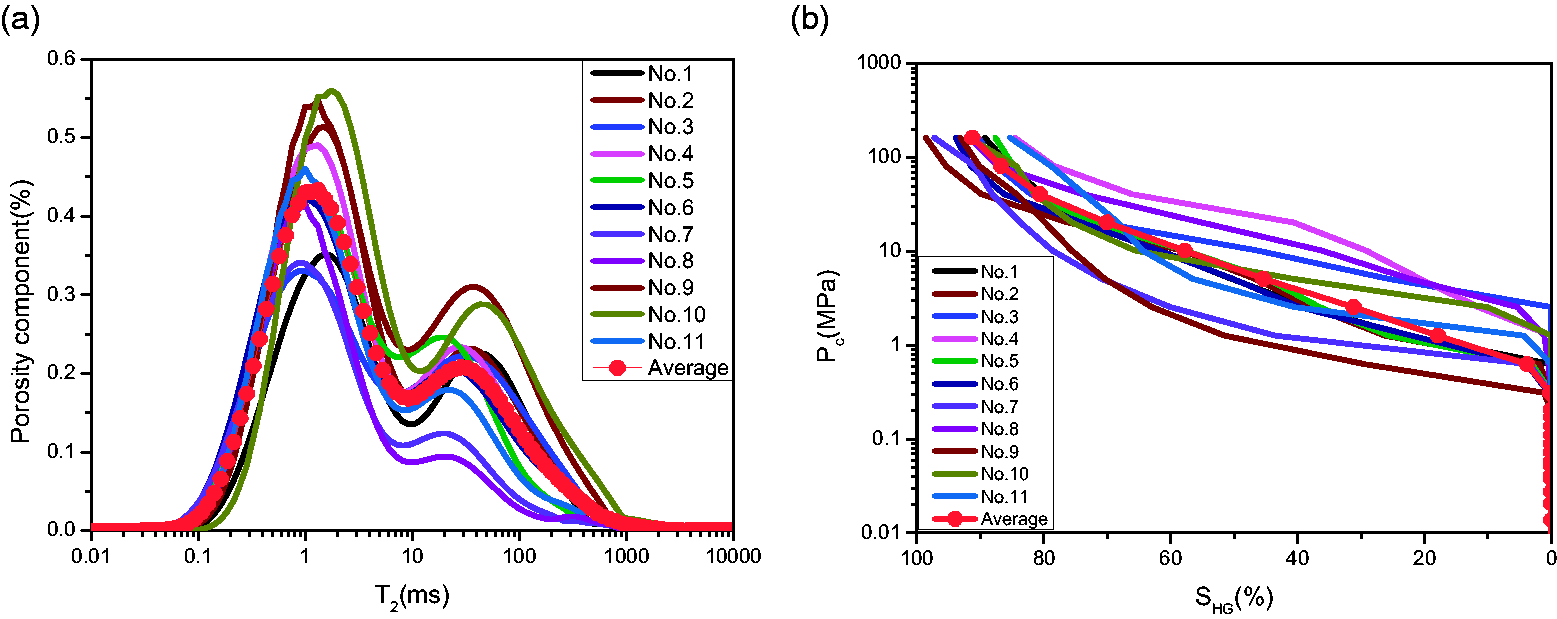
The characteristics of NMR T2 spectrum distribution and mercury injection curves. (a) NMR T2 spectrum distribution; (b) mercury injection curves.
In order to establish the transformational relation between NMR T2 data and pore throat radius, the average NMR T2 spectrum data were first processed and normalized to acquire the inverse cumulative curves, which contained similar shapes with average mercury injection curve. Then, the equisaturation principle proposed by Xiao et al. (2016) was used to extract the T2 time that corresponded to every Pc value under the same non-wettable saturation (Figure 8). Finally, the relationship between the extracted T2 time and the corresponding pore throat radius (Rc) is established in Figure 9. It can be seen that there is a good power exponential relationship between T2 time and pore radius, and the T2 time cut-off value of micro pore and macro pore is about 3.22 ms. In order to obtain a representative micro pore radius and macro pore radius at the same depth point, the porosity components corresponding to different T2 time are weighted and averaged to obtain the equivalent radius of micro pore and macro pore at different depth points. The calculation formula of equivalent pore throat radius is as follows
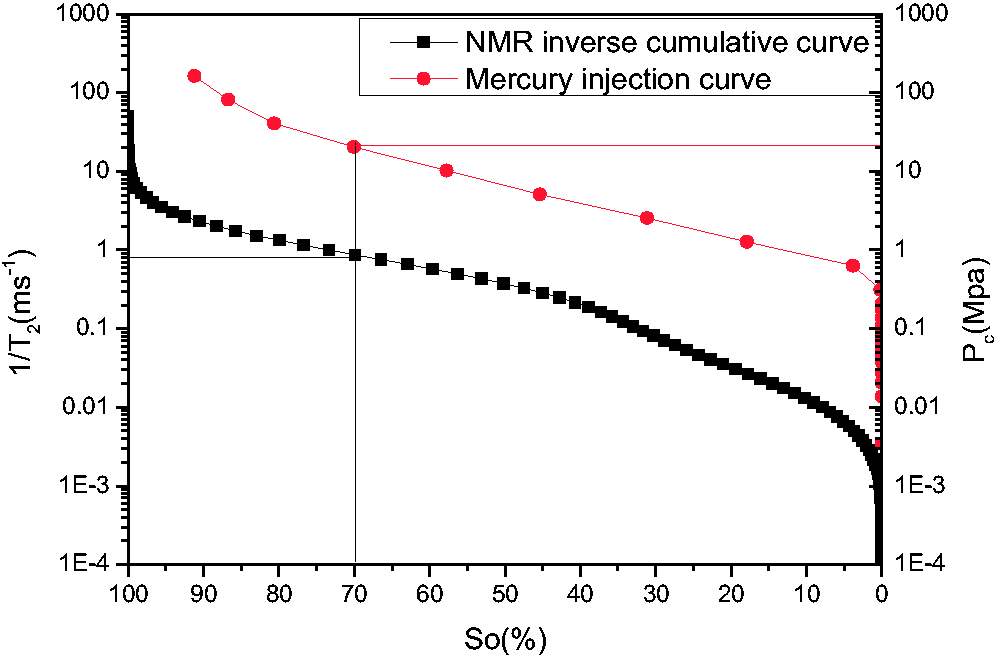
Principle of acquiring the T2 time that corresponded to every Pc under the same non-wettable saturation: based on the equisaturation method, a given non-wettable saturation was first determined. Next, a line, which passed the give non-wettable saturation and was perpendicular to the x-axis, was drawn. This line would both cross to the Pc and NMR inverse cumulative curve; the corresponded Pc and 1/T2 would be extracted.
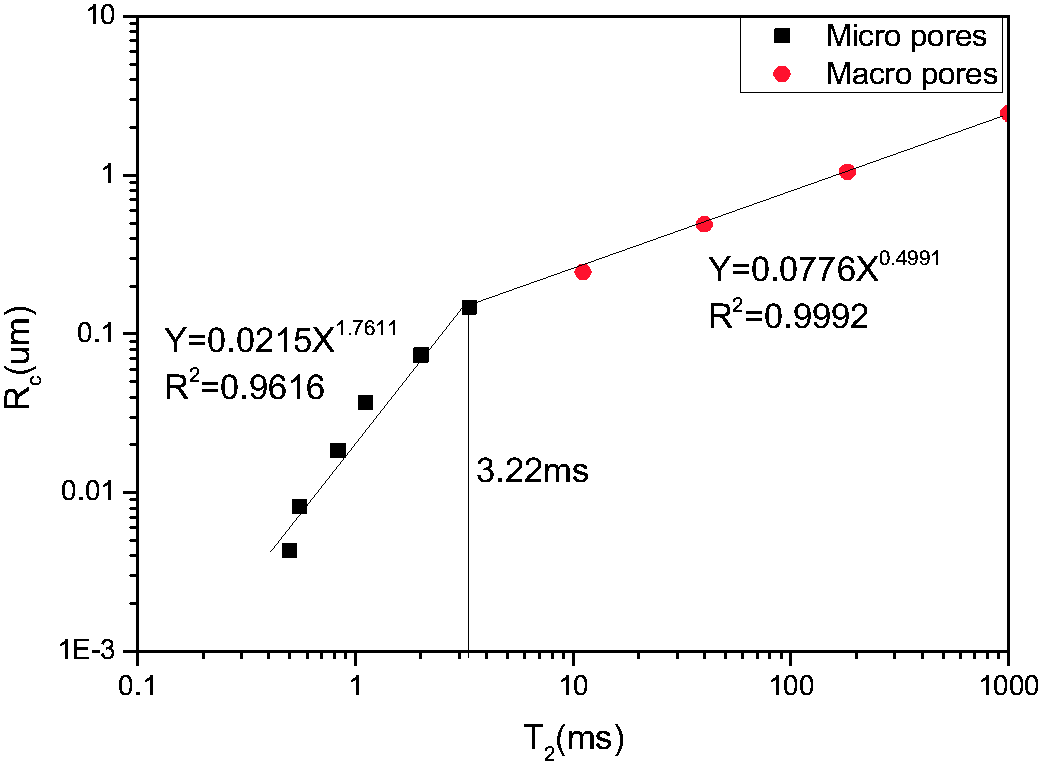
Relationship between the NMR T2 time and pore throat radius.
Reservoir porosity and permeability
The porosity and permeability are also two important parameters in the variable cementation index model. In general, the NMR logging has a unique advantage in evaluating reservoir permeability (Liu et al., 2017). However, it is worth noting that when using SDR model or Coates model to calculate permeability, it is still necessary to determine the appropriate model parameters by using a large number of core NMR experimental data. If the model parameters are not accurate or the default parameters are used, there will be great errors in the calculated permeability. In our study area, there are 11 cores NMR experimental data were collected, while the experimental data of overburden porosity and permeability are nearly 206 cores. Therefore, this paper still uses the conventional fitting method to determine the porosity and permeability calculation model of the reservoir (Figure 10). The detailed calculation formula is as follows


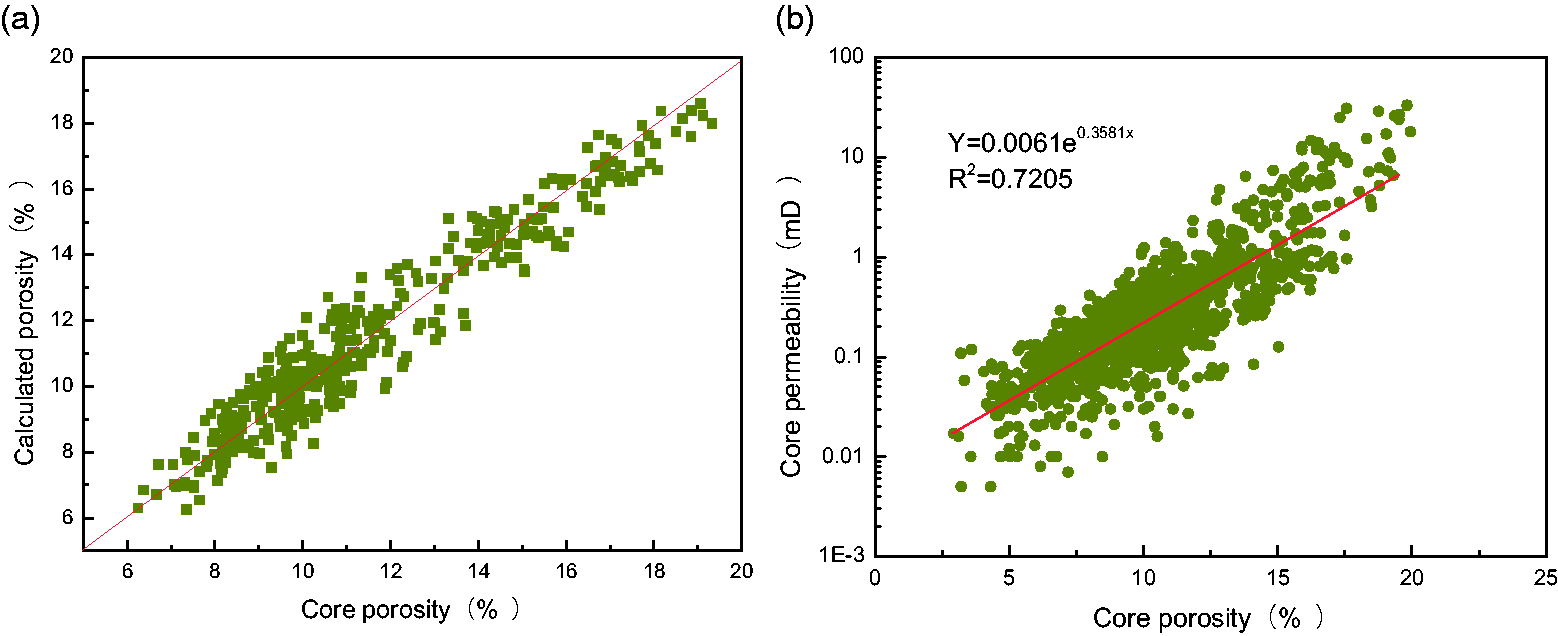
The calculation model of reservoir porosity and permeability: (a) the comparison results of porosity calculated by logging curves multiple regression and core porosity; (b) is the relationship between the core porosity and core permeability.
Verification of variable m model
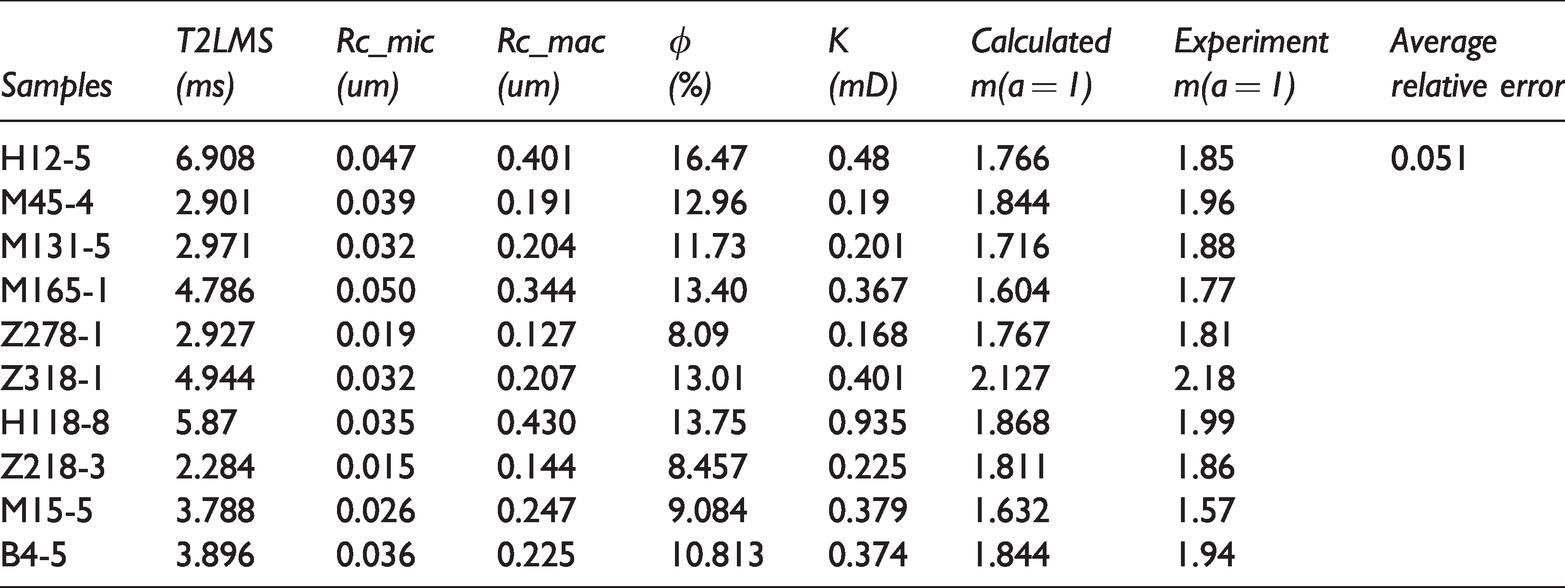
In order to test the reliability of the variable m model proposed in this paper, the NMR experiment data and overburden porosity and permeability experiment data of 10 cores in the study area were used to calculate the cementation index m based on the equation (9), and then the calculated m is compared with the corresponding rock electrical experiment results, as shown in Table 1. It can be seen that the difference between the calculated m based on the equation (9) and the m obtained by rock-electric experiment is relatively small, and the average relative error is 0.051, which indicates that the derived variable m model is feasible and effective.
Comparison between calculated m based on variable m model and obtained by rock-electric experiment.
Application effects analysis
In order to illustrate the application effect of the proposed variable m saturation calculation method, the saturation logging interpretation of tight sandstone reservoir is carried out in our study area.
Figure 11 is the result of saturation log interpretation of a sealed coring well. The first track is depth track, and from the second track to fourth track are the original log curves of resistivity log, porosity log and lithology log, respectively. The fifth track is the T2 spectrum characteristics of NMR log, and the black solid line is the geometric mean of T2 time. The sixth track is the equivalent pore throat radius of micro pore and macro pore calculated by NMR logging. The red solid line in the seventh track and eighth track are the calculated porosity and permeability. The ninth track is the logging lithology profile. The blue solid line, green solid line and red solid line in tenth track are the saturation calculated by classical Archie model, Indonesia model and the proposed variable m saturation model, respectively. The black solid stick is the saturation data analyzed from sealed cores. It can be seen that saturation calculated by proposed variable m saturation calculation method is the most consistent with the sealed coring data than that calculated by the classical Archie model and Indonesia model.
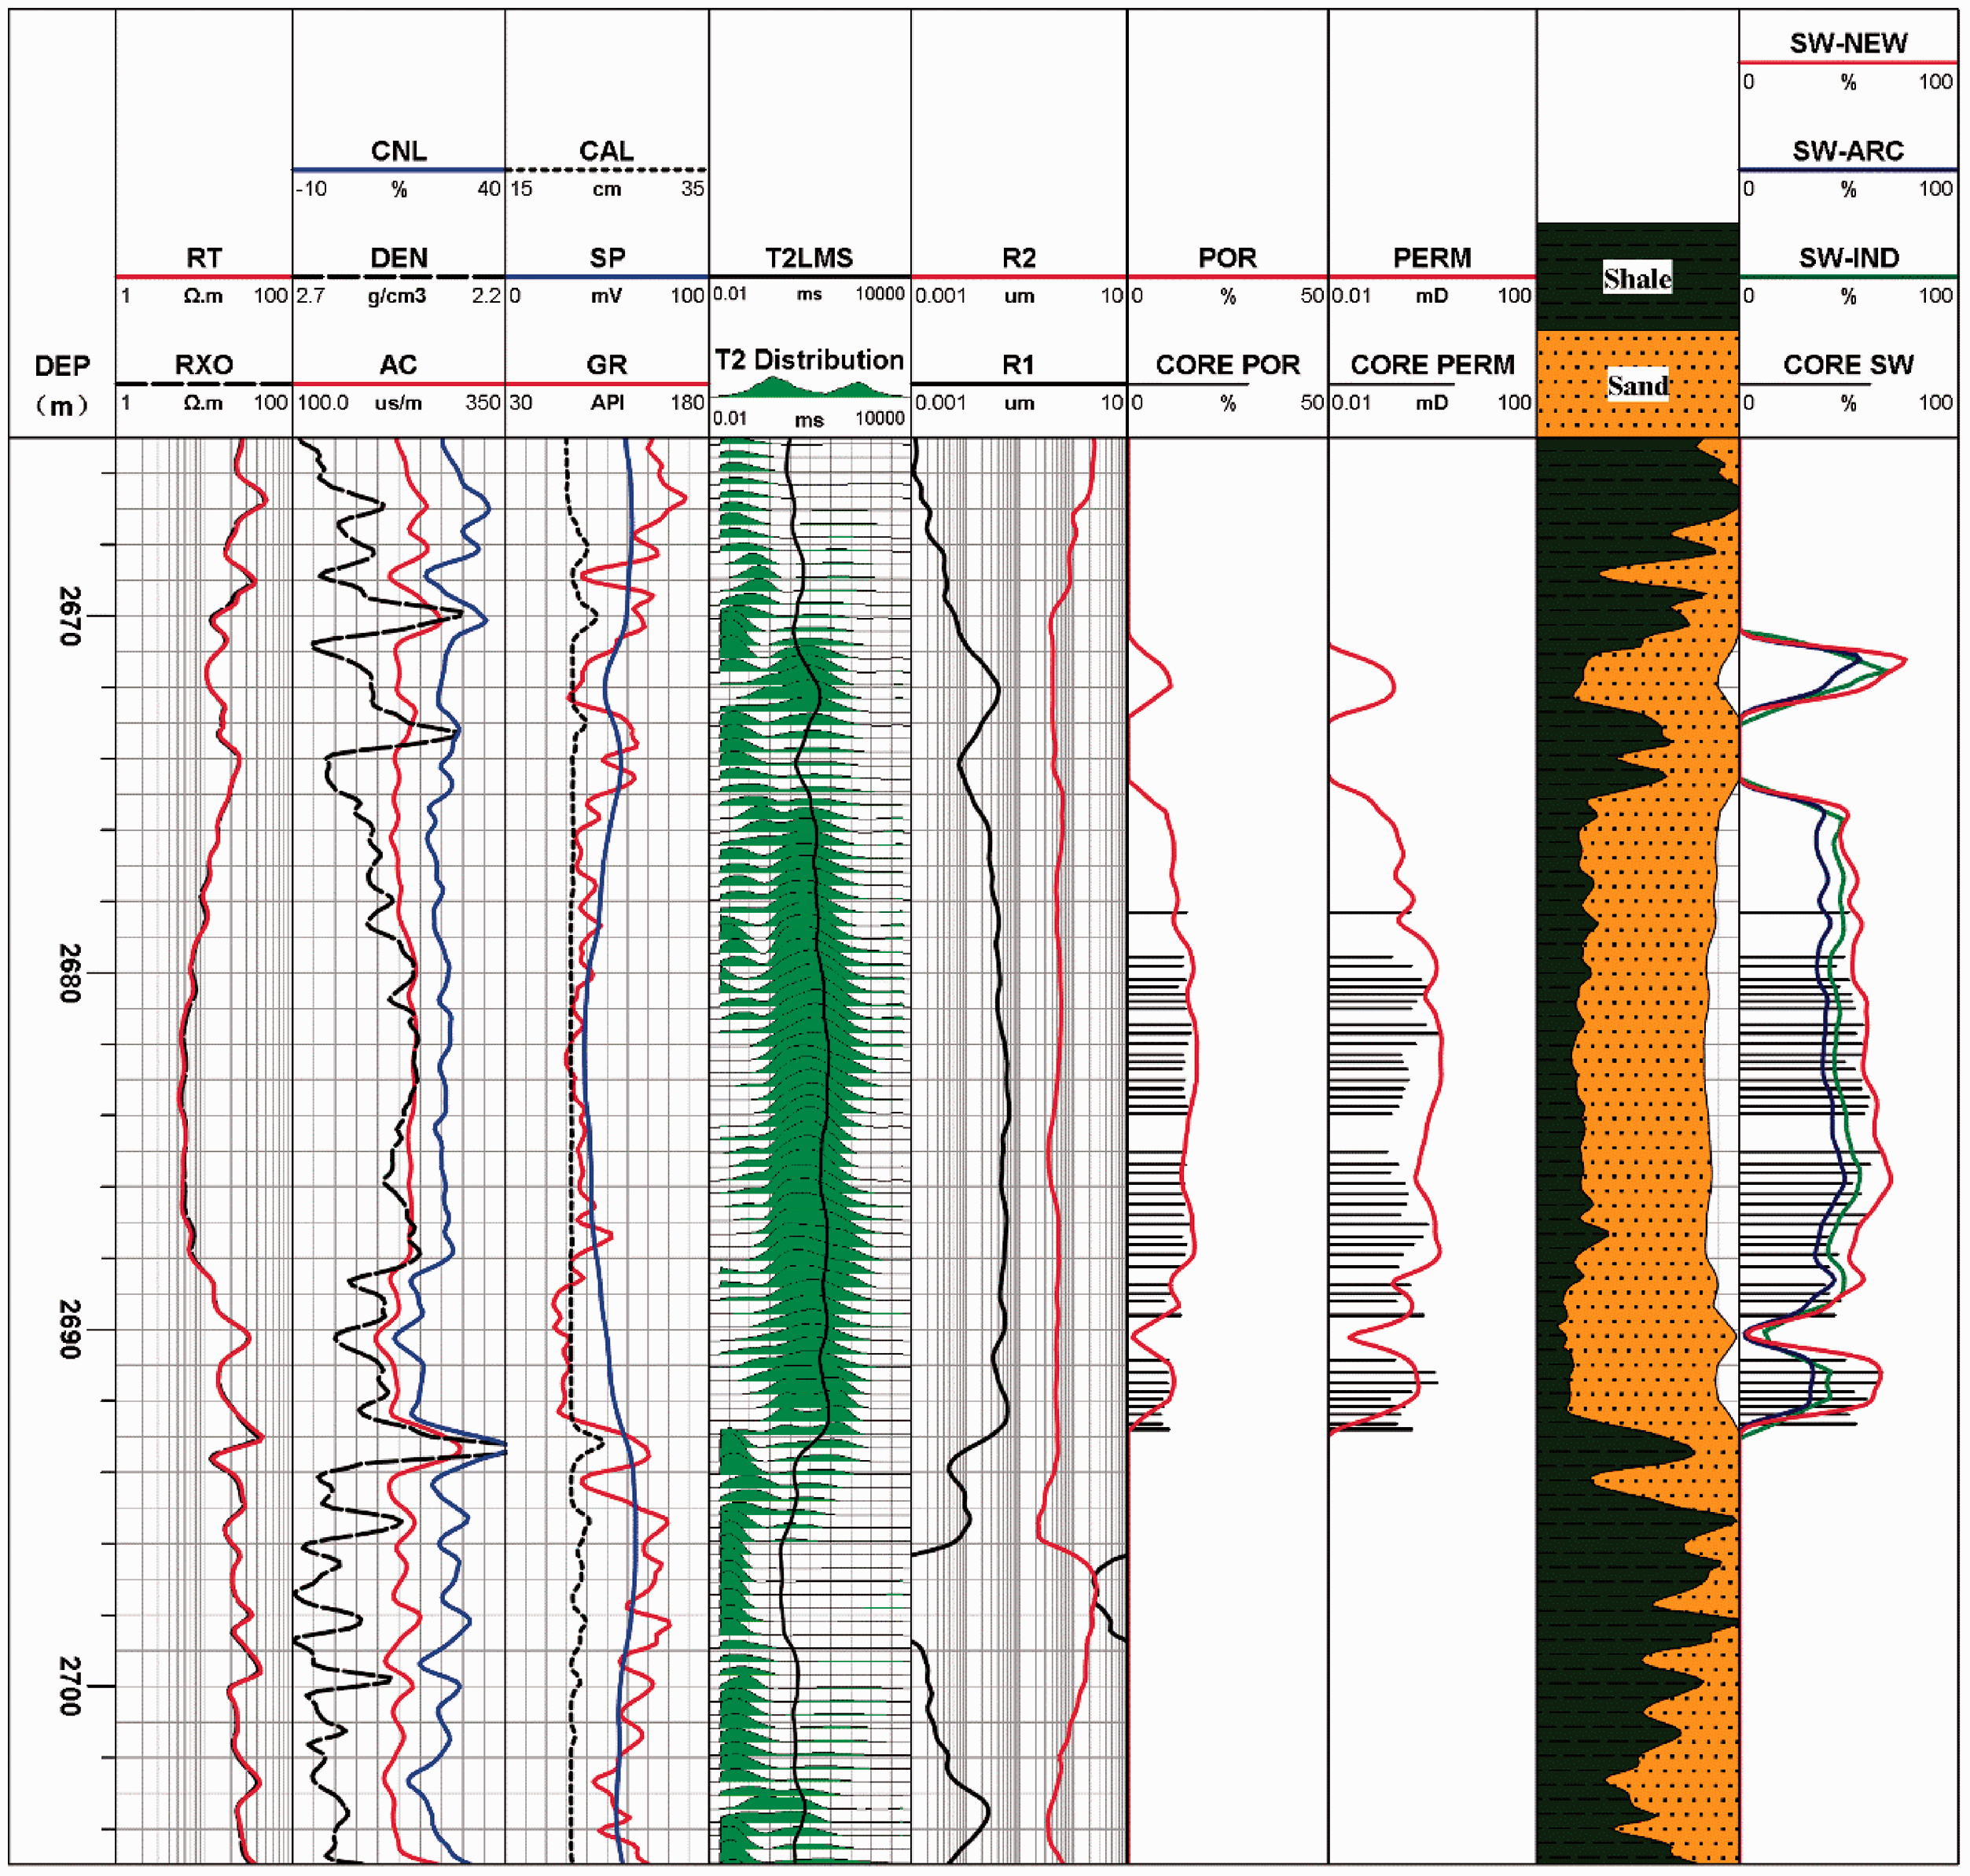
An application example of the saturation logging interpretation.
Besides, the calculated saturation of the variable m model, classical Archie model and Indonesia model are compared with the saturation analysis data of 125 sealed cores from 9 wells (Figure 12). Results show that the average relative error of saturation calculated by the variable m model is within 7%, which is lower than that of the classical Archie model and Indonesia model. And it further verifies the reliability of the proposed saturation calculation method.
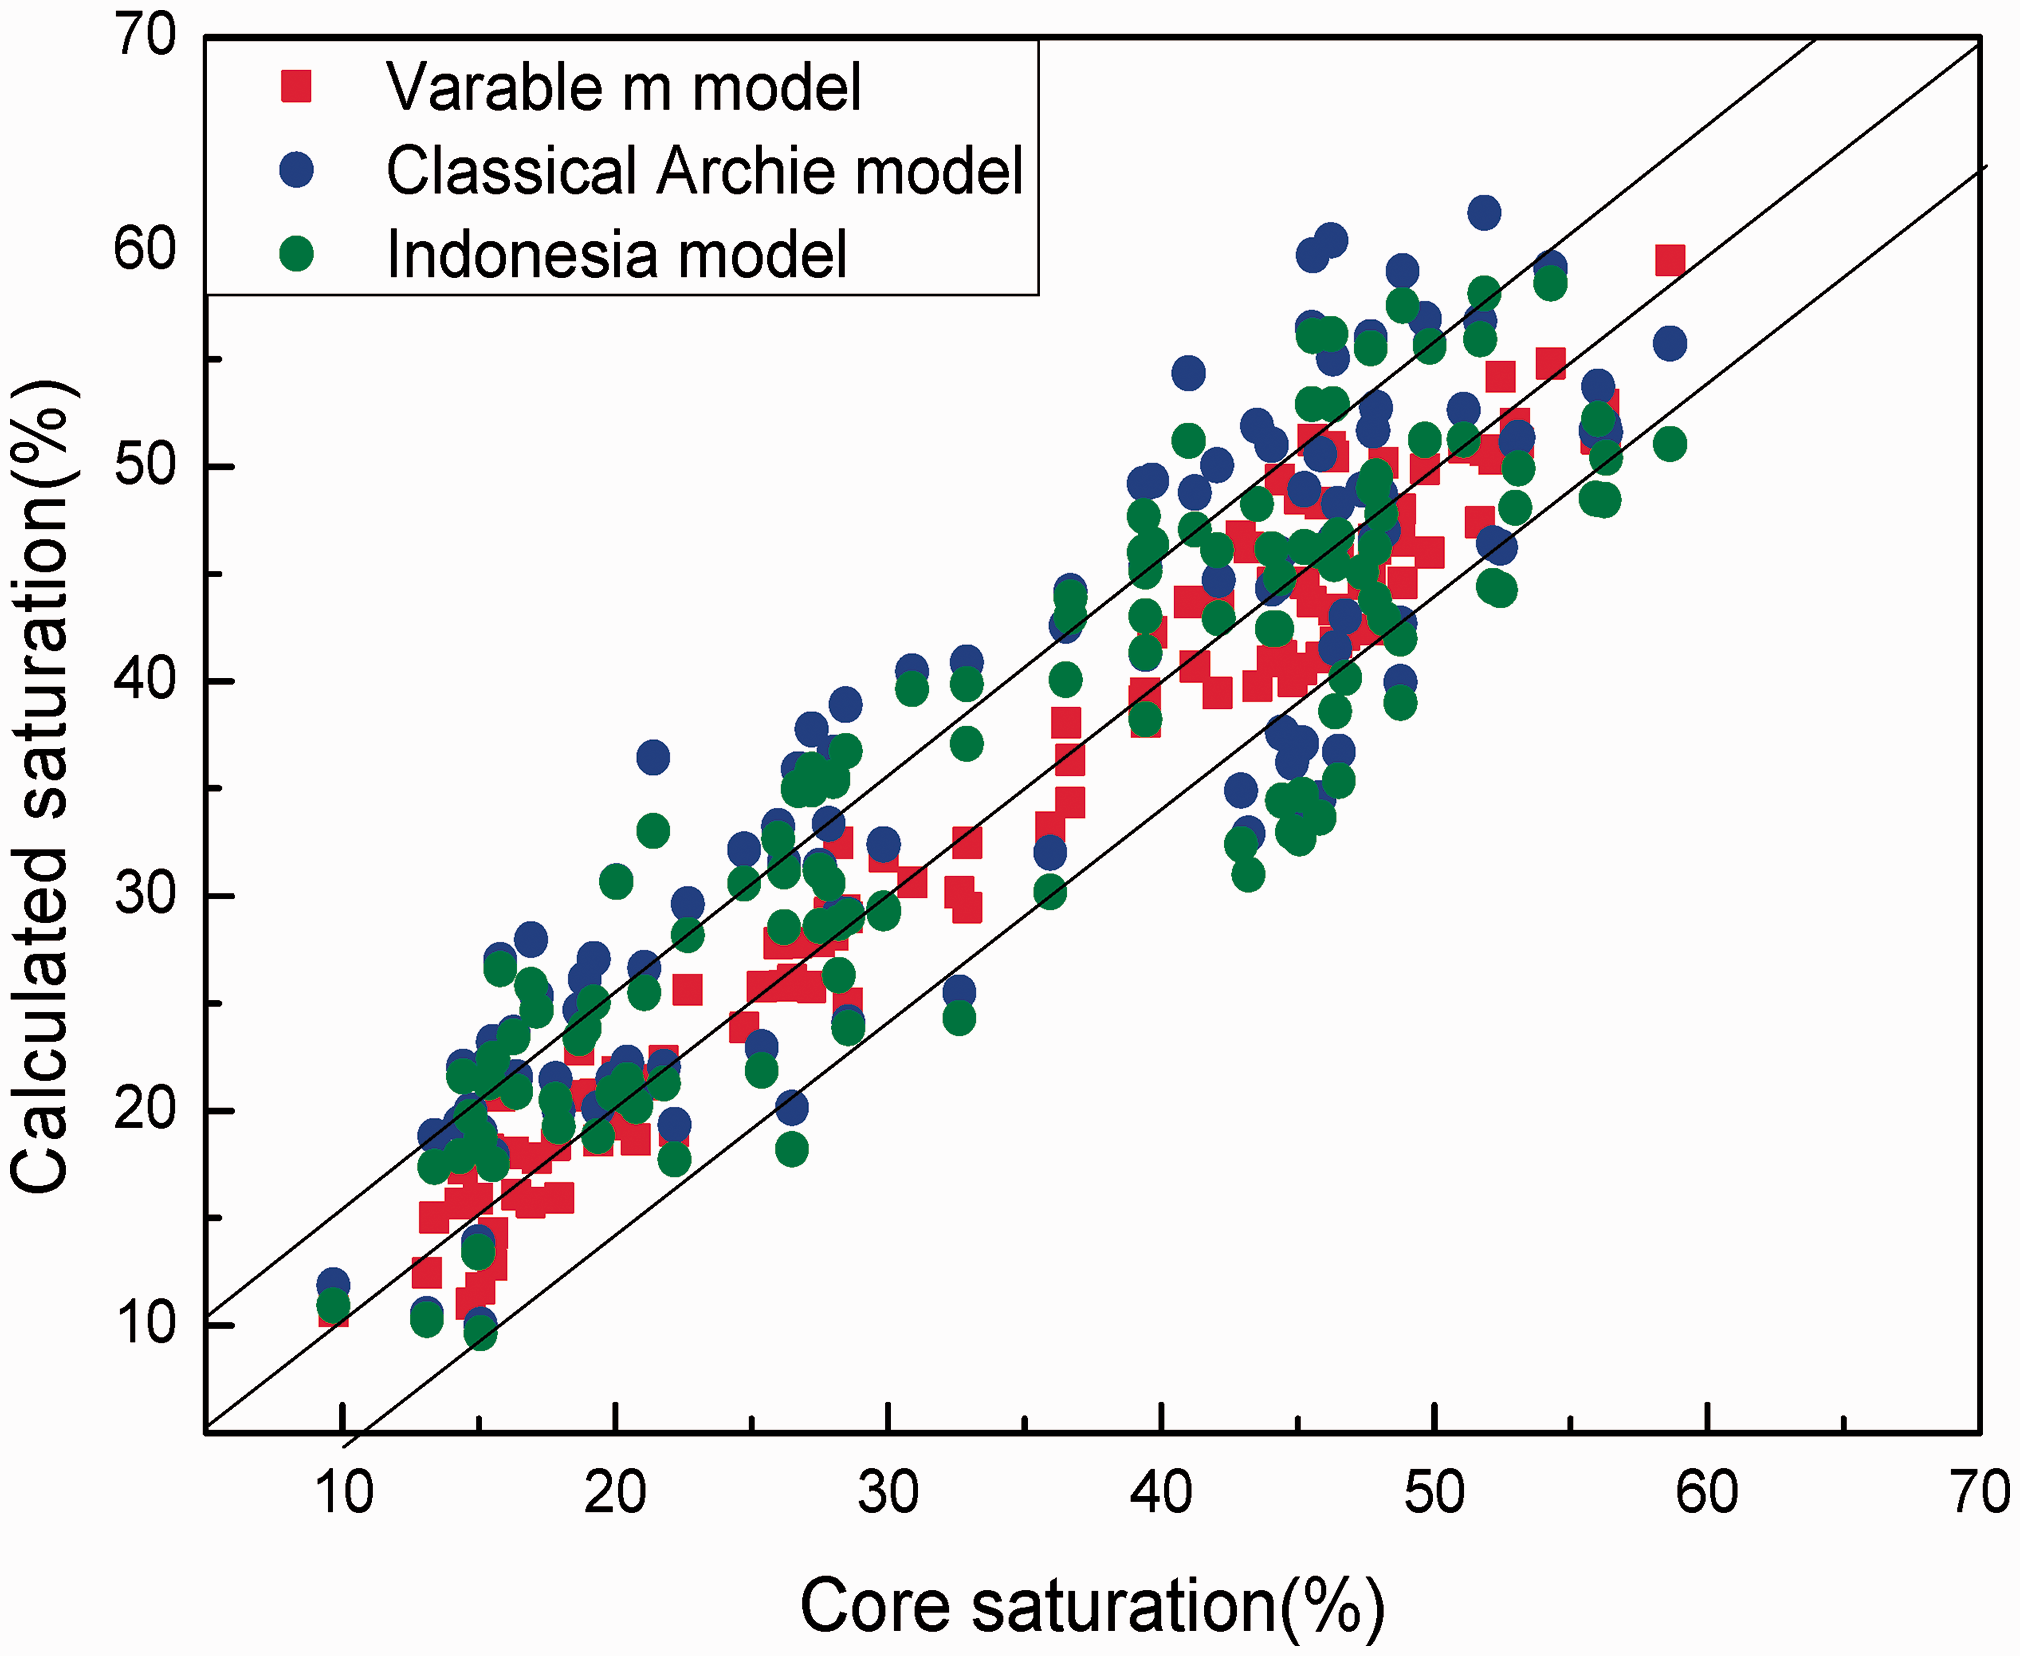
Comparison of calculated saturation between the variable m model, classical Archie model and Indonesia model.
Conclusions
Chang 8 tight sandstone reservoir in Longdong West area of Ordos Basin has low porosity and low permeability, and large number of clay minerals fill the pores leading to the complexity of pore structure. The pore throat radius of reservoir shows a bimodal distribution characteristics, and the relationship between porosity and formation factors is nonlinear in double logarithmic coordinate system. Based on the equivalent rock capillary bundle theory, pore space is equivalent to the parallel connection of micro capillary bundle representing the micro pores and coarse capillary bundle representing macro pores. And the improved Archie model of variable cementation index(m) saturation calculation method is established by using Poiseuille flow equation and Darcy's law. During calculation of model parameter, the T2 spectrum data of NMR was used to calculate the equivalent radius of reservoir micro pores and macro pores, which ensured the popularization and application of the proposed saturation calculation method. Besides, the calculated m was compared with the m obtained by the rock-electric experiment, which verifies the correctness of the variable m model. The application result shows that saturation calculated by the proposed variable m model is the closest to the analysis data of sealed coring than that calculated by the classical Archie model and Indonesia model, and the average relative error is controlled within 7%, which proves that the proposed saturation calculation method is effective in the evaluation of tight sandstone reservoir.
Footnotes
Declaration of conflicting interests
The authors declared no potential conflicts of interest with respect to the research, authorship, and/or publication of this article.
Funding
The authors disclosed receipt of the following financial support for the research, authorship, and/or publication of this article: This paper is sponsored by National Natural Science Foundation of China (41774144), National Major Projects “Log Interpretation and Evaluation of Complex Oil and Water Layers” (2016ZX05050), The Introduced Talent Fund of Anhui University of Science and Technology (13200427).