
Abstract
Tight sandstone reservoirs typically show a wide pore size distribution, which ranges from several nanometers to several hundred micrometers, requiring a combination of several techniques to properly characterize the pore structure characteristics. In this article, scanning electron microscopy, nitrogen gas adsorption, pressure-controlled porosimetry, and rate-controlled porosimetry were applied to investigate the pore systems of five tight samples of Yanchang Formation in Upper Triassic Ordos Basin China. Pore throat types and shapes were qualitatively identified and classified by scanning electron microscopy and nitrogen gas adsorption, and pore size distribution was calculated by combination of nitrogen gas adsorption, pressure-controlled porosimetry, and rate-controlled porosimetry, which is proposed as a new method to obtain the overall pore structure characteristics of tight sandstone reservoirs; then analyzing microscopic pore structure controls of permeability stress sensitivity of tight sandstone reservoirs. Results indicate that three typical pore types exist in tight sandstone reservoirs, which are interparticle pores, grain dissolution pores and micro cracks, and pore shapes contain sheet and bent sheet, cylindrical, and bottle neck shapes. Pore size distribution develops from nano-micrometer scale completely in tight sandstone reservoir, nitrogen adsorption experiments can accurately characterize nanometer scale pore size distribution mainly ranging 2–50 nm; nano-micrometer scale pore throats distribution characteristics are quantitatively analyzed by pressure-controlled porosimetry and rate-controlled porosimetry, pore throats radius ranges 10 nm–40 µm using the former, pores radius ranges mainly 80–300 µm, throats radius ranges 100 nm–5 µm and pore throat ratio difference is bigger by the latter, and the pore throat structures determine the typical reservoir characteristics in Ordos basin. The emphasis of study on mechanism of permeability stress sensitivity currently is microscopic pore throat structures instead of macroscopic permeability, indicating that the strongest is micro cracks and neck pores, intergranular cylindrical pores and intragranular dissolution pores is the weakest. This is significant to the development of tight sandstone reservoirs.
Keywords
Background
Tight sandstone reservoirs refer to reservoirs that have less than 1 × 10 − 3 µm2 (overburden pressure matrix permeability is less than 0.1 × 10 − 3 µm2) air permeability and less than 10% porosity (National Energy Administration (NEA), 2011; Pramudito, 2008; Surdam, 1997). In recent years, the tight oil, tight gas, shale oil, and other unconventional oil and gas resources have had an impact on business development in the United States, Canada, Australia, and other several countries. Tight sandstone reservoirs now occupy an important position in the global energy structure (Chen et al., 2011b; Kuuskraa et al., 2013; Xu and Li, 2012). Tight sandstone oil and gas widely distribute in Sichuan, Ordos, and Songliao basins, which are rich in oil and gas resources, and oil and gas production is more than 50% of the total domestic production (Huang et al., 2014; Jia et al., 2012; Zou et al., 2012a). Different from conventional reservoirs, tight reservoirs have poor material properties, complex pore structures, and wide pore size distribution. Therefore, it is important and efficient for reservoir evaluation and oil development to accurately characterize pore structure characteristics of tight reservoirs (Chalmers et al., 2012; Loucks et al., 2009; Zou et al., 2012b).
Current technologies that characterize pore structure characteristics mainly include scanning electron microscopy (SEM), X-ray computer tomography (CT), nuclear magnetic resonance (NMR), mercury intrusion porosimetry (MIP), nitrogen gas adsorption (NGA), and small angle neutron scattering (SANS). However, all these technologies have some limitations in characterizing pore structure of tight sandstone reservoirs. SEM can observe qualitatively pore structure characteristics such as size, shape and type, but the pore three-dimensional distribution state cannot reconstruct and pore connectivity lacks quantitative analysis (Lame et al., 2004; Ying et al., 2002). Multi-scale CT scans can reconstruct three-dimensional pore throat structure characteristics using X-ray scanning, which can obtain nano, micro, and millimeters scales pore throat structures (Gelb et al., 2011; Sakdinawat and Attwood, 2010), but it is difficult and expensive to identify pores that are less than 50 nm, which is not suitable for tight reservoirs research (Blunt et al., 2013; Guan et al., 2011). NMR experiments can quantitatively evaluate pore spaces, and can directly observe the signal of rock pore structure characteristics, but its prediction for pore structure of tight reservoirs is still being explored (Li et al., 2015; Schmitt et al., 2014; Wang et al., 2010). NGA experiments test nanometer scale pore structure characteristics (pore types and pore size distribution, specific surface and pore volume) of tight reservoirs using adsorption–desorption curves, but the disadvantage is this experiment narrowly measures pore distribution range, mostly nanopores (Clarkson et al., 2013; Liu et al., 2015). MIP experiment is one of the primary methods that tests rock capillary pressure curves, mainly containing pressure-controlled porosimetry (PCP) and rate-controlled porosimetry (RCP) experiment. RCP can be separately measured by capillary pressure curves of pore and throat, but mercury saturation is low, which can not reflect comprehensive pore-throat information (Li et al., 2013). PCP test range is wide, and mercury ejection curve can reflect the characteristics of the porous media, the disadvantage is that it can only test throat radius with pore information (Yang et al., 2013b).
In recent years, scholars around the world have applied these methods to test pore structure characteristics of tight sandstone reservoirs. Curtis et al. (2010, 2011) and Desbois et al. (2011) intuitively analyzed pore structure characteristics of tight reservoir using SEM. Echeverria et al. (1999), Green et al. (2011), and Nie et al. (2015) probed nano-micrometer scale pore size distribution of different coal rank coalbed by gas adsorption experiment. Ross and Bustin (2009), Clarkson et al. (2012), Romero-Sarmiento et al. (2014), Sun et al. (2015), and Xiong et al. (2015) studied shale pore structure characteristics using gas adsorption experiment. Zhu et al. (2008, 2015) and Zhao et al. (2015) analyzed pore structure characteristics of tight reservoirs and discussed the influence on permeability by pressure-controlled porosimetry and rate-controlled porosimetry experiments. Xie et al. (2006), Clarkson et al. (2013), Yang et al. (2013a), and Schmitt et al. (2013) analyzed shale pore structure characteristics combined mercury intrusion method with nitrogen adsorption. First of all, through the analysis of the predecessors' research, the nitrogen adsorption experiments were more applied to coal and shale reservoirs; however, the application to tight sandstone reservoir rarely happened; secondly, the combination of these experiments can foster strengths and circumvent weaknesses as well as better characterize pore size distribution of tight reservoir from nano-micrometer ranges and microscopic pore structure characteristics from qualitatively to quantitatively.
Tight sandstone reservoirs have several pore types and wide pore size distribution. It is the key to accurately characterize multi-scales pore structure of reservoirs. Loucks et al. (2012) proposed a new pore size classification scheme, which is definitely sufficient in the petroleum industry. In this scheme, nanopores range from 1 nm to 1 µm, micropores range from 1 to 62.5 µm, and mesopores from 62.5 µm to 4 mm. In this article, SEM, NGA, PCP, and RCP were applied to investigate the pore systems. The goals were (a) to intuitively analyze pore types and shapes characteristics of tight reservoirs, (b) to quantitatively investigate pore size distribution from multi-scales and research the features of oil and gas existence of different pore characteristics, and (c) to evaluate the influence of microscopic pore structure characteristics of tight sandstone reservoirs to permeability stress sensitivity.
Samples and experimental theories
The typical tight samples
Experimental samples are mainly from Ordos basin, northern China, which is second largest basin of China. Divided into Chang 1–Chang 10 from top to bottom, the upper Triassic group is an important tight reservoir in Ordos basin. Coring layer is Chang 6 Formation, and coring region is mainly located in shallow underwater distributary channels, bays and river mouth bars, and lithology is mainly composed of siltstone, argillaceous siltstone and mudstone, which are characterized by interbed distribution (Deng et al., 2011; Fu et al., 2010; Wang et al., 2014; Yao et al., 2013).
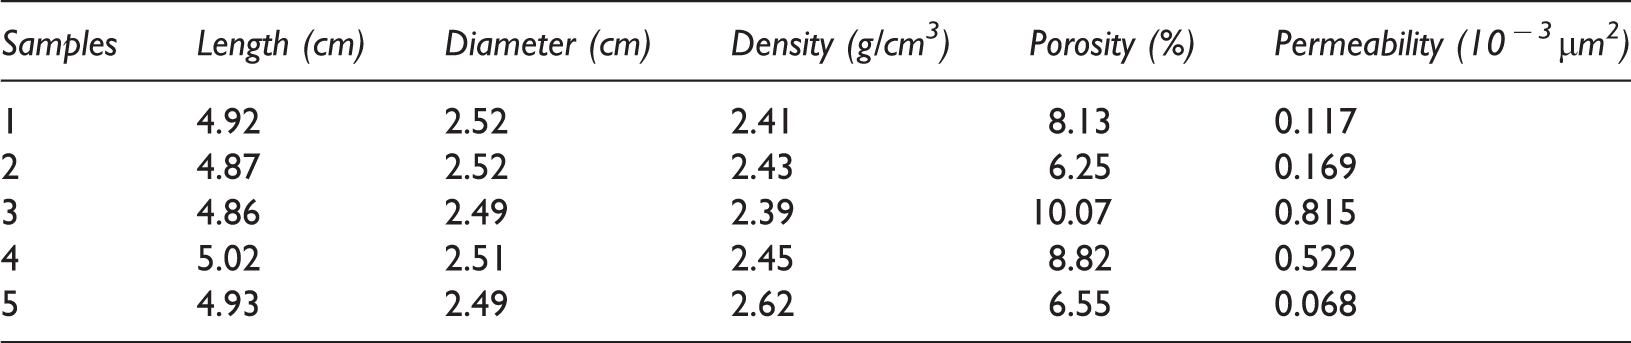
Parameters of testing samples.
Experimental theories
SEM
FEI Quanta 200 F SEM was used to examine pore type and shape of samples, the accelerating voltage, and resolution of SEM were 30 kV and 1.2 nm, respectively, magnification of 25-200,000. Fragments were first mechanically polished to make the ion beam bombardment samples surface avoid the mechanical damage to the sample surface polishing process and retain the real samples surface pore configuration. Thickness of the samples should be no more than 0.1 cm. All samples were golden-coated and placed for secondary electron (SE) imaging, back scatter electron (BSE) imaging, and energy dispersive spectroscopy (EDS) mineral identification.
Low temperature NGA
The NGA experiments were conducted on a QUADRASORB SI apparatus on samples. The samples prepared for adsorption analysis were outgassed at 120℃ for about 12 h under high vacuum to remove air, free water, and other impurities, prior to pore structure analysis. The instrument can measure the diameter in the range of 0.35–400 nm, the minimum measurable specific surface area to 0.0005 m2/g, the minimum detectable pore volume to 0.1 mm3/g. Under 196.15℃, different partial pressure of nitrogen adsorption and desorption isotherm were test, nitrogen adsorption isotherms were obtained for the relative pressure (P/P0) (the gas pressure/the saturated vapor pressure) ranging from 0.01 to 0.995. Based on multiple adsorption theories, such as Brunauer Emmett Teller (BET), Langmuir, Barrett Joyner Halenda (BJH), T-Plot, MK-Plate, H-K, Dubinin Radushkevich (D–R), pore structure parameters were automatically calculated by the computer software. BET, BJH, and H-K methods are used for PSD, BET, Langmuir, and T-Plot for SSA, and D–R and BJH approaches for pore volume.
Mercury intrusion experiments
Pressure-controlled porosimetry (PCP) was performed on a Pore Master PM33-13 mercury porosimeter following the standard SY/T 5346-2005 of China. Maximum intrusion pressure was 80 MPa, corresponding to a pore throat size of 9.2 nm. After reaching the highest pressure, the pressure was then gradually decreased and the mercury extruded from the samples. In PCP experiments, both intrusion and extrusion curves were obtained.
Rate-controlled porosimetry (RCP) was performed on an ASPE-730 following the standard Q/SYDQ1531-2012 in China. Mercury intrusion rate was a quasi-static constant value of 0.00005 mL/min, and maximum intrusion pressure was 7 MPa (1000 psi) to keep the intrusion rate quasi-static, which corresponds to a pore throat size of 0.105 µm. Each pore shape change will cause the change of mercury meniscus shape, and then the capillary pressure changes in the system. Data obtained were altered using the correction curve obtained from the stainless steel blanks to correct the data for the effects of the instrument and compressibility.
Experimental results
Pore types
Rock samples of Chang 6 Formation are located in Ordos basin, which is typical tight sandstone reservoirs of China, and has complicated diagenesis, multiple pore types and shapes (Wang et al., 2011; Wu et al., 2013). Fragments were first polished by argon ion polishing technology, then SEM and energy spectrum were used to observe nano-micrometer scale pore throat structure, which can clearly show the microscopic pore structure characteristics and intuitive analysis of pore types and morphological characteristics of tight sandstone reservoirs. Pores were identified by SEM images and were classified into four types, which are interparticle pores, intraparticle dissolution pores, and micro cracks (Figure 1).
Typical pore types and shapes found in the tight oil sandstone samples by SEM. (A) Sheet interparticle pores (sample 1), (B) cylindrical interparticle pores (sample 3), (C) necking interparticle pores (sample 5), (D) residual interparticle pores coated by chlorite (sample 2), (E) clay mineral dominated intergranular pores (sample 1), (F) quartz dissolution pores (sample 3), (G) Feldspar dissolution pores (sample 4), (H) Feldspar broken micro cracks (sample 3), and (I) interparticle micro cracks (sample 5).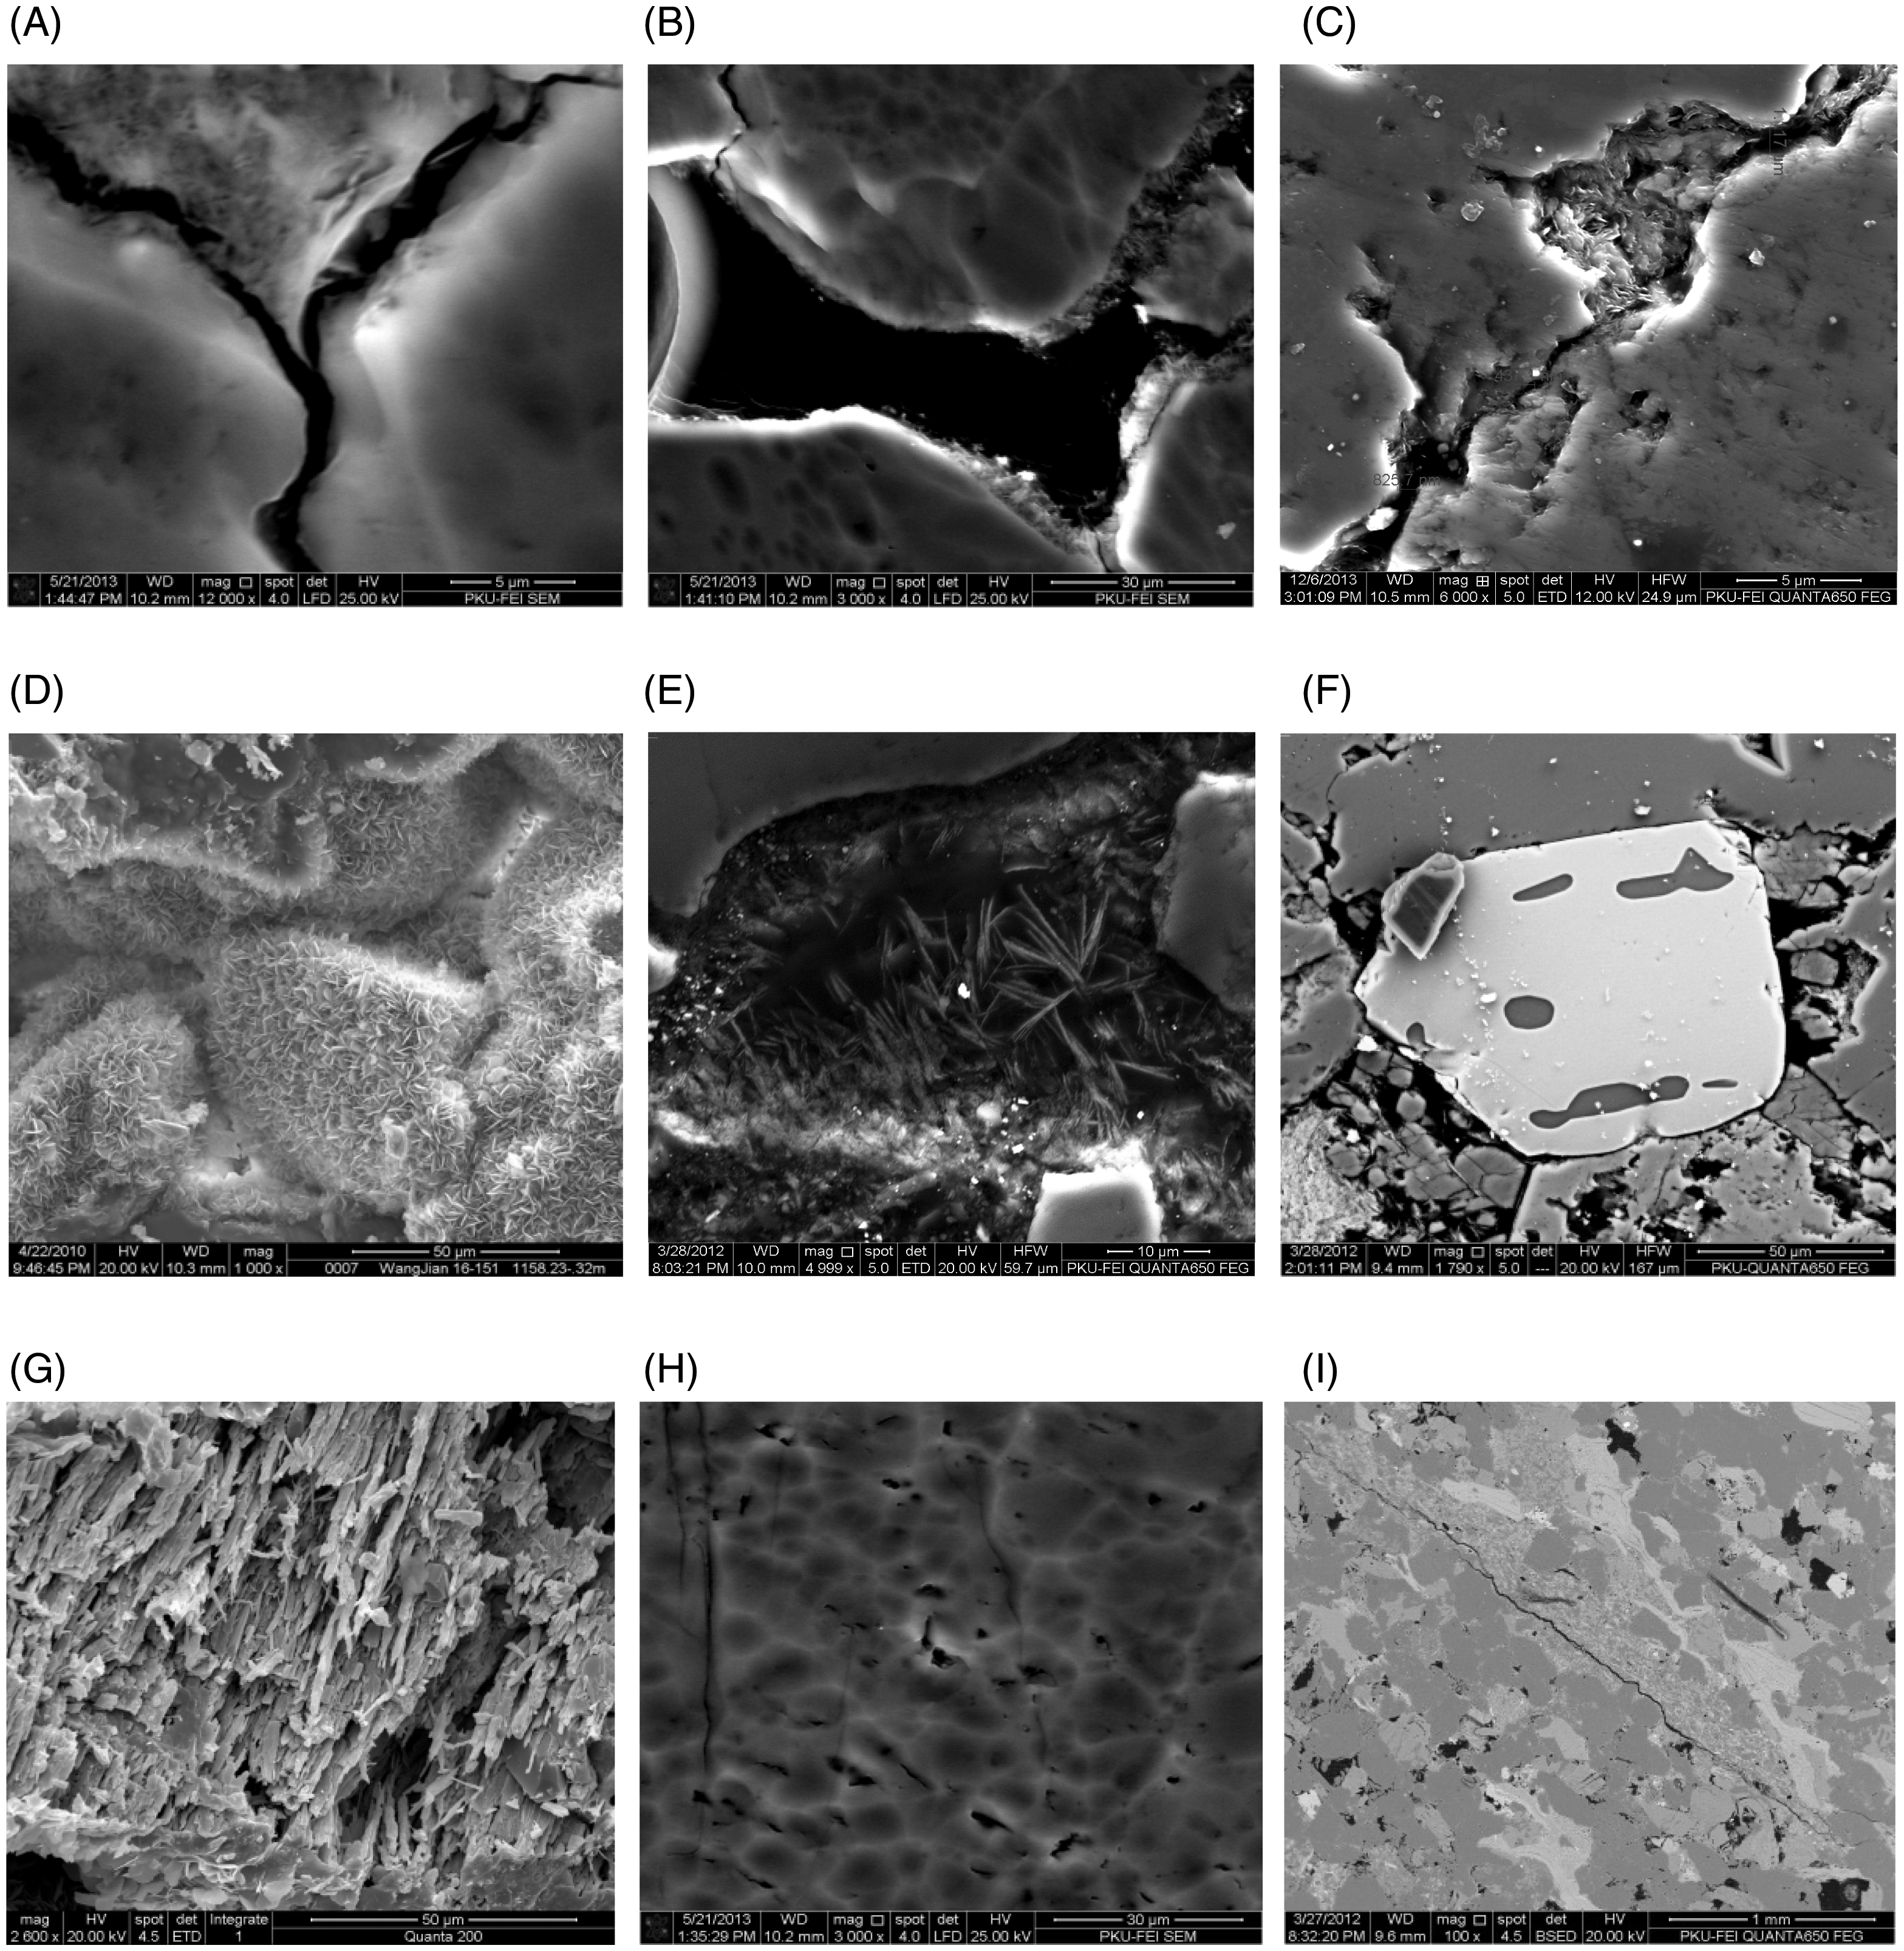
Intergranular pores mainly existed on micro scale include primary intergranular pores (Figure 1(A) to (C)) and residual intergranular pores (Figure 1(D)), which are the main oil and gas storage and seepage spaces owing to the fact that they are relatively large in size and clay mineral intergranular pores are complex due to the high plasticity of the clay minerals, strong oil, and gas adsorption ability and the water swelling effect. This suggests that they only have storage capacity (Figure 1(E)). Intragranular dissolution pores originated from the dissolution of grains such as feldspar, quartz, and clay minerals range from nano-micrometer (Figure 1(F) and (G)), and generally have poor connectivity, but some form effective seepage channels due to connections with intergranular pores through micro cracks. Micro cracks (Figure 1(H) and (I)) mainly consist of interparticle and Feldspar broken micro cracks with nanometers’ width and micrometers’ length, which are important seepage channels of oil and gas (Zeng and Li, 2009).
Low temperature NGA-desorption curves
When the relative pressure is higher, adsorption isotherm and desorption isotherm of samples do not overlap, which form a hysteresis loop. Four types of hysteresis loops were identified and correlated with the morphology of pore shapes (Sing, 1985) (Figure 2). Type A hysteresis is related to cylindrical pores, hysteresis loop is large; type B corresponds to bottle neck pores, desorption curve has a sharp decline in a turning point; type C and D hysteresis are attributed to sheet and bent-sheet pores, and there are small hysteresis loops and smooth desorption curves.
Hysteresis loops and their corresponding pore shapes.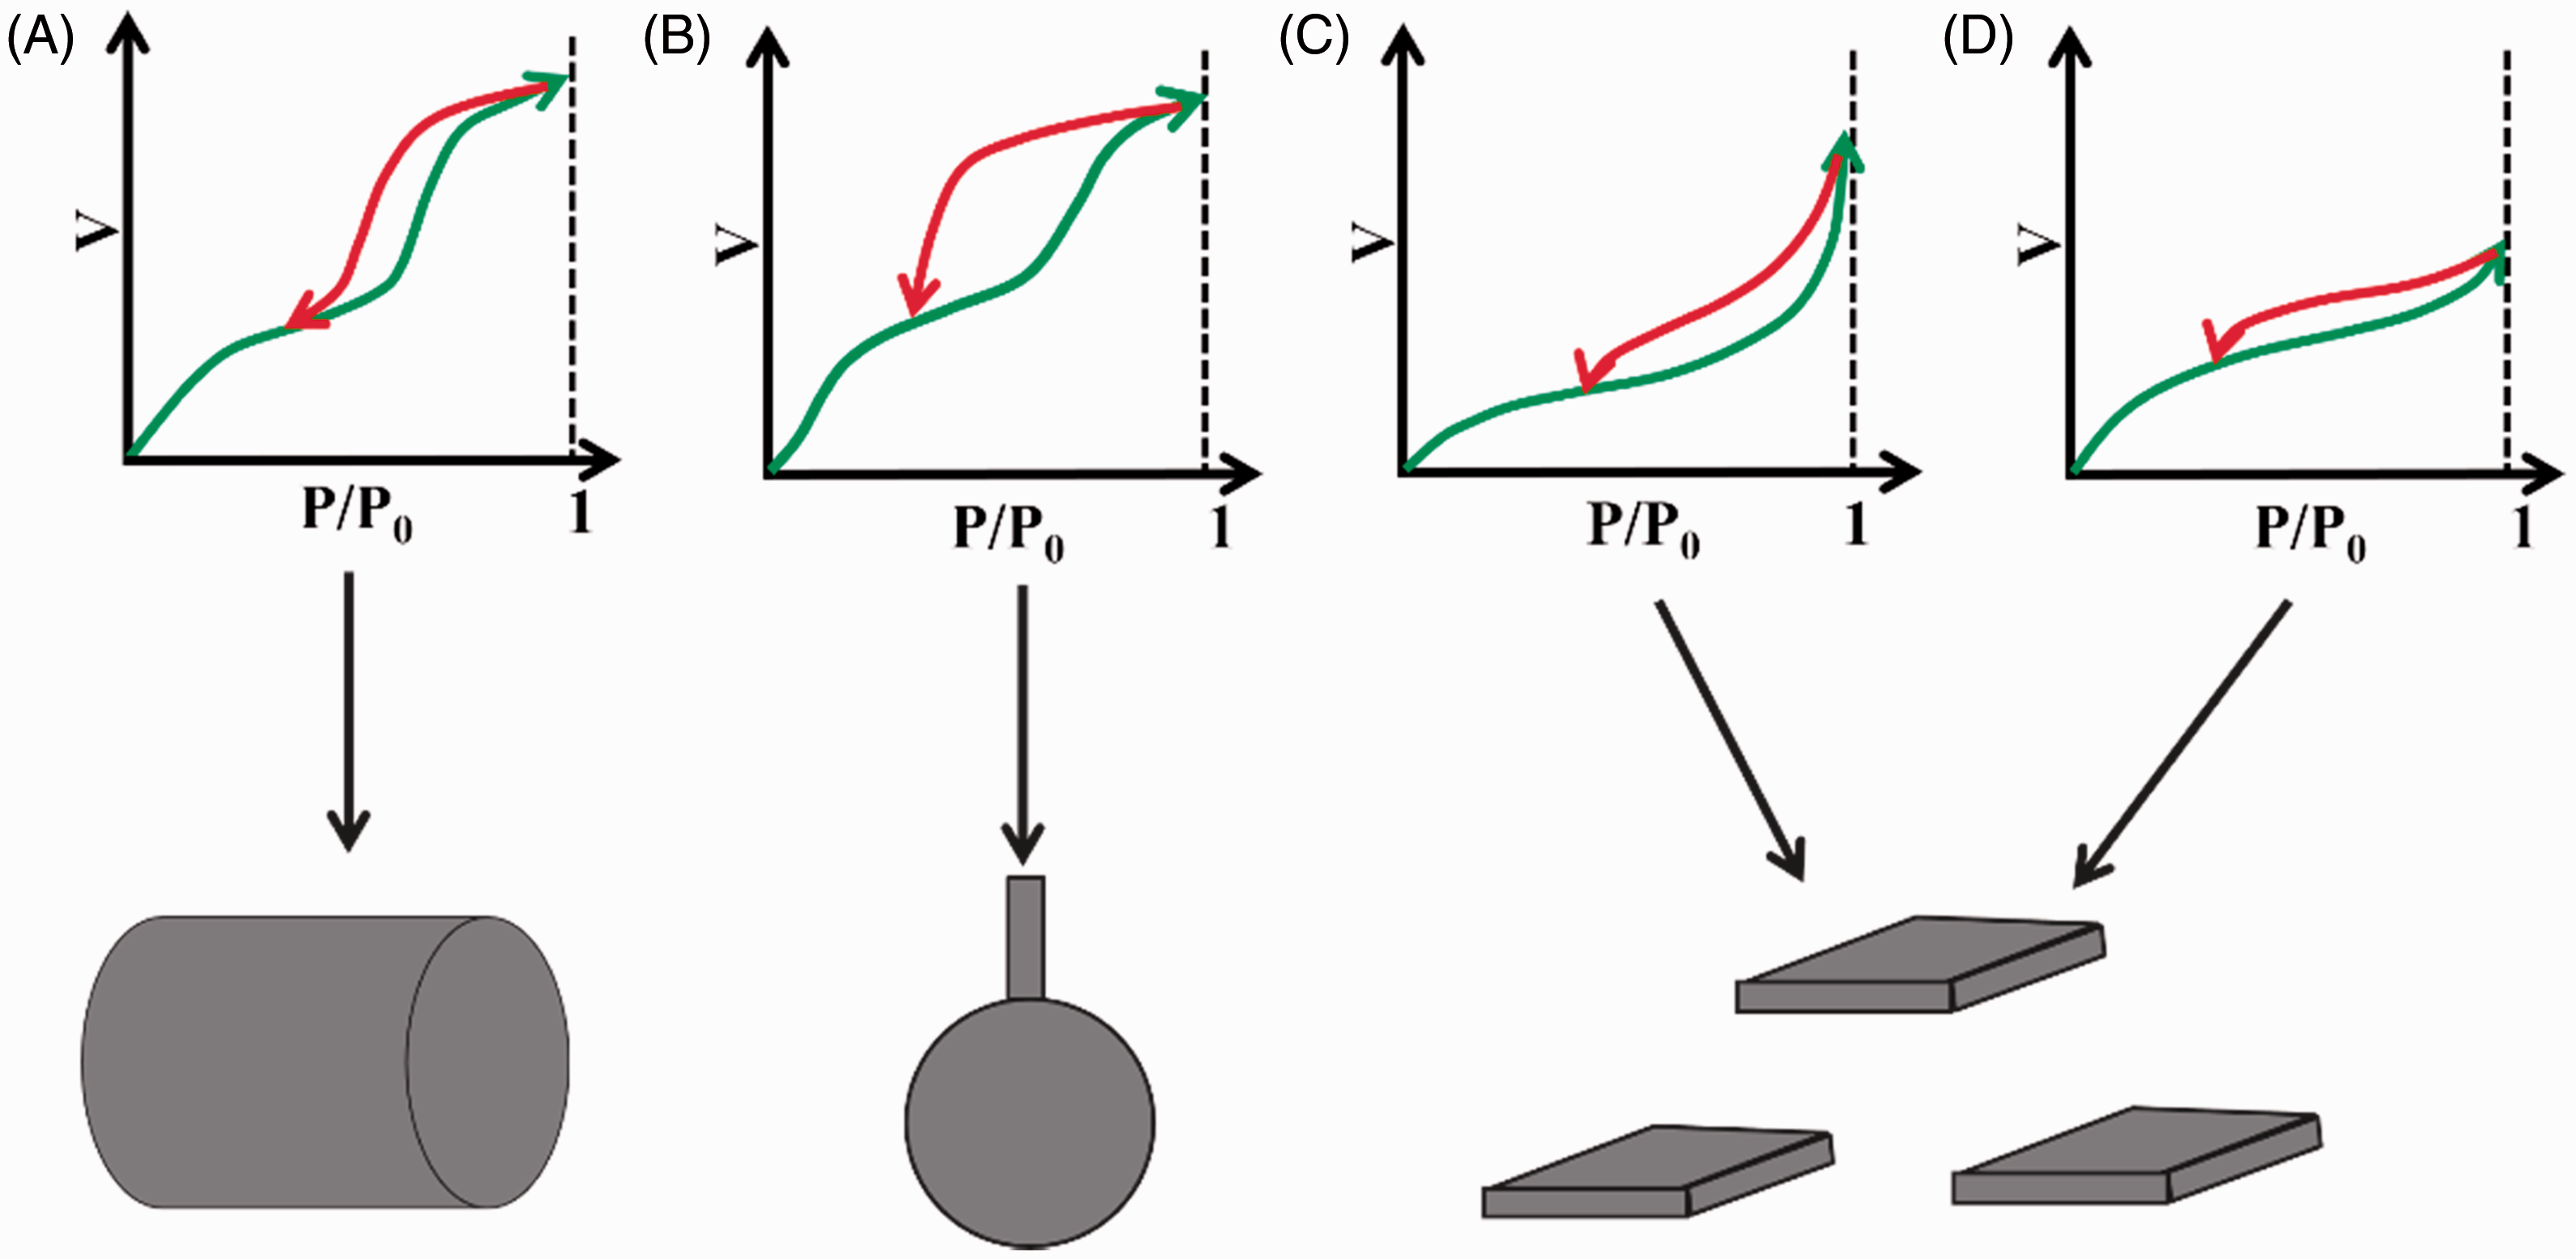
The NGA isotherms for five samples are shown in Figure 3. The figures suggest big differences among the samples studied with the relative pressure increasing. Samples 1 and 2 adsorbed the least N2 (<3 cm3/g) at the highest pressure (Figure 3), and the sample 2 at the highest pressure is only 1.5 cm3/g, suggesting little microporosity. Whereas the samples 3–5 absorbed the most N2 (>9 cm3/g), and the sample 4 at the point of highest pressure can reach 10.6 cm3/g. In addition, all the tested samples, except samples 2, show a distinct hysteresis loop at higher relative pressure (P/P0 > 0.5). According to the Kelvin equation, capillary condensation cannot occur when P/P0 < 0.5, thus the adsorption hysteresis loop disappears (Nie et al., 2014).
NGA isotherms for five samples.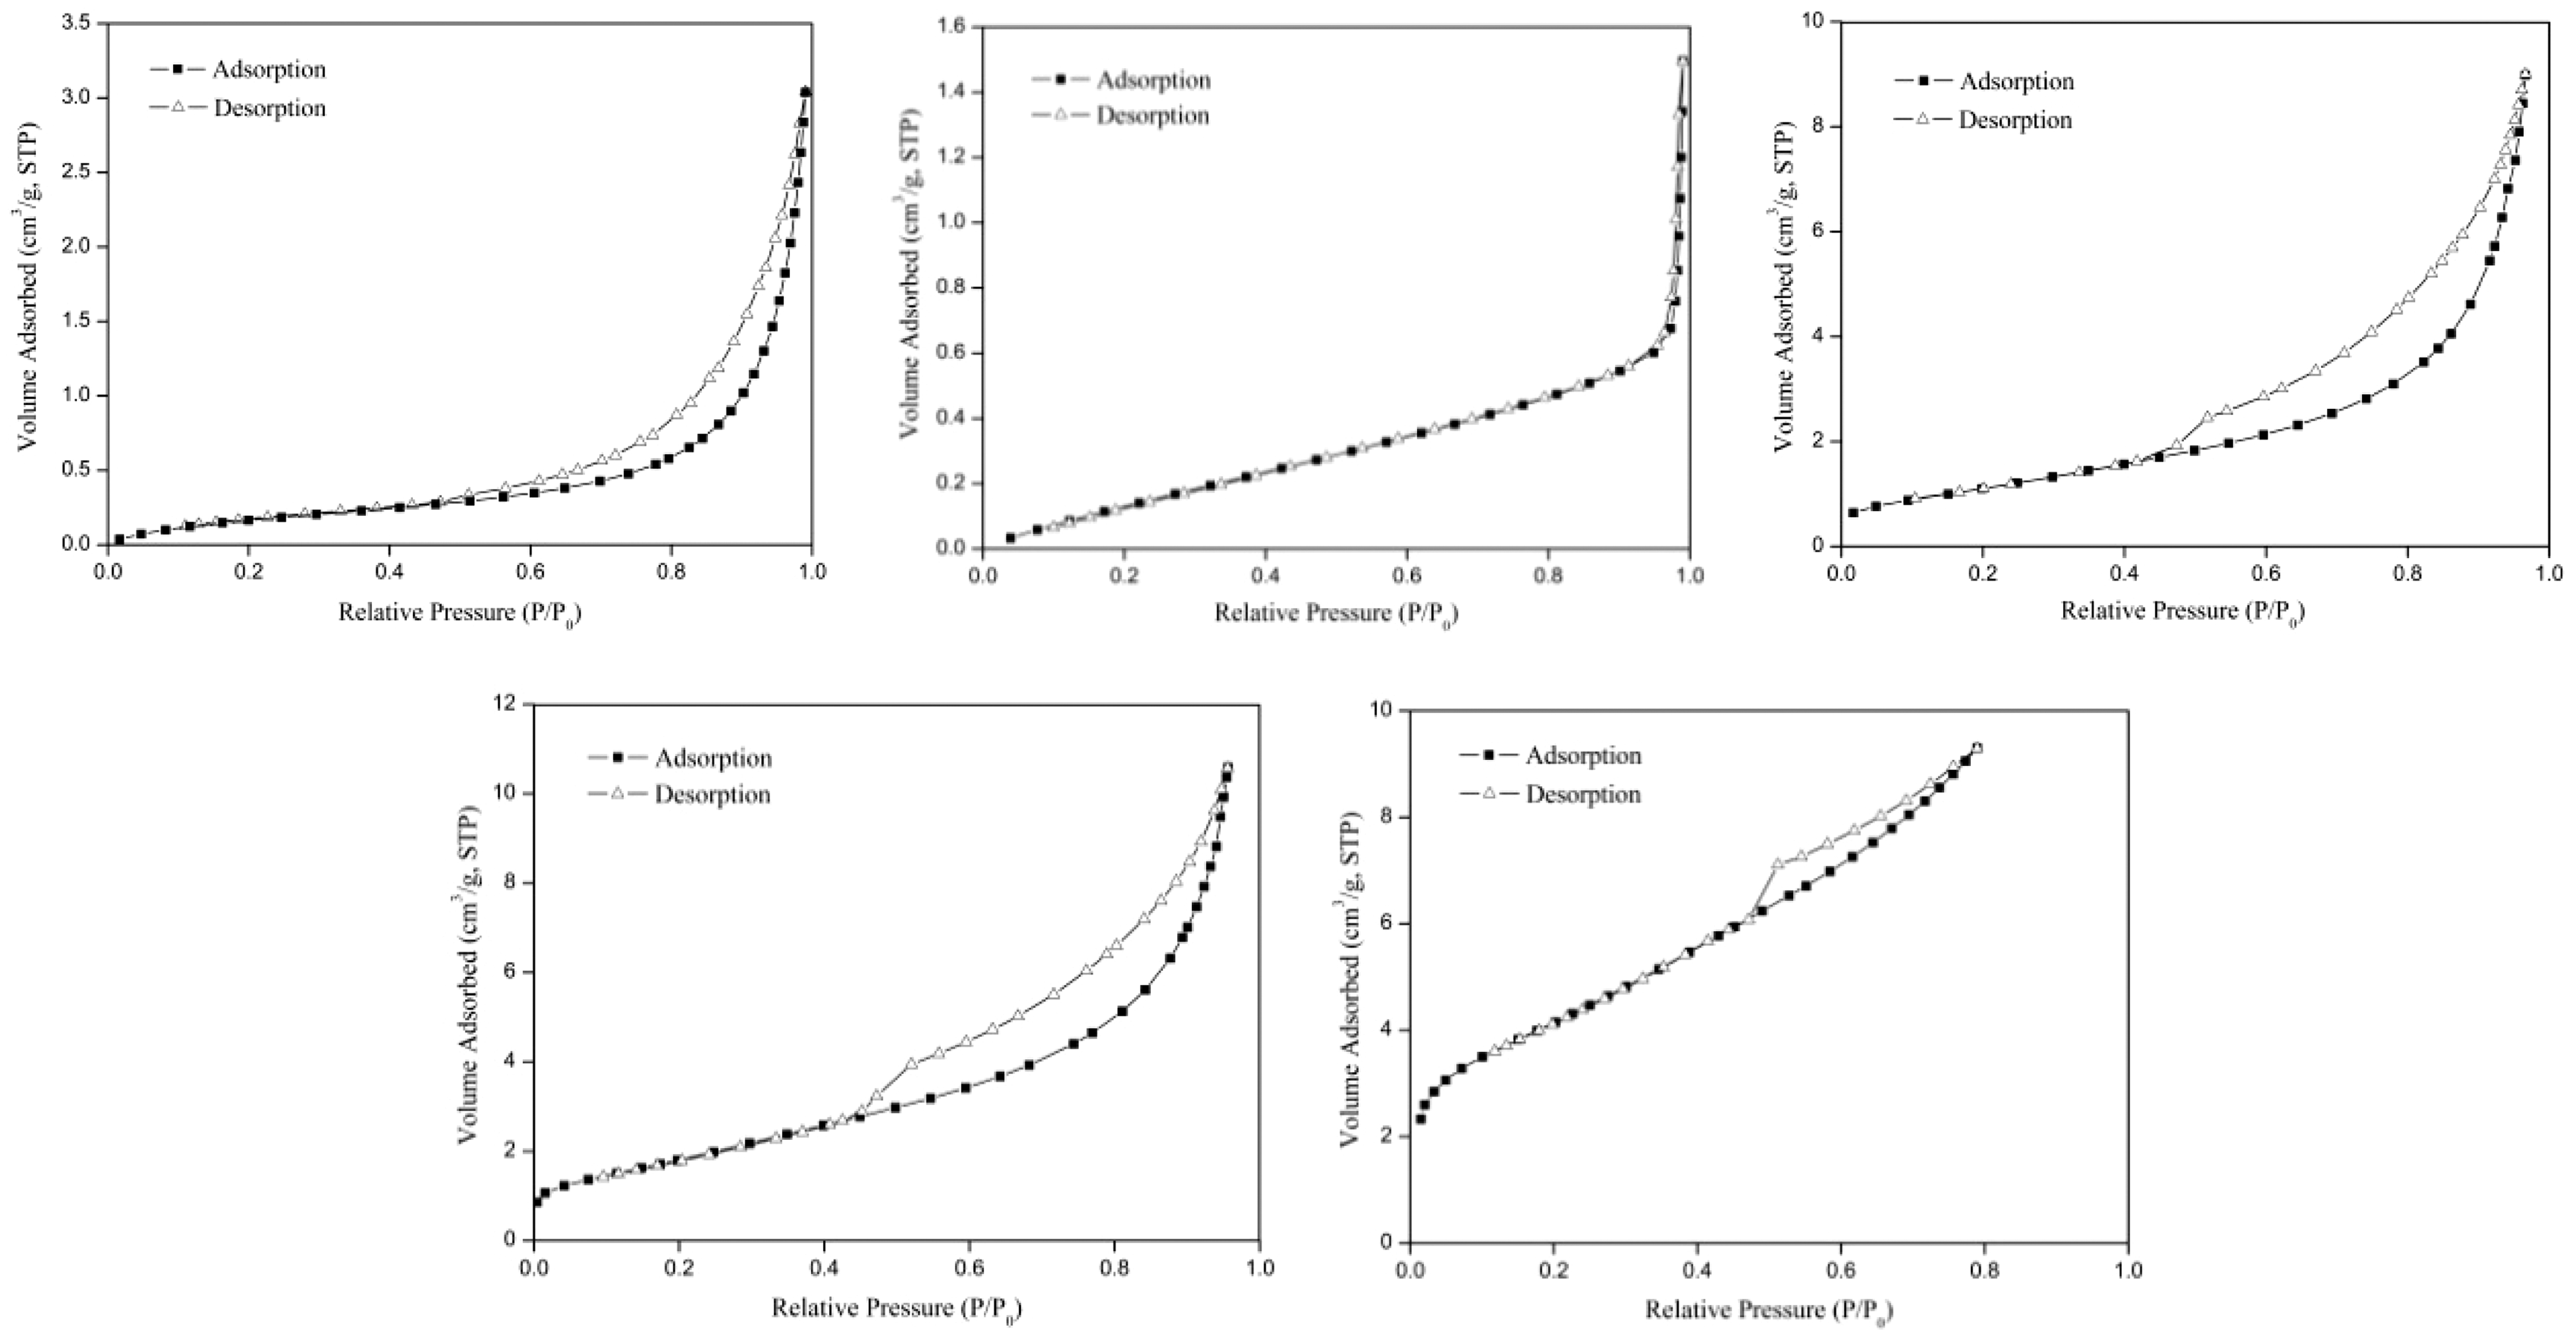
According to the principle of adsorption–condensation, samples 1–4 adsorption increase dramatically and the two curves tend to overlap when the relative pressure is close to 1, it suggests that nanometer scale pores of tight reservoirs is mainly sheet-shaped and cylindrical connected pores (Liu et al., 2015). The curves of the samples 1 and 2 are similar to the curve C and D, not only are hysteresis loops small, but also the curves are relatively smooth, which illustrate pore shapes of the two samples are mainly composed of sheet, bent-sheet pores. The adsorption-desorption isotherms of samples 3 and 4 belong to type A, indicating that the presence of numerous cylindrical pores and few slit-shaped pores, the bigger loop suggests the better pore connection of sample 4. The shape of the hysteresis loop in the sample 5 corresponds to type B. The desorption curve has a sharp decline in a turning point at 0.5 of relative pressure, which shows that the existence of bottle neck-shaped pores, and pore connectivity is poor.
Mercury intrusion curves
PCP curves
According to the capillary pressure curve in the process of mercury intrusion and mercury extrusion, pressure-controlled porosimetry can be semiquantitatively evaluate pore throat structures characteristics (Pang et al., 2007). The PCP curves of five samples are shown in Figure 4 and characteristic parameters are in Table 2. Curves characteristics of five samples have big differences, the threshold pressure of sample 4 is only 0.29 MPa, showing the pore throat radius is big and connectivity is good, and the threshold pressure of sample 5 can reach 2.75 MPa that suggests the pore throat radius is small and connectivity is poor. The length of horizontal stage of mercury intrusion curves length change shows some differences, sample 5 is shortest and sample 2 is longest, suggesting pore throat sorting differences are large. The maximum mercury intrusion saturations show some differences: the largest is sample 3 with 95.39%, the smallest is sample 5 with 71.37%, but all are greater than 70%. However, the extrusion efficiency is not that good: the largest residual mercury saturation is sample 3 with 70.11%, and the smallest is sample 5 with 48.91%, with the average residual mercury saturation being 62.62%. The differences between intrusion saturation and extrusion saturation indicate that a large amount of mercury was snapped off in pores, implying a large pore throat discrepancy.
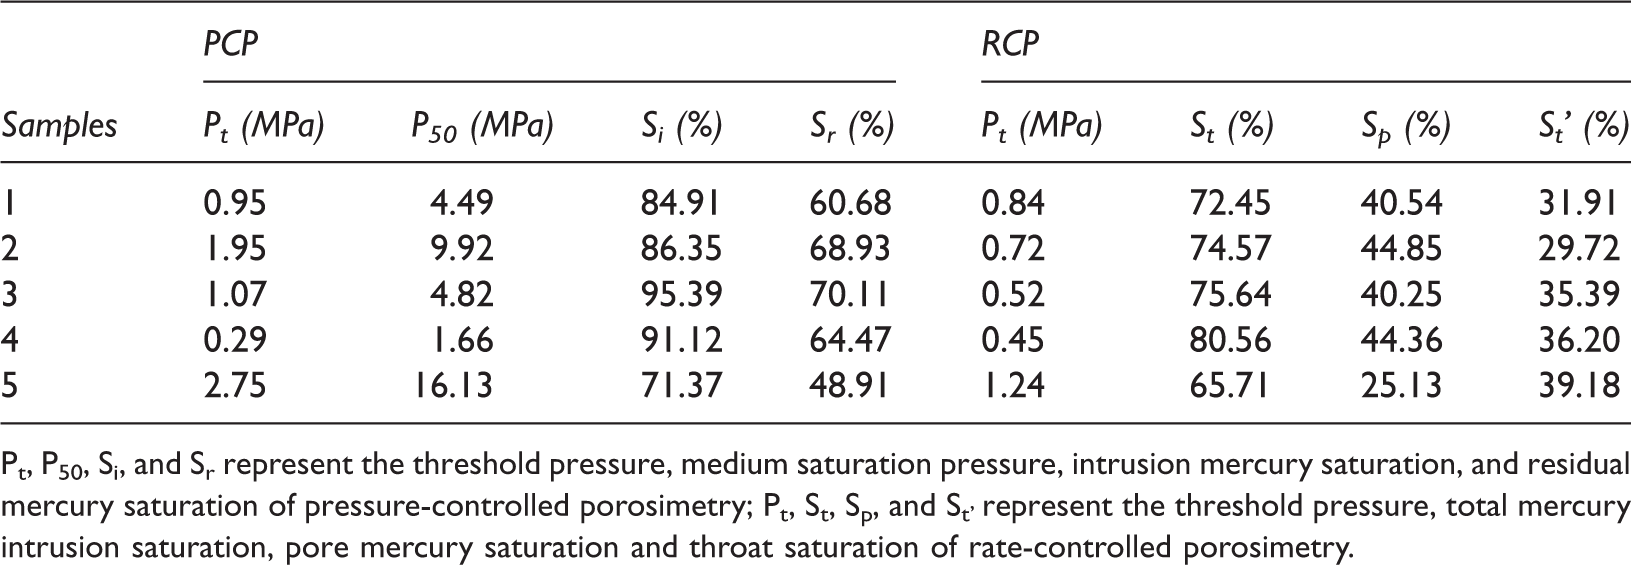
Intrusion and extrusion curves of pressure-controlled porosimetry. Characteristics parameters of PCP and RCP of five samples. Pt, P50, Si, and Sr represent the threshold pressure, medium saturation pressure, intrusion mercury saturation, and residual mercury saturation of pressure-controlled porosimetry; Pt, St, Sp, and St’ represent the threshold pressure, total mercury intrusion saturation, pore mercury saturation and throat saturation of rate-controlled porosimetry.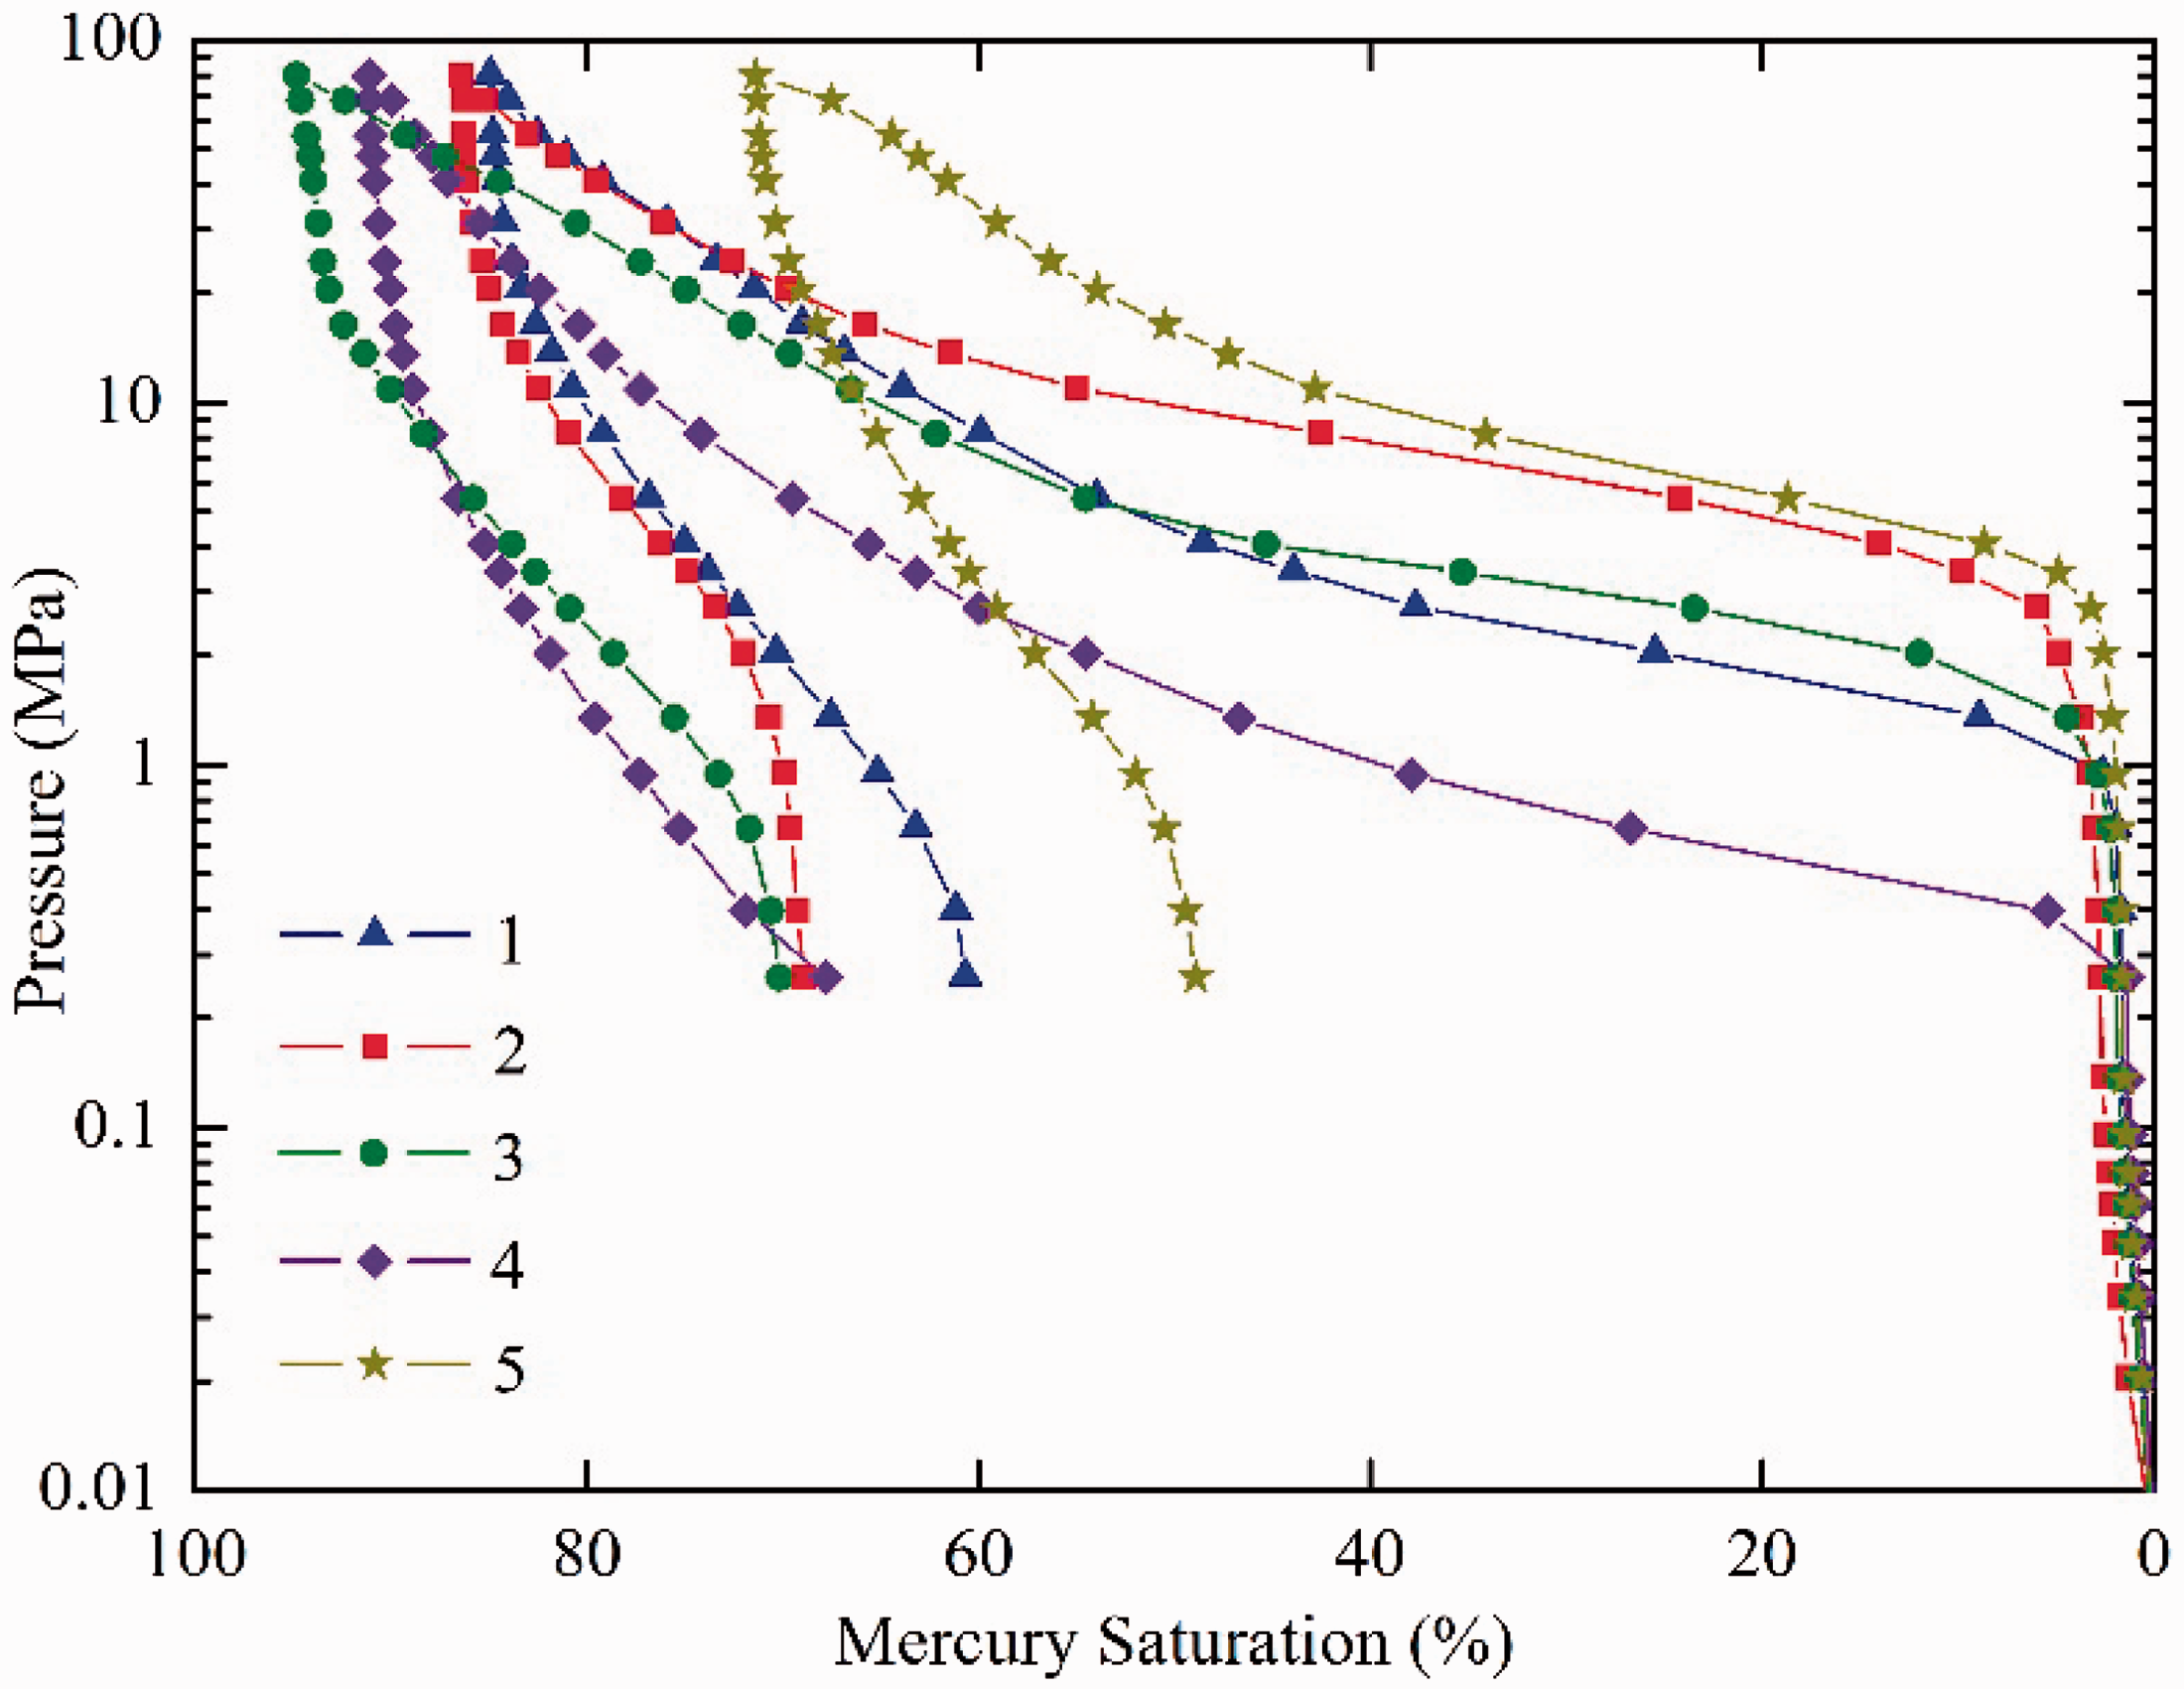
Intrusion and extrusion curves characteristics depend on pore structures (Tang and Zeng, 1994), indicating pore types are multiple and differences of pore structures are large among five samples. It can be seen from the above analyses: samples 1 and 2 have small pores and throats, samples 3 and 4 have large pores and throats and good pore throat sorting, and sample 5 has large pores and small throats and poor pore throat sorting.
RCP curves
Rate-controlled porosimetry can directly and quantitatively measure pore and throat radius, which is particularly important to the low permeability reservoirs that have big differences of pore and throat radius (Xu et al., 2011). RCP curves are classified into two types. Here, two typical samples are displayed, i.e. samples 2 and 5 in Figure 5, and characteristic parameters are shown in Table 2. For sample 2, the threshold pressure is 0.72 MPa, and the trend of the total intrusion curve is in accordance with that of the pore intrusion curve at the early stage of intrusion. When the pressure increases, pore intrusion curve becomes steep and the trend of the total intrusion curve is in accordance with that of the throat intrusion curve. The final mercury intrusion saturation of the pore space is 44.85%, which is greater than that of throat (29.72%). In contrast, for sample 5, the threshold pressure is 1.24 MPa, higher than that of sample 2. And the trend of the total intrusion curve is in accordance with that of the throat intrusion, pore intrusion curve change is rapid. The final mercury intrusion saturation of the pore space is low with 25.13%, which is lower than that of throat (39.18%).
RCP curves of the total, pore, and throat for samples 2 and 5.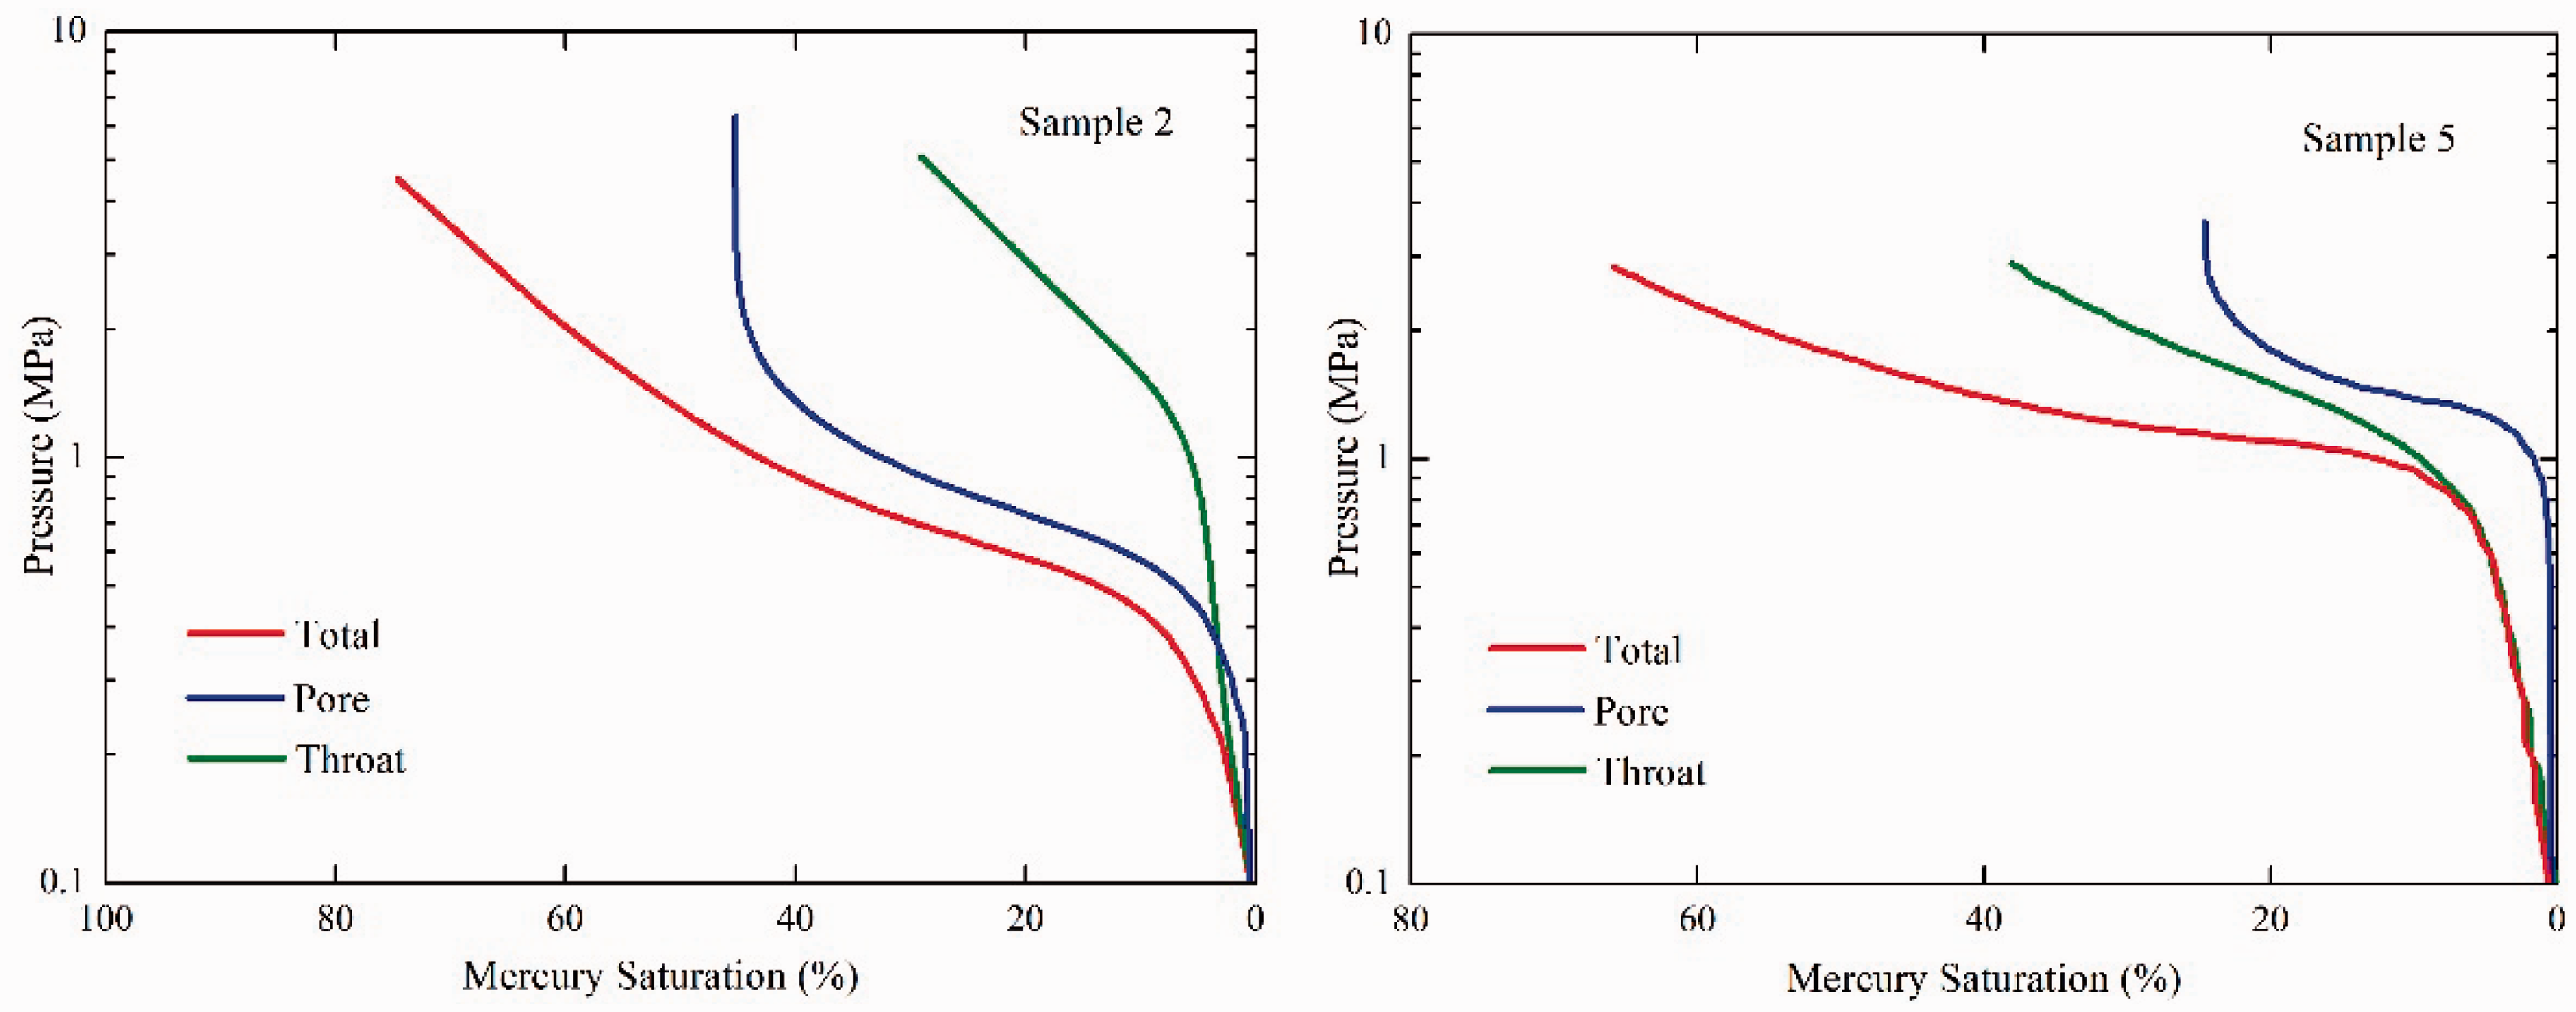
The threshold pressure of five samples indicates big differences, sample 5 is most and sample 4 least. The maximum mercury intrusion saturations suggest differences with that of PCP, the largest is sample 4 with 80.56%, the smallest is sample 5 with 65.71%. Because the maximum pressure is only 7 MPa, which corresponds to a pore throat size of 0.105 µm.
Discussion
Pore structure characteristics based on NGA
Pore size distribution
Microscopic pore structure and the nanometer scale pore size distribution of tight reservoirs have great influences on oil and gas storage and seepage, therefore accurate characterization is the key to reservoir evaluation (Rahmanian et al., 2010; Wang et al., 2015). Low temperature NGA experiments can overcome the measurement difficulty of bigger surface and smaller pore size of tight reservoir, targeted to quantitatively characterize nanometer scale small pores and micro cracks (Tian et al., 2012). Nanopores are classified into three categories by the International Union of Pure and Applied Chemistry (IUPAC): macropores (≥50 nm in diameter); transitional pores (2–50 nm in diameter); and micropores or adsorption pores (≤2 nm in diameter) (Zou et al., 2013). The pore size distribution of five samples is shown in Figure 6 and Table 3. The experimental results indicate that all the studied samples are mainly transitional pores, displaying the unimodal PSDs. The distribution of samples 1 and 2 range from 1 to 120 nm, the dominant pore size is between 2 and 15 nm for sample 1, between 5 and 30 nm for sample 2. Samples 3 and 4 have generally similar pore size distribution within 50 nm, with a major peak at approximately 5 nm. The distribution of sample 5 is limited only within 15 nm, with peak at 9 nm. It is widely believed that smaller pores, with diameter less than 100 nm, are the main control of gas adsorption and storage.
Nanometer scale pore size distribution of five samples. Pore structure parameters of samples.
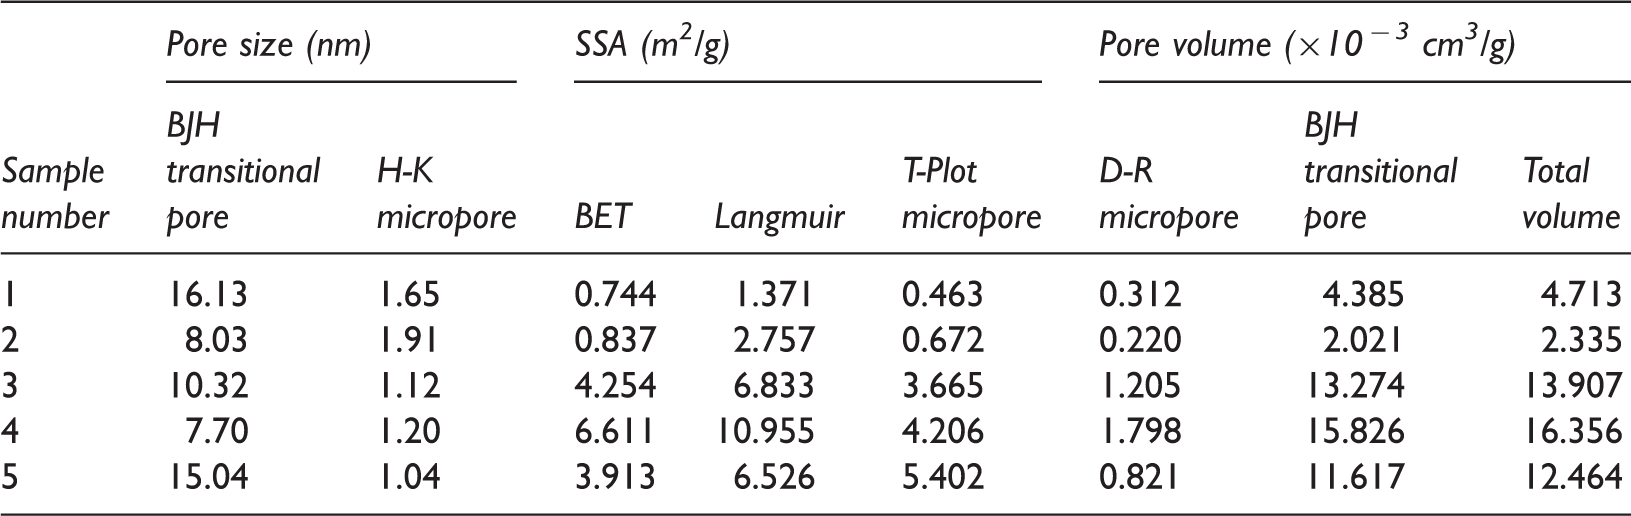
Pore volume and specific surface area
In this study, we use BET, BJH, D–R, Langmuir, and H-K to compute pore size, SSA, and pore volume, separately, as presented in Table 3. The data obtained show a large variation exists in surface area and pore volume of different samples. The BJH transitional pore volume of 5 samples ranges from 2.021 to 15.826 × 10 − 3 cm3/g, D–R micropore volume from 0.220 to 1.798 × 10 − 3 cm3/g. Transitional pore volume of samples 1 and 2 are relatively small, such as sample 2 ranging 0.386–2.613 × 10 − 3 cm3/g; distribution of samples 3 and 4 are similar, sample 3 changing from 0.235 to 19.213 × 10 −3 cm3/g; and that of sample 5 is moderated. It is pointed out that micropore volume is much smaller than transitional volume. And pore SSA similarly exhibit a wide range for the samples, SSA of samples 1 and 2 are much smaller than that of samples 3, 4, and 5. The BET transitional pore SSA of five samples ranges from 0.744 to 6.611 m2/g, Langmuir SSA ranges from 1.371 to 10.955 m2/g, and T-Plot micropore SSA from 0.463 to 5.402 m2/g, illustrating that the transitional pores have a greater contribution to SSA; thus, transitional pores determine the adsorption capacity to a large extent.
Pore structure characteristics based on MIP
Pore size distribution of PCP
Pore throat radius distribution curves of PCP indicate the samples show a wide PSD with pore sizes ranging from 10 nm to 40 µm, and the main distribution range between 50 nm and 3 µm (Figure 7). Sample 4 show peak when pore radius is 1 µm, while the peaks of sample 1 appear when pore radius are 0.1 µm. It is based on the assumption that the pore network of a rock is made up of cylindrical shapes of different radius, which is in fact not the case, this leads to mistaking the pore volume for the throat volume (Schmitt et al., 2013). The proportion of different radius pore throat to total pore throat of five samples is different, and contribution to permeability is also different, which are closely related to the size, distribution, and connectivity of pore throat (Figure 7).
Pore size distribution by pressure-controlled porosimetry.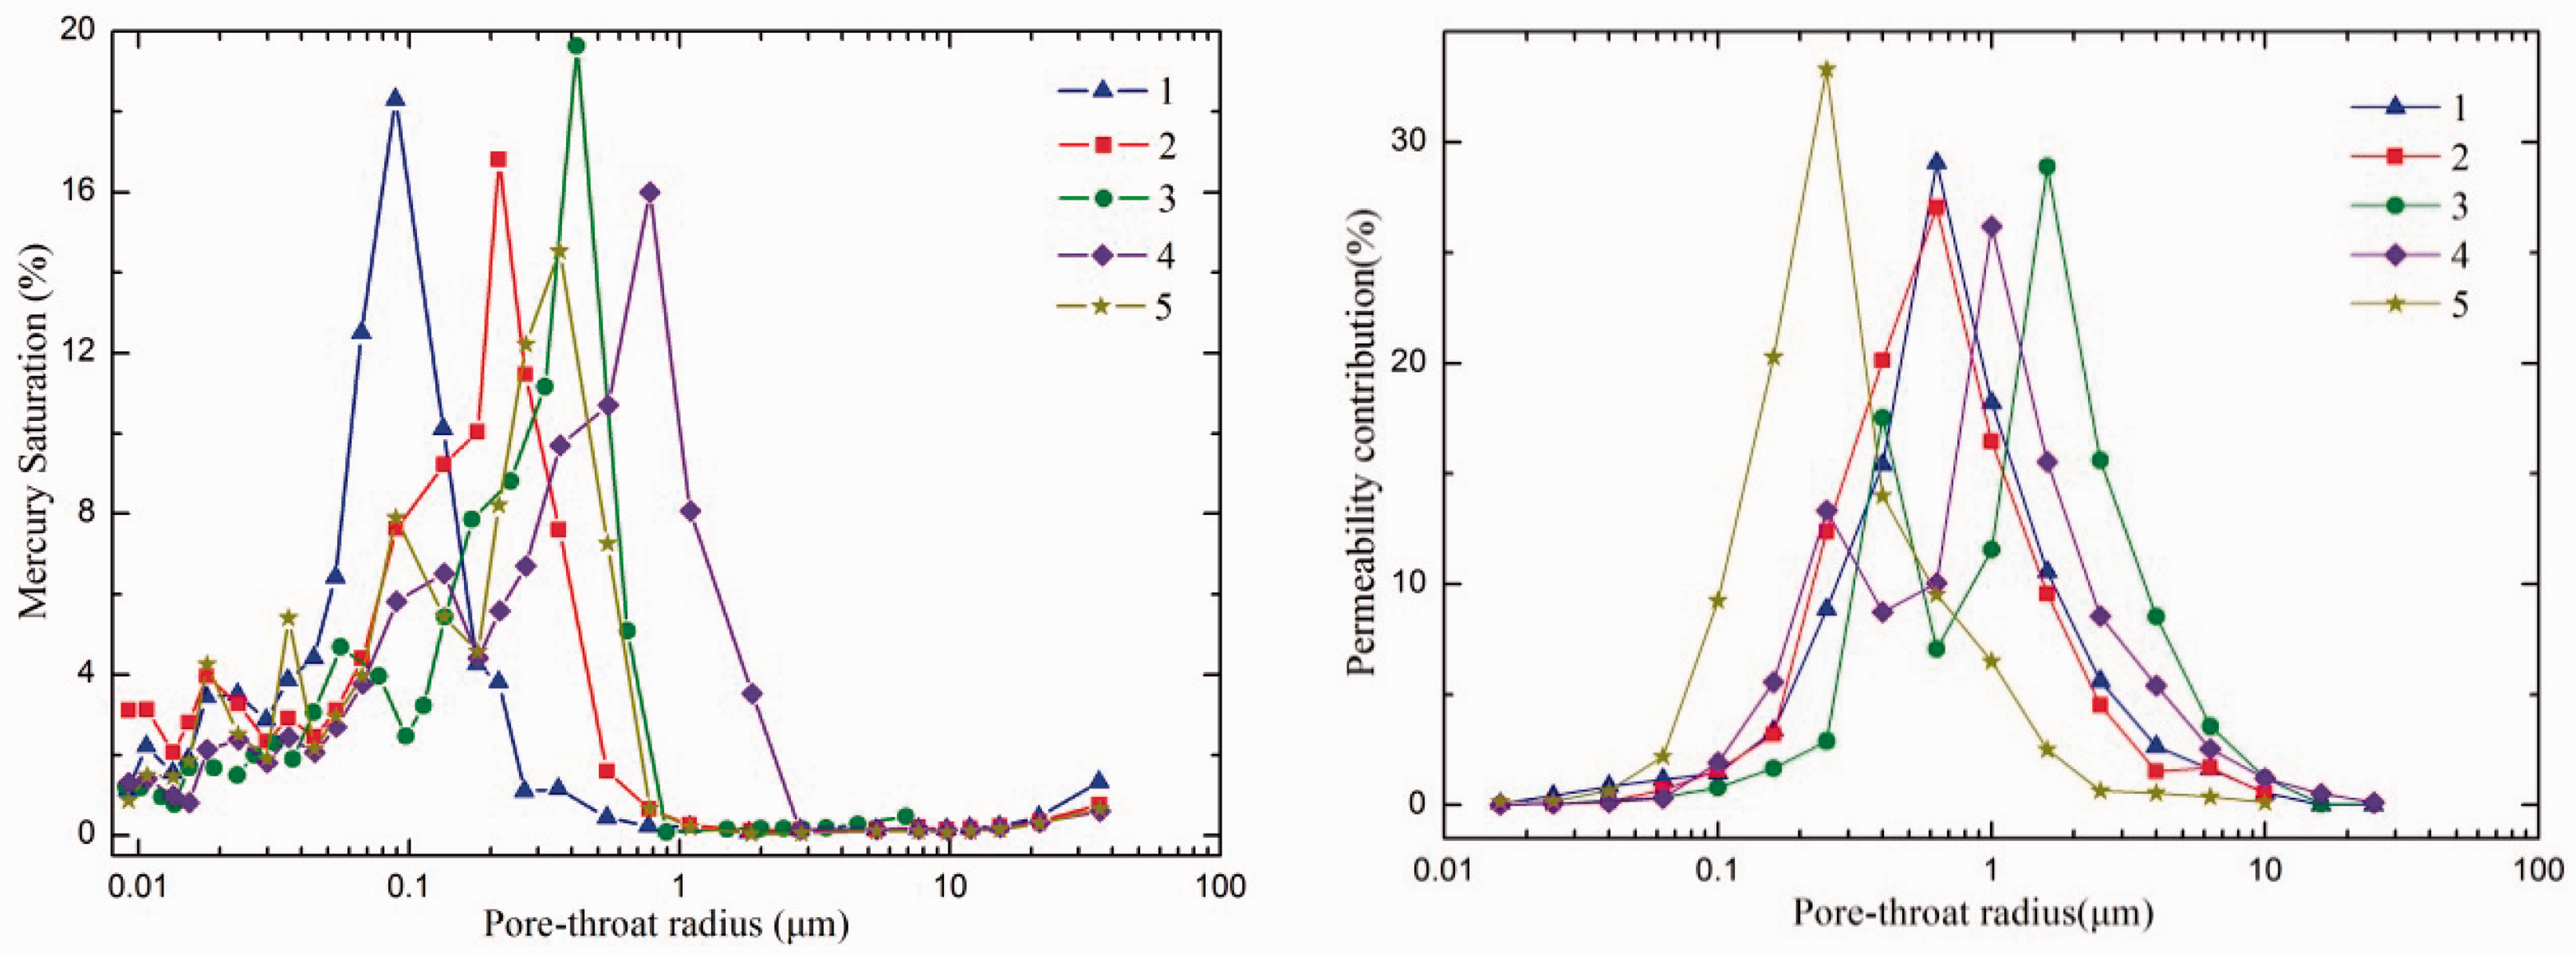
Pore size distribution of RCP
Rate-controlled porosimetry experiment measures pore and throat radius distribution and pore-throat radius ratios (Figure 8). The radius of pores has large variations among the samples mostly ranging from 80 µm to 300 µm, and that of samples 1 and 2 with peak about 100 µm is smaller than that of samples 3, 4, and 5 with peak about 150 µm, which has great impacts on oil and gas storage but small significance to seepage ability. The throat distribution ranges from 0.1 to 5 µm, and that of samples 1, 2, and 5 with peak about 1 µm is smaller than that of samples 3 and 4 with peak about 2.5 µm. Throat is the key factor to determine seepage ability of tight reservoirs, and average throat radius of five samples is about 2 µm, there are big sorting coefficient and strong heterogeneity. Therefore, differences in the pore and throat radius result in relatively large pore-throat ratio. Pore-throat ratio varies widely, ranging from 50 to 500 among five samples, the smaller the pore-throat ratio is, the higher effective pore throat development degree is. The ratio distribution of samples 1 and 2 is much narrower than that of samples 3, 4, and 5, and the peak of pore throat ratio of sample 5 is most, suggesting pore exists in the form of bottle neck and connectivity is poor. The feature of large-pore spaces and small-throats is what distinguishes tight oil reservoirs from other conventional reservoirs.
Pore size distribution by rate-controlled porosimetry.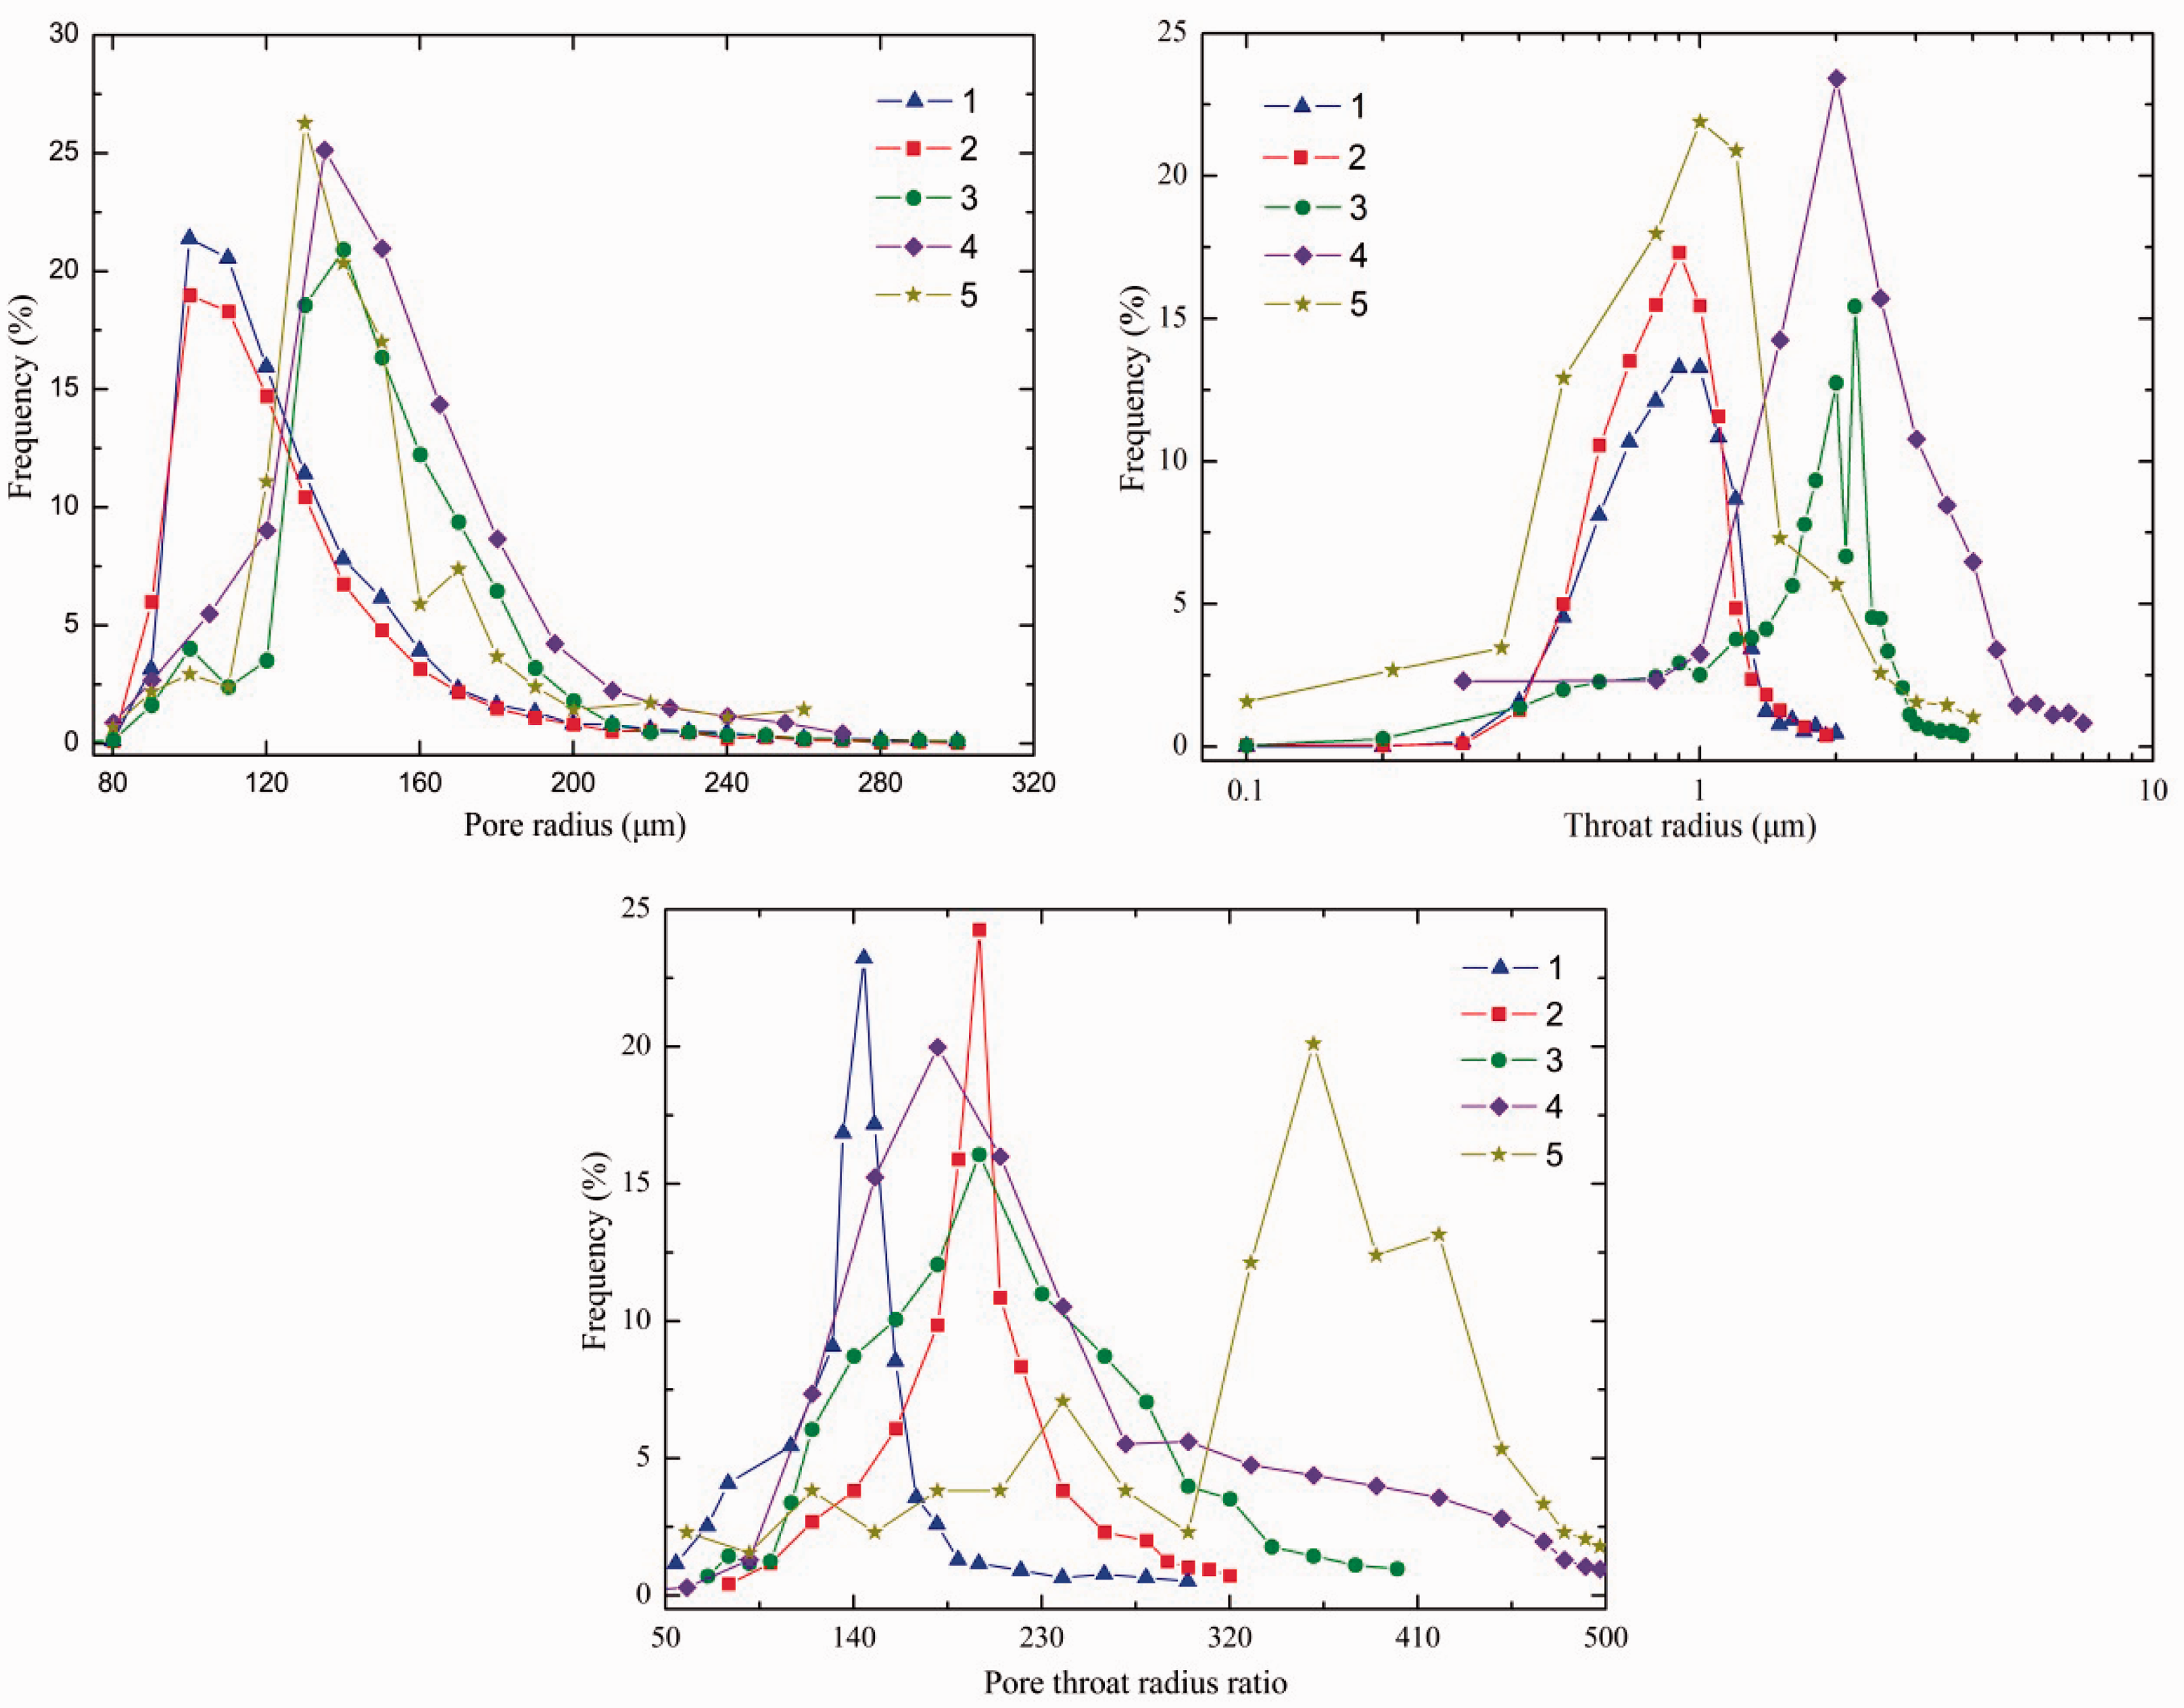
These analyses show that pore and throat types and the matching relation change greatly because of different deposition and diagenesis. The characteristics of several pore throat types and shapes are complex, which is a key problem encountered in the development of tight reservoirs (Chen et al., 2011c; Yang et al., 2011). Throat radius is to determine the main factors on seepage ability, RCP can distinguish pore throat radius and characterize accurately the concept of pore throat ratio, which is better than the RCP experiment (Chen et al., 2011a; Zhu, 2013).
Pore structure characteristics’ influence on the permeability stress sensitivity
The reservoir permeability stress sensitivity is affected by several factors such as rock compositions and pore structures (He et al., 2012; Jiao et al., 2011). When the tight rock of porous media is pressed, compression starts from the pore throats, not from pore bodies (Ruan and Wang, 2002). For tight sandstone reservoirs, due to the complexity of pore structures and various types, microscopic pore structure has an important influence on deformation characteristics and permeability under the stress effect (He et al., 2011; Liao et al., 2012; Tian et al., 2015). Permeability stress sensitivity curves of five samples are shown in Figure 9. Analyzing the influence of pore structure characteristics on the reservoir seepage mechanics features are based on five samples that have different pore structures.
Permeability curves of five samples under different effective stress.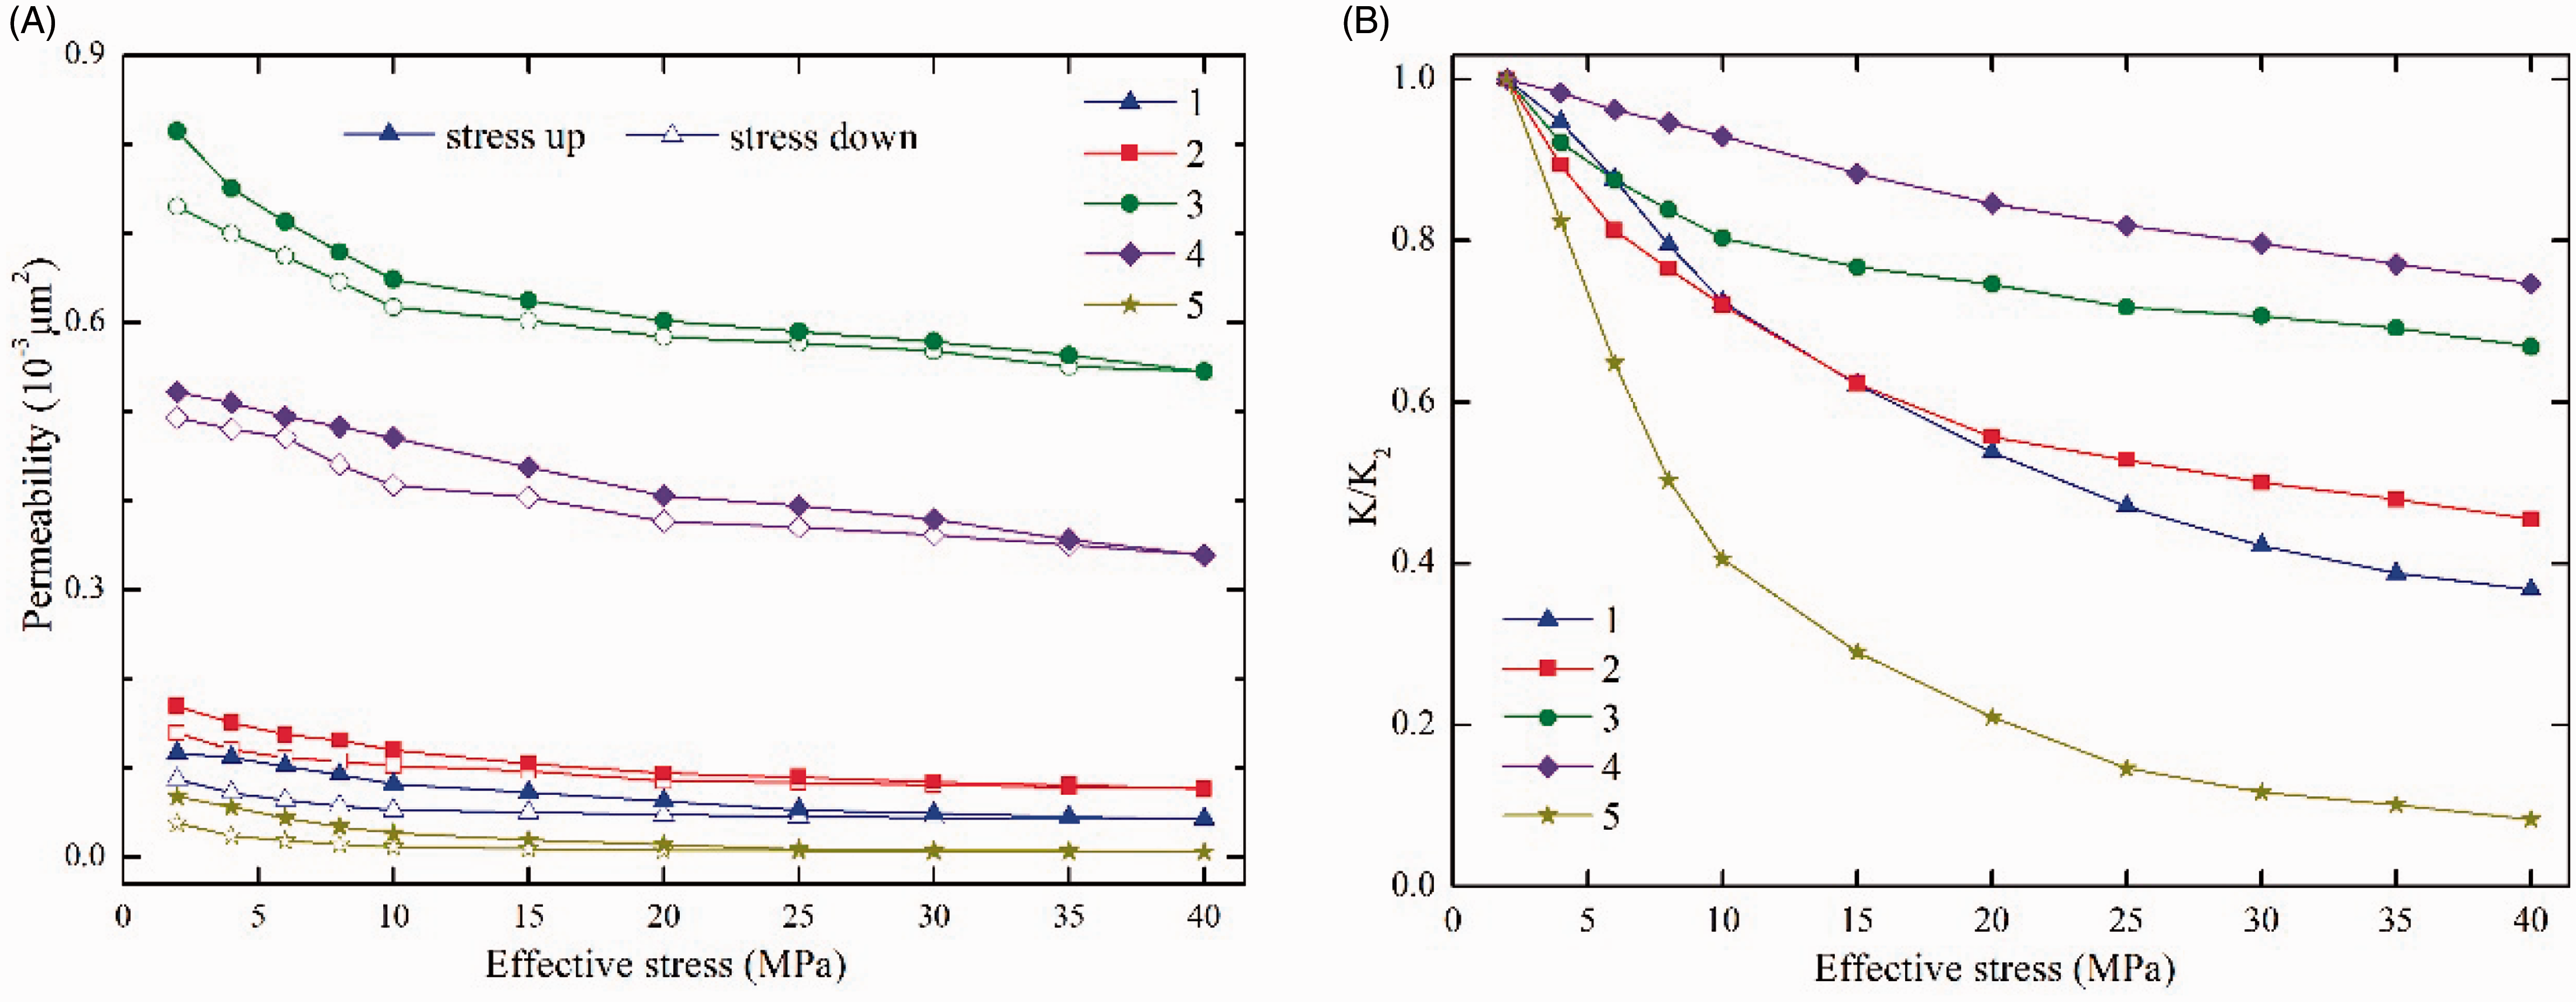
Figure 9(A) is the absolute permeability decrease with the increase of effective stress of five samples. The absolute decrease in permeability is 0.0739 × 10 − 3 µm2, 0.0922 × 10 − 3 µm2, 0.2702 × 10 − 3 µm2, 0.1832 × 10 − 3 µm2, and 0.0624 × 10 − 3 µm2, respectively, when effective stress reaches 40 MPa. When effective stress releases from 40 MPa to 2 MPa, the recovery rate in permeability, is 74.57%, 82.08%, 89.54%, 95.98%, and 55.77%, respectively, which indicates stress state change has different degree of elastic and plastic deformation and irreversible damage to reservoir. Figure 9(B) shows the relative permeability decrease as the change of effective stress. Change in permeability is obvious under different effective stress conditions. Firstly, permeability is falling fast, due to the closure of micro cracks, and then the falling speed is relatively slow because of closure of pore throat, the relative permeability decrease of samples, respectively, is 63.27%, 54.49%, 33.14%, 25.37%, and 91.73%, respectively. Stress sensitivity degree of five samples has big differences, the damage of samples 3 and 4 is weak, and that of samples 1 and 2 is moderate, while sample 5 is strongest with more than 90%.
Through the above analysis, samples 1 and 2 mostly develop sheet, bent sheet nano-micro scale intragranular dissolution pores, intergranular residual pores and a small amount of feldspar cracks. Micro cracks, intergranular pores and throats close as the increase of effective stress, whereas the closure of intragranular dissolution pores is less due to mineral skeleton support, so the stress sensitivity is moderate. Samples 3 and 4 mainly include cylindrical micrometer scale intergranular primary pores and a certain amount of intragranular pores. With the increase of effective stress, pores are strong in resistance to stress change and compressed deformation but not closed, which has little effect on the reservoir seepage capacity, so the stress sensitivity is weakest. Sample 5 mainly exists bottle neck-shaped pore and a large number of micro cracks, therefore pores are more easy to deform and closure if they are micro cracks and small pores, which can produce great damage to the seepage ability with effective stress increase, making these pores becomes “dead” pores, so the stress sensitivity is the strongest with more than 90%. As a result, there are big differences among permeability stress sensitivity of tight reservoirs, which suggests different pore structure may lead to occur different deformation characteristics owing to unceasingly compressed.
Conclusion
This article, using SEM, NGA, and MIP technologies, presents an experimental study of microscopic pore throat structure characteristics of tight sandstone reservoirs in Ordos Basin. Based on our experimental studies and data analyses, we come to the following conclusions:
Using qualitative methods for describing pore structure of tight reservoirs. Three pore types are recognized by SEM experiments in tight sandstone reservoirs: intergranular pores (intergranular primary pores and intergranular residual pores and clay mineral dominated pore), intragranular dissolution pores (feldspar and quartz dissolution pores), and micro cracks (intragranular cracks and grain flange cracks). Combined with NGA experiment, it indicates that various pore shapes include sheet and bent sheet, cylindrical and bottle neck shapes. Pore throat size distribution of tight reservoirs is widespread, a combination of three experiments is proposed as a new method for tight oil reservoirs pore structure characteristics. The study finds that pore size distribution of tight sandstone reservoirs ranges from nano-micrometer scale completely and the contribution to reservoir properties from 2 nm to 500 µm distribution. Nanometer scale pores are made up of intragranular dissolution pores and that of in nano-micrometer range are composed of intergranular pores and micro cracks, and the contribution to the reservoir seepage mainly ranges from 100 nm to 10 µm. The combination of several kinds of pore types and multi-scale pore size composes the main oil and gas storage space of tight reservoir, and complex pore size distribution, connectivity, and matching relations are the reasons for forming low permeability reservoirs. Using this new method, intuitive analyses are carried out on the pore types and shapes, the nano-micrometer scale pore size distribution is studied quantitatively, which is the defects of previous studies. The study of permeability stress sensitivity of five samples finds that stress sensitive effects resulting in “damage” is of a permanent, irreversible nature for tight reservoirs. However, permeability stress sensitivity of reservoirs that have different pore types, shapes, and pore size distribution features is different from each other. Samples 3 and 4, with cylindrical intergranular pores and intragranular dissolution pores, have less sensitivity to effective stress; samples 1 and 2 of the sheet and bent sheet pores is moderate of stress sensitivity; sample 5 that comprises bottle neck pores and micro cracks are major contributors to stress sensitivity. Pore throat analysis results show that pore-throat size, shape, and matching relation mainly control permeability stress sensitivity in tight sandstone reservoirs, which can affect well oil production in the process of water injection development.
Footnotes
Acknowledgements
The authors express their gratitude to Dr Lei Xu and Shuheng Du for their valuable professional suggestions and assistance.
Declaration of conflicting interests
The author(s) declared no potential conflicts of interest with respect to the research, authorship, and/or publication of this article.
Funding
The authors are grateful for the support of the National Key Basic Research Development Plan of China (2009CB219300).