
Abstract
The Iqe coalfield is one of the most significant coal production bases in the Qaidam Basin. Over the last few decades, core explorations have targeted the Dameigou Formation for No. 7 coal seam (M7). Although many M7 coal samples have been analyzed for coal components in the laboratory, the systematic understanding of the components and changes of coal in the whole Iqe coalfield is still inadequate. In this study, we focus on building log interpretation models to accurately calculate the content of coal components of M7, including ash yield (Aad), volatile matter (Vdaf), fixed carbon (FCad), and moisture (Mad). Multiple regression analysis and statistical method, combined with the rock volume model, were used to establish log interpretation models of coal components. A total of 28 coal samples from ZK1, ZK2, ZK11-5, ZK23-4, and ZK36-9 wells in the Iqe coalfield were involved in the modeling, as well as well-logs parameters, such as radioactivity (GR), compensation density (DEN), acoustic (AC), and resistivity (RLLD). According to sensitivity analysis, the fitted Aad and Vdaf contents of M7 increase with the increasing of DEN and GR values, whereas the FCad content shows the opposite way. Furthermore, the positive relationship between Aad and Vdaf (R2 = 0.59) and the negative relationship between Aad and FCad (R2 = 0.92) as well as Vdaf and FCad (R2 = 0.69) indicate that Aad is a key factor in coal and should be prior determined. Finally, based on the multiple regression analysis and rock volume model, we proposed log interpretation models for M7 coal components in the Iqe coalfield, these models have been examined successfully by the case studies from the same coalfield and will provide new insights into the application of geophysical log parameters for coal quality evaluation.
Introduction
At present, the production and consumption of coal in China still account for a significant proportion (e.g. around 60% in total primary energy consumption; Chen et al., 2017; He et al., 2021; Yang et al., 2018), and China is the largest coal producing country around the world (Gao et al., 2019; Kalkreuth et al., 2020; Ward, 2016). In recent years, green and clean utilization of coal has been vigorously promoted by China government. Understanding the petrologic compositions and contents of coal is necessary for better utilization of coal (Feng et al., 2020). The primary coal components are ash (Aad), volatile matter (Vdaf), fixed carbon (FCad), and moisture (Mad), occurring in a complex compound formation. Commonly, the coal components can be determined by geochemical analysis in laboratory and geophysical log interpretation (Fu et al., 2009a; Roslin and Esterle, 2015; Shao et al., 2013). However, different coal types have obviously variations in geophysical log data such as natural gamma ray (GR), compensation density (DEN), acoustic (AC), and deep investigate double lateral resistivity log (RLLD) (Lamberson and Bustin, 1993; Scott et al., 2007).
Generally, geochemical test in laboratory is more reliable for coal components. However, sample collection and analysis are cost- and labor-intense, as well as high uncertainty during the collection and transportation process. As an alternative, in the past decades, geophysical log data have been widely used for calculating the coal petrologic components, albeit with variable success (Mavor et al., 1994; Roslin and Esterle, 2015; Shao et al., 2013; Yegireddi and Bhaskar, 2009). In the analysis of coal by well logs, parameters mainly include spontaneous potential (SP), GR, borehole diameter (CAL), DEN, AC, RLLD, and shallow investigate double lateral resistivity log (RLLS). However, due to the relatively loose structure of coal seam, CAL is prone to expansion in coal seam (Safar et al., 2009; Vieira et al., 2007) and can be affected by the coalbed methane content with changes of inverse (Hamada and Hegaxy, 2007; Trcka et al., 2006). The coal types has a close relationship with the SP log (Hou, 2000), and the detection depth of RLLD is higher than that of RLLS. Previous researchers reviewed that the geophysical log responses of coal components include the followings: 1) low ash yield generally corresponds to low DEN and GR logging values (Chatterjee and Paul, 2013; Ghosh et al., 2014); 2) the higher Vdaf content commonly along with the greater DEN and GR logging values; 3) the FCad content is negatively correlated with DEN and GR logging data (Fu et al., 2009b). Therefore, we selected the well logs of DEN, GR, AC, SP, RLLS, and RLLD to identify the coal seam and evaluate the coal components in present study.
Different statistical approaches and regression models have been used to calculate coal components, and the representative and widely applied methods and models are as follows: 1) Bond et al. (1971) proposed a physical bulk-volume model of rock, providing a fundamental theory for calculating the coal components. 2) Mullen (1988) proposed a statistical analysis method to determine the physical properties of coal, such as coal components, coalbed methane content, and coal seam structure, whereas no geophysical log model have been established to calculate coal components. However, the statistical analysis is benefit for establishment of multiple regression model. 3) Pan and Liu (1996) found a positive correlation between coal ash yield and DEN values, and this relationship can be used to calculate Aad content in coal. However, the measurement of DEN is influenced by multiple factors, such as the quality of well, mud raw materials, and water and gas content of coal seam. Thus, the results may be not reliable by only using DEN to obtain coal component content. 4) Hou and Wang (1999) used the BP neural network method to program multiple logging data as the input layer of model and finally obtained the percentages of coal component in the output layer. However, the respective specimen has a great impact on the results. 5) Gagarin (2008) attempted to use mineral content to determine ash content of Karaganda coal, but did not involve other coal components. In addition, the mineral content is difficult to determine quantitatively. 6) Man and Yang (2008) proposed fuzzy mathematics to evaluate the content of coal component and achieved a certain success (Huang et al., 2020). However, this method requires specific conditions which are difficult to popularize.
Although many statistical approaches and regression models have been proposed, the application conditions and settings of each method or model vary considerably. In this paper, a multiple regression analysis quantitative method with independent multi-factor variables is proposed based on geophysical log data to determine the content of coal component in coal seam No. 7 (M7) from the Iqe coalfield. We selected coal samples at depths ranging from 1083 to 1374 m to investigate Aad, Vdaf, FCad, and Mad of coal by geophysical log and compared the results with laboratory analyses. The results from this study provides new insights for determining the content of coal components using geophysical log data.
Geological setting
The Qaidam Basin, located in the northwest (NW) China, is one of the basins with the most petroleum and coal production developed on the Qaidam block, with an area of around 1.2 × 10⁵ km2 (Figure 1a and b). Over 10-km-thick sediments were deposited throughout the Late Neoproterozoic to Cenozoic in the Qaidam Basin, and several coal seams were developed during the Carboniferous and Jurassic epochs (Liu et al., 2013). The Jurassic strata in the Qaidam Basin have been widely studied in recent years duo to tremendous coal mining in this basin (Li et al., 2020; Lu et al., 2020; Shao et al., 2014).
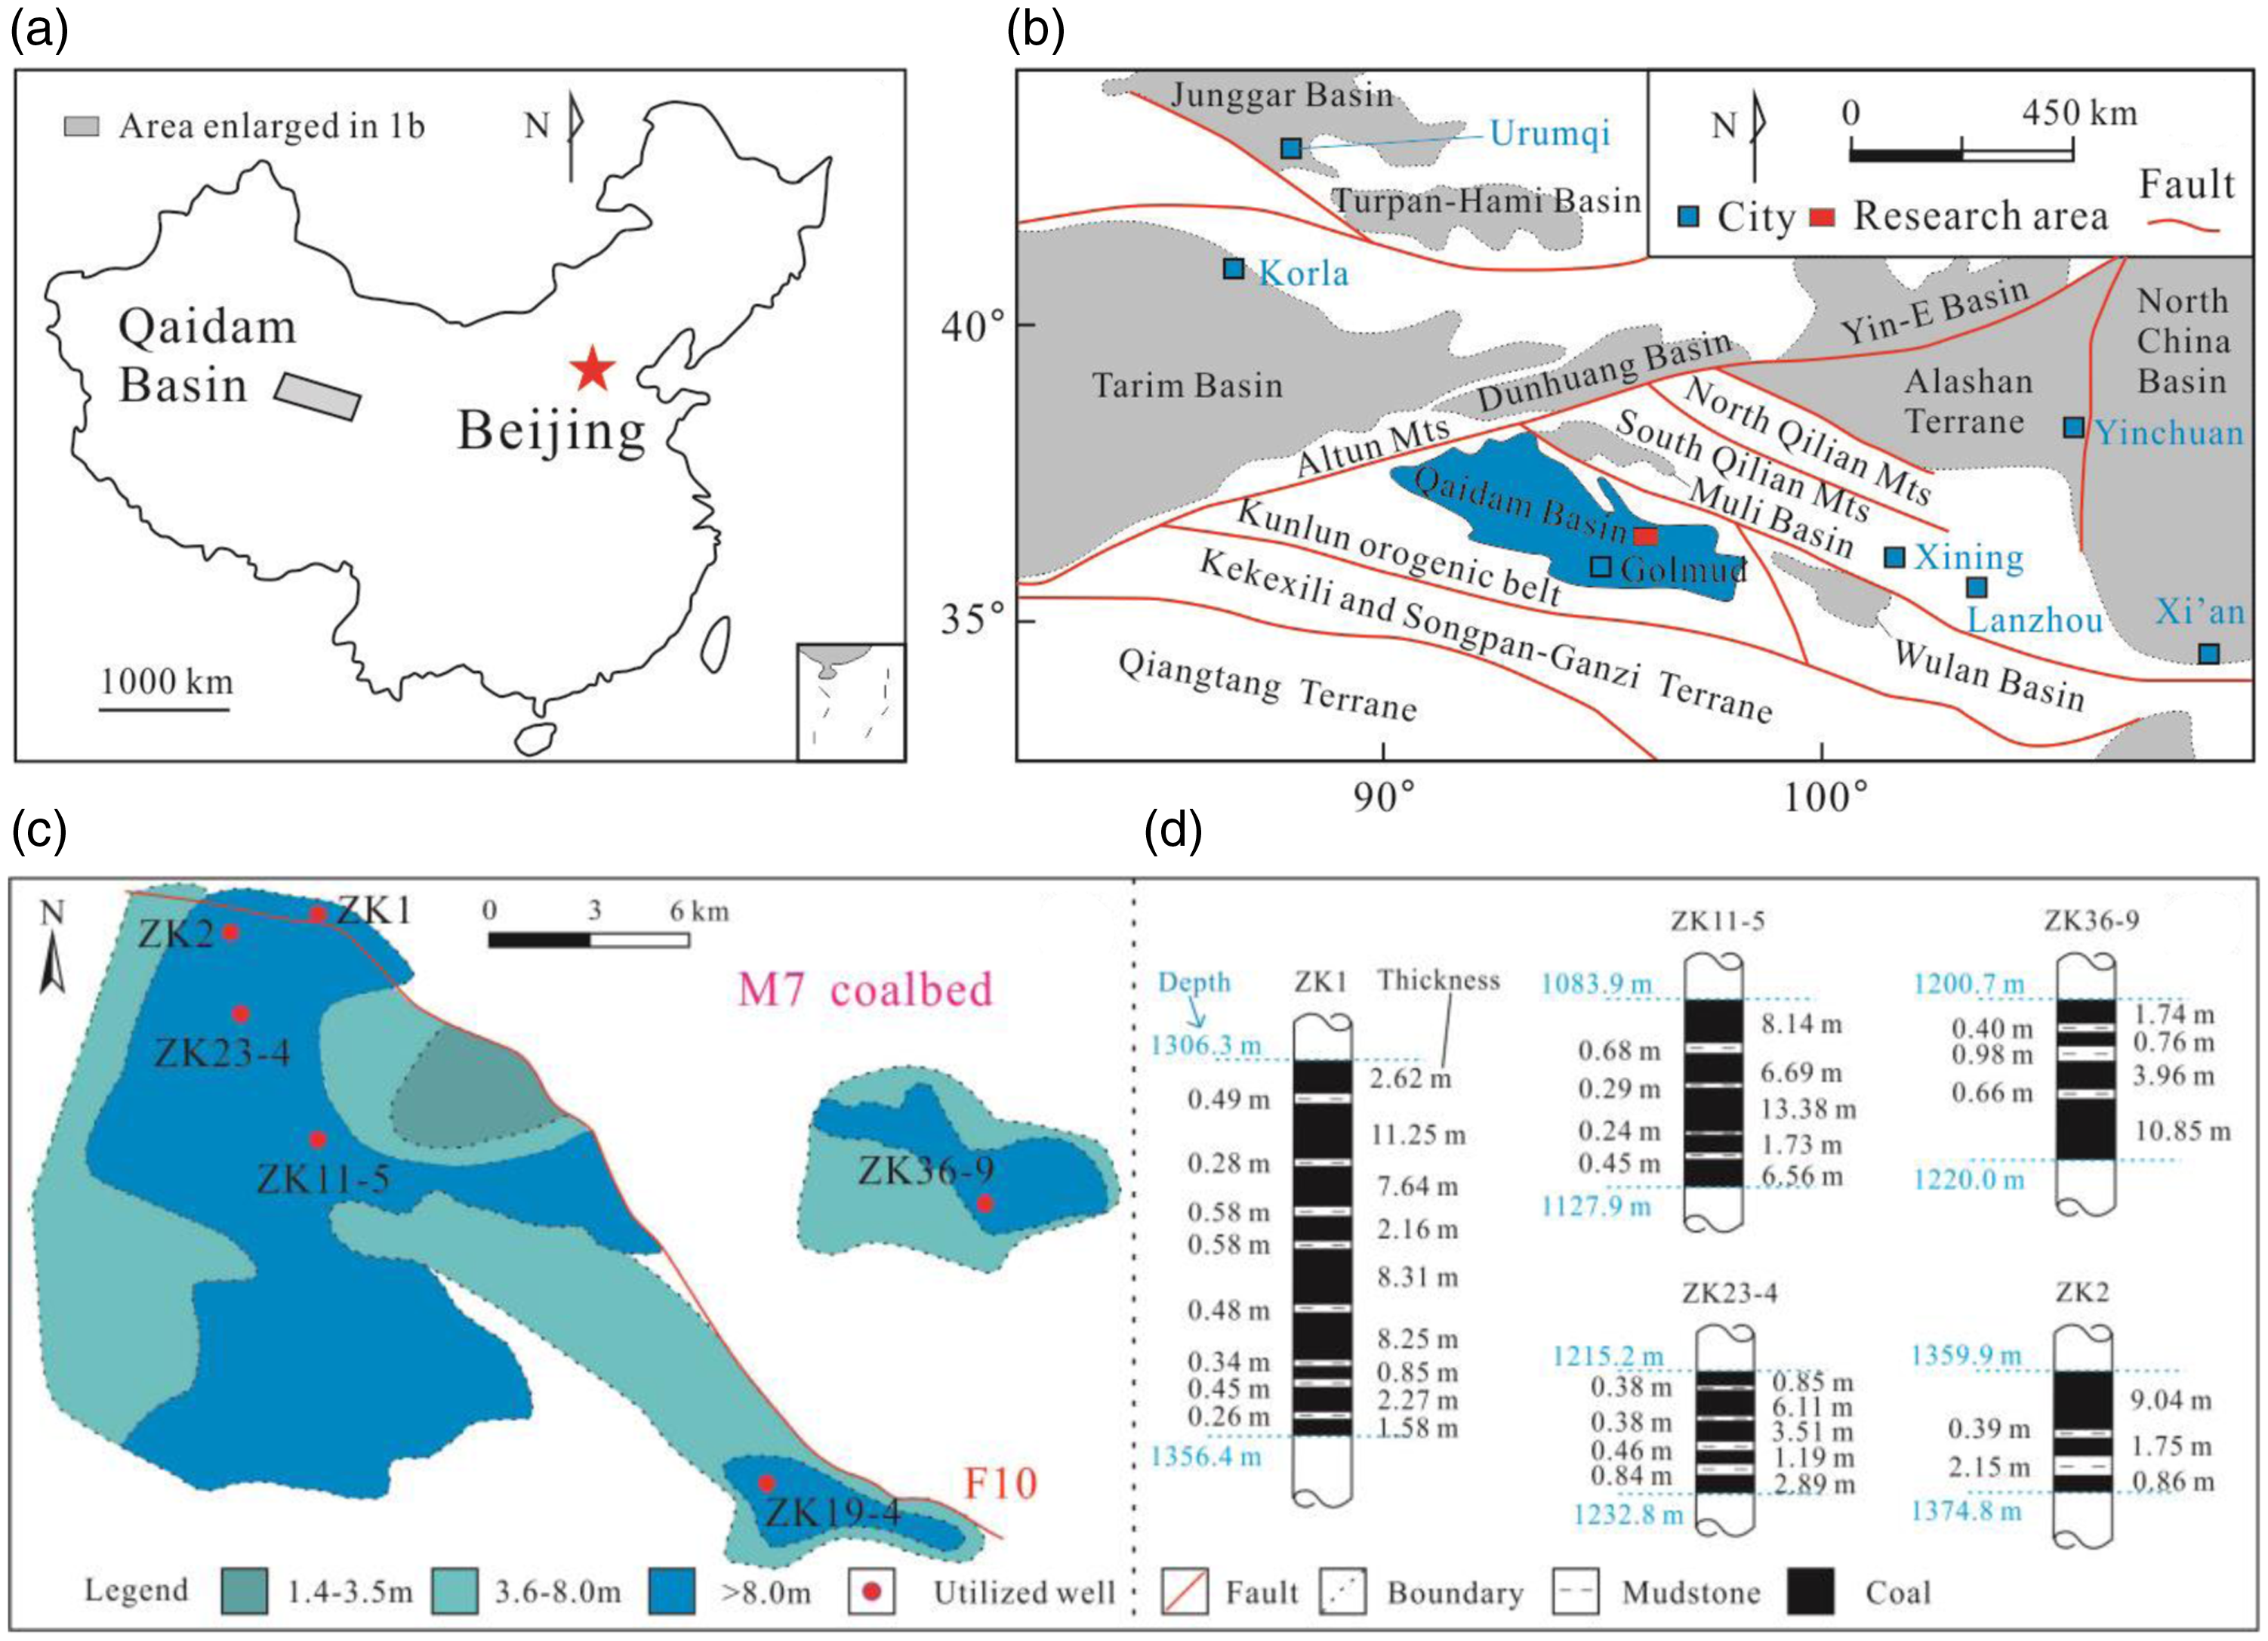
Location and geological setting of the Iqe coalfield Qaidam Basin. (a) Location of the Qaidam Basin on the Map of China. (b) Geological setting around the Qaidam Basin. (c) The thickness contour of M7 coal seam in the Iqe coalfield. (d) Coal seam structure of M7 in different wells.
The Iqe coalfield is one of the most significant coal production bases in Qinghai Province and located in the northern margin of the Qaidam Basin (Figure 1b). The basement of Iqe coalfield is Proterozoic and Ordovician metamorphic rock, and the overlying strata is filled with complete Middle Jurassic sediments (Chen et al., 2019; Liu et al., 2013) (Figure 2). Coal-bearing strata in the Middle Jurassic consist of the Dameigou Formation (J2d) and the Shimengou Formation (J2s), which contain a total of seven coal measures (M1–M7) (Figure 2). Of these, M5 and M7 are the primary mineable coal seams in the Iqe coalfield, with a potential distribution area of 620 km2. The Shimengou Formation is composed of five coal seams and black shale, oil shale, mudstone, and siltstone, whereas only M5 is minable in the entire coalfield, ranging from 0.12 to 41.4 m with an average of 4.9 m (M1 and M2 are un-mineable, M3 and M4 are partly mineable measures), these coal measure strata were formed in delta, fluvial, and lacustrine environments (Liu et al., 2013; Qin et al., 2018). The Dameigou Formation is composed of M6 and M7 coal seams, mudstone, carbonaceous mudstone, and sandstone, which were deposited in fluvial and delta settings (Hu et al., 2019; Lu et al., 2020; Zhao et al., 2017). The thickness of M7 ranges from 1.7 to 105.8 m with an average of 19.3 m, and forming two separate parts in the Iqe coalfield (Figure 1c). In this paper, we focus on the main, mineable M7 coal measure, which is successively distributed in the central part of the Iqe coalfield. Coal types of M7 in the Iqe coalfield are mainly subbituminous coal and non-caking coal. The macrolithotypes of M7 primarily consist of semibright coal, followed by bright coal and semidull coal, with a dark to black color, parallel bedding, and a lumpy structure, as well as a glass-golden luster (Chen et al., 2019).
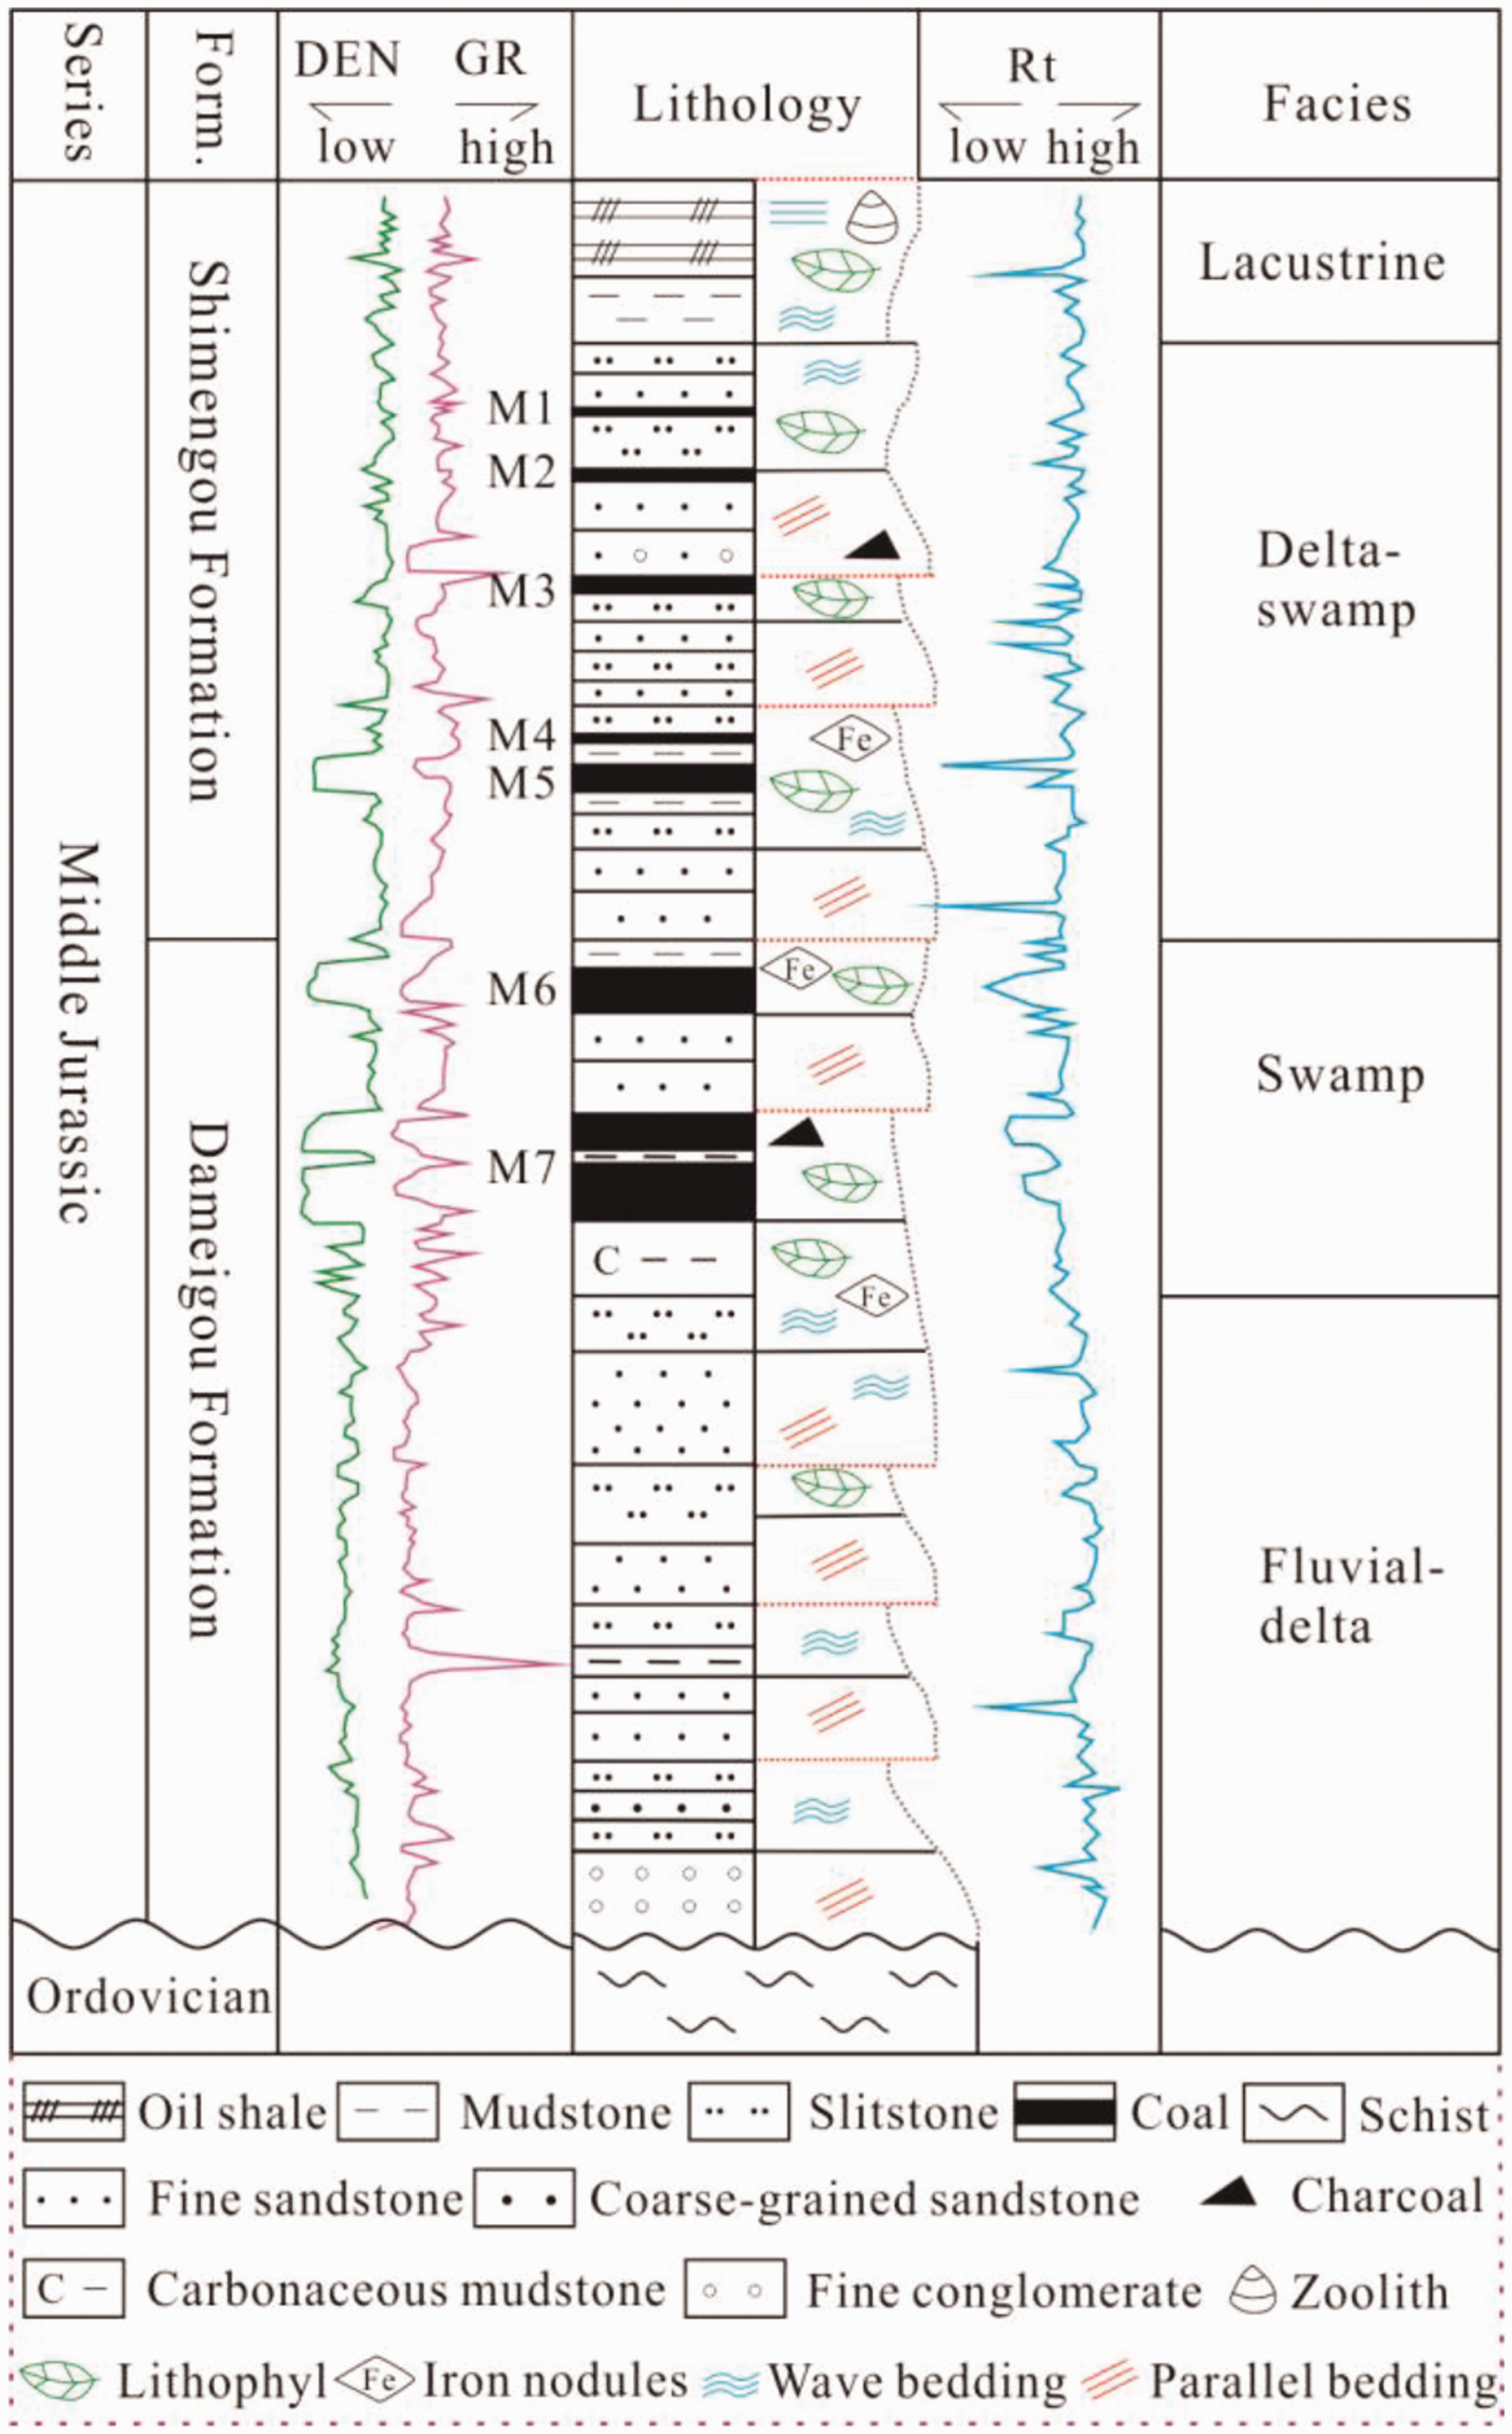
Integrated histogram of the coal measure strata in the Middle Jurassic of Iqe coalfield.
Samples and analytical procedures
For this study, 28 samples were collected from M7 coal seam of the ZK1, ZK2, ZK11-5, ZK23-4, and ZK36-9 wells. Samples depths ranged from 1,083 to 1,374 m and sample thickness from 0.4 to 1.1 m (Figure 1d). All samples were analyzed for ash yield, volatile matter, and moisture in the Key Laboratory of China National Administration of Coal Geology.
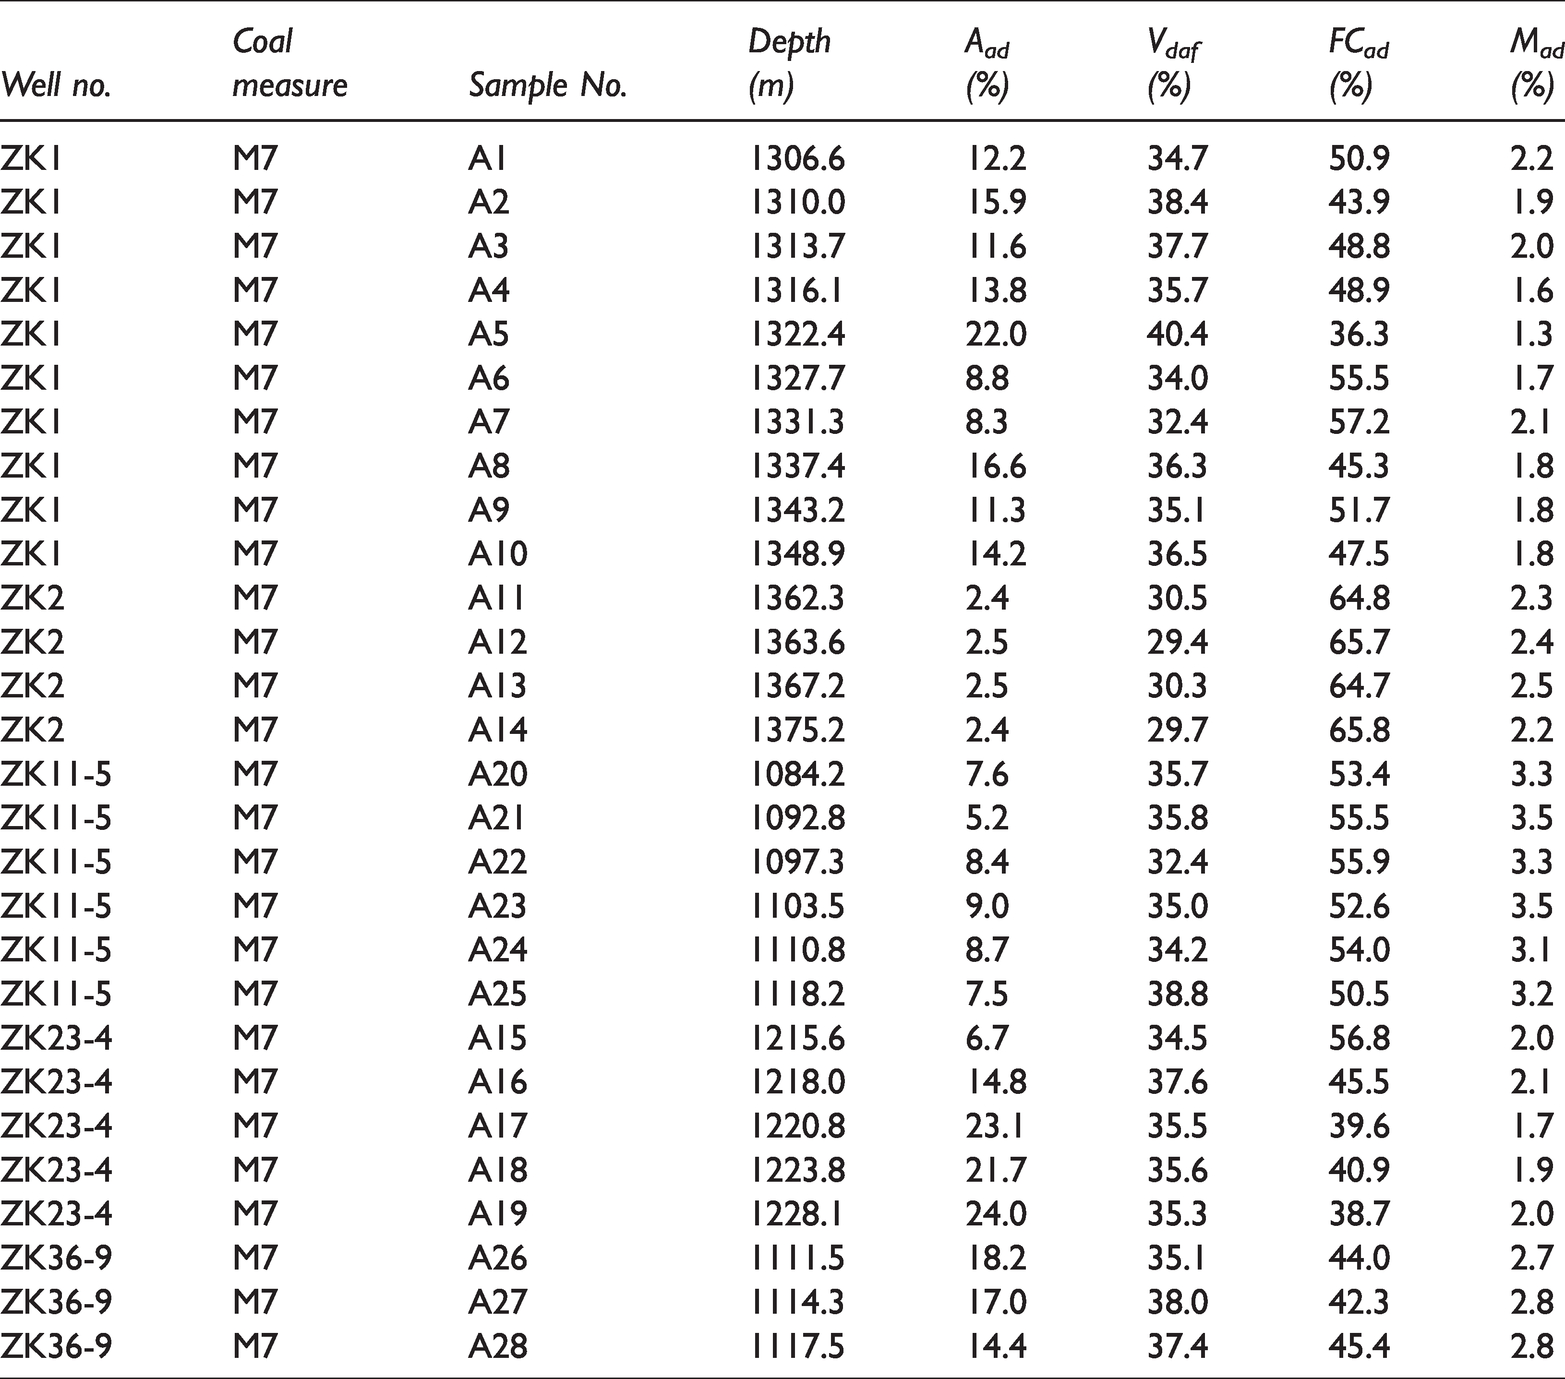
Ash yield determination was performed using a heating furnace with 1-g sample. Air was advanced into the furnace, and subsequently, the temperature was set at 500°C and maintained for 30 min, followed by further heating to 815°C. The samples were automatically weighed every 5 min until constant weight for 10 min, with weight variations less than 0.0005 g. The moisture content was determined using a heating furnace. For this, 1-g sample was placed on a dry crucible and air was fed into the heating furnace. The temperature was increased to 105°C–110°C at 5°C/min. The samples were automatically weighed every 5 min until constant weight for 10 min, and subsequently, the moisture content was determined based on mass loss. Volatile matter was measured with 1-g samples using a heating furnace. The temperature was increased to 900°C, and during this period, nitrogen was fed into the heating furnace at 120 times per hour, then transported the sample into the furnace keeping for 7 min. Ash yield, volatile matter, and moisture analysis followed the Chinese Standard Method GB/T 30732 − 2014 with a precision above ± 0.0005 g. Fixed carbon is the organic matter remaining in the coke slag after high-temperature pyrolysis of coal samples. The fixed carbon content is the percentage of coal samples (100%) minus the moisture, ash yield, and volatile contents (China National Coal Association, 2009). The results of coal petrol analysis are shown in Table 1.
Proximate analysis of M7 from 5 wells in the Middle Jurassic Dameigou Formation.
Geophysical logging data used in this study were determined using PSJ-2 type digital logging apparatus on these selected wells. The log parameters include SP, CAL, DEN, GR, AC, SP, RLLS, and RLLD, and the logging data have been demonstrated that are available and reliable by standardized correction and practical application in coal exploration.
Establishment of the relationship between log parameters and coal components
Principle of log interpretation
The geophysical log interpretation is widely applied for calculating coal components, such as ash yield, volatile, fixed carbon, and water contents (Lu et al., 2021; Sayan et al., 2016; Shao et al., 2013). The primary theoretical basis for using logging data to evaluate coal components is multiple regression analysis (Sayan et al., 2016; Shao et al., 2013; Scott et al., 2007). Based on the different contributions of coal components to DEN, GR, AC, and RLLD, we propose the response equation to determine the petrological parameters of M7 in the Iqe coalfield. In addition, as a low-porosity and low-permeability character, coal not only develop matrix pores but unique cleat fractures (Bond et al., 1971; Edwards and Banks, 1978). Therefore, the establishment of coal petrological volume model is the prerequisite and basis for logging interpretation and evaluation.
Multiple statistical regression analysis was widely used to determine the quantitative relationship between two or more variables (Lamberson and Bustin, 1993). The least square method can be used to program the linear relationship, such as y = a0 + a1x1 + a2x2 + a3x3…, where a0 is a constant, x is log parameter, and a1, a2, and a3…are regression coefficients. Coal components, as dependent variable y, was used for multiple regression equation calculation. Through sensitivity analyzing of logging data, the most relevant log parameters, such as GR, DEN, and AC…, are selected as independent variables. Finally, according to the multiple regression analysis among coal components and log parameters, the calculation model of each coal component is optimized.
Sensitivity analysis
Although some kinds of geophysical parameters of coal components (such as the acoustic velocities of ash yield, volatile components, and fixed carbon) cannot be determined directly, we can build relationships between geophysical log parameters (GR, DEN, AC, and RLLD) and coal components (Aad, Vdaf, FCad, and Mad) using the least square method (Dong, 2008). However, the correlation among different coal components and log parameters exhibit a relatively large variation (Figures 3 to 5). Generally, different well logs contribute various responses to coal seam, for example, low GR and DEN, negative abnormality of SP, and high AC, RLLS, and RLLD values have been detected in coal seam (Fu et al., 2009a; Hou, 2000; Rai et al., 2004; Roger, 2005). In this study, we selected the well logs of DEN, GR, AC, SP, RLLS, and RLLD to identify coal seam and evaluate coal components. Partially high-resolution log data have been used to identify and evaluate coal components, and the sensitivity analysis are as follows:
Aad
Ash yield plays a significant role and is a key parameter among the coal components because it closely relates to other coal components (Shao et al., 2013). Therefore, an effective logging interpretation model of Aad should be first established to facilitate the building of other models. The relationships between Aad and DEN, GR, AC, and RLLD indicate that Aad is positively correlated with DEN and GR (Figure 3a and b), but has a poor correlation with AC and RLLD (Figure 3c and d). That is because of the low ash content (between 2.4 and 24.0%, av. 11.8%) of M7 in the Iqe coalfield, which generally corresponds to a low DEN (Chatterjee and Paul, 2013; Ghosh et al., 2014). The radioactivity of M7 coal is quite low, may cause by low clay mineral content, which is also supported by the mineral analysis results of M7 from Sun et al. (2015). A strong positive relationship between Aad and GR of M7 indicates that GR would be a significant parameter to calculate Aad (Figure 3b). Coal with low DEN values commonly have well-developed pores and fractures as well as high AC values (Fu et al., 2009a). Generally, the Aad content tends to decrease as resistivity increases (Fu et al., 2009b). A poor relationship between RLLD and Aad may cause by coal structure and Mad content (Figure 3d). According to the sensitivity analysis of different well logs and Aad, DEN and GR should be selected to optimize during the establishment of Aad model.
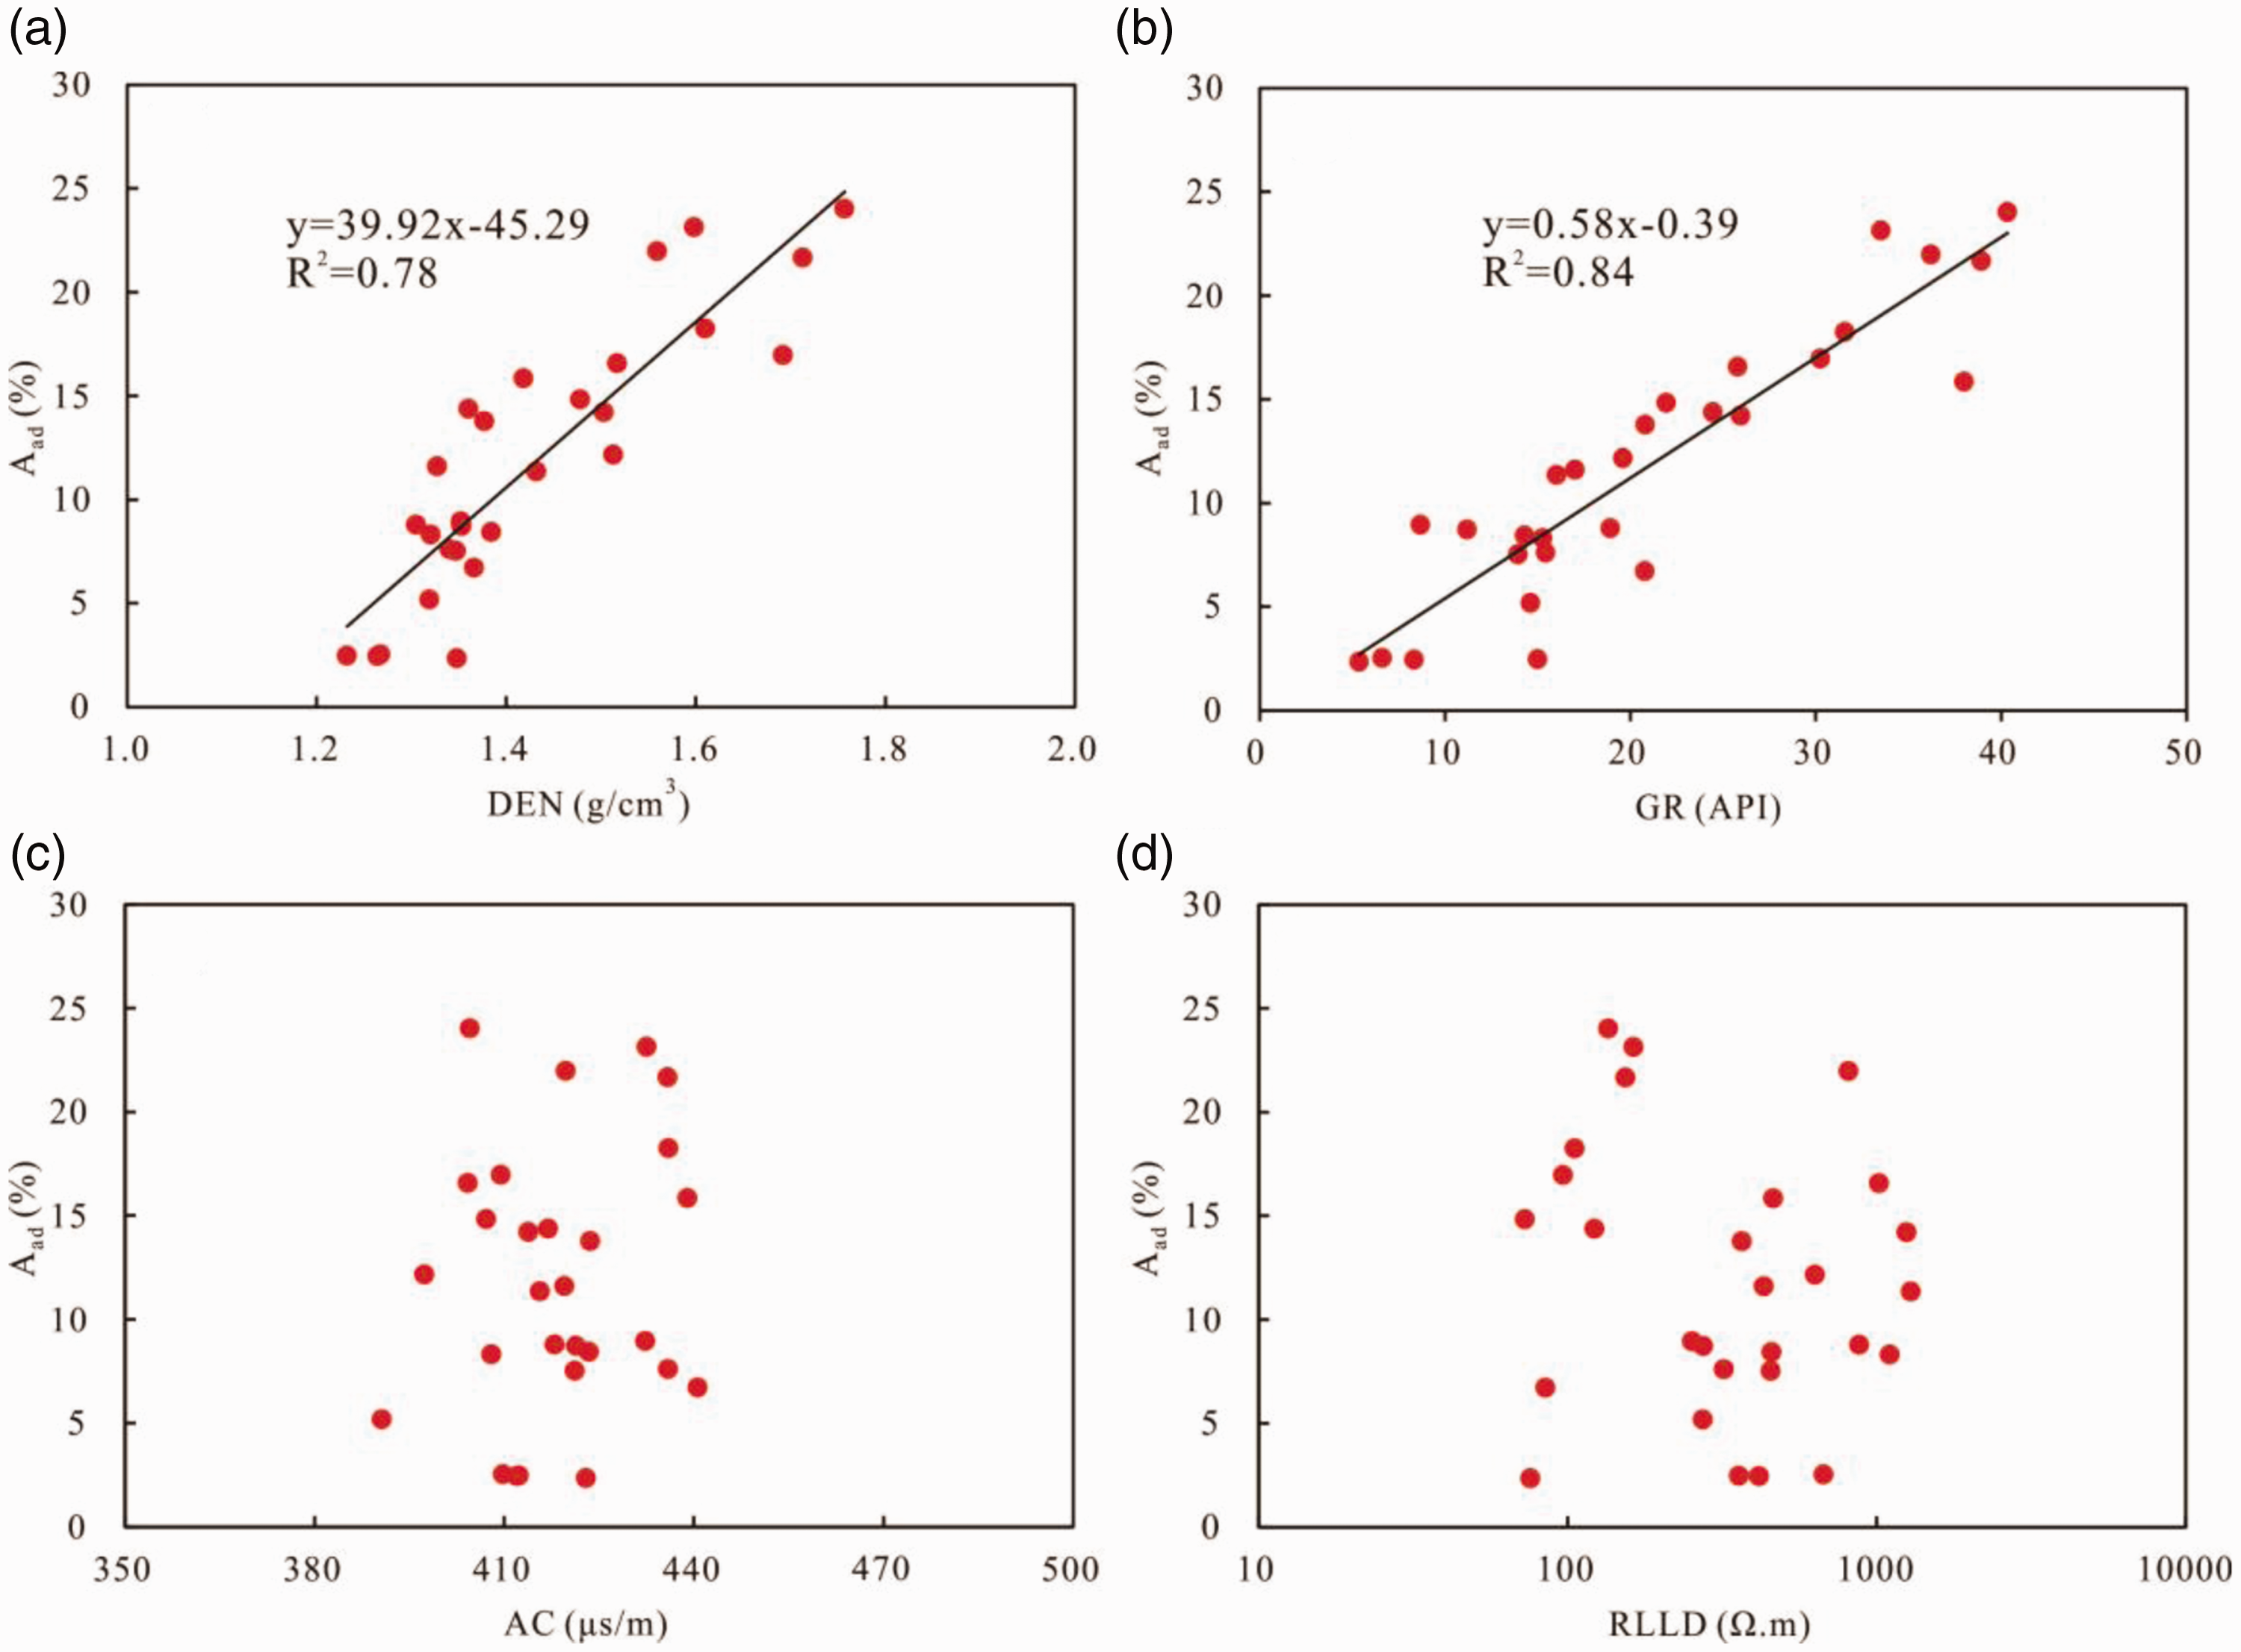
Cross-plots of Aad and related well logs. (a) Relationship between Aad and DEN. (b) Relationship between Aad and GR. (c) Relationship between Aad and AC. (d) Relationship between Aad and RLLD of coal.
Vdaf
The coalification degree, the depositional environment and coal petrologic types are the main factors controlling the Vdaf content (Scott et al., 2007). Commonly, the Vdaf content decreases with increasing coalification degree duo to coal molecules structure changes (Nie and Wang, 2012), as a result, lignite has higher Vdaf values, while Vdaf values of anthracite is the lowest. The Vdaf values of studied coal samples ranged from 29.4% to 40.4%, with an average of 35.1% (Table 1), coinciding with those of subbituminous coal and non-caking coal in the Iqe coalfield (Chen et al., 2019). The relationships between Vdaf and DEN, GR, AC, and RLLD indicate that Vdaf is weak to moderate positively correlated with DEN and GR, and has a poor correlation with AC and RLLD (Figure 4). Furthermore, a moderate relationship between Vdaf and Aad (R2=0.59) suggest that Aad content should be used as an independent variable in regression analysis for Vdaf content (Figure 4e). Interestingly, a good relationship between DEN and GR (R2=0.68) indicates that both of them are key parameters for determining the coal components. According to the sensitivity analysis of different well logs and Vdaf values of M7, GR and DEN should be selected to optimize in the establishment of Vdaf model, and Aad can be used as the auxiliary sensitivity parameter.
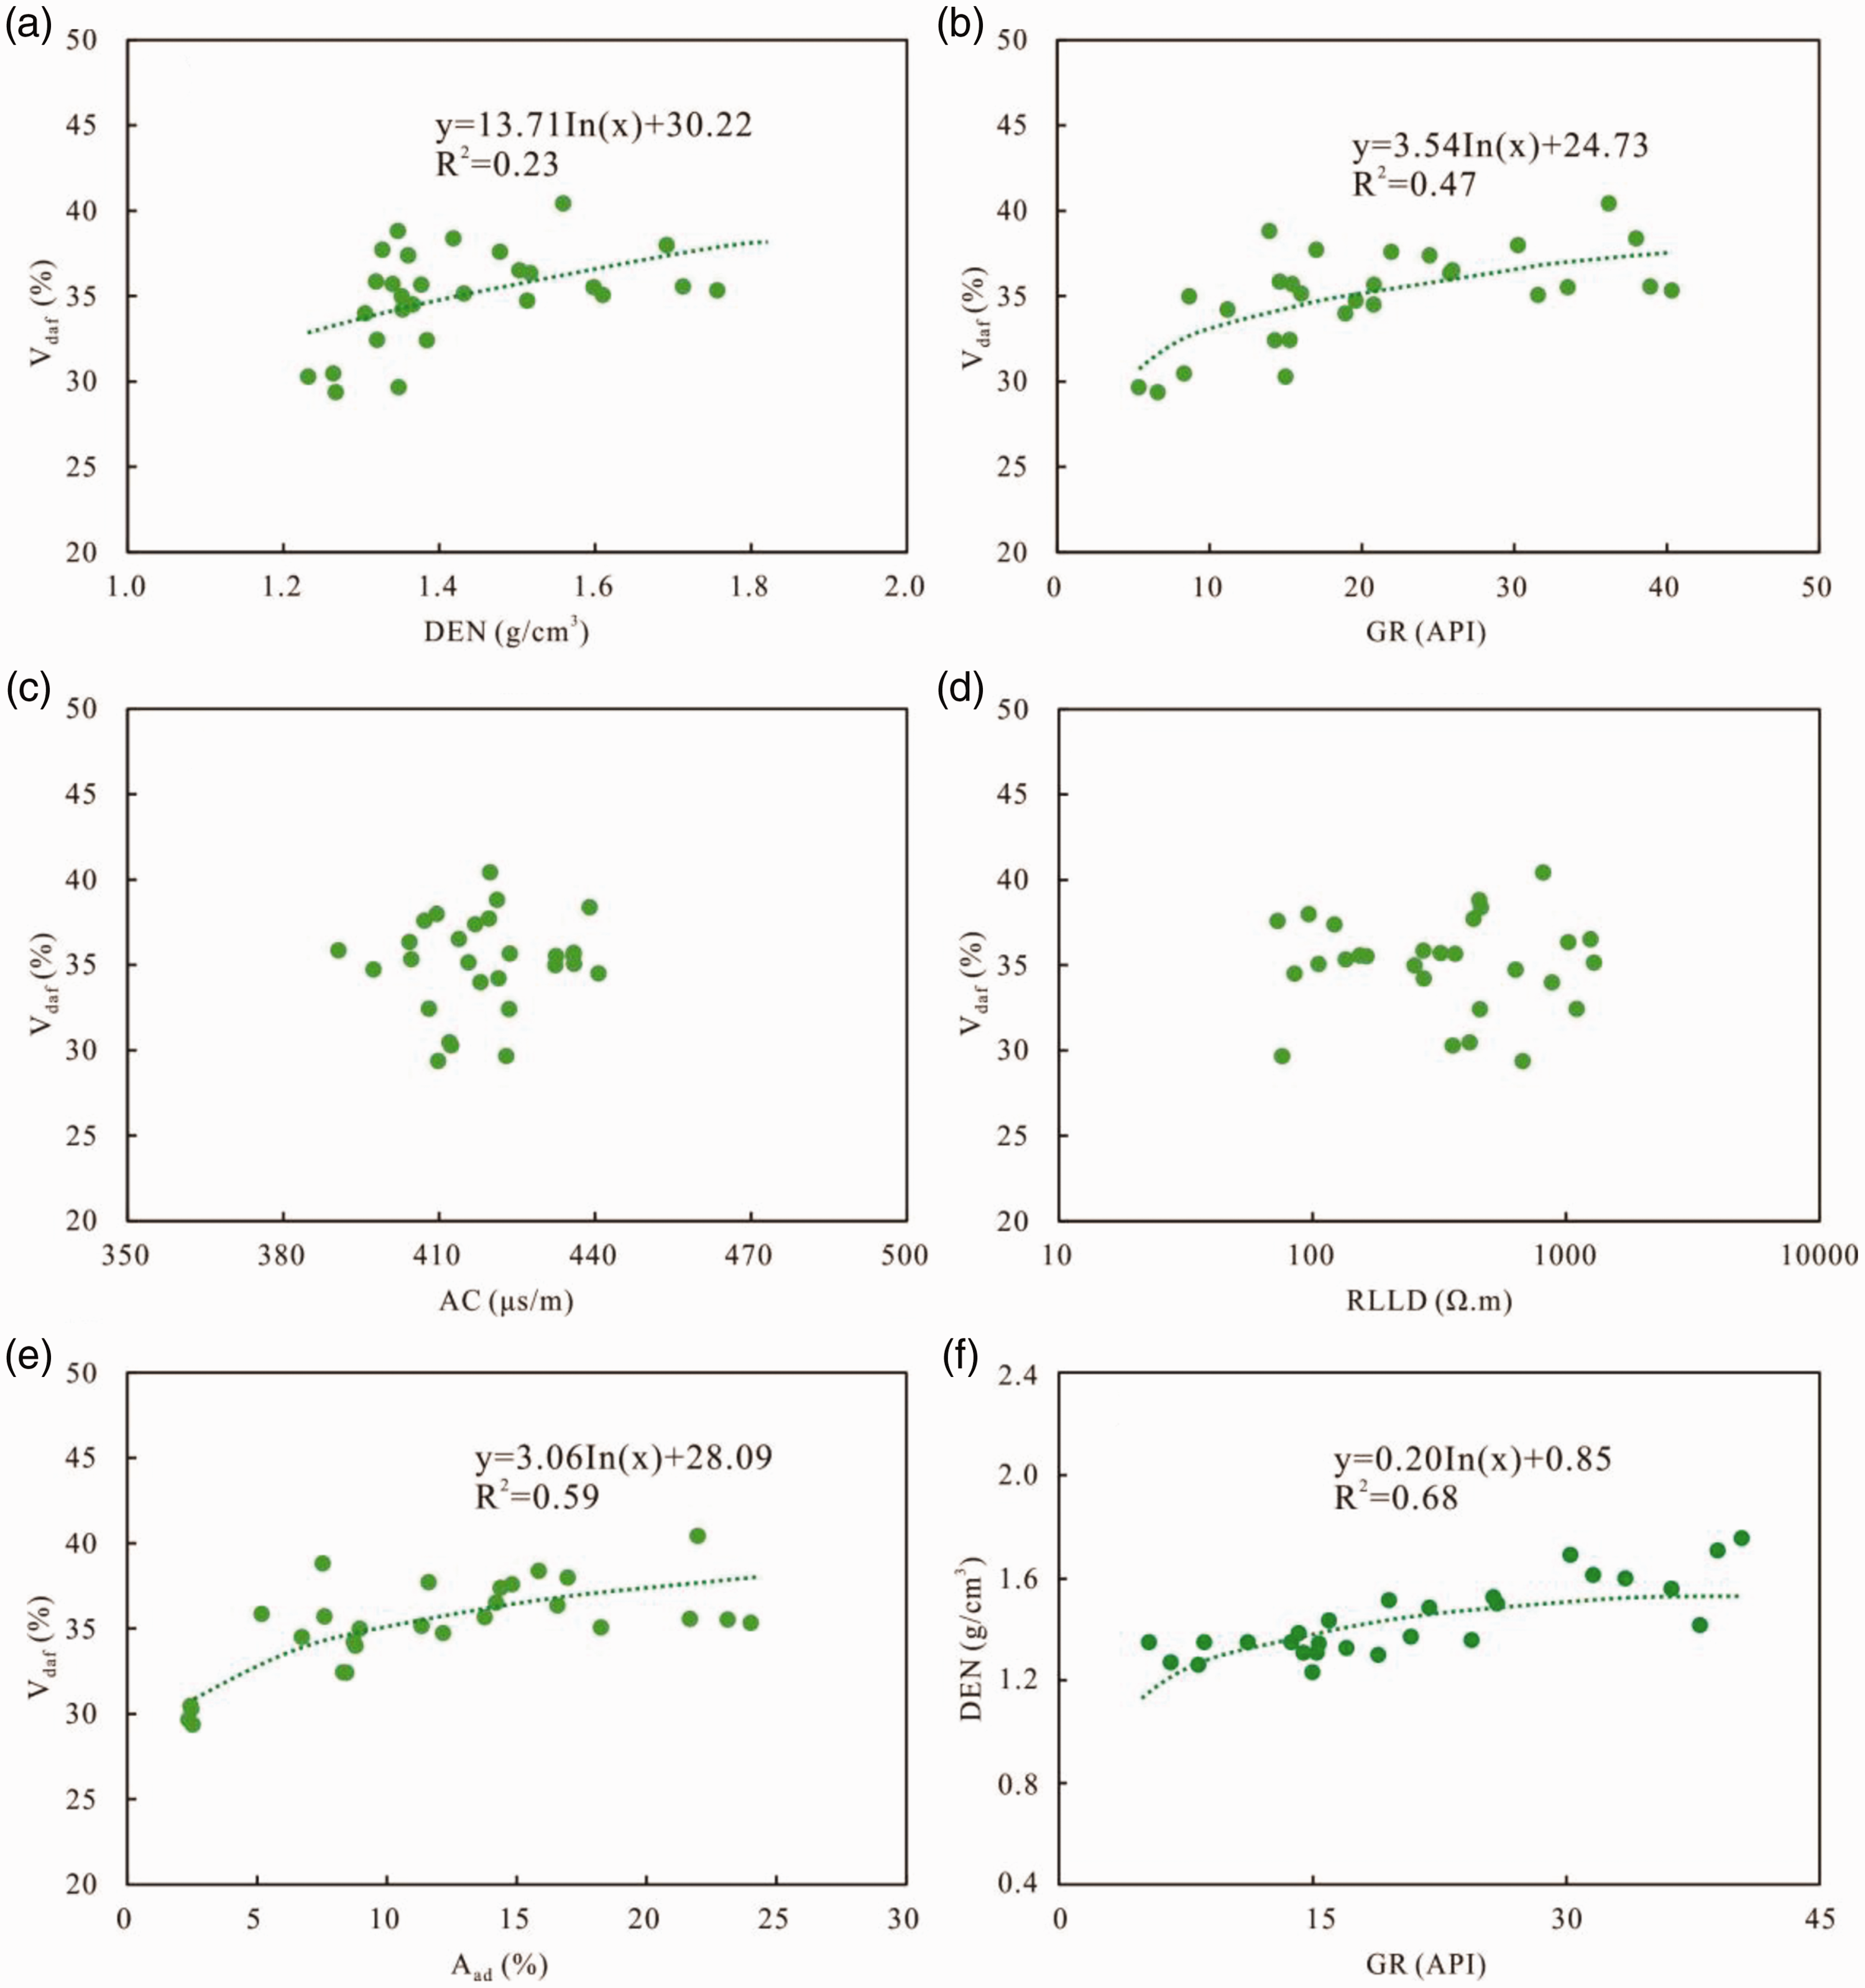
Relationships between Vdaf and discussed well log values and Aad. (a) The intersection diagram of Vdaf and DEN. (b) The intersection diagram of Vdaf and GR. (c) The intersection diagram of Vdaf and AC. (d) The intersection diagram of Vdaf and RLLD. (e) The intersection diagram of Vdaf and Aad. (f) The intersection diagram of DEN and GR.
FCad
The FCad content is one of the most important geological parameters for evaluating coal property (Hong, 2008; Sayan et al., 2016). Generally, the value of FCad is calculated in laboratory analysis, the results of the studied samples ranges from 36.3% to 65.8% with a mean value of 50.8% (Table 1). The relationships between FCad and DEN, GR, AC, and RLLD indicate that FCad has good negative correlations with DEN and GR, whereas poor correlations with AC and RLLD (Figure 5a to d). Furthermore, FCad has strong negative correlation with Vdaf and Aad (Figure 5e and f), suggesting that Vdaf and Aad content in the studied samples have significant influence on FCad content. According to the sensitivity analysis of FCad and different well logs, as well as Vdaf and Aad content, the sensitivity parameters, such as DEN, GR, Vdaf, and Aad, should be chosen to optimize the FCad calculating model.
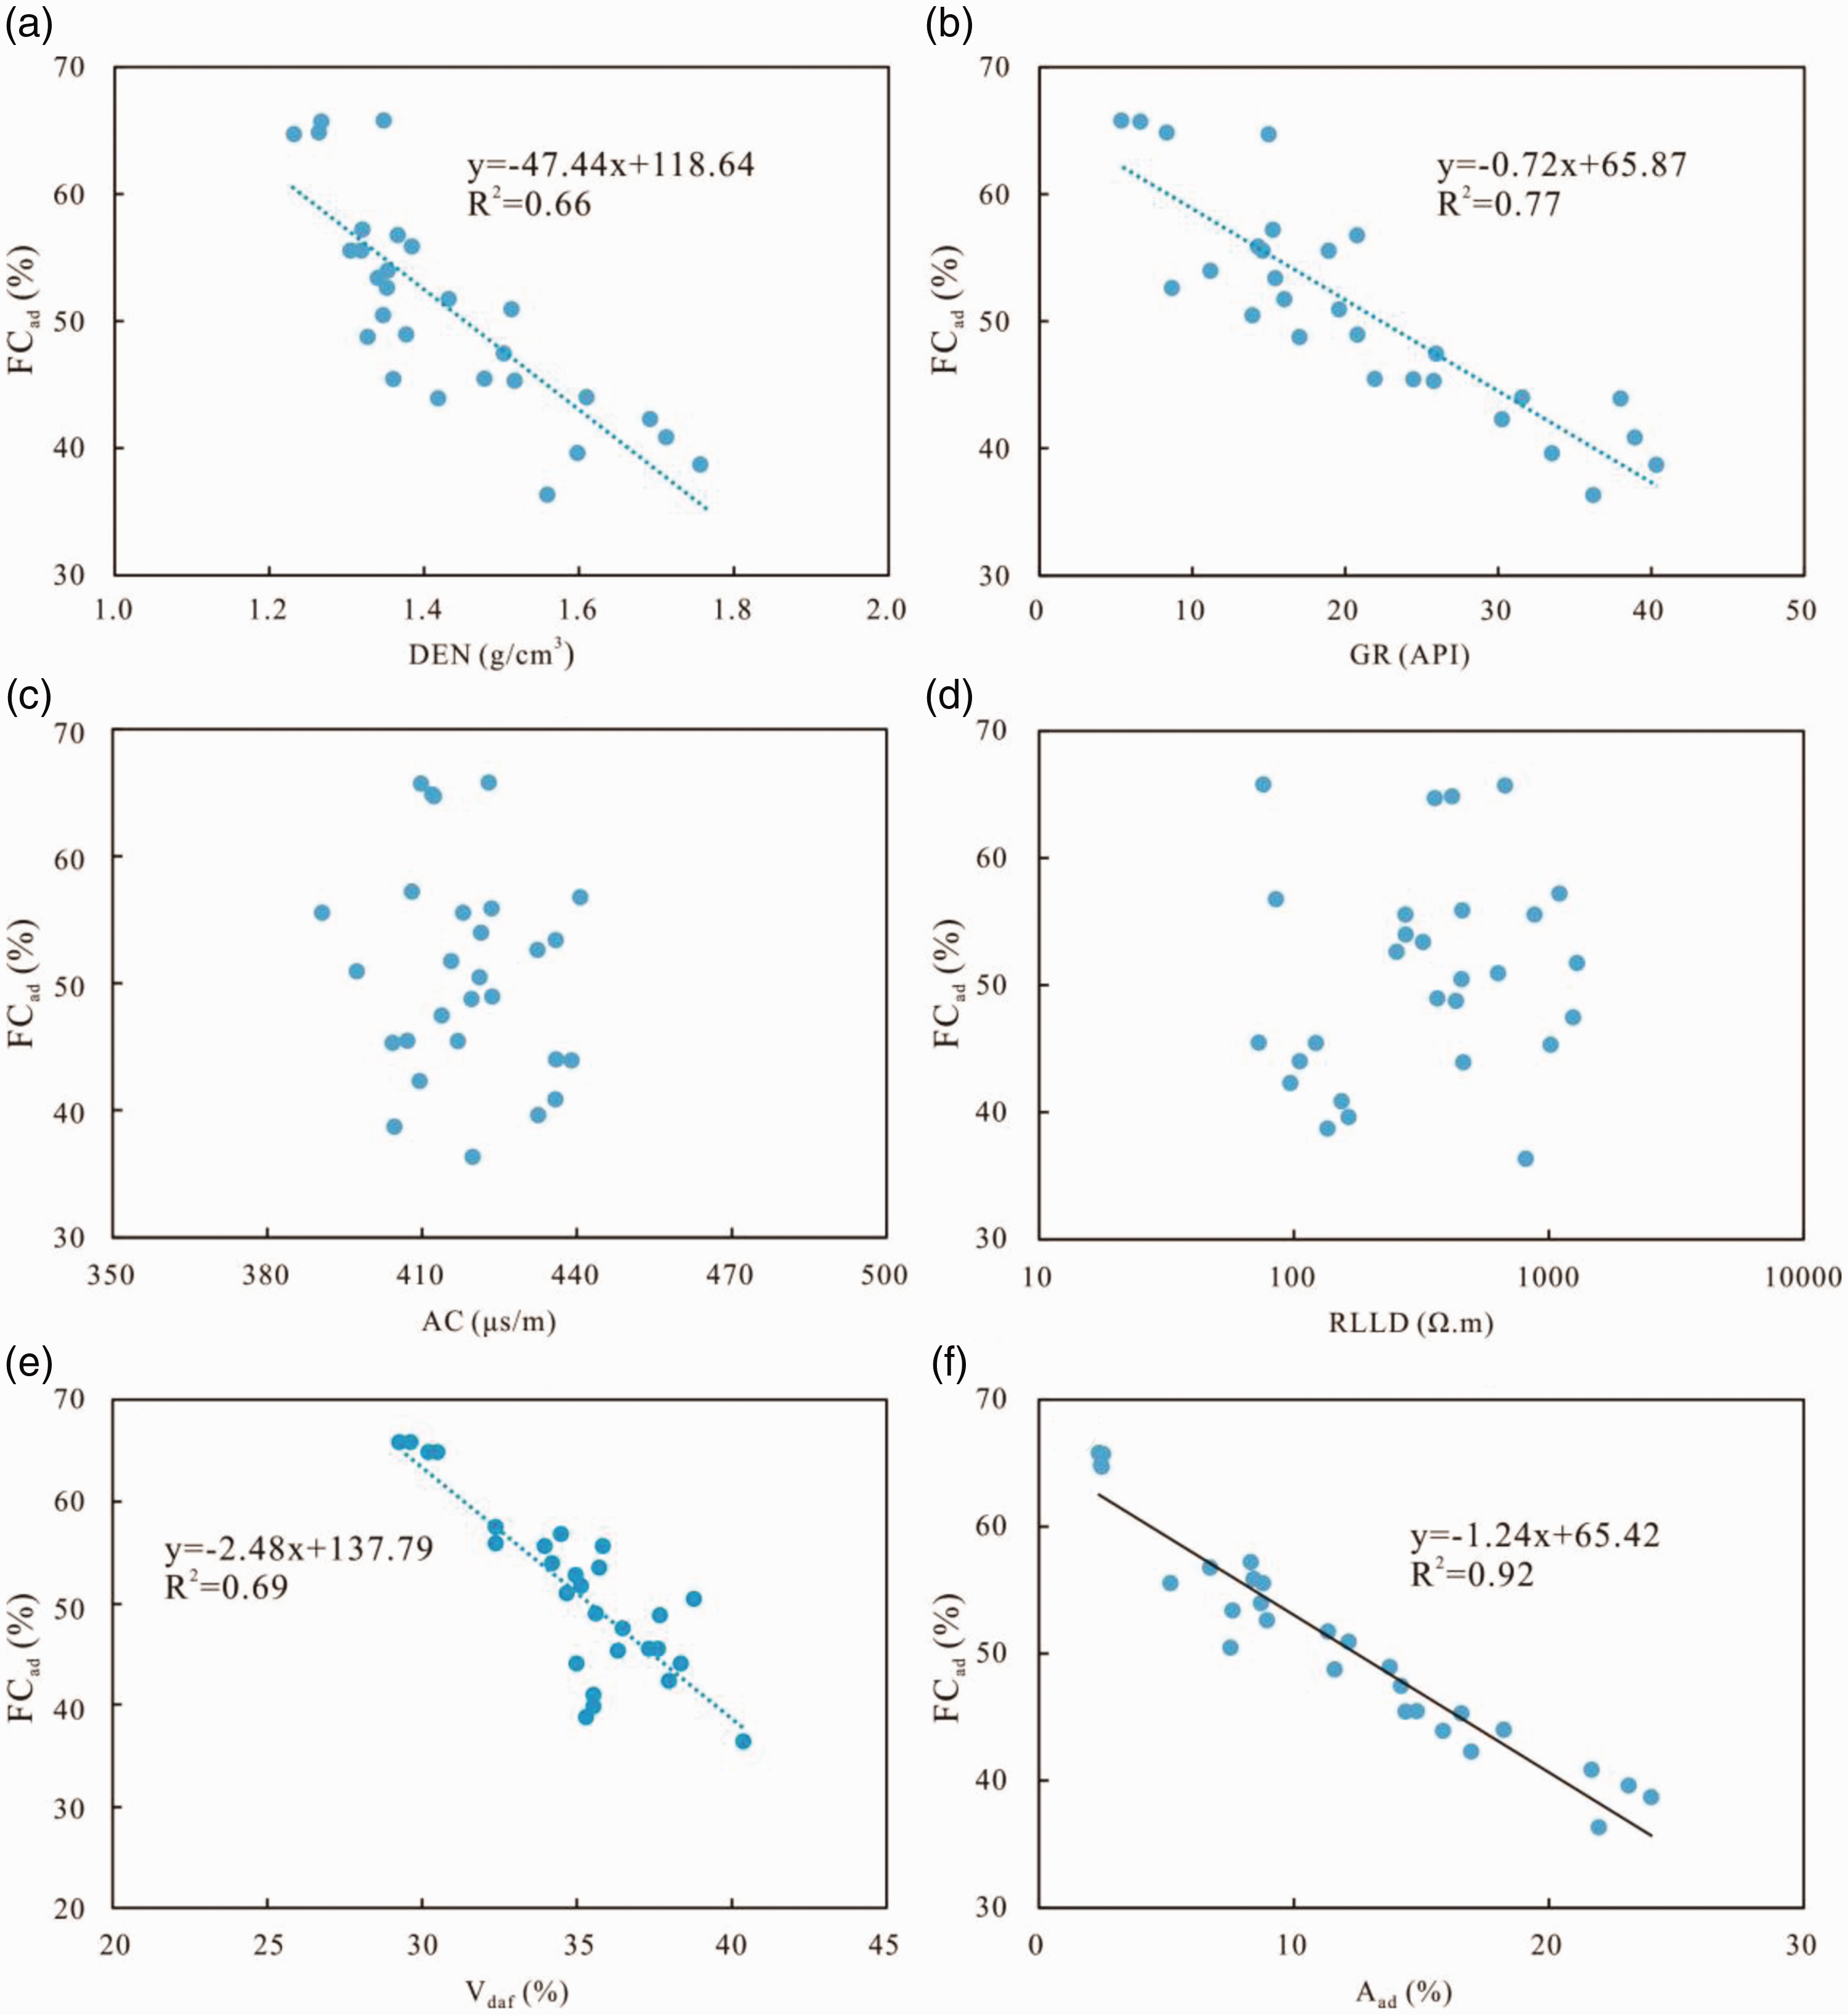
Relationships between FCad and related well log values and Aad. (a) Relationship between FCad and DEN. (b) Relationship between FCad and GR. (c) Relationship between FCad and AC. (d) Relationship between FCad and RLLD. (e) Relationship between FCad and Vdaf. (f) Relationship between FCad and Aad.
Mad
The content of Mad in coal samples can be calculated according to the “rock volume model”, which divide the unit volume of coal into four parts (Aad, Vdaf, FCad, and Mad). Here note that not considering the gas content in coal because only a small amount of gas was contained within the coal reservoirs (Sayan et al., 2016; Shao et al., 2013; Yang et al., 2007):


Where Aad is the ash yield, %; Vdaf is the volatile matter content, %; FCad is the fixed carbon, %; Mad is the moisture, %.
As discussed above, we found that the Aad, Vdaf, and FCad of studied samples from five wells in the Iqe coalfield are closely related to DEN and GR logs. In contrast, AC and RLLD logs have a poor correlation with these coal components. Therefore, DEN and GR are the primary proxies for building the log interpretation models, as well as considering the relationships among coal components.
Log interpretation model of coal components
Based on the sensitivity analysis results of coal components and DEN, GR, AC, and RLLD logs, the regression calculations for three kinds of coal components were performed using different log interpretation models to obtain the available correlation coefficients.
Aad model
To establish the Aad model, the following equations have been acquired based on DEN and GR logs (Table 2). The regression coefficient in model 3 is relatively high and can be regarded as an available calculating model for M7 coal in the Iqe coalfield.
Regression equations and coefficients of the Aad content.
Vdaf model
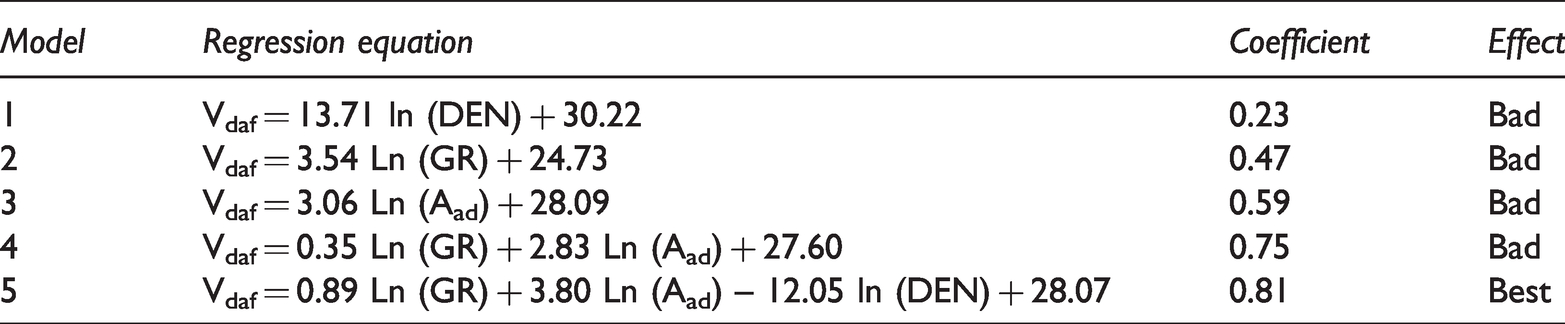
As mentioned above, a good positive relationship between Vdaf and GR, DEN logs, as well as Aad content suggest that these factors are important to Vdaf. Thus, the log interpretation model of Vdaf was established using these sensitivity parameters based on multivariate regression analysis, and the acquired models are exhibited in Table 3. By comparing the regression coefficient, we propose that model 5 is the best calculating model for Vdaf in this study.
Regression equations and coefficients of the Vdaf content.
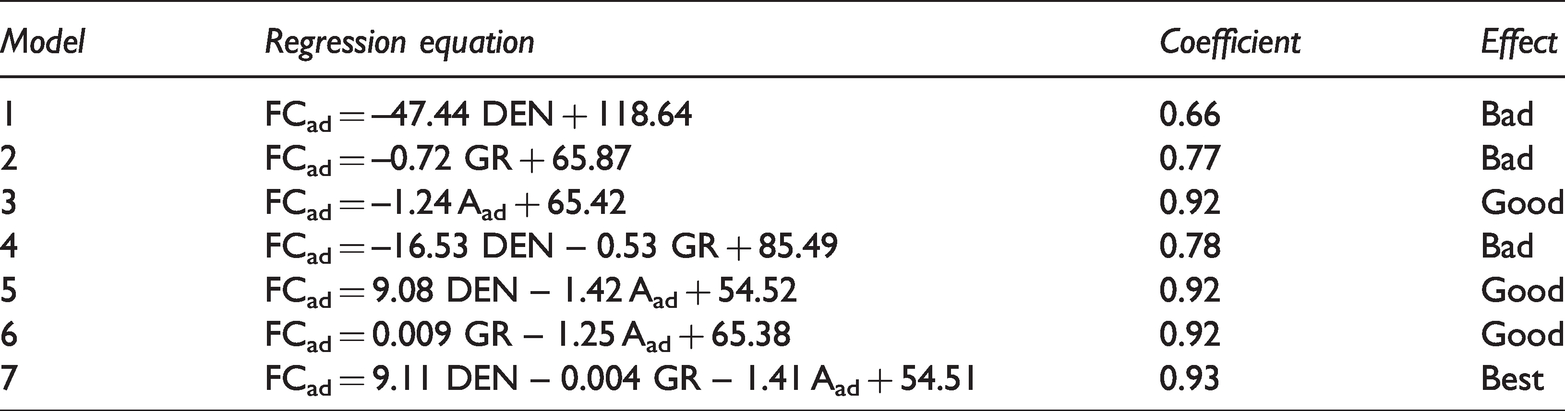
FCad model
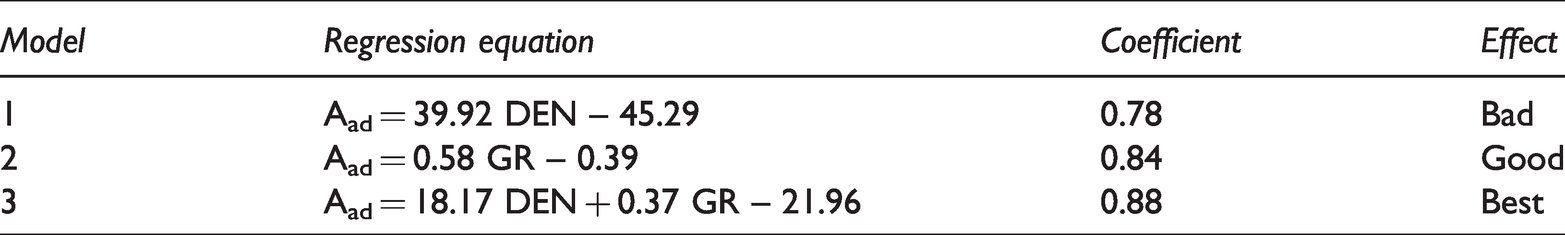
According to the sensitivity analysis, the well logs of DEN and GR, and Aad are significant sensitivity parameters to evaluate FCad. Multiple regression analysis has been performed to obtain the regression equation and regression coefficient using these significant sensitivity parameters and laboratory analysis results of coal samples, and the results are shown in Table 4. Obviously, model 7 is more proper to calculate the FCad values of M7 in Iqe coalfield.
Regression equations and coefficients of FCad content.
Case studies
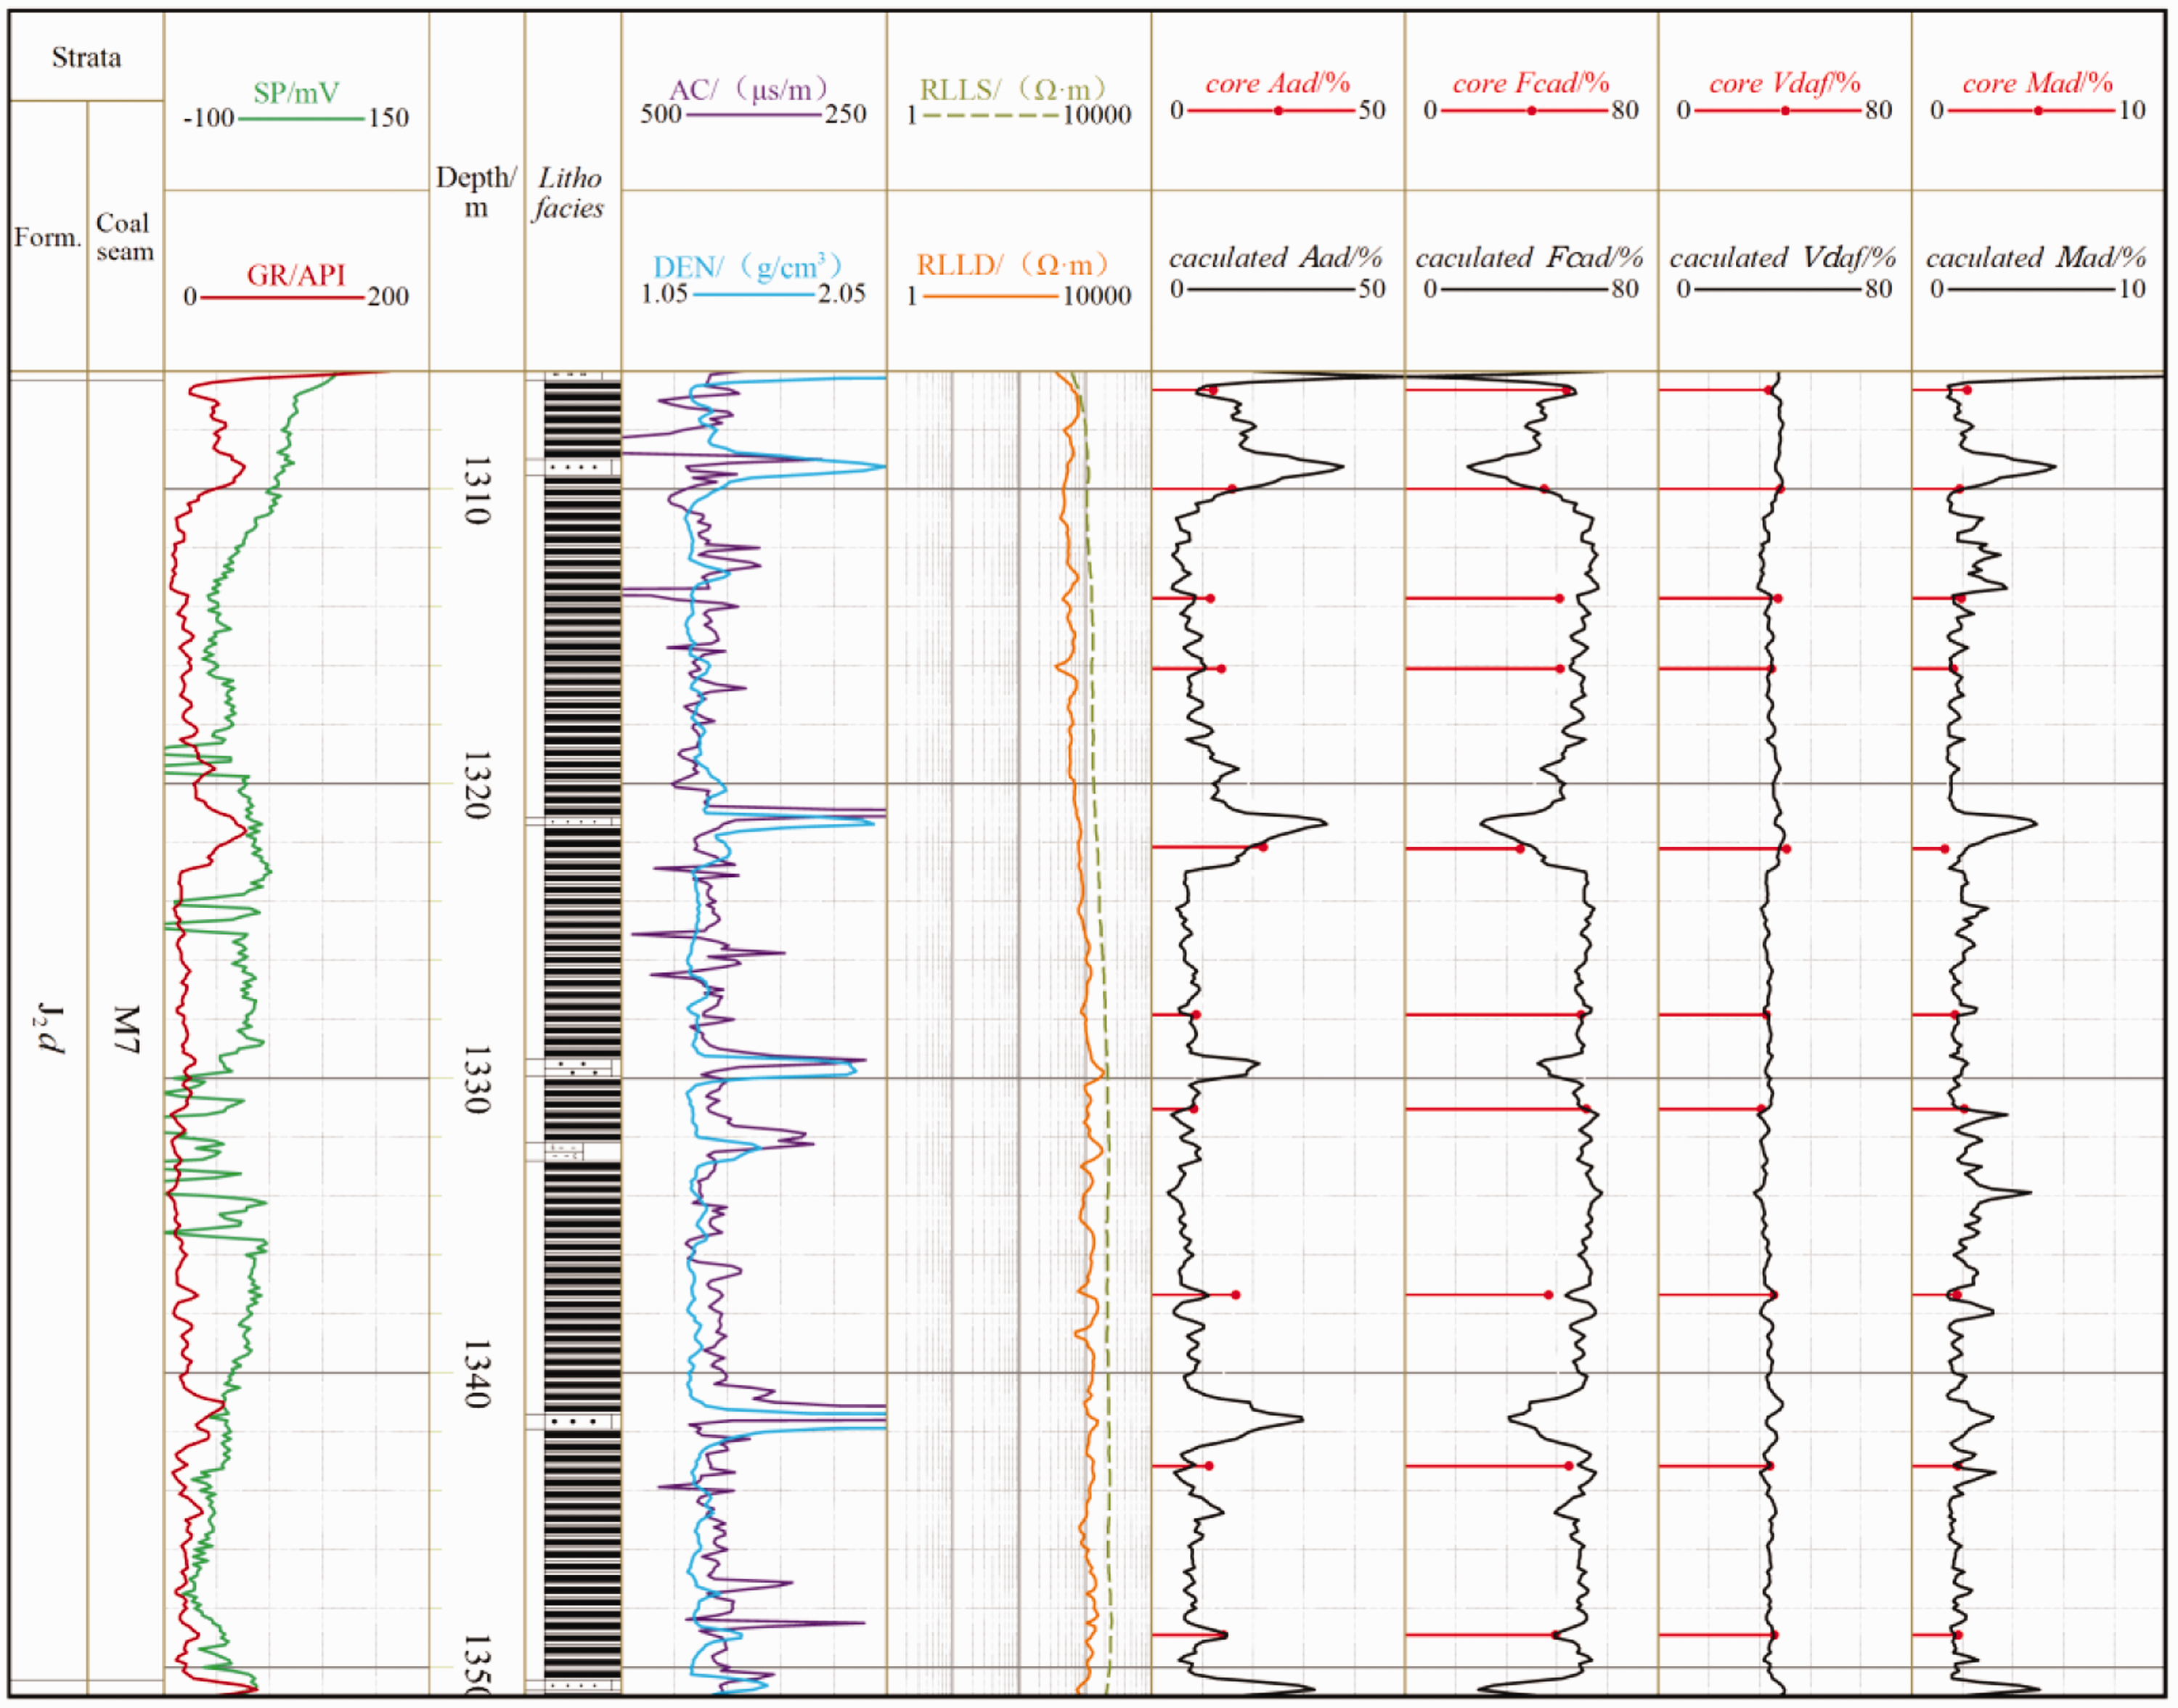
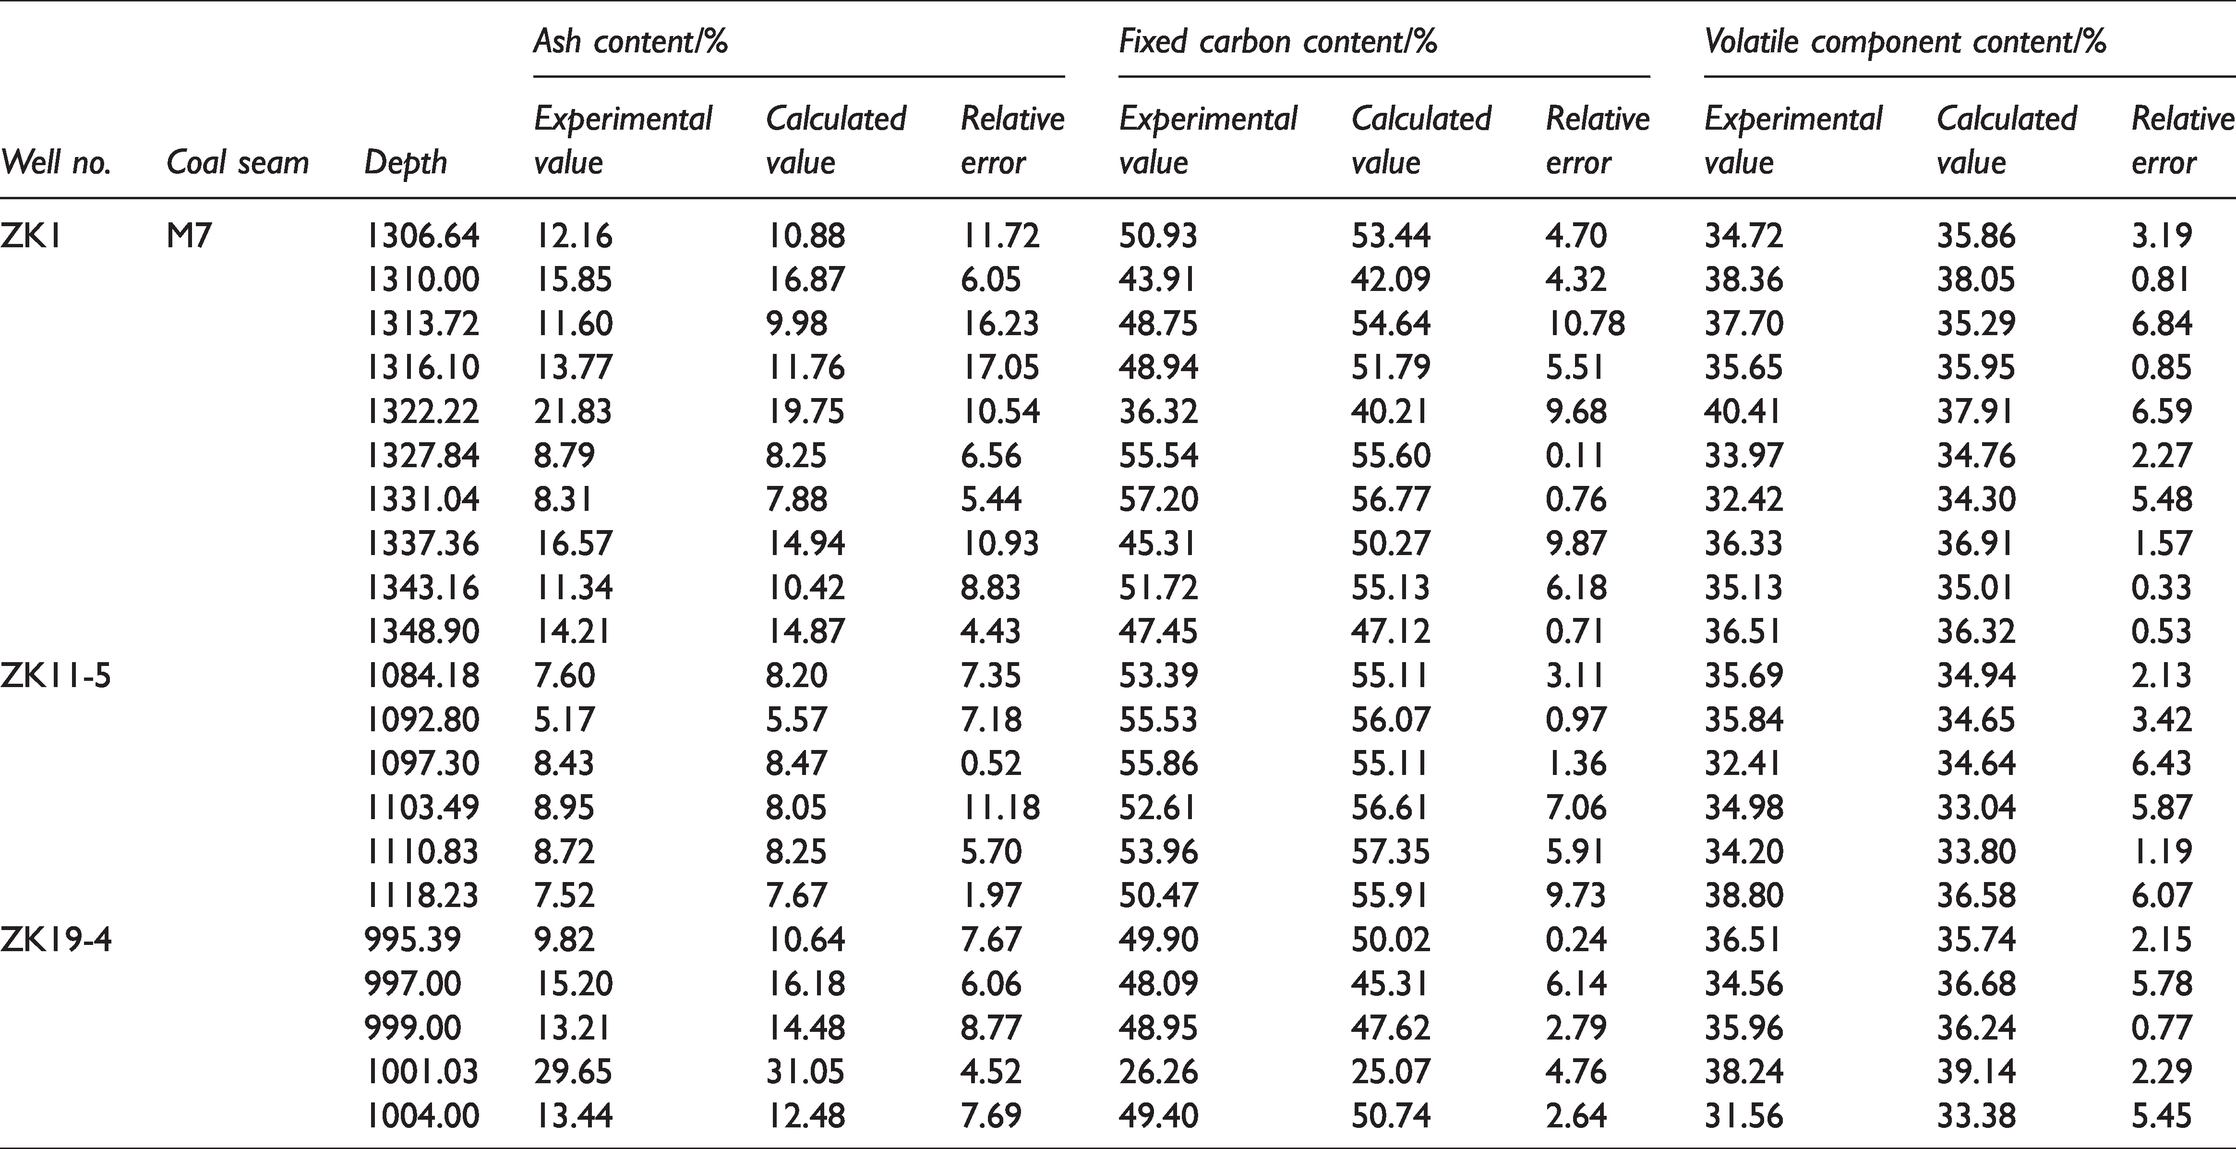
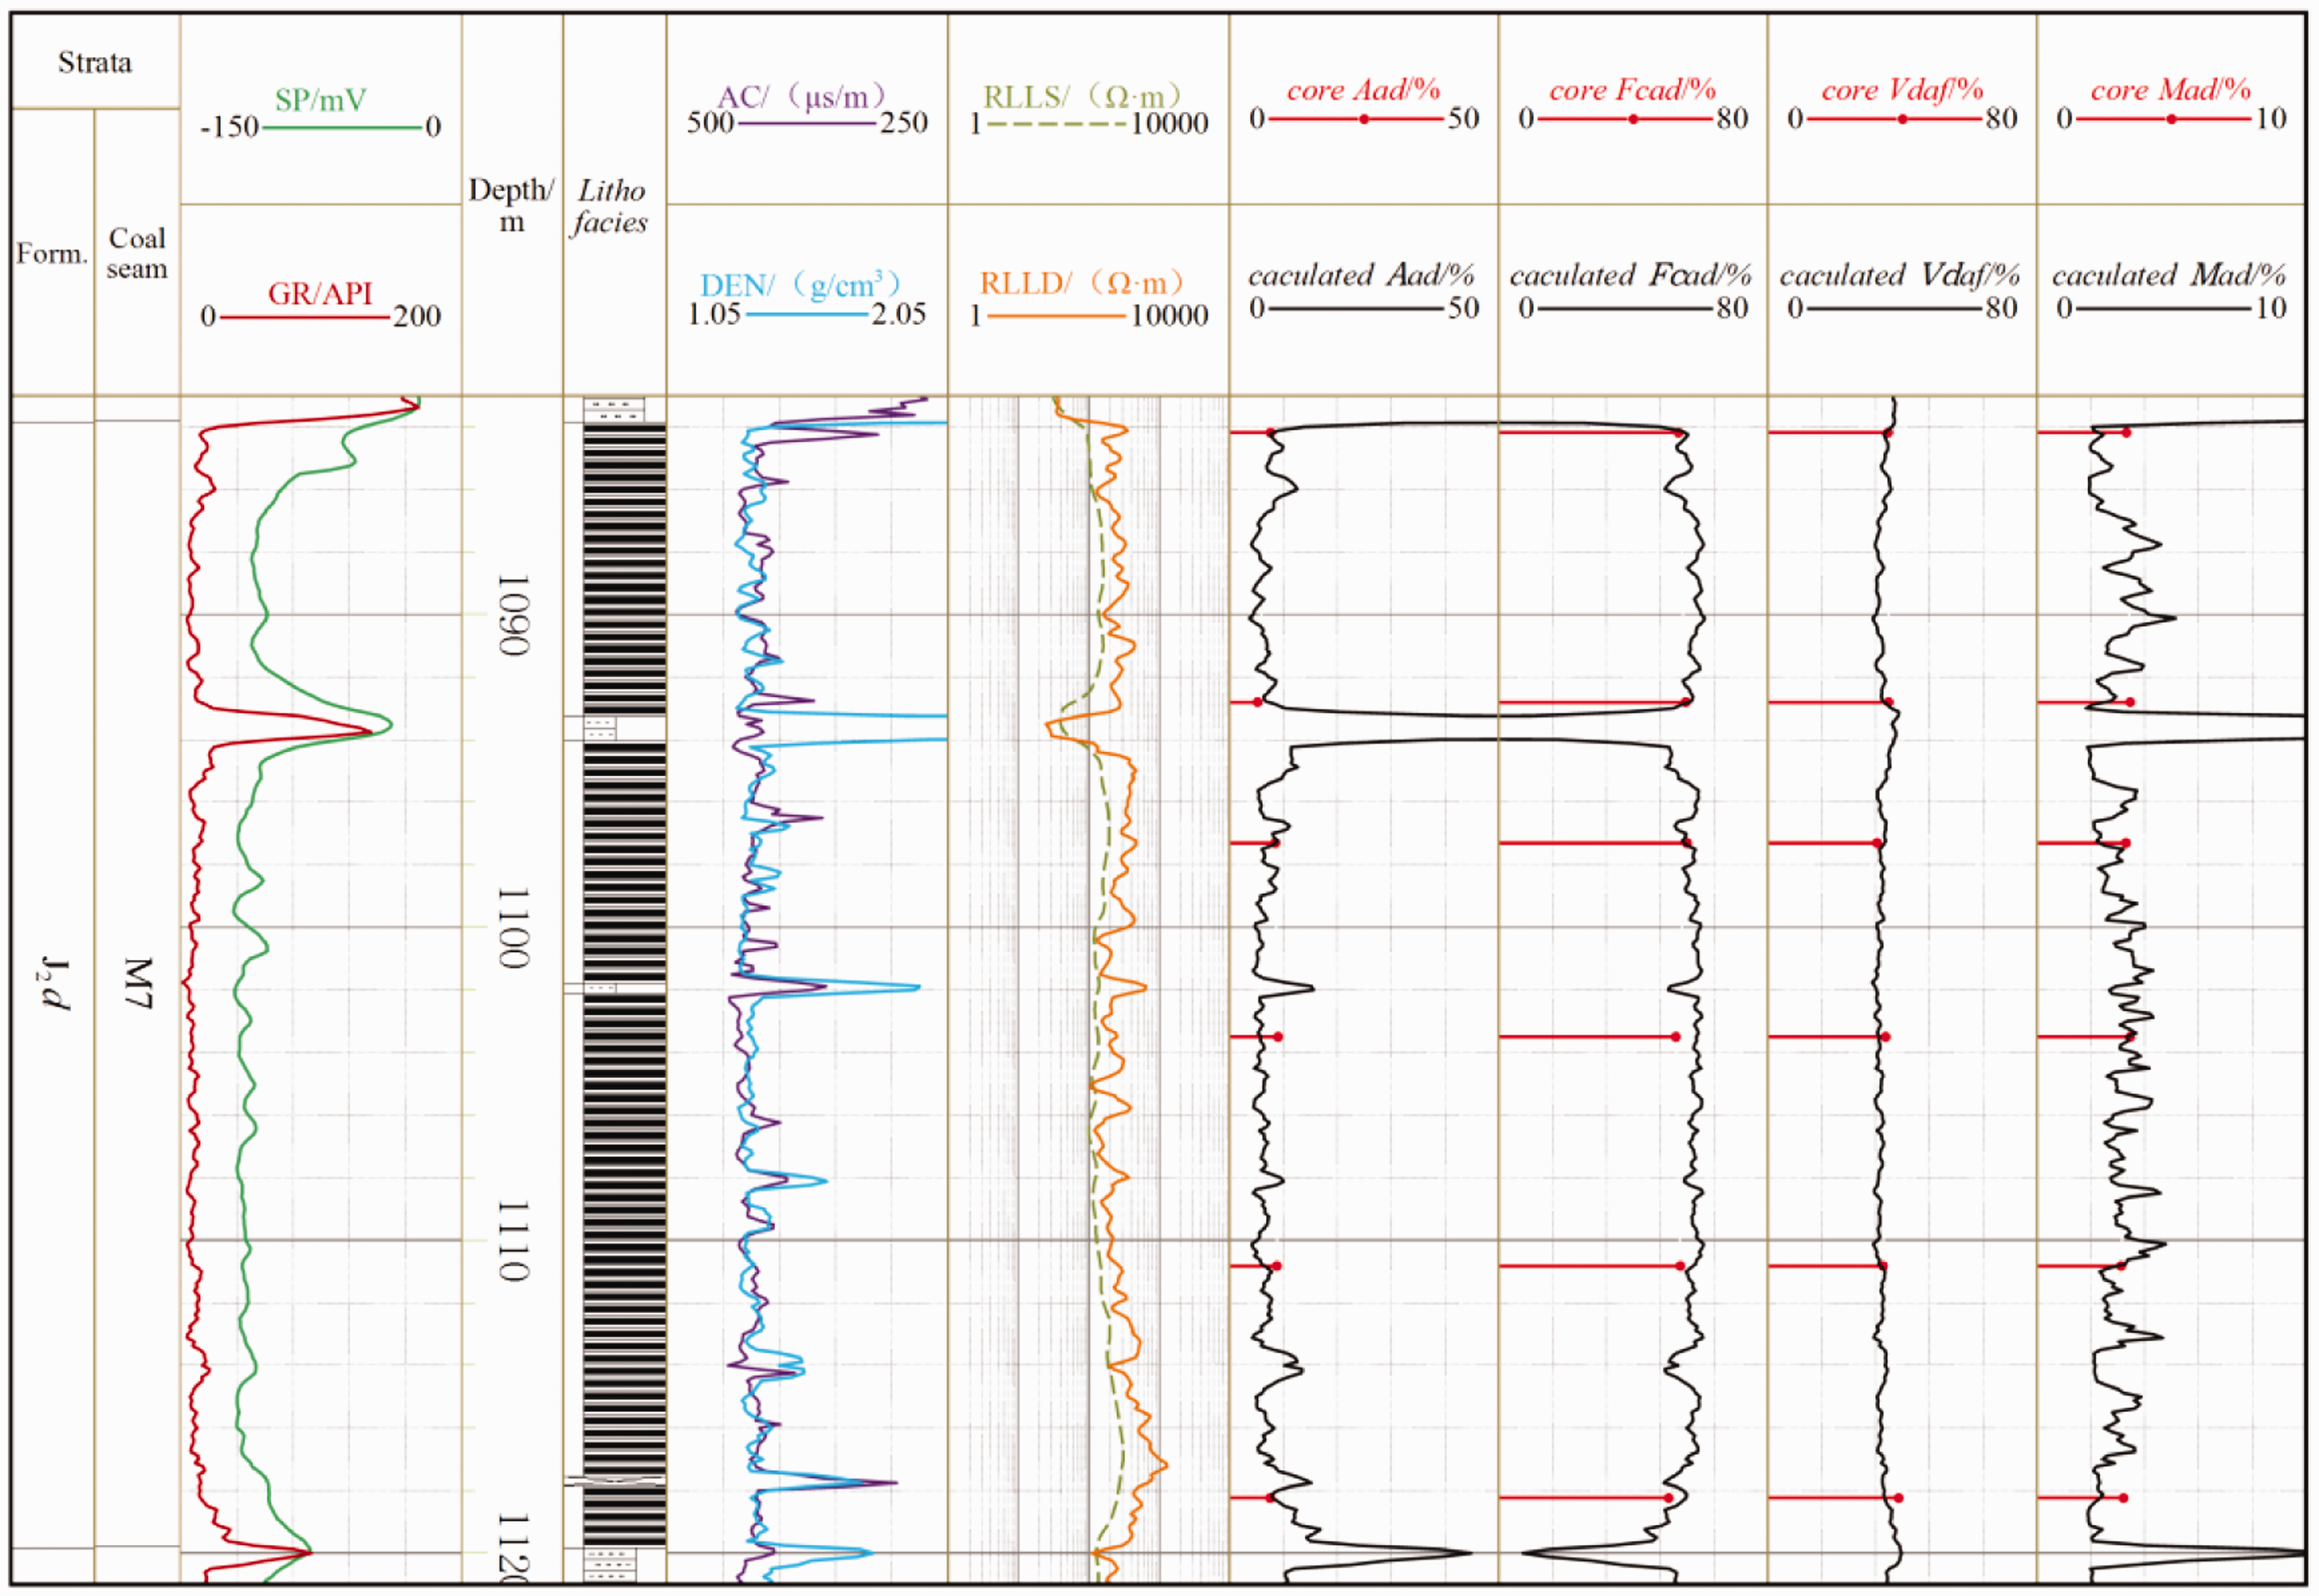
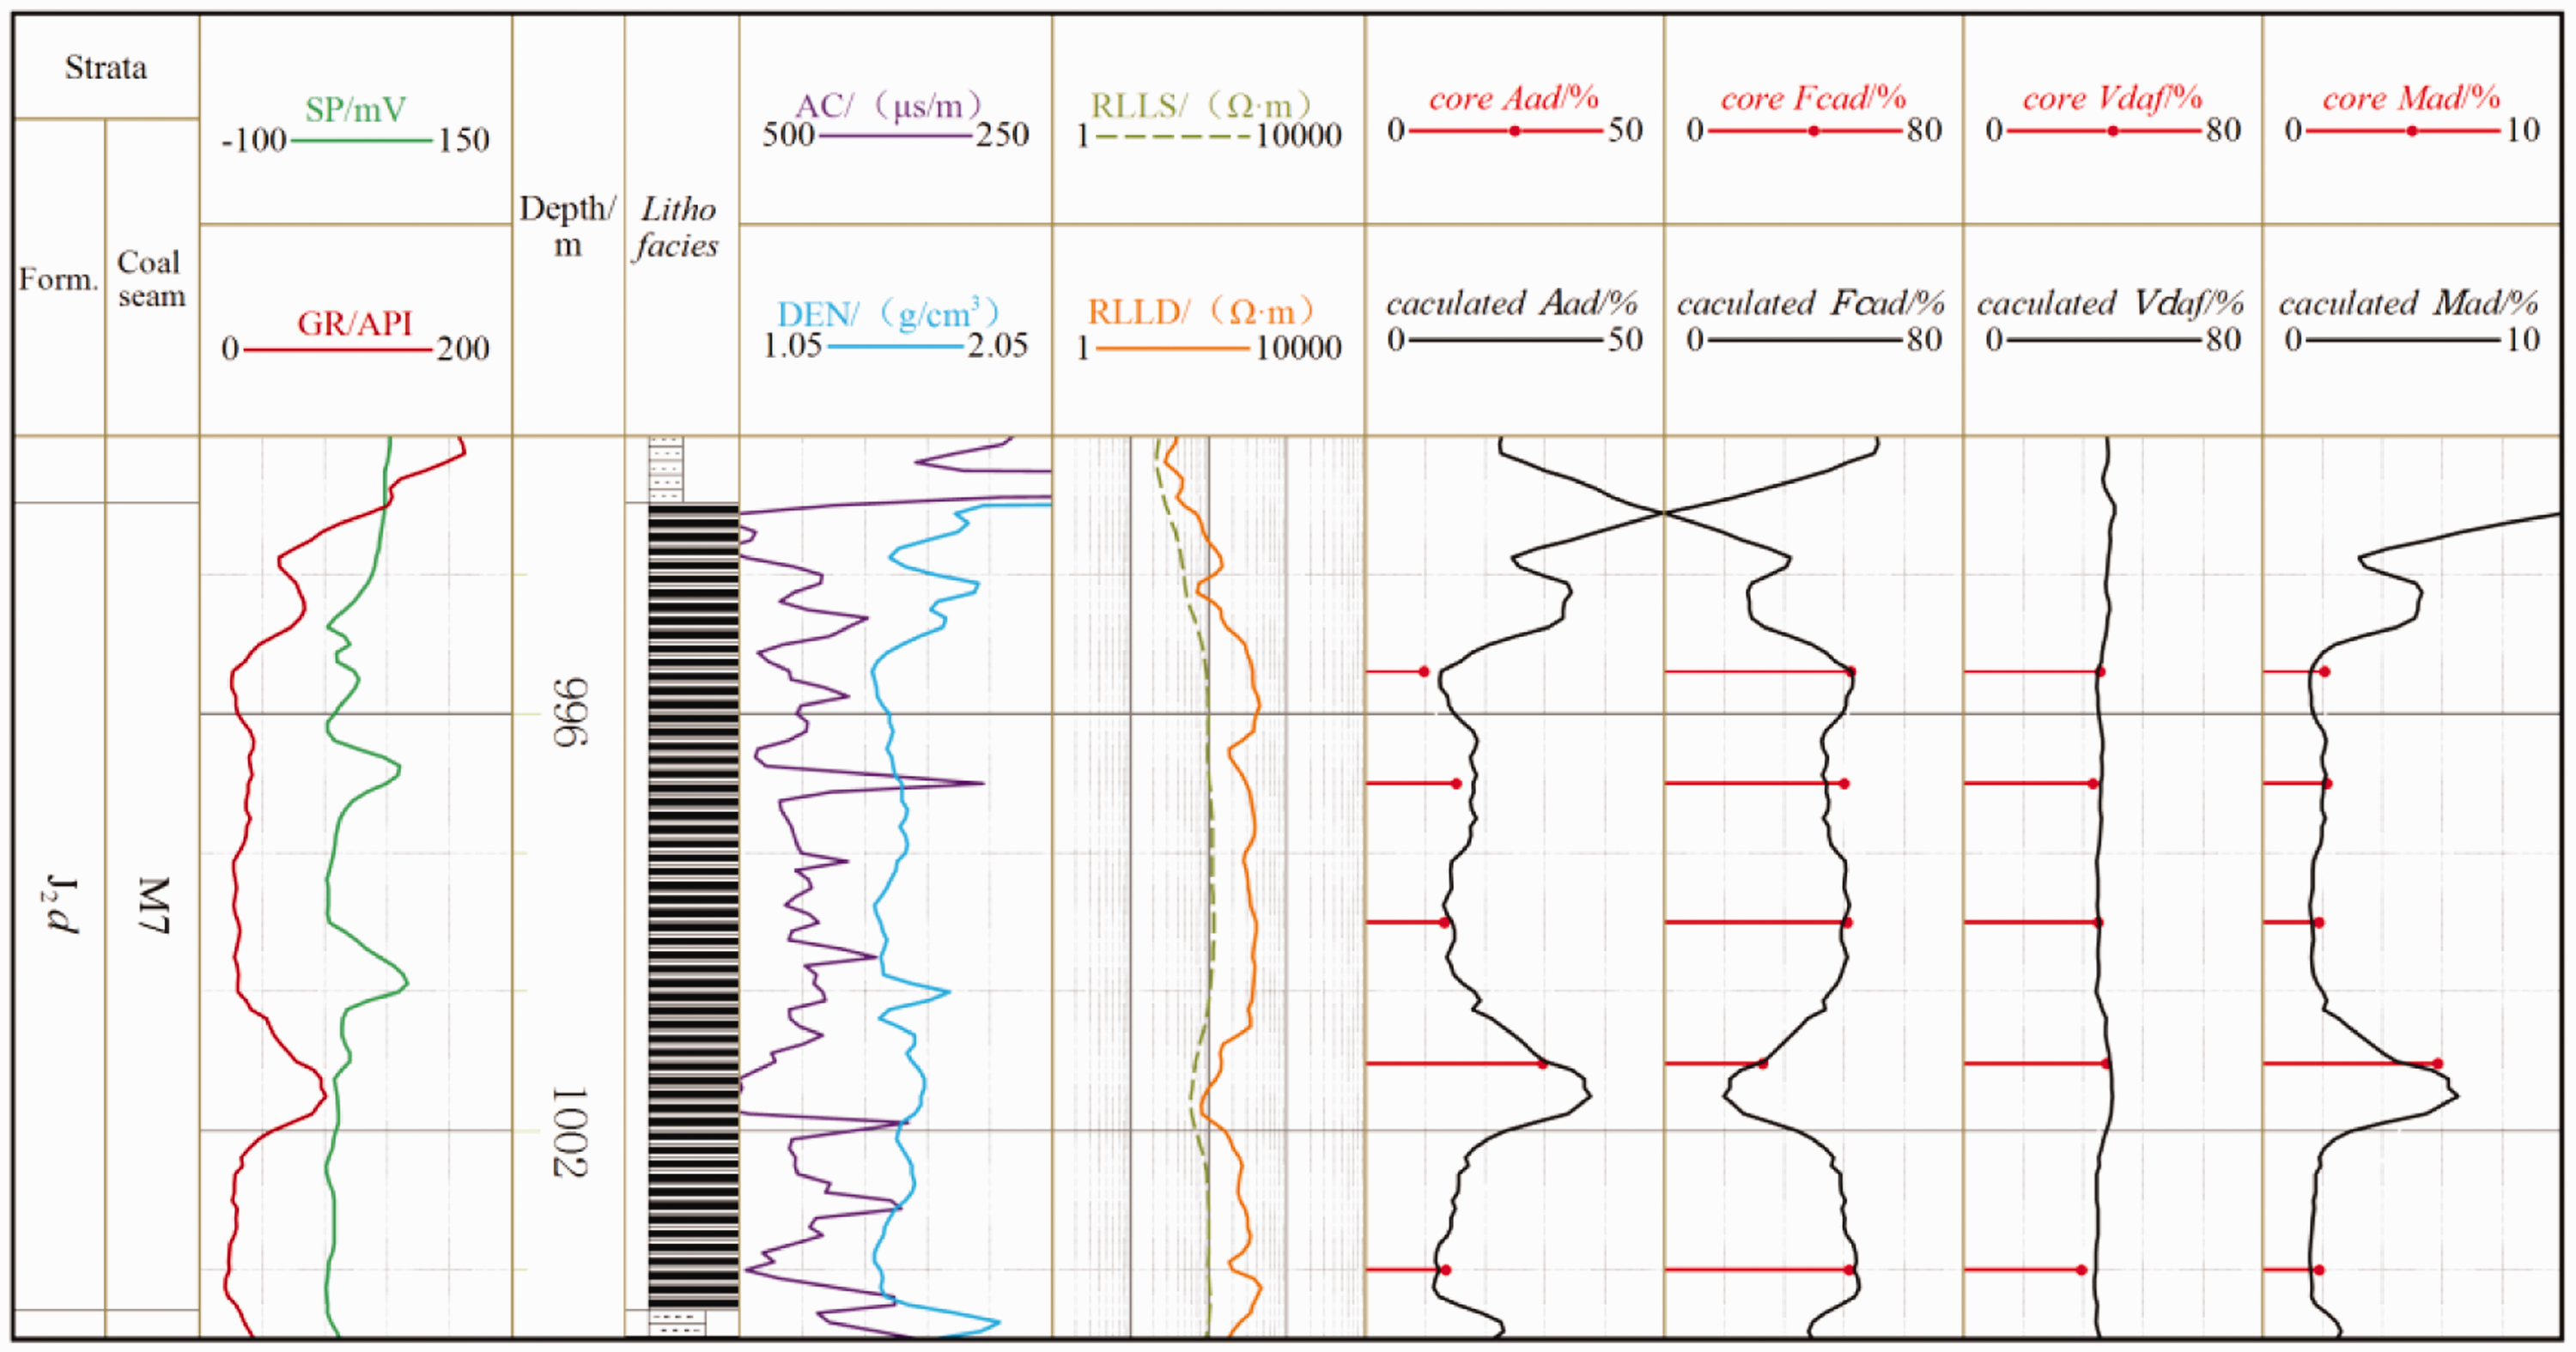
In order to identify the reliability and practicability of log interpretation models, we randomly select two wells (ZK1 and ZK11-5) which involved in model calculation and a new well (ZK19-4) in the Iqe coalfield to test these models. We use these selected optimal multiple regression models to calculate the coal component contents of M7 coal, such as Aad = 18.17 DEN + 0.37 GR – 21, Vdaf = 0.89 Ln (GR) + 3.80 Ln (Aad) – 12.05 ln (DEN) + 28.07, and FCad = 9.11 DEN – 0.004 GR – 1.41 Aad + 54.51. In the ZK1 well, the average relative error between log interpretation and experimental results of Aad, Vdaf, and FCad are 9.78, 2.85, and 5.26%, respectively (Figure 6, Table 5). Meanwhile, the average error of ZK11-5 is relatively low in Aad and FCad, which is 5.65 and 4.69%, respectively (Figure 7, Table 5). As a completely new well (ZK19-4), the average error values of log interpretation to experimental results about Aad, Vdaf, and FCad, which is 6.94, 3.29, and 3.31%, respectively (Figure 8, Table 5). Most of the experimental results show a good relationship with the calculated values indicating that these models are credible and utility in Iqe coalfield, and the calculated values can meet the needs of coal quality evaluation. Although some individual points have great errors, they may be caused by enlarged borehole and interbedded siltstones within M7 coal seam, and do not affect the application of log interpretation model for calculating the M7 coal components.
The results of experimental and calculated values of M7 coal components from ZK1 well in the Iqe coalfield.
Calculated and experimental values from wells of ZK1, ZK11-5, and ZK19-4.
The results of experimental and calculated values of M7 coal components from ZK11-5 well in the Iqe coalfield.
The results of experimental and calculated values of M7 coal components from ZK19-4 well in the Iqe coalfield.
Conclusions
Understanding the content of coal components is significant for the clean and green utilization of coal. In this study, we chose the well log parameters of DEN, GR, AC, SP, RLLS, and RLLD to identify M7 coal seam variation and evaluate coal components of M7 in the Iqe coalfield. Multiple regression analysis with well log parameters (DEN, GR, AC, and RLLD) as independent variable provides a new approach to build log interpretation models. Based on the significance of Aad in coal and its key control factor for other coal components, we firstly established the Aad model using closely related well logs (DEN and GR) through sensitivity analysis. We seriously considered the relationships between Vdaf, FCad and Aad when building the multiple regression model for calculating Vdaf and FCad. Finally, according to the rock volume model derivated as Mad =1 – FCad – Aad – Vdaf, we acquired the calculation method of Mad. The results of case studies (ZK1, ZK11-5, and ZK19-4) suggest that the proposed log interpretation models of coal components can meet the needs of coal quality evaluation for M7 in Iqe coalfield. These log interpretation models not only can satisfy to conveniently and economically evaluate M7 coal components in the Iqe coalfield, but also provide new insights into the connections between coal components and well log parameters.
Supplemental Material
sj-pdf-1-eea-10.1177_01445987211020450 - Supplemental material for Quantitative measurement on coal components through the interpretation model of geophysical log: A case study from the Qaidam Basin, NW China
Supplemental material, sj-pdf-1-eea-10.1177_01445987211020450 for Quantitative measurement on coal components through the interpretation model of geophysical log: A case study from the Qaidam Basin, NW China by Shiming Liu, Rui Liu, Shuheng Tang, Cunliang Zhao, Bangjun Liu, Junwei Diao and Zhaodong Xi in Energy Exploration & Exploitation
Footnotes
Declaration of conflicting interests
The author(s) declared no potential conflicts of interest with respect to the research, authorship, and/or publication of this article.
Funding
The author(s) disclosed receipt of the following financial support for the research, authorship, and/or publication of this article: This study is financially supported by the Fundamental Research Funds for the Central Universities (grant no. 2652019106) and the National Natural Science Foundation of China (grant no. 41702144).
References
Supplementary Material
Please find the following supplemental material available below.
For Open Access articles published under a Creative Commons License, all supplemental material carries the same license as the article it is associated with.
For non-Open Access articles published, all supplemental material carries a non-exclusive license, and permission requests for re-use of supplemental material or any part of supplemental material shall be sent directly to the copyright owner as specified in the copyright notice associated with the article.