
Abstract
Foam flooding is an effective method for enhancing oil recovery in high water-cut reservoirs and unconventional reservoirs. It is a dynamic process that includes foam generation and coalescence when foam flows through porous media. In this study, a foam flooding simulation model was established based on the population balance model. The stabilizing effect of the polymer and the coalescence characteristics when foam encounters oil were considered. The numerical simulation model was fitted and verified through a one-dimensional displacement experiment. The pressure difference across the sand pack in single foam flooding and polymer-enhanced foam flooding both agree well with the simulation results. Based on the numerical simulation, the foam distribution characteristics in different cases were studied. The results show that there are three zones during foam flooding: the foam growth zone, stable zone, and decay zone. These characteristics are mainly influenced by the adsorption of surfactant, the gas–liquid ratio, the injection rate, and the injection scheme. The oil recovery of polymer-enhanced foam flooding is estimated to be 5.85% more than that of single foam flooding. Moreover, the growth zone and decay zone in three dimensions are considerably wider than in the one-dimensional model. In addition, the slug volume influences the oil recovery the most in the foam enhanced foam flooding, followed by the oil viscosity and gas-liquid ratio. The established model can describe the dynamic change process of foam, and can thus track the foam distribution underground and aid in optimization of the injection strategies during foam flooding.
Keywords
Introduction
Foam flooding has been an effective enhanced oil recovery (EOR) method for oil and gas development, especially in reservoirs that are difficult to exploit, such as high water-cut reservoirs, fault block reservoirs, low-permeability reservoirs (Cai et al., 2019; Zhao and Du, 2020), and heavy oil reservoirs (Hirasaki et al., 2011). The EOR mechanism of foam flooding is to increase the oil displacement efficiency and sweep efficiency. First, the apparent viscosity of foam is greater than that of pure gas owing to bubble trapping, which decreases the mobility of the driving gas significantly. Moreover, the blocking capacity of foam increases with the reservoir permeability. This is because the blockage is selective, i.e., the foam tends to block large pores and remain stable in the water phase until it encounters oil. This is of great significance for inhibiting the formation of dominant channels (Farajzadeh et al., 2012). In addition, the surfactant in the foam system can reduce oil–water interfacial tension and, consequently, improve the washing efficiency.
The flow mechanism of foam in porous media is quite complex. The foam generation mechanism mainly includes the snap-off, lamella division, leave-behind, and pinch-off mechanisms (Liontas et al., 2013). The coalescence mechanisms includes capillary-suction coalescence and gas diffusion (Khoshkalam et al., 2019). The foam generation rate and coalescence rate determine the stability of the foam system together, and this affects the EOR greatly. Hence, the presence of the oil phase, surfactant adsorption, and addition agent (e.g., polymer) should be considered seriously in the study of foam stability during foam flooding. The effects of residual oil on the rate of foam generation were studied through experiments and simulations. The results suggest that the presence of crude oil can result in hysteresis of the foam front (Batot et al., 2016). This is because the oil–water interfacial tension is far less than the gas–water interfacial tension, and the interface alteration leads to interfacial tension reduction when oil, gas, and water coexist in porous media. Moreover, there is a critical oil saturation for foam generation under high oil saturation in foam flooding. In other words, only when the oil saturation is below the critical oil saturation can the foam generate. In addition, surfactant adsorption is another factor that cannot be ignored during foam flooding, this is because the unnecessary surfactant loss caused by adsorption causes the foam system to have poor stability (Wei et al., 2019). And Davarpanah et al. (2019) determined a suitable injectivity model for one of the heterogeneous sandstone reservoir in which hydrolyzed polyacrylamide concentration in the solution foam has the most recovery factor.
To improve the performance of the surfactant, the use of a surfactant containing suitable chemical additives has been proposed to stabilize the foam. Commonly used chemical additives include organic compounds, electrolysis quality, nanoparticles, polymers, and liquid crystals (Farzaneh and Sohrabi, 2015; Lv et al., 2014; Rezvani et al., 2020; Yan et al., 2011). For example, Risal et al. (2019) investigated the enhancement of carbon dioxide foam stability, pore plugging, and oil recovery in the presence of silica nanoparticles. Wang proposed enhancing the foam system by adding polymer additives into the foam (Wang and Wang, 2004). This technique has been widely used in the Shengli Oilfield. The foam becomes fairly stable because the polymer reduces the amount of surfactant adsorption and decreases the foam coalescence rate. The stability in the presence of oil is also improved. The gas phase type influences the EOR process in foam flooding. Air, nitrogen, flue gas, natural gas, and carbon dioxide are the potential selections (Bai et al., 2019; Chen et al., 2018; Du et al., 2019; Hurtado et al., 2018; Jin et al., 2019; Lang et al., 2020; Ren et al., 2018).
It is necessary to model the foam distribution quantitatively in the numerical simulation of foam flooding of the reservoir. There are several foam flow models, such as the non-Newtonian fluid model, two-phase model, flow resistance factor model, population balance model, and critical capillary model (Du et al., 2011; Du et al., 2020; Falls et al., 1988; Ma et al., 2015; Risal et al., 2018; Rossen et al., 1999; Saeibehrouzi et al., 2020). The non-Newtonian fluid model regards the foam as power law fluid, and the foam characteristics are determined by apparent viscosity. The two-phase model regards the foam as a component that includes both a gas phase and a liquid phase. The effects of foam flow are combined into a flow resistance factor based on percolation theory in the resistance factor model, and the value of this factor increases with the permeability and decreases as the foam mass increases. Among these models, the population balance model is the most comprehensive approach. The population balance model describes a mass conservation equation of the foam, i.e., the mass increment of the foam is equal to the sum of the inflow and newly generated foam minus the outflow and coalescence foam. The foam mobility ratio is considered as a function of the foam structure and flow velocity. The model assumes that the total number of bubbles is in equilibrium under the dynamic process involving foam generation and coalescence. Moreover, it fully considers the mechanisms of foam generation, coalescence, and migration (Bertin et al., 1998; Kovscek et al., 1997). However, the traditional population balance model ignores the influence of oil on the stability of foam. In addition, Samimi et al. (2020) presented a numerical investigation of foam behavior in a porous medium. Fractional flow method was applied to describe steady-state foam displacement in the entrance region.
In this study, a numerical simulation method of foam flooding was established based on the population balance model. It comprehensively considers the effect of the foam generation rate, the effect of the natural-coalescence rate, oil phase effects on foam stability (the oil-coalescence rate), the strengthening effect of the polymer, and the interfacial tension reduction effect of the surfactant. The numerical simulation method was validated by means of laboratory experiments. Moreover, the regional characteristics during foam flooding were investigated, and the main influencing factors were analyzed. The research can provide a tool to monitor the foam dynamics underground and help optimize the injection scheme during foam flooding.
Numerical simulation method for foam flooding
The mathematical model is based on a compositional model and includes three phases (oil, gas, and water) and six components: oil, water, nitrogen, foam, foamer (i.e., surfactant), and polymer. The gas phase has two components: trapped gas and flowing foam. The component mass conservation equation on foam is

Net foam generation rate
Foam flow is a dynamic equilibrium process where foam generation and foam coalescence occur simultaneously. The net foam generation rate is the generation rate minus the coalescence rate, i.e.,
The foam generation rate depends on oil saturation in the presence of oil. So* is defined as the maximum critical oil saturation when the foam system is in a stable state, which means that the generation rate is zero when the oil saturation is larger than this value. The foam generation rate is related to gas saturation, liquid saturation, and the surfactant concentration, that is,

Considering the effect of oil, the foam coalescence rate is divided into the natural-coalescence rate and oil-coalescence rate. The foam natural-coalescence rate is decided by the molar concentration of foam in the gas phase, capillary pressure, and other factors. The higher the foam component content, the greater the foam natural-coalescence rate, which is given by

Laboratory experiments show that the existence of the oil phase decreases the foam stability (Poryles et al., 2020; Rattanaudom et al., 2020; Skauge et al., 2020). As oil saturation increases, the molar concentration of foam in the gas phase decreases noticeably. Therefore, the oil-coalescence rate is introduced to characterize this phenomenon (Du et al., 2017), that is

Viscosity and relative permeability
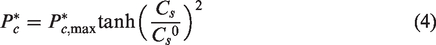
The gas phase contains nitrogen gas and foam, and the foam system has a non-Newtonian flow characteristic in a porous medium. Follow a similar way of Myers and Radke (2000), the foam effective viscosity is given by an empirical equation:

The flow resistance of the gas phase increases after the generation of foam, which is mainly reflected in the decreased gas-phase relative permeability. Because the foam molar concentration in the gas phase is the macroscopic reflection of foam stability, the gas-phase relative permeability can be described as follows:
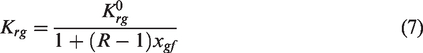
The flow chart for the numerical solution scheme is shown in Figure 1. In each run, we first calculate the foam generation rate and the coalescence rate, subsequently the net rate, in which the polymer or surfactant effects can be considered. Then the parameters that are determined by the foam concentration are updated, such as the viscosity and relative permeability. Finally we can solve control equations of the compositional model and update field parameters and the foam distribution.
Flow chart for the numerical solution scheme.
Experimental validation
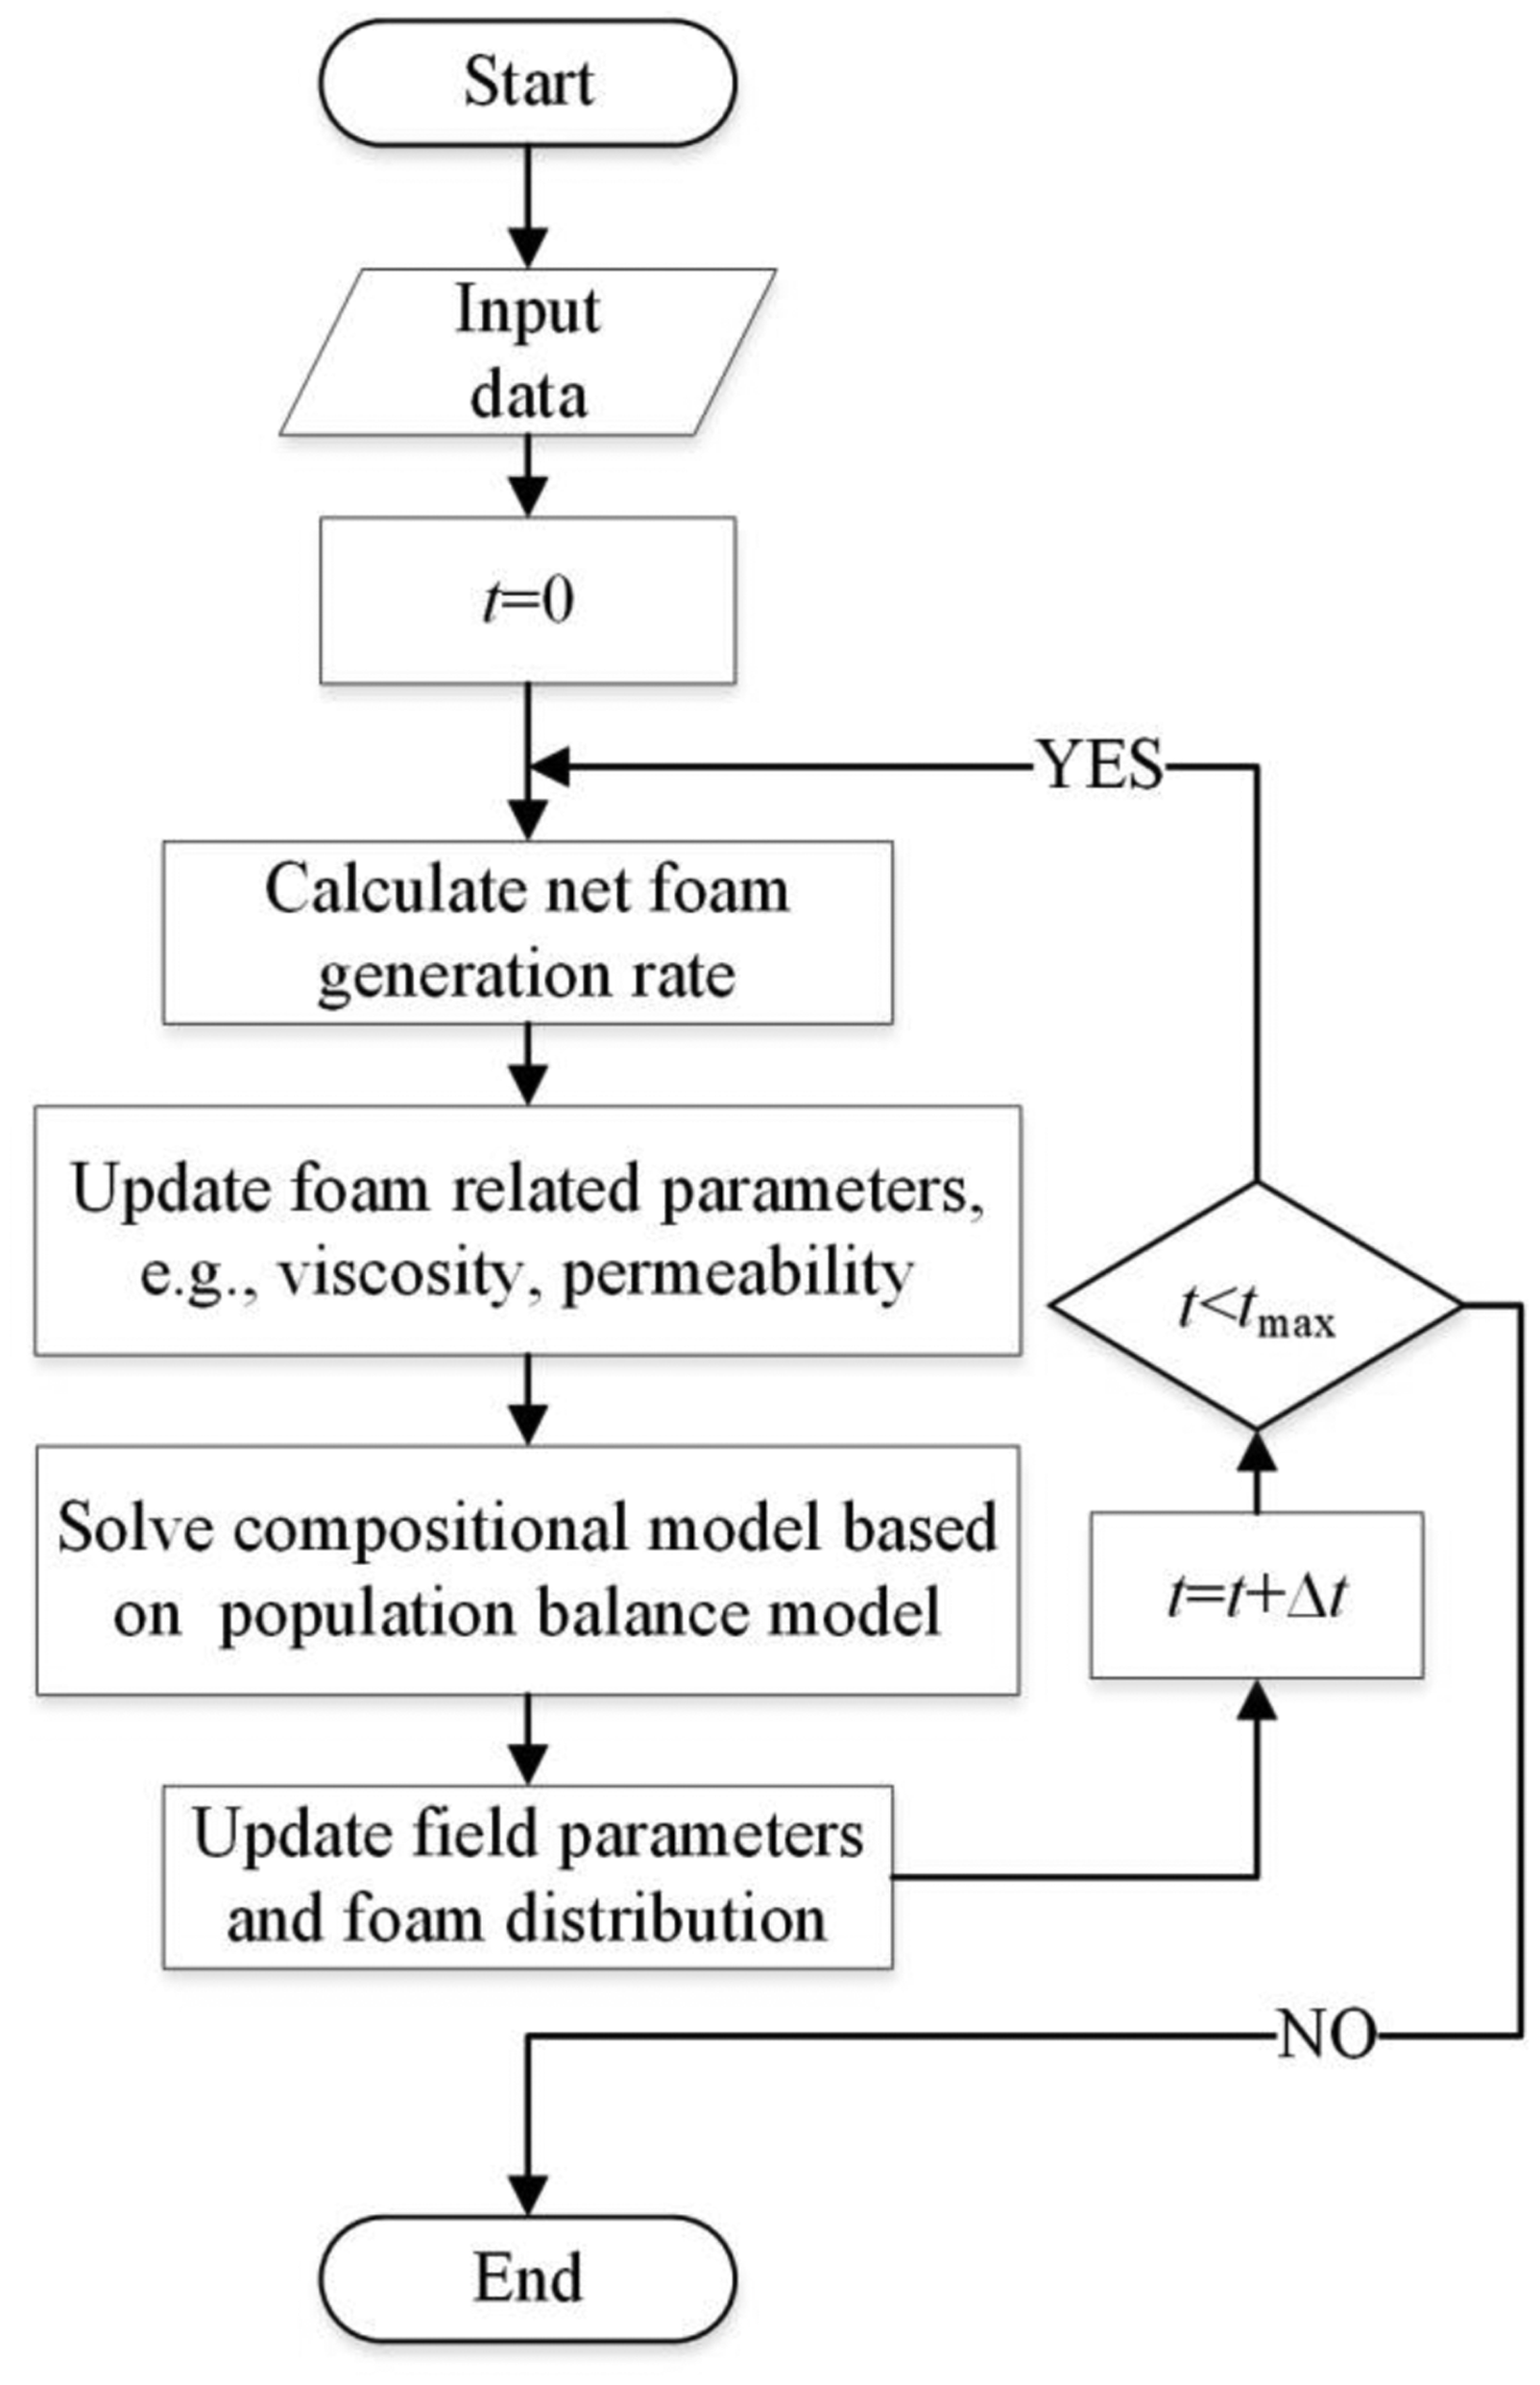
The 1 D foam flooding experimental apparatus is shown in Figure 2. This setup makes possible the simultaneous injection of gas, surfactant solution, and oil. The sand pack is relatively homogeneous, with a diameter of 2.5 cm and a length of 60 cm. The average porosity is 0.34, and the permeability is 0.24 μm2. During the experiment, the sand pack core is placed in an oven at 65°C. Nitrogen and surfactant solution are injected into the sand packs, and foam generates subsequently in the core. The injection rate can be controlled using a flowmeter, and the pressure can be measured at different positions using a pressure gauge.
Experiment setup of foam flooding.
Two experiments, i.e., foam flooding with and without polymer, were conducted. Both experiments run started with flushing the core with a large volume of water at a backpressure of 6.0 MPa, after which the water was displaced by oil to mimic the formation process of the oil reservoir. Then, the core was displaced by water until the water cut reached 98%. Next, for the experiment without the polymer (single foam flooding), nitrogen and foamer solution were co-injected continuously into the core at a specified gas and liquid rate. For the polymer-enhanced foam experiment, nitrogen, foamer solution, and the polymer were co-injected under the same conditions. The gas–liquid ratio was maintained at 1:1 during injection. Pressures between the inlet and outlet were recorded until a steady state was achieved. The concentration of the polymer solution was 1800 mg/L.
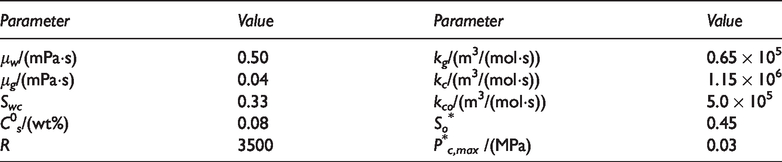
The foam flooding mathematical model in Section 2 was solved numerically, and the laboratory core experimental results were fitted by changing related parameters. The values of the main fitting parameters are shown in Table 1. The simulation model is a 1 D model, in which the grid domain is 120 × 1 × 1, and the grid resolution in different directions is 0.25 cm, 2.215 cm, 2.215 cm, respectively. The numerical simulator is written in Fortran and solved by IMPES method.
Parameters in the numerical simulation.
The experimental and simulation results of foam flooding are shown in Figures 3, and the average relative error is less than 15.6%. The fitting curve of pressure shows that the calculated value of the numerical model is essentially consistent with the experimental value. The stability of the single foam system is difficult to maintain in the presence of oil, and the pressure difference is very small, approximately 100.0 kPa, as shown in Figure 3. The polymer enhances the stability of the foam when it encounters oil, so that the foam can exist stably in the oil-containing sand pack. Therefore, the pressure difference enhanced in the foam flooding experiment increases rapidly after water flooding, as shown in Figure 4.
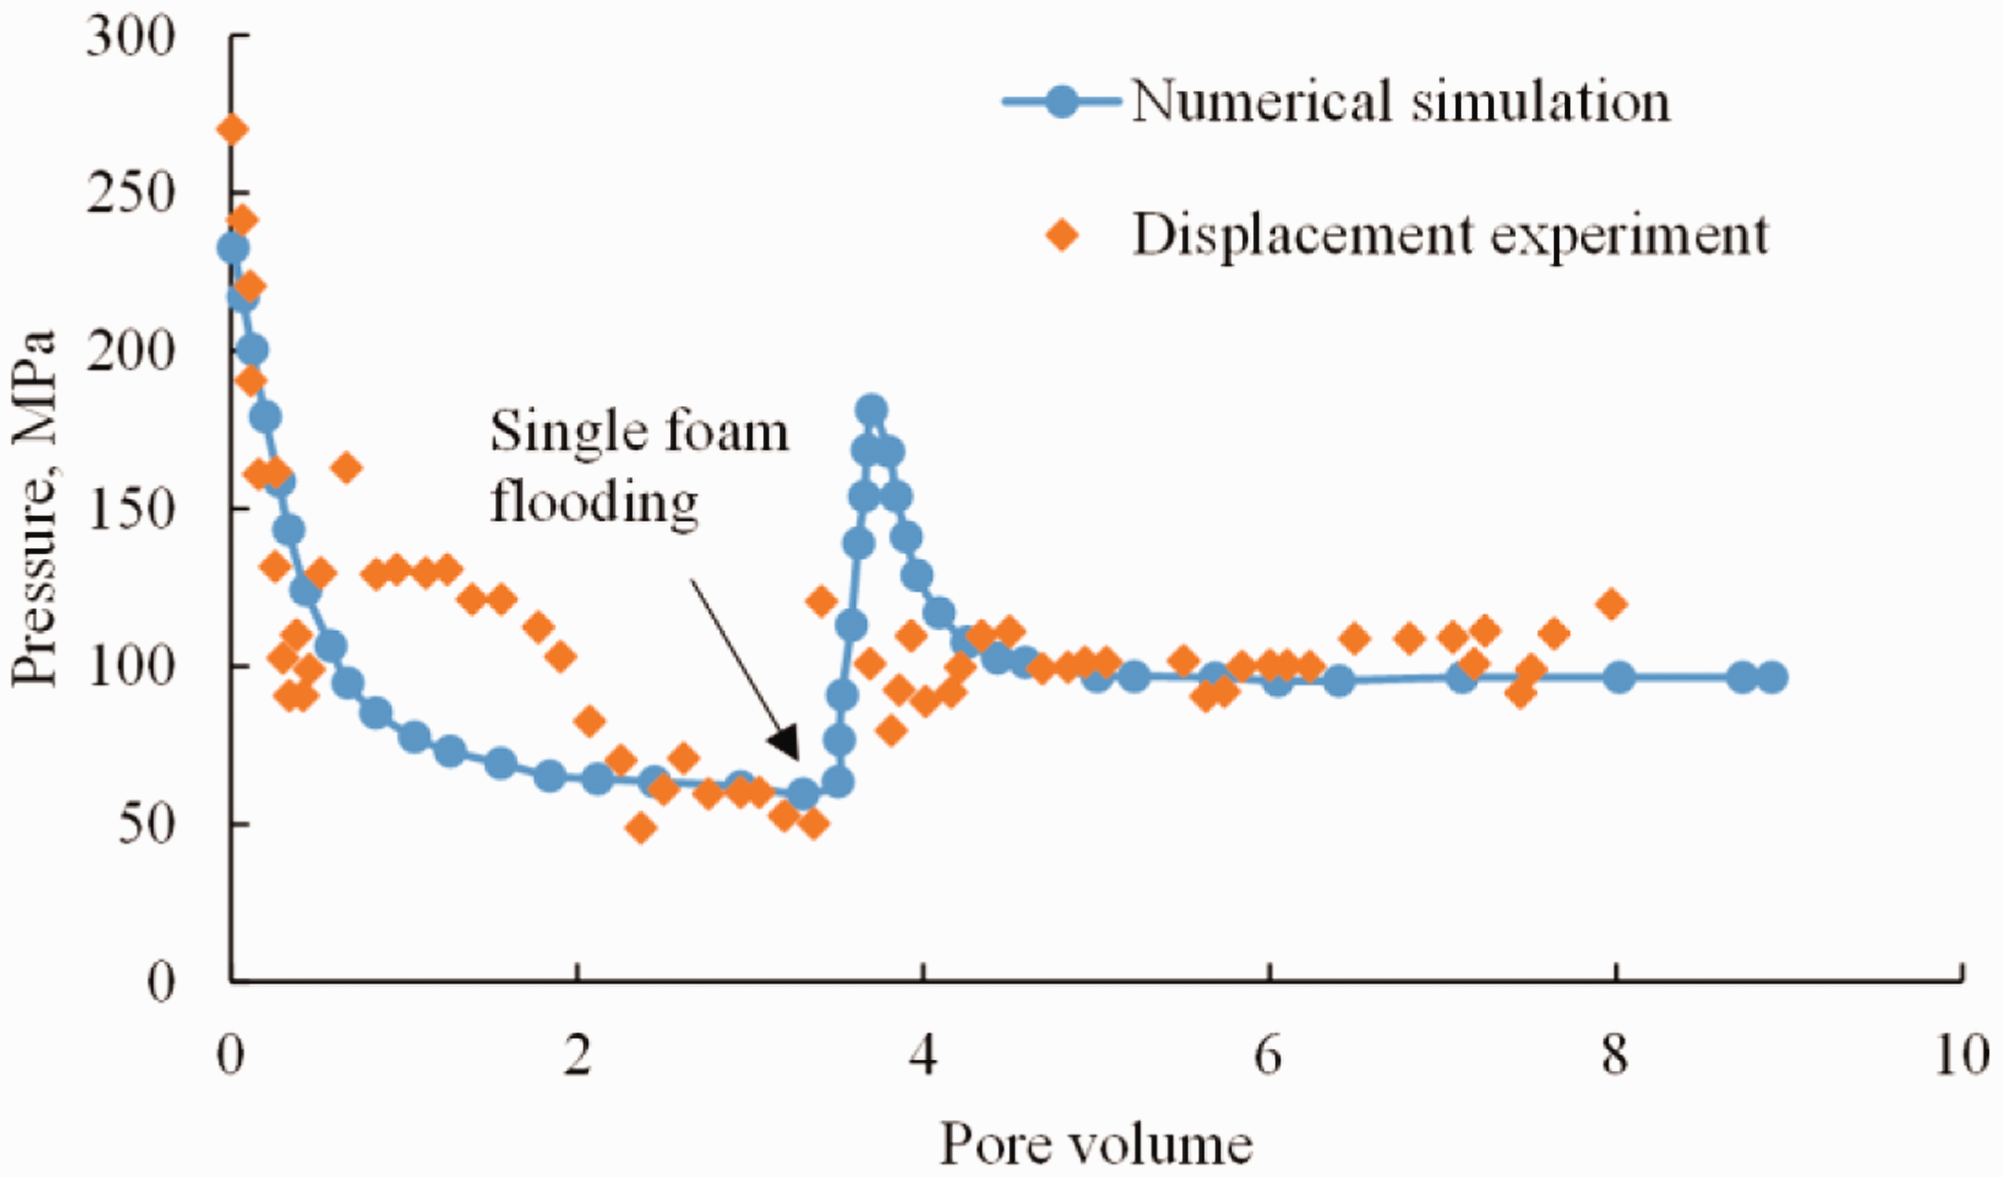
Pressure difference matching curve of foam flooding without polymer.
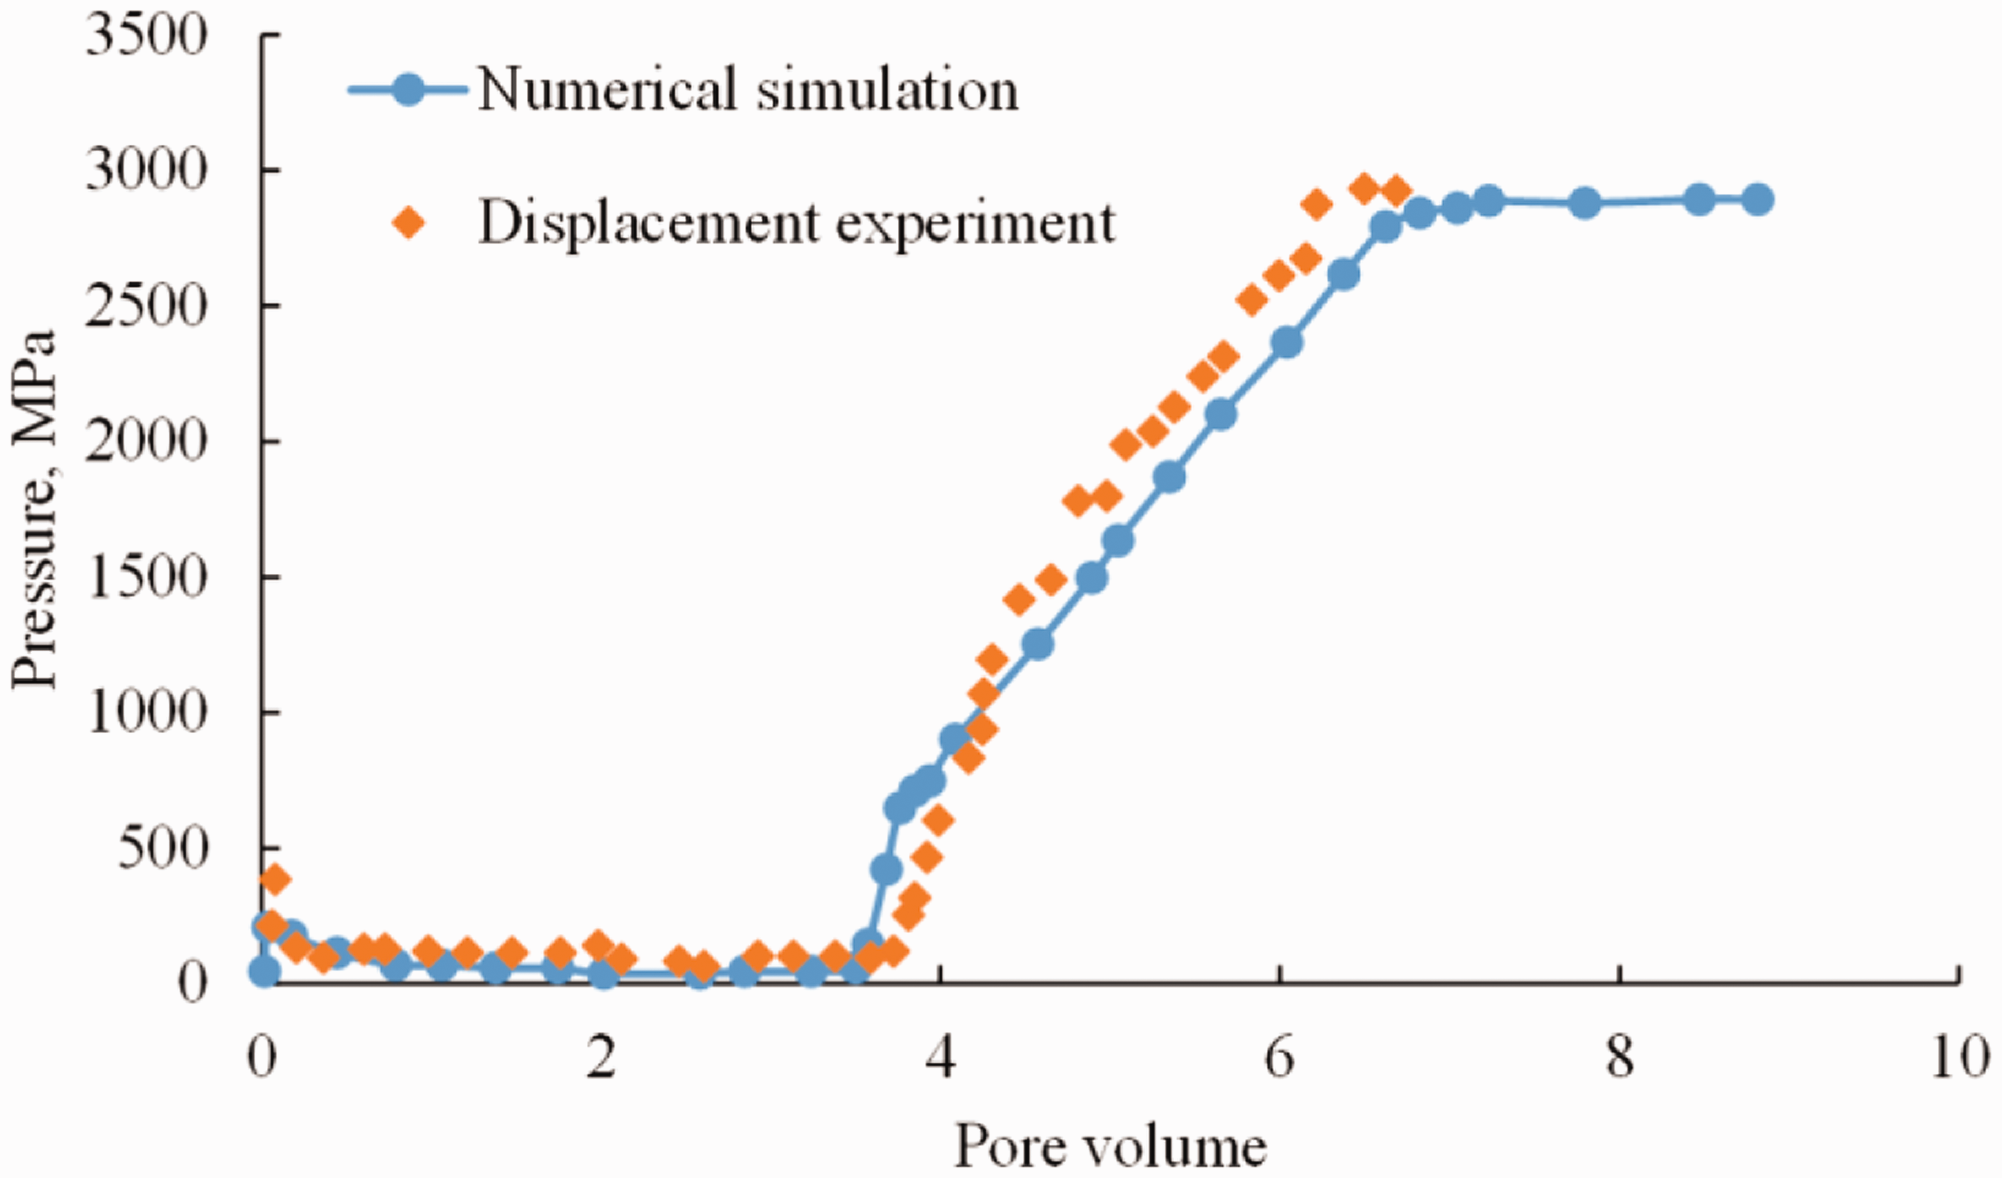
Pressure difference matching curve of foam flooding enhanced by polymer.
Results and discussion
The distribution characteristics of the foam generation rate, natural-coalescence rate, oil-coalescence rate, and net generation rate under different conditions were analyzed. Based on the results, it is proposed that there are three zones in the process of foam flooding: the growth zone, steady-state zone, and decay zone. The factors influencing regional characteristics are discussed below, and a 3 D application example for the foam flooding is provided.
Regional characteristics of foam flooding
Based on the experimental fitting data, three types of 1 D foam flooding, i.e., pure foam flooding without oil, single foam flooding involving oil, and polymer-enhanced foam flooding, were simulated. The foam generation/coalescence rate can be controlled by the surfactant concentration and the foam fraction in the gas phase. The greater the surfactant concentration, the faster the generation rate. Furthermore, the greater the total amount of foam, the faster the foam coalescence rate. The distributions of the foam generation/coalescence rate at different core positions are plotted in Figure 5. The dimensionless location is defined as the ratio of x (the distance from a certain point at core to the injection inlet) to L (the length of the core).
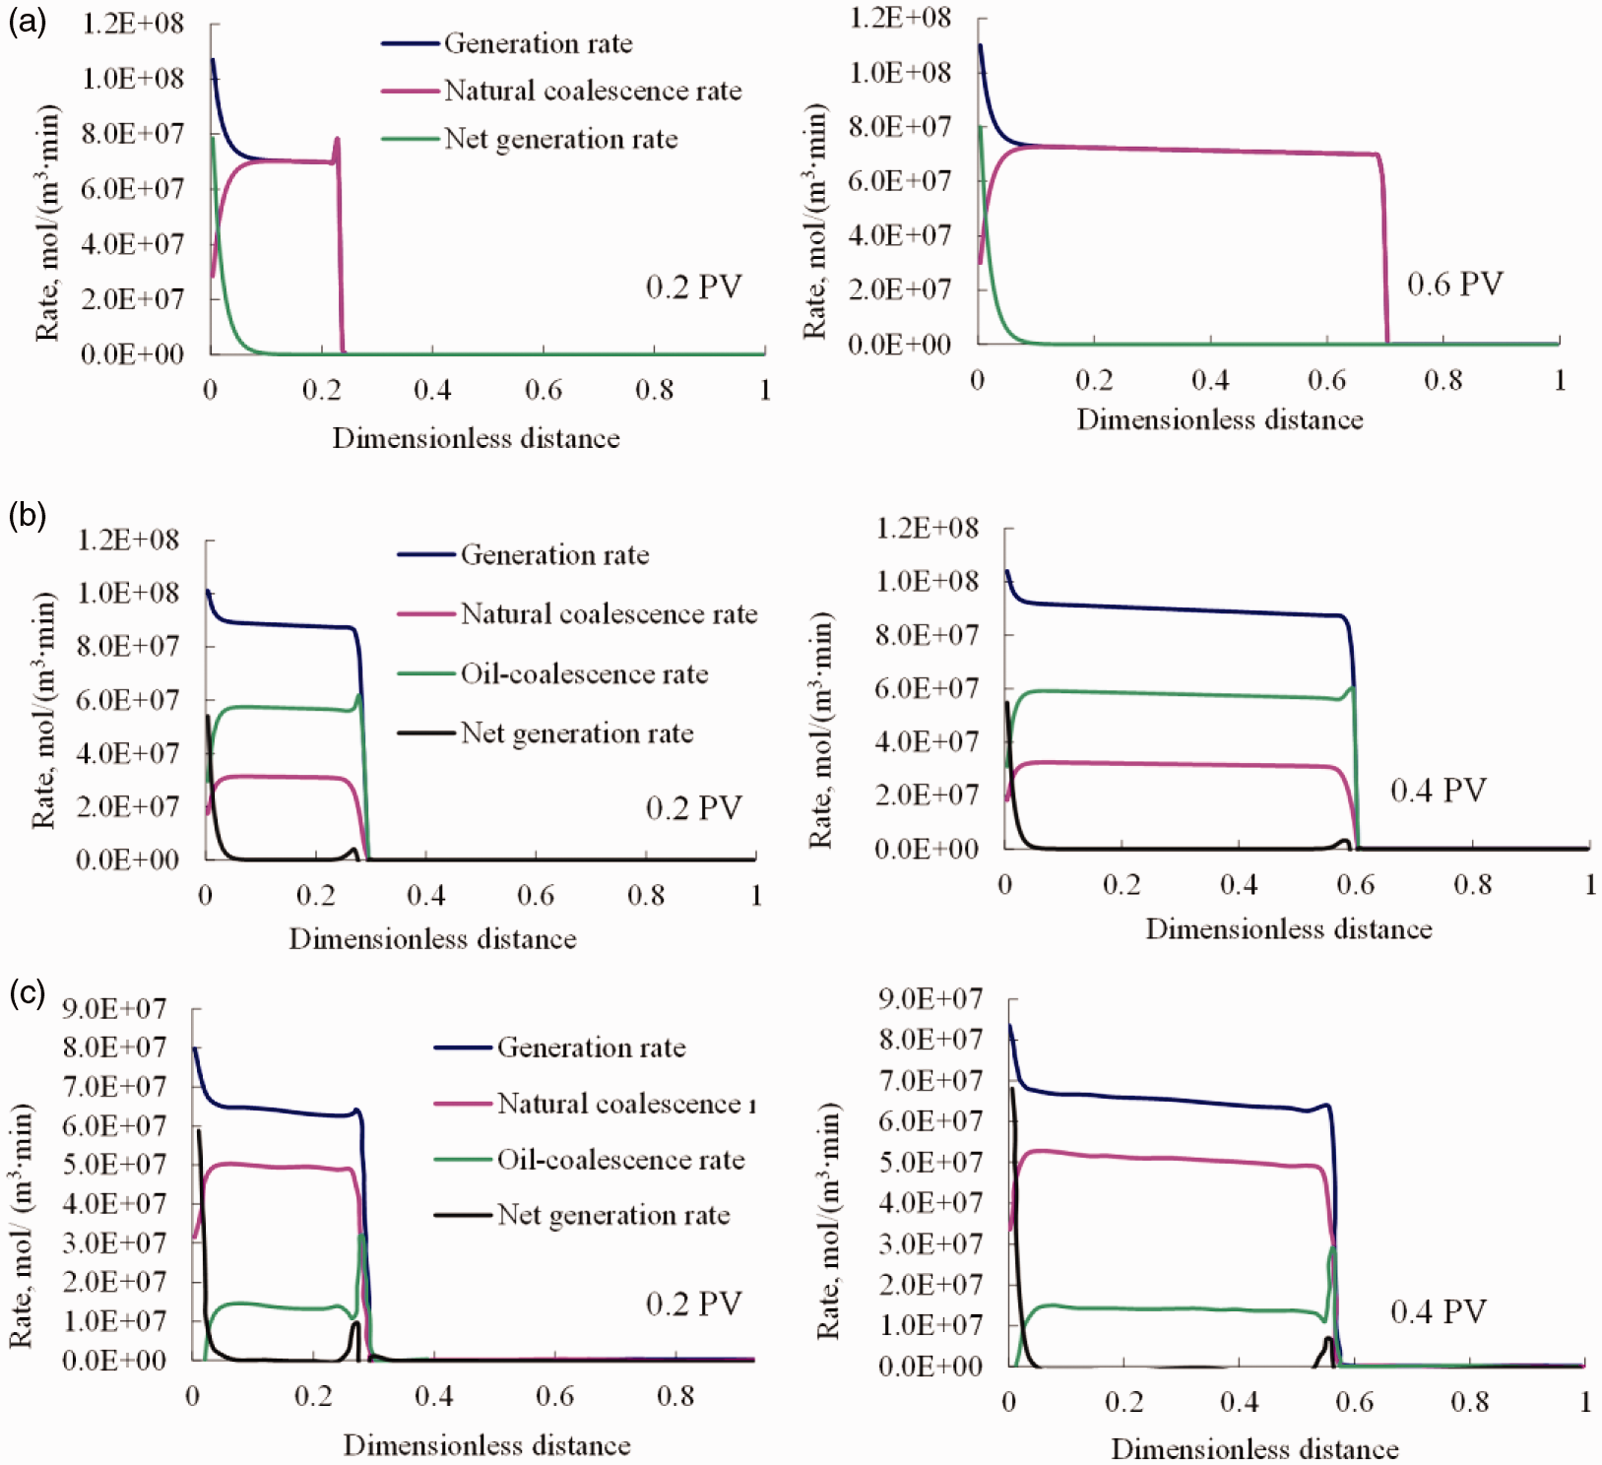
Foam distribution for different flooding types: (a) oil-free model, (b) single foam flooding involving oil, and (c) polymer enhanced foam flooding involving oil.
The distribution of the foam generation rate and coalescence rate in the oil-free model (Figure 5(a)) shows that foam generation and foam coalescence occur simultaneously; hence, it is a dynamic process. After the foam generates, it coalesces naturally within a migration distance and then generates at a new location. Near the core inlet, the generation rate is maximum because the concentrations of free gas and surfactant are higher, and the natural-coalescence rate is much lower because the foam concentration is small. At the middle of core, the foam system reaches a balance. This is because the generation rate is equal to the natural-coalescence rate. In the single foam flooding model involving oil (Figure 5(b)), the coalescence rate includes the natural-coalescence rate and oil-coalescence rate, and the oil-coalescence rate is greater than the natural-coalescence rate. At the displacement front, the net foam generation rate fluctuates for the oil phase and influences the oil-coalescence rate at the interface, and the flow pattern begins to shift from foam flooding to water flooding. As for the polymer-enhanced foam flooding (Figure 5(c)), the oil-coalescence rate in the middle core is less than the natural-coalescence rate because the polymer enhances the foam stability.
The foam net generation rate reflects the comprehensive effect of foam generation and coalescence. Observing the net foam generation rate along the core made it possible to summarize the regional characteristics during foam flooding, as shown in Figure 6. The first zone is the foam growth region, where the net generation rate is greater than 0. Comparison of the maximum net generation rate in models with and without oil shows that the presence of oil decreases the net generation rate near the core inlet as well as shortens the foam growth region. The second zone is the stable region, where the generation rate is approximately equal to the coalescence rate, that is, the net generation rate is 0. The third zone is the decay region, which lies between the stable and unswept regions. In the left boundary of the decay region (close to stable region), the net generation rate reaches a high value for the decrease of the natural-coalescence rate. On the other side (close to the oil–water interface), however, the oil-coalescence rate is higher, and the net generation rate is negative because of the presence of the oil wall. There is no decay region during foam flooding in the oil-free model. As for the polymer-enhanced foam flooding, the foam front flows more slowly than in the model without the polymer. This is because the foam concentration of the gas phase in the polymer-enhanced model is much greater, thus having better stability. The stable foam has a larger viscosity, and the front moves more slowly than in the unstable foam system.
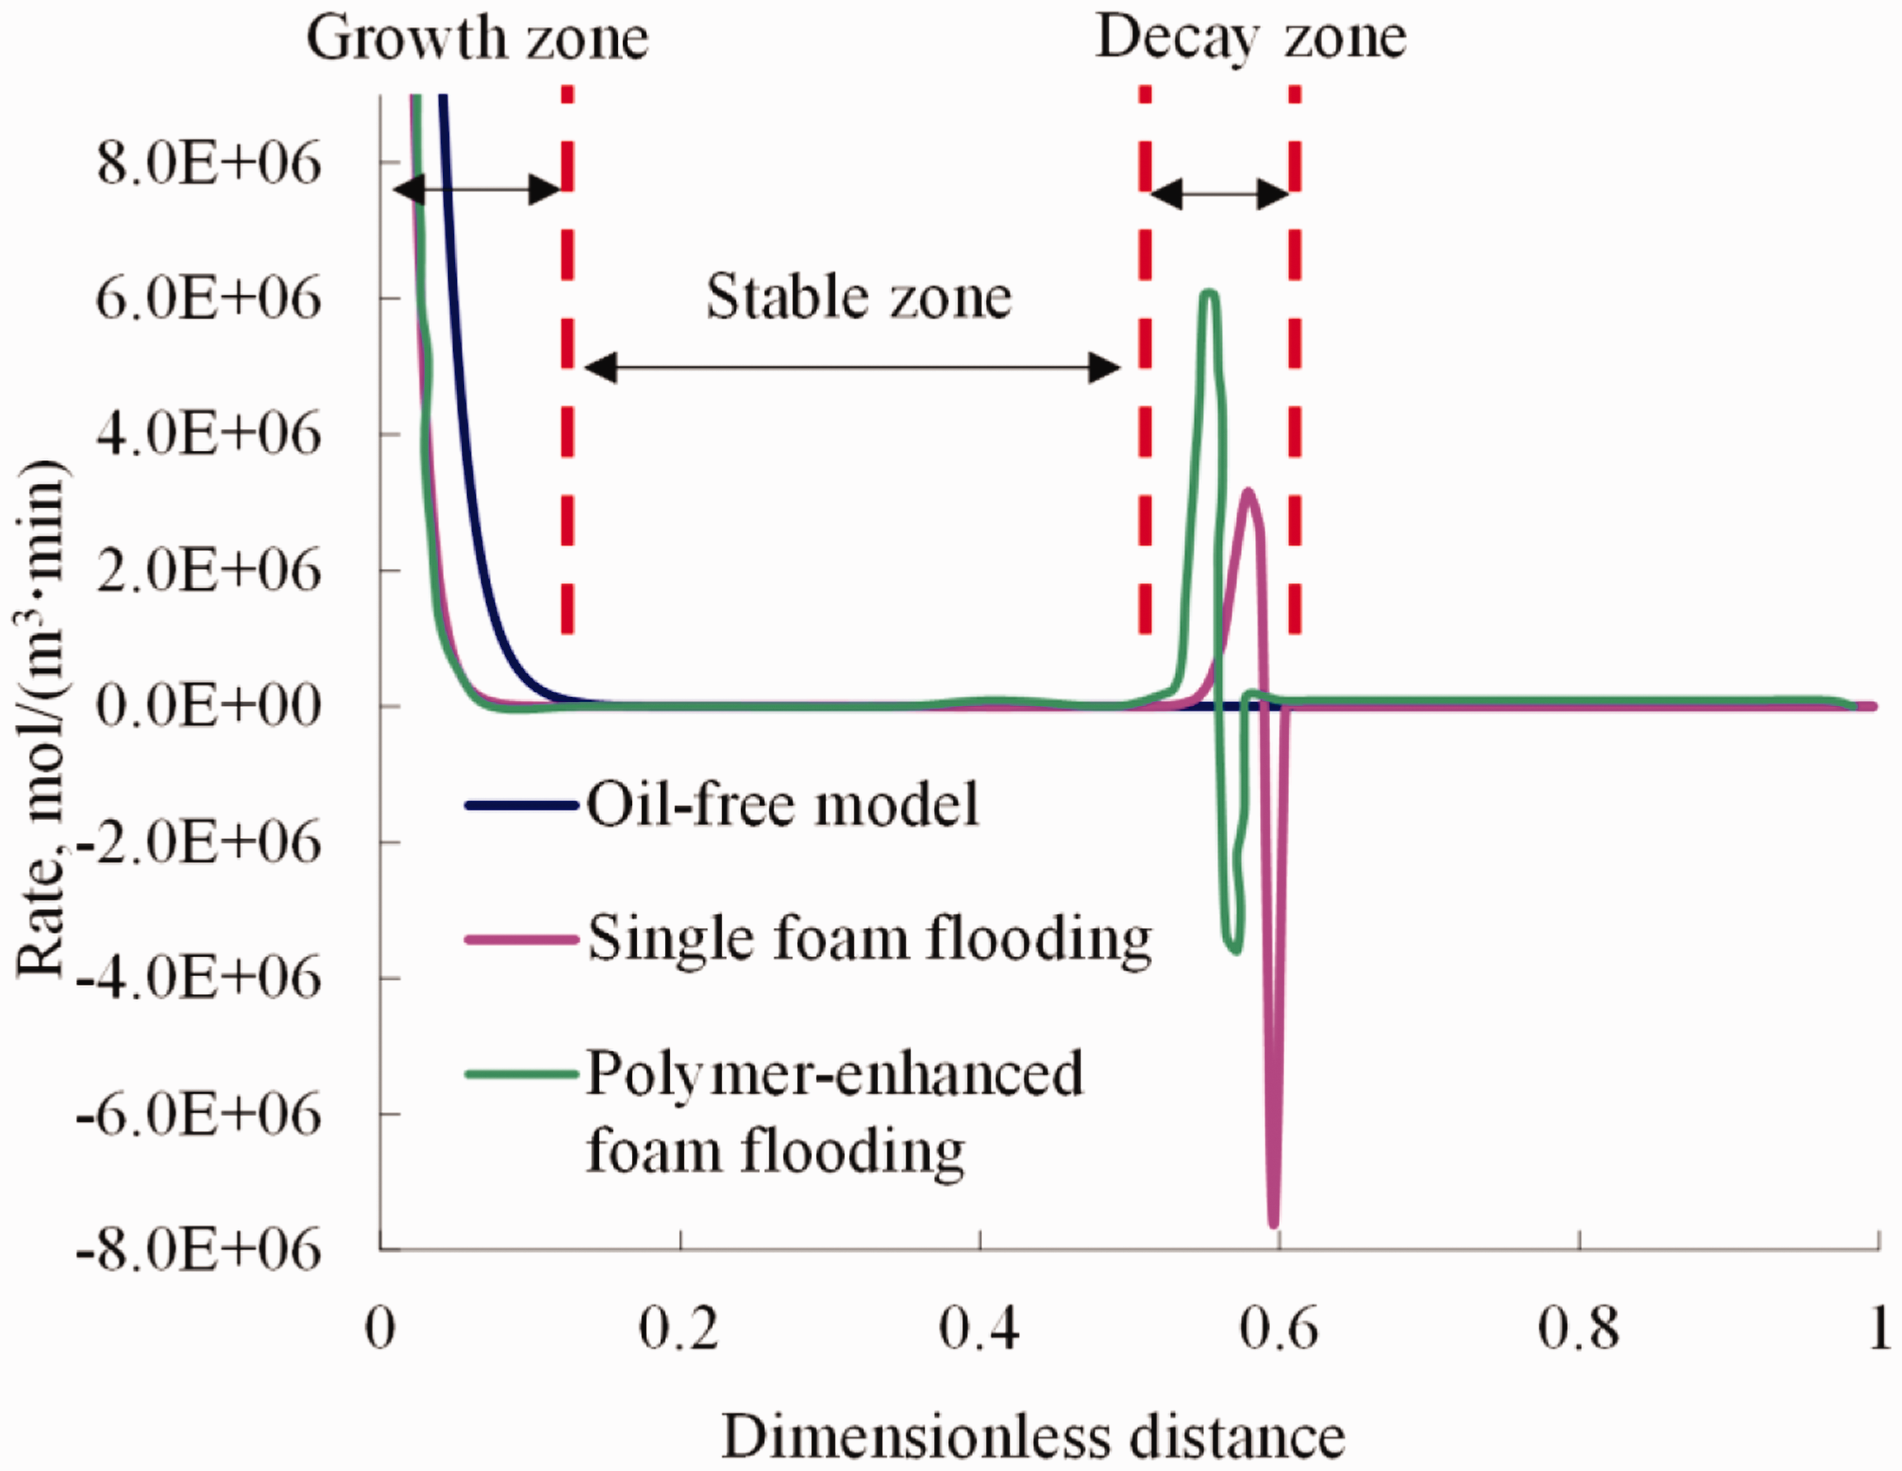
Foam net generation rate and regional characteristics (0.4 PV).
Analysis of influencing factors
Surfactant adsorption strength is an important factor affecting foam flooding. A regional characteristics comparison between when the adsorption is considered and when it is not in enhanced polymer foam flooding is shown in Figure 7. The foam moves more slowly, and the decay zone becomes shorter after considering the adsorption. This is because the natural-coalescence rate decreases and the oil-coalescence rate increases when the adsorption is considered; consequently, the foam concentration in the gas phase increases.
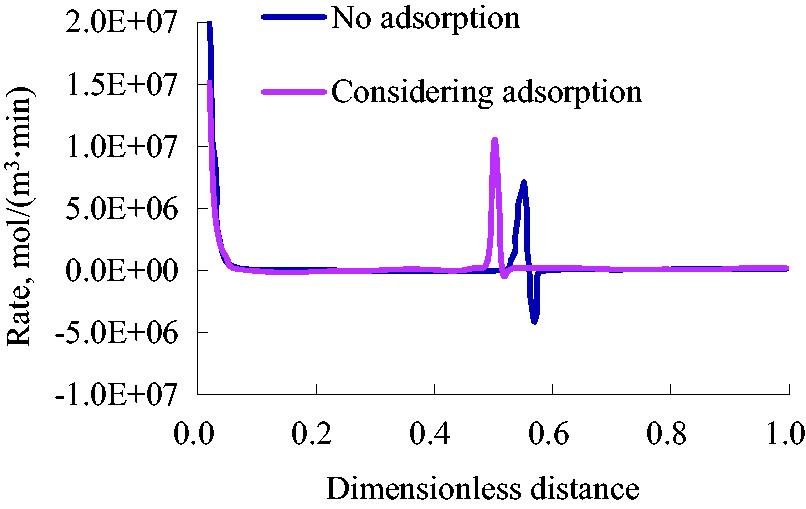
Effect of the surfactant absorption on foam net generation rate (0.4 PV).
The gas–liquid ratio also influences the foam flooding. If the gas–liquid ratio is too small, it cannot generate a large amount of stable foam. If the gas–liquid ratio is too large, however, the foam is unstable, and this can promote the formation of gas channeling. The regional characteristics when the gas–liquid ratios are 0.5:1, 1:1, 2:1, and 3:1 in polymer-enhanced foam flooding are shown in Figure 8. The foam moves faster, and the net generation rate exhibits greater fluctuation when the gas–liquid ratio is larger. This is because the larger the gas–liquid ratio, the smaller the foam concentration in the gas phase. The foam concentration in the gas phase decreases sharply in the displacement front, forming an unstable zone. Moreover, a large amount of free gas exists when the gas–liquid ratio is larger, and the foam breaks through quickly. In addition, the greater the gas–liquid ratio, the higher the oil saturation of the displacement front, leading to a higher oil-coalescence rate and a lower natural-coalescence rate in the oil–water interface.
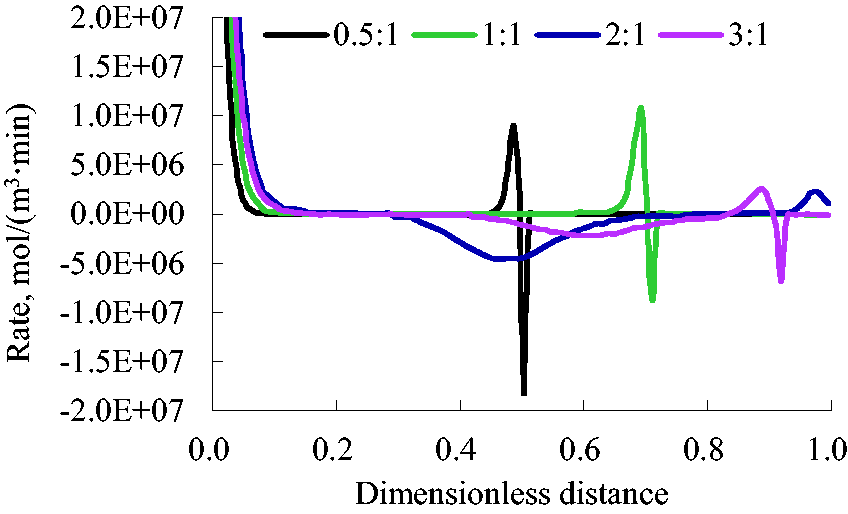
Effect of gas–liquid ratio on foam net generation rate (0.6 PV).
The faster the injection speed, the faster the foam generation and coalescence rate. Based on the enhanced foam flooding model, water flooding was performed first until the water content reached 98%; then, the gas–liquid ratio was maintained at 1:1, and the foaming agent solution and nitrogen were injected at rates of 0.1, 0.3, 0.5, and 0.7 cm3/min. The regional characteristics are shown in Figure 9. The slower the injection rate, the more stable the foam generation and coalescence rate, and the more uniform the foam distribution in the core. The faster the injection rate, the more slowly the foam front moves, and it suffers larger fluctuations in the decay zone.
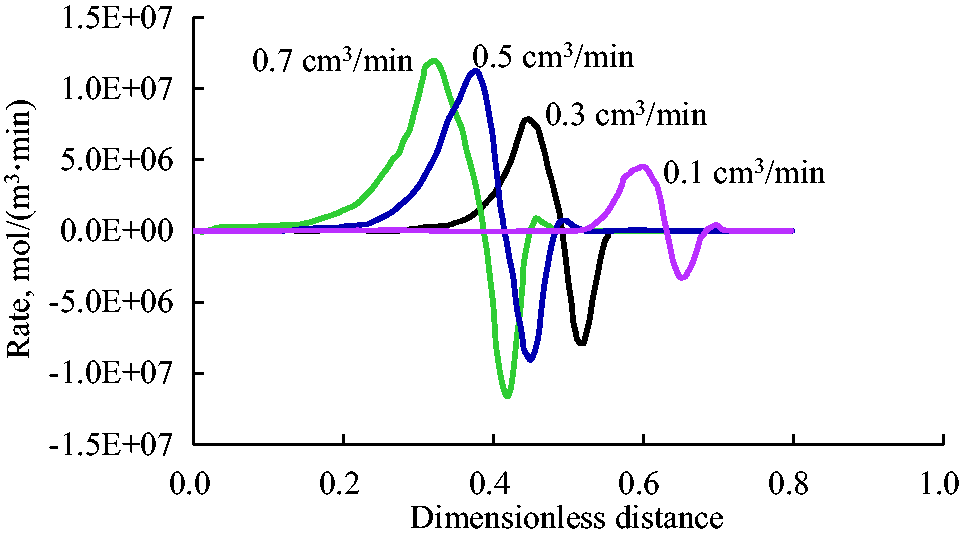
Effect of injection rate on foam net generation rate (0.6 PV).
The total injection rate of the foaming agent solution and nitrogen were kept the same when the effects of different injection schemes on the regional characteristics were further investigated (Figure 10). Scheme I represents simultaneous mixed injection, and schemes II–IV represent alternate injection with periods of 1, 2, and 4 min, respectively. The foam system in the mixed scheme has the best stability and easily forms a stable zone. For the alternate injection scheme, however, the longer the alternate injection period, the greater the fluctuation of the foam reaction rate, and the more difficult it is to form a foam steady zone.
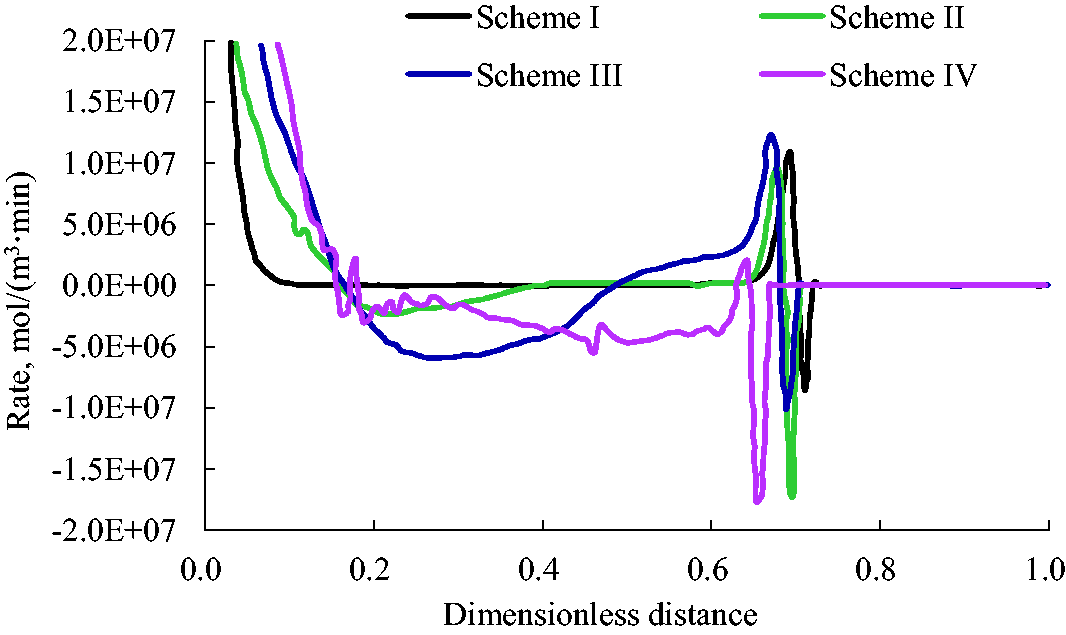
Effect of injection mode on net generation rate (0.6 PV).
Regional characteristics in 3D application example
A 3 D reservoir conceptual model was established based on a foam flooding pilot site in Shengli Oilfield, as shown in Figure 11. The area of the simulated domain is 1.07 km2, the porosity is 0.37, and the geologic reserve is 146 × 104 t. The entire area was divided into a uniform grid system of 36 × 33 × 6. The permeability of all the six simulation layers is a positive rhythm distribution with a variation coefficient of 0.73, and the average permeability is 1500 × 10−3μm2. The initial oil saturation is 0.68, and the oil viscosity is 75 mPa·s. The model had 14 production wells and five injection wells (four wells, i.e., C70_1, C25_G10, C26_G9, and C27_G10, were implemented with foam flooding, and the injection well are marked by the letter “I” at the end of well name). The water cut before foam flooding was 96.5%, and the recovery percentage is 43.6%.
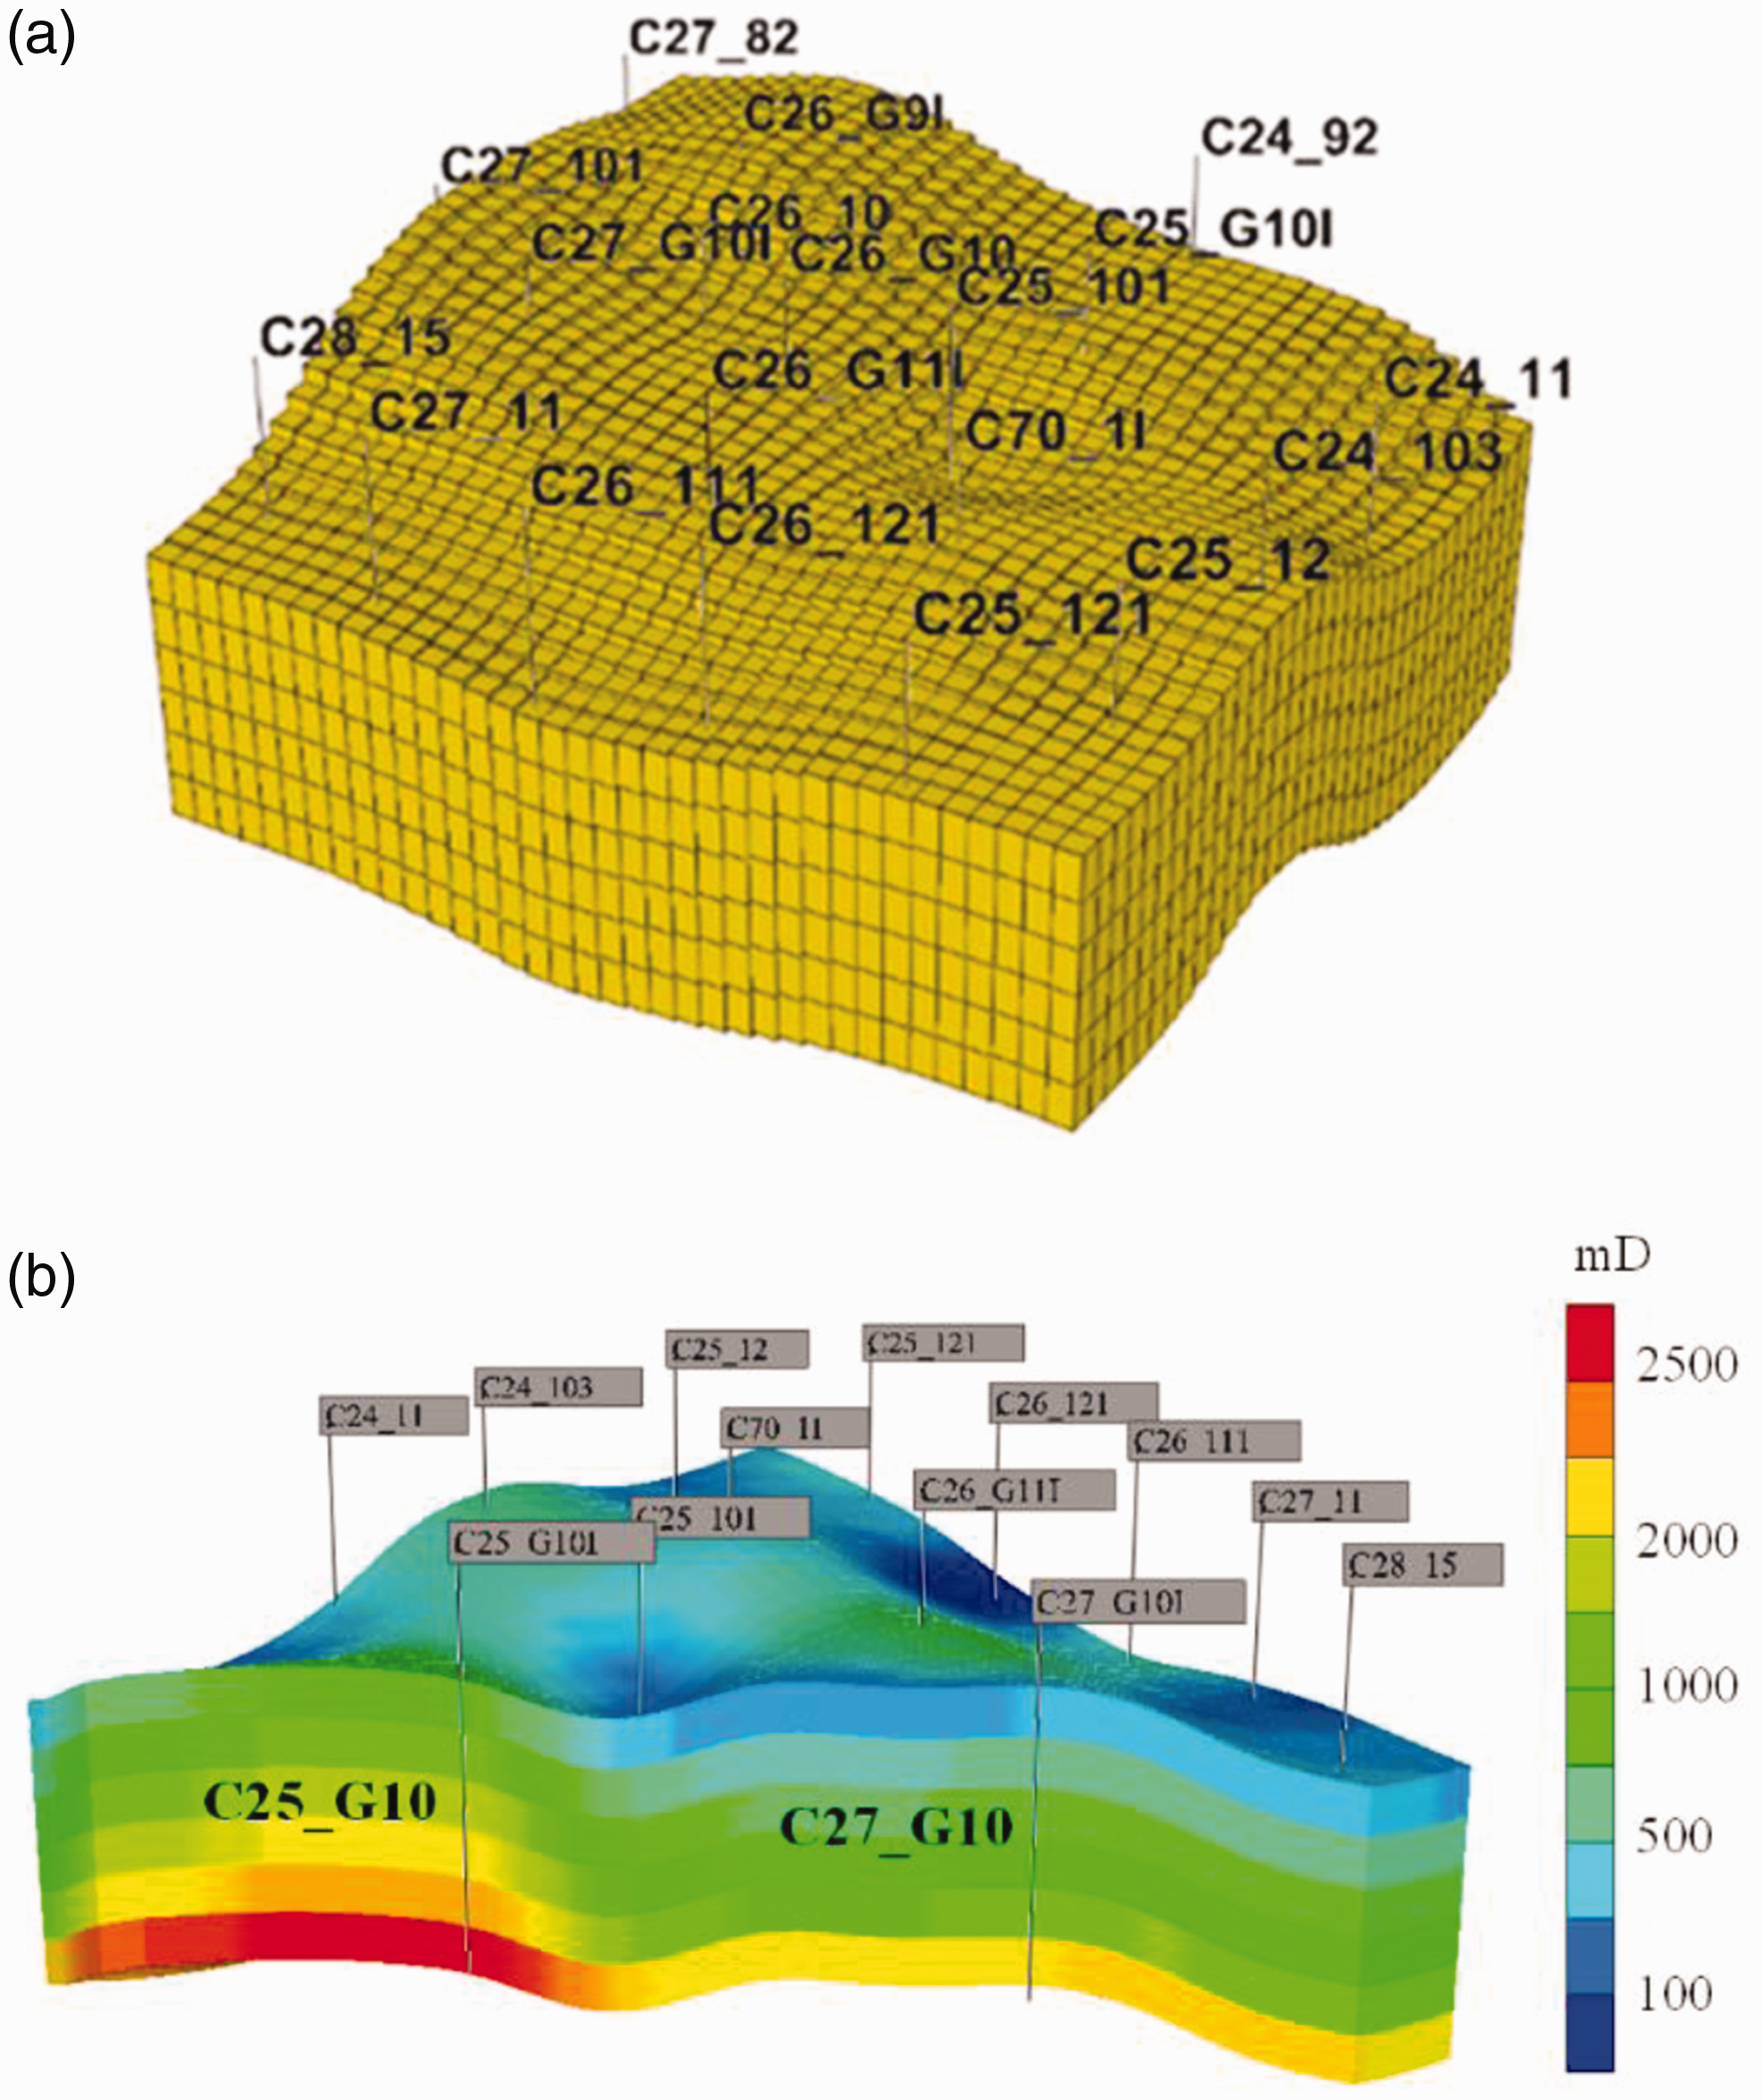
Geologic model and its permeability distribution.
Based on history matching, the single foam flooding simulating analysis was performed first. The simulation scheme was as follows. The preslug was 0.01 PV × 1.0 wt% surfactant solution, and the main slug was a 0.3 PV slug with nitrogen gas and surfactant solution of 1.0 wt% injected alternately. The alternating cycle was 30 days, and the gas-fluid ratio was 1:1. The parameters for foam generation and coalescence were consistent with the laboratory experimental simulating results in the previous section. The simulation results show that the single foam flooding enhanced oil recovery by 3.51% compared with water flooding. To describe the distribution of foam, the conceptual model along with wells C25_G10 and C27_G10 was sliced during single foam flooding, and the 3 D distributions of the foam generation rate, natural-coalescence rate, oil-coalescence rate, and net generation rate were plotted, as shown in Figure 12.
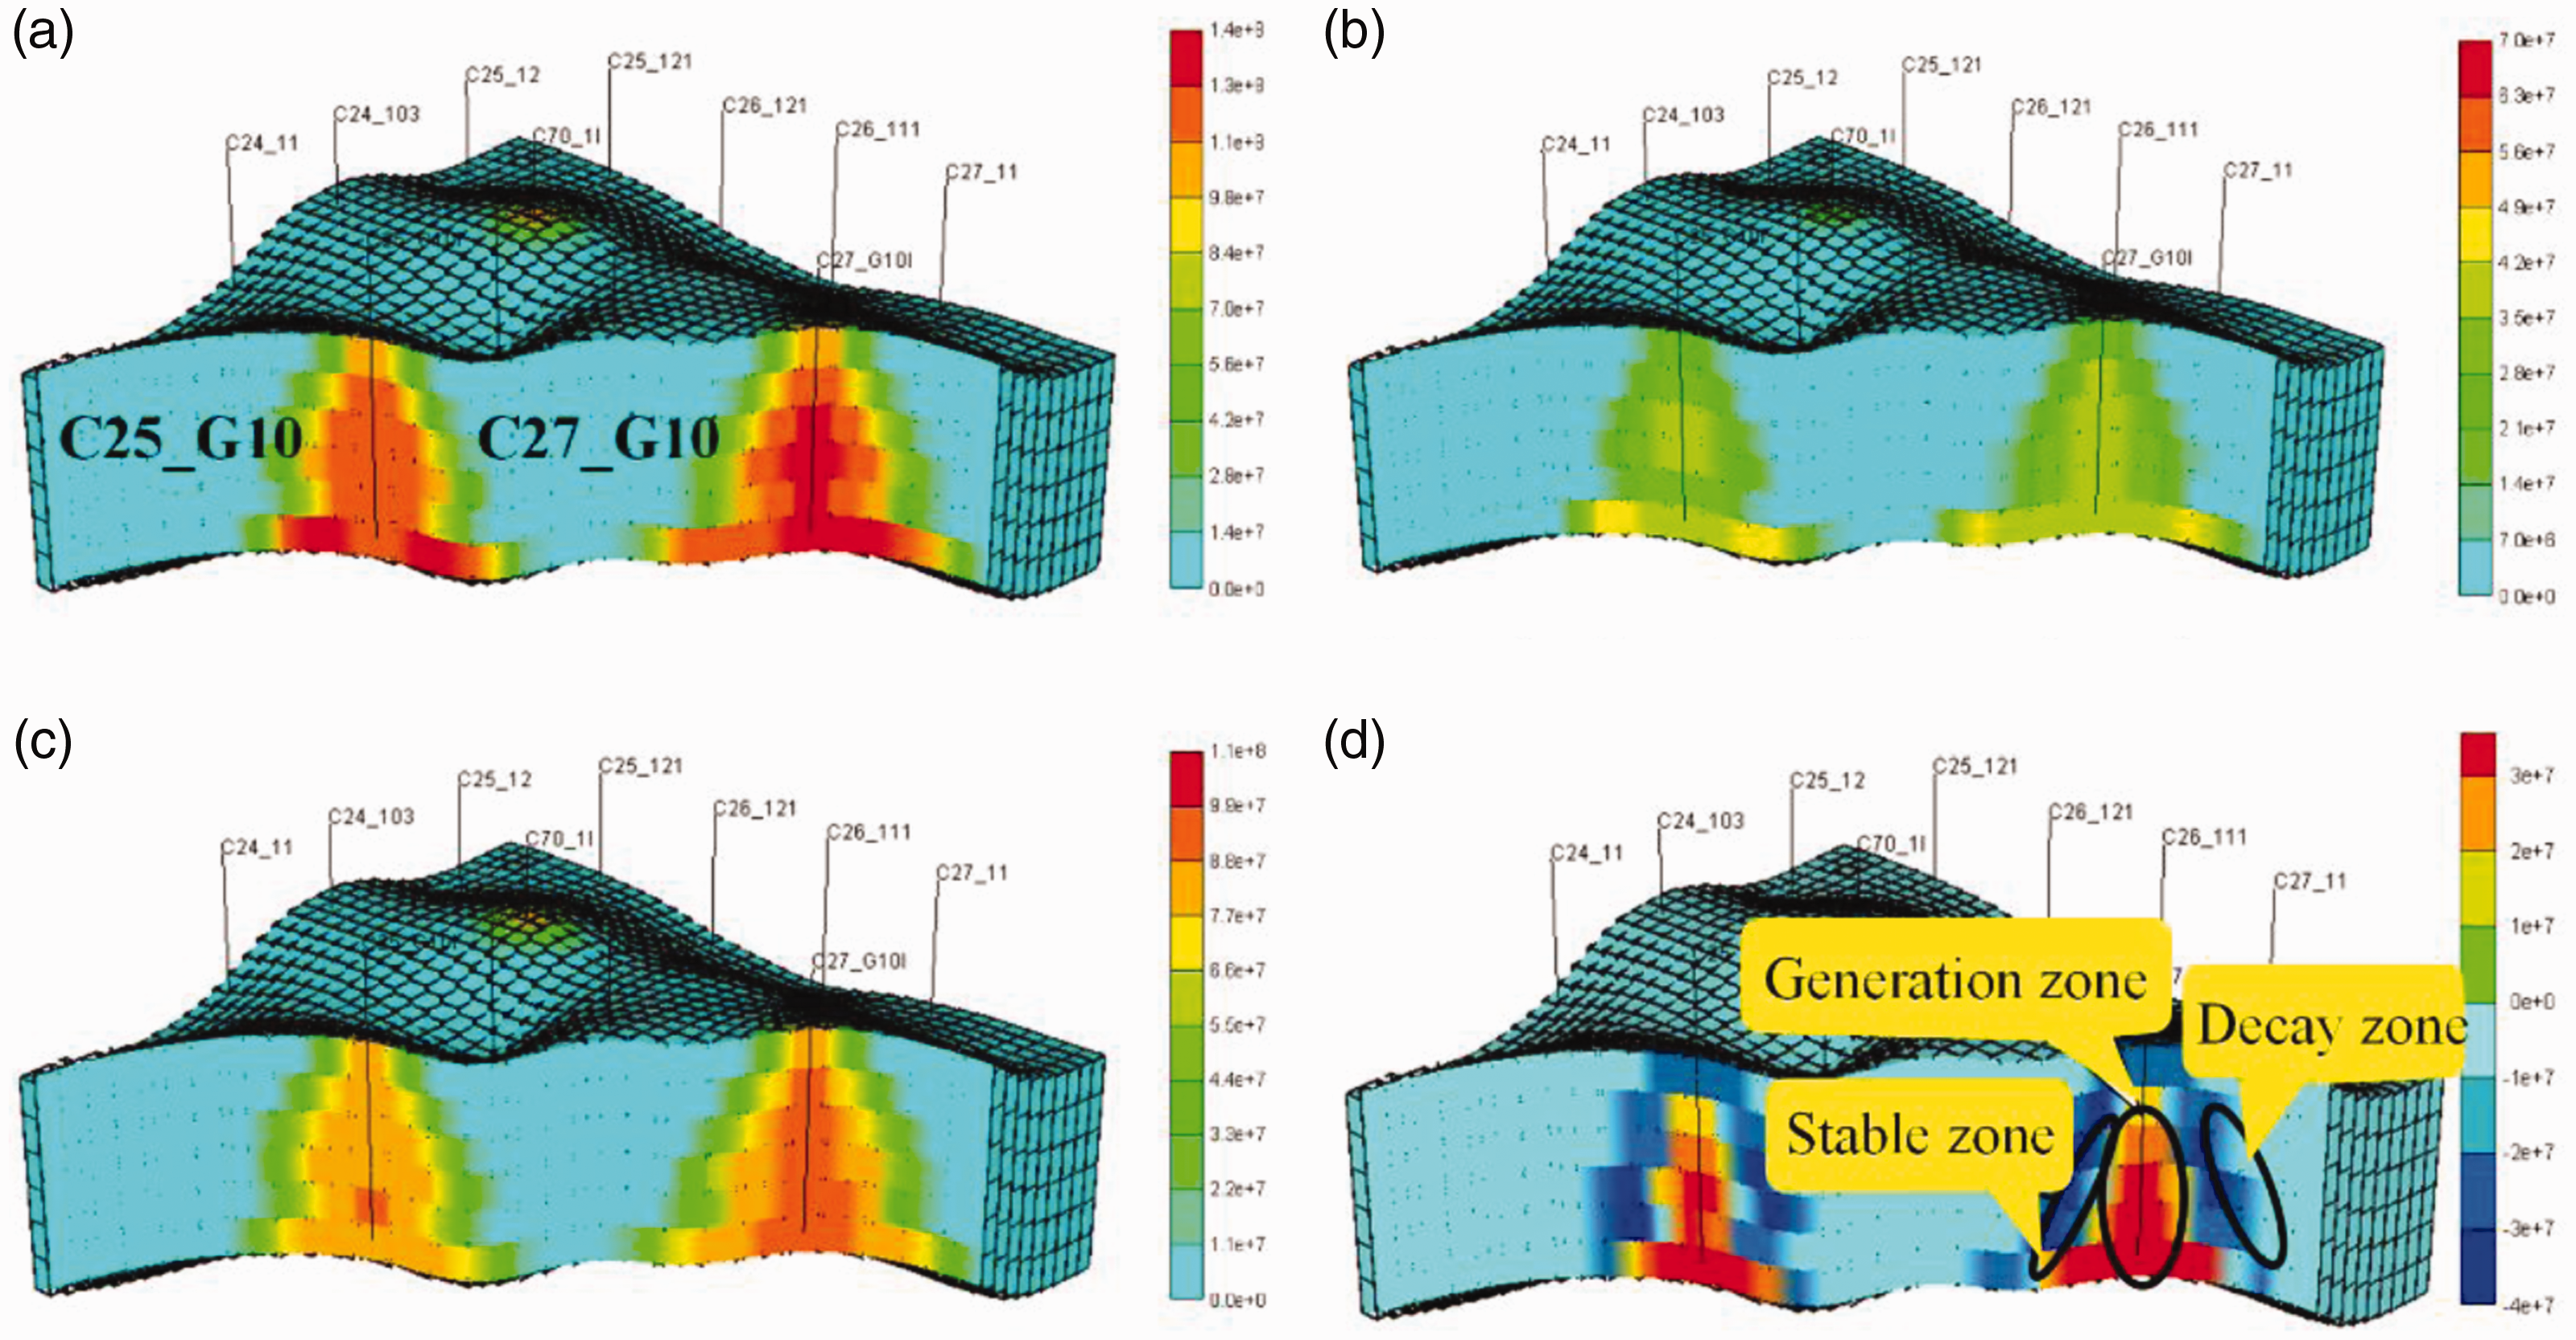
Distribution of reaction rates in single foam flooding (0.3 PV).
In Figure 12(a), the foam generation rate is higher near the injection well and lower near displacement front. Meanwhile it is higher in the top low-permeability layer and lower in the bottom high-permeability layer because the foam can block the high-permeability layer effectively. Figure 12(b) and (c) show that the distributions of the coalescence rate and generation rate are similar. Moreover, the oil-coalescence rate is greater than the natural-coalescence rate in single foam flooding. Thus, the presence of oil is a main factor that affects the stability of the foam distribution. Unlike in the 1 D model, the foam coalescence rate near the injection well is higher in the 3 D model. This is because the foam flow is a linear flow in the 1 D model, while it is a radial flow in the 3 D model, so the flow concentration is the highest near the injection well in 3 D model. Figure 12(d) shows that net generation rate distribution in the 3 D model can also be divided into three zones: the foam growth region, stable region, and decay region in the reservoir. Both the growth region and the decay region have a wide distribution range, whereas, in the stable region, it is not obvious. Because foam generates and coalesces constantly in the swept region, the unsteady characteristics at the injection inlet and displacement front in the 3 D model cannot be neglected.
Furthermore, polymer-enhanced foam flooding was conducted. The simulation scheme was as follows. The preslug was a 0.01 PV chemical slug (polymer solution of 1800 mg/L and surfactant solution of 1.0 wt%), and the main slug was 0.3 PV with alternating injection of nitrogen gas and a chemical slug (surfactant solution of 1.0 wt% and polymer solution of 1800 mg/L). The alternating cycle was 30 days, and the gas–fluid ratio was 1:1. The simulation results show that the enhanced foam flooding improved oil recovery by 9.36% compared with water flooding, which is a higher value than that of single foam flooding. The foam distributions are shown in Figure 13, which shows that the distribution of the foam generation rate in enhanced foam flooding is similar to that of single foam flooding. Figure 13(b) and (c) show that the oil-coalescence rate is substantially less than the natural-coalescence rate in enhanced foam flooding, which indicates that the presence of the polymer enhances the stability of the foam. Figure 13(d) shows that the distribution of the net generation rate in the reservoir is consistent with that of single foam flooding, but the growth region is larger than that in single foam flooding.
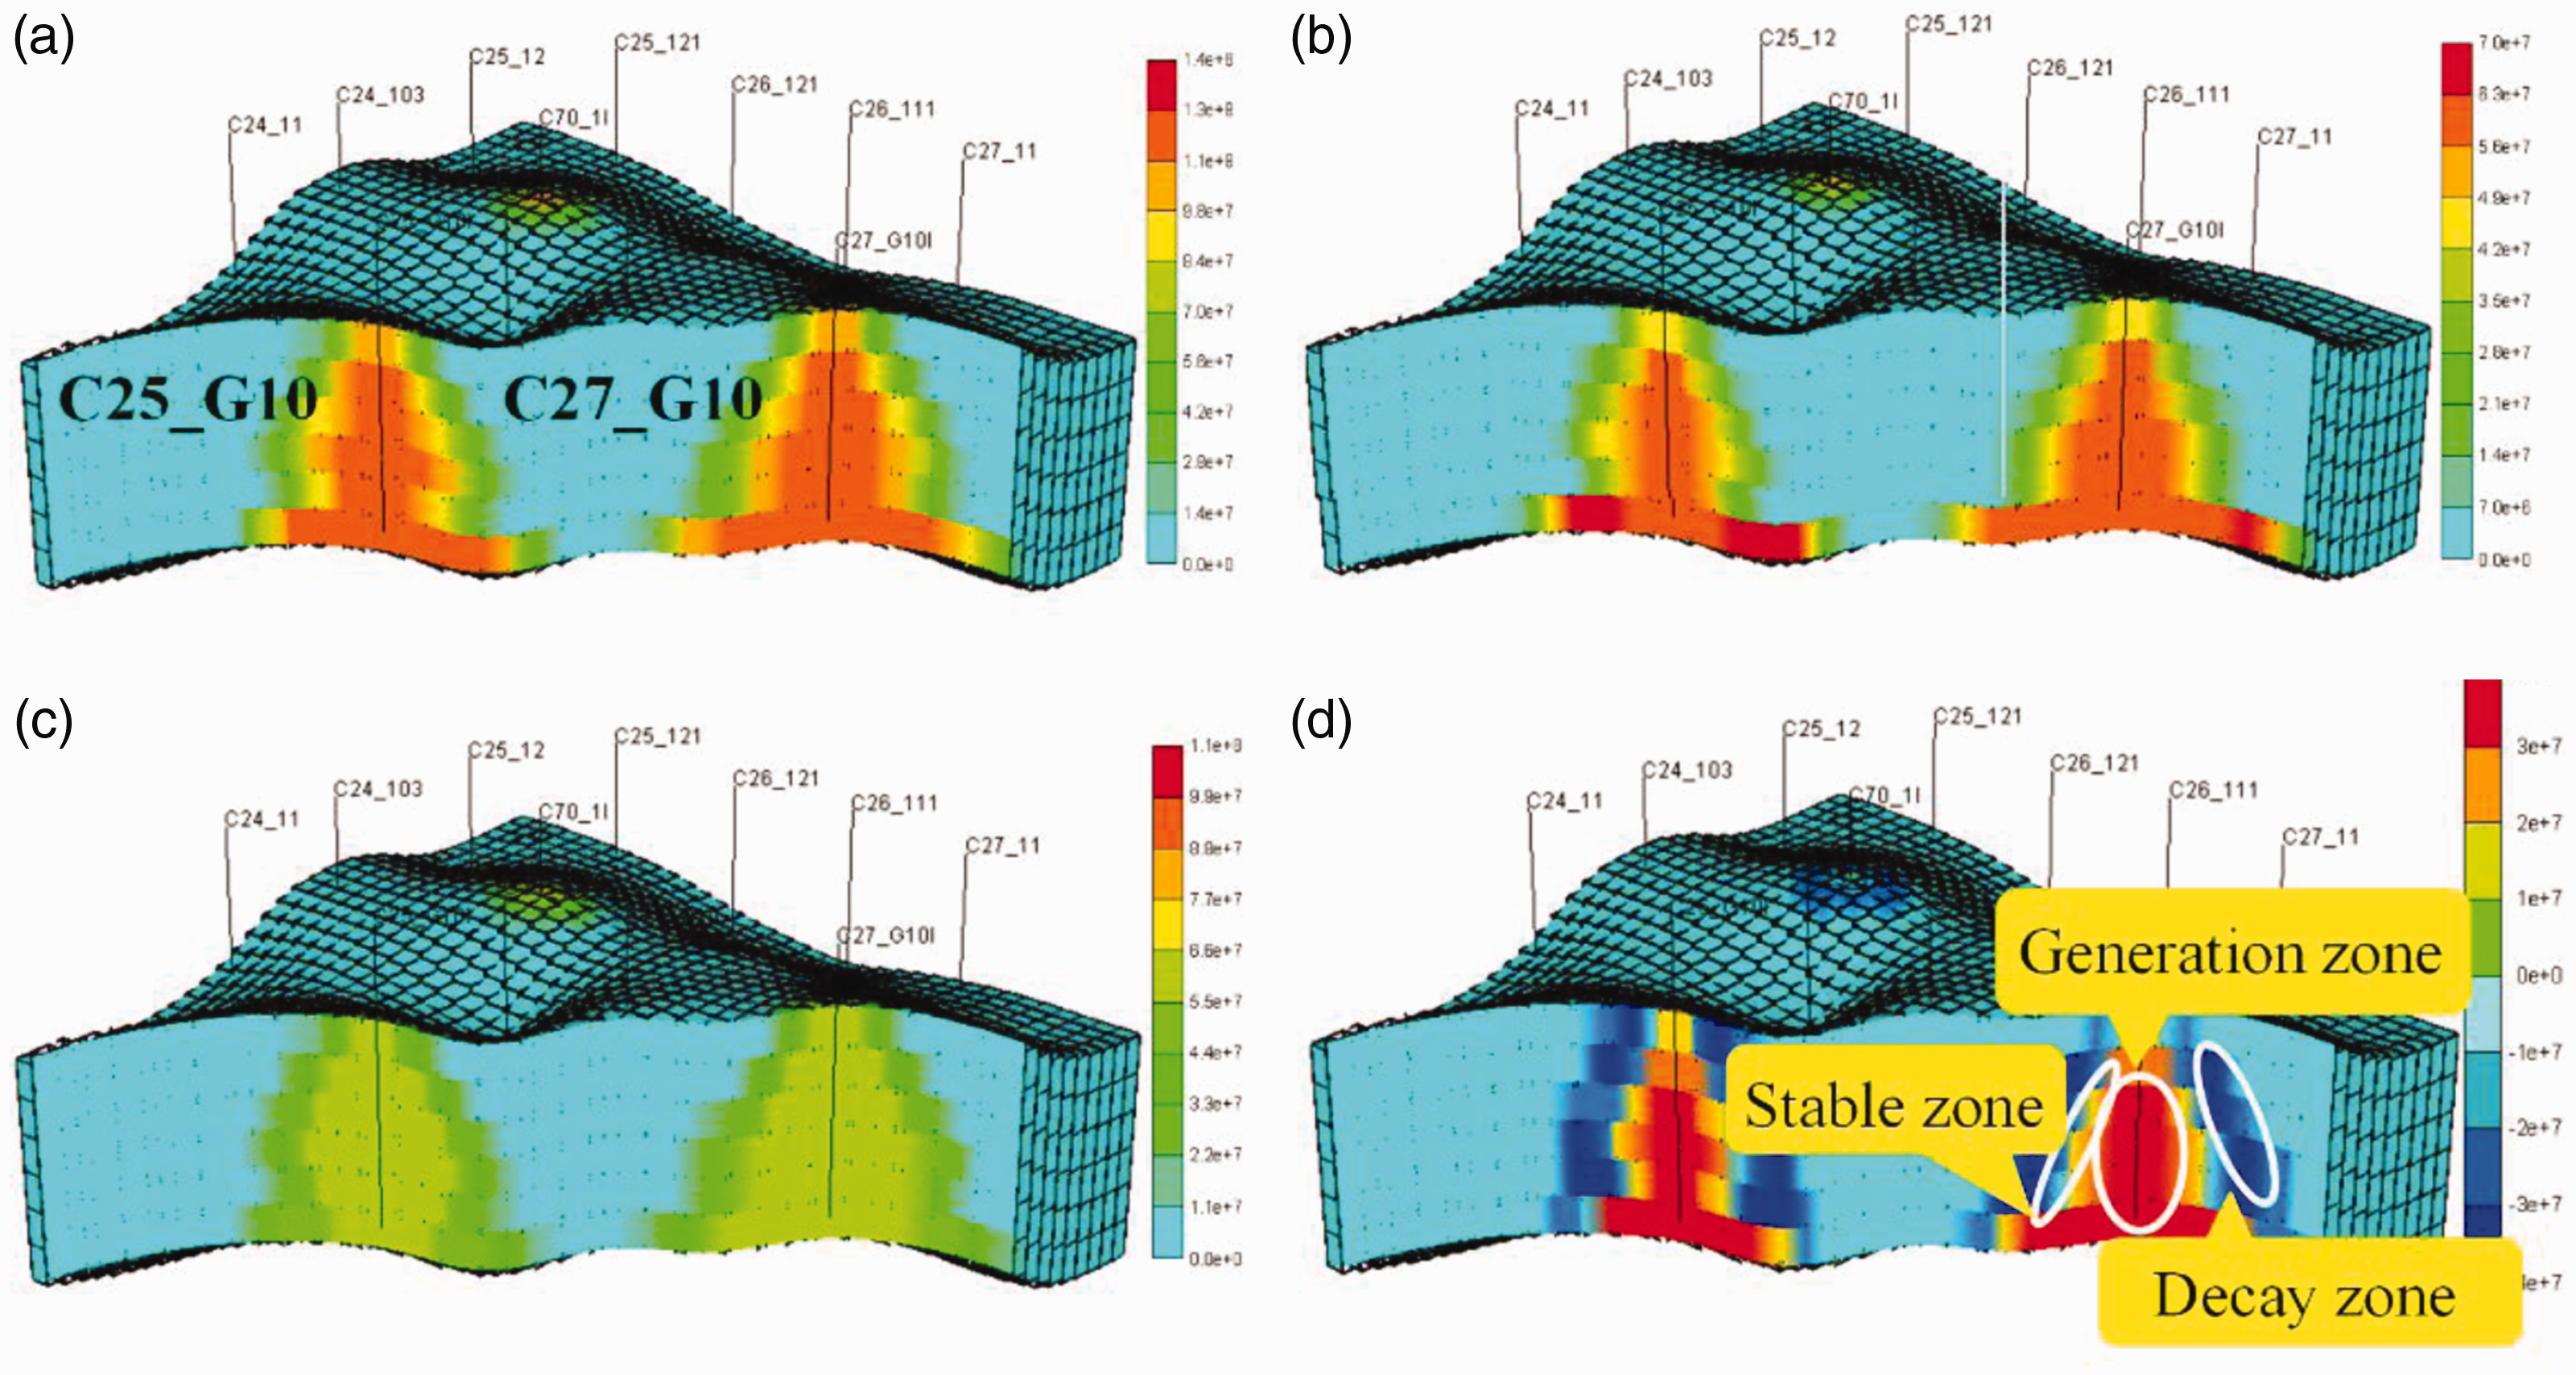
Distribution of reaction rates in polymer-enhanced foam flooding (0.3 PV).
Based on the above 3 D model, we further examine the sensitivity of different parameters on the final oil recovery during the polymer enhanced foam flooding. We select five parameter levels for each influencing factor (oil viscosity, injection rate, polymer concentration, gas-liquid ratio, slug volume, and the injection timing) within a reasonable interval, then run those simulation cases and calculate the coefficient of variation for each influencing factor (the ratio of the standard deviation to the mean average of the oil recovery). If the coefficient of variation is larger, it means that the oil recovery is more sensitive to this parameter. The parameter details are shown in Table 2 and the sensitivity chart is shown in Figure 14.
Parameters for influencing factors sensitivity analysis.
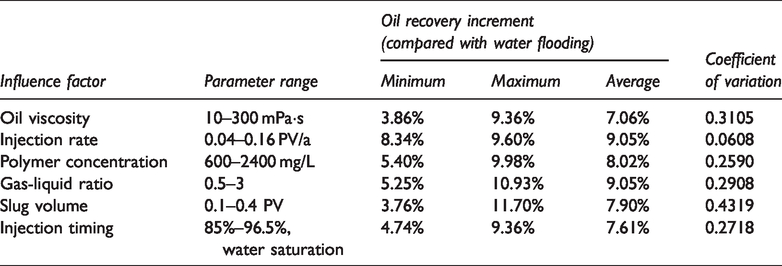
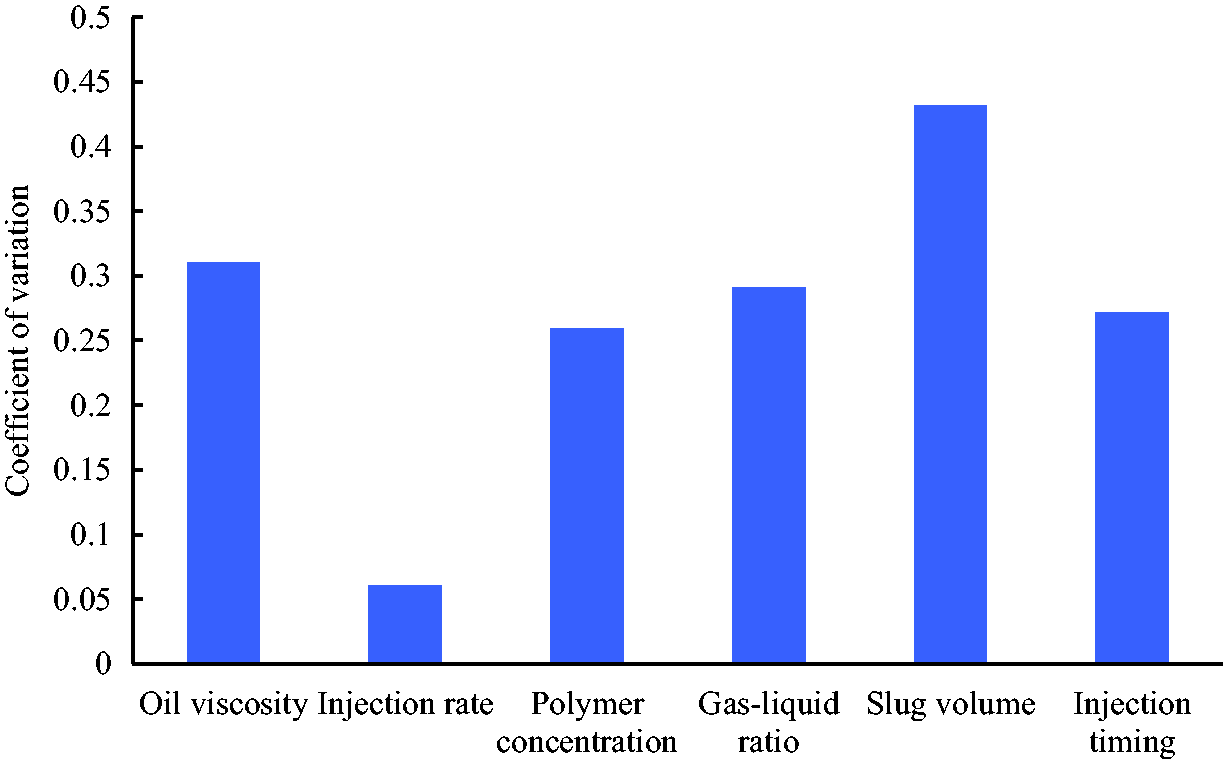
Sensitivity analysis chart for the polymer enhanced foam flooding.
It shows that the slug volume influences the oil recovery the most, followed by the oil viscosity, gas-liquid ratio, injection timing, and the polymer concentration. In addition, the effects of injection rate on the oil recovery rank the last. That means we can simply choose to increase the slug volume to improve the oil recovery. However, we must consider the extra cost of the chemical slugs, and achieve a best replacing oil ratio of chemical agents. Similarly, we had better to optimize the polymer concentration, for though larger polymer concentration helps improve the foam stability, it may also lead to formation damage.
Conclusion
A foam flooding simulation model was established based on the population balance model. The model was validated based on experiment results. The main conclusions are as follows.
There are three zones during foam flooding: the growth zone, stable zone, and decay zone. In the area near the injection inlet, foam generates gradually, and its concentration increases, forming the growth zone. After a certain distance of movement, the foam generation rate becomes approximately equal to the coalescence rate, reaching a dynamic stable state. At the front of foam flooding, the foam coalescence rate increases for high oil saturation and gas diffusion, leading to a decay zone. The stability of the single foam system is much poorer under the condition of high oil saturation, and the polymer can enhance the foam system effectively. In polymer-enhanced foam flooding, the foam front flows more slowly than in the model without the polymer. There is no decay zone in the oil-free model. The foam moves more slowly and the decay zone becomes shorter after the surfactant adsorption has been considered. The foam moves faster and the net generation rate suffers a larger fluctuation when the gas–liquid ratio is larger. The faster the injection rate, the more slowly the foam front moves, and the greater the decay zone fluctuation. The foam mixed injection scheme has better stability than alternate injection and easily forms the stable zone. The 1D and 3D regional characteristics of foam flooding are slightly different. Because the foam flow in the 1D model is a linear flow, the growth area and the decay area are not as wide, and most of the swept area is a stable zone. While the flow near the well in the 3D model is a radial flow, most of the swept area is controlled by the growth zone and decay zone. The foam can prevent the formation of gas channeling and block the high-permeability layer effectively. The enhanced foam flooding improves oil recovery by more than 9%, and the growth zone in enhanced foam flooding is larger than that of single foam flooding.
Footnotes
Declaration of conflicting interests
The author(s) declared no potential conflicts of interest with respect to the research, authorship, and/or publication of this article.
Funding
The author(s) declared the following potential conflicts of interest with respect to the research, authorship, and/or publication of this article: The authors greatly appreciate the financial support of the National Science Foundation for Distinguished Young Scholars of China (Grant No. 51625403), the National Natural Science Foundation of China (Grant No. 52004319), and the Important National Science and Technology Specific Projects of China (Grant no. 2016ZX05011–003). Wei also was financially supported by the China Postdoctoral Science Foundation (Grant no. 2020M672176), the Qingdao Postdoctoral Applied Research Project (Grant no. qdyy20190033), and the Fundamental Research Funds for the Central Universities (Grant no. 20CX06029A).