
Abstract
In this paper, the effect of adding the composite PCM (Phase Change Material) heat storage capsules to the heat storage layer of the salt gradient solar pond on the thermal performance of the solar pond was studied numerically and experimentally. Based on the program-controlled temperature simulation of the solar pond experimental platform, the effect of adding the composite PCM (48–50°C and 58–60°C melting point paraffin) heat storage capsules on the solar pond temperature and stability was studied, and a numerical simulation model was established to be compared by the experimental results. The results showed that the experimental temperature was consistent with the simulation results; the solar pond with PCM capsules had a smaller temperature change range than the conventional solar pond during the phase change process, but it did not have such effect in the non-phase transition process; in terms of flow, the addition of the PCM phase change units could reduce the flow rate of the heat storage zone, and the PCM with a larger latent heat had a more obvious suppression effect on the flow. Therefore, within a certain temperature range, adding PCM units to the solar pond had a positive effect on maintaining the stable temperature and stability of solar pond.
Keywords
Introduction
The increase of effective supply of the various clean energy sources such as solar energy is one of the basic ways to realize China’s commitment to the world on energy conservation and emission reduction in 2030 (Zhao et al., 2017). The salt gradient solar pond (the following is abbreviated as solar pond), as a low-cost solar heat utilization integrating solar energy absorption and storage, can store large-capacity low-temperature thermal energy for a long time (Abdullah et al., 2016).
The solar pond is a salt water pond with increasing salinity from surface to bottom. This increasing density gradient in the depth direction suppresses the thermal convection caused by the temperature gradient, so that the solar energy reaching the bottom can only be lost to the environment in the form of heat conduction through the thicker gradient zone, so a stable salt gradient zone is the most basic guarantee for the solar pond operation (Wang et al., 2011). Solar pond is generally composed of three zones: the Upper Convection Zone (UCZ) composed of fresh or brackish water; the Non-convection Zone or gradient zone (NCZ) where the brine concentration gradually increases with depth and the heat can only be transferred in the form of heat conduction; and the Lower Convection Zone (LCZ) composed of concentrated brine with uniform concentration. LCZ is also called heat storage layer because convective flow occurs uniformly and it absorbs and stores solar radiation energy.
Solar pond can be used in many heat supplied applications. It can be used for indoor air conditioning (Jebbar and Mahdi, 2019), or coupled with seawater desalination to operate the system without consuming traditional energy (Mohamed and Bicer, 2019), or used to provide heat for industrial salt production which in turn acts as a heat source for low-temperature power generation such as organic Rankine cycle (ORC) and thermoelectricity (Zeynali et al., 2019; Ziapour et al., 2017), or to provide auxiliary heat supply for hydrogen production systems (Karakilcik et al., 2018), etc.
Despite the wide application, all the existing technologies are based on the sensible heat storage form of the brine as the heat storage medium, resulting in a lower heat storage density per unit volume of working fluid in solar pond (Kasaeian et al., 2019). On the other hand, sensible heat storage easily leads to an increase in temperature difference between the upper and lower layer of the gradient zone, which causes solar pond to lose its stability if the solar radiation is strong or if there is no heat extraction.
The latest research developments began to study the effect of addition of phase change heat storage materials to solar pond on its thermal performance (Kasaeian et al., 2018). Assari et al. (2015) and Beik et al. (2019) encapsulated paraffin in a metal tube encapsulation structure and placed it in the LCZ of solar pond. The research results showed that the use of PCM in soalr pond reduced the temperature difference between the day and the night, and a more stable temperature appeared during the heat extraction. In order to improve the thermal conductivity of PCM, also in the tube encapsulation structure, Sarathkumar et al. (2017) added nano metal powder to paraffin as an enhanced heat transfer medium to investigate the soalr pond temperature evolution. The experimental results of Ines et al. (2019) showed that adding PCM heat storage units to solar pond was beneficial to stabilize the heat supply at a certain temperature level which could be used for domestic hot water supply. In the latest report of Amirifard et al. (2018), a sleeve encapsulating paraffin phase change material was installed on the outer wall of the heat exchange tube inside solar pond to study the effect on the heat exchange efficiency. In their study, the focus is placed on the heat exchange situation of the heat exchange tube, and the solar pond temperature conditions was taken as constants. The existing studies have focused on the effect of adding PCM on the temperature development of solar pond, but the effect on the stability caused by adding PCM has not been reported.
In this paper, the temperature development of the solar pond with paraffin added in the LCZ was studied numerically and experimentally, and a numerical model was established based on the experimental conditions. The effect of PCM capsules on the solar pond temperature distribution as well as the effect of the parafin capsules on the solar pond flow stability have been studied.
Experimental study
Experimental setups
The experimental setups, as shown in Figure 1, were mainly composed of a solar pond and a computer PLC control system, which were connected to each other by data lines. The experimental solar pond had a surface area of 0.48 m2 (0.8 m × 0.6m) and it was 1 m deep, and its bottom and surroundings were welded with 304 stainless steel, its middle was filled with SiO2 aerogel insulation material with a good thermal insulation and a thickness of 0.1 m. There was a special snake-shaped 316 L stainless steel electric heater at 0.15 m from the bottom of the water tank whose heating power (range: 0–500 W) was adjusted and controlled by the computer-PLC control system. A stainless steel tube was inserted into the geometric center of the water tank and tied with 15 PT100 thermocouple temperature sensors, which located at the depth of 5, 10, 15, 20, 25, 30, 35, 40, 47, 54, 61, 68, 75, 85 and 95 cm. The computer-PLC control system had two main functions: one was to input local initial data used to calculate the heating power through an internal program to control the heating of the electric heater; and the other was to record the temperature data fed back by the temperature sensors during the experiment as well as all experimental log data.
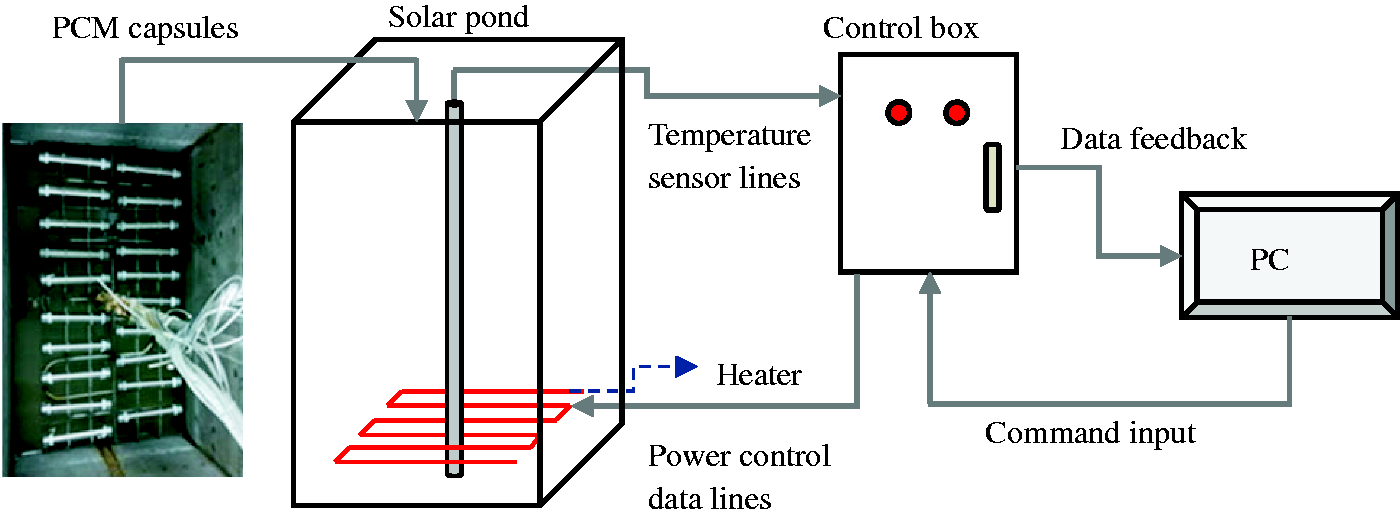
The experimental setups of solar pond with PCM capsules.
The filling method of solar pond was as follows: the WZ-212/ATC salinity measuring instrument was used to measure the brine concentration, with a measurement accuracy of ±0.1%. The initial salt concentration gradient distribution of solar pond was as follows: the uppermost UCZ had a thickness of 12 cm for fresh water, and the NCZ had 4 gradient layers with a thickness of 7 cm and a brine concentration of 6%, 10%, 14% and 18%, respectively, and LCZ had a thickness of 40 cm with the brine concentration of 20%. The PC-PLC control system controlled the heating power according to the local solar radiation data, and the data was updated each minute. PCM are classified by working temperature of the application (Camila et al., 2014), and generally, keep PCM working with liquid state when it used for heat storage. Therefore, considering the operating temperature of the solar pond in this study, two kinds of paraffin wax used in this study, which are both the products of Chinese Medicine Group, 48–50°C melting point (CAS 8002-74-2) and 58–60°C melting point (CAS 8002-74-2), and hereinafter referred to as Paraffin 50 and Paraffin 60 respectively.
According to the different heat storage units, three sets of experiments were conducted: Case A: a blank control group without PCM added, and in order to exclude the influence of the tube, the heat storage capsule tube was filled with 20% saline; Case B: LCZ Composite (Paraffin 50) heat storage capsules were added to the solar pond; and Case C: composite (Paraffin 60) heat storage capsules were added to the LCZ.
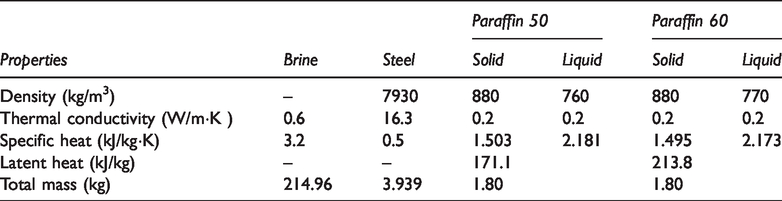
The preparation process of the heat storage unit: the stainless steel wire was evenly added to the cylindrical stainless steel tube with one end closed to fill the entire cavity, then the molten paraffin was injected and naturally cooled to a solid, and finally the other end was sealed. This same method was used to produce three groups of PCM heat storage units, each with 20 stainless steel tube PCM capasules. The steel pipe and stainless steel wires were made of stainless steel 304. The outer wall and steel wire of the composite PCM heat storage units were also made of 304 stainless steel. Each heat storage unit had a diameter of 32 mm, a wall thickness of 1 mm, a tube length of 200 mm, and a total weight of 196.9 g. The mass fraction of the steel wire accounted for 10% of the total filler, and the total volume of each heat storage unit accounted for 1.67% of the LCZ volume. The mass of paraffin material in Case B and Case C was 1.80 kg, and the physical parameters of other experimental materials were measured under the laboratory environmental conditions. The detailed parameters of the materials used in this study were listed in Table 1. Figure 2 showed the change of specific heat capacity of paraffin material used in this study with temperature.
Physical properties of experimental materials.
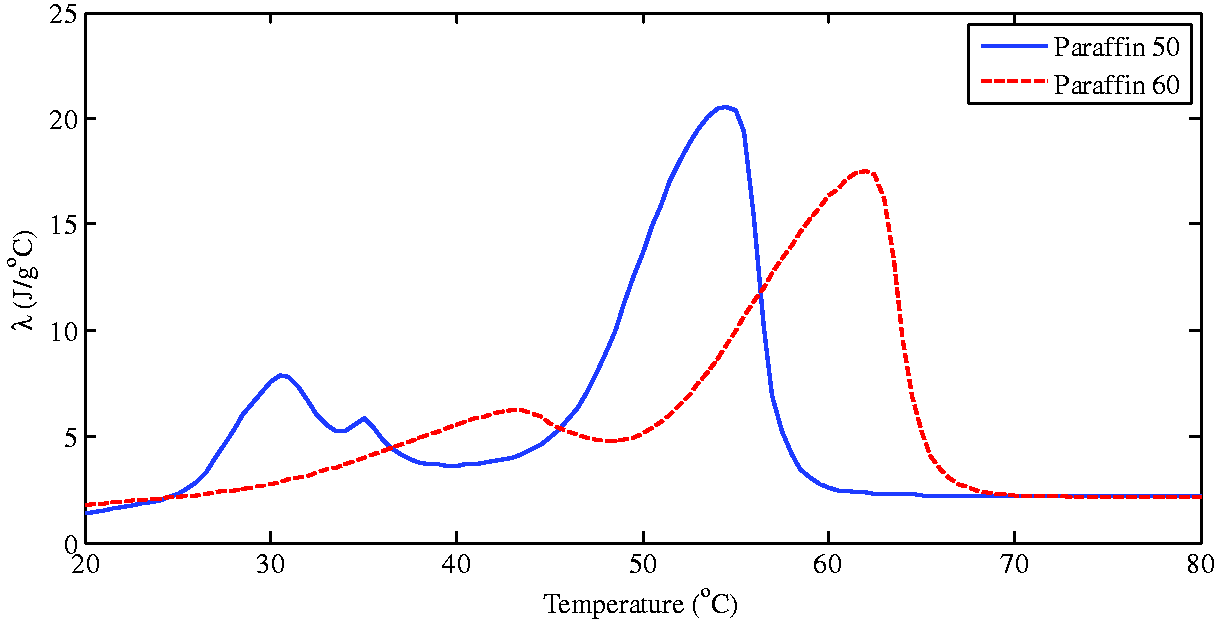
Heat capacity variations with temperature of Paraffin 50 and Paraffin 60.
The experiment was set to start at 12:00 noon on June 1, and was divided into three groups. In order to ensure the contrast of the experiment, except for the heat storage material inside the heat storage unit, the other setting parameters were the same: the solar radiation data came from the meteorological data of Jiaozuo city: Jiaozuo, Henan Province, China, latitude of 35°20′. The extinction coefficient was set at 0.6 and the indoor ambient temperature was around 22 °C. After the experiment, the stability analysis of the temperature field and flow field of the solar pond was carried out according to the temperature data recorded by the pre-set temperature sensors. On the 5th day, temperature difference reached the solar pond limit and caused the destruction of the salt gradient and stability of the entire system, so, each group of experiments only ran for 5 days.
Experimental results
Figure 3 showed the average LCZ temperature in three cases, and Figure 4 showed the change in temperature with time in solar pond experimentally measured in the depth direction in the three cases. It could be seen from Figure 3 that, the three curves were quite close. This was because the proportion of added phase change heat storage material was small relative to the total amount of water in the heat storage layer, but, as the main purpose of this study was to verify the model of the PCM capsule to predict the temperature field development of the solar pond effectiveness, it did not explore the effect of the added amount on the thermal performance of solar pond.
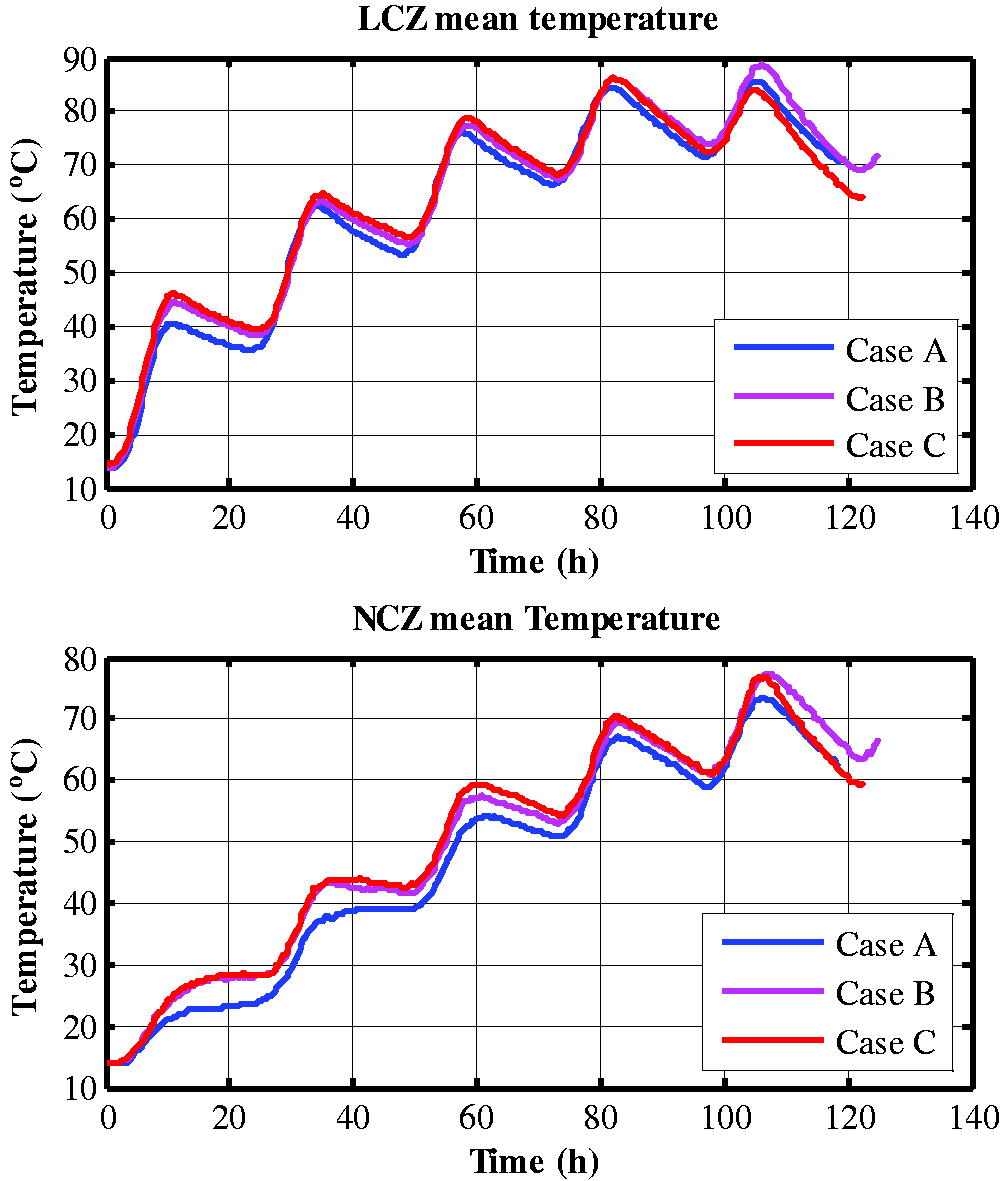
Experimental results of LCZ and NCZ mean temperature of the three cases.
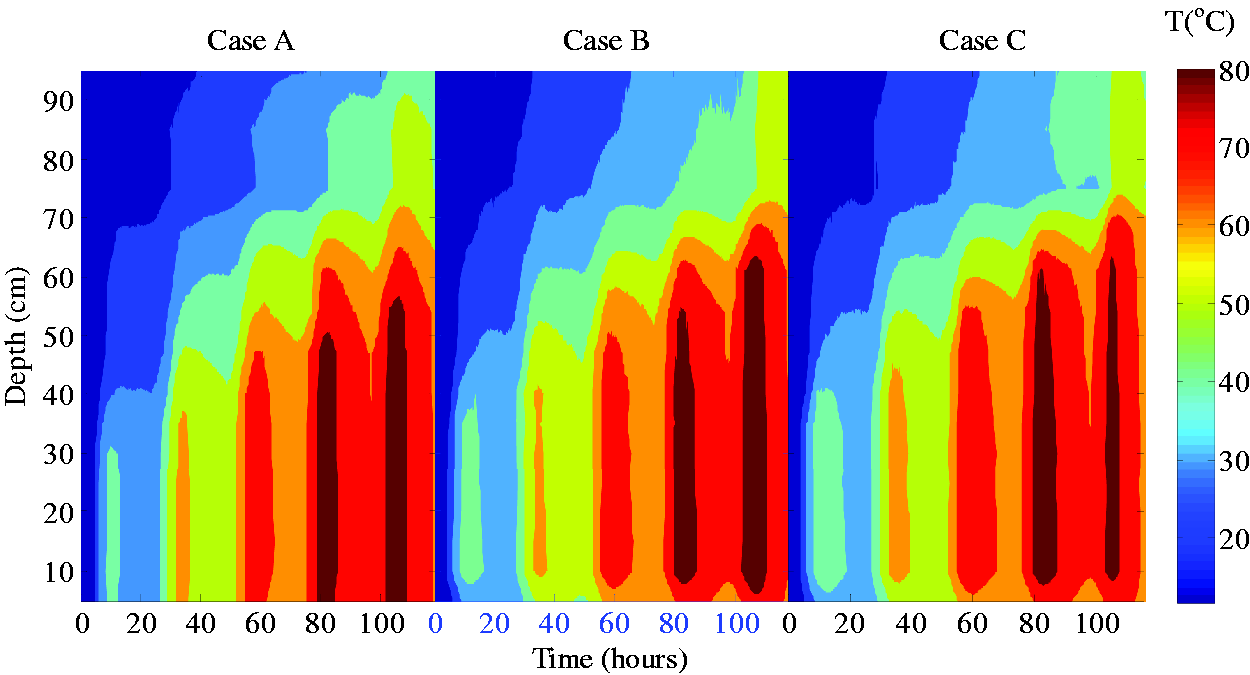
Experimental solar pond temperature evolutions for three cases.
It also could be seen from the experimental results that, PCM had different effects on solar pond at different phase state stages. As for the phase change process, as shown in Figure 3, the LCZ temperature in the three cases was between 50∼63°C in the second day. In this temperature range, the phase changes of most of Paraffin 50 and Paraffin 60 have been completed, and the LCZ temperature increments of Case A, Case B, and Case C were 27.06, 25.04, and 25.45 °C respectively, which Case B and Case C being 2.02 °C and 1.61 °C lower than Case A, the reason maybe the large amount of absorption of the phase change latent heat. At night, the LCZ temperature in the three cases A, B and C dropped by 9.09 °C, 8.24 °C and 8.17 °C respectively, meaning that the day-night temperature change of Case B and Case C was 2.87 °C and 2.53 °C lower than Case A respectively.
From the third day onwards, the lowest temperature in all three cases exceeded 66 °C, and it could be assumed that the PCM was then in liquid state. In the three cases, the LCZ temperature increments on the third day were 22.37 °C, 22.3 °C, and 22.71 respectively; and, on the fourth day, the temperature increments were 18.3 °C, 18.63 °C, and 17.9 °C respectively. This was because the sensible heat storage of liquid paraffin no longer had a buffering effect on the temperature rise of solar pond, on the other hand, as the temperature difference between solar pond and the environment increased, the range of cooling at night also amplifed. On the fifth day, as the stability of the solar pond salt gradient zone was destroyed due to the high LCZ temperature, the experiment came to its end.
Numerical study
Numerical model
The two-dimensional unsteady heat conduction process in solar pond could be expressed by the governing equation (1), taking into account the diffusion of NaCl molecules and the Soret effect of the temperature gradient. In general, the Soret effect accelerated the mass diffusion along the temperature gradient. Assuming that the solar radiation reaching the bottom of solar pond was completely absorbed by the heat storage medium in solar pond, as the temperature changed, the Soret effect would accelerate the salt diffusion along the temperature gradient. Equation (2) represented the salt diffusion equation.


Salinity is expressed with density and temperature deference. The relationship between brine density, brine concentration and temperature was shown in equation (5) below, where T0 is the ambient temperature.

The thermal conductivity of brine would change with changes in temperature and salinity, and the relationship among thermal conductivity, temperature and salinity S can be expressed by equation (6):

The specific heat of brine changes with the change of density and salinity. The relationship between specific heat cp, brine density ρ and salinity S could be expressed by equation (7):

The solar radiation was divided into two parts during the process: the part reflected by the water surface and the other part absorbed by the different zones of solar pond water related the turbidity of the water. The residual amount of solar radiation reaching each layer could be obtained by equation (8) (Wang et al., 2018):

β represents the part of solar radiation actually absorbed by solar pond, β = 0.5; μ represents the extinction coefficient of water, which was related to the turbidity of water, in this study μ = 0.6; and yi is the distance between the lower boundary of the i-th layer and the water surface.
In terms of heat loss, the experimental water tank was used to simulate a solar pond, the bottom and surrounding walls of which were welded with 304 stainless steel, and the SiO2 aerogel (the thermal conductivity is 0.022 W/m·°C) insulation material with good insulation performance was filled between the hollow steel plates up to 0.10 m thick. According to the calculation, the heat transfer coefficient of the bottom and surrounding walls was about 0.3 W/m2·°C.
As for the heat dissipation coefficient on the water surface, the temperature of the upper surface of solar pond was similar to the environment, so, the evaporation heat loss of the water surface was ignored. Most of the heat dissipation on the water surface was mainly caused by the convection of the air and the water surface. The heat loss coefficient (h) of the wind convection was a function of the average wind speed (v) (h = 5.7 + 3.8v).
Comparison of experimental and numerical results
Figure 5 showed the comparison of experimental and numerical simulation results of LCZ average temperature. From the comparison results, it could be seen that, the solar pond temperature gradually increased over time in the three cases. Compared with the experimental results, it could be seen that the temperature development of the experimental and simulation results tended to be consistent, but for the daily amplitude of the day-night temperature change (i.e., the temperature difference between day and night), the simulation result was smaller than the experimental result, and the daily temperature drop of the simulated temperature curve was less drastic. This might be attributable to the fact that the numerical simulation of LCZ had many average temperature points, which in turn caused the temperature curve to be slower than the experimental result curve.
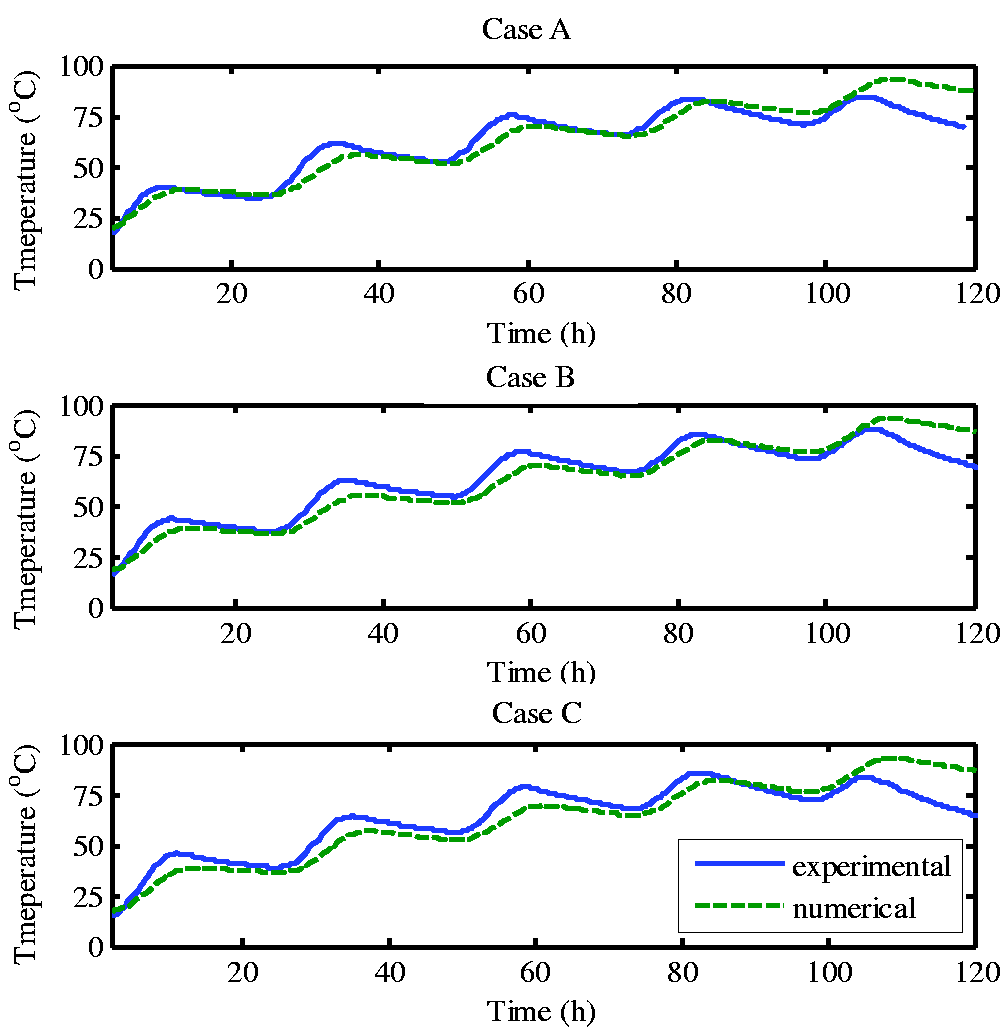
Comparison of mean LCZ temperauture evolutions for three cases.
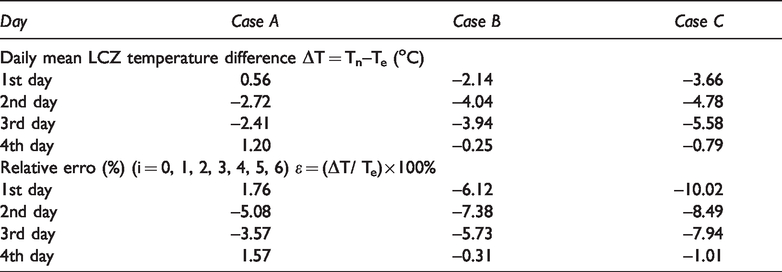
The numerical model used in this study is based on the experimental system, such as the size of the solar pond, the running date, the conditions of the solar radiation source term and so on. Therefore, the comparison between the values of this part and the experimental results is based on the same conditions, which ensured the comparability of numerical and experimental results. Table 2 showed the calculation results of the average daily LCZ temperature and the experimental results. It could be seen that, the temperature of the simulated results was slightly lower than the experimental results in the three cases. The reason might be the error (±2%) of power control on the one hand. As mentioned above, the solar radiation power of the simulation experiment platform was controlled by PLC according to the solar radiation calculation formula, and there was a certain error due to the effect of voltage fluctuation. On the other hand, the experiment was arranged at 61, 68, 75, 85 and 95 cm in the LCZ measurement point, which was upward in the vertical direction. In general, the upper temperature of natural convection would be higher. In the three cases, in terms of the comparison of the experimental and simulated temperature difference in the three cases, the consistency of Case A was relatively better, with the average relative error between 1.57% and −5.08%, while the consistency of the experimental results with the simulation results of Case C was slightly worse: the error was the largest on the first day with the average difference of -3.66 °6, and the relative error of -10.02%, which was due to the larger relative error caused by the lower water temperature on the first day.
Daily mean LCZ temperature difference between numerical and experimental results.
Numerical results
The physical parameters of the numerical simulation were based on experimental conditions and related control equations. Through numerical simulation, the effect of adding the composite PCM heat storage capsules to solar pond on its thermal performance was studied. Figure 6 showed the temperature distributions at noon on the third day (60 h) and the fourth day (84 h) respectively. The reason for selecting the third day and the fourth day was that the third day was the time when the phase change occurred for the PCM in Case B and Case C, while the fourth day showed the state after the phase change was completed. It could be seen from Figure 6 that, at noon on the third day, with respect to the temperature distribution of LCZ in the three cases, it was obvious that the temperature of Case B and Case C with paraffin phase change materials were lower than Case A without blank phase change materials. This was because the paraffin in Case B and Case C underwent a phase change at this temperature stage, absorbing heat with latent heat, while the working medium in Case A absorbed heat in a sensible way. From the third-day results of Case A in Figure 6, it could also be seen that the blank encapsulated capsule tube also had an effect on the temperature field distribution. For example, in Figure 6, the 71 °C isotherm was curved, while the 71 °C isotherms of both Case B and Case C B were more biased towards the bottom than in Case A, which was more prominent for Case C (i.e., in case of addition of RT 60). As for the distribution of the temperature field on the fourth day, as shown in the right column of Figure 6, at this time, the LCZ temperature reached above 80 °C, much higher than melting point of the two phase change materials added in Case B and Case C, so, the phase change materials in Case B and Case C were in the completely liquid state. Figure 6 also showed that the temperature field distribution in the three cases was relatively close at this time. A comparison of the 81°C and 82°C isotherms demonstrated that the two isotherms in Case C were slightly lower than Case A and Case B. This was because (it could be seen from Table 1 that) the phase change material Paraffin 60 added in Case C had a larger phase change latent heat than Paraffin 50, so its effect on LCZ temperature also lasted for a longer time. From the results of the numerical simulation of the development of temperature field distribution, it could be seen that adding the PCM heat storage capsules to solar pond heat storage zone did not necessarily mean a lower LCZ temperature, which was related to the temperature stage it was in. This relationship was well established in the PCM phase changes; however, after the phase change was completed, it would be accompanied by a more obvious change in the heat absorption and release process than brine as the specific heat capacity of liquid paraffin (see Table 1) was less than that of brine.
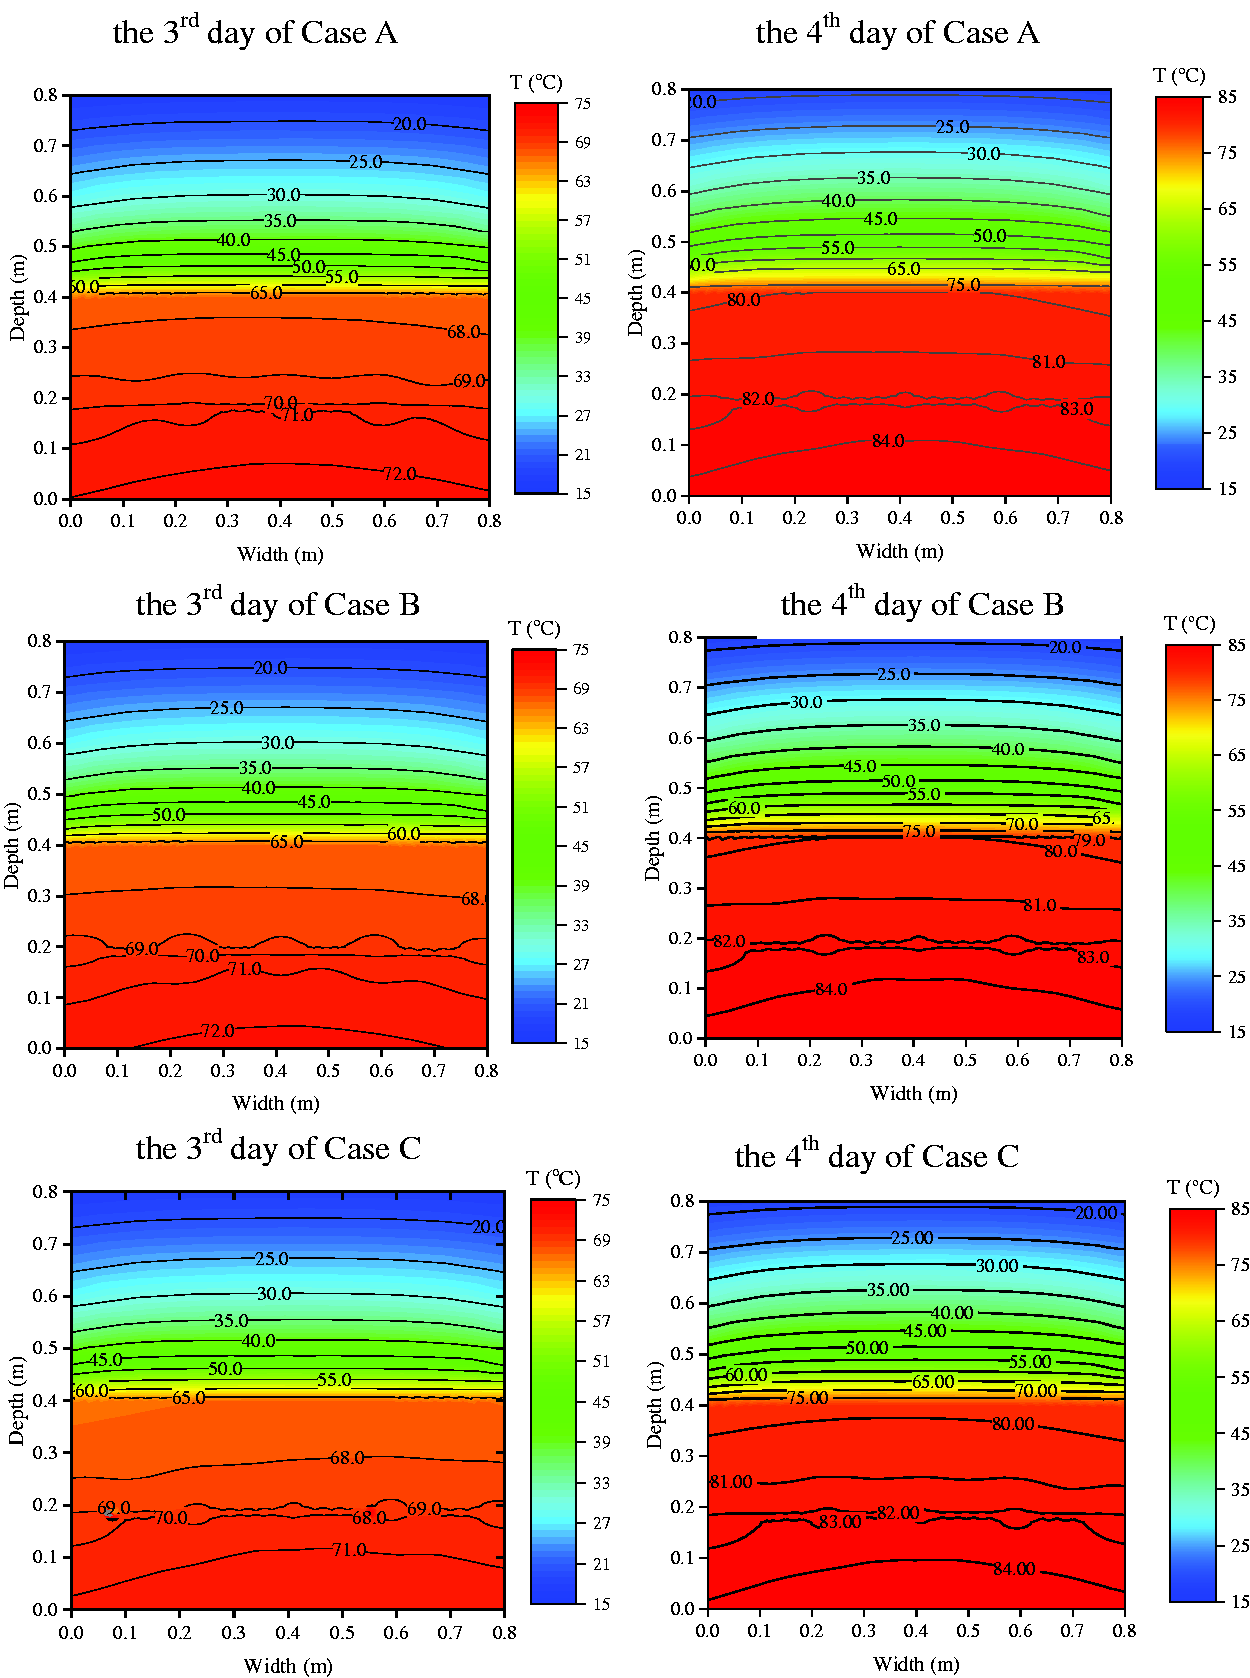
The numerical results of temperature field on the 3rd (left column) and 4th (right column) day of the three cases.
In order to study the effect of adding the PCM heat storage capsules on the flow, Figure 7 showed the changes of the Re (Reynolds number) with the temperature and time at the center depth of the heat storage zone at 0.35 m and 0.25 m respectively. It could be seen from Figure 7 that, the oscillation of Re at 0.35 m in the upper zone was obviously larger than that at 0.25 m, and the reason for this was the natural convection in the LCZ. Re of the two points in this study showed an increasing trend with the increase of temperature throughout the calculation period, but both of them were very small (in the order of 10−18), indicating that the influence of inertial forces on viscous stress was still very small in the calculation range. The development trend was different in the three cases, as could be seen from the change graph of Re with time on the left column of Figure 7: in Case A without any PCM added, Re increased rapidly with time, especially at 70 h when the LCZ temperature was around 65°C. Due to the lag of heat transfer, the temperature change caused by the latent heat absorption in Case B and Case C decreased as a result of the effect of the phase change process, resulting in a slow increase in the Re number. Thereafter, the Re of Case A increased rapidly with the temperature, while the Re of the other two cases added with PCM increased slowly. It could also be seen from Figure 7 that, in the initial stage, the Re of Case B at the 0.35 m and 0.25 m points was higher than that of the other two cases. This might attribute to the different thermal characteristics of Paraffin 50. Figure 2 showed that the occurrence of solid-solid phase change of Paraffin 50 was earlier and more obvious, and, after its first phase change, the heat capacity showed a significant downward trend, which would inevitably cause the increase of temperature in part of Case B, resulting in the Re increase.
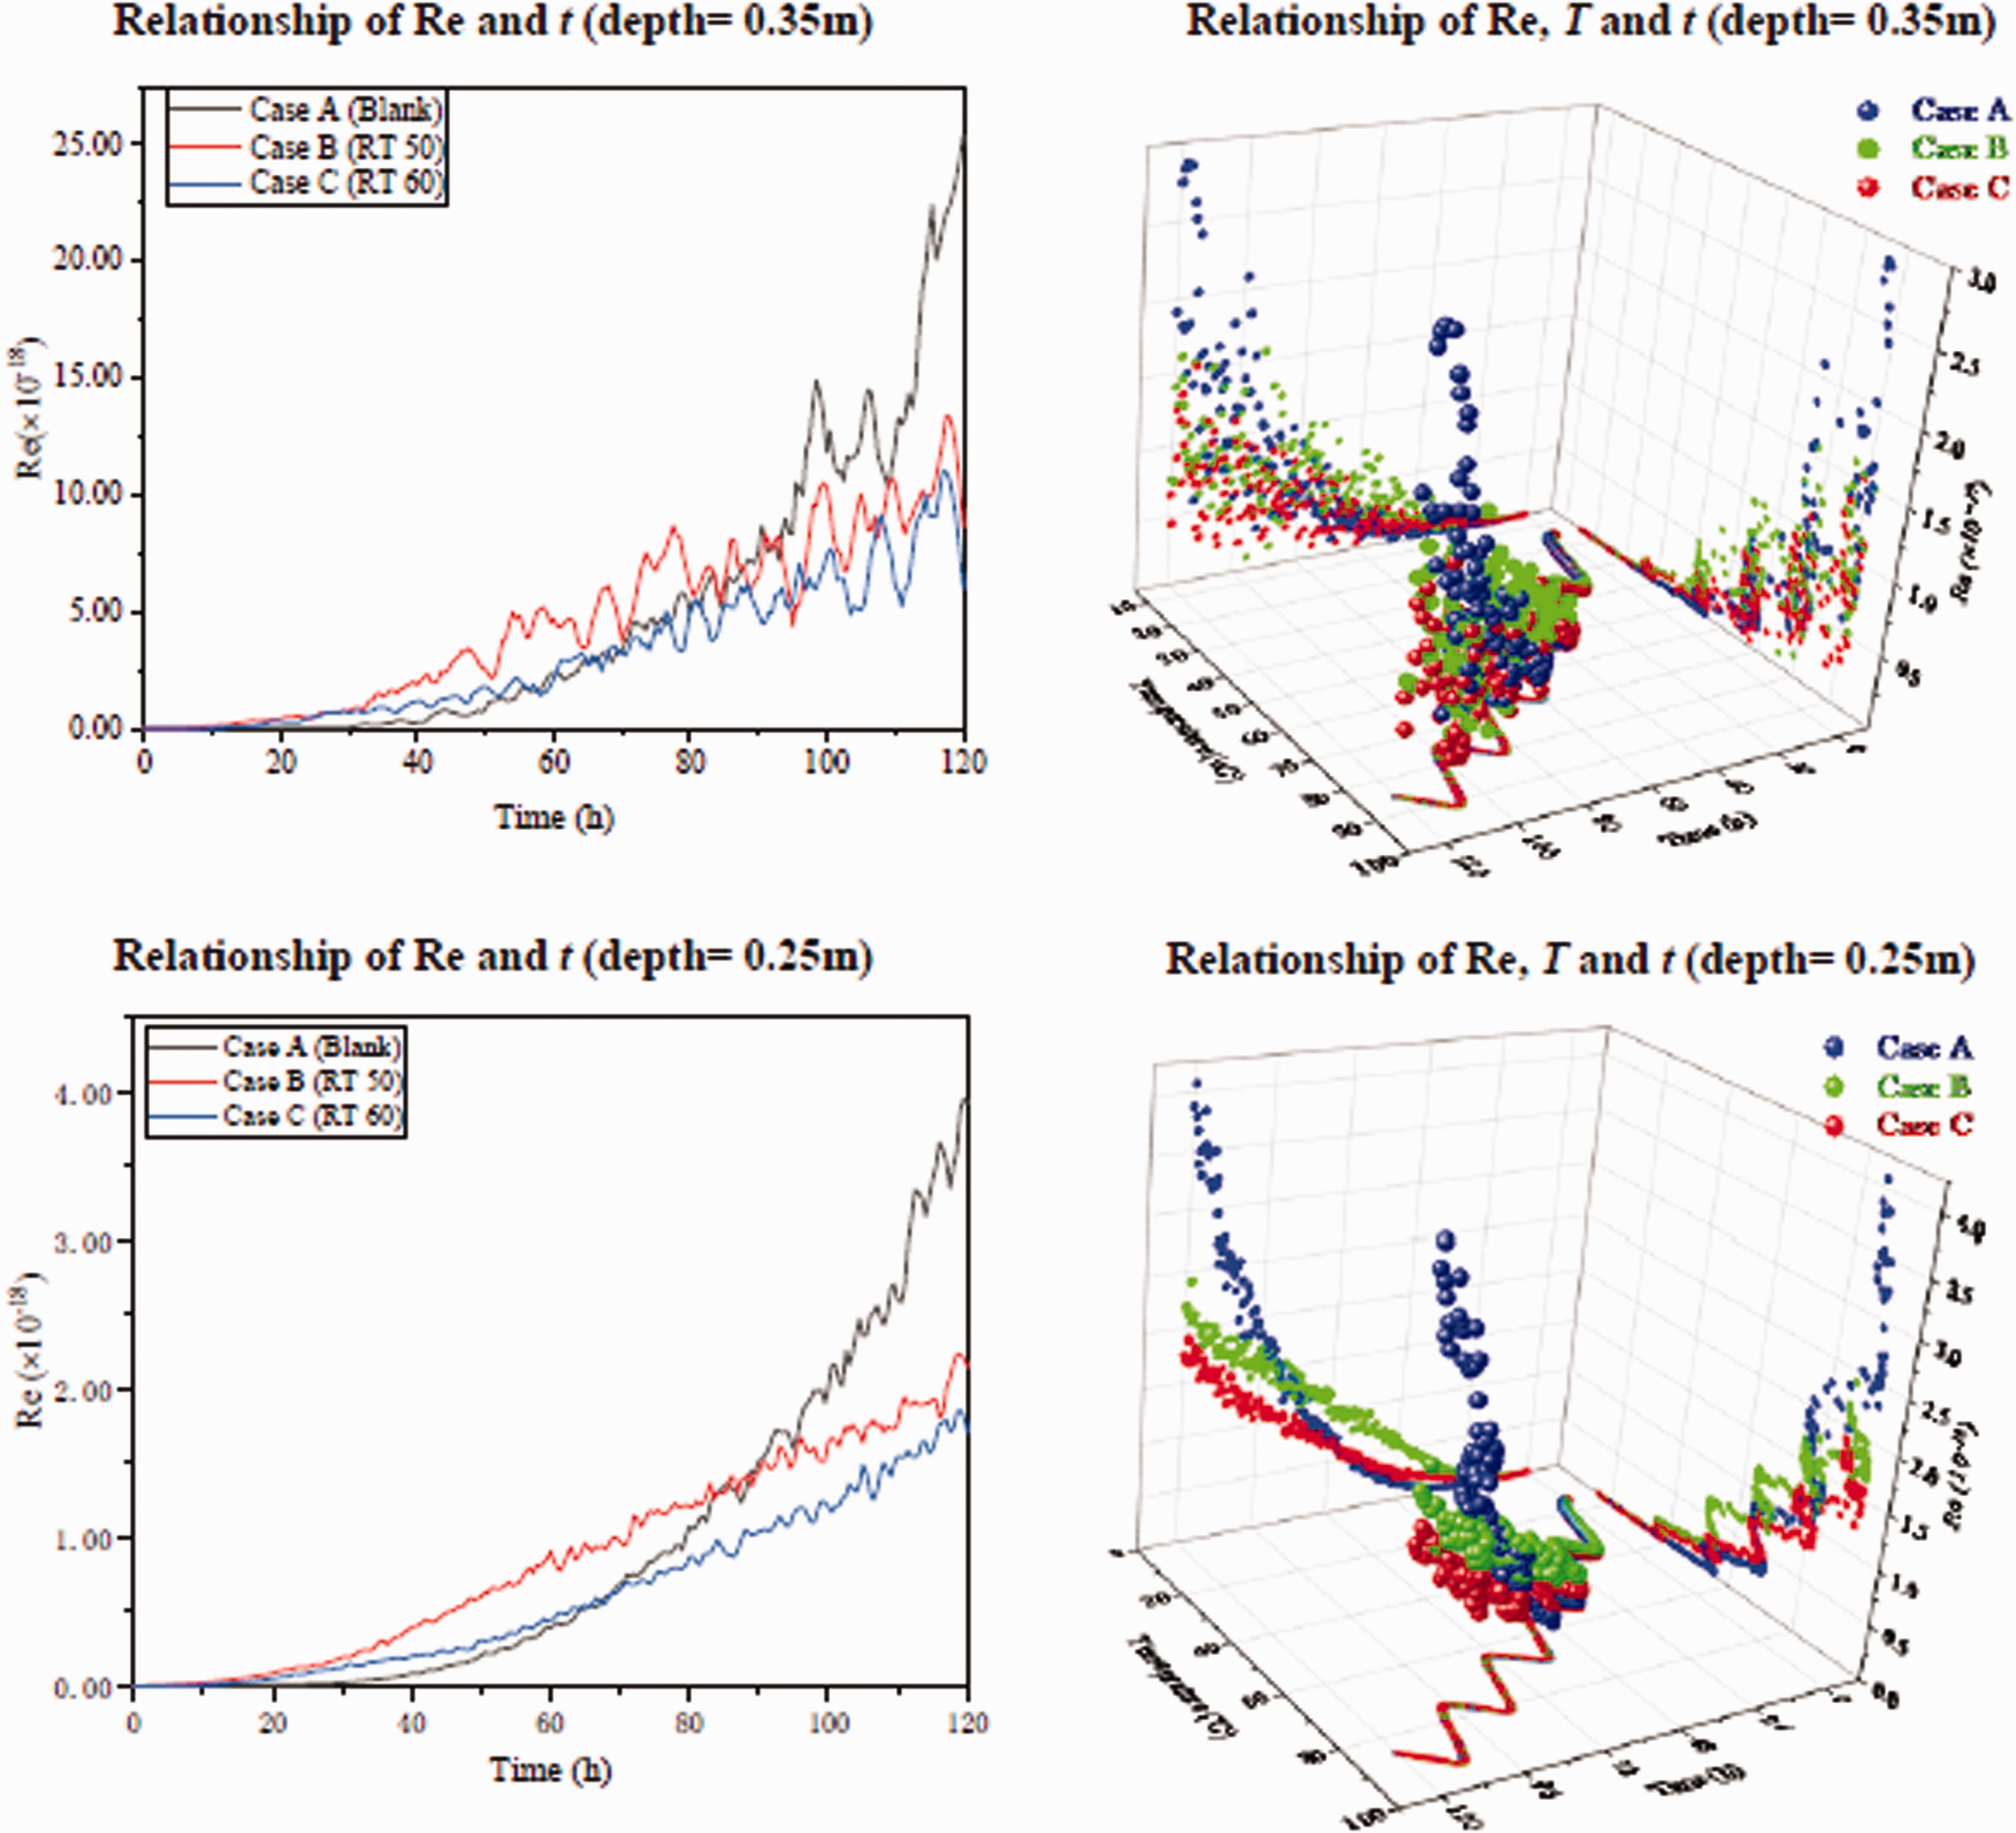
Re and temperature evolutions for the two pointations of LCZ for the thress cases.
Interestingly, although it could be seen from Figure 7 that, the temperature of Case B and Case C with the added PCM capsules was not much different from the temperature of Case A, the Re increase at both of the two points examined was slowed down, slower than Case A. The reason might be that, as the paraffin wax was completely liquified at the later stage, the small specific heat capacity of the paraffin wax caused the temperature of the brine in the area to undergo drastic changes between the day and the night. Furthermore, as the PCM phase change capsules were set in the middle of the depth of LCZ, such temperature change affected the temperature distribution caused by the natural convection of the LCZ to a certain extent, so that the Re change at the point (at a depth of 0.35 m and 0.25 m) was slowed down.
Conclusions
This paper, through the comparative study of adding two phase change heat storage units (Paraffin 50 and Paraffin 60) to solar pond, compared the influence of the phase change heat storage PCM units on the temperature field and flow stability of solar pond. Both the experimental and simulation results showed that, the addition of PCM units reduced the solar pond temperature change during the phase change process of the PCM, however, after the phase change was completed, this effect no longer existed. NCZ could effectively prevent most of the LCZ heat from transferring to UCZ. In the three cases, the trend and value of the temperature curve were consistent. The addition of PCM phase change units could reduce the LCZ flow rate during the PCM phase change process, and PCM with a larger latent heat had a more obvious inhibitory effect on the flow field. Meanwhile, it was found that, the addition of PCM phase change units could change the natural convective heat transfer and convection distribution of the LCZ layer, so that Re of the upper half of LCZ was reduced. Therefore, adding PCM units to solar pond had important positive significance for maintaining the solar pond stability. The selection of the melting point of PCM should match the temperature of the application.
Footnotes
Declaration of conflicting interests
The author(s) declared no potential conflicts of interest with respect to the research, authorship, and/or publication of this article.
Funding
The author(s) disclosed receipt of the following financial support for the research, authorship, and/or publication of this article: This work has been carried out with the financial support of the Funding Scheme of the Young Key Teachers of the Higher Education University in Henan (2017GGJS050) and the Natural Science Foundation of China (NSFC) (U1404520, 51676064).