
Abstract
This work deals with the development of Combined Energy Pattern & Power Density Method (CEPPDM) to evaluate the two parameters needed to define Weibull distribution. Five years (2015–2019) wind data recorded each 60-minutes interval at eleven representative sites in Pakistan was used and efficiency of CEPPDM was compared with Energy Pattern Factor Method (EPFM) and Power Density Method (PDM) with the help of MAPE, MSE and R2. Analysis showed that CEPPDM is the most efficient method while EPFM is the least efficient. Furthermore, it was found that RYK is the most lucrative site and Layyah is the weakest site regarding wind potential. Wind rose plots were drawn which showed that the wind mainly blows in the range of 200°–270°.
Keywords
Introduction
Wind energy is one of suitable, green and economic options for energy generation (Shoaib et al., 2017; Sumair et al., 2020a, 2020d, 2020f). Globally wind installed capacity, which was about 180.85 GW at the end of 2010, has exceeded 622.70 GW at the end of 2019 (IRENA, 2020). According to International Renewable Energy Agency report, 2020 (IRENA, 2020), wind installed capacity in Pakistan is about 1.27 GW while our neighboring country, India has more than 37.50 GW at the end of 2019. Wind power development in Pakistan dates to 2008 when a total of only 6 MW was installed. Annually reported wind installed capacity in Pakistan has been depicted in Figure 1 which shows that from the beginning to date, installed capacity has increased manifolds. However, comparison of this installed capacity with total theoretically existing wind potential in Pakistan i.e. 346 GW (Shami et al., 2016) shows that installed capacity at the end of 2019 is still much less than the existing potential i.e. only about 0.36%. Therefore, there is a large gap and hence the utilization of huge wind potential is the need of hour (Khahro et al., 2014a).
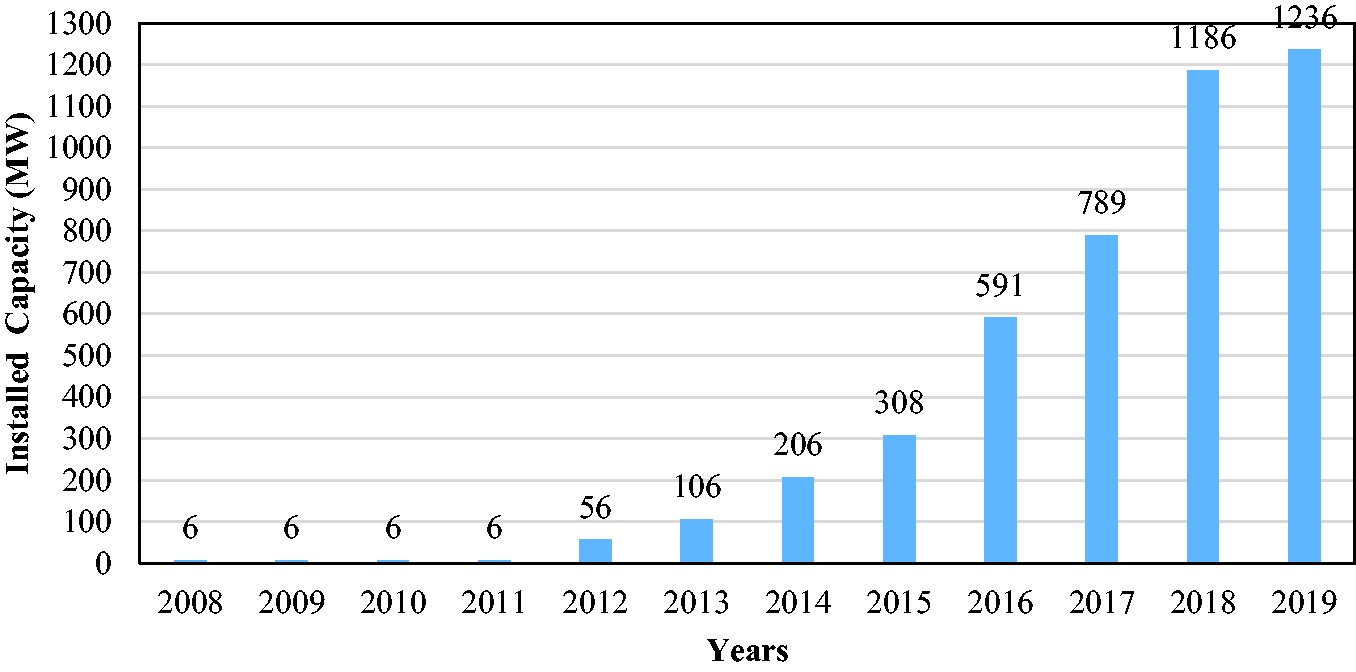
Year-wise wind power installed capacity in Pakistan.
Currently, Government of Pakistan (GOP) is working on enhancing its green energy production. According to Pakistan 2019 energy policy, Pakistan plans to obtain 30% of its energy production from green energy resources and 30 GW from only wind by 2030 (ALI, SEP 7TH, 2019; (GOP), 2019). Exploration of wind resource is first step to exploit it (Bilir et al., 2015) which is often done using continuous statistical probability distribution i.e. Weibull distribution as presented in (Acker et al., 2007; Lima and Filho, 2012; Pishgar-Komleh et al., 2015; Ramachandra et al., 1997; Sumair et al., 2020a, 2020b, 2020c, 2020d, 2020e, 2020f; Ucar and Balo, 2009).
In literature, many methods have been reported (Khahro et al., 2014a, 2014b; Khalid Saeed et al., 2019; Sumair et al., 2020d, 2020e) and researchers have compared the performance of these methods and proposed new and better methods, e.g. comparison of seven methods was made for wind resource assessment at two sites in Kiribati, presented in (Aukitino et al., 2017). These methods were compared, and Method of Moment (MOM) was found the best among all which was further used to estimate power density at Tarawa and Abaiang. Mean wind speeds of 5.34 and 5.45 m/s were observed at two sites respectively. Moreover, annual energy yields were estimated using five turbines each of 275 kW along with the economic assessment and it was found that two sites have payback period of 5.42 and 8.74 years respectively which showed that sites are good candidate for wind power utilization.
Five different locations in the world have been investigated using Weibull representative distribution (Celik, 2003). Eight years data was applied to evaluate wind energy potential. Weibull distribution curves were drawn followed by a comparison of monthly calculated values from Weibull function and time series data. It was figured out that Weibull distribution calculates the wind potential with significant accuracy with a total error of about 2.79%. Similarly, Akpinar, E. Kavak, and S. Akpinar (Akpinar and Akpinar, 2005) compared EPFM with Regression Method (RM) and Maximum Likelihood Estimation (MLE). Results showed EPFM was the best method among three. Similarly, Jowder, Fawzi A. L. (Jowder, 2009) compared Empirical Method (EM) and RM to explore wind resource at Bahrain and found that EM is efficient of the two.
Wind potential of Jeddah (Saudi Arabia) (Bassyouni et al., 2015) explored using 11 years wind meteorological data collected at 10 m hub height with GM and MOM. It was found that minimum wind potential is observed in February while maximum in March. Moreover, the predominant wind direction in the city has been found to be southeast. Moreover, site was declared a good candidate for small scale off-grid wind energy utilization. Similarly, Wind potential at Çanakkale was estimated using three methods i.e. GM, MOM and MLM with Weibull distribution (Akdağ and Güler, 2009). These methods were compared using R2 and RMSE and MOM was found the best.
Another work (Azad et al., 2014) compared seven Weibull estimation methods i.e. GM, MOM, MLM, MMLM, PDM, standard deviation method (STDM), and Energy equivalent method (EEM). Comparison was made using different performance evaluation criteria i.e. RMSE, MAPE and variance analysis. The study concluded that MOM and MLM are the best methods at any height while PDM gave the best fit only at lower altitude.
Another work, presented in (Ouahabi et al., 2020) compared five methods namely GM, EPFM, EMJ, EML and MOM. Wind data was collected at 10-minute rate at 60 m height for three years period at Tetouan (Morocco). Comparison was made and it was found that RM gave the weakest fit while MOM gave the best fit among all five methods. Moreover, annual energy generation using various turbines was also calculated and it was found that G80/2000 kW turbine is the best choice at investigated location which could produce about 28% of total energy required in the city. Another such work compared six methods using R2, RMSE and MBE and it was found that among six methods, MMLM is the best method.
It is clear that no single method can be declared the best method for each terrain and there is always room for developing new methods. Therefore, current work introduces a new method to determine Weibull parameters which has been termed as Combined Energy Pattern & Power Density Method (CEPPDM) and has not previously been used in literature. This method has been compared with EPFM and PDM.
Materials and methods
Methodology
Estimation of wind potential was carried out using a newly developed method in this study. Five years (2015–2019) wind data recorded 60-minutes interval, measured at a mast height of 50 m, was used at eleven locations. EPFM, PDM and CEPPDM were applied. Performance comparison of these methods was done using MAPE, R2, and MSE. Later, wind power potential was estimated using best found method among three. Finally, wind rose plots were also drawn.
Modelling of wind data
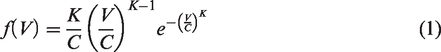
In this work, Weibull distribution as given in (Aized et al., 2019; Bagiorgas et al., 2012; Costa Rocha et al., 2012; Khahro et al., 2014b; Kitaneh et al., 2012; Sumair et al., 2020b) was applied with probability density function shown by f(V) and cumulative probability function represented by F(V) as given below:

Various methods applied for the evaluation of parameters of Weibull distribution
In this work, one new method has been developed known as Combined Energy Pattern and Power Density Method (CEPPDM) which has been compared with the methods from which it has been developed i.e. EPFM and PDM.
These methods have been discussed below:
EPFM
Following the determination of energy pattern factor (Epf), (Sumair et al., 2020d, 2020f) given as equation (3), these parameters are calculated using equations (4) and (5) respectively.
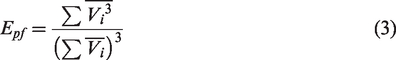
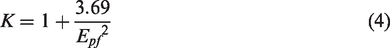
Where
PDM
This method is another form of EPFM Weibull parameters are estimated using equations (7) and (4)
Combined energy pattern and power density method (CEPPDM)
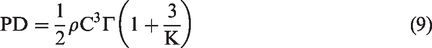
As the name suggests, this method has been developed using both the EPFM and PDM. As wind power density is given as follows:
Integration of equation (8) gives equation (9)
Equation (8) can also be solved in another way presented below:
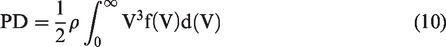
From equation (4), we can write
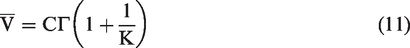
Also, we can write the mean value as follows:

Simultaneously solving equation (12) with equation (10)
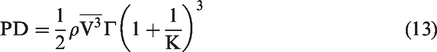
Comparing equation (9) with equation (13)
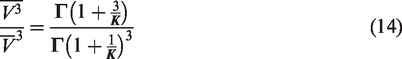
Numerical iterative solution of equation (14) gives K.
Using another relation between wind speed and scale parameter presented in (Sumair et al., 2020d), we can write

Taking natural logarithm of equation (15), we have

Further we can also write

Equation (17) can be used to write another equation following the same pattern

Equation (18) can be used to estimate C.
Comparison of Weibull parameters estimation methods
EPFM, PDM and CEPPDM have been compared using MAPE, MSE and R2. Mathematical relationships for MAPE, R2 and MSE are given below in equations (19) to (21) respectively.
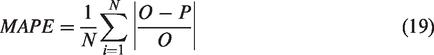
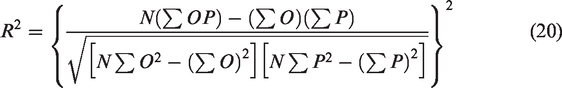
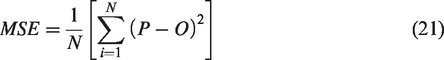
Using these mathemtical reltionships with O as actual relative frequency of certain wind range and P as relative frequency calculated from weibull distribution with all three methods of EPFM, PDM and CEPPEM one by one, correctness of these methods has been estimated. The method having lower MAPE and MSE while higher R2 describes wind characteristics more accurately.
Wind power potential
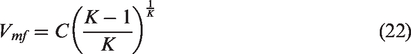
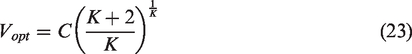
There are several parameters which are used to refer wind potential e.g. mean wind speed, most frequent wind speed (Vmf), optimum wind speed (Vopt) and PD (or ED). Having evaluated Weibull parameters, Vmf and Vopt are estimated using equations (22) and (23) respectively (Sumair et al., 2020d, 2020f)
However, as wind speed doesn’t remain constant over an estimated period. Therefore, its frequency distribution must also be considered while estimating PD and ED. Incorporating the effect of frequency distribution, we have following form for predicted wind power density (PDP):
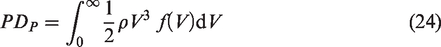
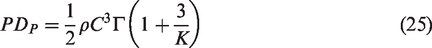
Integration and simplification give
And ED is simply estimated by multiplying PD with time

Results and discussions
Measuring the accuracy of Weibull parameters estimation methods
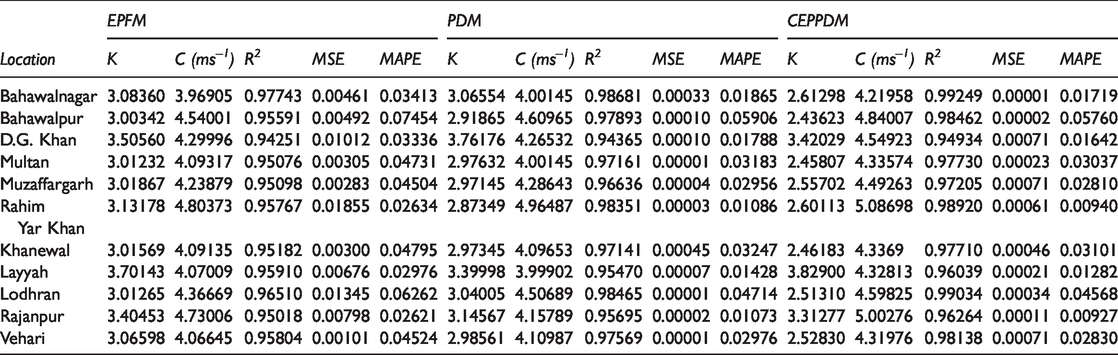
In current study, EPFM, PDM and CEPPDM were applied and compared. Methods were compared using MAPE, MSE and R2, as shown in Table 1. Three sets of comparison were conducted i.e. between CEPPDM and EPFM, between CEPPDM and PDM and finally between EPFM and PDM. First set of comparison shows that CEPPDM shows better performance than EPFM. Similarly, second set of comparison shows that CEPPDM is superior to PDM when evaluated with regard to (w.r.t) all three criteria. Finally, third set of comparison shows that PDM is superior to EPFM. Hence, CEPPDM has been found the best method while EPFM as the worst method.
Comparative analysis of EPFM, PDM and CEPPDM.
As risk of investment in wind power projects depends upon the risk involved in correct wind resource estimation; higher uncertainty in resource estimation leads to high risk involved in investment. Therefore, mitigation of this risk requires higher degree of correctness of investigation of wind data and its distribution characteristics so that accurate wind potential estimation can be made. As CEPPDM calculates parameters of Weibull distribution with more accuracy than PDM and EPFM, therefore, this is the method which can estimate wind potential more accurately and hence can develop confidence in any investment by reducing the risk factor involved.
Weibull distribution curves showing the comparison among EPFM, PDM and CEPPDM have been depicted in Figure 2.
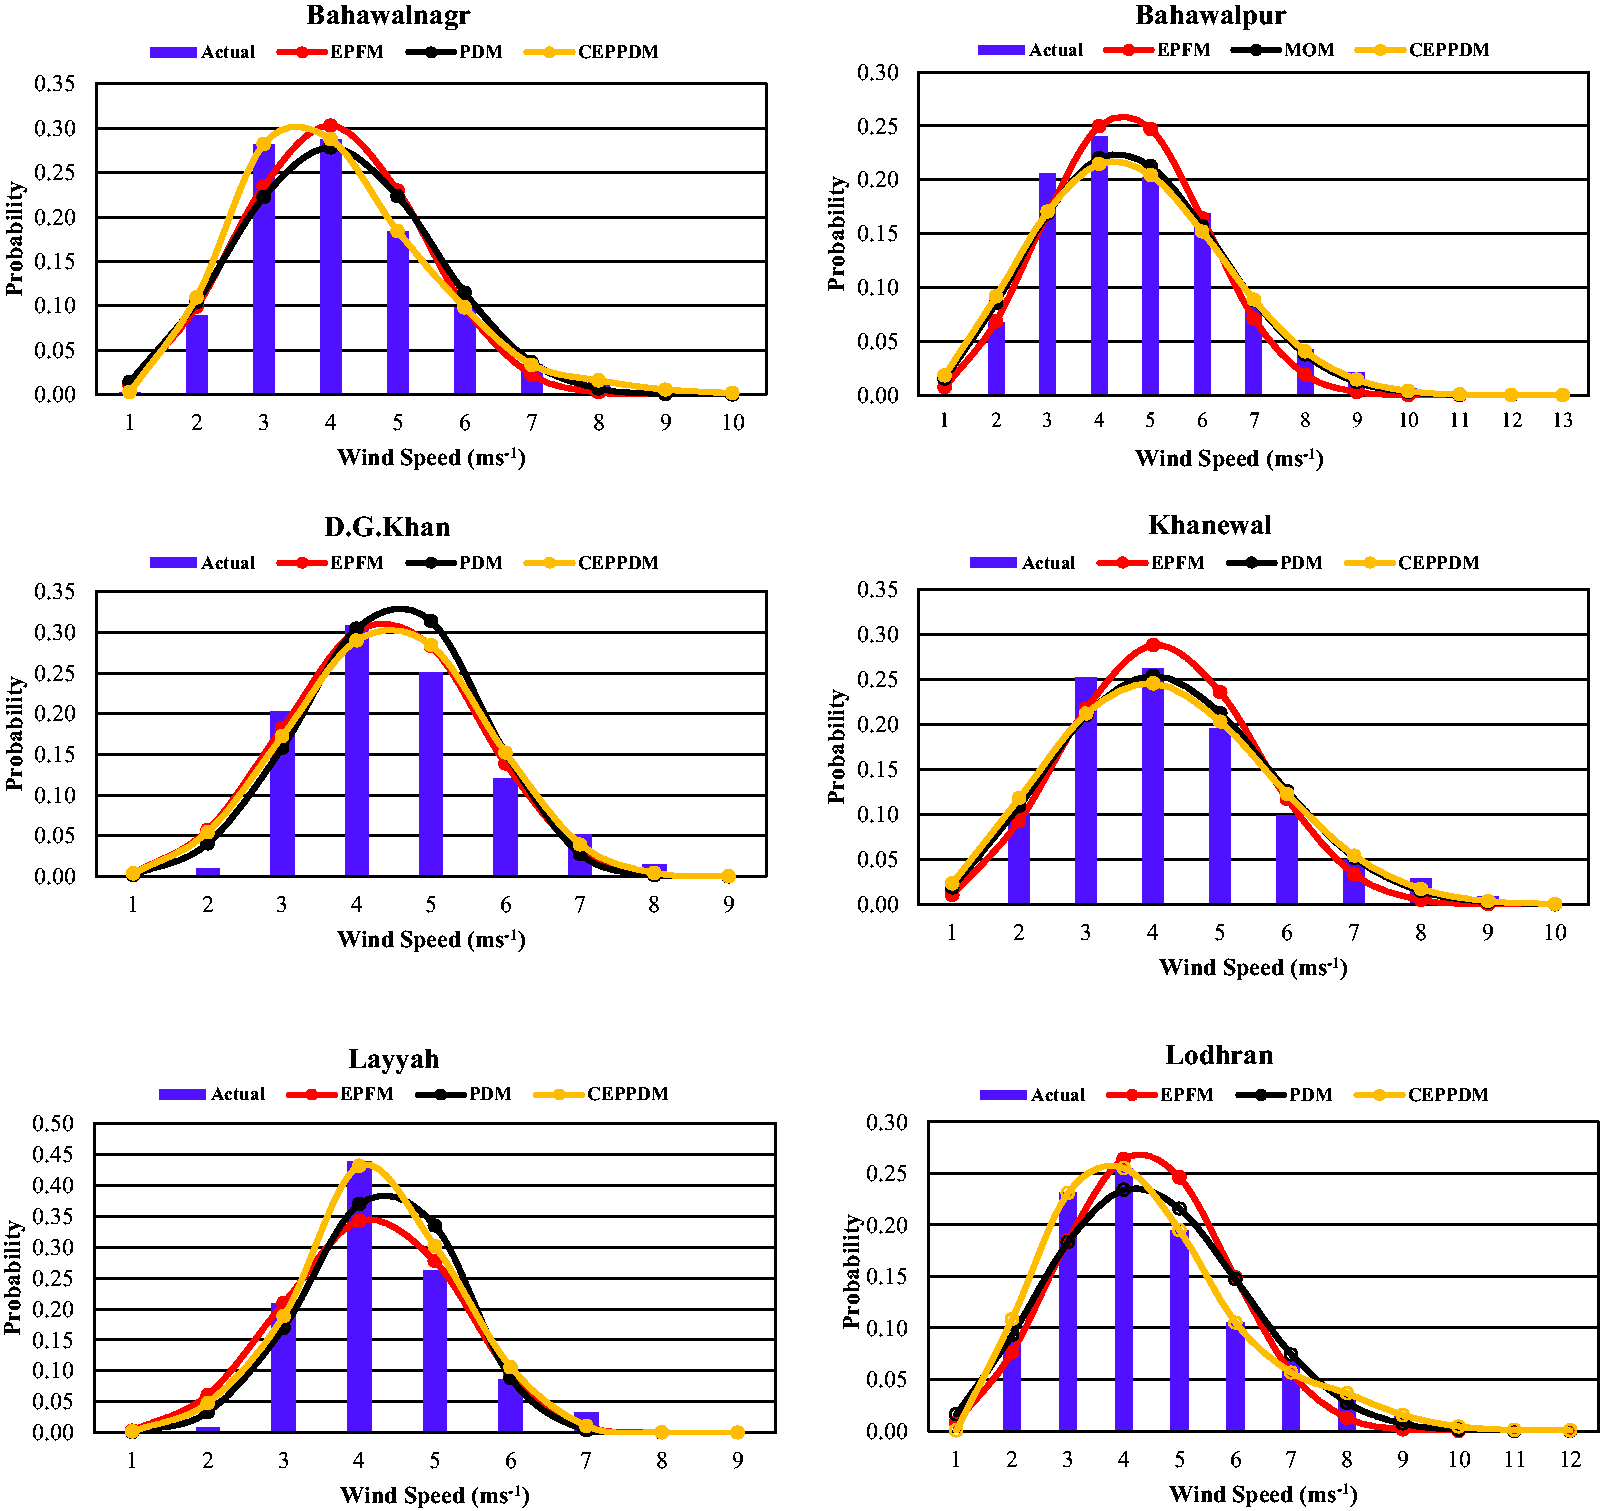
Comparison of three Weibull parameters estimation methods with actual probability distribution.
Wind potential
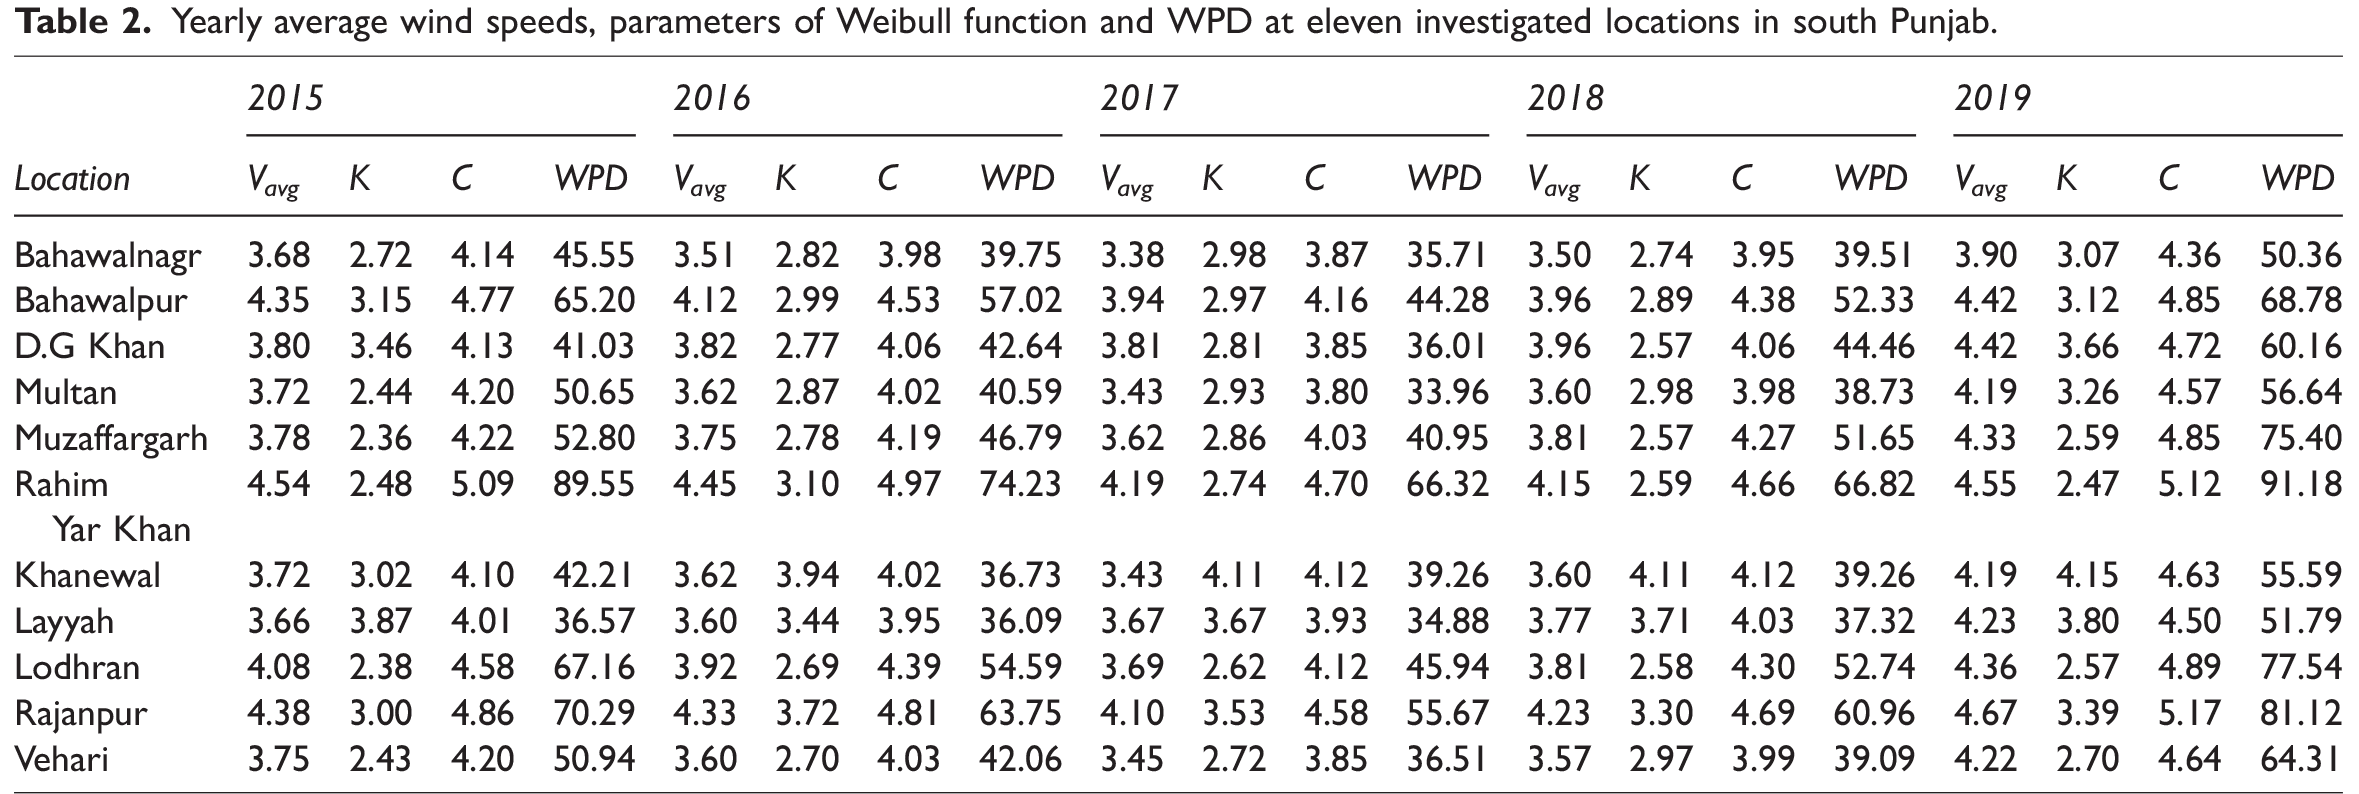
Table 2 enlists wind speed, Weibull parameters and PD values. Annual mean wind speeds, wind PDs and wind EDs have been shown in Figures 3 to 5 respectively. It can be inferred that RYK has maximum wind potential while Layyah has the minimum. RYK observes PD and ED as 77.60 W/m2 and 680.26 kWh/m2 respectively while corresponding values at Layyah are 39.30 and 344.67 respectively. Vmf and Vopt have been shown in Figure 6. The variation in these parameters is coincident with power potential variation.
Yearly average wind speeds, parameters of Weibull function and WPD at eleven investigated locations in south Punjab.
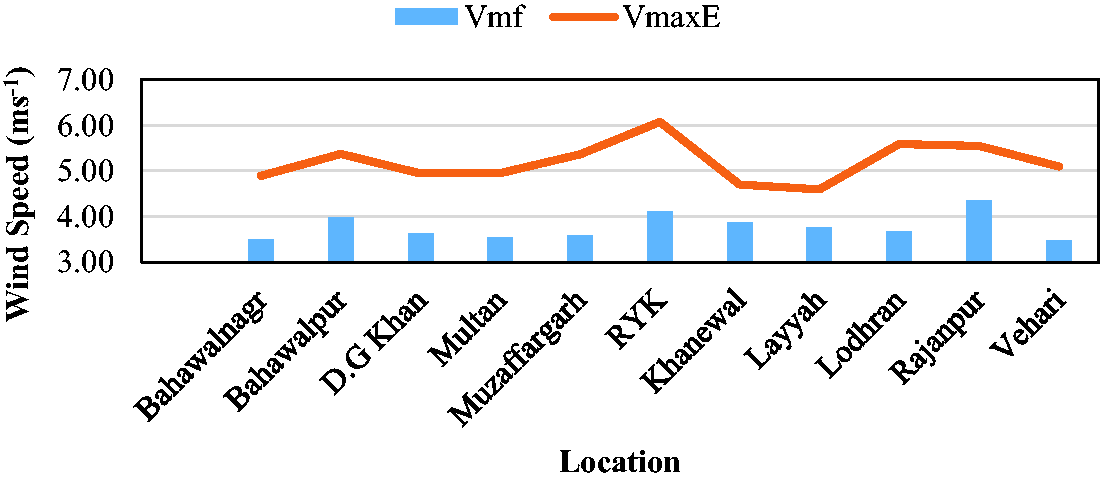
Most frequent and optimum wind speeds at eleven investigated locations.
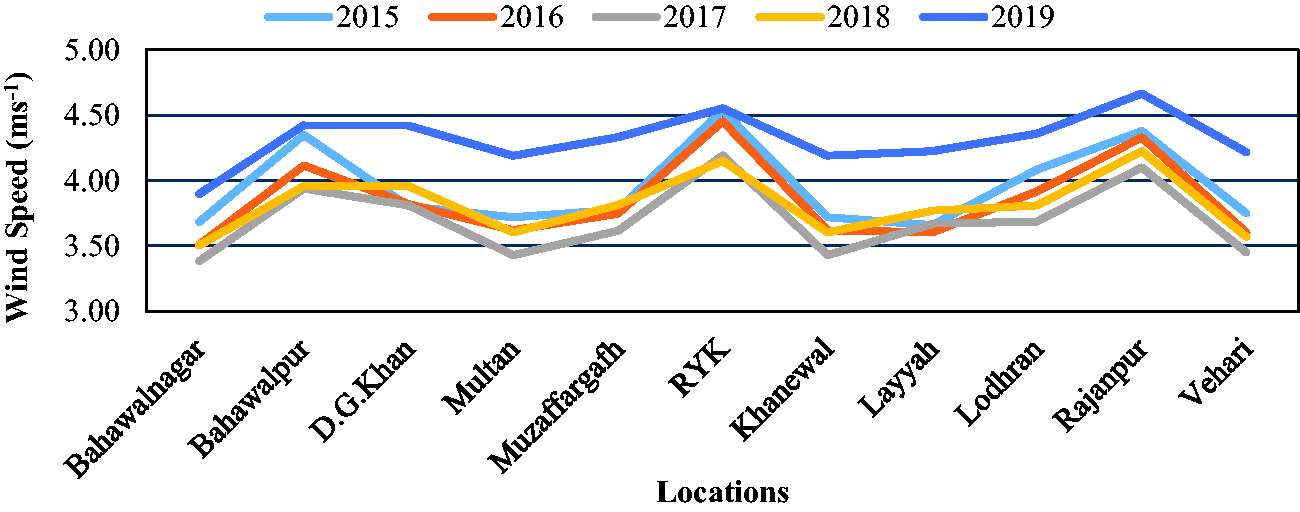
Wind speeds (ms−1) at eleven investigated locations.
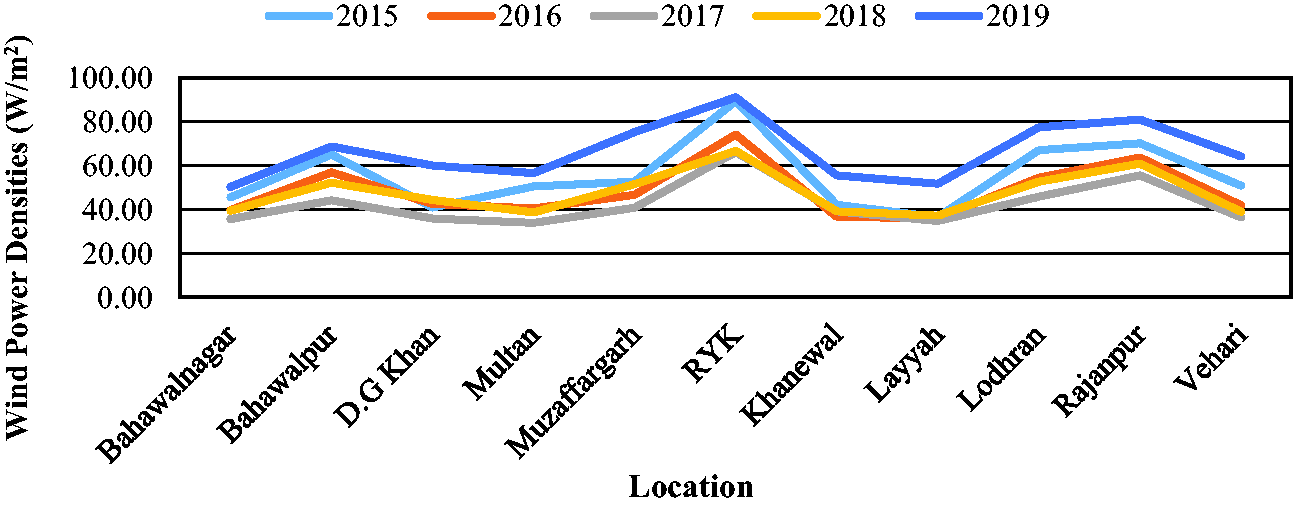
Wind power densities (W/m2) at eleven investigated locations.
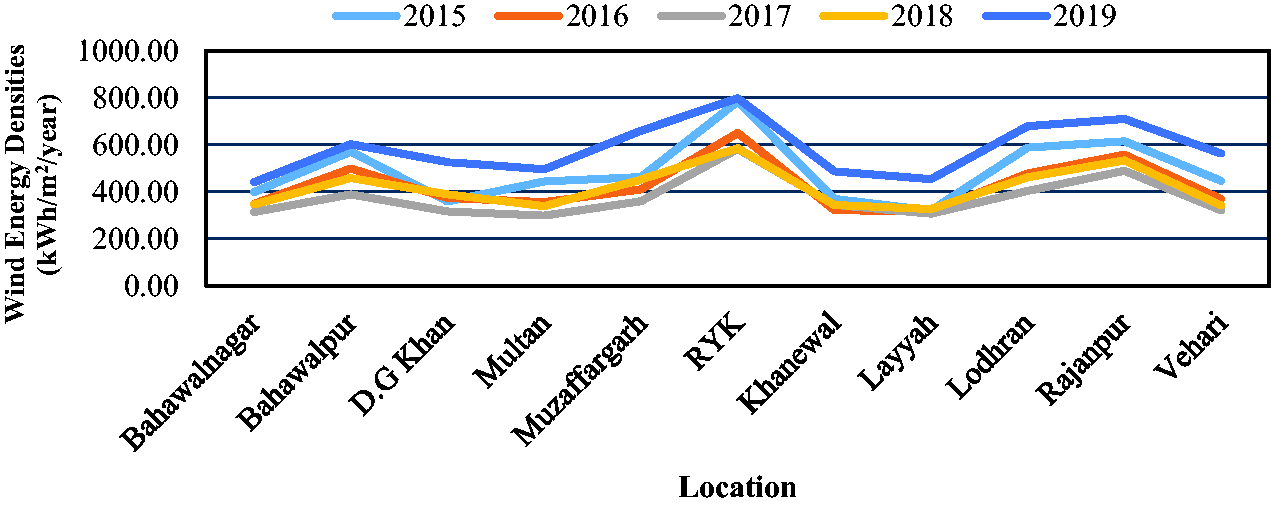
Wind energy densities (kWh/m2) at eleven investigated locations.
Wind speed distribution
In wind potential estimation, it is important to estimate for how much fraction of time per year, wind blow at or greater than a certain speed. This is so because the wind blowing at lower speed than a certain wind speed (generally 3 ms−1) will be of no use when a turbine is installed to extract the power from wind. Cumulative frequency distribution curves are drawn to show this fact, in Figure 7. For example, it can be seen that wind blows at more than 3 ms−1 for about 62% of time of year for Bahawalnagar.
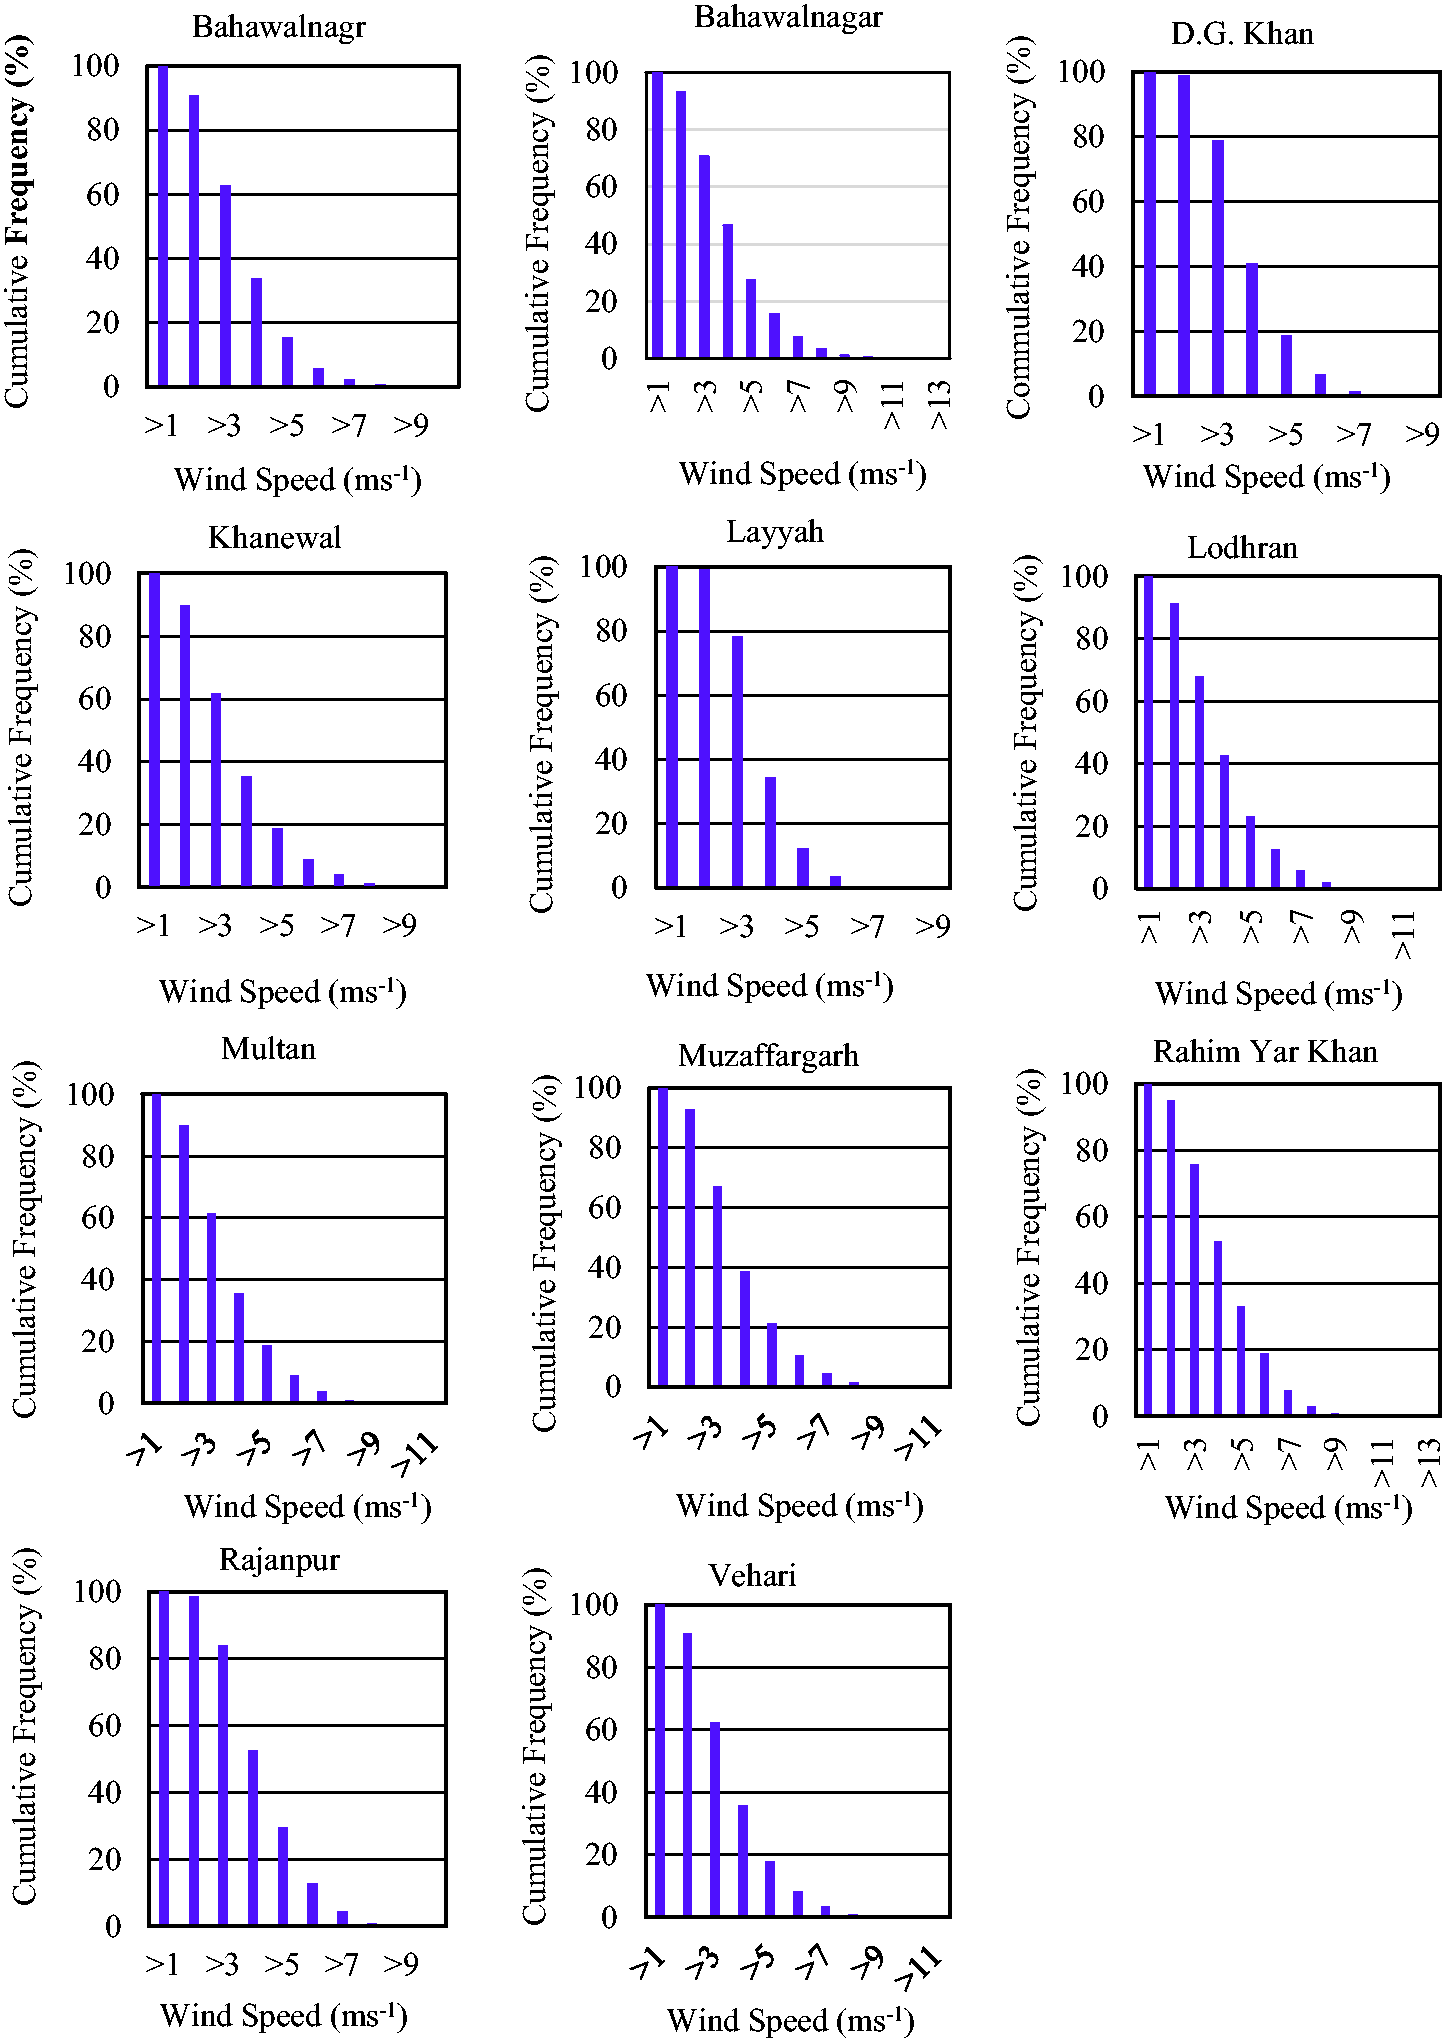
Cumulative frequency distribution diagrams for eleven investigated locations.
Wind roses
Wind roses are the plots which show the wind blowing direction. Estimation of suitable wind direction is important as the amount of wind power extraction using horizontal axis wind turbine (generally used for power production purposes) depends upon the direction in which these turbines are installed. Therefore, the turbine should be installed with its rotor facing the optimum wind direction. In Figure 8, the wind rose plots have been shown at each location and it can be inferred that the optimum direction varies in the range of 200°–270°.
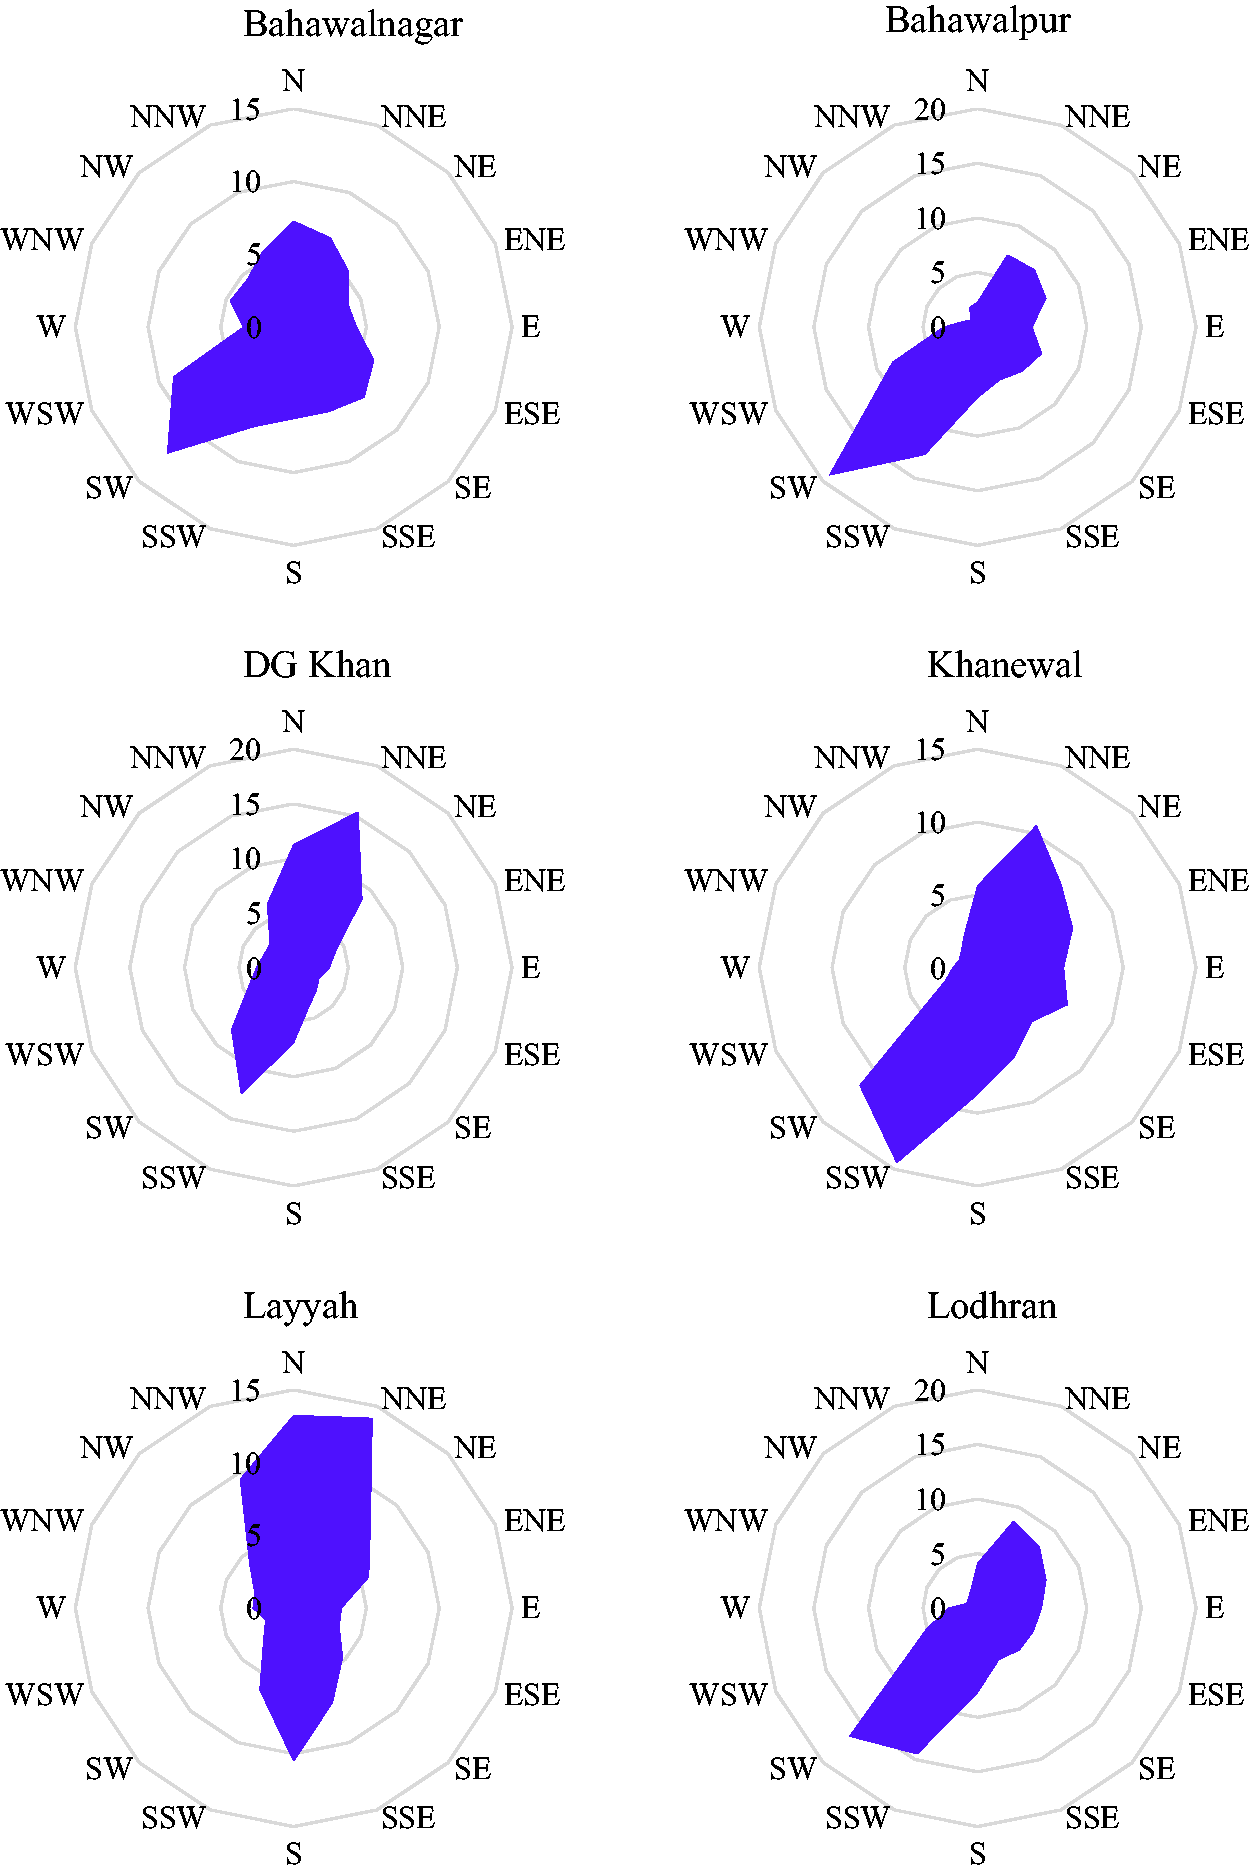
Wind rose plots at eleven investigated locations.
Conclusion
A comparison of three Weibull parameters estimation methods was conducted along with estimating wind potential at eleven locations in South Punjab and CEPPDM has been found the best method with PDM and EPFM as second and third most accurate methods respectively. CEPPDM was further used and RYK was found as the most lucrative site while Bahawalnagar has been found as the site having minimum wind speed. However, minimum wind power density has been observed at Layyah. The difference is associated with the difference in frequency distributions characterized by Vopt values. Highest Vmf and Vopt have been observed at RYK while the lowest Vmf speed is observed at Bahawalnagar and lowest Vopt is observed at Layyah.
Notation
Weibull Shape/Slope Parameter Weibull Scale Parameter
Footnotes
Declaration of conflicting interests
The author(s) declared no potential conflicts of interest with respect to the research, authorship, and/or publication of this article.
Funding
The author(s) received no financial support for the research, authorship, and/or publication of this article.