
Abstract
A new test method based on sound signals for natural frequencies of steel components was proposed in this paper. The proposed method is a non-contact measurement method which does not need to install any sensors and therefore generates no measurement errors. The method consists of three steps. First, a steel component is placed in suspension state, and the sound signals of this component are collected under artificial excitation by a recording device such as a mobile phone. Second, the collected sound signals are analyzed by the periodogram method to obtain the power spectral density curves. Finally, the first few natural frequencies of the steel component are readily obtained through the power spectral density curves. An I-steel beam was tested in the experiment to verify the proposed method. The first three natural frequencies of this beam can be successfully obtained by the proposed method. For comparison, the values of the first three natural frequencies of this beam were also analyzed by numerical simulations and the traditional modal test method using the acceleration sensors. It has been found that the results obtained by the proposed method only have slight deviations compared with the values obtained by the simulation and the modal test method. Compared with the traditional modal test methods, the proposed method is more economical, fast, and precise to obtain the natural frequencies of steel components. It may be a promising testing method for the natural frequencies of steel components.
Introduction
The natural frequency is the most commonly used parameter of the engineering structure, which can reflect the comprehensive physical properties of the structural system.1,2 For example, the natural frequency can reflect the damage state of structural components. When the damage occurs in a structure, the corresponding natural frequency often decreases.3–5 In the meantime, the natural frequency will change when the boundary condition of the structural component is changed.6–9 Moreover, the natural frequency can also reflect the change of the axial internal force in a structural component such as a cable or a truss bar.10–12 Thus, the test method of the natural frequency has received much attention in recent years. Generally, the existing test methods can be divided into two types: contact methods and non-contact methods. The contact method needs to install the accelerometer or displacement sensors on the component, which often has inevitable error due to the masses of the sensors.13–16 As an alternative, the non-contact method such as laser-based test method has better performance since it does not need installations of sensors in the structure. But the cost of the laser-based method is usually expensive. 17 In engineering practices, the common steel component often has large stiffness with less mass.18,19 When the steel component is excited by an external impact, some signals of sounds will appear and can be measured. In view of this, a new natural frequency test method based on sound signals of steel components is proposed in this paper. The proposed method belongs to non-contact measurement methods and consists of three steps. The first step places the target steel component in suspension state and collects the sound signals of this component under artificial excitation by a recording device such as a mobile phone. The second step analyzes the collected sound signals by the periodogram method to obtain the power spectral density (PSD) curves. In the third step, the first few natural frequencies of the steel component can be readily obtained through the PSD curves. An I-steel beam with a length of 2.1 m was tested in the experiment to verify the proposed method. Using this method, the first three natural frequencies of this beam can be successfully obtained. For comparison, the values of the first three natural frequencies of this beam were also analyzed by the finite element (FE) method and the traditional modal test method using the acceleration sensors. Furthermore, the impact point and the position of measurement are analyzed. It has been found that the results obtained by the proposed method only have slight deviations compared with the values obtained by the FEM and the modal test method. The proposed method is very economical and precise to obtain the natural frequencies of steel components. It may be a promising testing method for the natural frequencies of steel components.
This paper is organized as follows: The following section presents the theoretical analysis of the natural frequencies of the steel components, which is followed by a section that illustrates the proposed natural frequency test method by using the sound signals. The penultimate section demonstrates the reliability of the proposed method by the comparison of the results obtained by the theoretical analysis, the proposed method, and the traditional acceleration-based test method. The conclusions are summarized in the final section.
Numerical analysis for the natural frequency of the steel component
In this section, an I-steel beam is used as an example to illustrate the numerical analysis process of the natural frequency. The physical and geometric parameters of the test sample are tabulated in Table 1.
Initial parameters of the test sample.

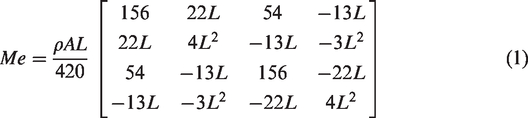
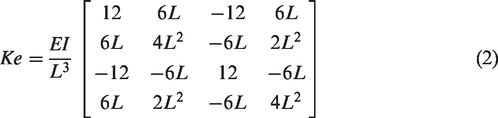
The FE method was used to analyze the theoretical vibration mode of the component. As shown in Figure 1, dividing the components into 42 equal length beam elements along the length direction and the element mass matrix can be represented as
20

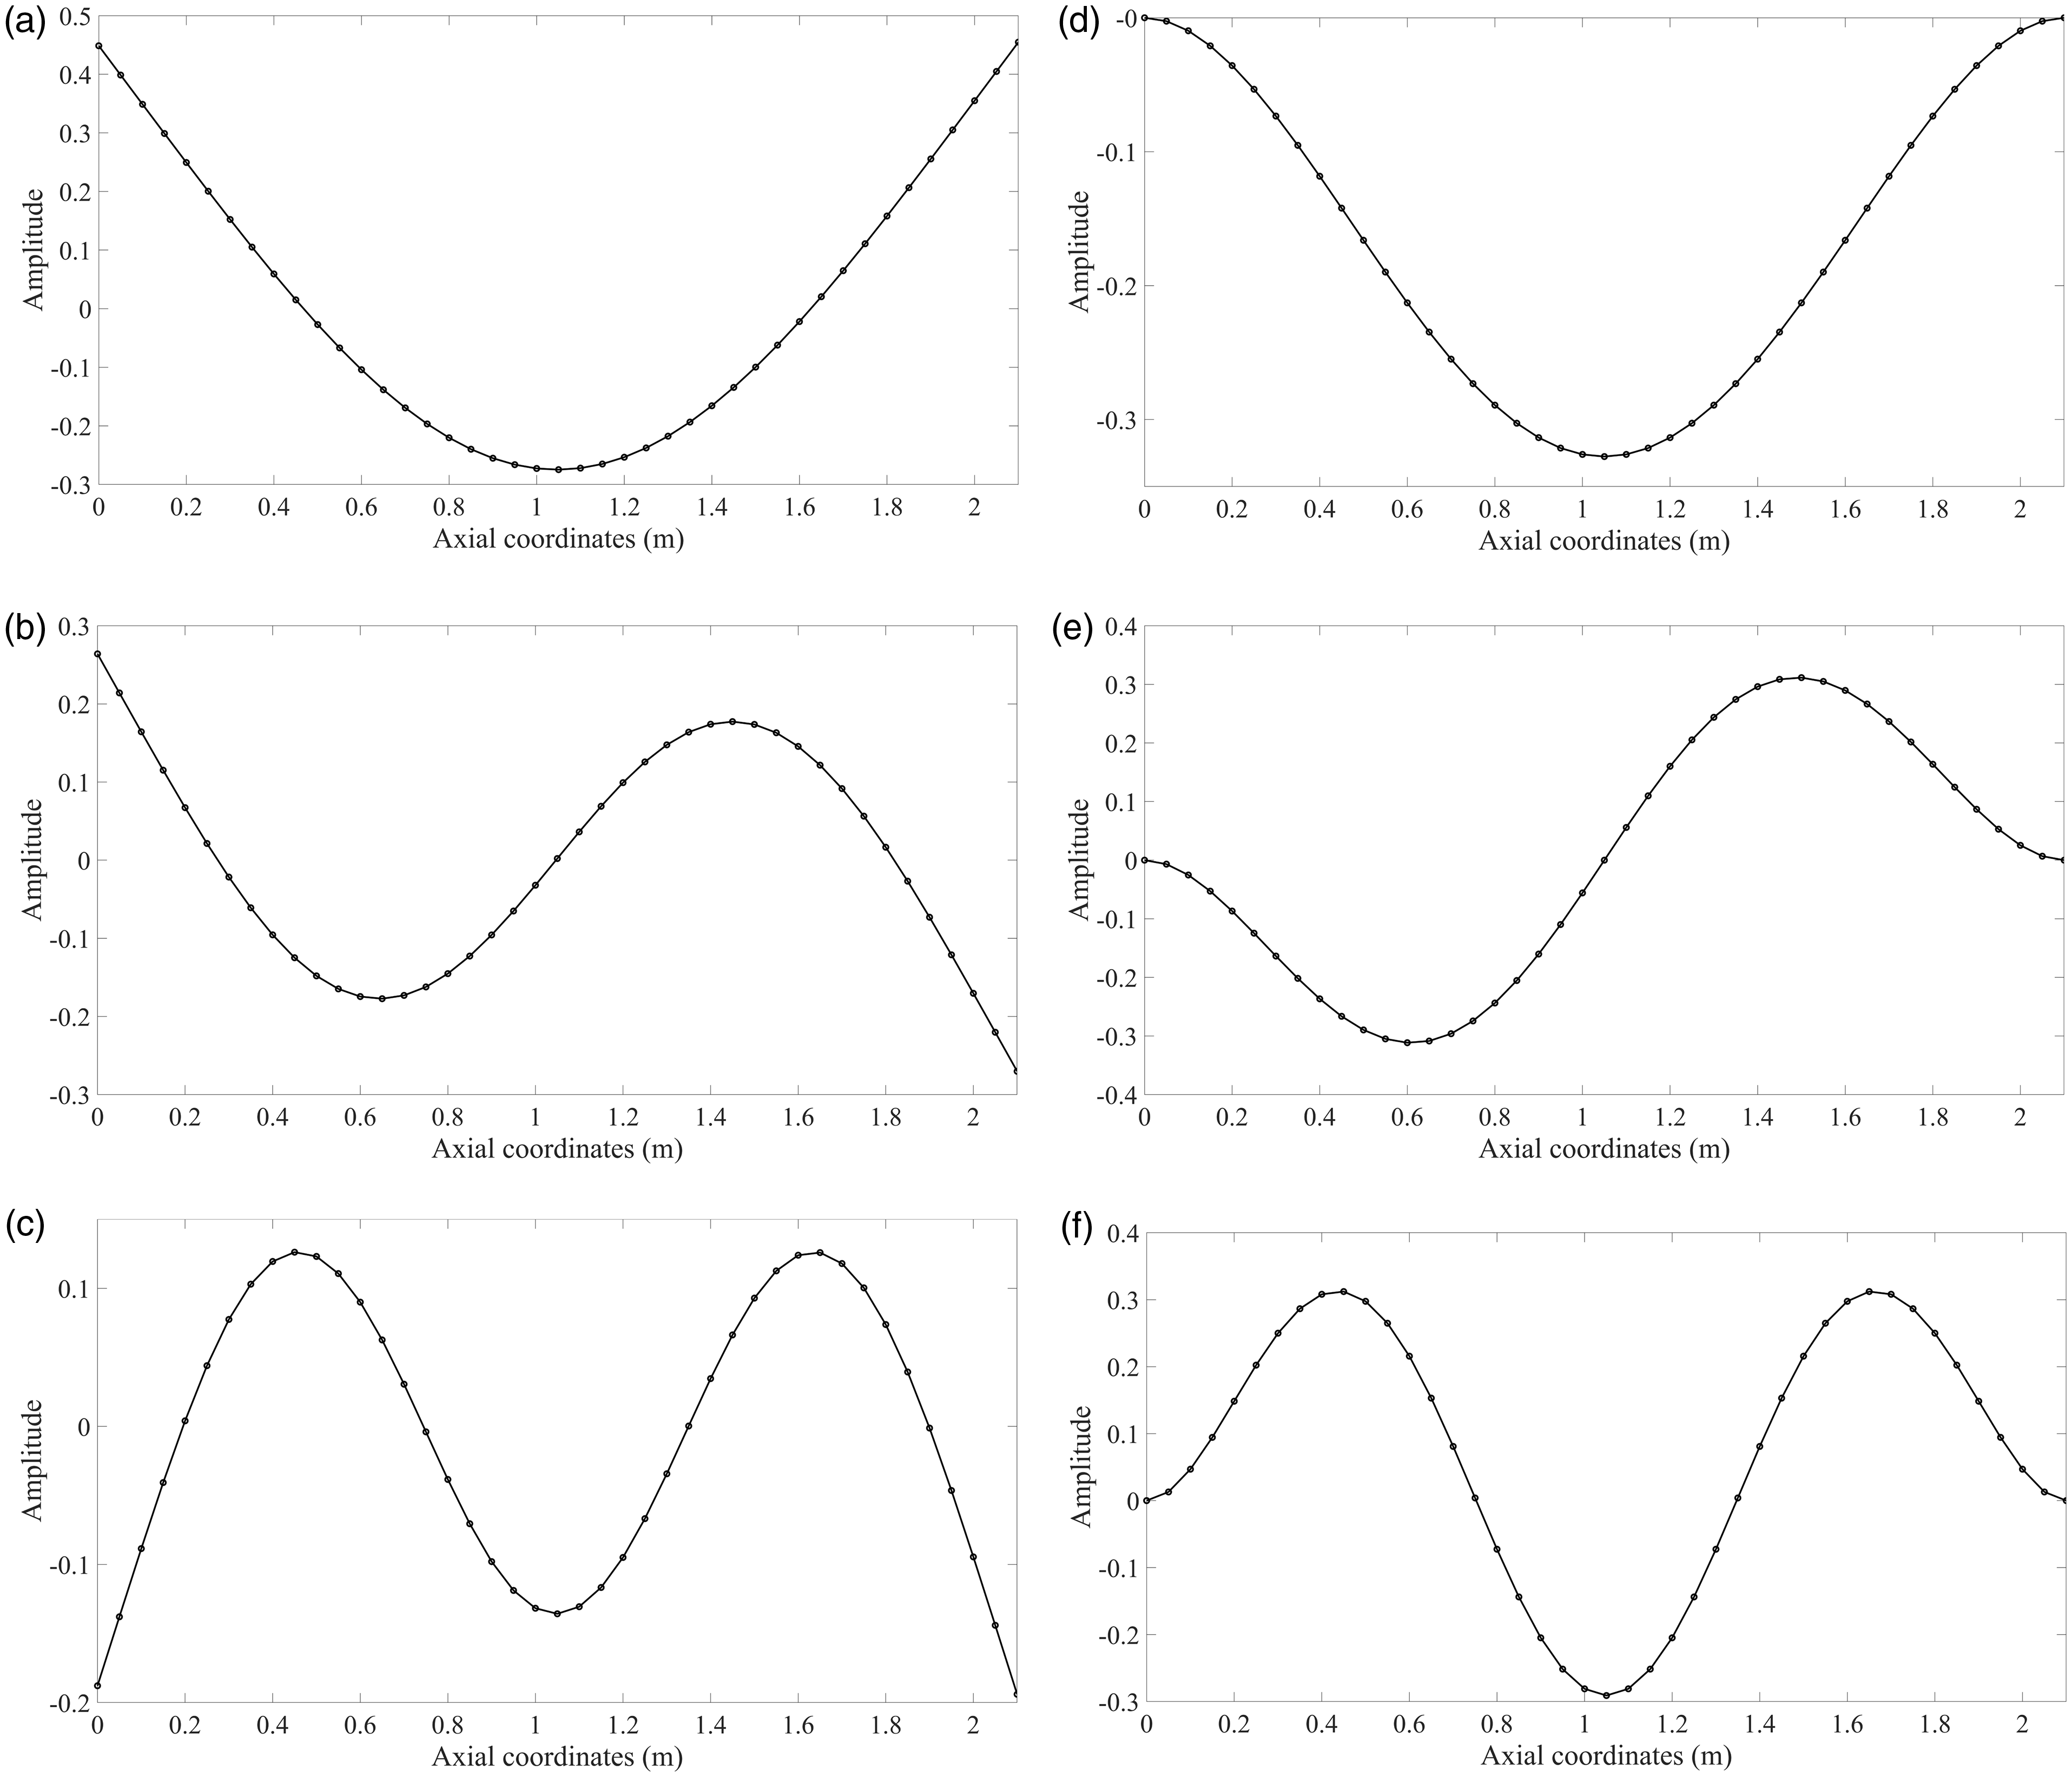
Mode Shapes of the same component under different boundary condition: (a) the first mode shape when hung by flexible ropes; (b) the second mode shape when hung by flexible ropes; (c) the third mode shape when hung by flexible ropes; (d) the first mode shape when fixed at both ends; (e) the second mode shape when fixed at both ends; (f) the third mode shape when fixed at both ends.
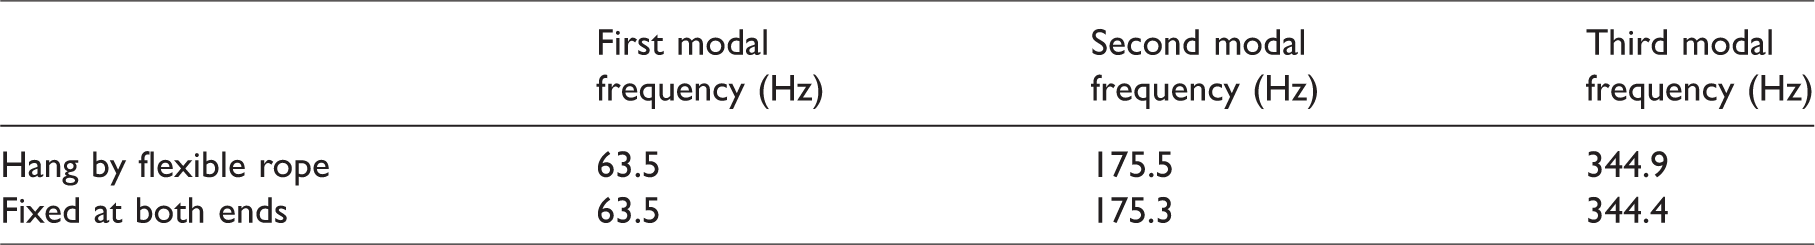
The natural frequency of the same component under different boundary conditions is tabulated in Table 2. The comparison shows that there is a subtle difference of natural frequency between the two boundary conditions. As the section steel components in service are usually fixed at both ends, according to the conclusion of numerical analysis, it is reasonable to use the suspension method to detect the natural frequencies of steel components.
Natural frequency of the test sample by the numerical method.
Natural frequency test by the proposed method
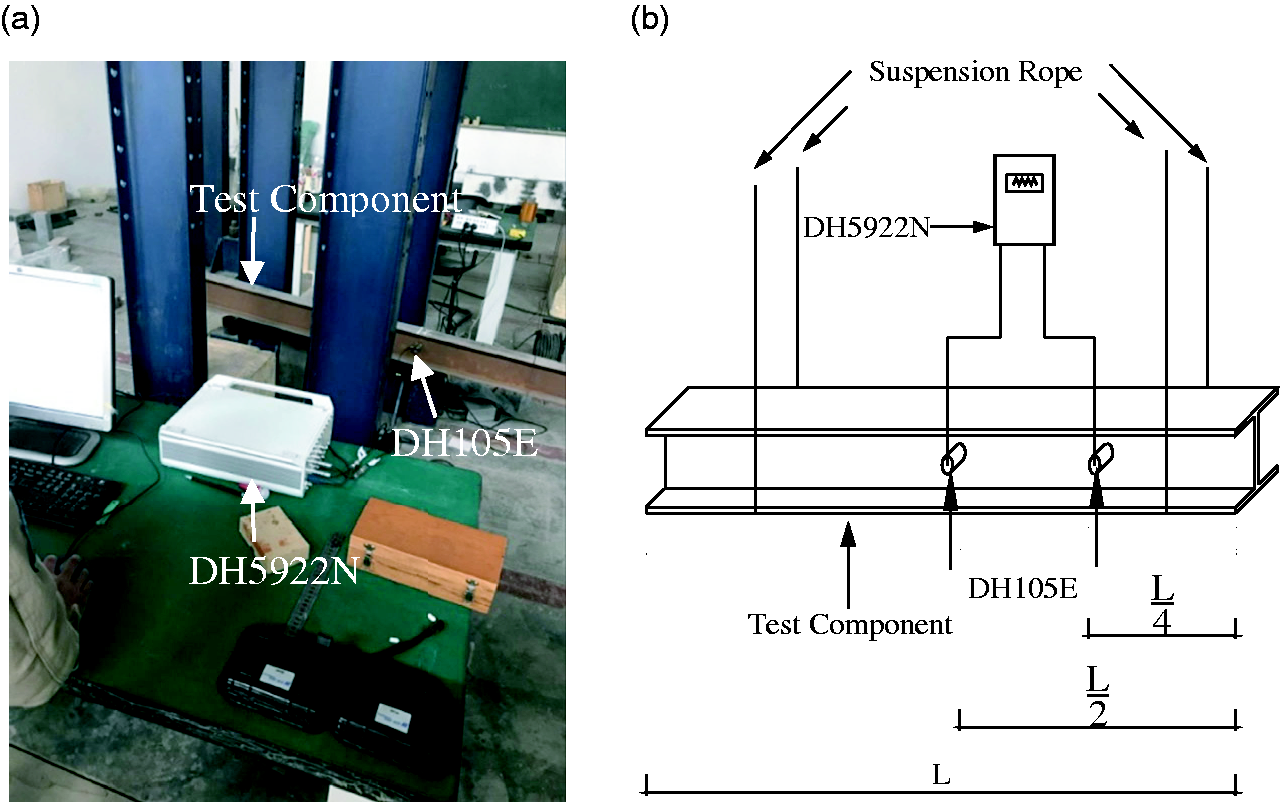
Sounds propagate in the air in a form of acoustic waves; hence, the acquisition and analysis of sound signals might be affected by the environment or test conditions. This research plans to suspend the selected steel component, as shown in Figure 2, and then knock at it with a round head hammer. The acquisition device for sound signals uses smart mobile phones. Its sampling frequency is 44.1 kHz, and the format of the acoustic signal is m4a.
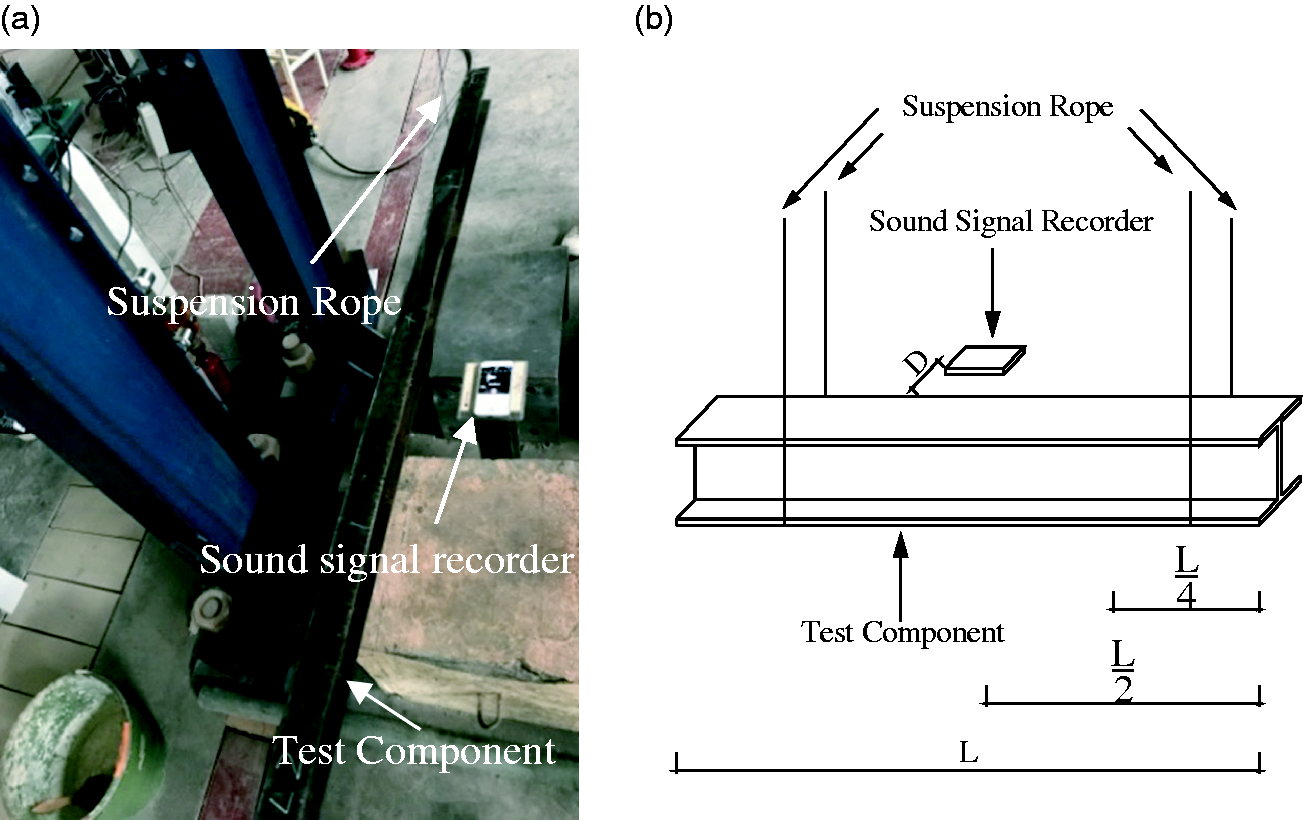
Sound signal experimental model: (a) steel component sound signal test setup; (b) schematic diagram of test site.
According to the actual test environment, two different conditions that might affect the test results are discussed in this paper, which come from the distance between the sound recording devices to the test components and the percussion position on the component.
Influence from sampling distance
Generally, in a structural test system, the location of the sampling device is not specified. Furthermore, the transmission of sound signals in the air would decline with the distance. Therefore, the sampling distance may be an important factor affecting the test results of the natural frequency of the component. This paper intends to test the influence from distance between the sound recording devices to the test component, so as to provide reasonable sampling distances for the field test of the natural frequency of the components.
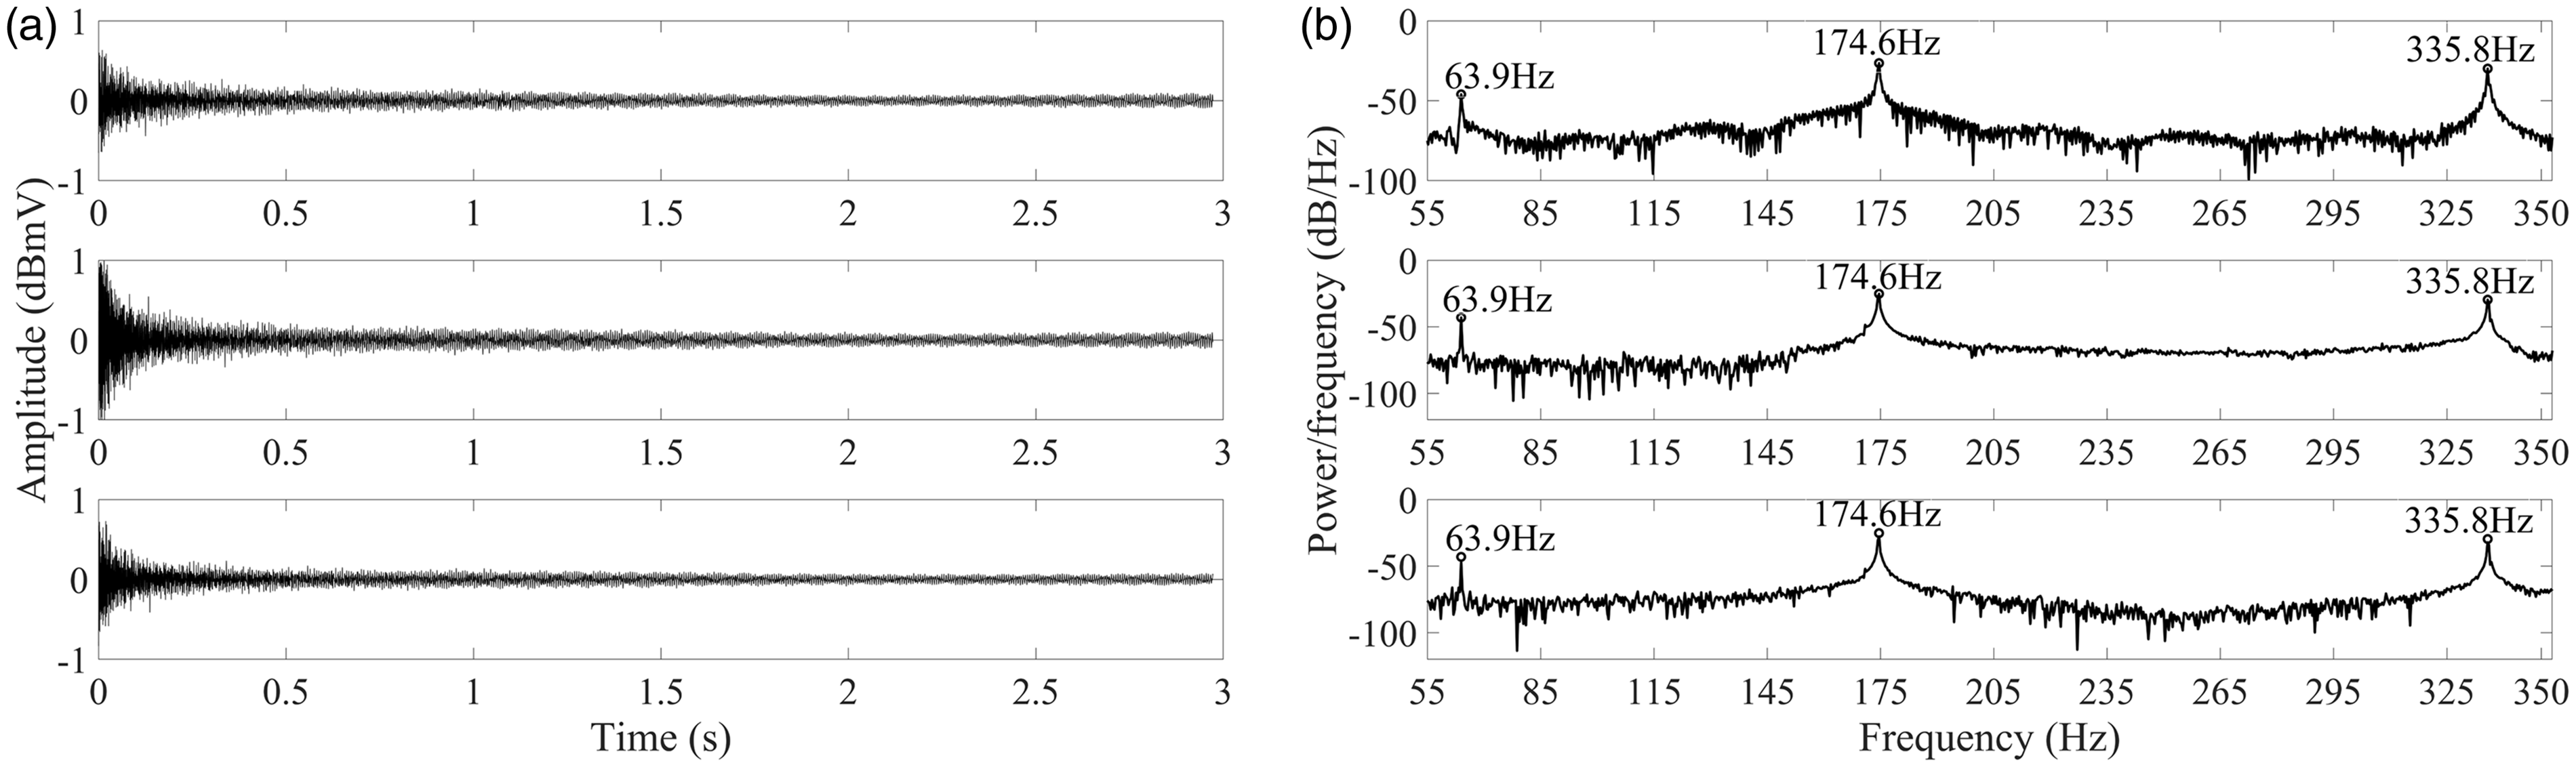
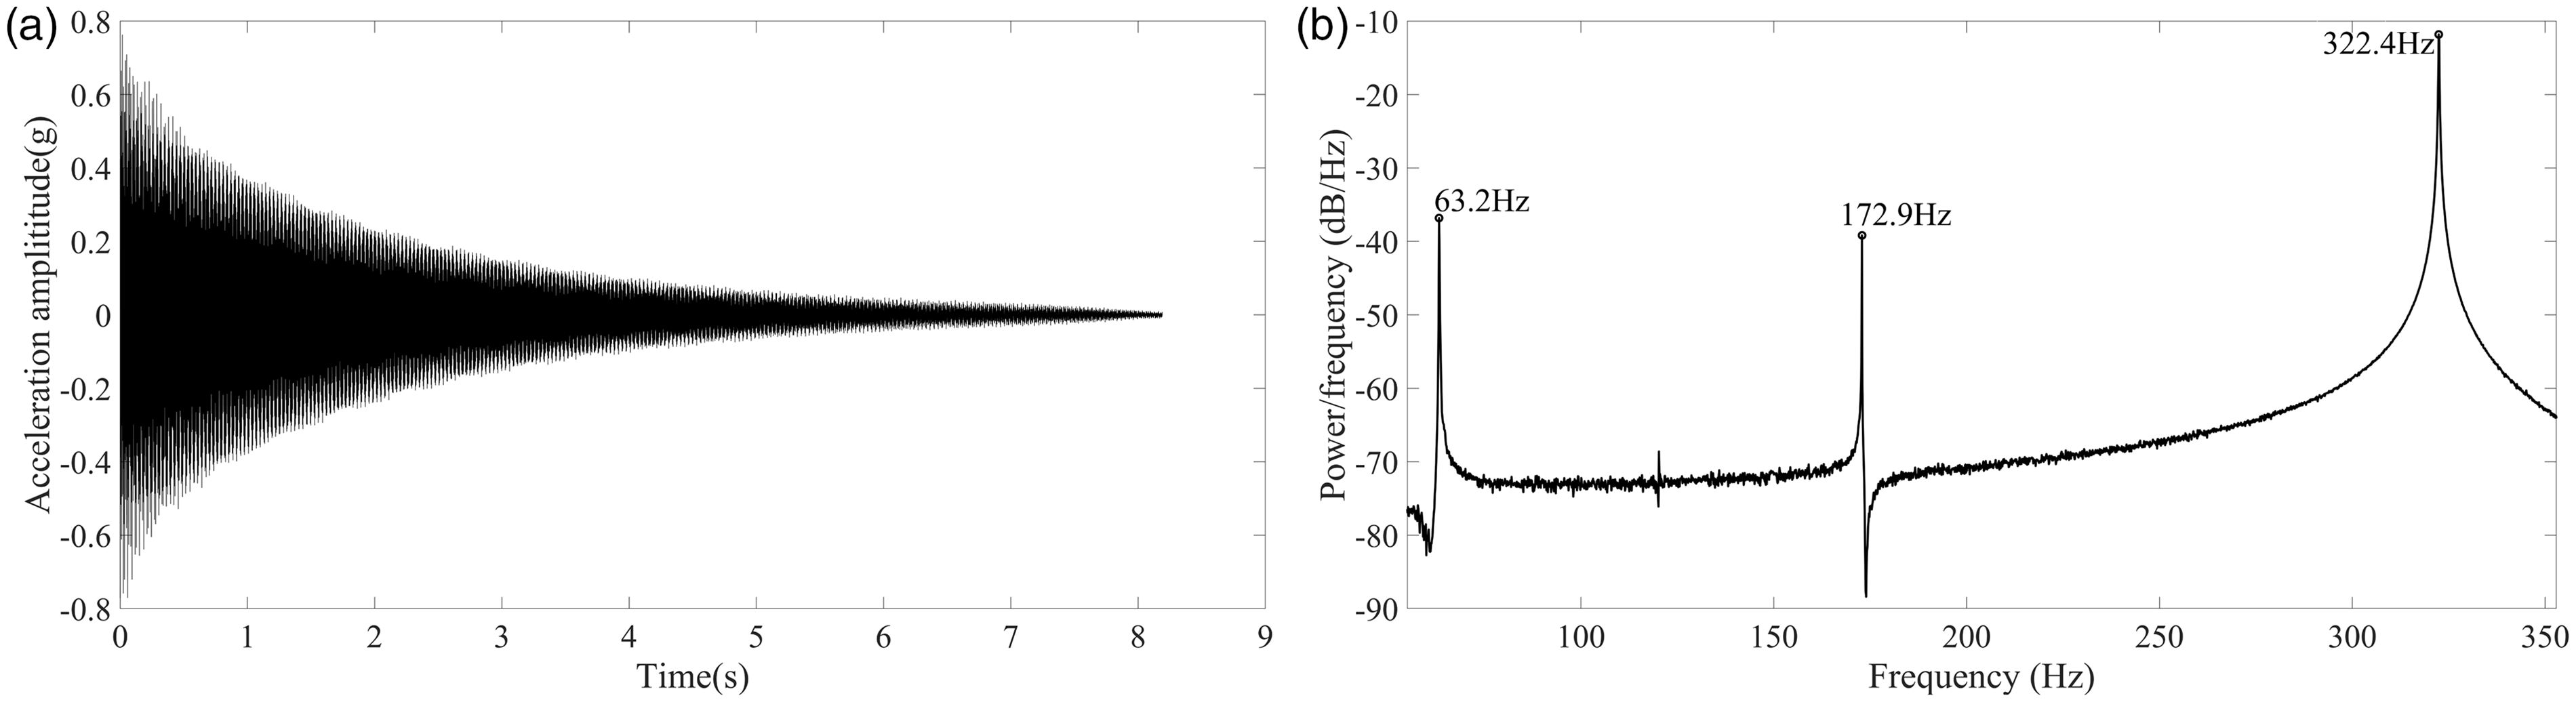
The sound signal acquisition at a distance of 0.1 m from the test component is shown in Figure 2(b) (D = 0.1 m). When percussion of the steel component was conducted three times on quarter point with a round head hammer, the sound signal acquisition is traveled about 5 s. The acquisition device for sound signals used a smart mobile phone, whose sampling frequency 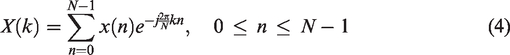
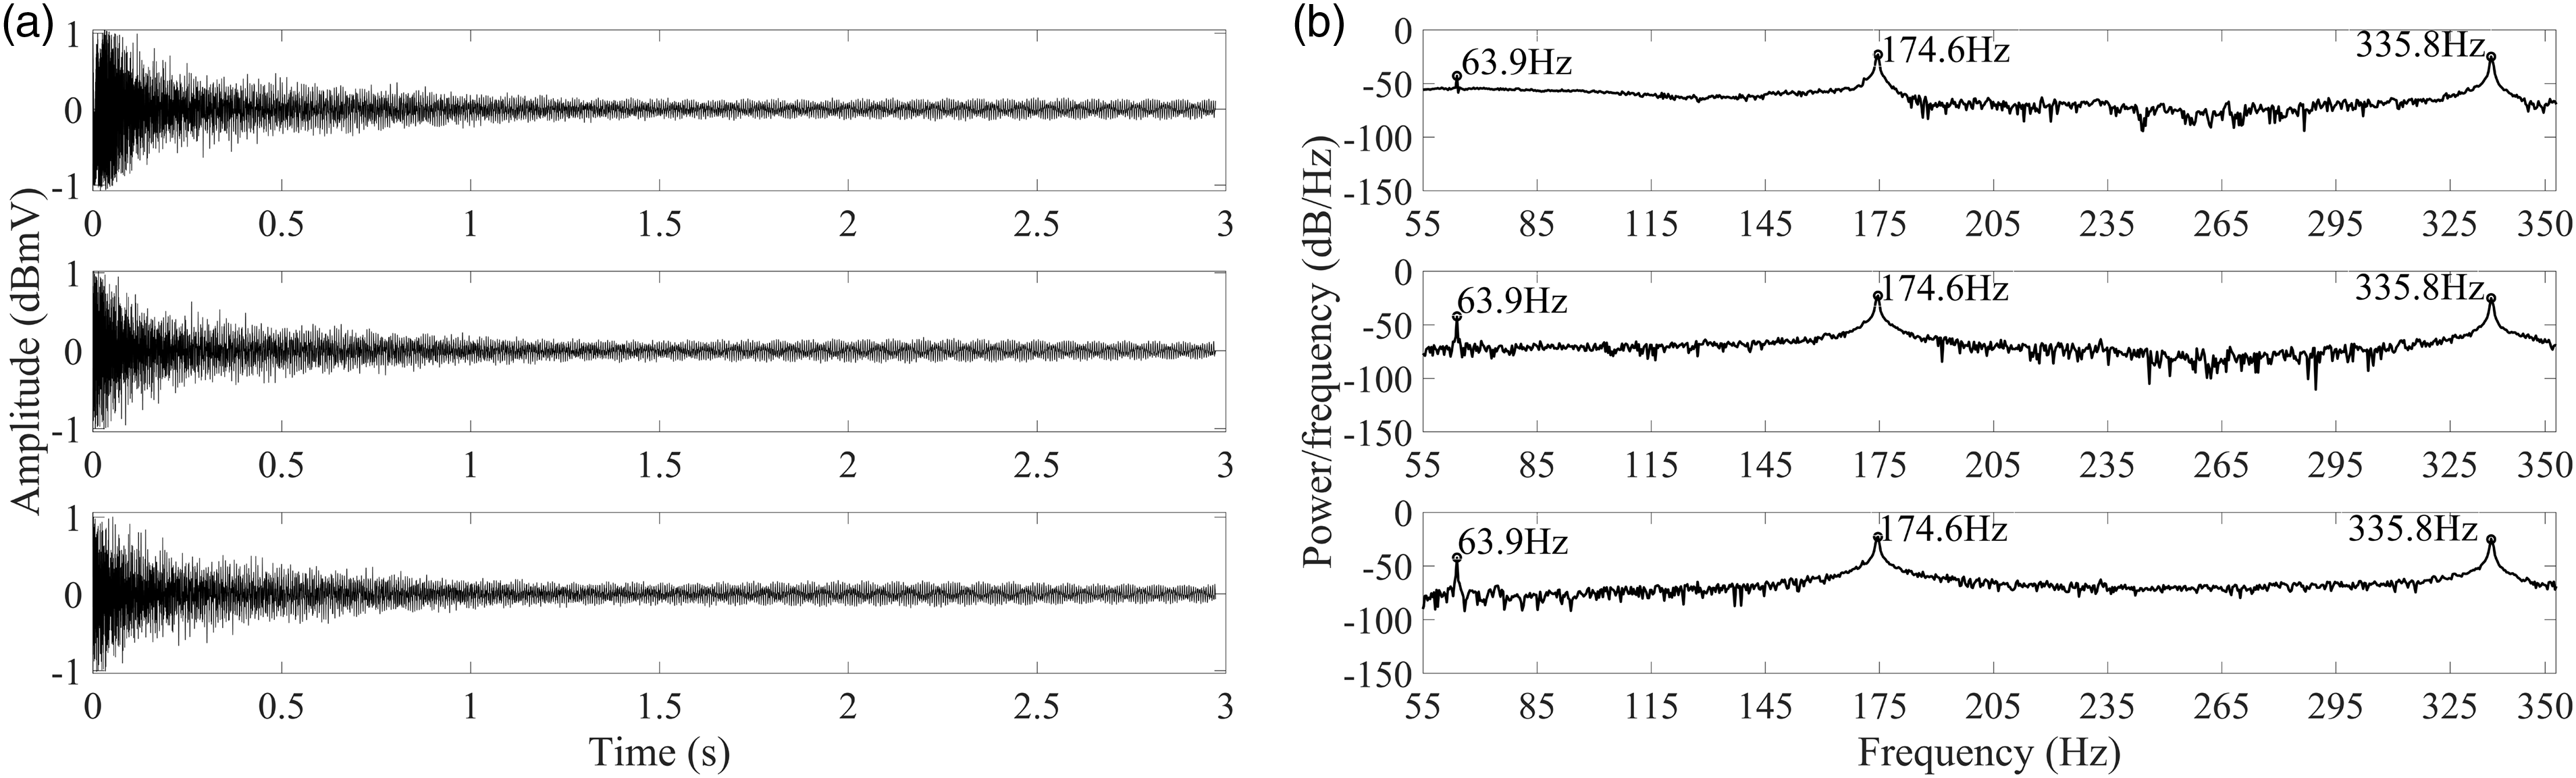
SSTNF of the component under the distance of 0.1 m: (a) sound signal acquisition 0.1 m; (b) PSD estimation of the sound signals.
Then they were imported to MATLAB and calculated to obtain the discrete PSD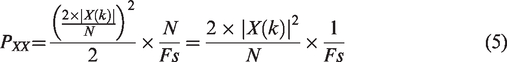

The PSD depicted in Figure 3(b) is now typically described as a logarithmic plot (in dB) of the squared magnitude of the Fourier transform. In Figure 3(b), the transverse coordinates are the frequency ranging from 55 to 350 Hz, and the longitudinal coordinates are the values of PSD. The first three-order natural frequencies of the test component could be clearly located at the three peaks of the PSD curves, which confirmed the validity of the introduced method.
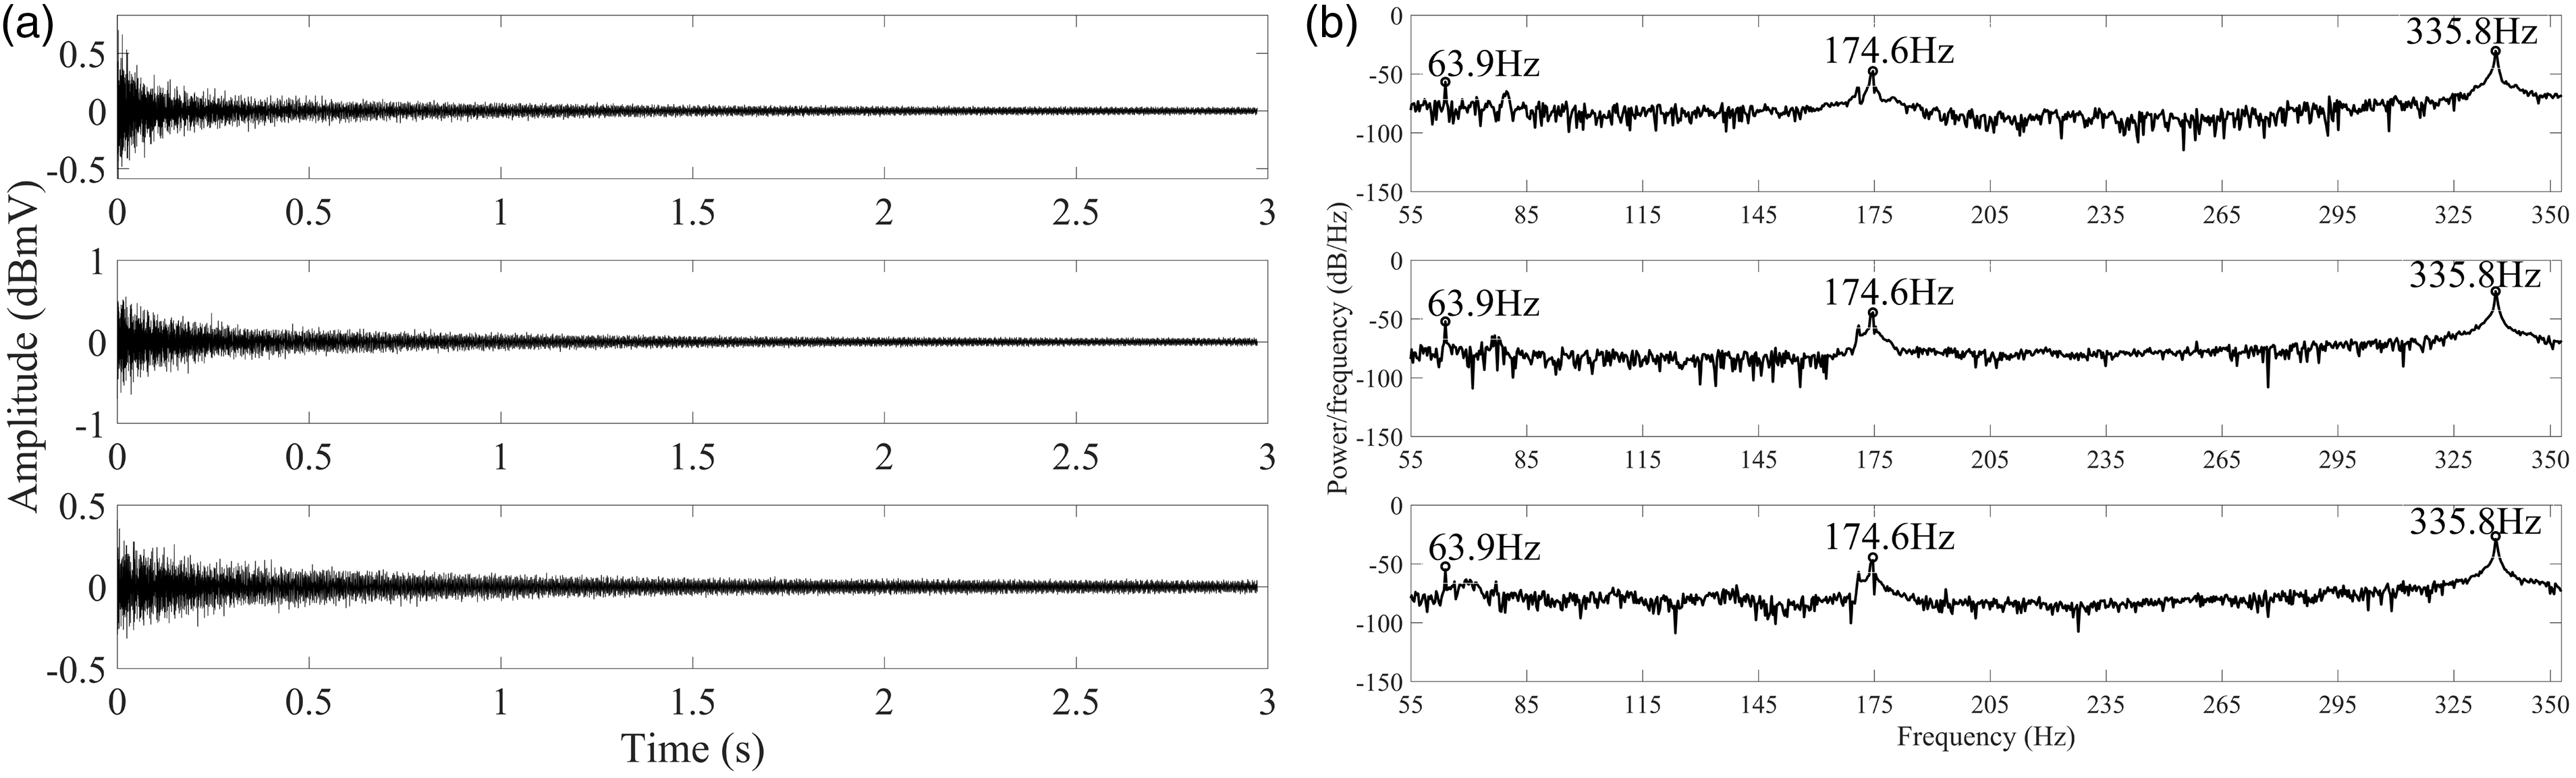
When the distance of sound signal acquisition expanded to 0.3 m from the test component, as shown in Figure 2(b) (D = 0.3 m), the PSD curve depicted in Figure 4(b) could still be clearly located at the peaks for the first three-order natural frequencies of the test component. However, the first-order natural frequency slightly changed to 61.9 Hz in the third test, which indicated that the distance does have an effect on the measurement results.
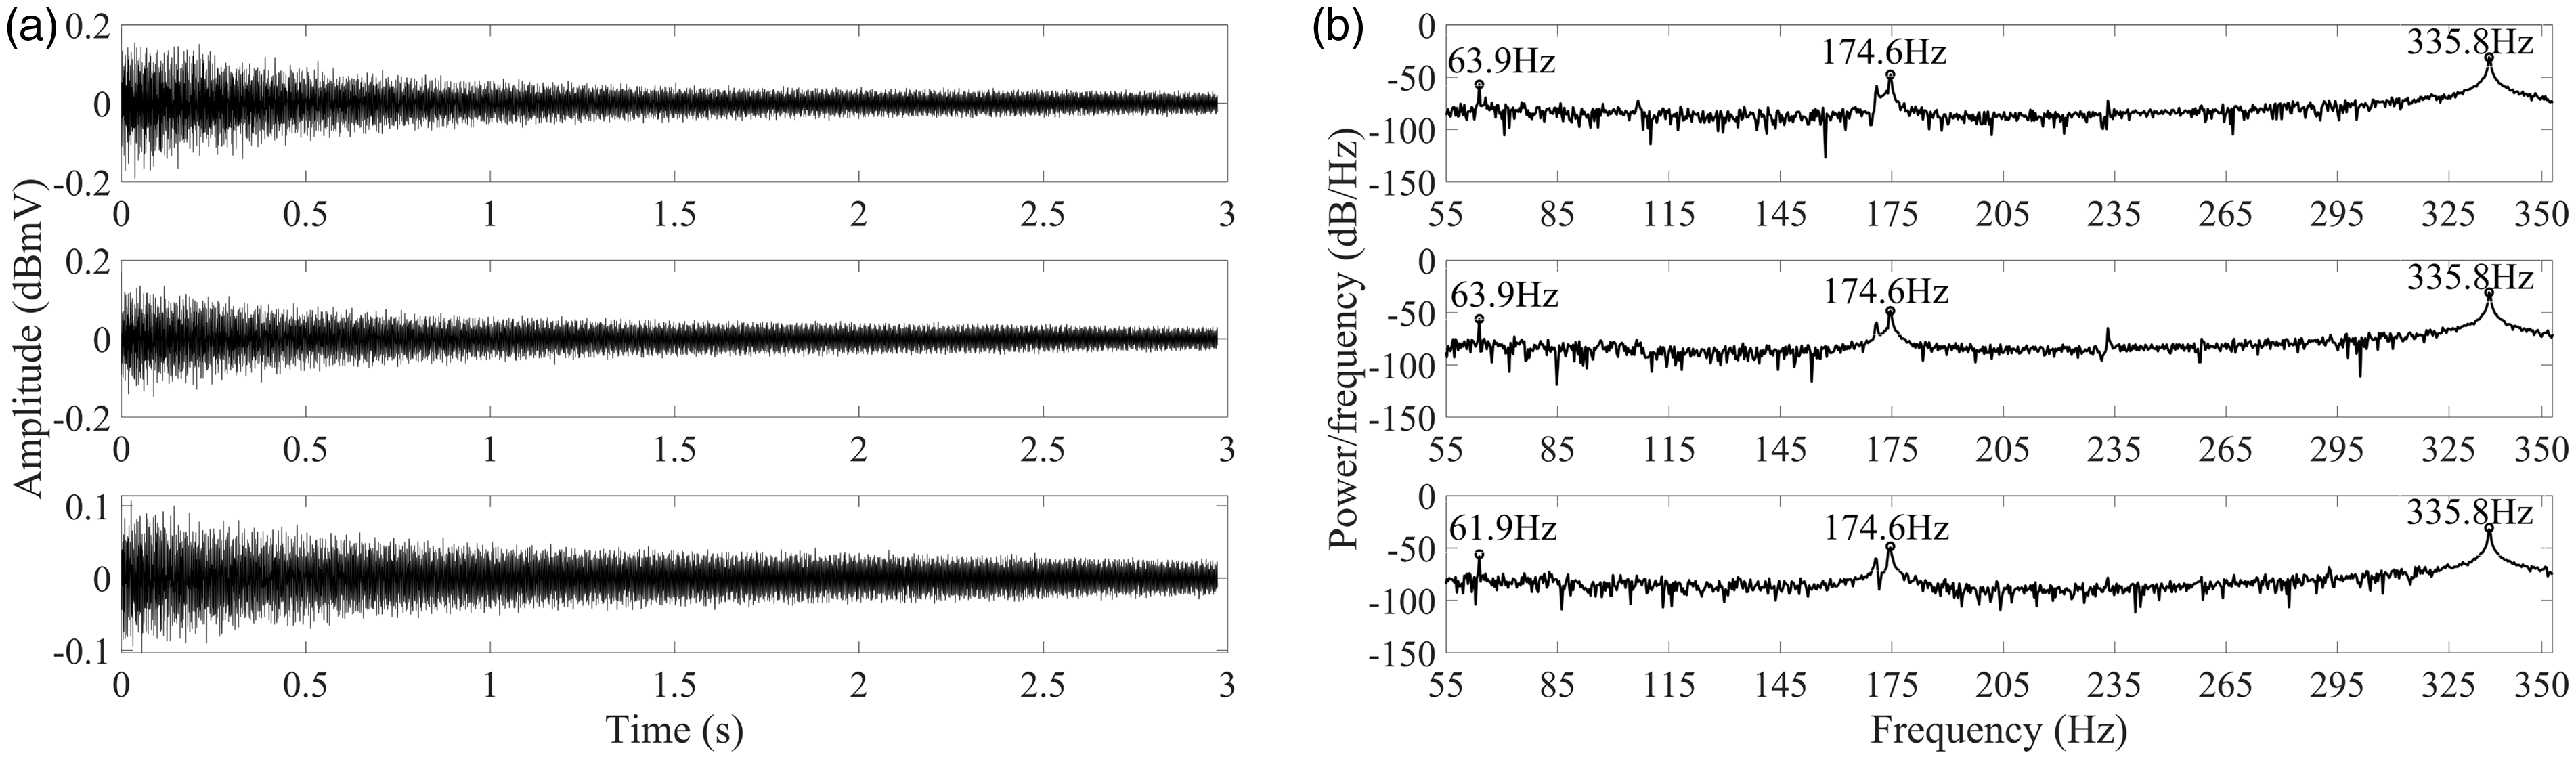
SSTNF of the component under the distance of 0.3 m: (a) sound signal acquisition 0.3 m; (b) PSD estimation of the sound signals.
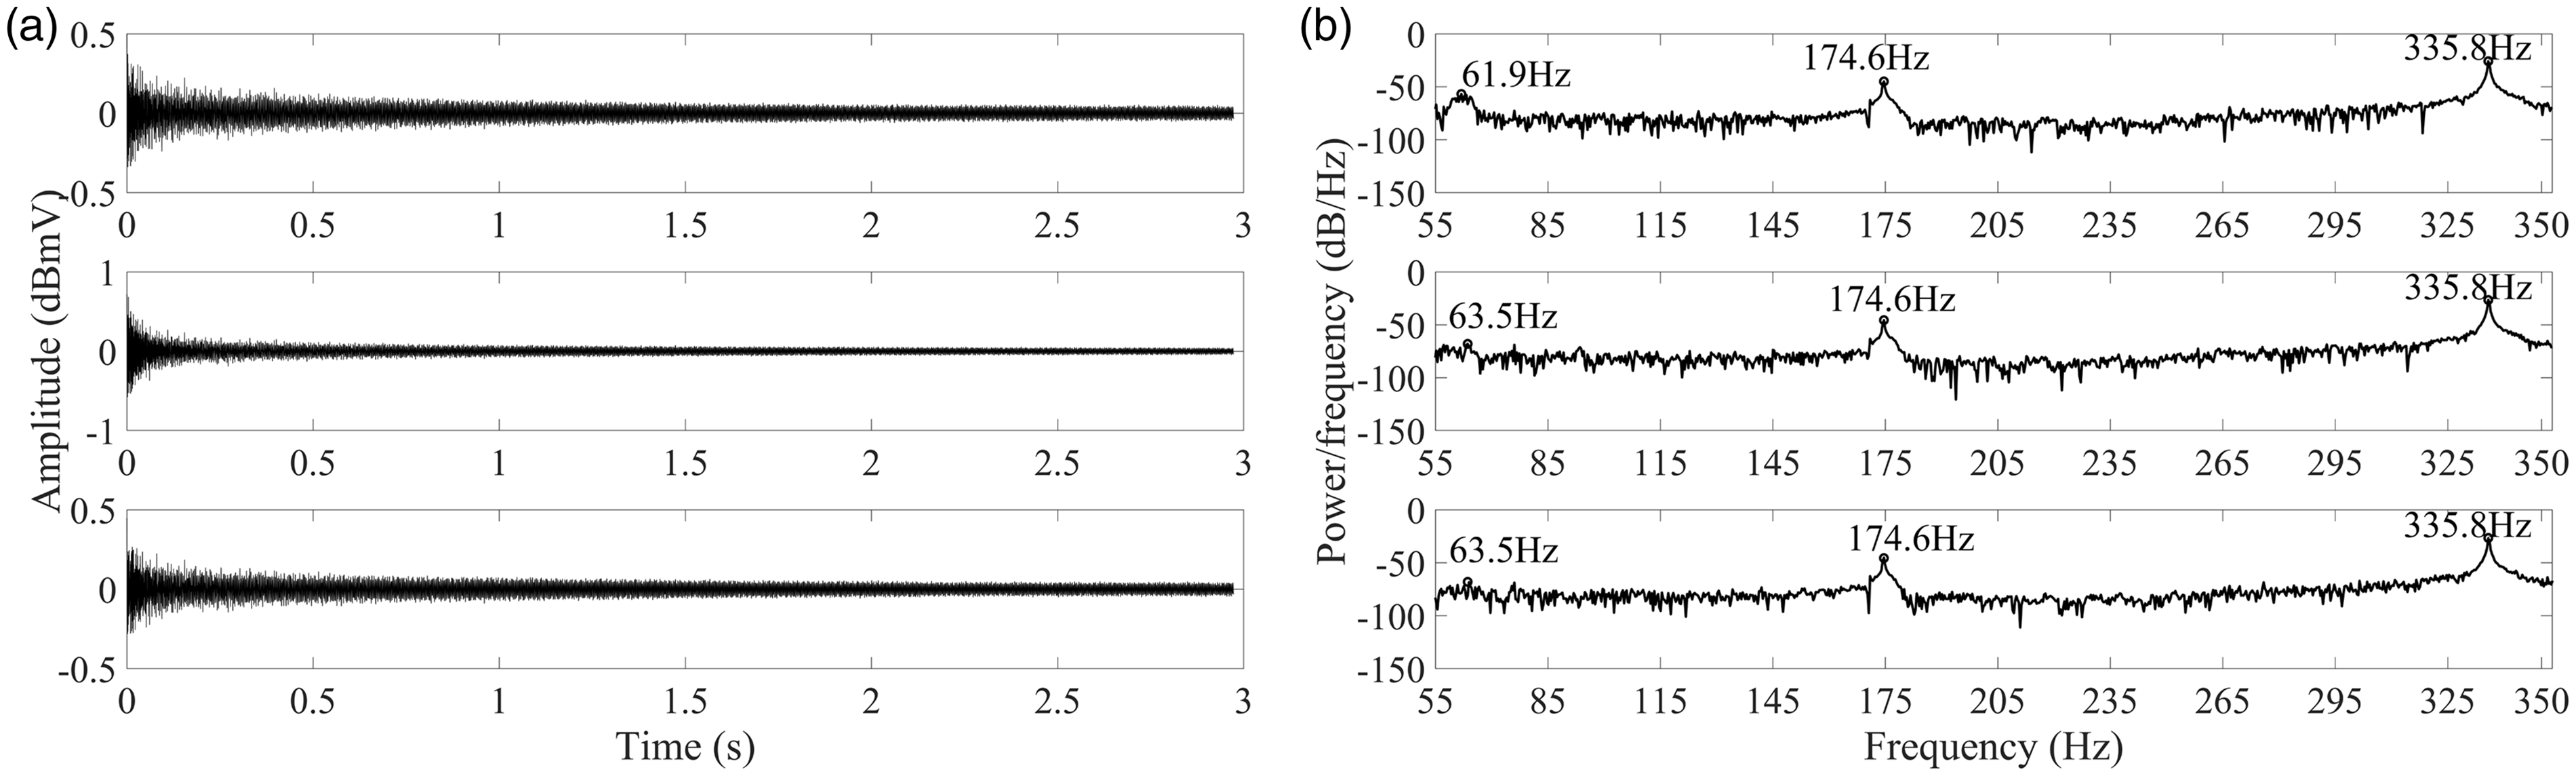
With different distances, the same test method was operated to measure the natural frequency of the same component. The results are shown in Figures 5 and 6. Figure 5(b) shows the slight change of the first natural frequency occurs, and the result of the test needs to take the mean of the three measurements. Fortunately, when the distance is 0.5 m, the obtained PSD curve can still be used to analyze the natural frequency of the component. Furthermore, it seems that the higher order frequency of the second and third orders measured by this method is more accurate and stable, which is different from detecting the natural frequency of structure system by acceleration sensors. The natural frequency result of the acceleration signal analysis usually gives first place to the first mode.
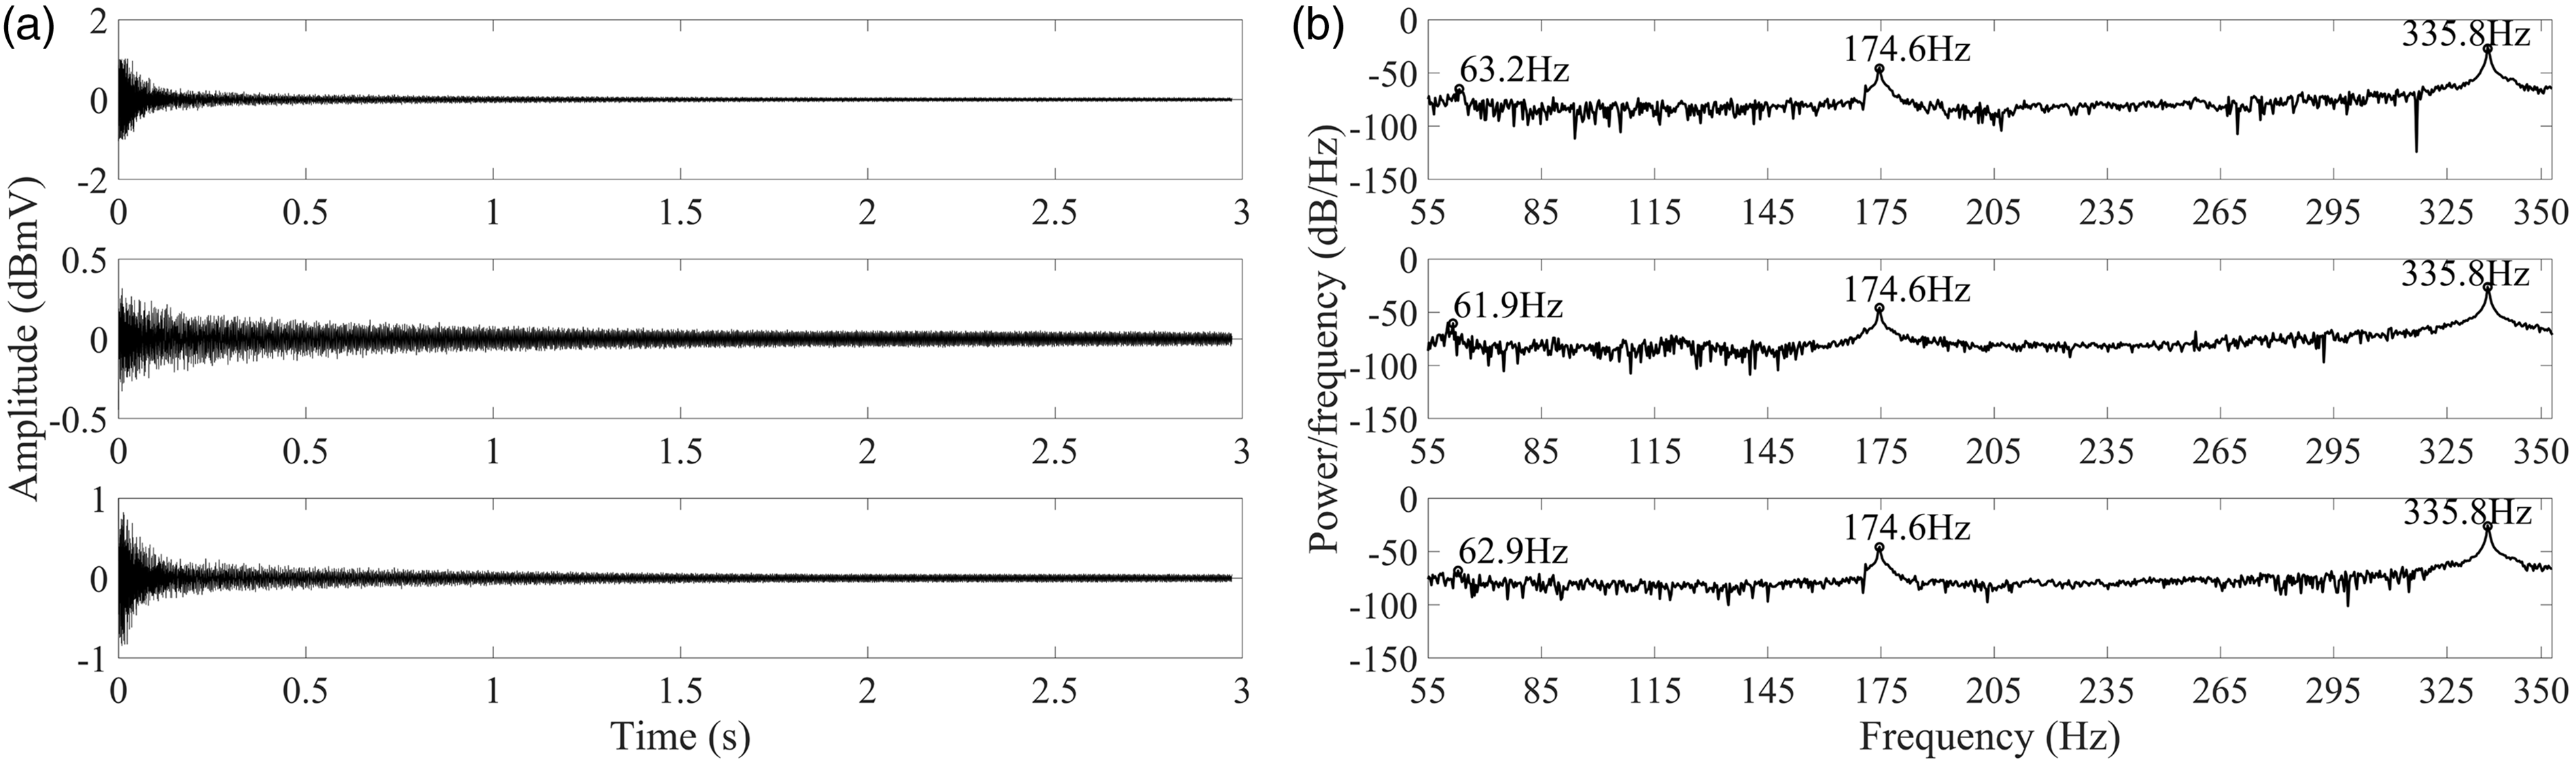
SSTNF of the component under the distance of 0.5 m: (a) sound signal acquisition 0.5 m; (b) PSD estimation of the sound signals.
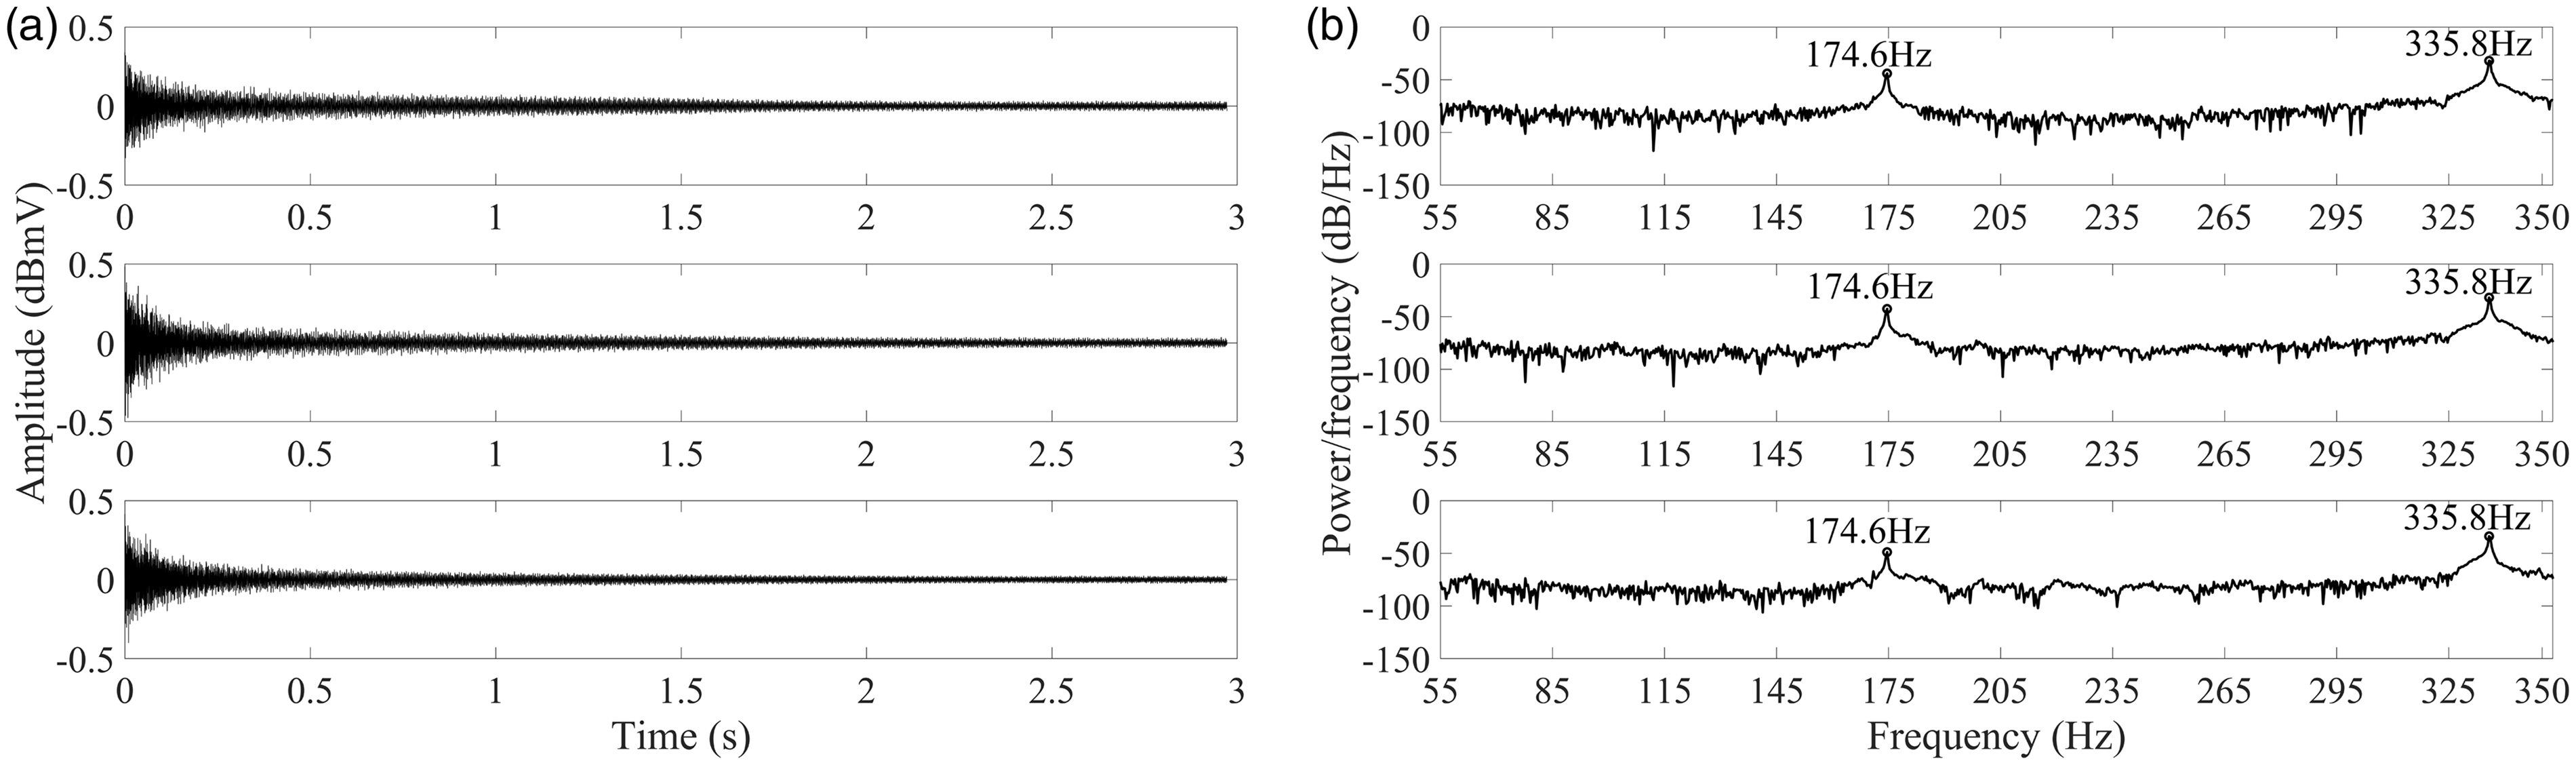
SSTNF of the component under the distance of 1 m: (a) sound signal acquisition 1 m; (b) PSD estimation of the sound signals.
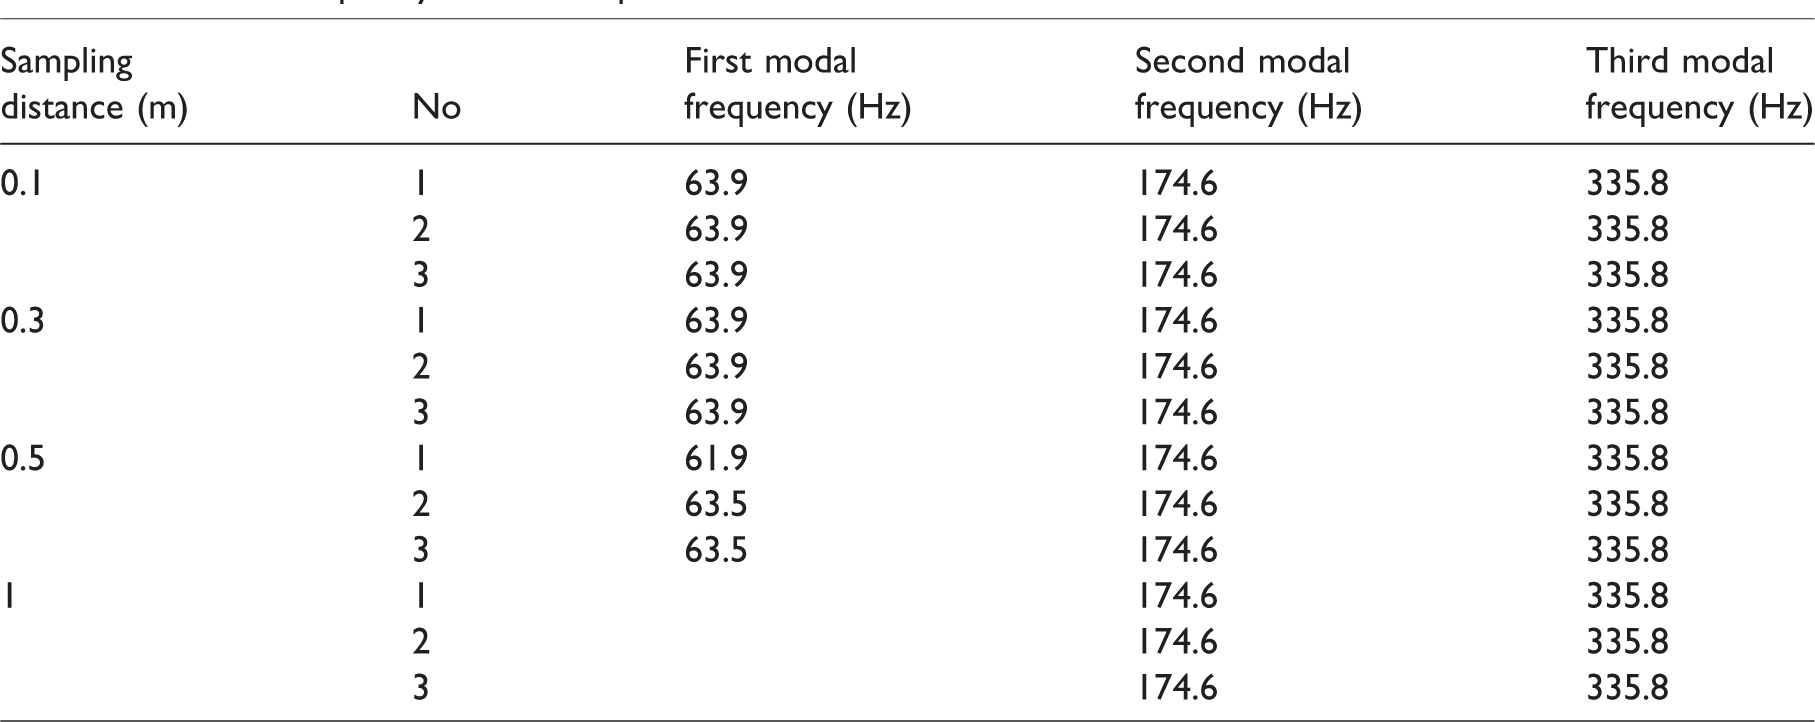
Figure 6(b) reflects the results of the PSD estimation of sound signals when the distance is 1 m. It is clear that the natural frequency of the first order cannot be identified at this distance. The natural frequency results of the first three order of the steel component obtained by the periodic graph periodogram method at different distance are tabulated in Table 3 together. It could be seen that the sound signal test natural frequency (SSTNF) method introduced in this paper has an accurate and stable effect for the natural frequency test of the steel components. At the same time, it is suggested that the installation position of the recording device of the sound signal should not be more than 0.3 m.
Natural frequency of test sample.
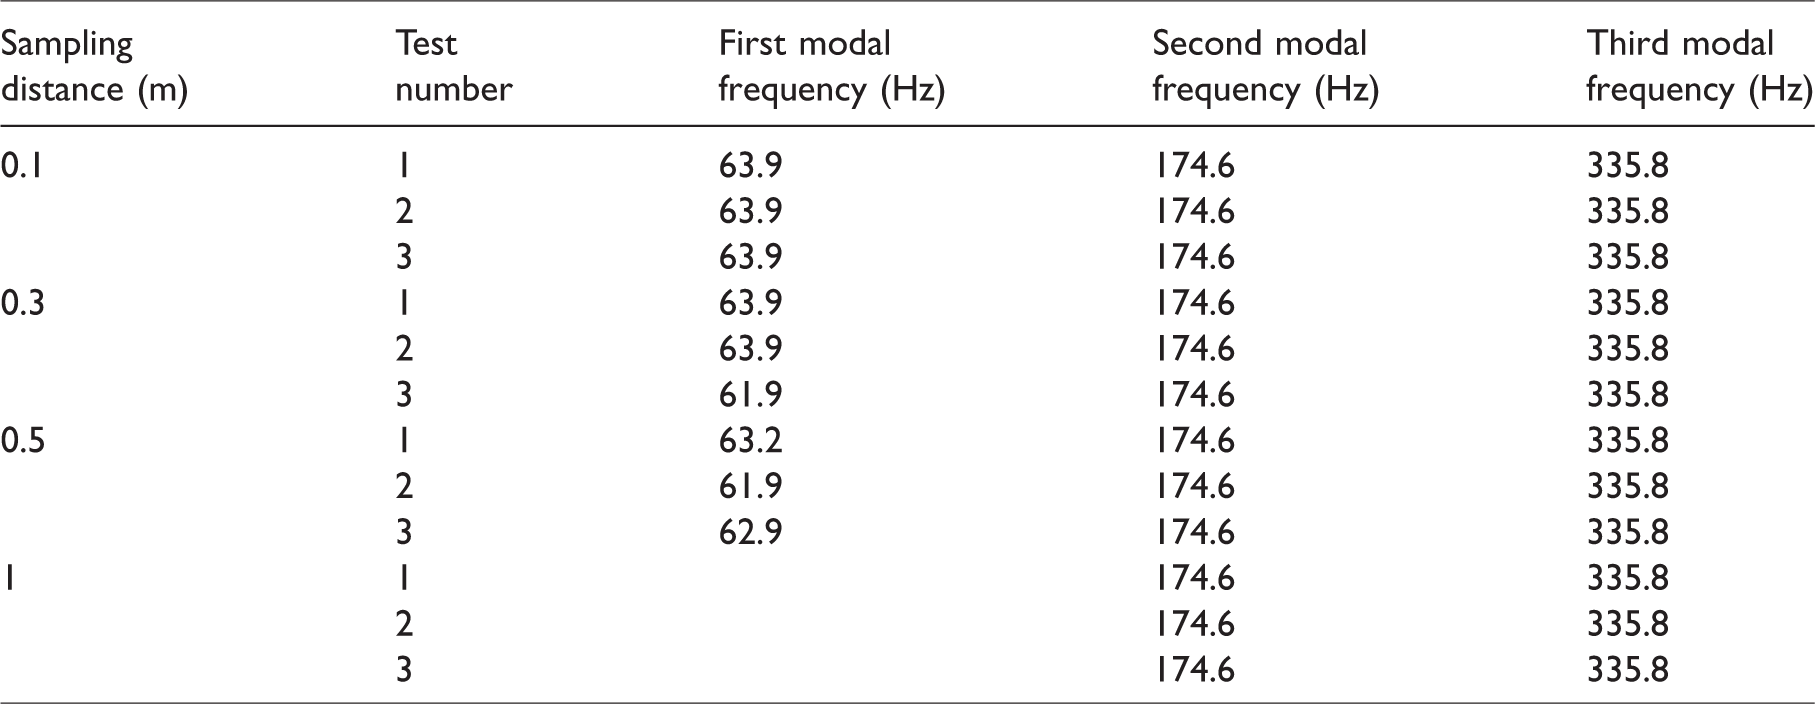
As a result, the SSTNF method introduced in this paper has an accurate and stable effect for the natural frequency test of the steel components, and the influence from sampling distance should not be neglected. Generally, when the sampling distance is less than 0.3 m, the natural frequency of the component can be accurately measured. When the distance is more than 0.5 m, only the high order natural frequency of the component could be detected.
The influence from percussion position
In this paper, a key step is to knock the component with a round head hammer to make it vibrate and sound. In general, this step could be affected by the limitation of the installation position of the steel components or the test conditions, which brings about the problem of the percussion position. This study further analyzed the artificial excitation on the middle point of the component to test the correspondence between the percussion position and the test results, so as to provide reasonable percussion position for the field test of the natural frequency of the components.
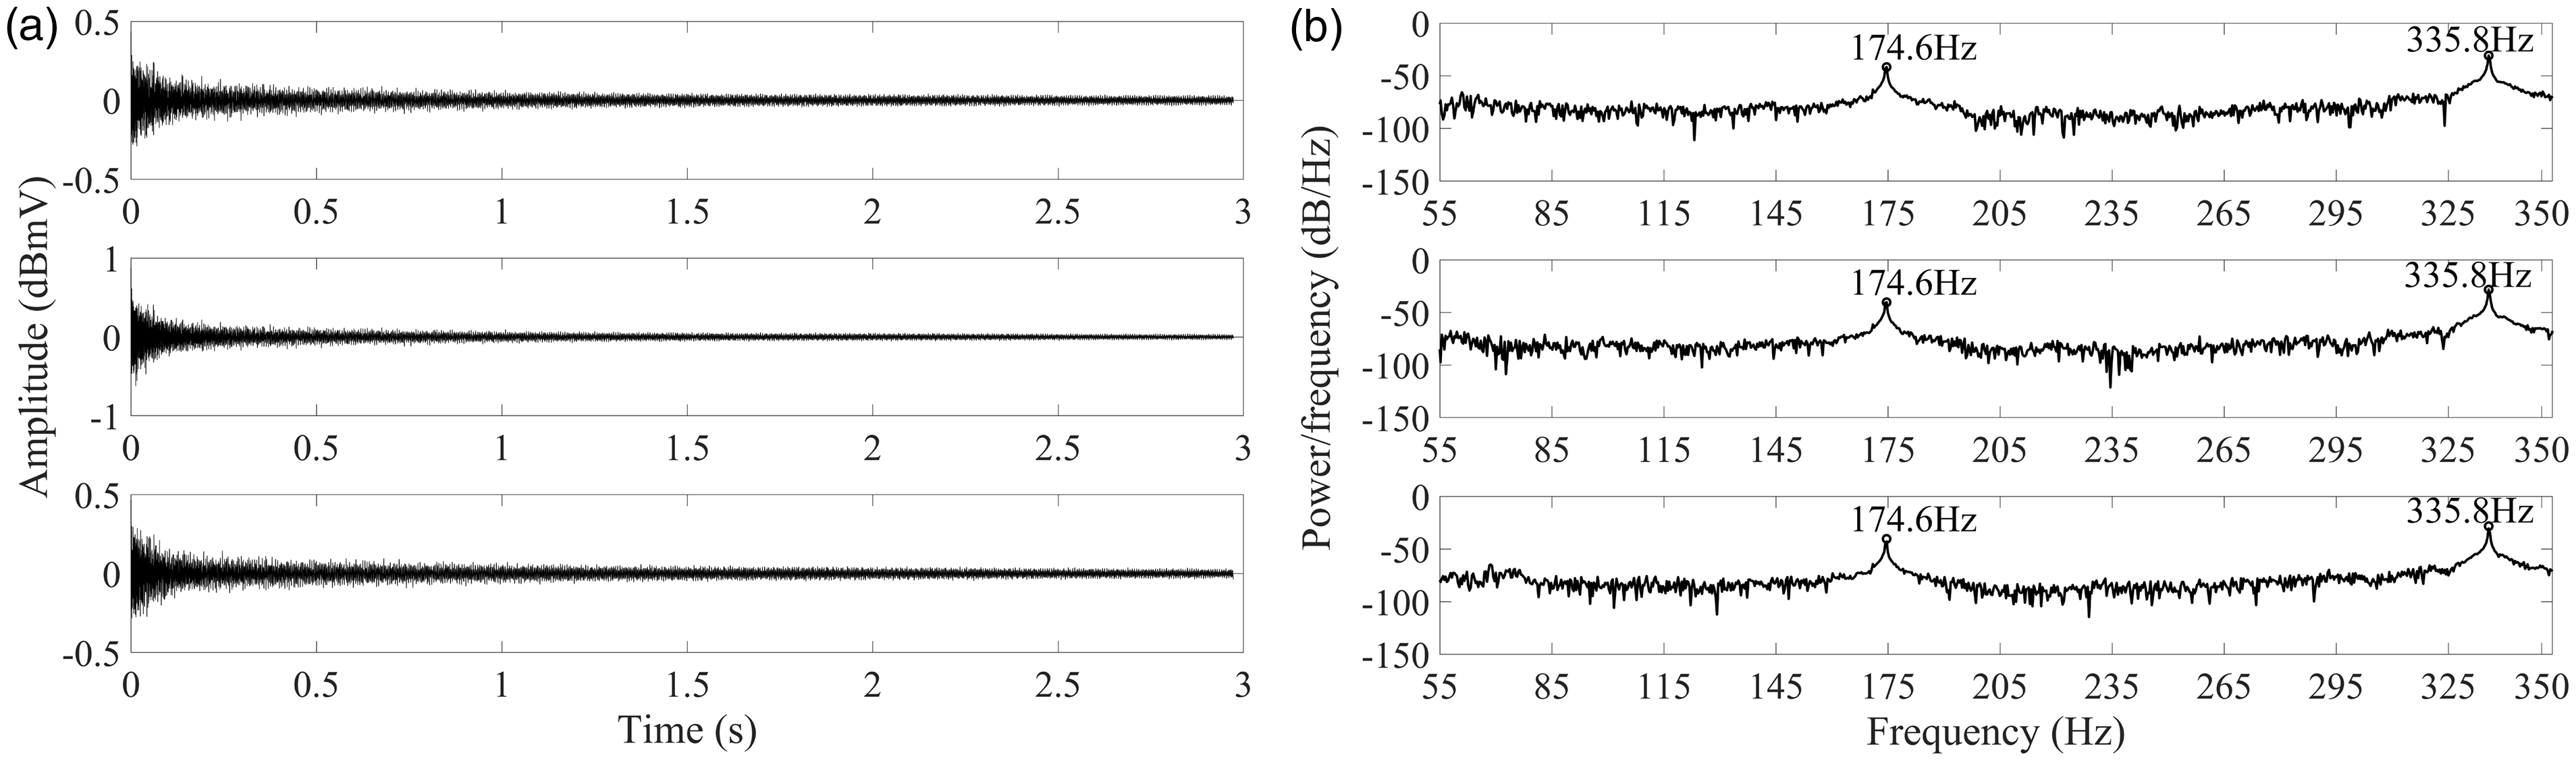
Selecting the middle point of the component as a new percussion position, the same test method was operated to collect the sound signal three times as shown in Figure 7(a). The spectrogram depicted in Figure 7(b) typically shows the first three-order natural frequencies of the same component. The validity of the introduced method in this paper is confirmed again.
SSTNF of the component under the distance of 0.1 m: (a) sound signal acquisition 0.1 m; (b) PSD estimation of the sound signals.
When the distance of sound signal acquisition expanded to 0.3 m from the test component, the sound signal time history obtained by knocking at the middle point is depicted in Figure 8(a). The middle point position is the peak position of the influence line of the steel component, where the lateral deformation stiffness of the component reaches the least. Its vibration could be easily excited; therefore, the natural frequency could be detected easier by the periodic graph periodogram method (Figure 8(b)).
SSTNF of the component under the distance of 0.3 m: (a) sound signal acquisition 0.3 m; (b) PSD estimation of the sound signals.
The sound signal time history obtained by knocking at the middle point was continued when the distance of sound signal acquisition expanded to 0.5 m (Figure 9) and 1 m (Figure 10) from the test component.
SSTNF of the component under the distance of 0.5 m: (a) sound signal acquisition 0.5 m; (b) PSD estimation of the sound signals.
SSTNF of the component under the distance of 1 m: (a) sound signal acquisition 1 m; (b) PSD estimation of the sound signals.
The analyzed results show the same regularity as percussion on the quarter point. Figure 9(b) shows the slight change of the first natural frequency, where the mean of three measurements was taken.
From Figure 10(b), one could say that the natural frequency of the first order cannot be identified at this distance. At this point, it is worth mentioning that, in real practice, several sound sources are usually mixed. Measuring the natural frequencies of components by means of sound signals excited by vibration could be disturbed by ambient noises. Experimental results demonstrate that it has more obvious effect on the first natural frequency. This study could effectively improve the impact of test results by reducing the distance between the test component and the sampling device.
The natural frequency result of the first three order of the steel component obtained by the periodic graph periodogram method at different distance is tabulated in Table 4 together. It could be seen that the SSTNF method introduced in this paper shows a more accurate and stable effect as percussion on the midpoint. At the same time, it is suggested that the installation position of the recording device of the sound signal still should not be more than 0.3 m.
Natural frequency of test sample.
Comparison study
The results by SSTNF method were validated by acceleration signal test based on hammer excitation. As shown in Figure 11, the acceleration sensors (DH105E, 172 g weight) were installed both at the middle and the quarter point of the component. The acceleration sampling equipment model is DH5922N, whose sampling frequency is 1000 Hz.
Acceleration signal experimental model: (a) steel component acceleration test setup; (b) PSD estimation of the acceleration signal.
Figures 12(a) and 13(a) depict the acceleration signals of the same component excited by hammer impacts. The acceleration signal acquisition spanned about 9 s. Interception of 2^13 (depicted in Figure 3(a)) of the data points from the acquisition device was selected for signal processing. The same periodogram method was adopted to analyze the acceleration signals to obtain PSD estimation (Figures 12(b) and 13(b)). The first three-order natural frequencies of the test component could be clearly located at the three peaks of the PSD curve in Figures 12(b) and 13(b), which further verified the validity of the SSTNF method introduced in this paper.
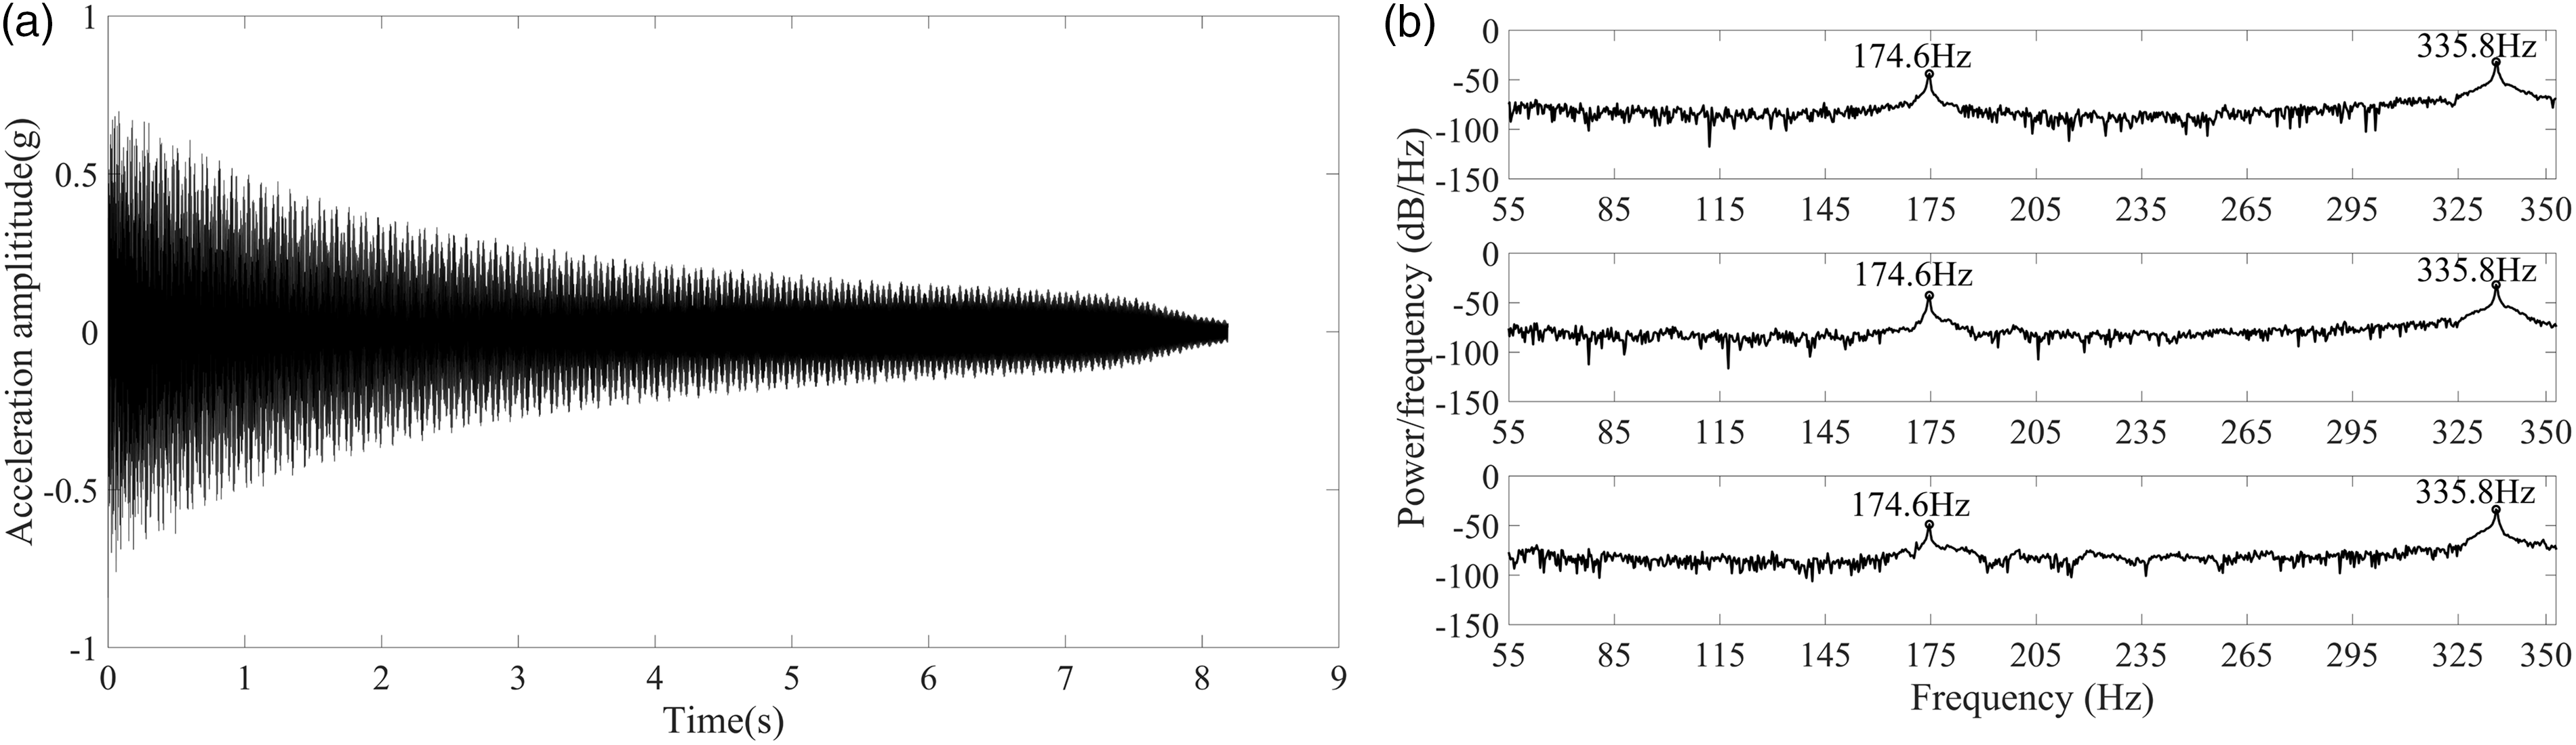
Measured vertical acceleration: (a) measured acceleration at the quarter point; (b) PSD estimation of the acceleration signal.
Measured vertical acceleration: (a) measured acceleration at the middle point; (b) PSD estimation of the acceleration signal.
Table 5 tabulates the first three natural frequencies of the test component by three different analysis methods. The natural frequencies of the component obtained by the SSTNF method are obviously closer to the theoretical results. Furthermore, the results obtained by the acceleration sensor are always slightly smaller than the theoretical analysis results of the same order. We can investigate the main reason from the acceleration sensor’s mass. As the acceleration sensor with weight of 172 g each was installed on the test component, the distribution mass of the component increased, but its stiffness remained unchanged. This leads to a decrease in the analyzed results by acceleration signals. Although the error is small, it is obvious that the introduced method (SSTNF) in this paper is better.
Natural frequency results from different methods.
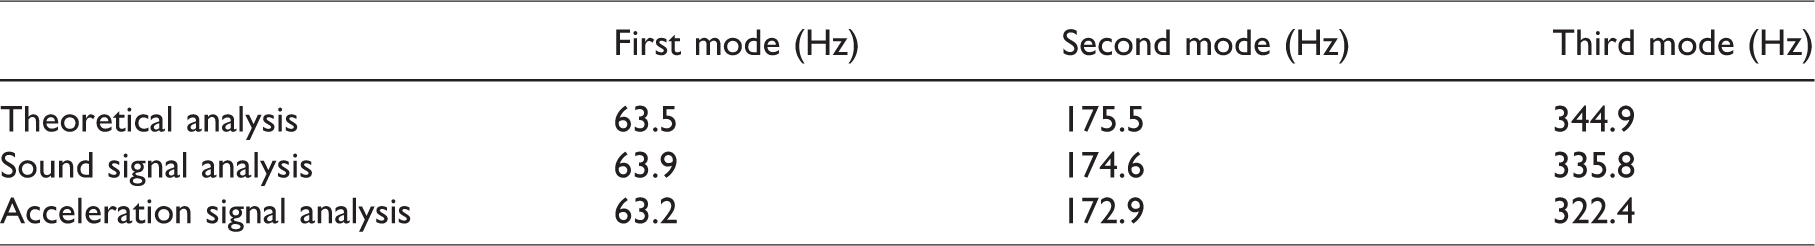
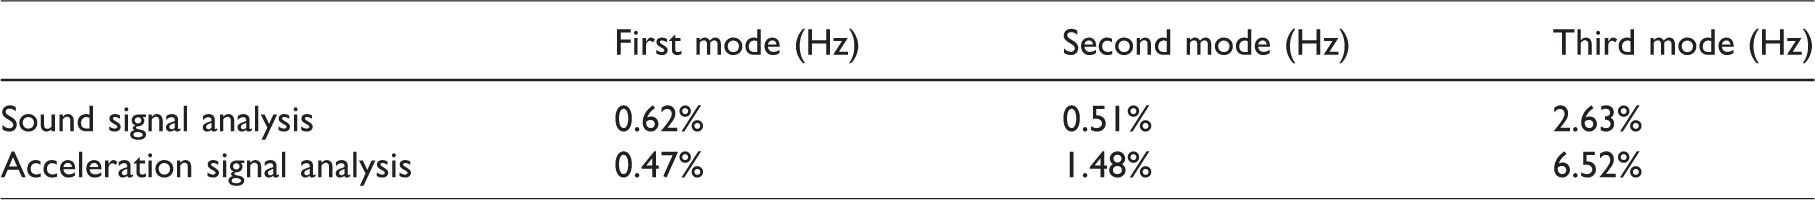
Table 6 tabulates the relative errors of the two test methods based on the theoretical analysis results. The relative error of the first three-order natural frequencies obtained by the SSTNF method stays less than 3%, but the maximum relative error from the acceleration signal passed over 5%. Additionally, the sampling time required by the SSTNF method was usually only less than one-third of the acceleration signal method for its high sampling frequency, which shows the advantage on test speed of the introduced method.
Relative errors of the two test methods.
In summary, the SSTNF method is a new strategy for the natural frequency analysis of steel component. This method has a unique cost advantage, and the accuracy and test speed are substantially improved.
Conclusions
This study introduced a new strategy based on sound signals for the test of natural frequencies of the common steel components. The results show that the proposed method has good performance in testing the natural frequencies of the I-steel beam. It is suggested that the distance between the sample and the recording device of the sound signal should be smaller than 0.3 m. When the percussion position is located in the midpoint of the beam, the corresponding test result is the most accurate. By comparison, it has been shown that the results obtained by the proposed method only have slight deviations compared with the values obtained by the numerical method and the traditional modal test method. The proposed method is economical, fast, and precise to test the natural frequencies of steel components. It may be a promising testing method for the natural frequencies of the common steel components. The experiment in this work was carried out in the laboratory without special sound insulation for the test environment. The test results show that the proposed method is not affected by the environment. It is very important to show whether this method is sensitive to the ambient noise impacts or not, which means further study is necessary.
Footnotes
Declaration of conflicting interests
The author(s) declared no potential conflicts of interest with respect to the research, authorship, and/or publication of this article.
Funding
The author(s) disclosed receipt of the following financial support for the research, authorship, and/or publication of this article: This work is supported by the Natural Science Foundation of Guangdong Province (2015A030310168).