
Abstract
This paper investigates the decarbonization of Tabriz-City focusing on its wind power for electrification. Statistical, quantitative, comparative, and simulation-research-methods used to analyze the existing and future total energy consumption, demand, and cost in the city according to carbon-based and wind-based electricity. The Monte Carlo Simulation Method has been used to estimate the probability of the Levelized Cost of Electricity. Tabriz thermal power plant generates 1kWh electricity that costs 0.15 US$/kW without subsidies and produces 575 g.CO2/kW.h overall while it will plunge to 0.05US$/kWh producing 7 g.CO2/kWh using wind. The NPV and IRR (32%) analysis show that that investment in wind-based electricity is three times cheaper than thermal power electricity in Tabriz. It is shown that the electrification of an oil-based economy with wind-based power plants is an economical investment for the city. Besides the hub-height and rotor sweep area, the capacity factor is the most decisive in the productivity of the alternative turbines.
Keywords
Introduction
In terms of climate change and the need for sustainable growth, a significant shift in the energy landscape can be seen globally. This shift is characterized by a move toward decarbonizing energy systems and adopting RE sources. This paper deals with the feasibility of wind power as a cost-effective solution for decarbonizing Tabriz City, a city with an oil-based economy. Electrification is going to be the key action of decarbonization based on local renewable energy (RE) (Moura and de Almeida, 2010). In recent years decreasing renewable electricity costs have made it competitive with non-renewable electricity and different forms of energy should be assessed for cost-benefit assessment (Elkinton et al., 2009).
Decarbonizing oil-based economies seems to be the main challenge of achieving B2DS (Ouria et al., 2023). Minimizing the incremental trend of carbon-based energy consumption in cities is the main objective of climate change and sustainable decarbonized cities’ hazard management (IRENA, 2015; Ouria and de Almeida, 2021). The role of cities is important due to their remarkable energy consumption worldwide (EUCC, 2018; UNPA, 2019). Three-fourths of the Iranians live in cities while half of the East-Azerbaijan province lives in Tabriz city with around two million people (Statistics, 2017).
According to the Paris Agreement, most cities can be decarbonized by electrification of different energy forms based on resource-efficient renewable energies (IRENA, 2015). Following the Paris Agreement and Beyond 2 Degree Scenario, cities should be decarbonized by 2050 while their CO2 emissions have to be halved by 2030 (UNPA, 2019).
Tabriz, with its oil-based economy, is at a pivotal point in its journey toward energy transition. The transition is guided by the Beyond 2 Degree Scenario (B2DS) and sustainable urban development principles. The central question of this paper is to answer: “Can wind power be a cost-effective solution for decarbonizing Tabriz, Iran, and if so, how?”
The transition to renewable energy is full of challenges. The main concern is the economic feasibility of such a transition in a developing and oil-based economy like Tabriz. Variation in wind speed complicates this analysis and necessitates a probabilistic approach to understanding and quantifying these uncertainties.
The research will be conducted as follows:
- Data Collection: Gather historical wind speed data from Tabriz and economic data related to wind power generation.
- Modeling: Apply MCSM to calculate LCOE and use Weibull distribution for modeling wind speed variability.
- Analysis: Analyze the results to assess the cost-effectiveness of wind power in Tabriz.
- Recommendations: Based on the findings, propose strategies for implementing wind power in Tabriz
The objective of this paper is to investigate the economic feasibility of wind power in Tabriz using the MCSM for the LCOE. The Weibull distribution has been employed to model the probability density function of wind speeds, providing a comprehensive framework for uncertainty analysis. The MCSM has been used to estimate the probability of LCOE throughout the lifespan of the project (30 years) by generating (N = 10,000) random samples in MS Excel software. Then, the average of the generated random distributions has been compared to the computed LCOE values. Figure 1, depicts the electrification process of Tabriz City in this paper. This research employs different software tools to aid in data collection and analysis:
- Geographic Information System (GIS): Used to create topographic maps of Tabriz.
- Grasshopper plug-in for Rhinoceros: Utilized for modeling wind velocity and directions at different levels.
- Microsoft Excel: Used for data organization, analysis, simulation, and visualization.
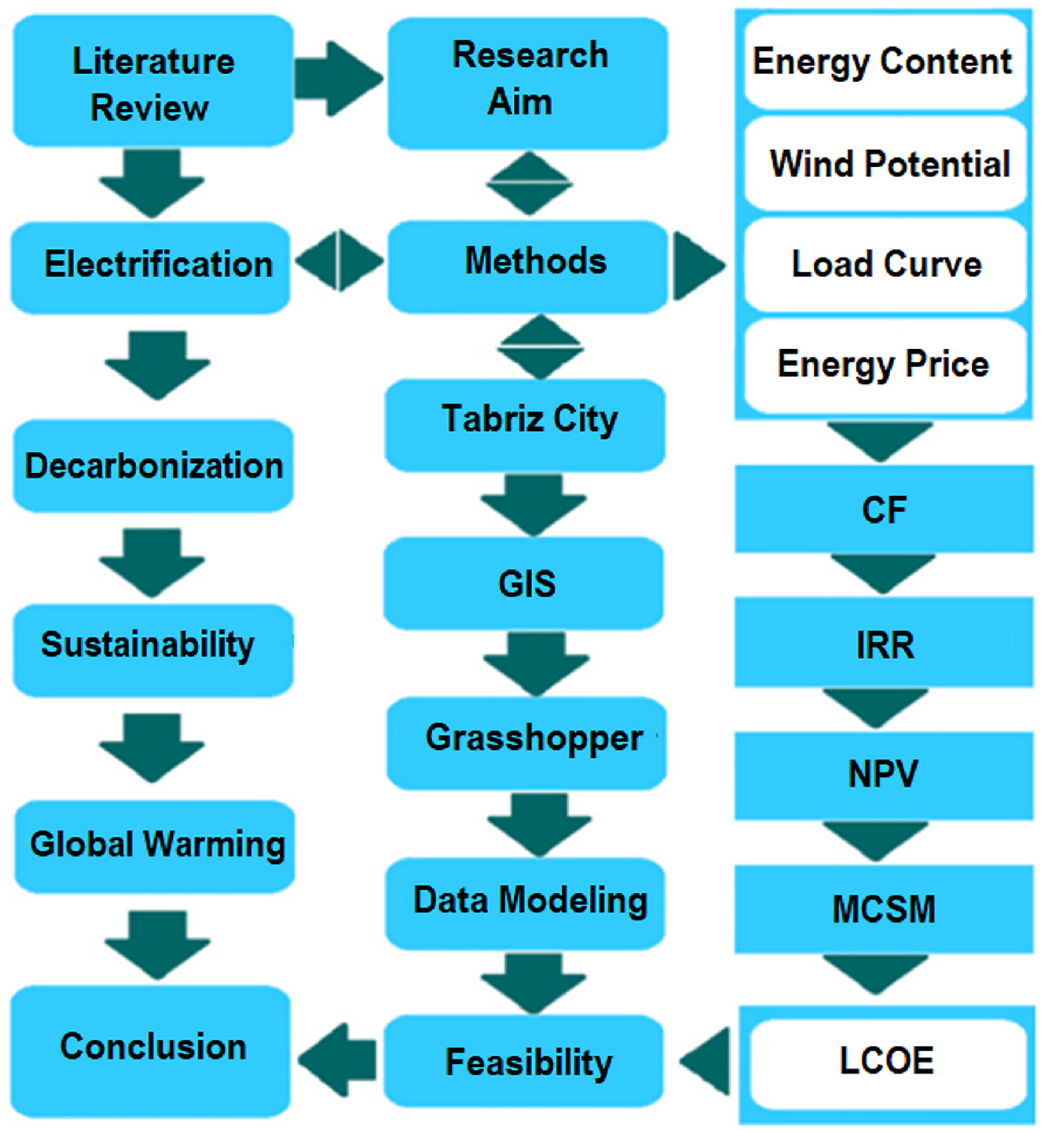
Electrification process.
Quantitative, statistical, and comparative research methods were used to estimate annual energy demand, conversion efficiency, and primary, and final exergy according to the fossil fuel-based (diesel) and REs. Next, the wind potential of the city was simulated using MS Excel and ArcMap while the results were validated by the Grasshopper plug-in-Rhino simulator. Geographical information system (GIS) data is used to analyze the topology of the city that reflects the height differences of different points in the city.
Regarding the literature review, there is remarkable wind potential in Iran while the cost-effectiveness of wind electricity needs to be investigated in detail. Therefore, this paper tries to fill this gap by focusing on wind electricity cost and its cost-effectiveness in Iran-Tabriz. The cost-effectiveness causes policymakers to think about green alternatives rather than fossil fuel ones.
In terms of the feasibility assessment, five models of commercial wind turbines of the same manufacturer were analyzed to select the optimal turbine that supplies maximum energy regarding environmental and economic issues. Tabriz city demands a remarkable amount of electricity that is supplied by fossil fuel-based power plants.
The existing energy demand of the city is estimated using the library methods based on the data published by the energy and statistics department, and the official news agency of IRI. The energy consumption, price, and incremental statistics were analyzed to estimate the energy content of fossil fuels, the density of available wind energy, and production costs.
The effective parameters that impact the wind power generation costs are (i) capital costs, (ii) capacity factor, and (iii) O&M costs (Gonzalez et al., 2014; Khraiwish Dalabeeh, 2017). Regarding renewable energy resources, the wind energy budgets of the city were simulated using Grasshopper plug-in-Rhino simulation software. Considering the optimal selection of wind turbine hub height and model, five commercial turbines were evaluated regarding their capacity factor, hub height, power production rate, each kWh energy production price, and NPV. Some of the relevant related studies that have been reviewed are presented in Table 1 as follows,
Selected literature review.
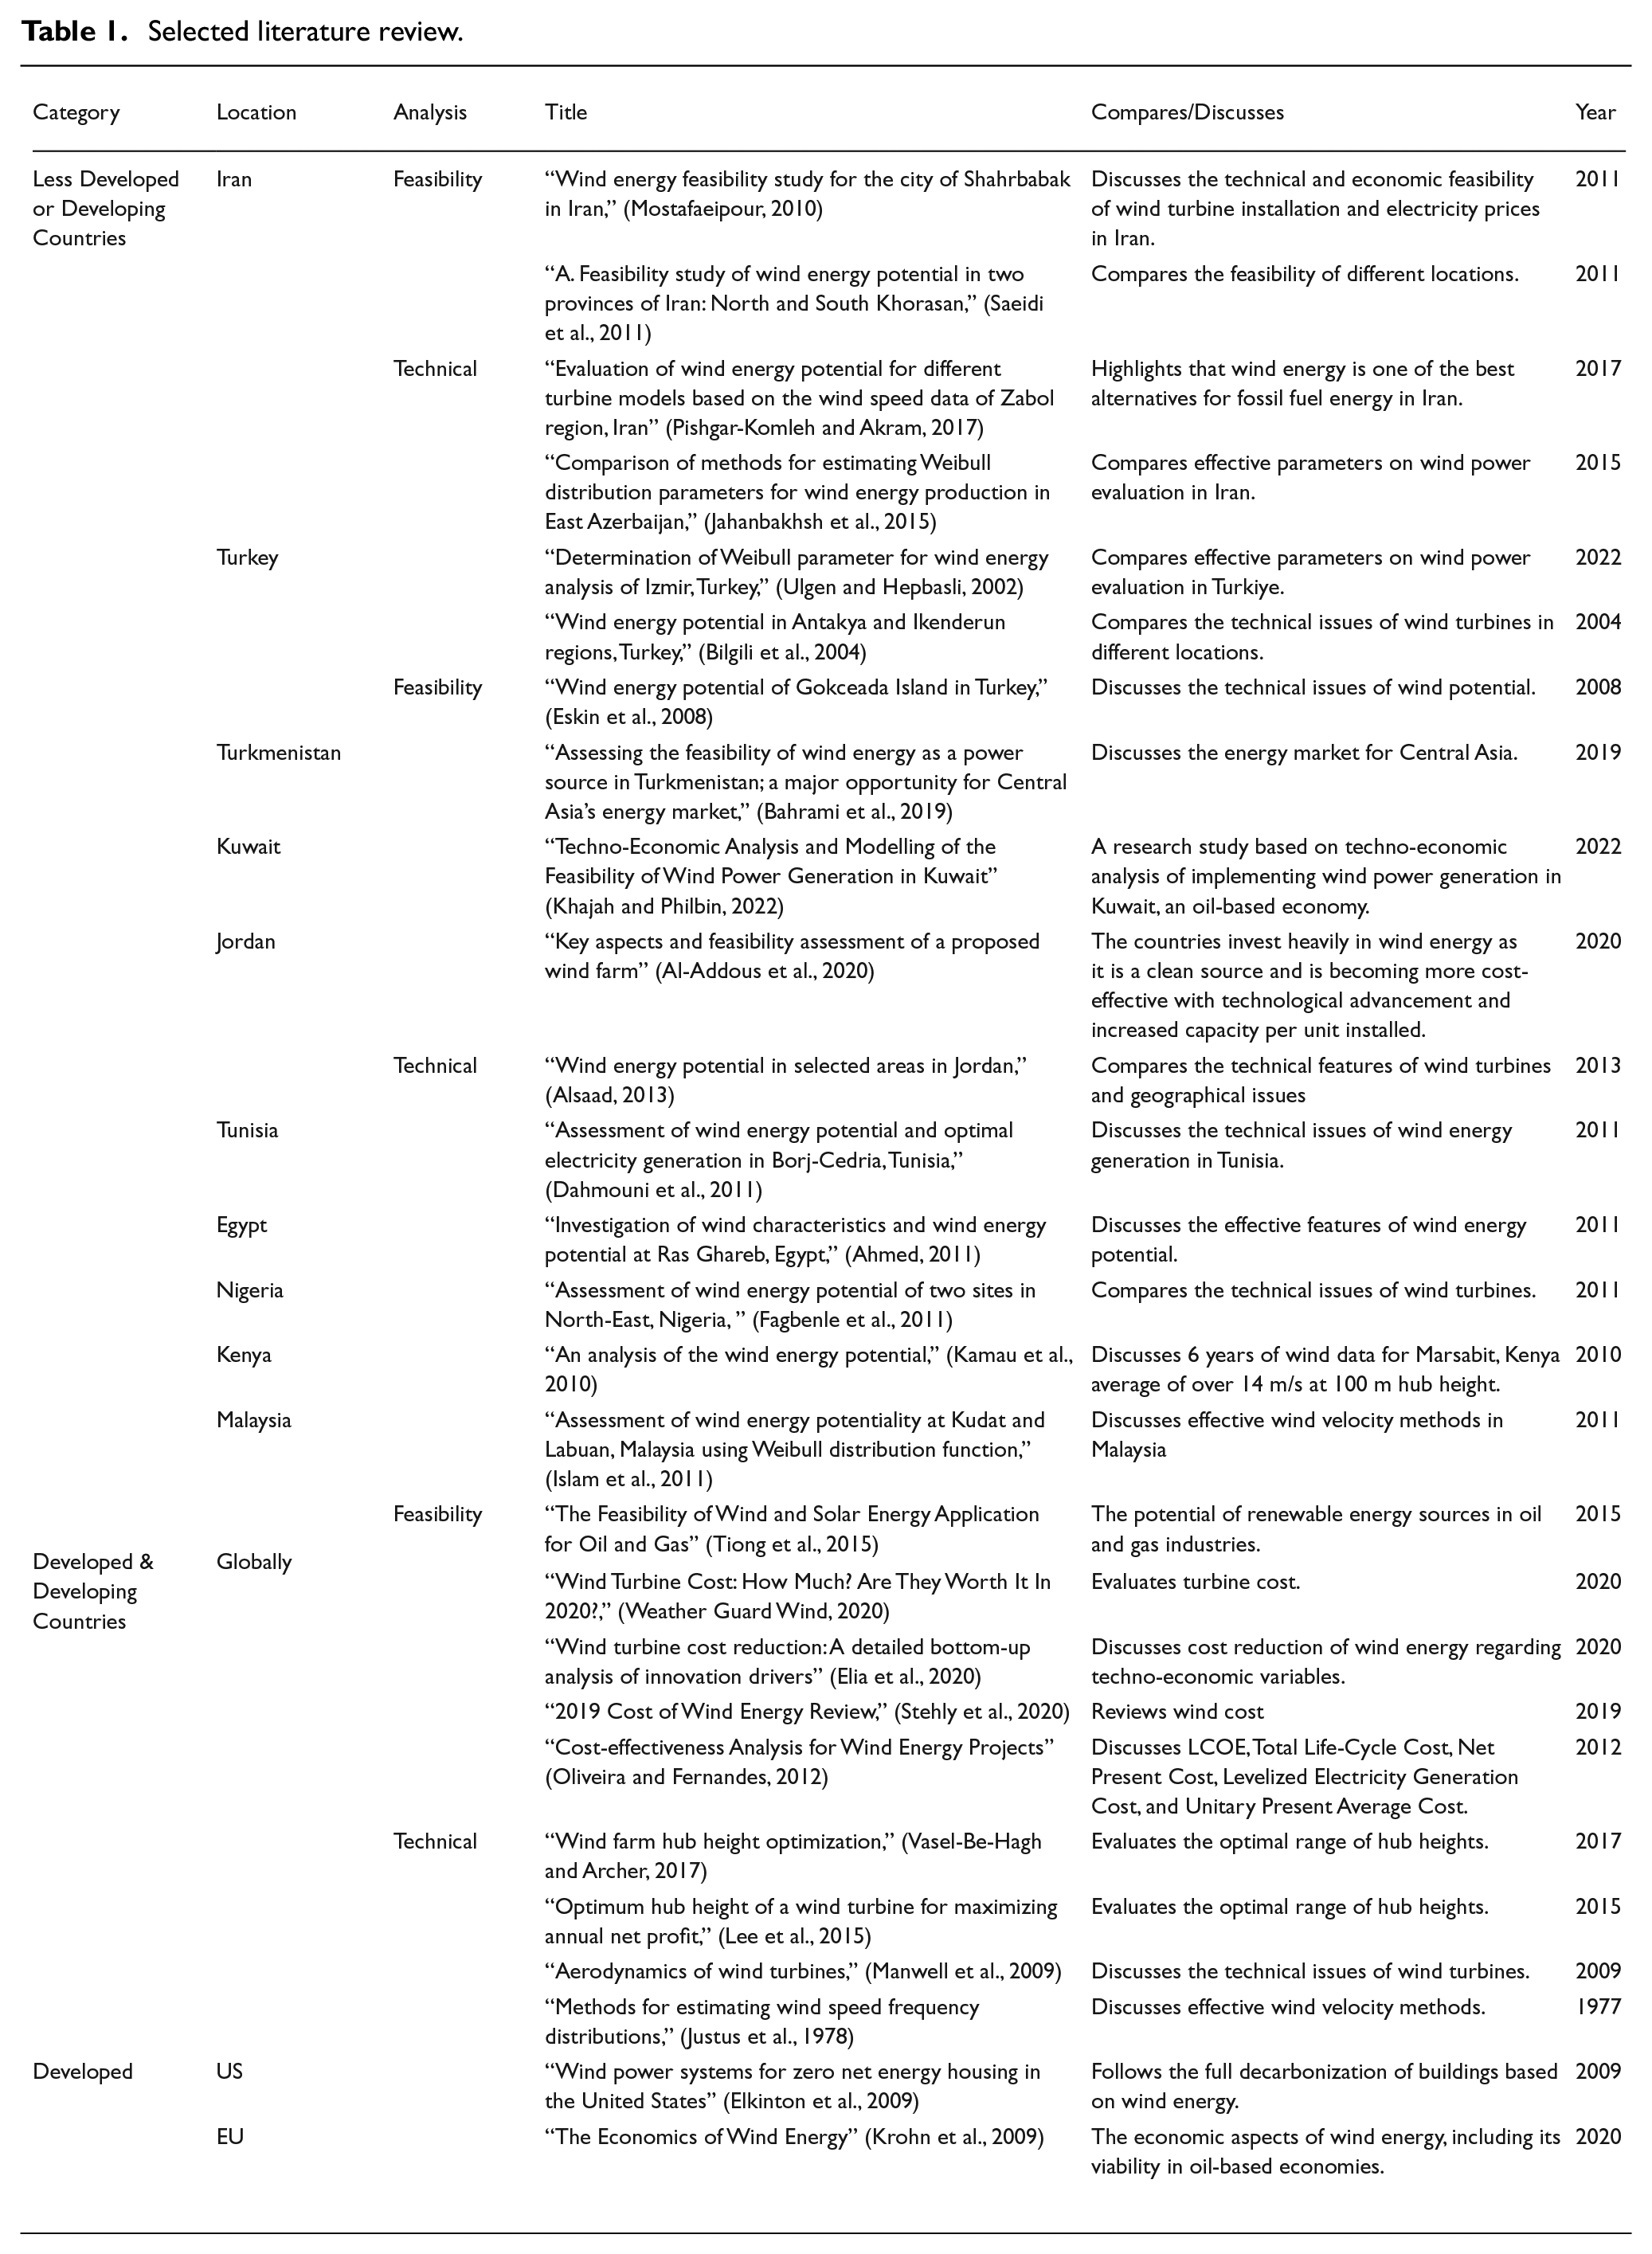
A brief review of the literature discloses that LCOE, NPV, and IRR are important factors regarding the cost-effectiveness of wind electricity used in this analysis (Elia et al., 2020; Mostafaeipour et al., 2011; Oliveira and Fernandes, 2012). In terms of wind power generation and its feasibility, it is essential to analyze the ideal and available local wind power resources. Therefore, some studies have been reviewed from Iran (Jahanbakhsh et al., 2015; Mostafaeipour, 2010; Pishgar-Komleh and Akram, 2017), Turkey (Ulgen and Hepbasli, 2002), Egypt (Ahmed, 2011), Nigeria, and Jordan (Alsaad, 2013). The common feature of the reviewed papers was that the maximum height of investigated turbines was 40 m and the average wind speeds at 10 m level were less than 4.5 m/s.
Methods and materials
Site details
The East Azerbaijan province with an area of 45,500 km2 is one of the most important provinces in Northwest Iran (Figure 2). The East Azerbaijan province presents different seasonal winds and the wind is one of the reliable resources in this region. The city with around two million people consists of 45% of the East-Azerbaijan state’s population (Ouria, 2019a). The city is located at latitude 38°5′N and longitude 46°16′E. Its climate is classified as (BSk) by Köppen and Geiger (Ouria, 2019b), with hot dry summers and harsh winters. The city’s altitude is between 1317 and 1856 m above sea level.
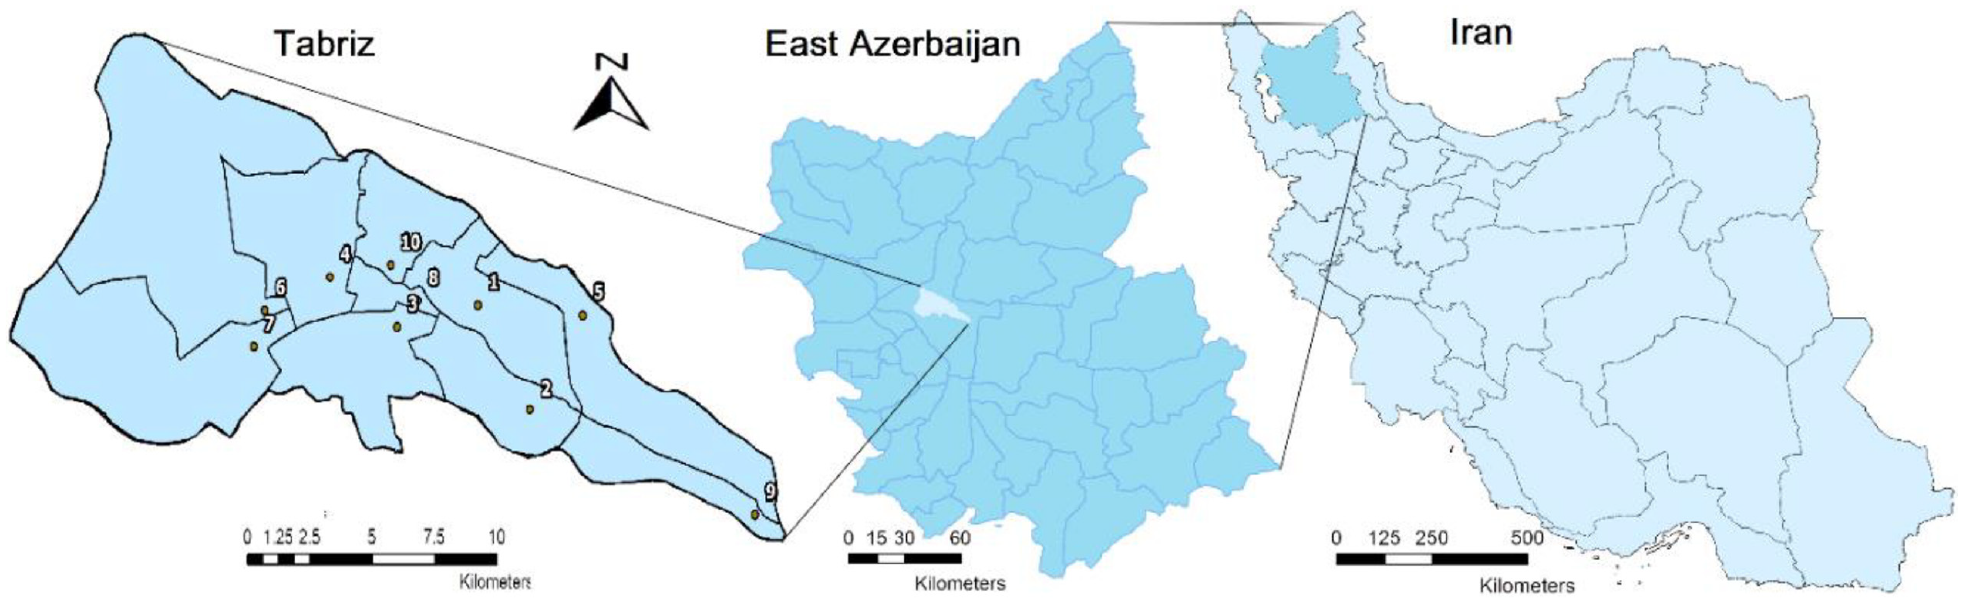
Location of the case study.
There already exist three wind turbines with 40 m hub height and a capacity of 1.98 MW in the Eynali-site of Tabriz City (Figure 3). However, primary analysis showed that there can be higher wind potential in this site, which should be promoted. The wind data including speeds and directions between 2004 and 2018 was collected from the Tabriz International Airport meteorological station (Climate One Buildings, 2021).
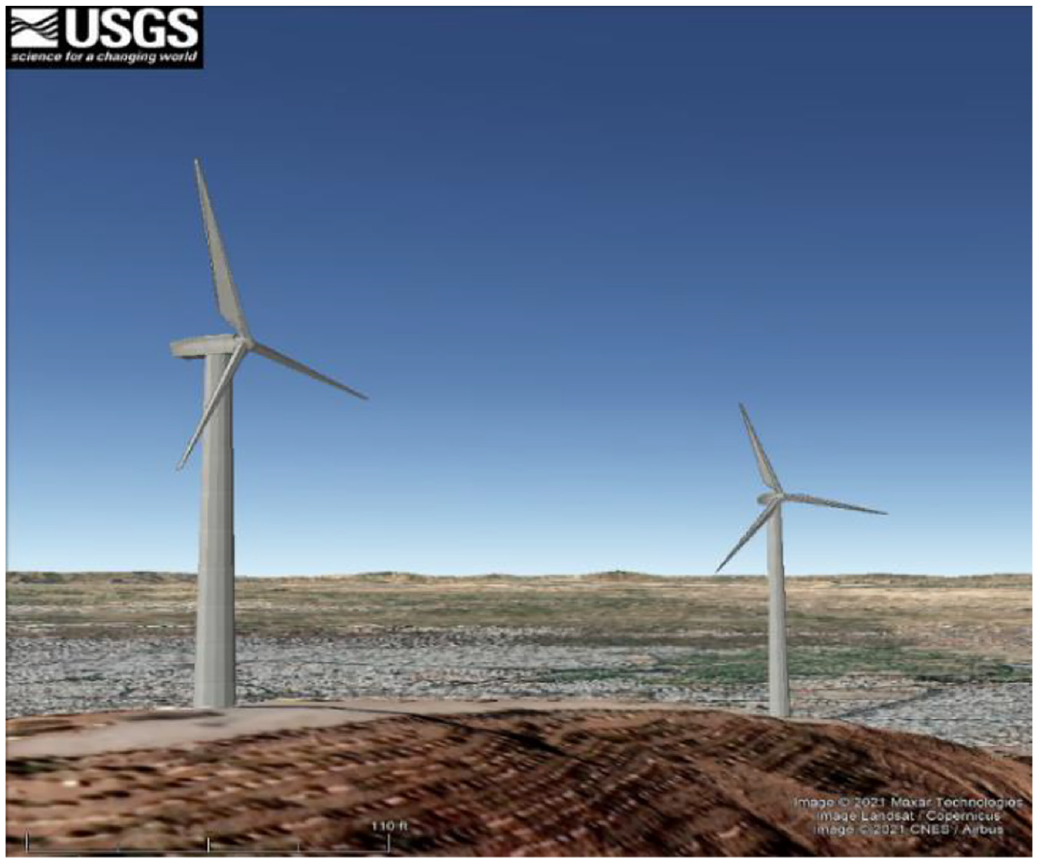
Location of wind turbines in Eynali site of Tabriz City (USGS, 2021).
At the Tabriz station, data are measured with hourly data through 2021 using the TMY/ISO 15927-4:2005 methodologies (Climate One Buildings, 2021). There is a remarkable change in wind power density to changes in height.
According to the data collected at the meteorological station of Tabriz international airport, the average wind speed is maximum in July while the minimum rate has been recorded in January (Figure 4).
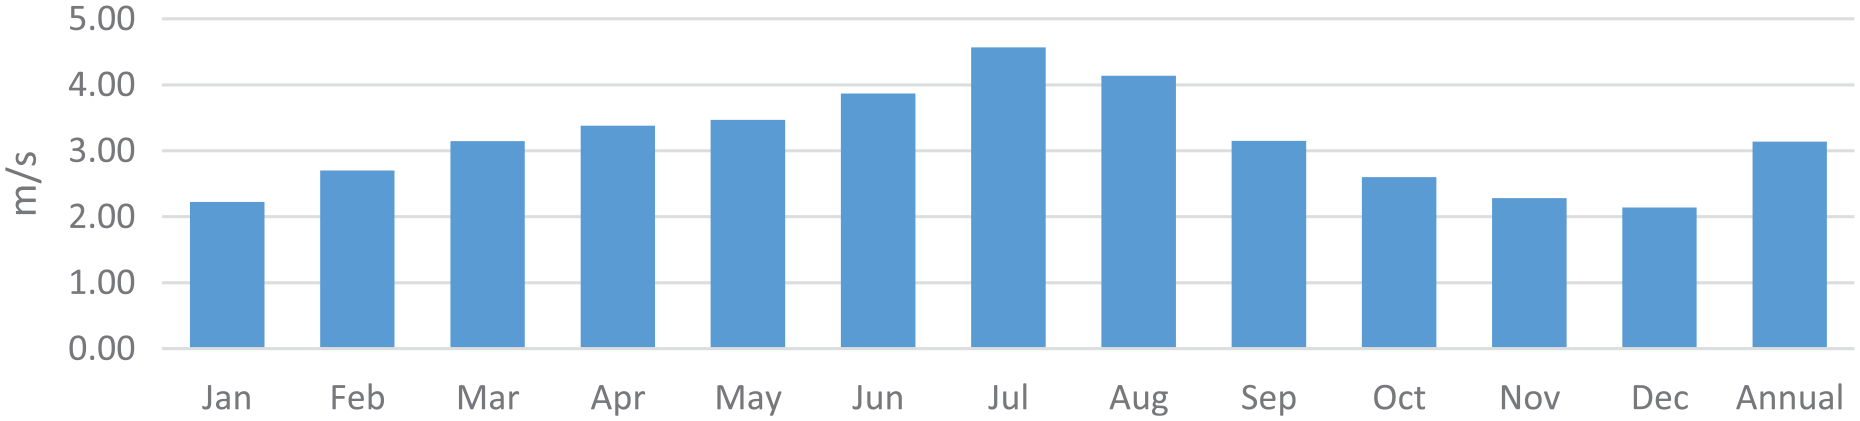
Monthly means of wind speed at 10 m level in Tabriz City, 2007–2021 (Climate One Buildings, 2021).
Energy consumption
According to Ouria and de Almeida (2021)“The city and vicinities consume 6538 GWh/year of electrical energy, of which 9% of this amount are distribution losses or illegal users (non-commercial losses). The buildings and urban users (residential, public, and street lighting) with 50% of the electricity consumption demand the highest consumption. Two percent of electricity spent on Public Street lighting annually equals the cement industry. Buildings and industries consume most of the electricity (Figure 5) (Ouria and de Almeida, 2021).
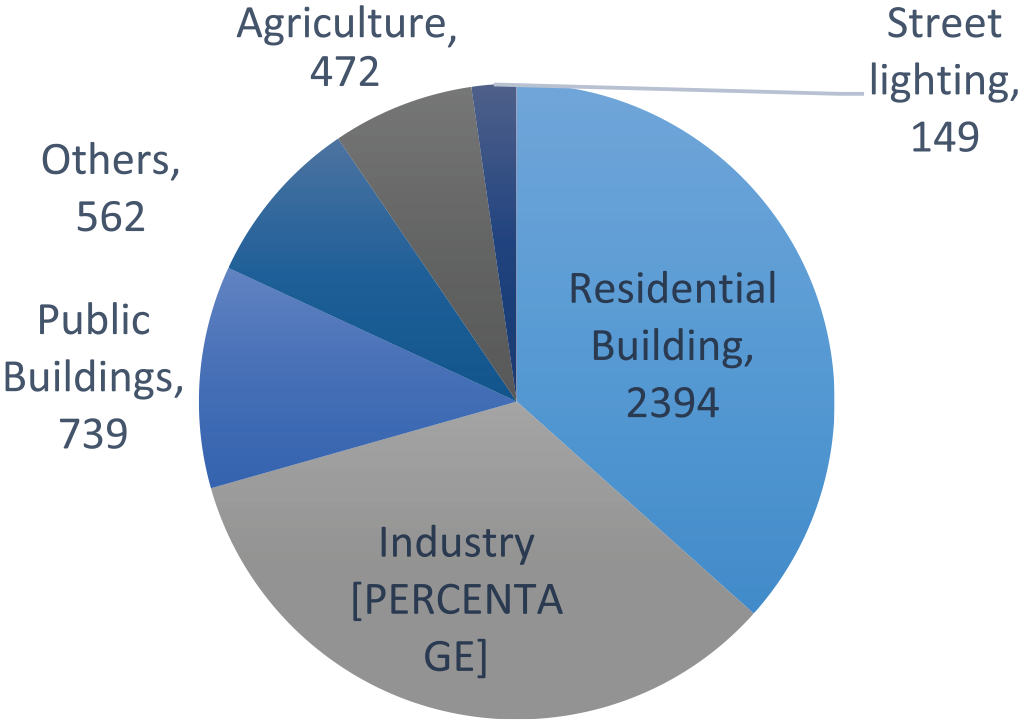
The annual electricity consumption of the Tabriz (GWh/y).
“The city consumes 58,050 GWh/year of different fossil fuel-based resources that only produced 20,110 GWh/year of useful work with 5.63 MT CO2 emissions, while the same work could locally be supplied by 30,000 GWh/year generated by RE with a much reduced 0.27 MT CO2 emissions” (Ouria and de Almeida, 2021). There has been an annual 6% increment in the electricity consumption rate in the city in the period of 20 years.
Production costs of energy
In this paper, the production cost of energy is estimated regarding different parameters such as;
- Resources type (wind, diesel, or NG).
- Direct materials or Capital costs
- Transportation, transmission & distribution.
- Labor, operation & maintenance.
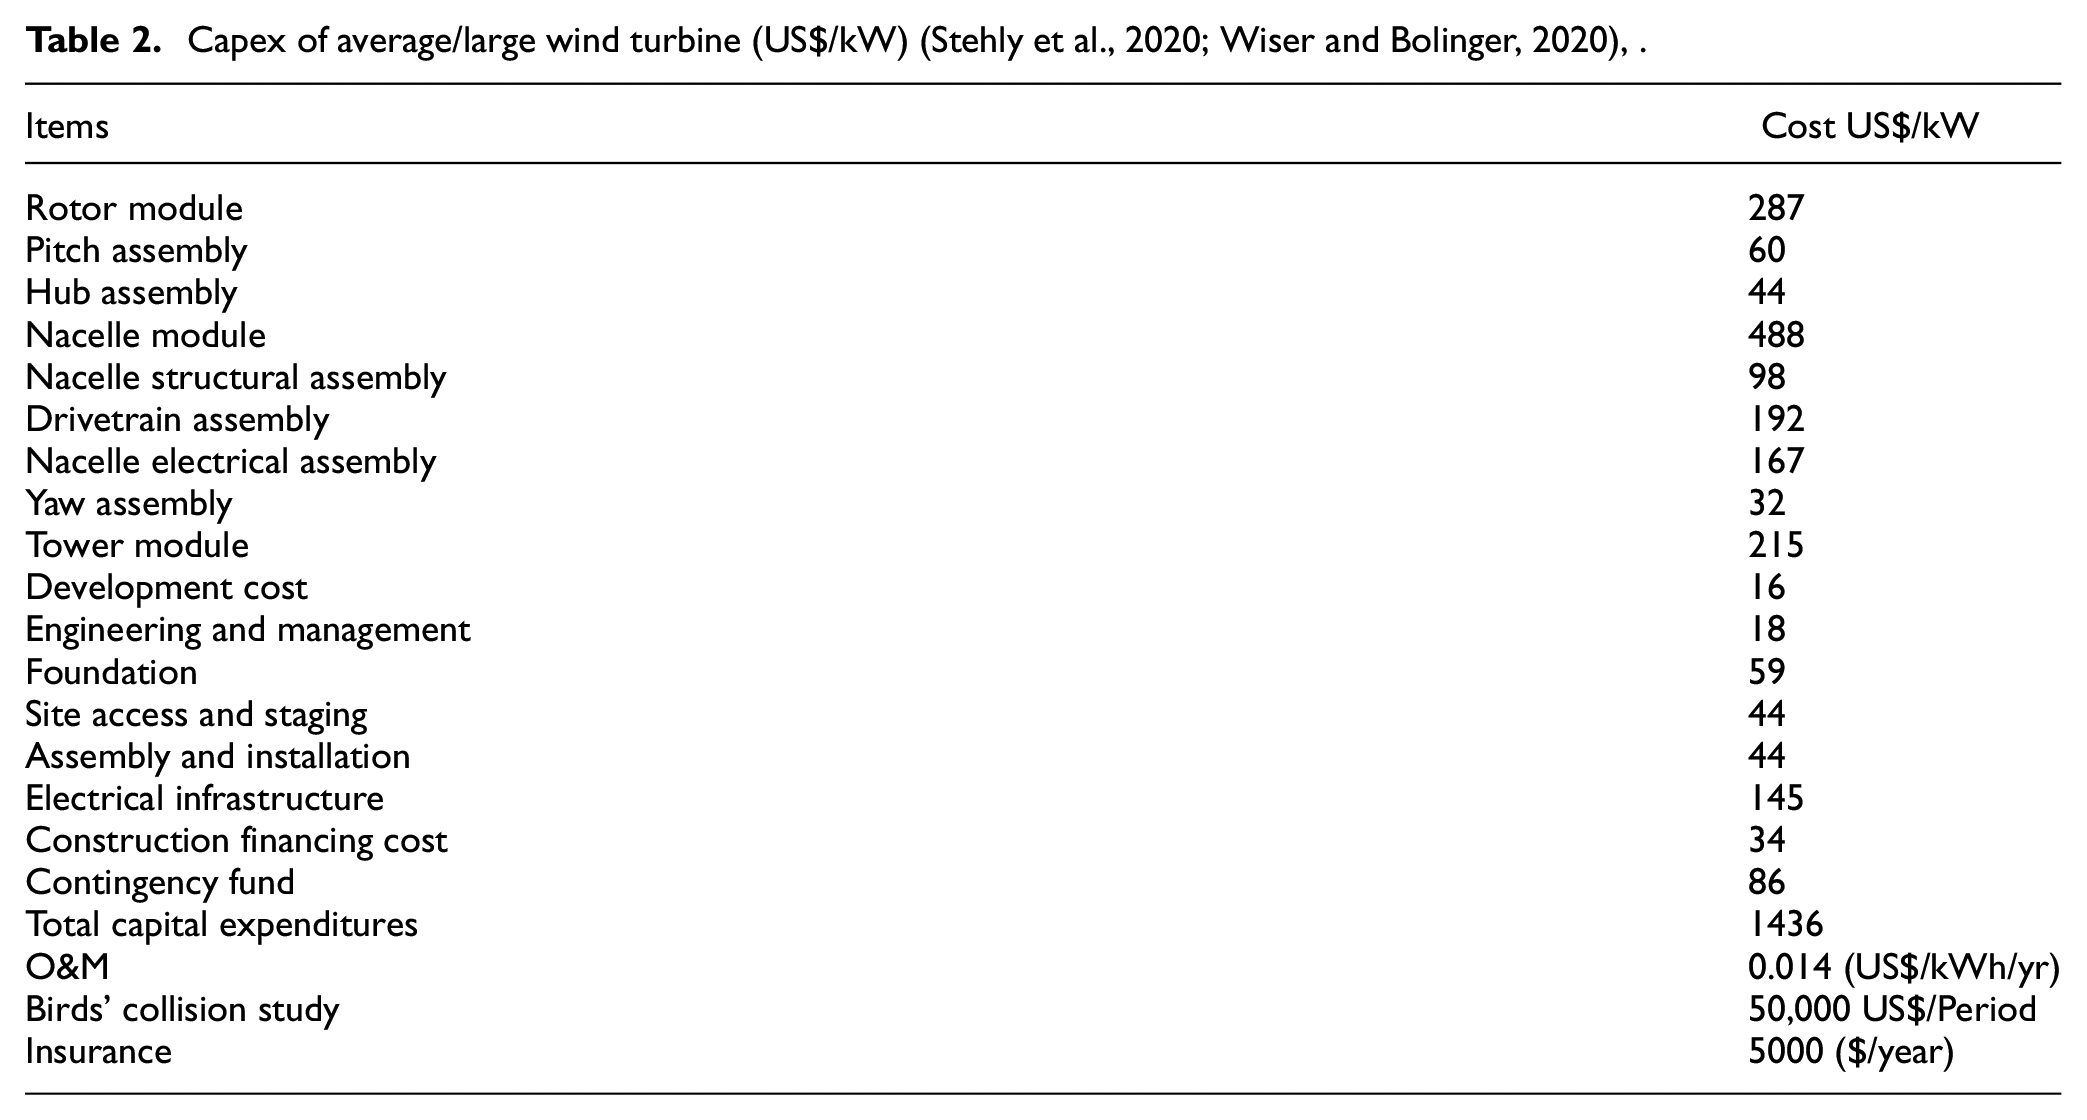
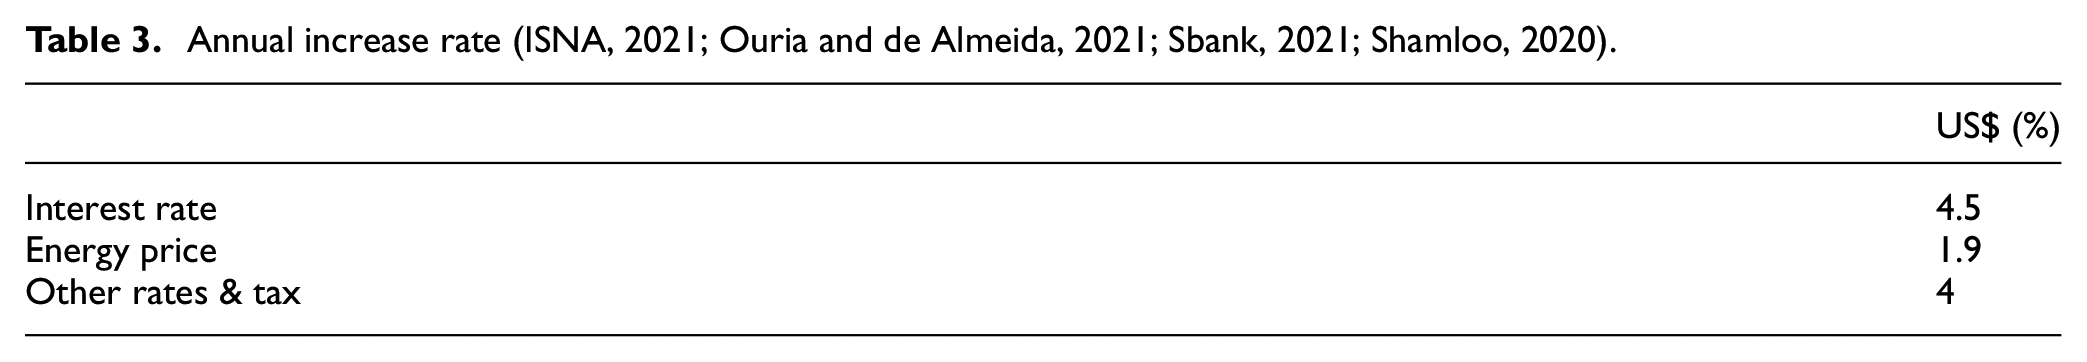
Regarding the Net Present Value (NPV) and cash flow of different alternatives, the real production cost of NG/diesel-based electricity should be estimated for each kWh of electricity without governmental subsidy. So, the average FOB price of fuels and pipeline transportation costs is considered in this regard. On the other hand, the total capital expenditure for each kWh is estimated for wind power regarding (Tables 2 and 3).
Capex of average/large wind turbine (US$/kW) (Stehly et al., 2020; Wiser and Bolinger, 2020), .
Annual increase rate (ISNA, 2021; Ouria and de Almeida, 2021; Sbank, 2021; Shamloo, 2020).
Optimal site and turbine selection
The topological analysis of the site is essential to optimal site selection. Geographical information systems (GIS) data are effective in this regard. Therefore, the topographical map of Tabriz city has been estimated using ArcMap 10.5 software.
The rotor diameter has a direct relation with turbine output power (Manwell et al., 2009). Therefore, maximizing the rotor diameter was investigated.
There is a direct relation between hub height and the energy output of wind turbines. On the other hand, the cost of larger turbines should be optimized regarding hub height maximum available power, and minimum financial investment.
In general, the mean horizontal wind speed profile shows the relationship between height (z) and wind speed (u) for contrasting surfaces. Also, (A) is used for area as follows (Donnou et al., 2019),

And,

Where,
Weibull distribution
There are different probability distribution functions (PDF) to analyze wind data but it has been shown that the Weibull function describes the prevailing wind profile features more accurately (Fagbenle et al., 2011; Kwon, 2010). Therefore, the Weibull probability distribution has been used in this paper regarding its accuracy.
In terms of computation of the Weibull probability distribution, estimation of scale factor (k) and shape factor (c) is essential (Islam et al., 2011; Justus et al., 1978). Among the variety of estimation methods to compute the Weibull parameters, the standard deviation method has been used to estimate (k) and (c) as follows,

and

Also,

and

Where,

Where (σ) is the Standard deviation (STDEV), (Vavg) shows average wind velocity (m/s), and (Г) represents the Gamma function presented as follows (Islam et al., 2011; Pishgar-Komleh and Akram, 2017),

The variables of this equation are the wind speed (Vi), the number of wind speeds (n), and all complex numbers with positive states except non-positive integers (t) (Pishgar-Komleh and Akram, 2017).
Probability density function (PDF)
PDF is one of the most prevailing methods to estimate the time fraction by analyzing wind speed distribution. Therefore, the Weibull PDF is presented as follows (Dahmouni et al., 2011; Islam et al., 2011; Kwon, 2010; Pishgar-Komleh and Akram, 2017),

Where the probability of the recorded wind speed (Vi) is presented by the f (V), the shape factor (k) is dimensionless, and the scale factor (c) is assumed to be more than one (1 < c). Also, the Cumulative Probability Function (CDF) based on the Weibull distribution is presented by F (V) as follows (Dahmouni et al., 2011; Kamau et al., 2010),

Equation (4) has been used to calculate the PDF of Weibull based on the (k) regarding equation (1). Regarding the frequency of zero wind speeds, standard Weibull distribution has been used without any modification in Ladybug-plug-in-Rhinoceros. Then, a Non-Linear Optimization has been used to evaluate the accuracy of the shape factor (k) in MS Excel.
Wind power
Ideal wind power
There is stationary air behind the turbines that prevent converting the entire power of the wind to mechanical power (Kosky et al., 2013), but the ideal estimation of wind power is given as follows,

In reality, only a fraction of this power can be recovered (Betz limit, 0.59) (Betz, 1966). The value of converted power depends on the combined efficiency of the wind generator (aerodynamical system, alternator, mechanic transmission).
The wind power density (WPD) is important to calculate wind energy potential (WEP) at a targeted site based on the PDF values (Fagbenle et al., 2011; Keyhani et al., 2010; Pishgar-Komleh and Akram, 2017) as follows,

Where the wind power and WPD are presented by P (V) and P (V)/A that their units are (W) and (W/m2). The air density (kg/m3) is shown by (ρ) that is estimated (Saeidi et al., 2011; Wind101, 2022) as follows:

And,

Where (ρ) depends on the average air pressure (P) in Pascal, the molar mass of dry air (M) the average air temperature (T) in Kelvin, and the gas constant (R) equals (287 J. kg1.K1). Respecting the cold and dry climate of Tabriz City, the air density is assumed 1.05 kg.m3 (Ouria, 2019b). The WPD of the city can be (Eskin et al., 2008; Islam et al., 2011; Pishgar-Komleh and Akram, 2017) presented for the assumed period (h) as follows:

Capacity factor (CF)
The average ratio of delivered power to the ideal power is shown by the capacity factor (CF) (Abed and El-Mallah, 1997; Khraiwish Dalabeeh, 2017), as follows,

Where Vc is cut-in speed. Vr is rated speed.
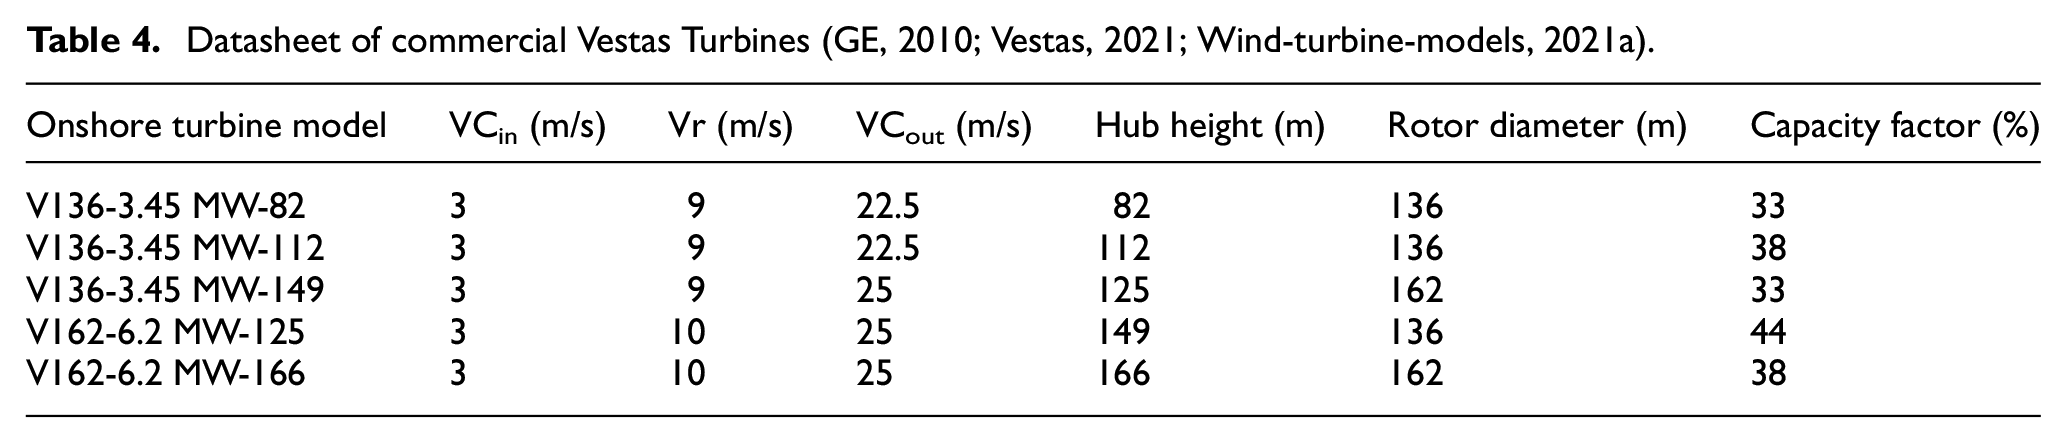
In this paper, five different turbines have been considered to estimate their capacity factor for optimal selection of turbine model according to their data (Table 4).
Datasheet of commercial Vestas Turbines (GE, 2010; Vestas, 2021; Wind-turbine-models, 2021a).
Available wind power
The average power output can be estimated by capacity factor and rated power as follows,

Estimation of the total energy produced over a specific period (t) is computed as follows,

Wind direction
Wind direction is one of the most relevant factors in the optimal orientation of wind turbines at the site and in choosing turbine type (Bilgili et al., 2004; Kamau et al., 2010; Pishgar-Komleh and Akram, 2017). The wind rose graph that illustrates the wind directions and their frequencies in the region has been used in this paper using Grasshopper-Plug-in-Rhinoceros 7.0 and MS Excel 2013.
Work, energy conversion, and price
To answer “what is the cost of producing each kWh of fossil-based electricity, it is required to compute how much NG/diesel is required to generate one kWh electricity according to the energy content of different fuels, specific heat capacity (
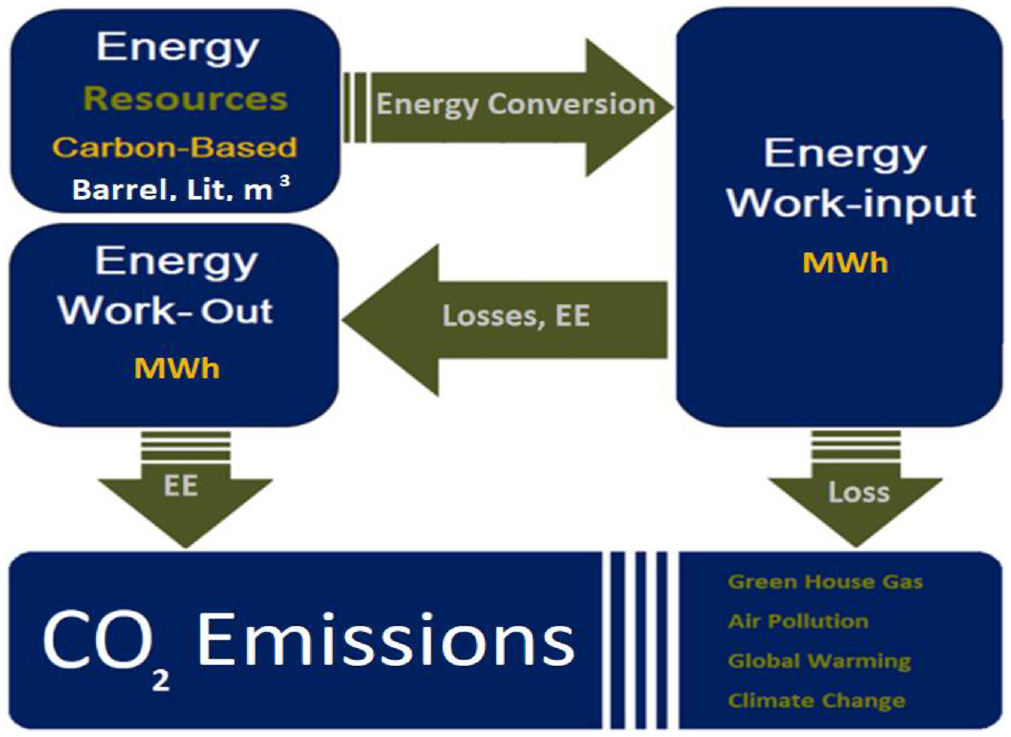
Energy-work-emissions process.
The conversion of NG/diesel onto kWh energy depends on the specific energy content in the fuel (

In terms of steam power plants, the efficiency of fuels depends on the ideal gas law that indicates a fraction of useful work done over the absorbed heat (Edwards et al., 2020; Ouria and de Almeida, 2021) as follows,

And,

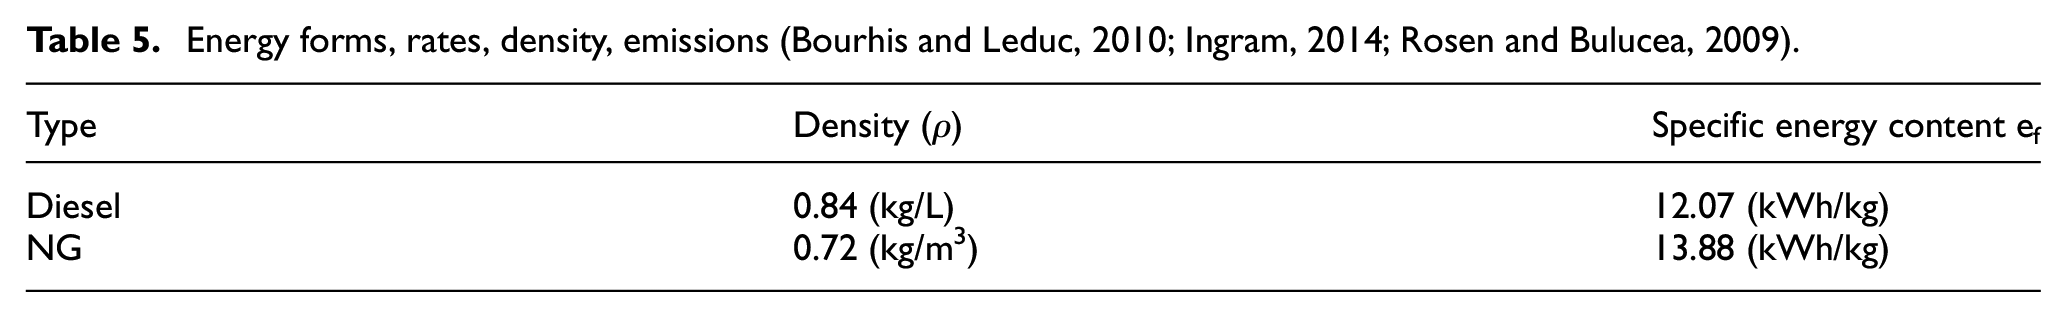
According to the Carnot cycle, the efficiency of the steam-electric power plant is 33%–48% while the efficiency of the Tabriz power plant is assumed 40%. Table 5 presents different forms of consumed fuels with their specific heat capacity, density, energy capacity (IPCC, 2020), and efficiency as follows,
Energy forms, rates, density, emissions (Bourhis and Leduc, 2010; Ingram, 2014; Rosen and Bulucea, 2009).
Feasibility assessment
Estimation of NPV and IRR are the essential factors in the feasibility assessment of the project.


The final cost of wind energy depends on the capacity factor of the wind turbine (CF), production amount (M), discount rate (r), initial investment (Co), operation & maintenance cost (Co&m), and labor cost (C labor) as follows,

The total cost of wind power farms is mainly based on net investment (equipment, installation, interest rate), maintenance, and operation costs. Tower and installation cost more than 84% of total installation (IRENA, 2012) while the total capital expenditures for wind energy is 1436 $US/kW (Stehly et al., 2020; Wiser and Bolinger, 2020). Also, operation and maintenance costs are considered as an additional US$ 0.014/kWh per year (Table 2) (Eia.gov, 2021; Steffen et al., 2020; Stehly et al., 2020; Weather Guard Wind, 2020),.
Also, it is required to estimate the actual production cost of NG/Diesel-based electricity. The cost of fossil fuel-based electricity depends on the FOB price of fuel (CFOB), transportation cost (Ctr), the refining cost Cref, and insurance cost (Cins) as follows:

According to data given in Figure 7, the average oil FOB Iran Abbas-Port price is $63.59 per barrel or $ 0.4 per liter (Opap, 2021; Parstoday, 2021). On average, a barrel of oil costs US$5.00 ($ 0.03 per liter) to be transferred by pipeline (Green, 2021). Approximately, 30% of electricity cost is assumed for the generation cost of the power plant.
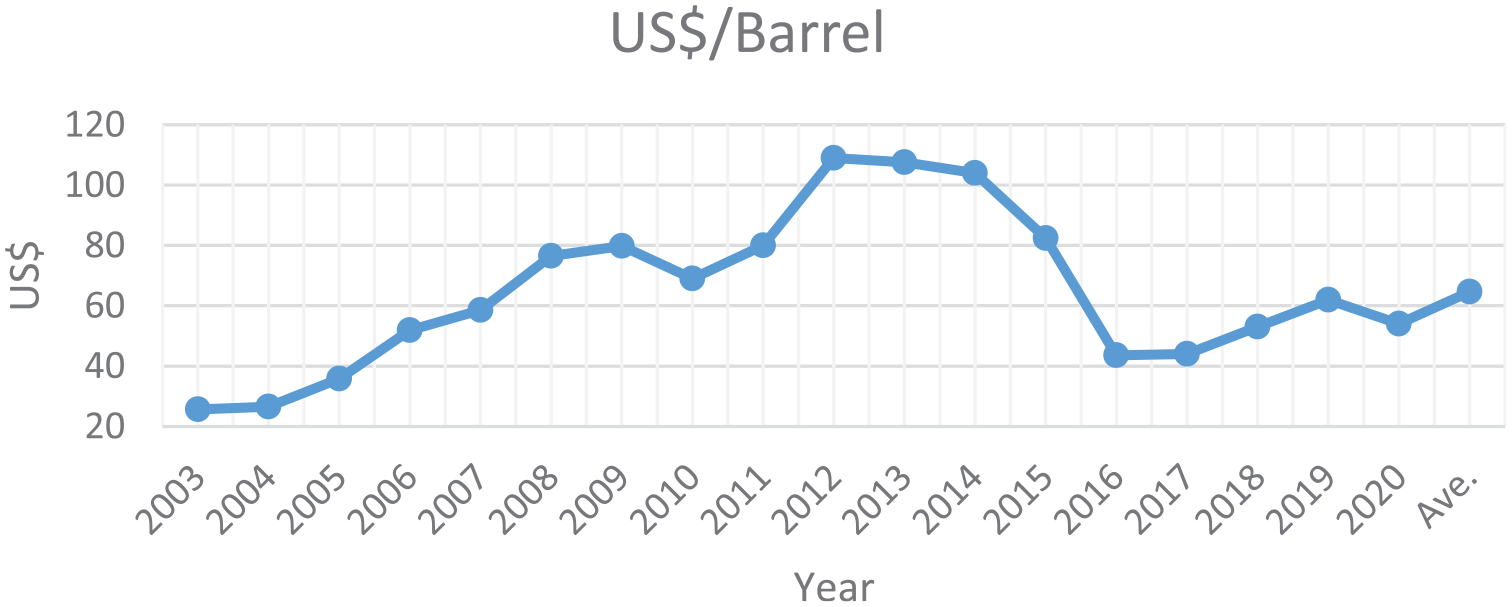
Annual Iran oil price (2003–2020) (TJN, 2022).
LCOE(Wind) and Monte Carlo simulation method
The annual production rate (M) and capital recovery factor (CFR) are decisive in estimating the Levelized Cost of Energy (LCOE).


The Monte Carlo Simulation Method (MCSM) has been used to estimate the probability of LCOE over the lifespan of the project (30 years) by generating (N = 10,000) random samples in MS Excel software. Then, the average of the generated random values has been compared to the computed rate of LCOE.
Results of the analysis
Results of site analysis
The topology of the city has been presented using ArcMap 10.5. According to the results of the topology analysis of the city, the South-Eastern and Northern mountains of Tabriz City are around 500 m higher than other parts of the city (Figure 8). Unconstrained wind flow is available due to minimal urban barriers in these sections. So, these parts that have higher potential have been assumed for the installation of wind turbines (Figure 8).
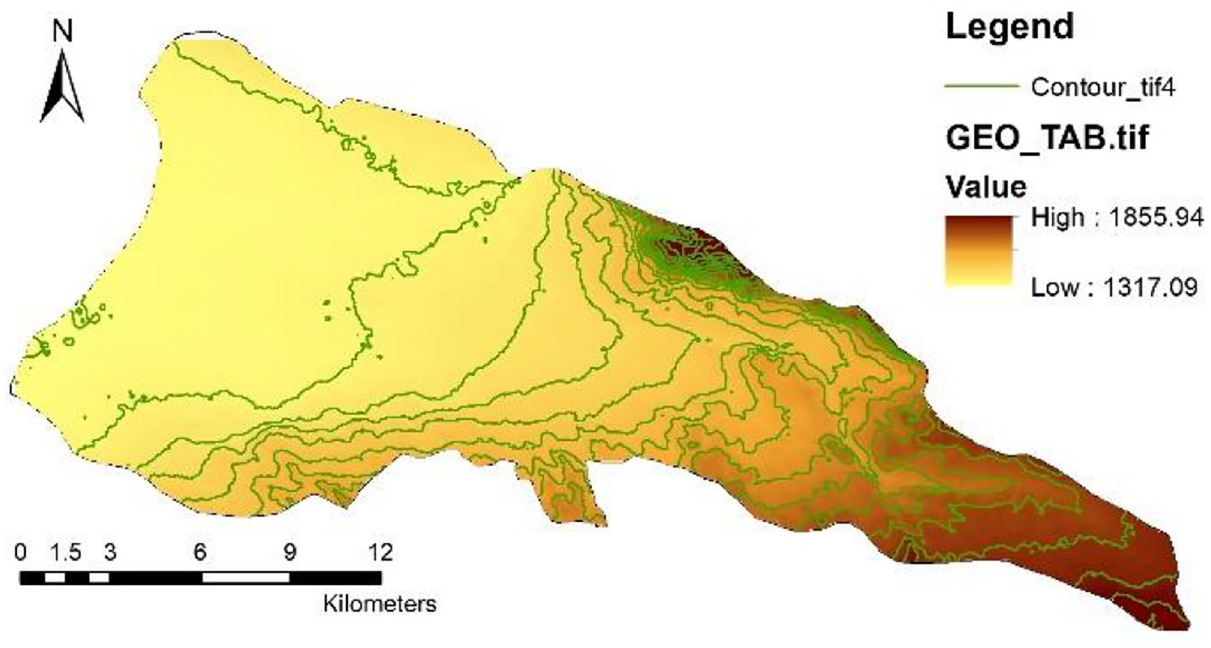
The topology of Tabriz City.
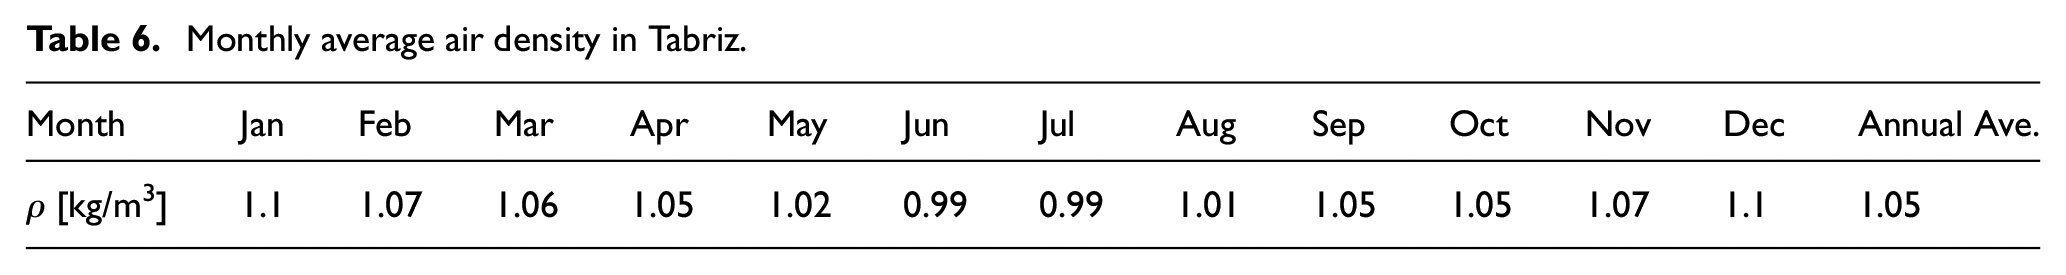
According to the air density analysis, the density has an indirect relation with temperature and height. In Tabriz, the maximum amount of air density can be detected in December and January (1.17) while it reduces to 0.96 in July at ground level. On average, the air density of the city has been assumed as 1.05 kg/m3 (Figure 9 and Table 6).
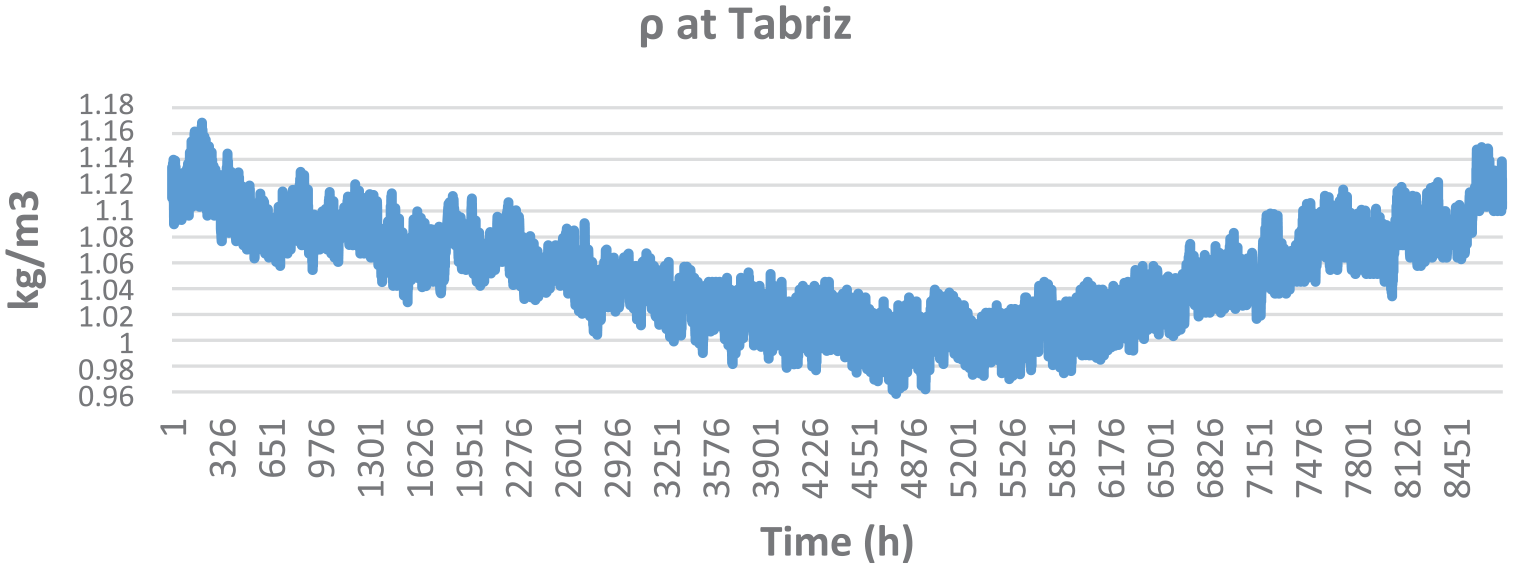
Air density in Tabriz.
Monthly average air density in Tabriz.
The wind speed and profile analysis have been done in the Grasshopper plug-in-Rhino simulator. Figure 10 Illustrates the annual mean wind speed at different horizons. The log wind profile of the data has been presented in Figure 10. It is shown in the figure that there is a direct relation between hub height and available wind velocity. Regarding the shape and scale factors of the case study terrain, the annual mean wind speed of different hub heights simulated for city terrain is as follows,
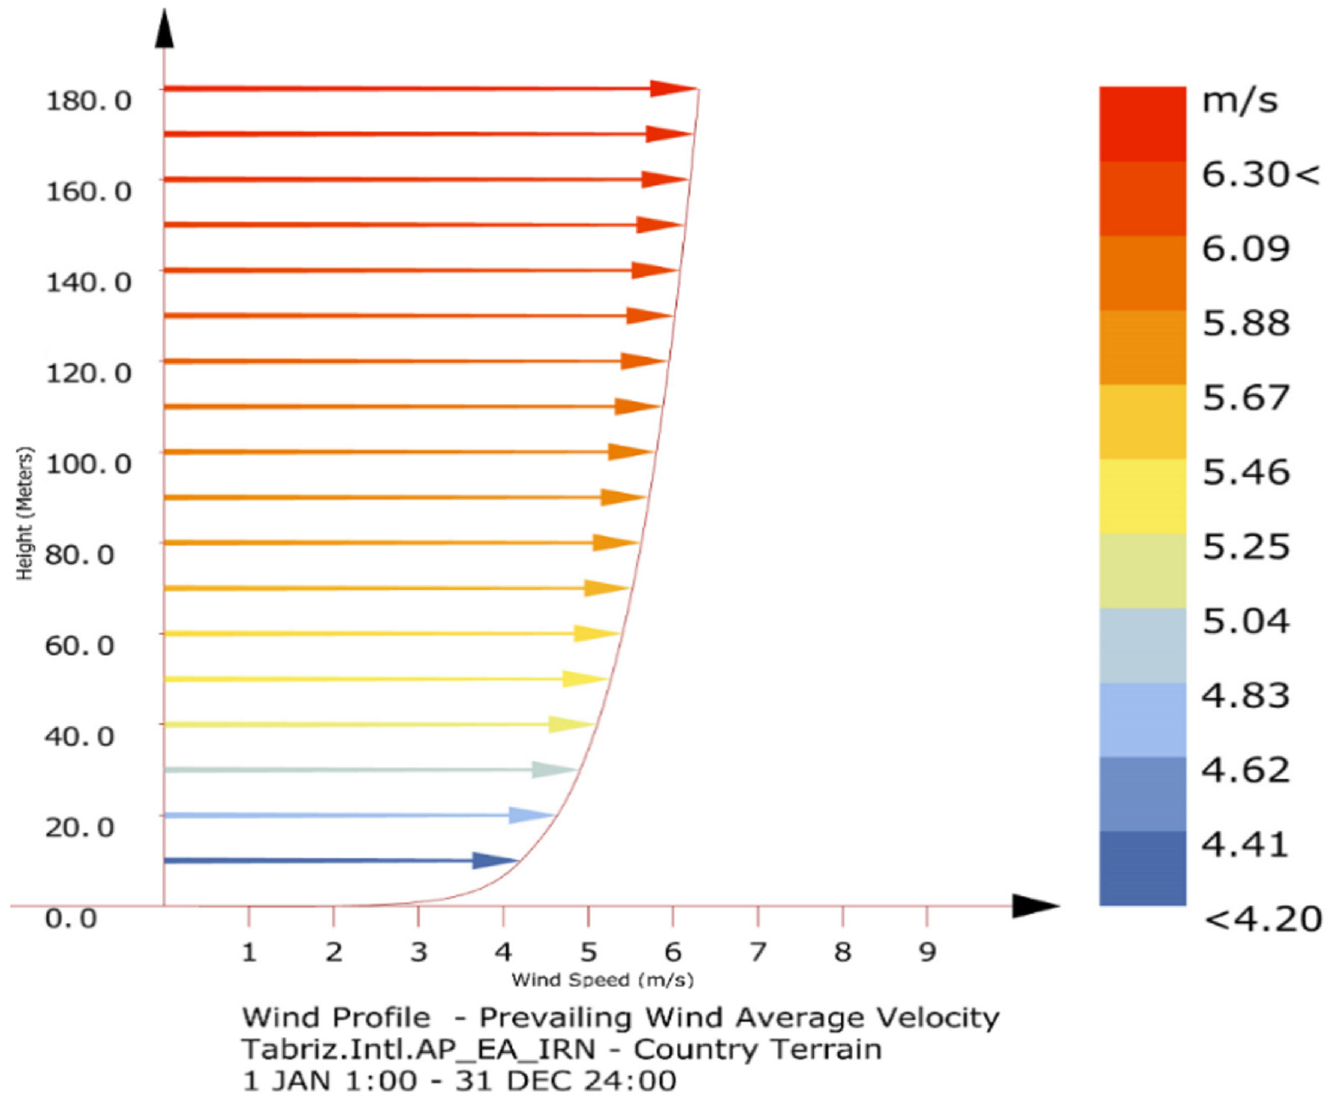
Annual wind profile velocity at different hub heights.
Regarding the cut-in and cut-out velocity range of wind turbines (25 ≥V ≥ 3), the frequency of available windy hours has been evaluated based on applied conditional selection (Figure 11). It illustrates that 59% of 8760 (annual hours) located under the applied condition which is fundamentally decisive in final output energy estimation (Figure 11).
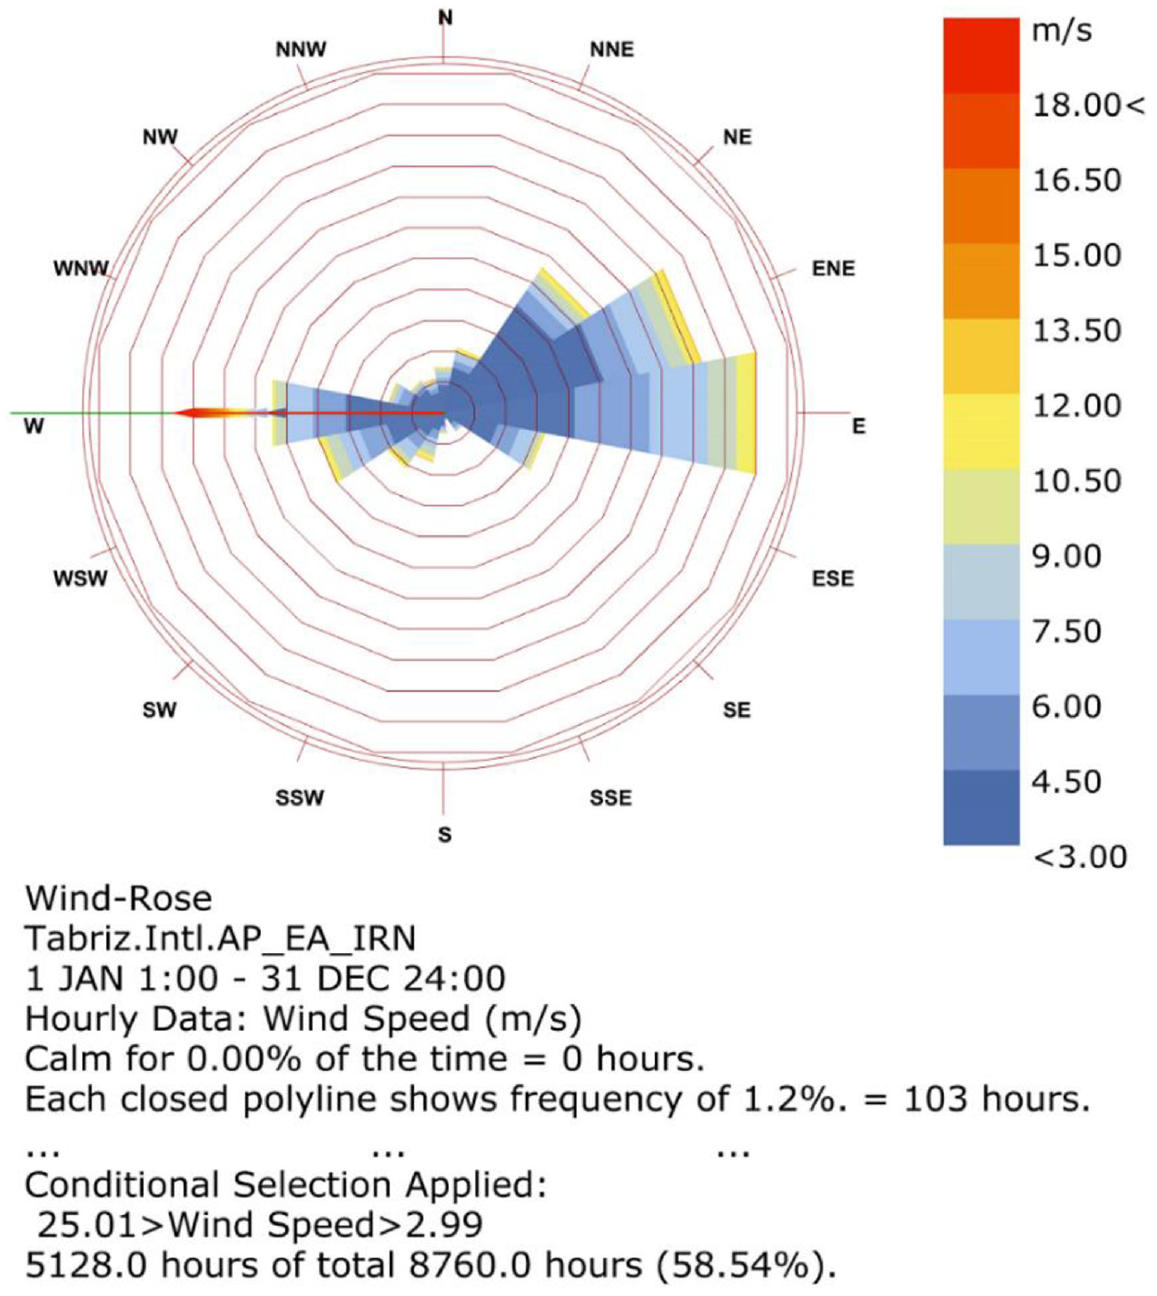
Annual wind velocity conditional selection applied (Cutin-CutOut).
Results of the power analysis
The frequency prediction of wind distribution at different hub heights shows an incremental trend at higher speed levels. For example, the observed data are frequently (22%) with 3 m/s at level 10 m, and there is only (a 1%) annual wind speed of 13 m/s. on the other hand, the frequency prediction for 166 m hub height, (14%) of wind distribution has been predicted with 6 m/s while (13%) of wind distributed between 10 to 25 m/s (Figure 12).
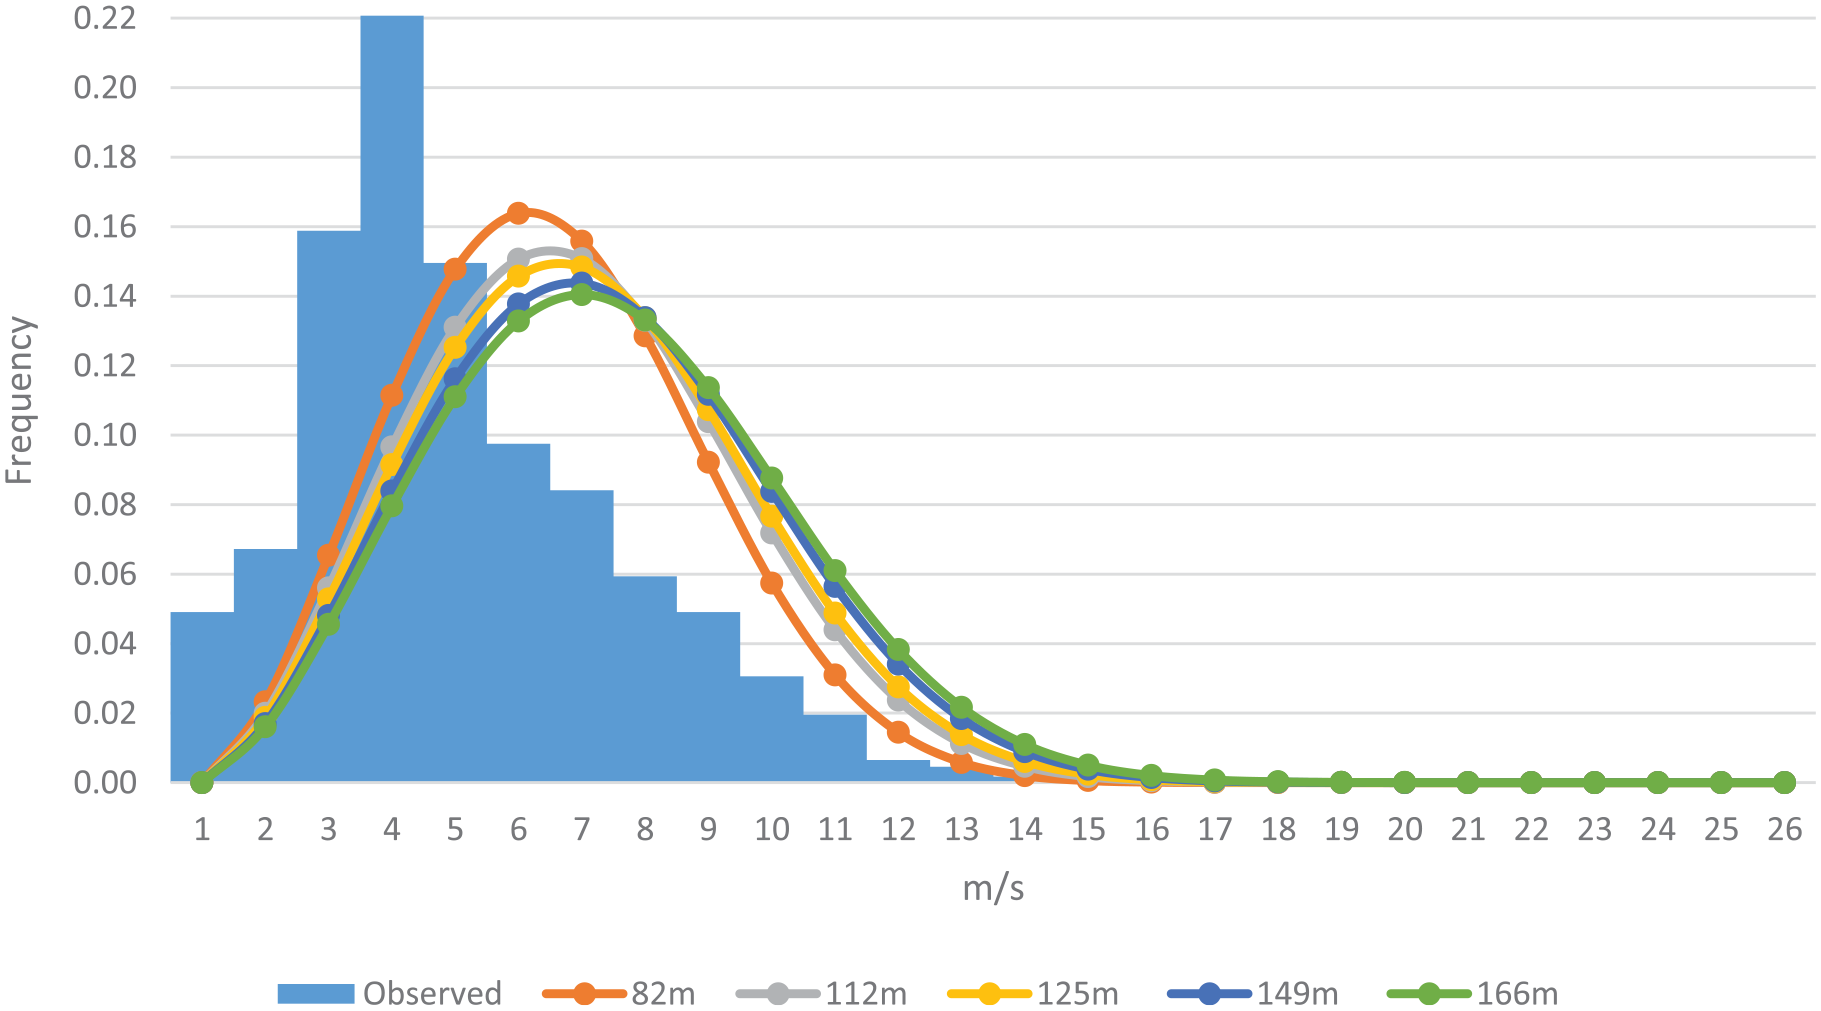
Comparison of predicted and observed wind speed frequencies at Tabriz Int. Airport (2007–2021).
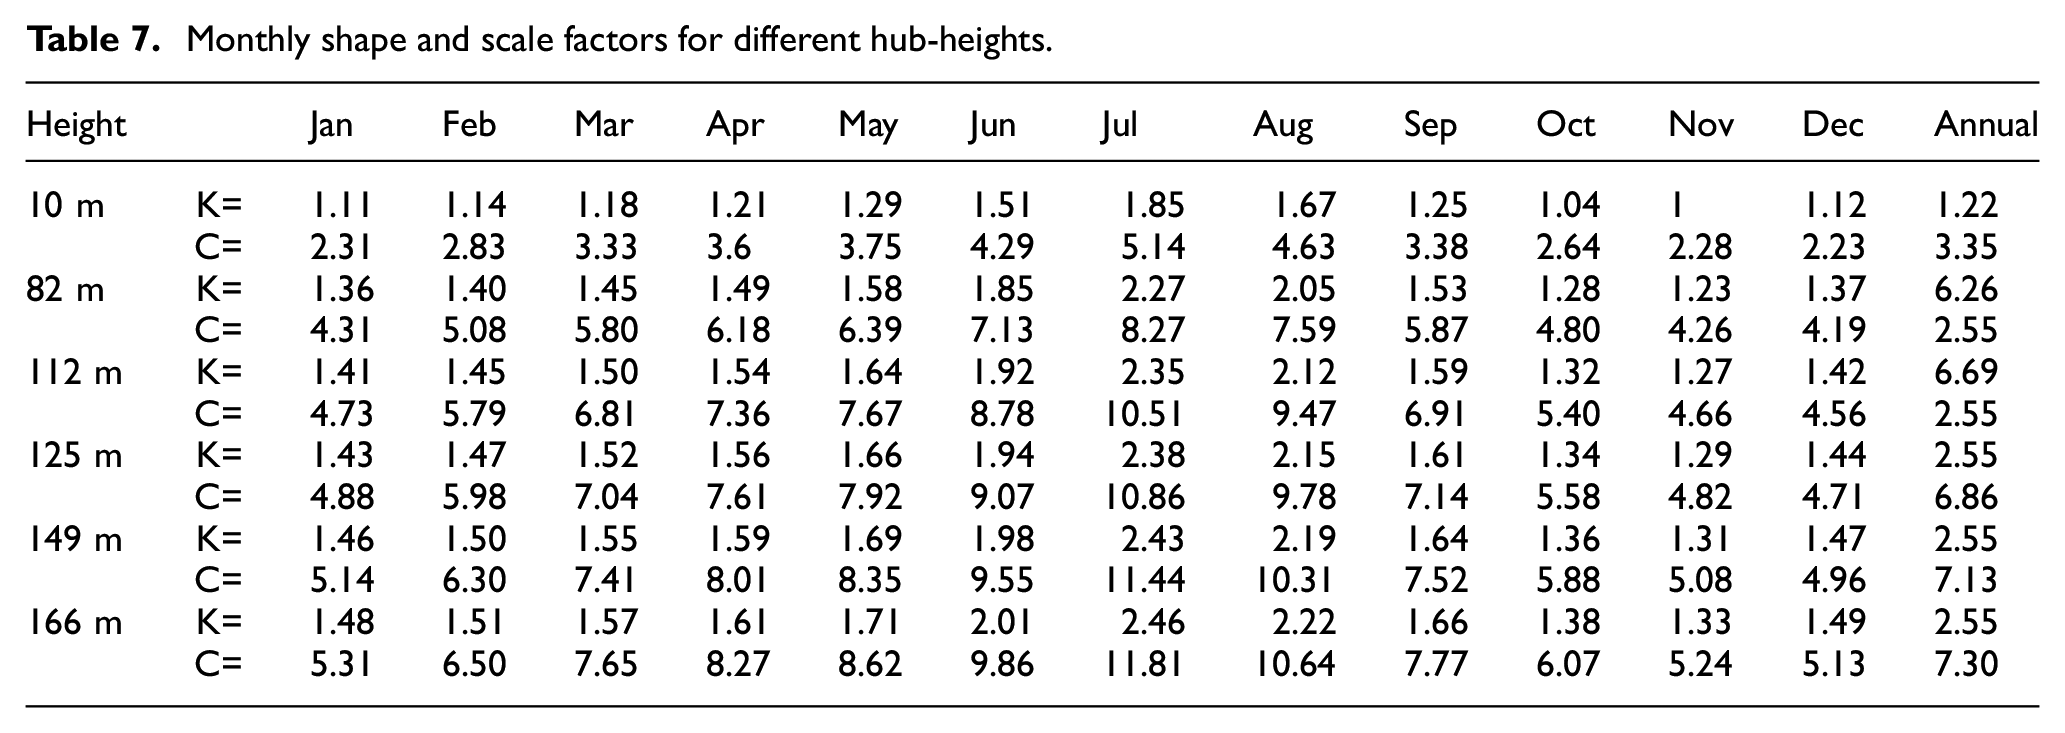
The shape and scale factors of Weibull distribution have been estimated for each month of aimed hub heights. Whereas the shape factor (k) depends on STDEV, the predicted values could change based on the aimed period. Therefore, the (k) and (C) factors have been estimated monthly and compared with annual values (Table 7).
Monthly shape and scale factors for different hub-heights.
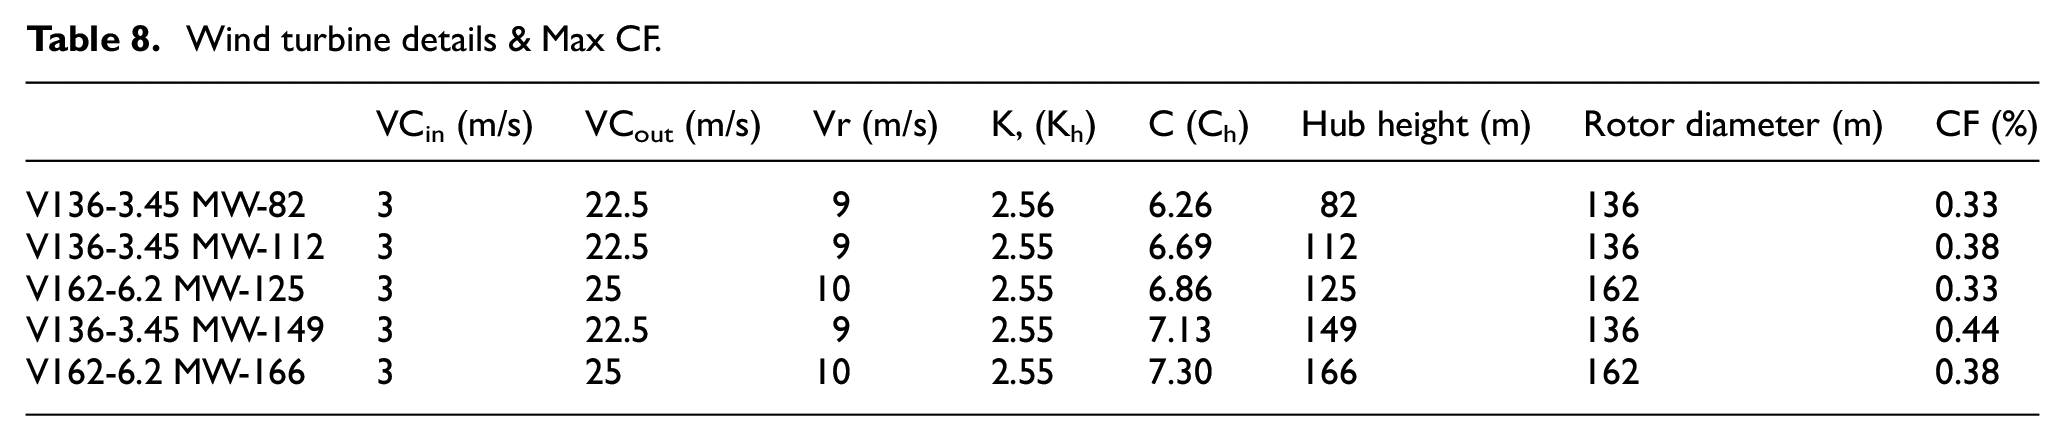
The results of the (CF) analysis show that the “V162-6.2 MW-125” with 36% and “V136-3.45 MW-149” with 46% have the lowest and highest capacity factor (Table 8).
Wind turbine details & Max CF.
The annual WPD shows the power density of different wind speeds based on their height and frequency without regard to the turbines’ sweep area (w/h.m2). At 82, 112, 125 149, and 166 m hub heights, the maximum power density is estimated at 9 m/s, 10 m/s (Figure 13).
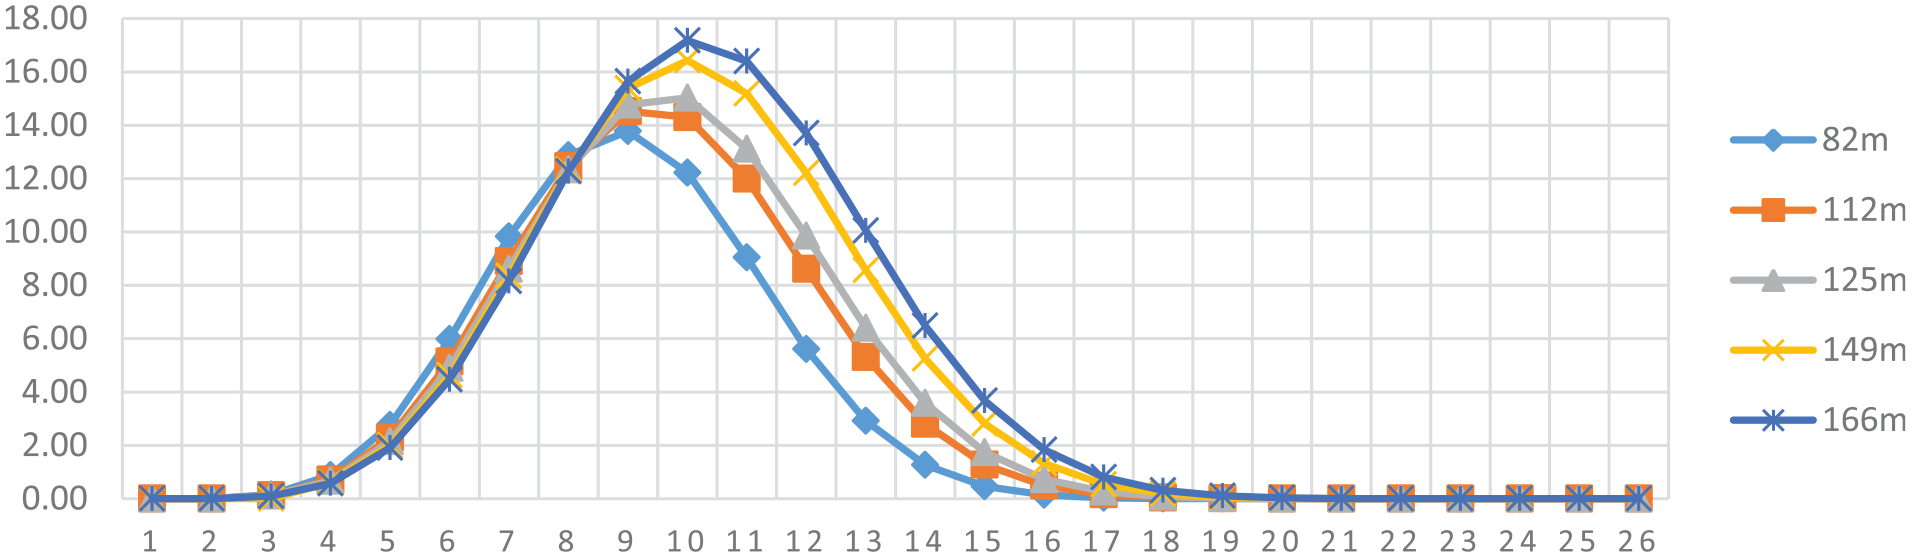
(WPD) Wind power density (w/h.m2).
The comparison of cumulative wind power density shows a remarkable difference at different hub heights (Figure 13). For instance, a hub with 82 m height finally can output 78 Wh/m2 between the cut-in and cut-out wind speed while 114 Wh/m2 can be acquired by a 166 m hub (Figure 13).
The monthly cumulative WPD shows an incremental trend according to the wind speed bin. The comparison of WPD at different hub heights illustrates different slopes between cut-in and cut-out speeds (Figure 14). A comparison of monthly WPD presented for different hub heights has been presented. The maximum WPD was observed in July while the minimum rate was recorded in Dec.
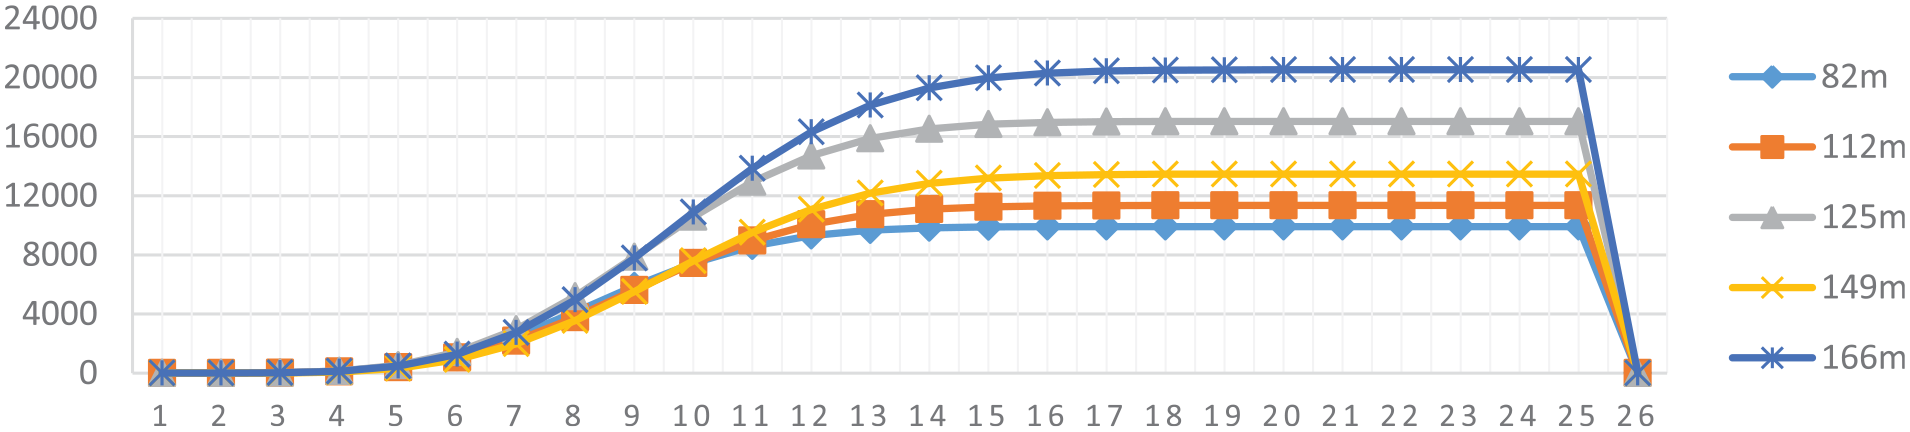
Annual cumulative final output (MWh/year).
The WPD depends on the wind speed and hub height of the wind turbine. The results of the cumulative wind power analysis at 82, 112, 149, and 166 m show, 78, 89, 94, 106, and 114 w/h.m2, respectively. Table 9 presented the cumulative wind power density for assumed hub heights and the final electricity output of different turbines as follows,
Annual WPD & final electricity output of different hub heights.
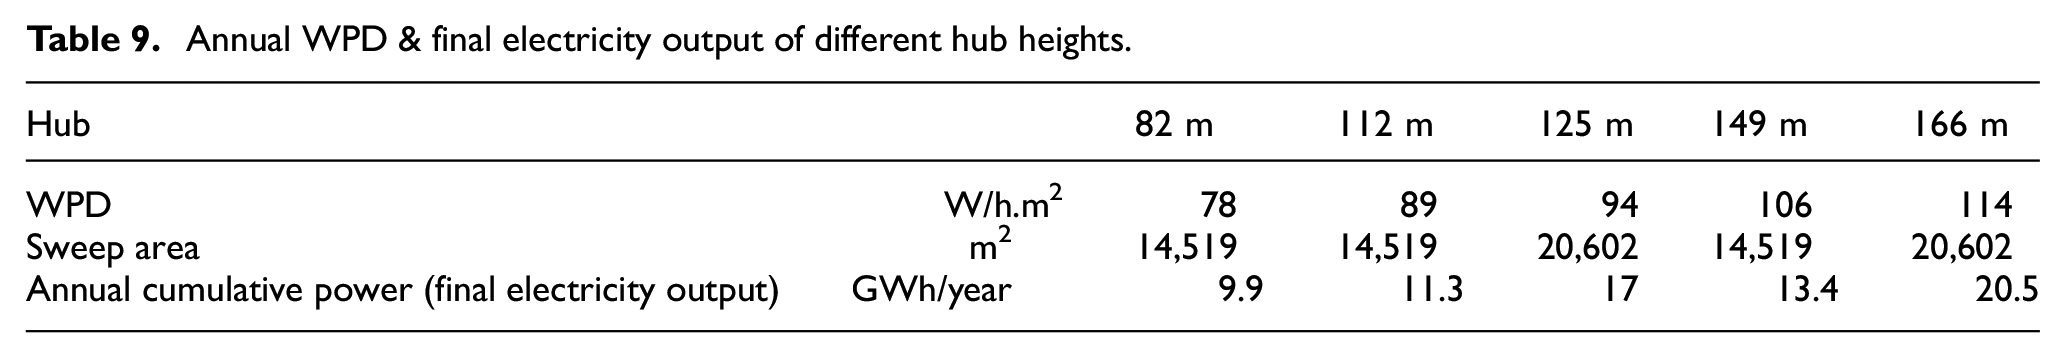
The comparison of power density and final power output shows that the turbine’s hub height is the most important factor in estimating the wind density while the turbine sweep area which is dependent on blade diameter is also important to evaluate the final output of the turbines. For example, the wind density at level 149 m with 106 (Wh/m2) is higher than 125 m with 94 (Wh/m2) because of incremental wind profiles (Table 9). However, the final output of the turbine (h = 125 m) is higher than the turbine with a hub height of 149 m because of its blade diameter (Figure 14 and Table 9).
Results of the financial analysis
Regarding the historical average oil FOB price (Figure 15), the results of the energy price analysis depict that the Tabriz power plant demands 0.25 lit diesel or 0.26 m3 NG to generate 1 kWh of electrical energy. Overall, carbon-based electricity costs 0.15$/kWh in Tabriz city in 2021. Assuming an annual incremental rate (6%), the electricity price has been presented in Figure 18 as follows,
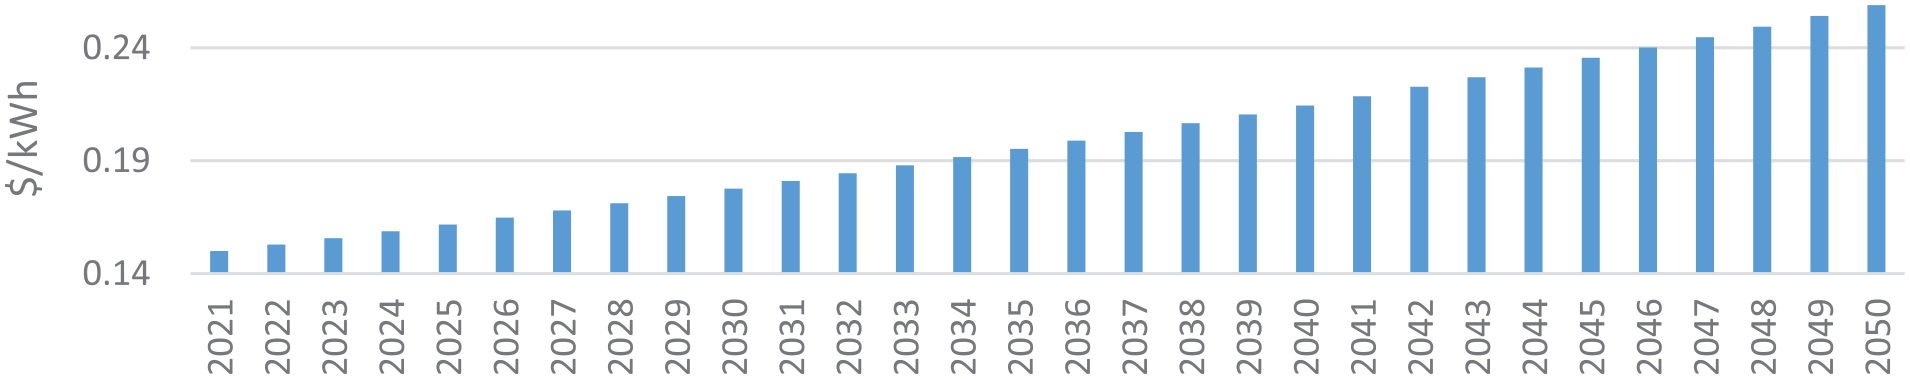
Production cost of carbon-based electricity by 2050 in Iran without Subsidy.
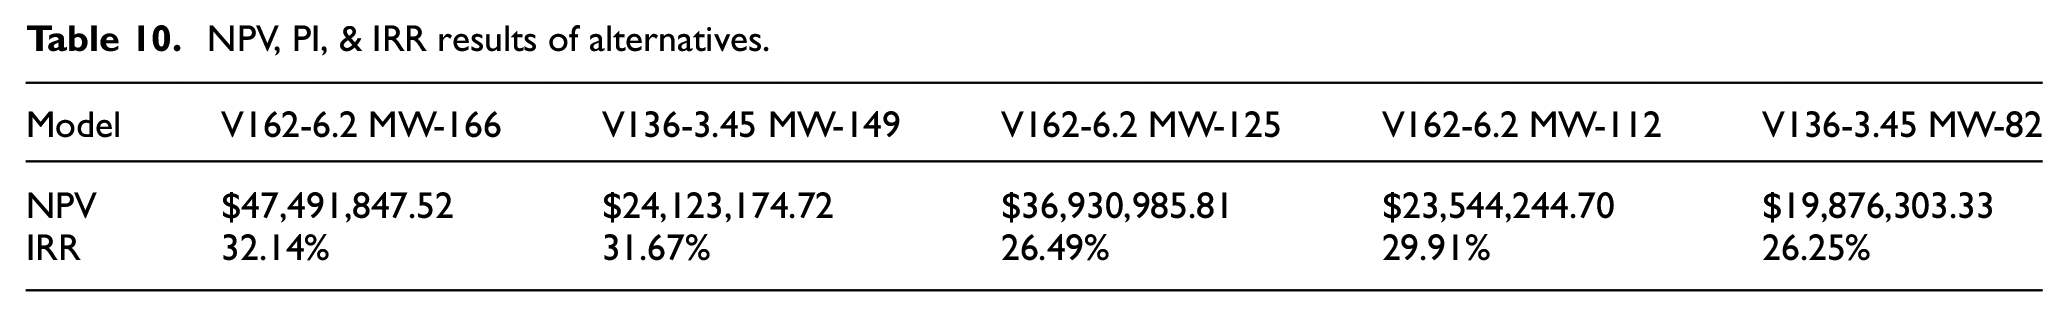
According to the financial analysis of five different models of wind turbines, (V162-6.2 MW-166) and (V136-3.45 MW-82) shows the maximum and minimum NPV with ($47,491,847.52) and ($19,876,303.33) over 30 years lifespan. On the other hand, the IRR analysis of each alternative shows a remarkable difference between (V162-6.2 MW-166) and other models. Therefore, this is the most feasible alternative among other turbines in this paper (Table 10). The cash flow of different alternatives has been compared and presented in Figure 16.
NPV, PI, & IRR results of alternatives.
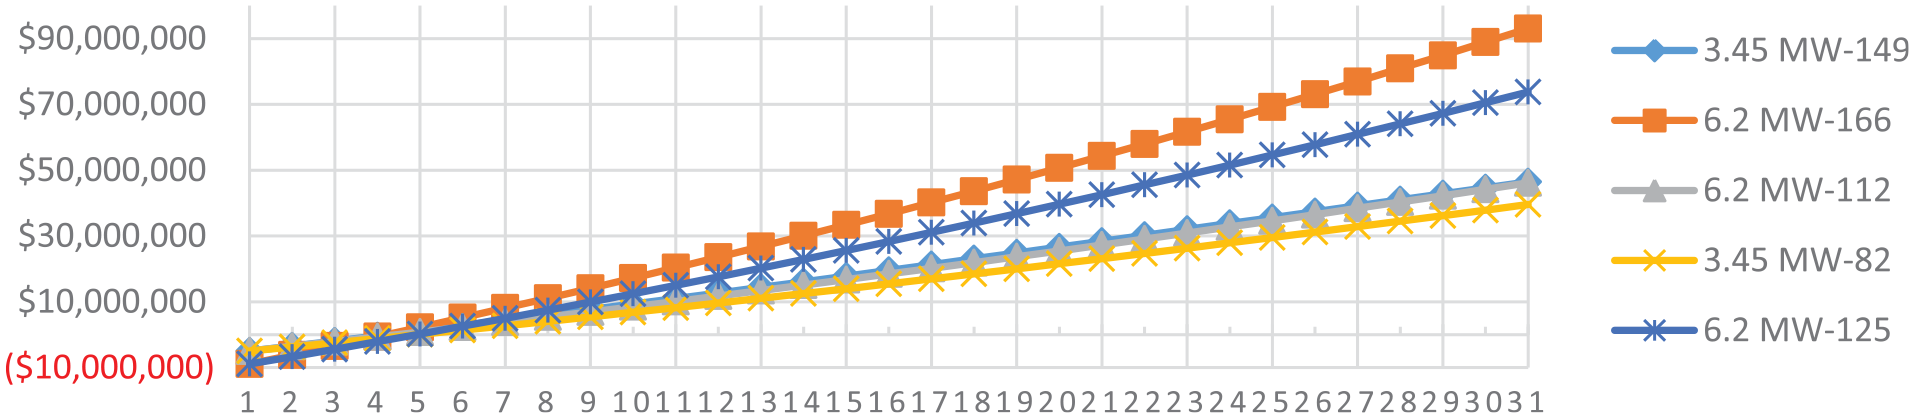
Cash flow comparison of different alternatives.
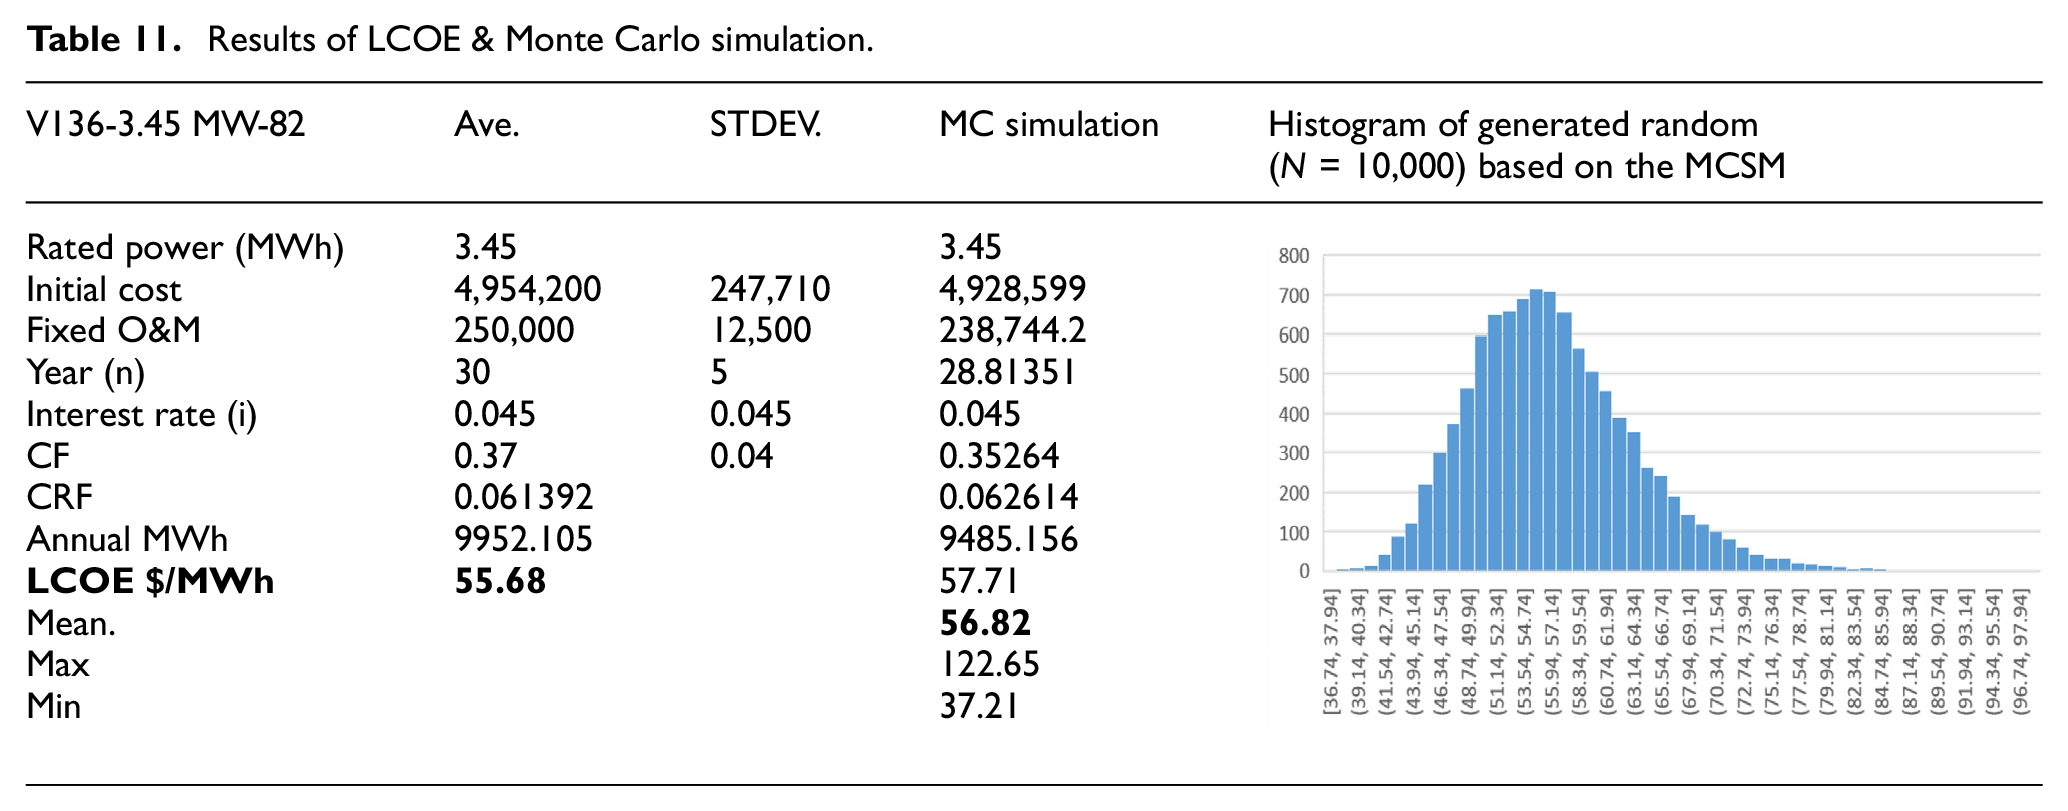
The analysis of LCOE for V136-3.45 MW-82 is estimated as 55.68 $/MWh while the Monte Carlo Simulation shows 43.01 $/MWh. The mean value of the randomly (N = 10,000) generated model equals 57.71 $/MWh. Also, the capacity factor is (CF = 0.37) and the capital recovery factor equals (CFR = 0.061392 as presented in Table 11. The histogram of generated random (N = 10,000) based on the Monte Carlo method in MS Excel (Table 11).
Results of LCOE & Monte Carlo simulation.
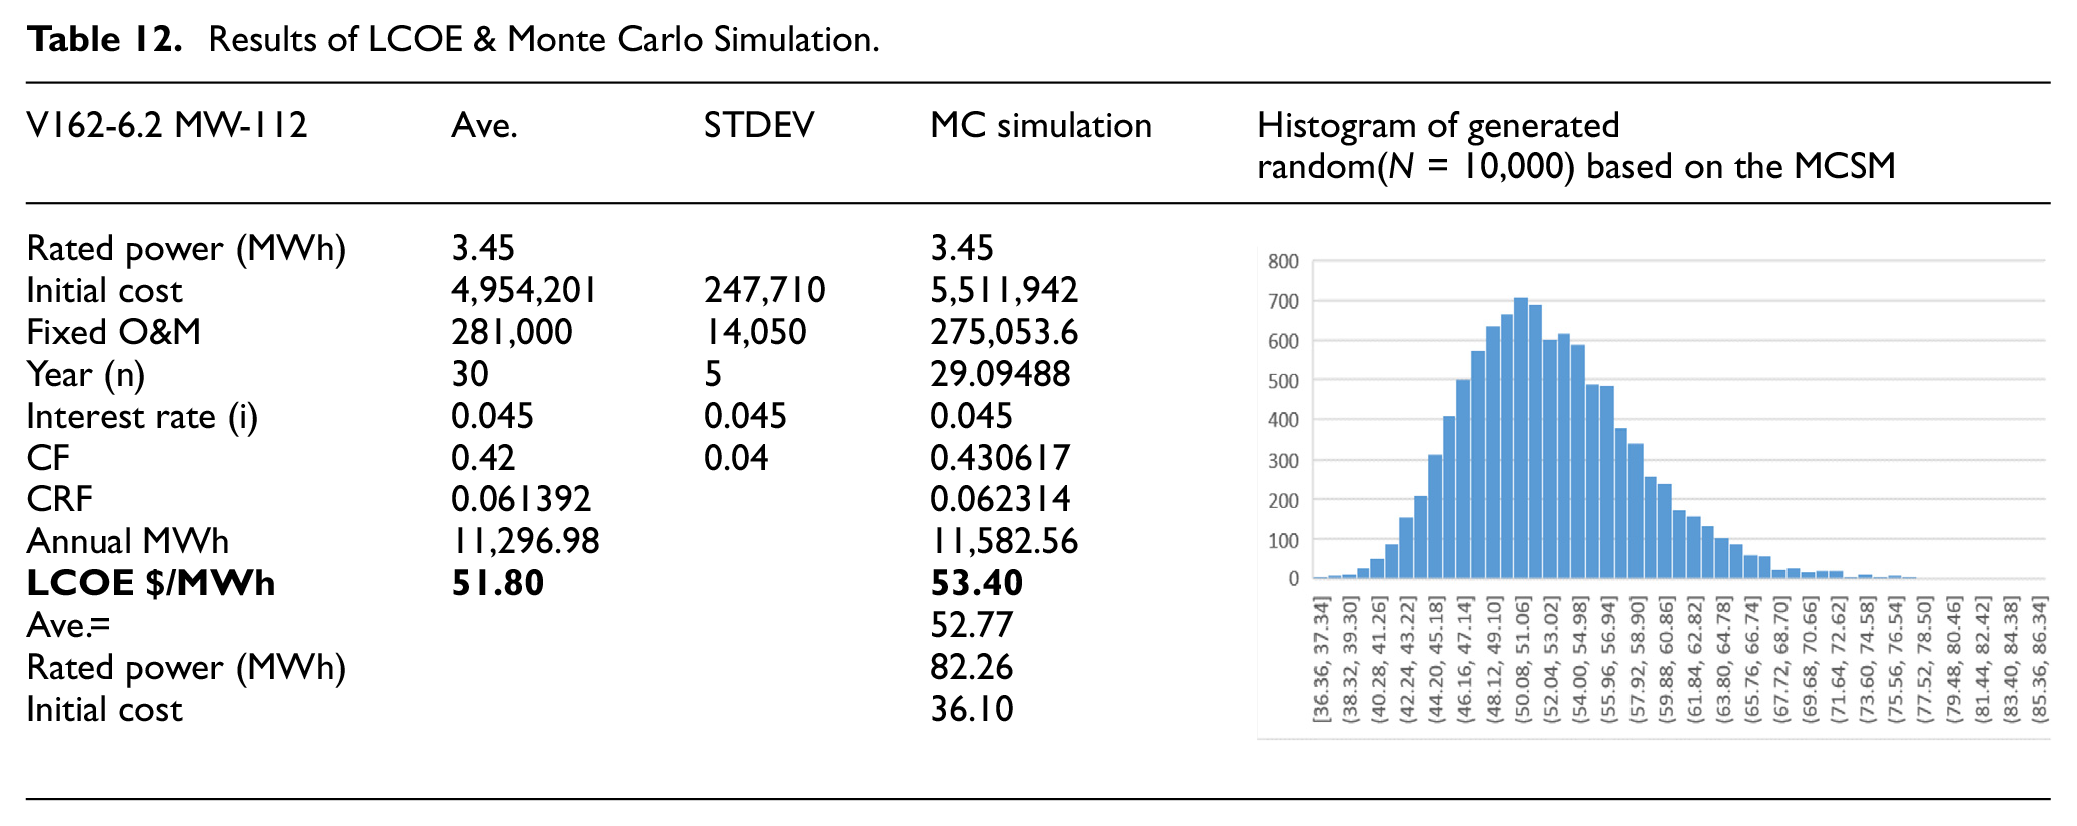
The analysis of LCOE for V162-6.2 MW-112 shows 51.80 $/MWh while the Monte Carlo Simulation shows 53.40 $/MWh. The mean value of the randomly (N = 10,000) generated model equals 52.40 $/MWh. Also, the capacity factor is (CF = 0.42) and (CFR = 0.061392) as presented in Table 12. The histogram of generated random (N = 10,000) based on the Monte Carlo method in MS Excel (Table 12).
Results of LCOE & Monte Carlo Simulation.
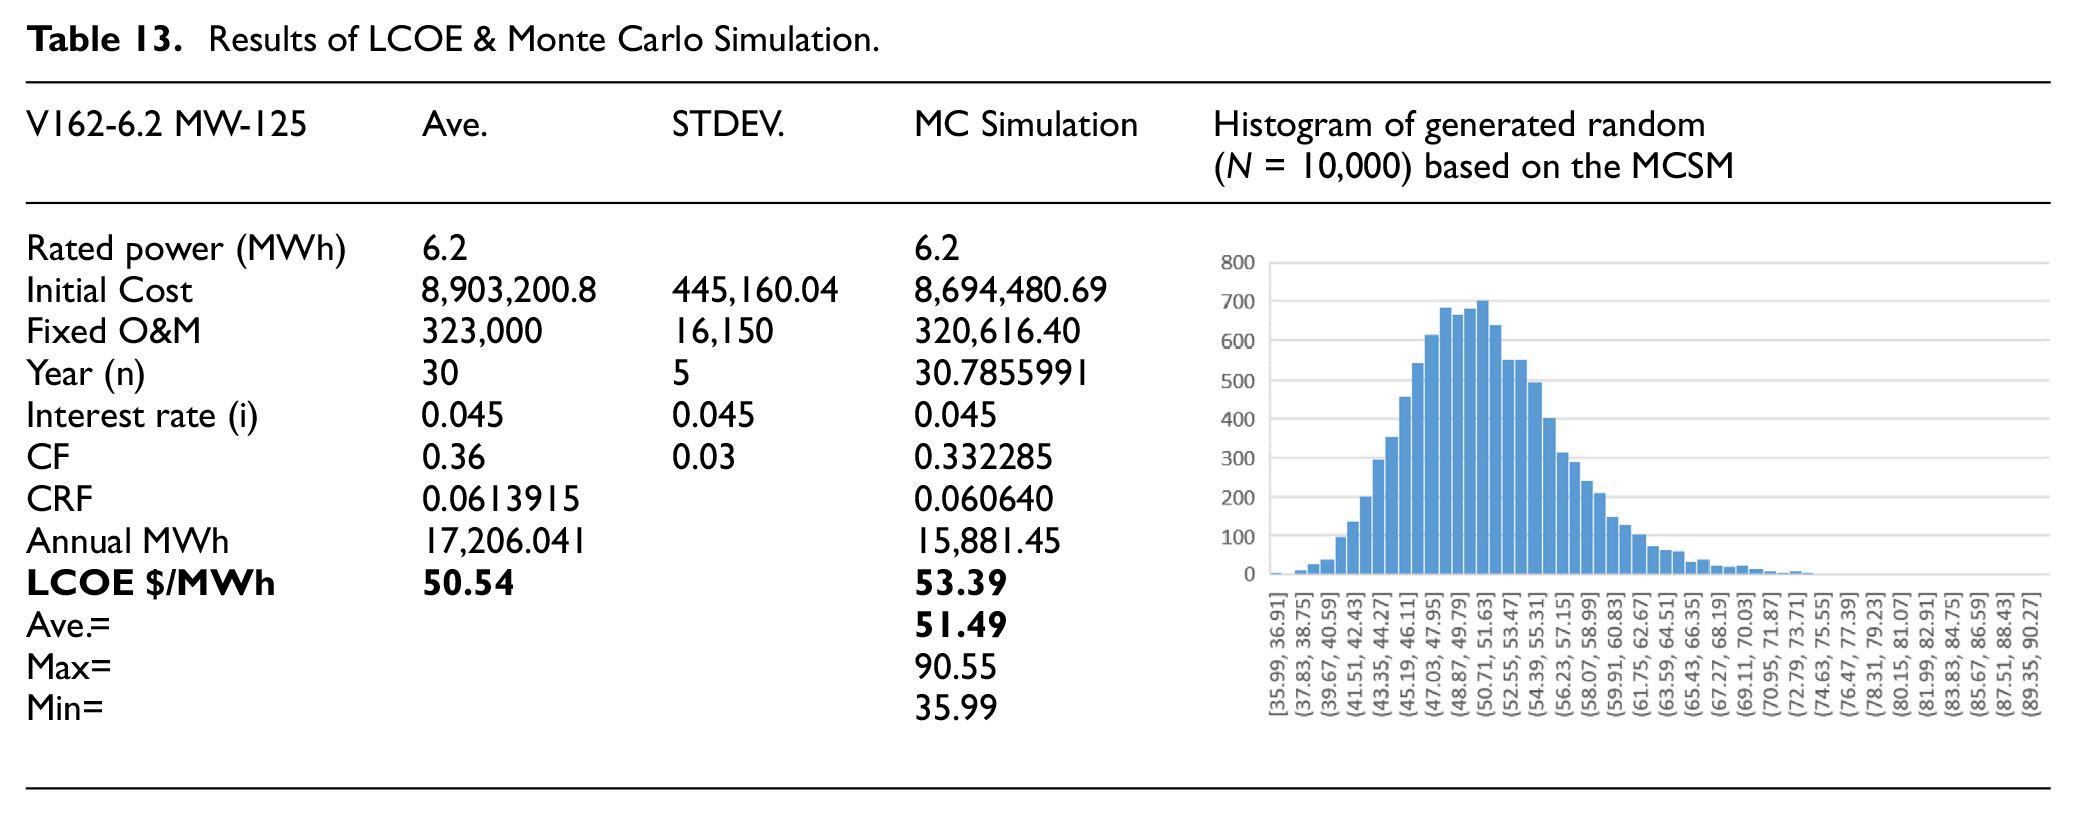
The analysis of LCOE for V162-6.2 MW-112 shows 50.54 $/MWh while the Monte Carlo Simulation shows 53.39 $/MWh. The mean value of the randomly (N = 10,000) generated model equals 51.49 $/MWh. Also, the capacity factor is (CF = 0.36) and (CFR = 0.061392) as presented in Table 13. The histogram of generated random (N = 10,000) based on the Monte Carlo method in MS Excel (Table 13).
Results of LCOE & Monte Carlo Simulation.
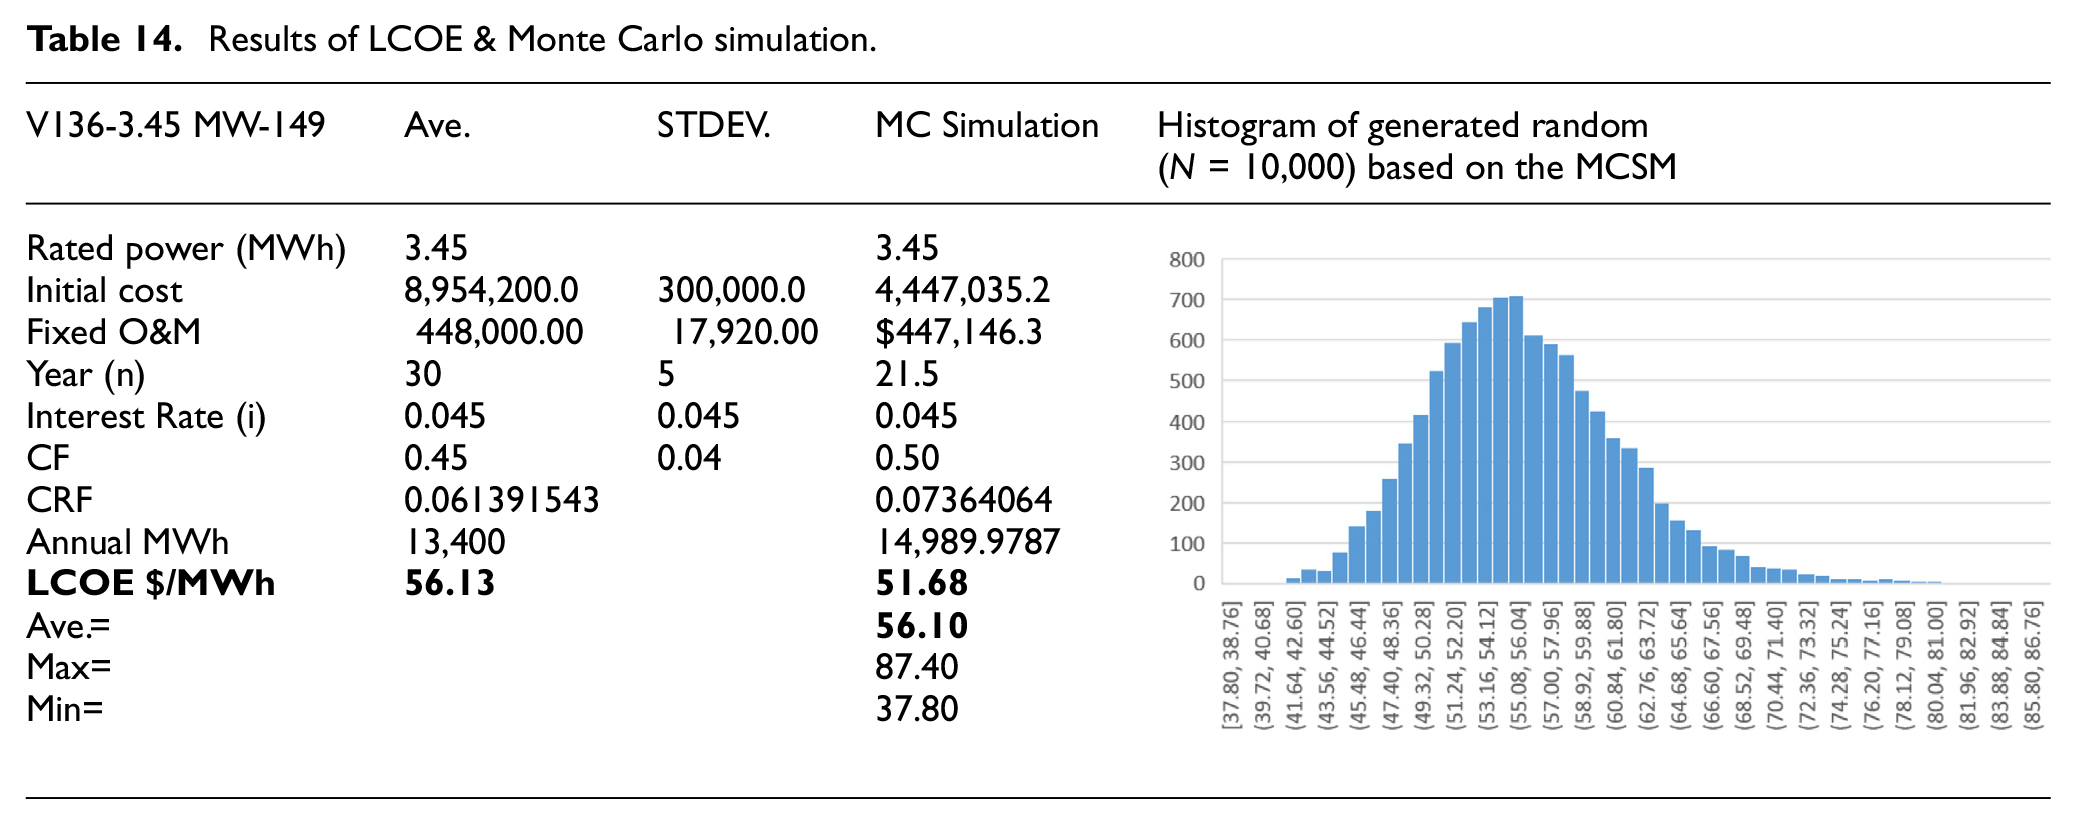
The analysis of LCOE for V136-3.45 MW-149 shows 56.13 $/MWh while the Monte Carlo Simulation shows 51.68 $/MWh. The mean value of the randomly (N = 10,000) generated model equals 56.10 $/MWh. Also, the capacity factor is (CF = 0.46) and (CFR = 0.061392) as presented in Table 14. The histogram of generated random (N = 10,000) based on the Monte Carlo method in MS Excel (Table 14).
Results of LCOE & Monte Carlo simulation.
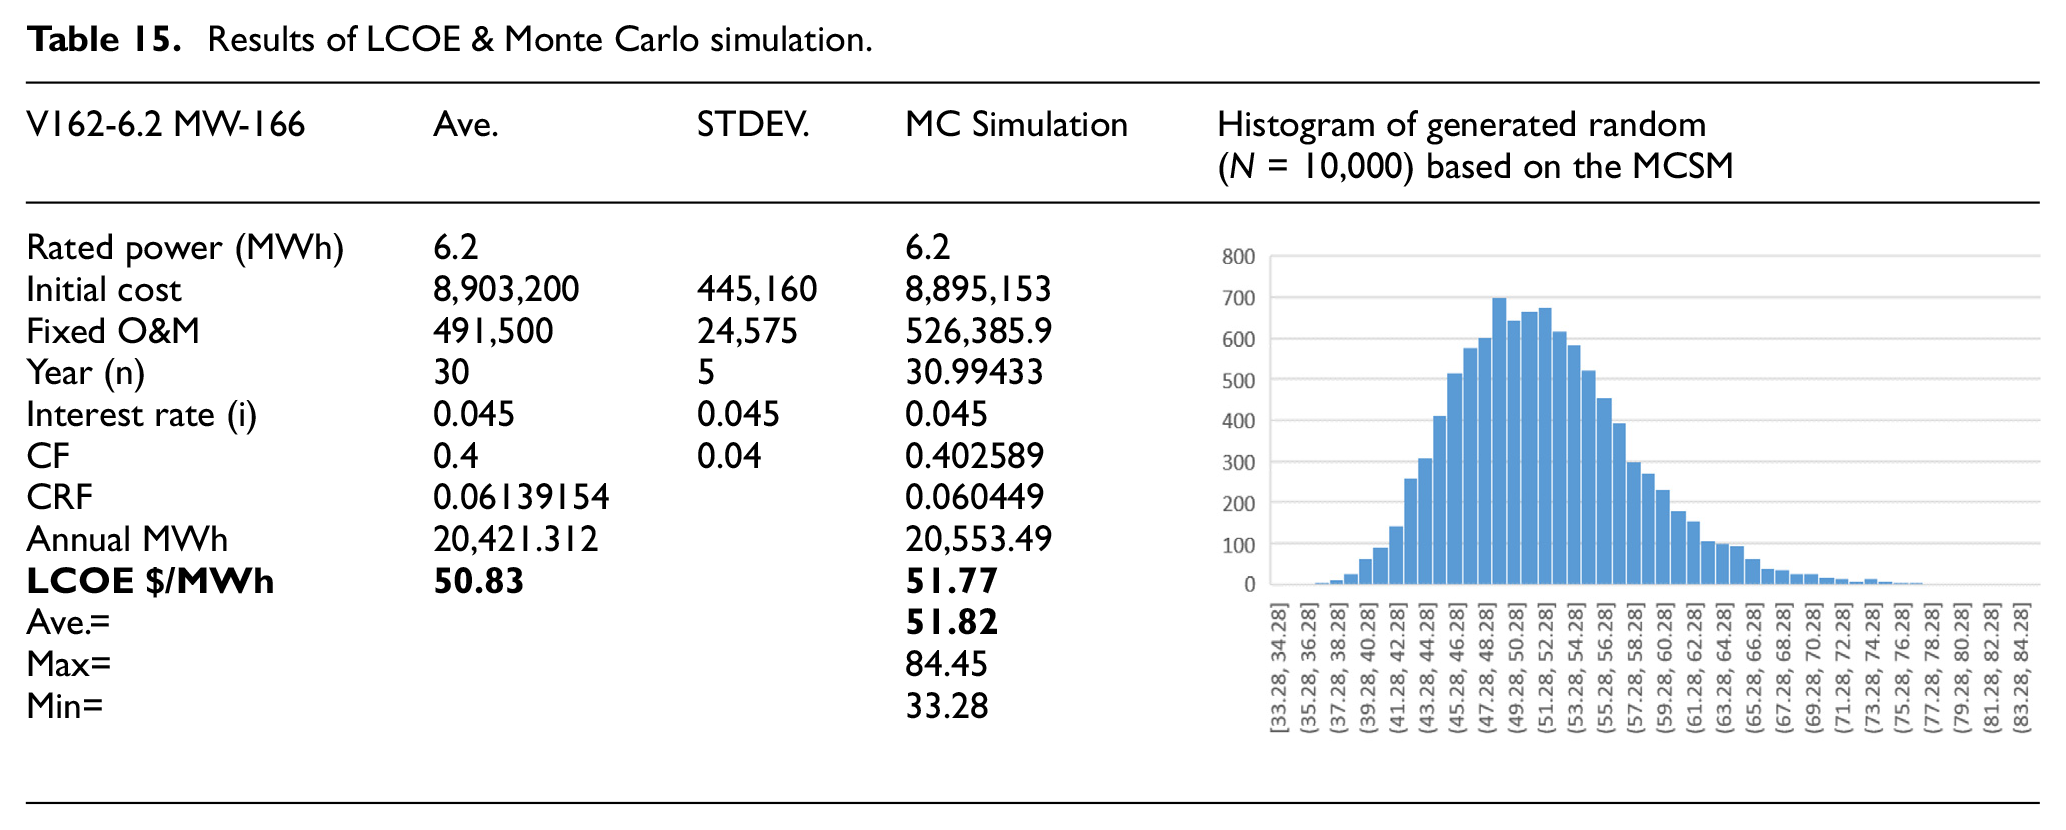
The analysis of LCOE for V162-6.2 MW-166 shows 50.83 $/MWh while the Monte Carlo Simulation shows 51.77 $/MWh. The mean value of the randomly (N = 10,000) generated model equals 51.82 $/MWh. Also, the capacity factor is (CF = 0.40) and (CFR = 0.061392) as presented in Table 15. The histogram of generated random (N = 10,000) based on the Monte Carlo method in MS Excel (Table 15).
Results of LCOE & Monte Carlo simulation.
Results of demand-supply curve
The city consumes 6538 GWh/year of electrical energy. In summer, the city demands 18.72 GWh/day in peak load Figure 17. Regarding 319 turbines (V162-6.2 MW-166) with a final output of 6540 GWh/year, the city requires alternatives for supplying 7.00 GWh/day or (28%) of demand at peak.
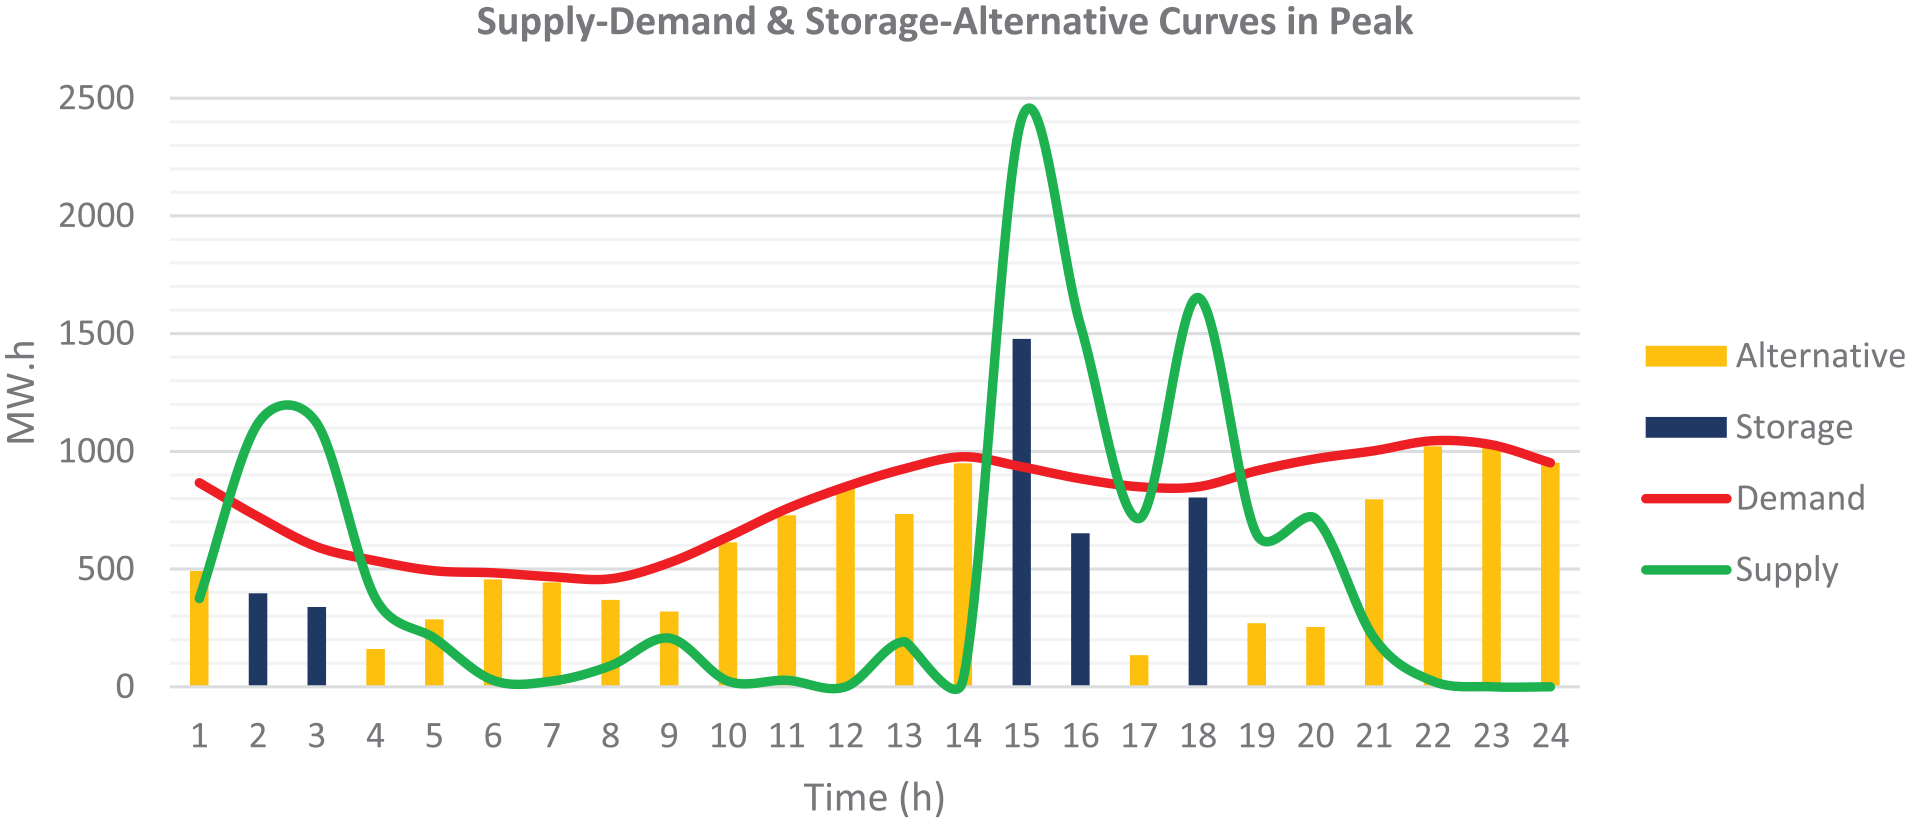
Supply load, alternative supply, and daily storage of Tabriz city in peak load.
From 01:30 to 03:30 and from 14:30 to 18:30, the system needs to store generated energy and the appropriate tariffs should be regulated regarding different storage alternatives such as G2Vs. Also, Evs may play important roles in balancing the demand-supply curve by V2G supply at peak demands.
Results of CO2 emission and halving the demand
According to the analysis of the CO2 emissions, each kilowatt-hour of carbon-based electricity causes 575 g.CO2/kW.h in overall. According to the electrification analysis, the resource-efficient demand of the city will rise to 37,143 and 70,697 GW.h/year by 2030 and 2050 respectively (Figure 18). Theoretically, the city needs to install 1725 wind turbines (V162-6.2 MW-166) to halve the CO2 emissions by 2030. 319 turbines (V162-6.2 MW-166) with 0.04 MT CO2 emissions can supply 65,400 GW.h/year of electricity that the fossil-based power plant of Tabriz supplies the same power by producing 3.78 MT CO2 emissions.
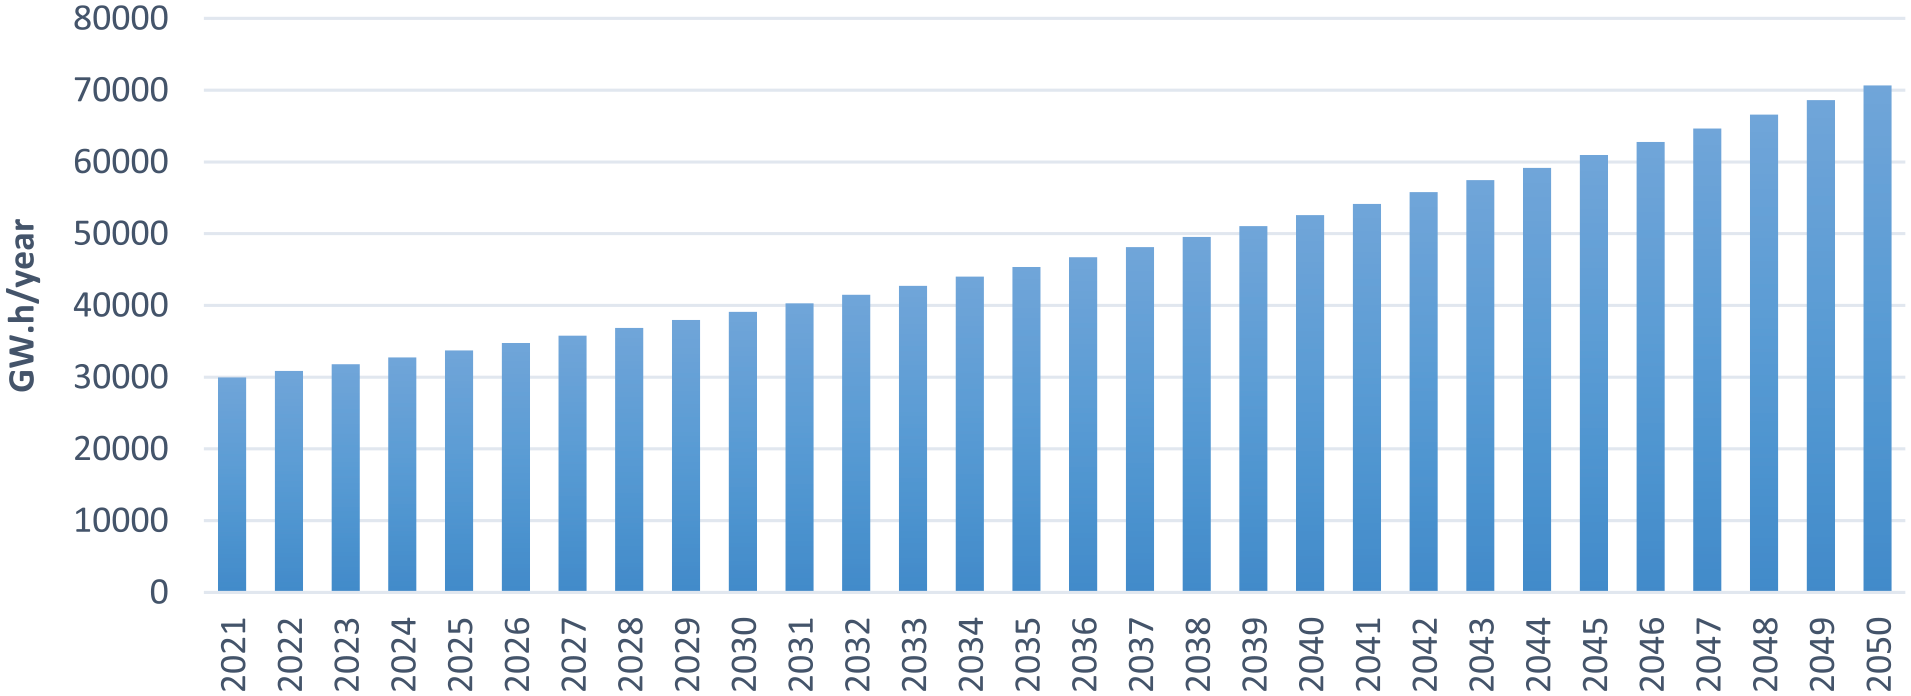
The minimum amount of carbon-free electricity to supply.
Summary of the findings
To make a clear comparison of different alternatives, the details, and the findings have been presented in Table 16. It is asserted that the capacity factor is the most decisive in the productivity of the alternative turbines.
Summary of the findings.
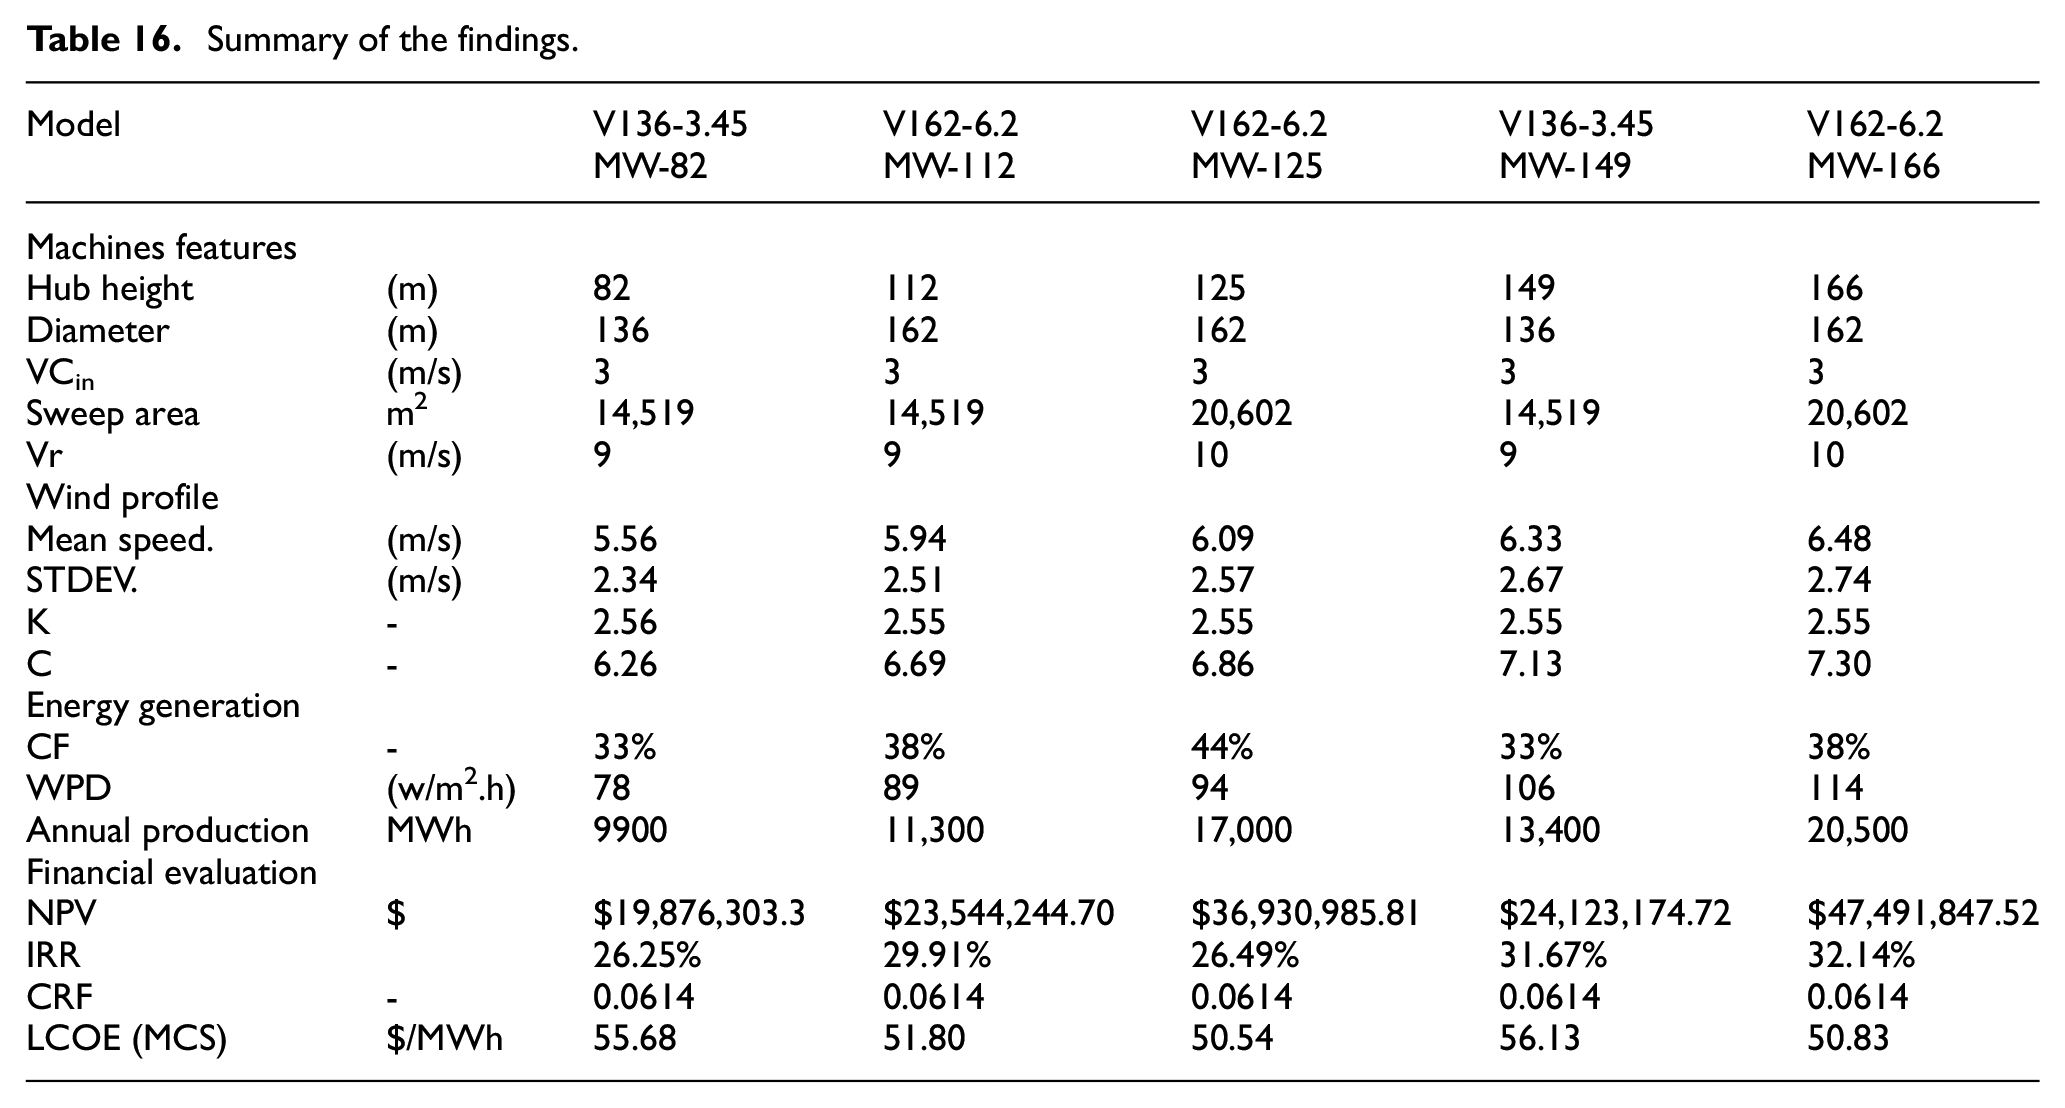
As is clear, the height, diameter, and capacity factors of wind turbines are effective on energy production rate and cost. However, the capacity factor is the most decisive in these regards. The LCOE of the V162-6.2 MW-166 turbine is 20.5 $/MWh which is the lowest rate among the five turbines due to its highest CF (38%).
Discussion of the findings
The main research question of this paper was whether wind power is a cost-effective alternative for decarbonizing Tabriz City, which currently has an oil-based economy. The noticeable findings were that wind power is three times cheaper than conventional electricity in Tabriz Also, the CF, influenced by hub height and rotor sweep area, is an essential factor in the productivity of alternative turbines.
The findings answer the research question by showing that wind power is a cost-effective solution for decarbonizing the city. The results support the first hypothesis that wind-based electricity is cheaper than carbon-based electricity in Tabriz, as the LCOE for wind power was estimated to be 0.05$/kWh, while the LCOE for conventional electricity was 0.15$/kWh. The results also highlight the second hypothesis that the CF is the most important factor in the productivity of alternative turbines, as the analysis of different turbine models revealed that higher capacity factors resulted in higher annual power production and lower LCOE. These findings are consistent with previous researches that have shown the environmental benefits and economic viability of wind energy for electrification in different sectors.
The implications of this paper are noticeable for the field of sustainable urban development and energy policy. The study shows that wind power can be an attractive and feasible option for electrifying oil-based economies, such as Tabriz, that face challenges such as high energy demand, carbon emissions, and dependence on fossil fuels. The findings also depict valuable insights into the optimal selection of wind turbine models based on their CF, hub height, and rotor sweep area. These insights can help decision-makers and planners to design and implement effective wind power projects that can meet the energy demand and mitigate the environmental impact of cities like Tabriz.
It should be mentioned that the study does have some limitations that should be regarded when interpreting the results. First, the evaluations and models relied on secondary data from the Tabriz International Airport meteorological station, which may not reflect the actual wind conditions at different sites in the mountainous city of Tabriz. Second, the paper used a simplified model to estimate the LCOE for wind power, which did not account for some factors such as grid connection costs, land costs. Third, the study did not consider other renewable energy sources such as solar or biomass that could also contribute to decarbonizing Tabriz.
Recommendations
This paper highlights only the role of wind energy in urban decarbonization focusing on reasonable renewable energy costs. Therefore, optimizing the position of wind turbines regarding the wake effect in wind farms is recommended. Also, the maximum number of possible and usable turbines should be optimized according to the geographical factors of the city.
Future research could address the limitations by collecting primary data from different locations in the city, using more comprehensive models to estimate the LCOE for wind power and other RE sources, and comparing the costs and benefits of different energy scenarios for Tabriz.
Conclusion
The South-Eastern and Northern mountains of Tabriz City are around 500 m higher than other parts of most of the city and have higher potential for the assumed installation of wind turbines. The availability of wind is maximum in Jun, Jul, and Aug while it is minimum in Jan, Feb, and Dec.
The results of the cumulative wind power analysis at 82, 112, 149, and 166 m show, 78, 89, 94, 106, and 114 w/h.m2, respectively.
The results of the (CF) analysis shows that the “V136-3.45 MW-82” with 36% and “V136-3.45 MW-149” with 44% have the lowest and highest capacity factor.
The comparison of power density and final power output discloses that the turbine’s hub height is the most important factor to estimate the wind density while the turbine sweep area which is dependent on blade diameter is also important to evaluate the final output of the turbines. The wind density at level 149 m with 106 (W/h.m2) is higher than 125 m with 94 (W/h.m2) because of incremental wind profiles (Figure 14 and Table 7). But the final output of the turbine (h = 125 m) is higher than the turbine with a hub height of 149 m because of its larger blades’ diameter (Figure 14 and Table 7). Turbine V162-6.2 MW-166 produces 20.5 GW.h/year which is more than other turbines due to its higher hub height and blade diameter.
The NPV analysis shows the (V162-6.2 MW-166) with the amount of ($47,491,847.52) is the most feasible alternative among other turbines in this paper. Also, its IRR of 32.14% is higher than other alternatives.
The energy demand of the city will increase to 37,143 and 70,697 GWh/year by 2030 and 2050 respectively. The city needs to install 1725 wind turbines (V162-6.2 MW-166) to halve the CO2 emissions by 2030. 319 turbines (V162-6.2 MW-166) with 0.04 MT CO2 emissions can supply 65,400 GW.h/year of electricity that the fossil-based power plant of Tabriz supplies the same power by producing 3.78 MT CO2 emissions.
The city requires alternatives for supplying 7.00 GWh/day or (28%) of demand at peak. From 01:30 to 03:30 and from 14:30 to 18:30, the system needs to store generated energy that the appropriate tariffs should be regulated regarding different storage alternatives such as G2Vs. Also, Evs may play important roles in balancing the demand-supply curve by V2G supply at peak demands.
Overall, carbon-based electricity costs 0.15$/kWh in Tabriz city. On the other hand, wind-based electricity production only costs 0.05 $/kWh in Tabriz.
It is asserted that the capacity factor, hub height, and blade diameters are simultaneously the most decisive in the productivity of the alternative turbines.
Footnotes
Declaration of conflicting interests
The author(s) declared no potential conflicts of interest with respect to the research, authorship, and/or publication of this article.
Funding
The author(s) received no financial support for the research, authorship, and/or publication of this article.