
Abstract
The steam chamber rising process is an essential feature of steam-assisted gravity drainage. The development of a steam chamber and its production capabilities have been the focus of various studies. In this paper, a new analytical model is proposed that mimics the steam chamber development and predicts the oil production rate during the steam chamber rising stage. The steam chamber was assumed to have a circular geometry relative to a plane. The model includes determining the relation between the steam chamber development and the production capability. The daily oil production, steam oil ratio, and rising height of the steam chamber curves influenced by different model parameters were drawn. In addition, the curve sensitivities to different model parameters were thoroughly considered. The findings are as follows: The daily oil production increases with the steam injection rate, the steam quality, and the degree of utilization of a horizontal well. In addition, the steam oil ratio decreases with the steam quality and the degree of utilization of a horizontal well. Finally, the rising height of the steam chamber increases with the steam injection rate and steam quality, but decreases with the horizontal well length. The steam chamber rising rate, the location of the steam chamber interface, the rising time, and the daily oil production at a certain steam injection rate were also predicted. An example application showed that the proposed model is able to predict the oil production rate and describe the steam chamber development during the steam chamber rising stage.
Keywords
Introduction
With an increase in oil demand, heavy oil has attracted greater interest from researchers (Diaz, 2001; Head et al., 2003; Miura and Wang, 2012; Syed et al., 2016; Thomas et al., 2001). Thermal oil recovery techniques are effective methods for recovering heavy oil. Steam-assisted gravity drainage (SAGD) is a promising thermal oil recovery technique. During the SAGD process, there are two parallel horizontal wells in the formation, the upper one, of which is the injector, and the lower one is the producer. Steam is injected into the formation through the injector to heat the oil. The heated oil flows to the producer under gravity. The steam occupies the position of the produced oil and forms a steam chamber. The development of the steam chamber has four stages: (1) the formation of a steam chamber when a thermal interconnection between the injector and producer occurs, (2) the upward rise of the steam chamber before it reaches the cap rock, (3) a lateral expansion of the steam chamber when it reaches the cap rock (Butler and Stephens, 1981; Chalaturnyk, 1996; Chung and Butler, 1988; Edmunds et al., 1994), and (4) a downward expansion of the steam chamber when it reaches the no-flow boundary.
Most researchers have concentrated on the development of the steam chamber after it reaches the cap rock (Akin, 2006; Ito and Suzuki, 1999; Liang, 2005; Nukhaev et al., 2006). Butler et al. (1979) first proposed the concept of SAGD and derived equations that predict the rate of drainage of heavy oil during the stage of lateral steam chamber expansion. Butler and Stephens (1981) modified the original theory in two ways: (1) The steam chamber remains attached to the production well and (2) a no-flow boundary is introduced, which is located half way from the neighboring well. Reis (1992) believed that the Butler’s model is inconvenient for oilfield applications and proposed a new SAGD model, in which the shape of the steam chamber is an inverted triangle. Azad and Chalaturnyk (2010) determined that the Butler/Reis model does not consider the geomechanics and improved the Butler/Reis model by using a model of slices. Based on numerical and experimental studies, Wei et al. (2014) assumed that the shape of the steam chamber is a combination of two symmetrical parabolas and established a new model to describe the steam chamber development. All of the above studies focused on the development of the steam chamber after it reached the cap rock. However, few studies have been conducted on the stage of a rising steam chamber. Butler (1987) proposed a rising steam chamber model and assumed that the rising rate of a steam chamber is a constant, which is not the case in an actual oilfield.
In this study, we propose a new analytical model for the steam chamber rising process to mimic the steam chamber development and predict the oil production rate. There are three main features to this approach compared with Butler’s model: (1) the shape of the steam chamber is assumed to have a circular geometry relative to a plane, (2) the rising rate of the steam chamber decreases over time instead of remaining a constant, and (3) the calculation formula of the SAGD production performance parameters (e.g. the daily oil production and the steam chamber rising height) considers the influence of the time-dependent steam injection rate, whereas Butler’s model does not. The model will make it convenient for oilfield engineers to mimic the steam chamber development and predict the production rate.
Model with a circular geometry
After the production and injection, wells have established a thermal connection, and the steam chamber begins to rise up. During the rising stage, the shape of the steam chamber is assumed to have a circular geometry relative to a plane. The bottom of the circle is fixed at the production well (see Figure 1). The temperature in the steam chamber is maintained at the steam temperature. The heavy oil is heated by the latent heat released by the liquefaction of steam into water. The heated crude oil and condensed water flow into the production well under gravity.

Illustration of a circular-shaped steam chamber.
Material balance
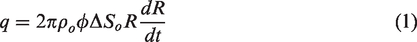
The oil production rate can be calculated by the volume swept by the steam chamber. Therefore, the oil production rate per unit of horizontal well length before the steam chamber reaches the cap rock is as follows
Energy balance
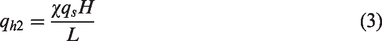
The latent heat released by steam is used to heat the cold heavy oil when the steam touches the cold oil and condenses into water. The condensed water and heated oil flow into the production well along the boundary of the steam chamber. The latent heat injection rate released by steam can be expressed as follows

The latent heat injection rate per unit of horizontal well length released by steam is as follows
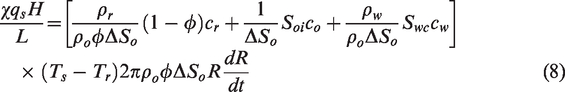
In this paper, we only discuss the steam chamber expansion before the chamber reaches the cap rock. The heat loss is mainly caused by this rock. Because the steam chamber does not reach the cap rock, we do not consider the heat loss. The latent heat released by steam is used to heat the rock, oil, and irreducible water. Based on the energy balance, the following are obtained


Solution procedure
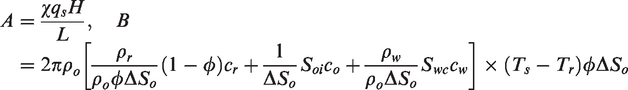
Combining equations (1) and (3) to (7), we obtain equation (8) as follows
Let
Equation (8) can be simplified as
By integrating equation (9), the steam chamber radius is calculated as follows
Taking the derivative of equation (11) with respect to t, the steam chamber rising rate is as follows
The steam chamber rising rate is not a constant. The rate decreases over time, which differs from Butler’s assumption that the steam chamber rising rate is a constant.
Combining equations (1) and (10), and considering the horizontal length, the oil production rate can be obtained as follows

The steam oil ratio is as follows
Sensitivity analysis
Sensitivity analysis of rising height of steam chamber
We next considered the influence of the steam injection rate, the steam quality, and the horizontal well length on the rising height of the steam chamber during the steam chamber rising stage.
Figure 2 reflects the influence of the different steam injection rates on the rising height of the steam chamber. The curves were simulated by setting the steam injection rate to 60, 80, and 100 t/d under a group of fixed model parameters, i.e. L = 346 m, H = 31.9 m, χ = 0.85, and t = 200 d. The steam liquefies into water and releases latent heat when it touches the reservoir around the steam chamber. Heat is transferred to the reservoir and the oil drains down, whereas the steam moves up and occupies the space left by the flowing oil. The more latent heat the steam releases, the more oil that drains down, and the higher the top of the steam chamber. The latent heat released by the steam is affected by the steam injection rate. The bigger the steam injection rate is, the more latent heat the steam releases. Therefore, the bigger the steam injection rate is, the higher the top of the steam chamber, as shown in Figure 2. As the steam injection rate increases from 60 to 100 t/d, the rising height of the top of the steam chamber increases from 12.10 to 15.32 m, as shown in Figure 2. The rising height of the steam chamber increases with the steam injection rate.
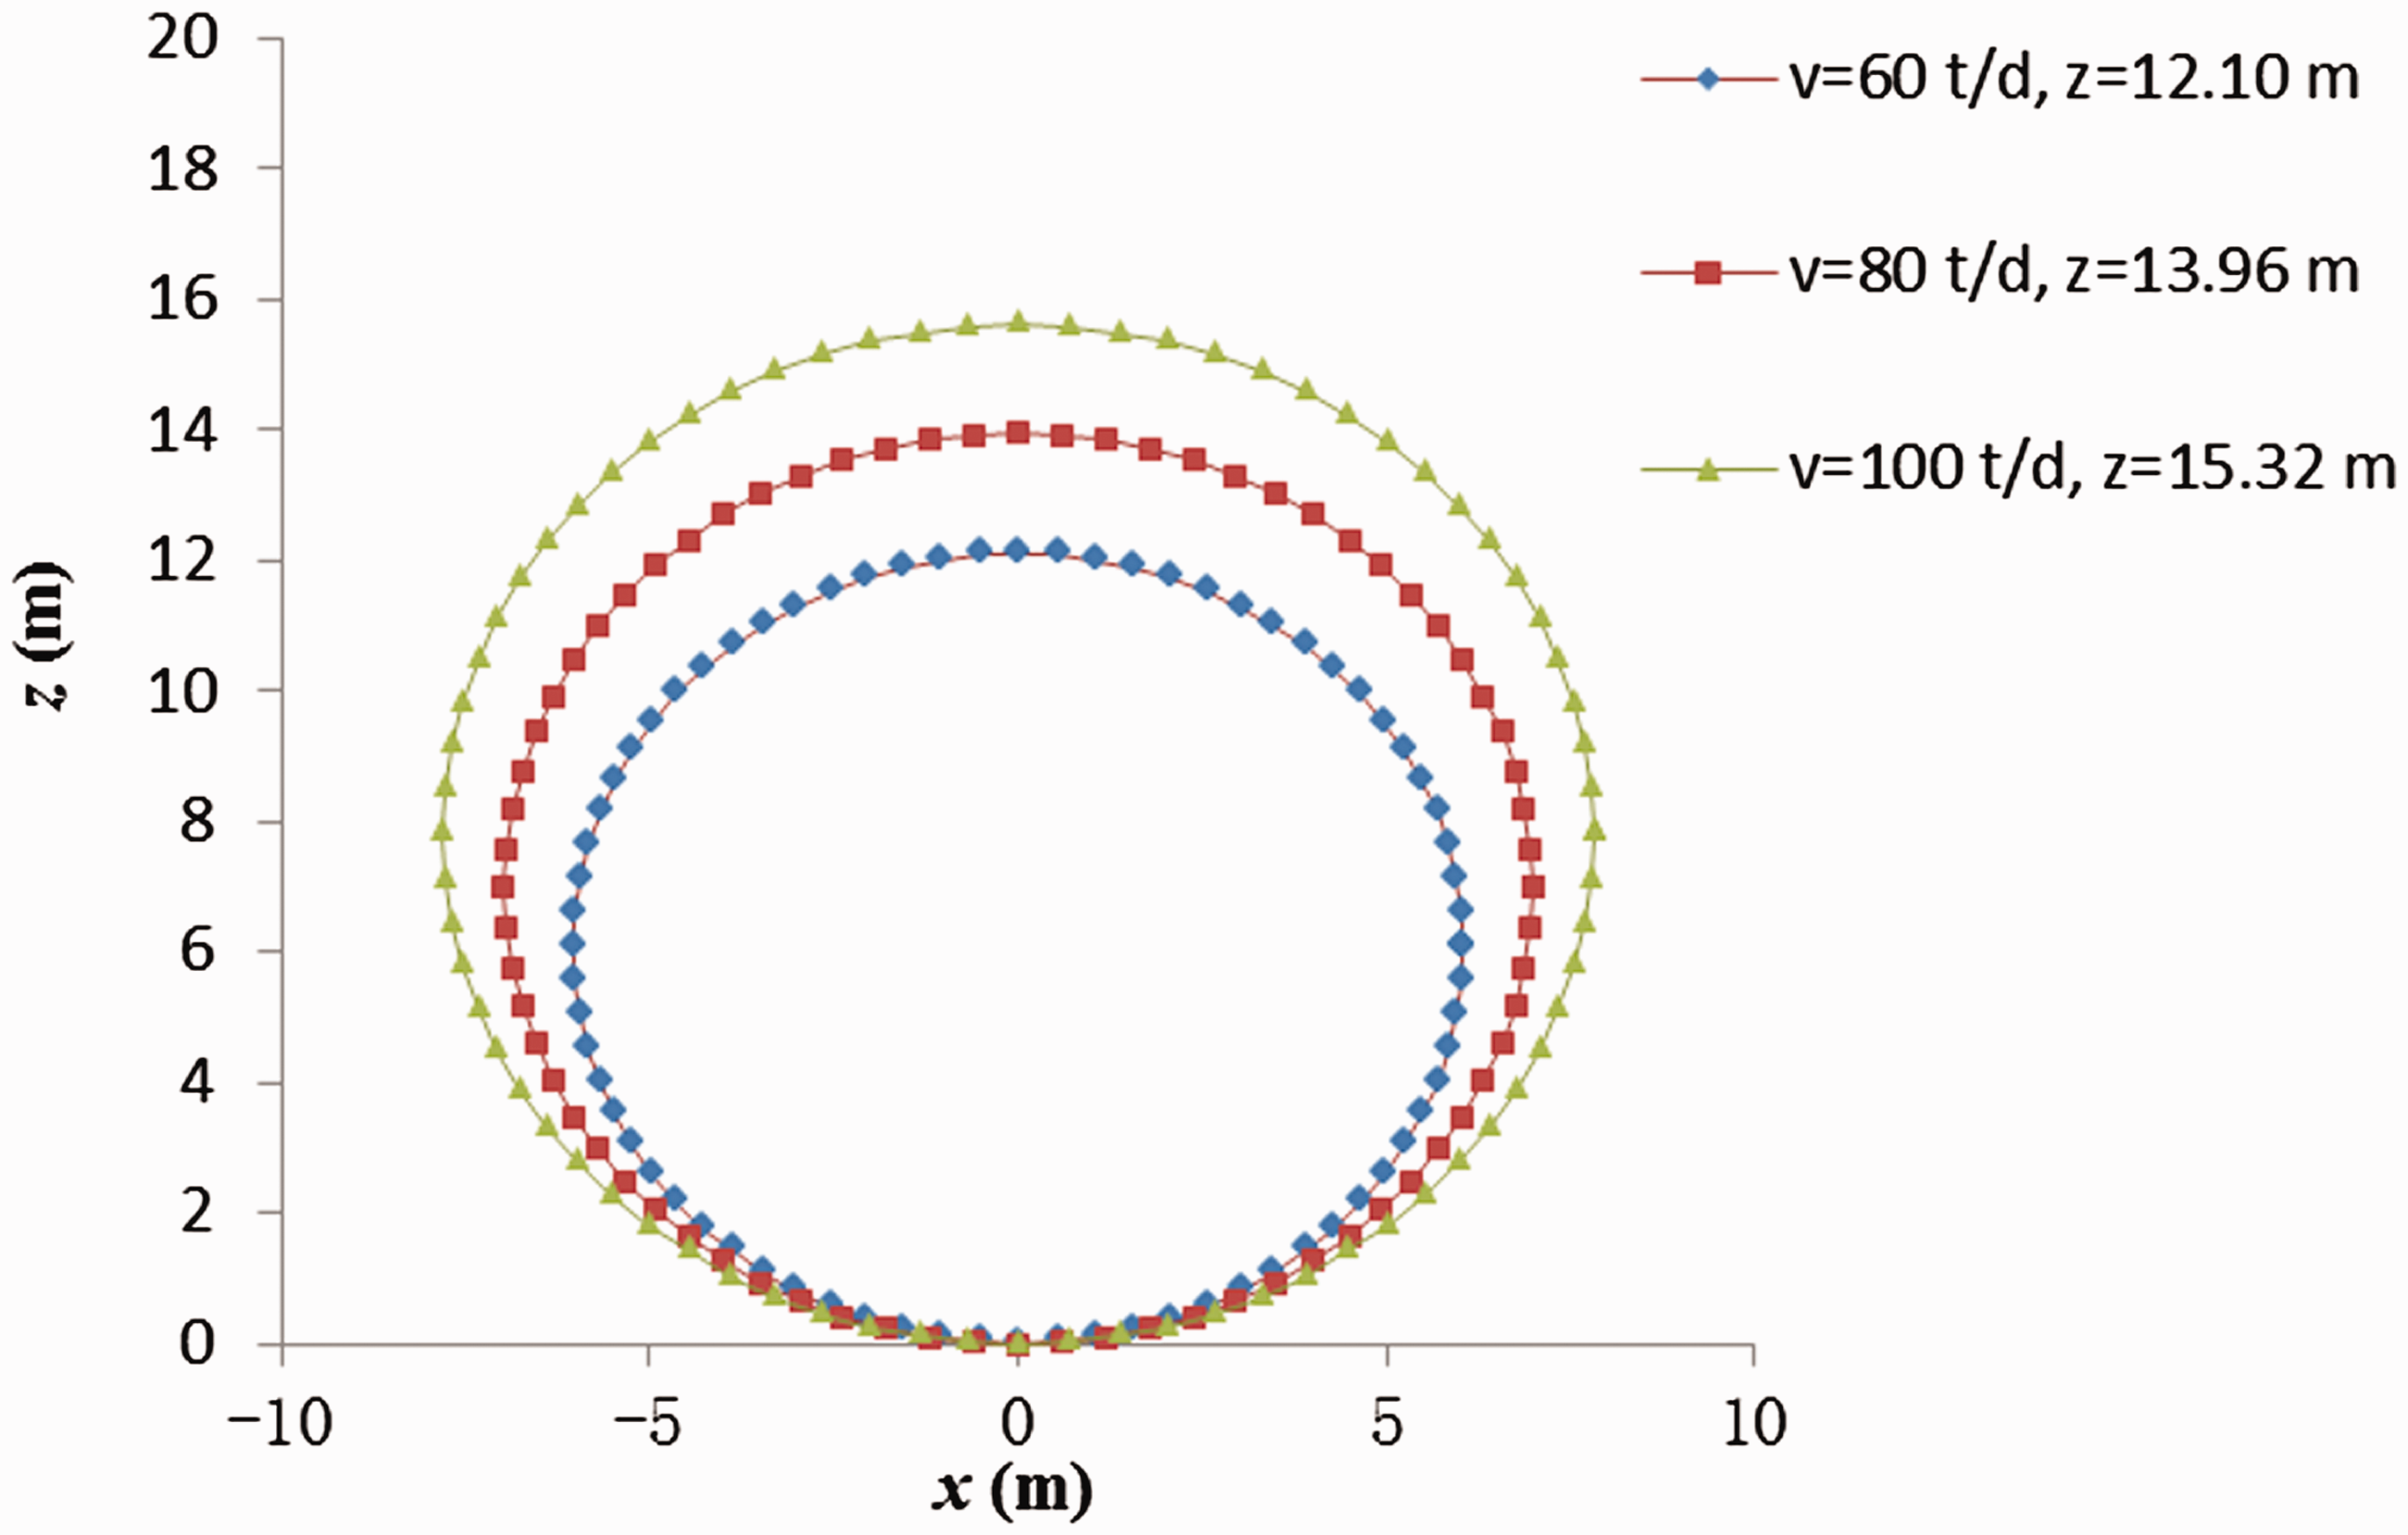
Curves of steam chamber rising height controlled by different steam injection rates.
The curves of the steam chamber rising height controlled by different steam qualities were simulated using a mathematical model. The curves were simulated by setting the steam quality to 0.7, 0.8, and 0.9 under a group of fixed model parameters, i.e. L = 346 m, H = 31.9 m, qs = 90 t/d, and t = 200 d. The latent heat released by the steam is affected by the quality of the steam. The higher the steam quality is, the more latent heat that is released by the steam, the more heavy oil that drains out, and the higher the top of the steam chamber. The rising height of the steam chamber increases with the steam quality, as shown in Figure 3. As the steam quality increases from 0.7 to 0.9, the rising height of the top of the steam chamber increases from 13.44 to 15.24 m, as shown in Figure 3. The steam quality at the bottom of the injection well is influenced by the buried depth of the reservoir. The deeper the buried depth of the reservoir is, the greater the wellbore heat loss and the lower the steam quality at the bottom of the injection well. Thus, SAGD from double horizontal wells is unsuitable for deeply buried reservoirs.
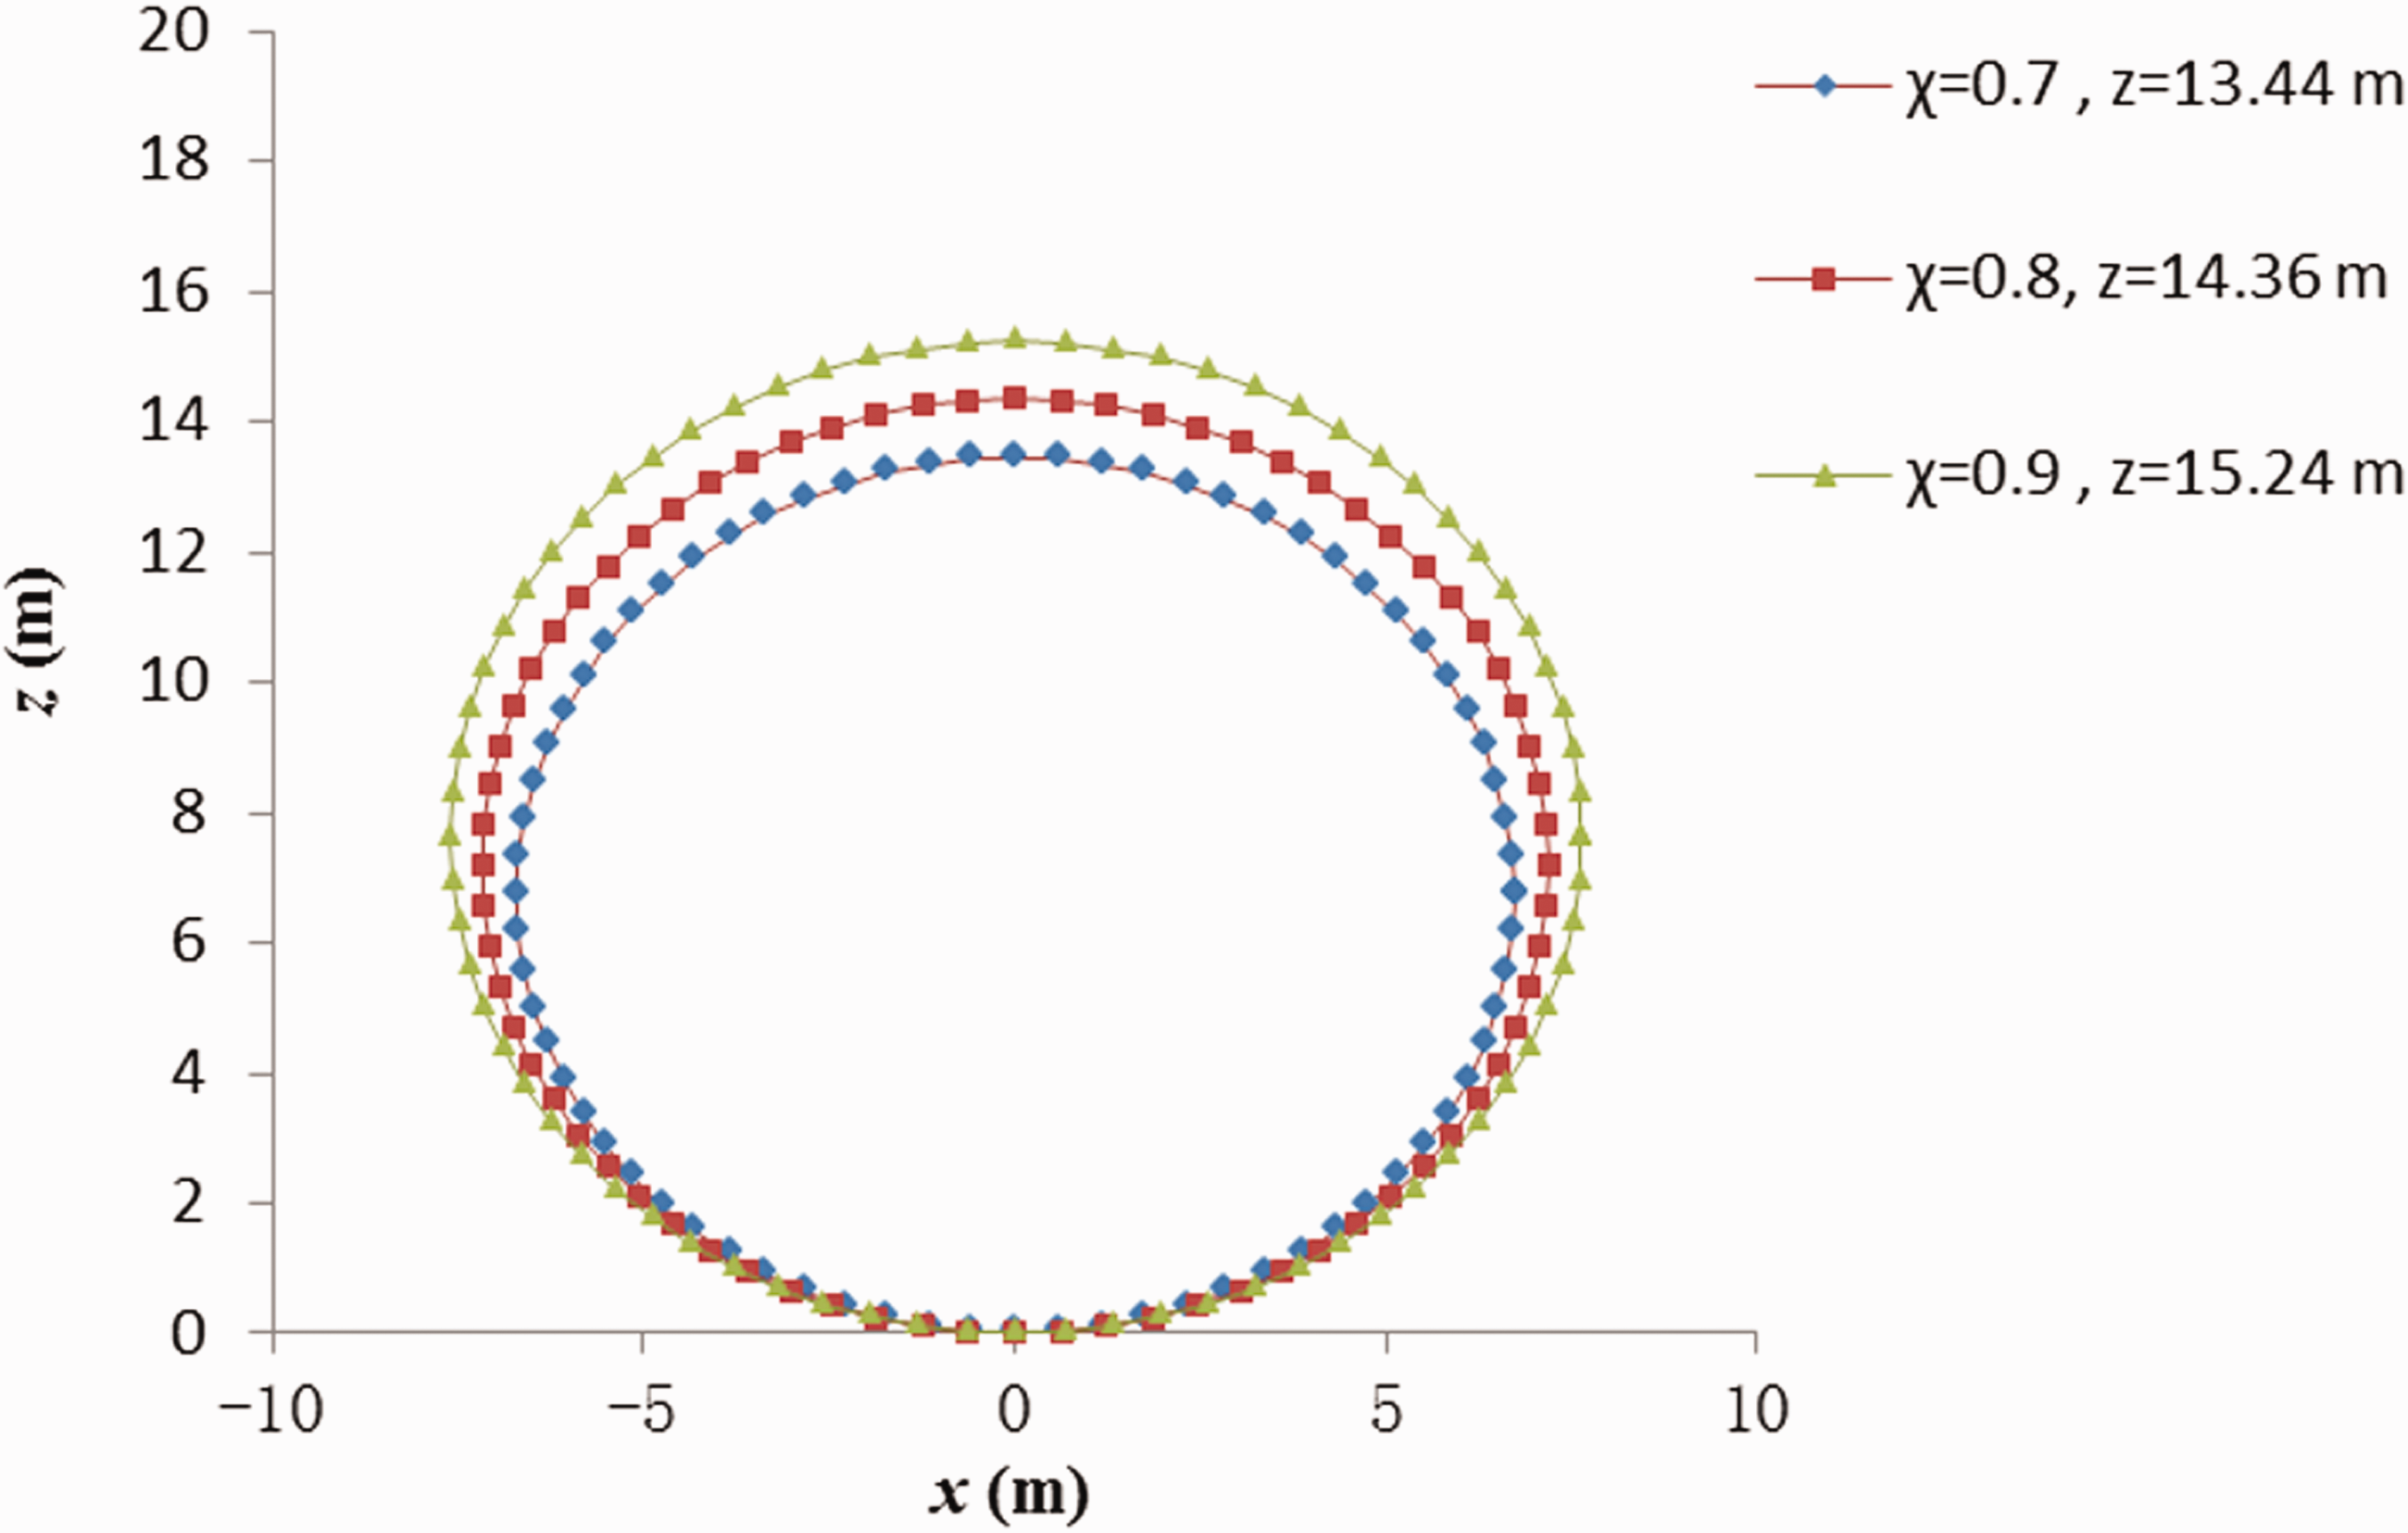
Curves of steam chamber rising height controlled by different steam qualities.
Under a group of fixed model parameters, i.e. H = 31.9 m, qs = 90 t/d, χ = 0.85, and t = 200 d, the curves were simulated by setting the horizontal well length to 250, 350, and 450 m. The steam is injected into the formation through the injection well. Under the same steam injection rate, the longer the horizontal well length is, the smaller the steam injection rate based on the horizontal well length. The rising height of the steam chamber increases with the steam injection rate. Therefore the rising height of the steam chamber decreases with the horizontal well length, as shown in Figure 4. As the horizontal well length increases from 250 to 450 m, the rising height of the top of the steam chamber decreases from 17.92 to 13.36 m, as shown in Figure 4. Thus, under the same steam injection rate, the longer the horizontal well length is, the more time it takes for the steam chamber to reach the cap rock.
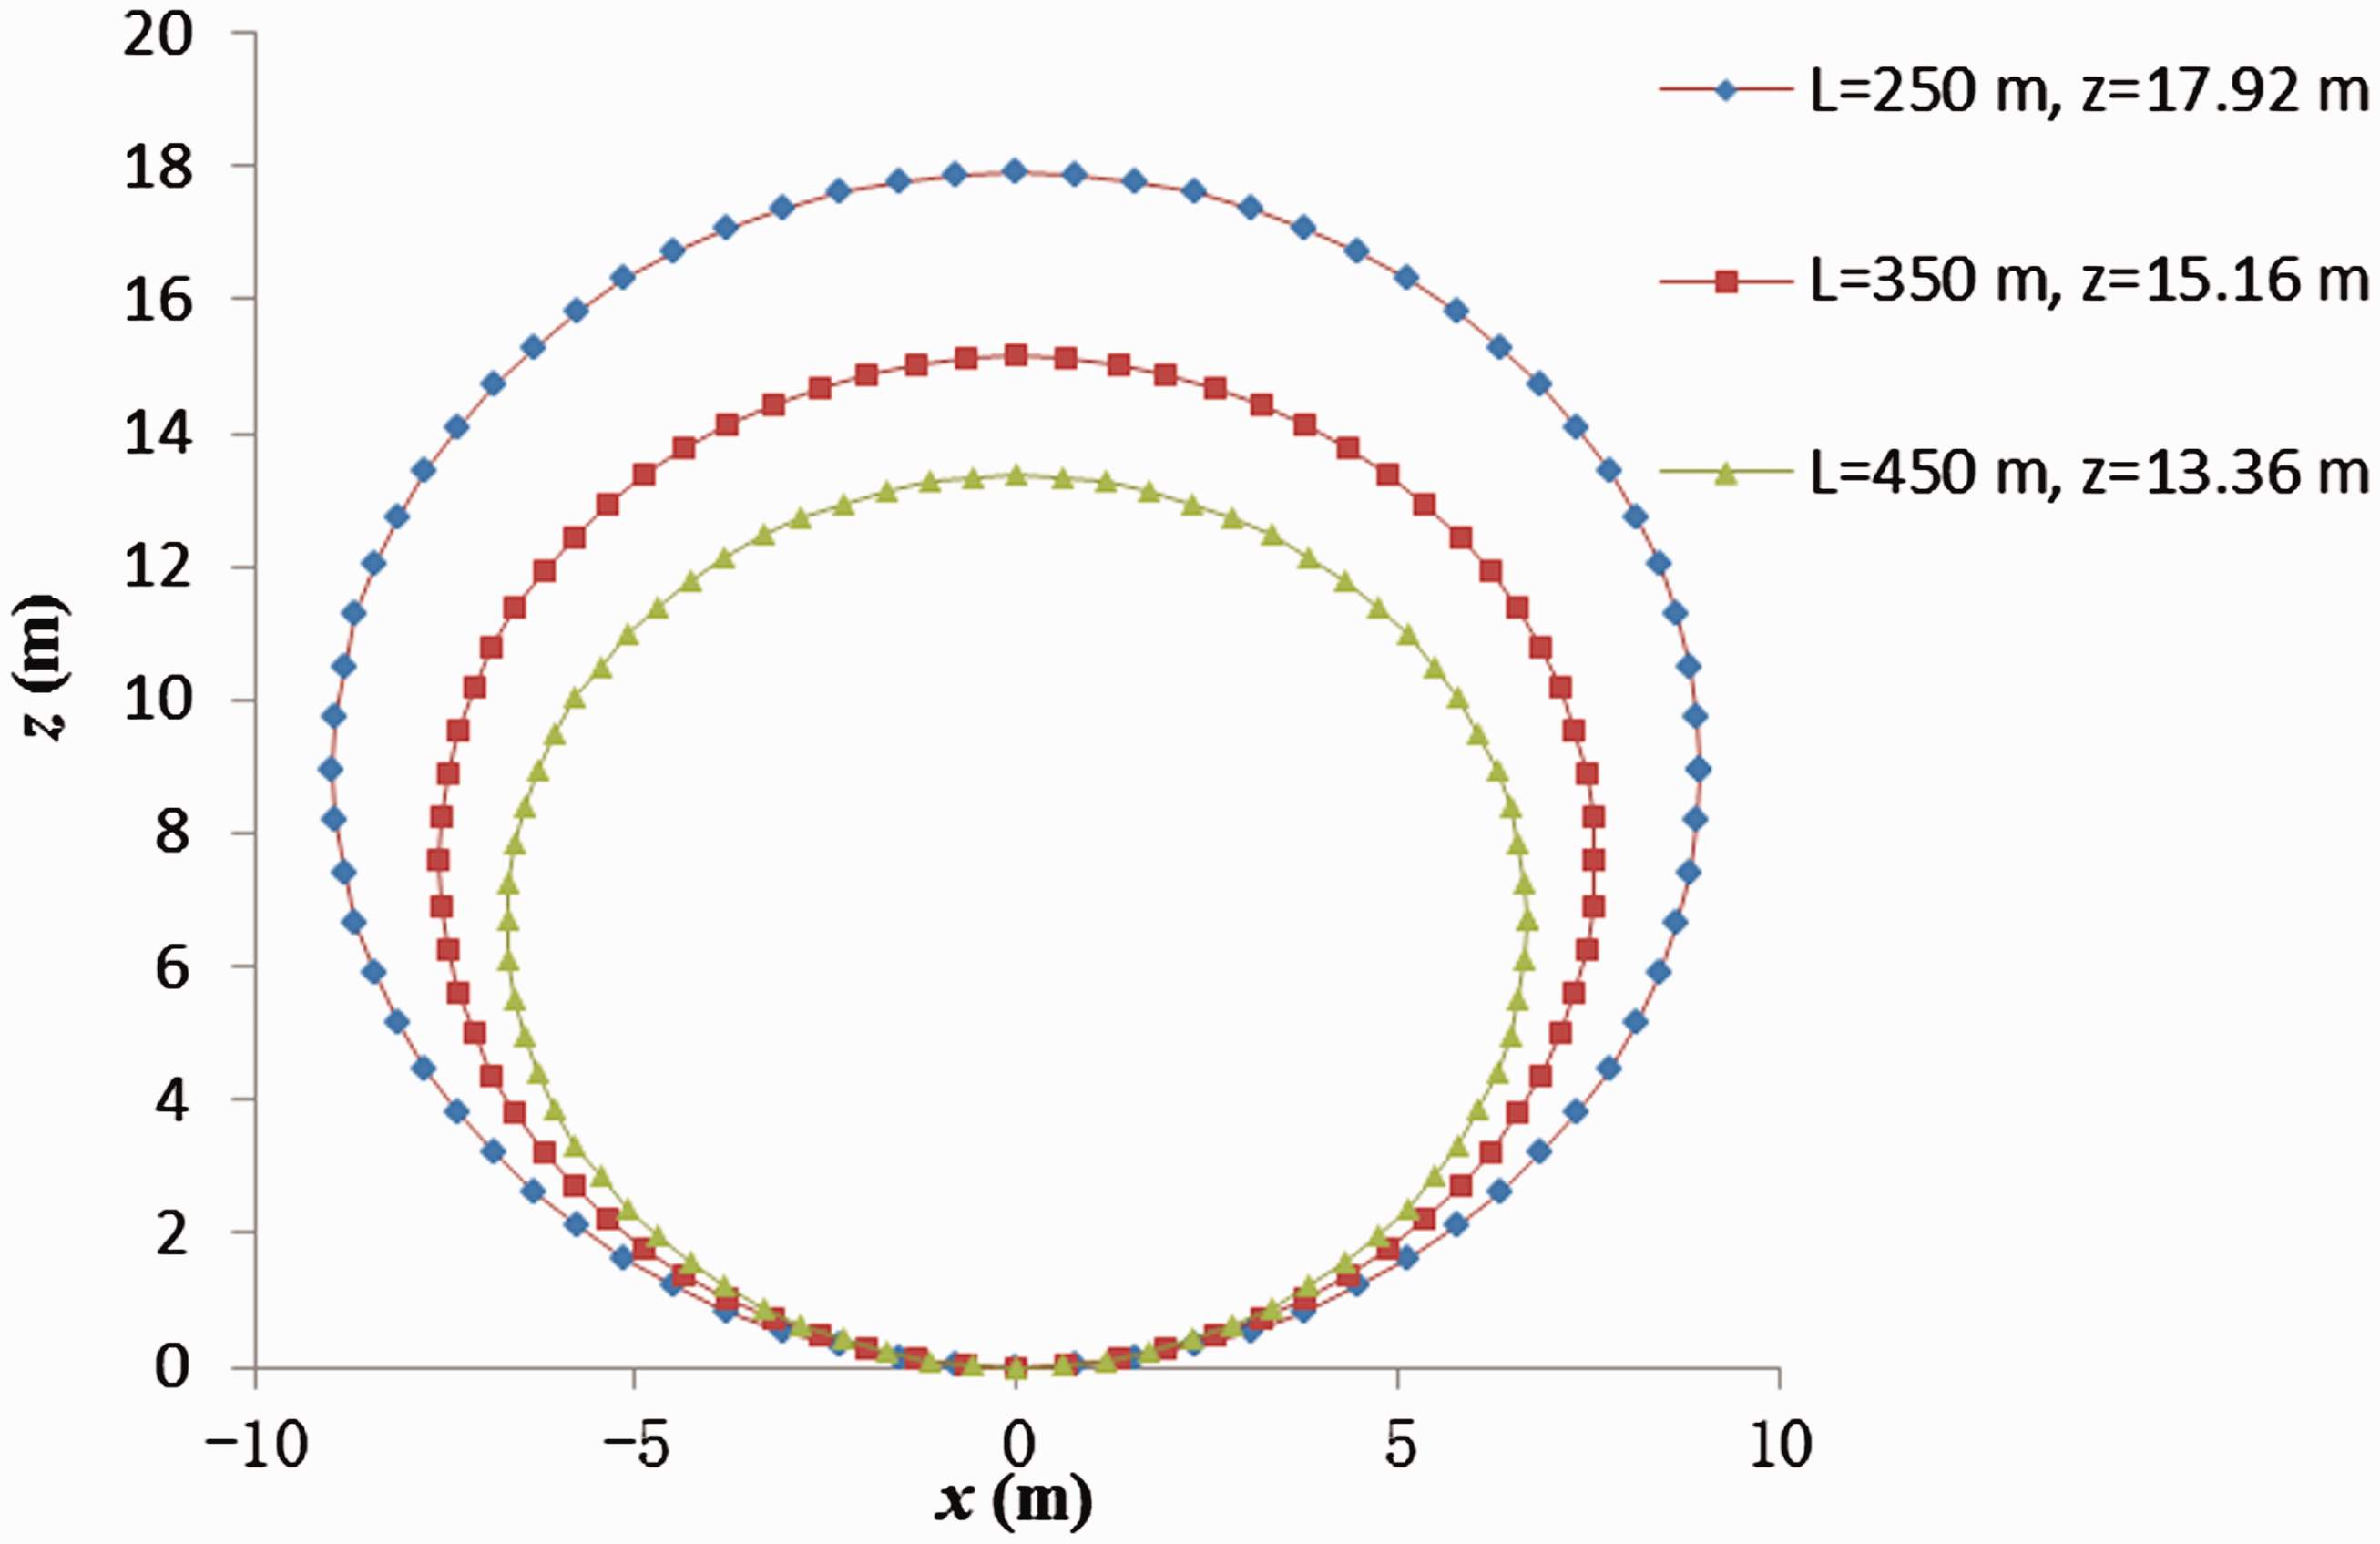
Curves of steam chamber rising height controlled by different horizontal well lengths.
Sensitivity analysis of the daily oil production
We considered the influence of the steam injection rate, the degree of utilization of the horizontal well, and the steam quality on the performance of SAGD during the steam chamber rising stage. The steam oil ratio is an important parameter in the production process of SAGD. In the proposed model, the steam oil ratio is affected by the steam quality and degree of utilization of the horizontal well. Thus, these aspects were also considered during the steam chamber rising stage.
Figure 5 reflects the influence of the different steam injection rates on the daily oil production. The curves were simulated by setting the steam injection rate to 60, 80, and 100 t/d under a group of fixed model parameters, i.e. L = 346 m, H = 31.9 m, χ = 0.85, and D = 100%. The latent heat released by the steam increases with the steam injection rate. Heat is transferred to the reservoir and the oil drains down. The more heat the oil absorbs, the more oil draining down. Thus, the daily oil production increases with the steam injection rate, as shown in Figure 5. As the steam injection rate increases from 60 to 100 t/d, the daily oil production increases from 26.77 to 44.61 t/d, as shown in Figure 5. In an oilfield, we can appropriately increase the steam injection rate to increase the daily oil production.
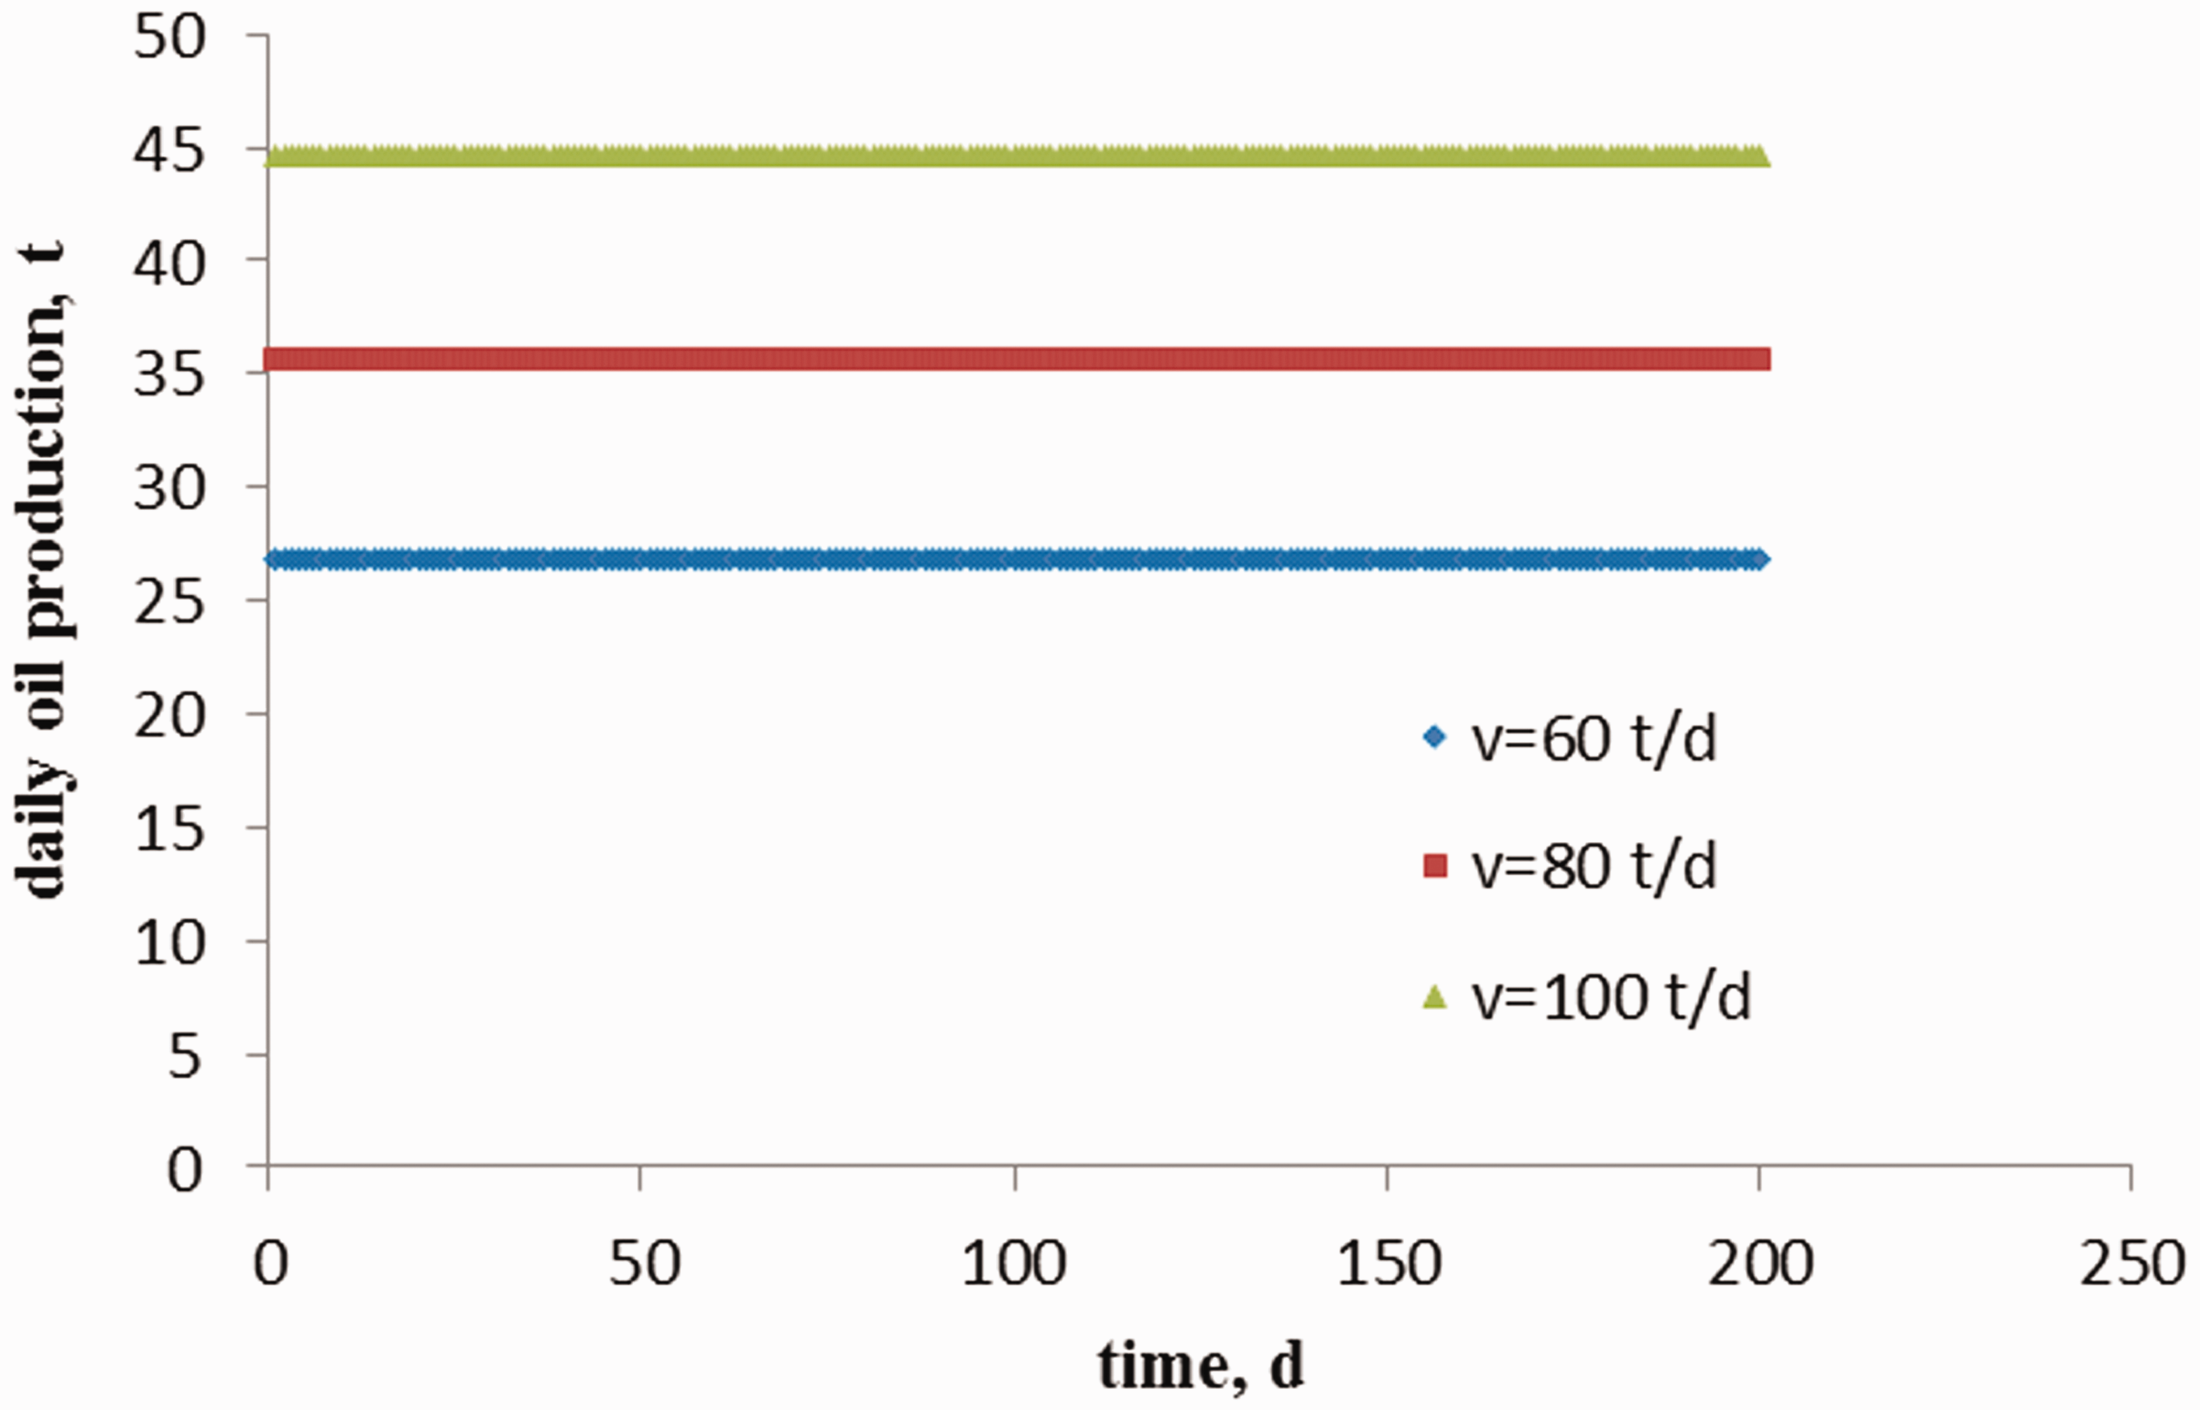
Daily oil production curves controlled by different steam injection rates.
The curves of the daily oil production and steam oil ratio controlled by different steam qualities were simulated using a mathematical model. The curves were simulated by setting the steam quality to 0.7, 0.8, and 0.9 under a group of fixed model parameters, i.e. L = 346 m, H = 31.9 m, qs = 90 t/d, and D = 100%. The latent heat released by the steam increases with the steam quality. The oil absorbs the heat and drains down. The more heat the oil absorbs, the more oil that drains out. Thus, the daily oil production increases with the steam quality, as shown in Figure 6. As the steam quality increases from 0.7 to 0.9, the daily oil production increases from 33.07 to 42.51 t/d, as shown in Figure 6. Under the same steam injection rate, the higher the steam quality is, the more oil that drains out, and the smaller the steam oil ratio, as shown in Figure 7. As the steam quality increases from 0.7 to 0.9, the steam oil ratio decreases from 2.80 to 2.24 t/t, as shown in Figure 7.
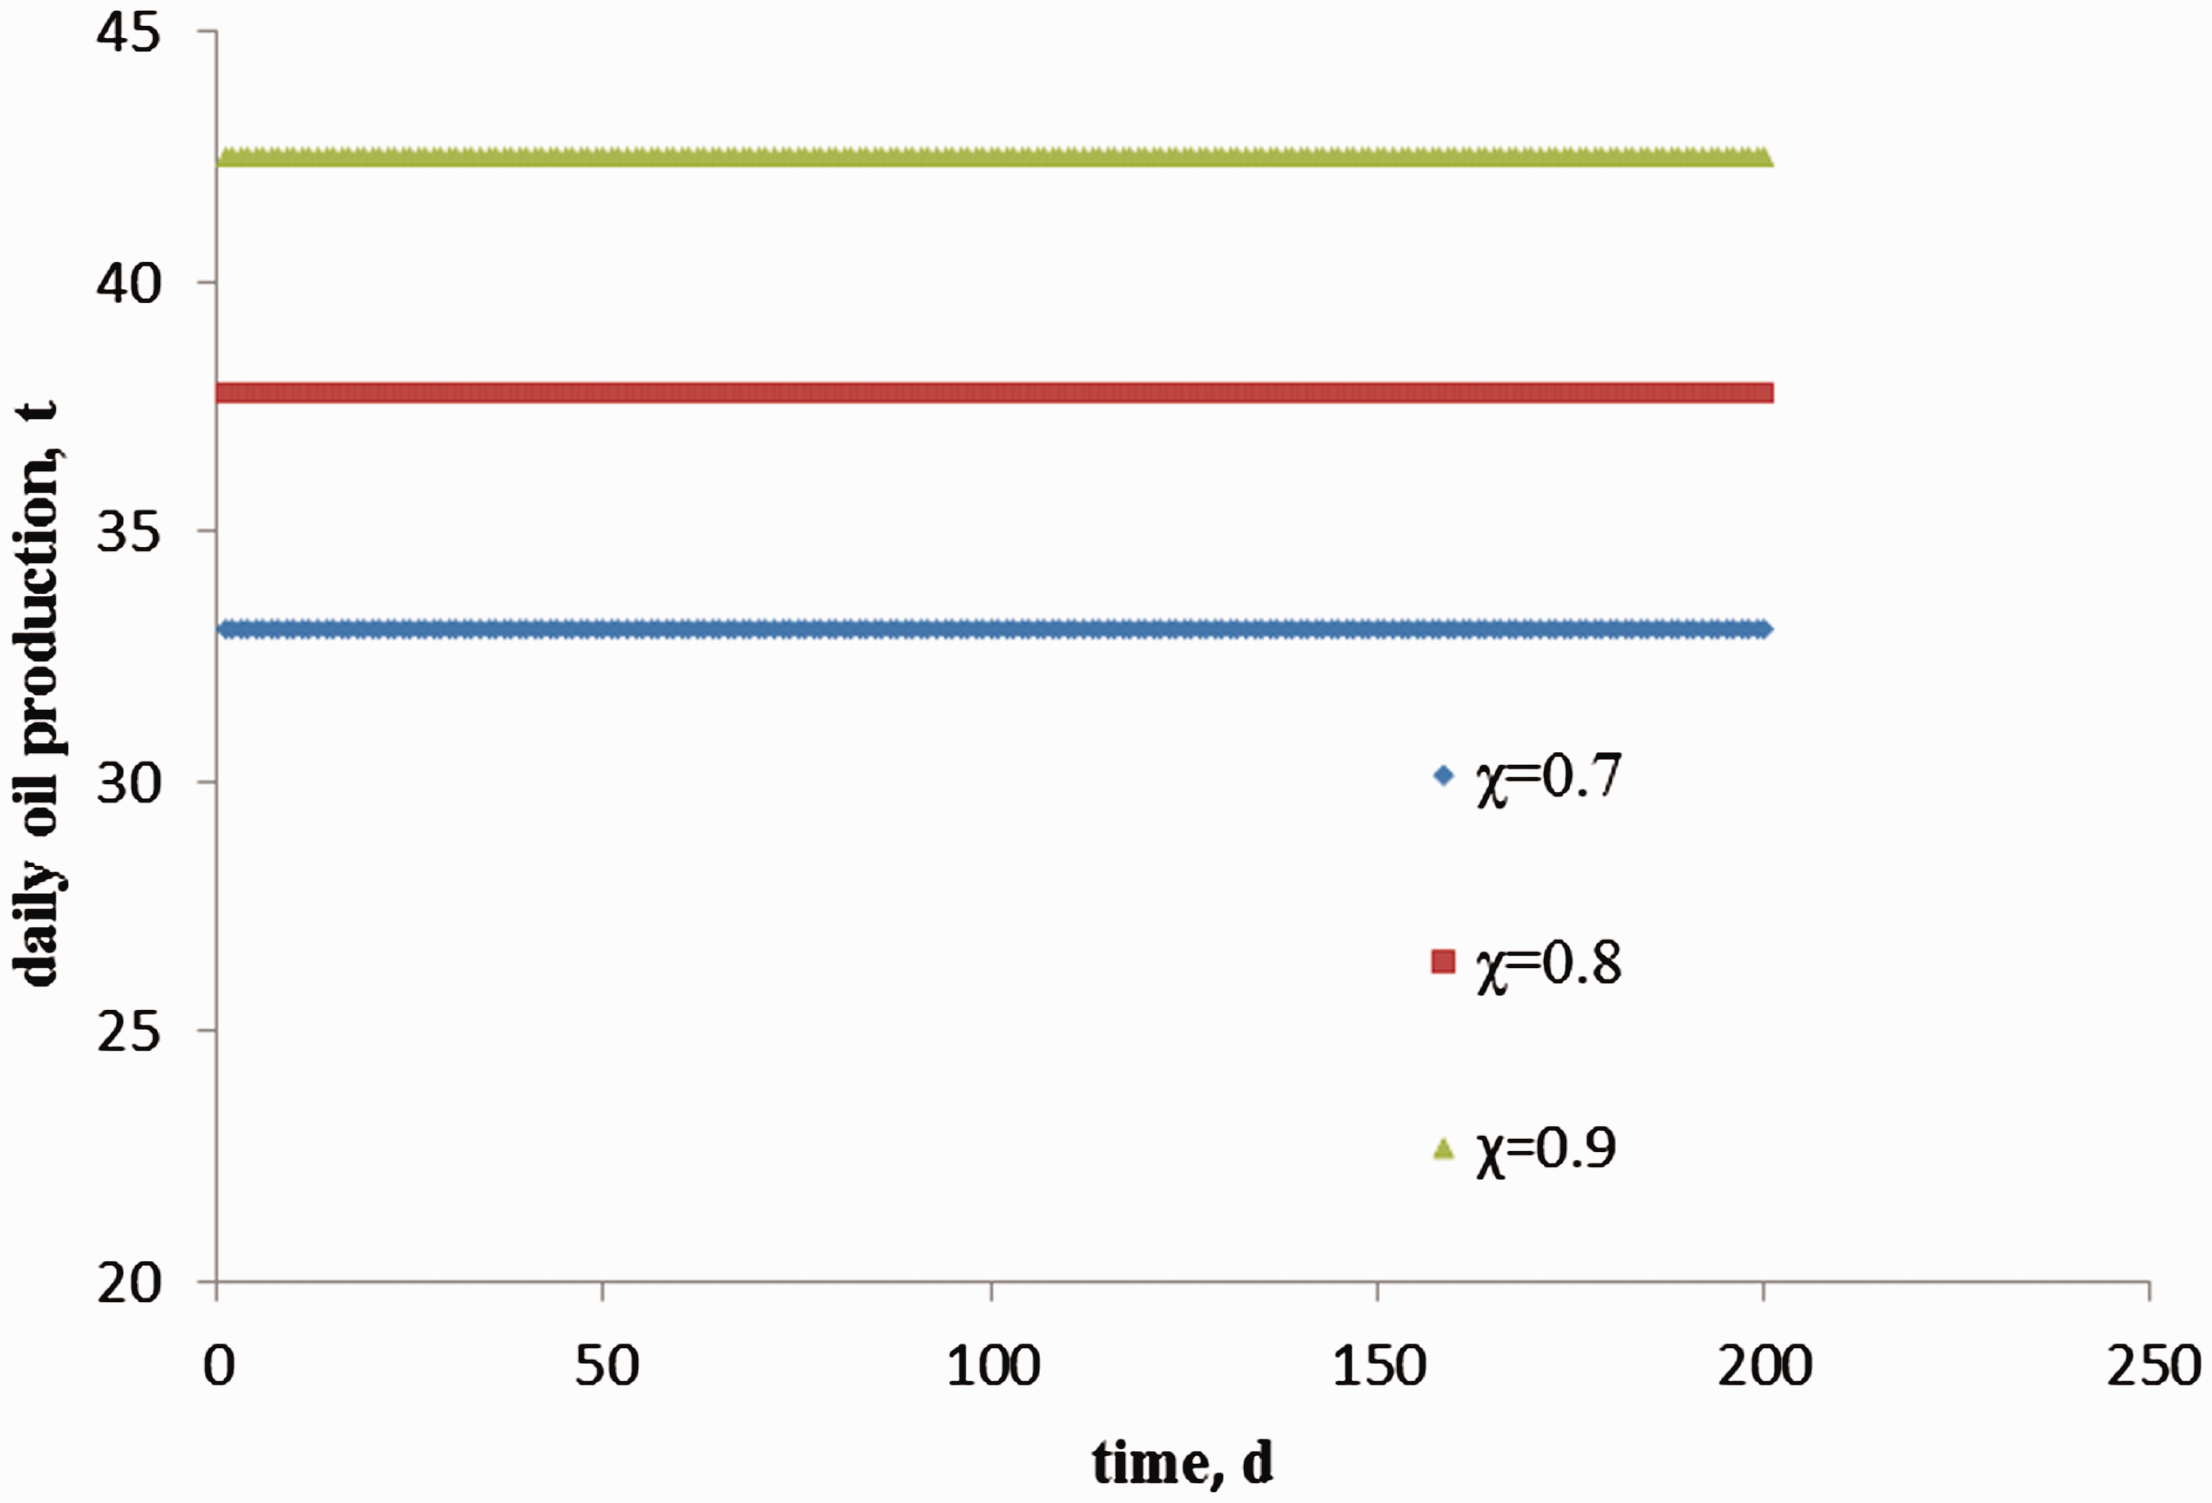
Daily oil production curves controlled by different steam qualities.
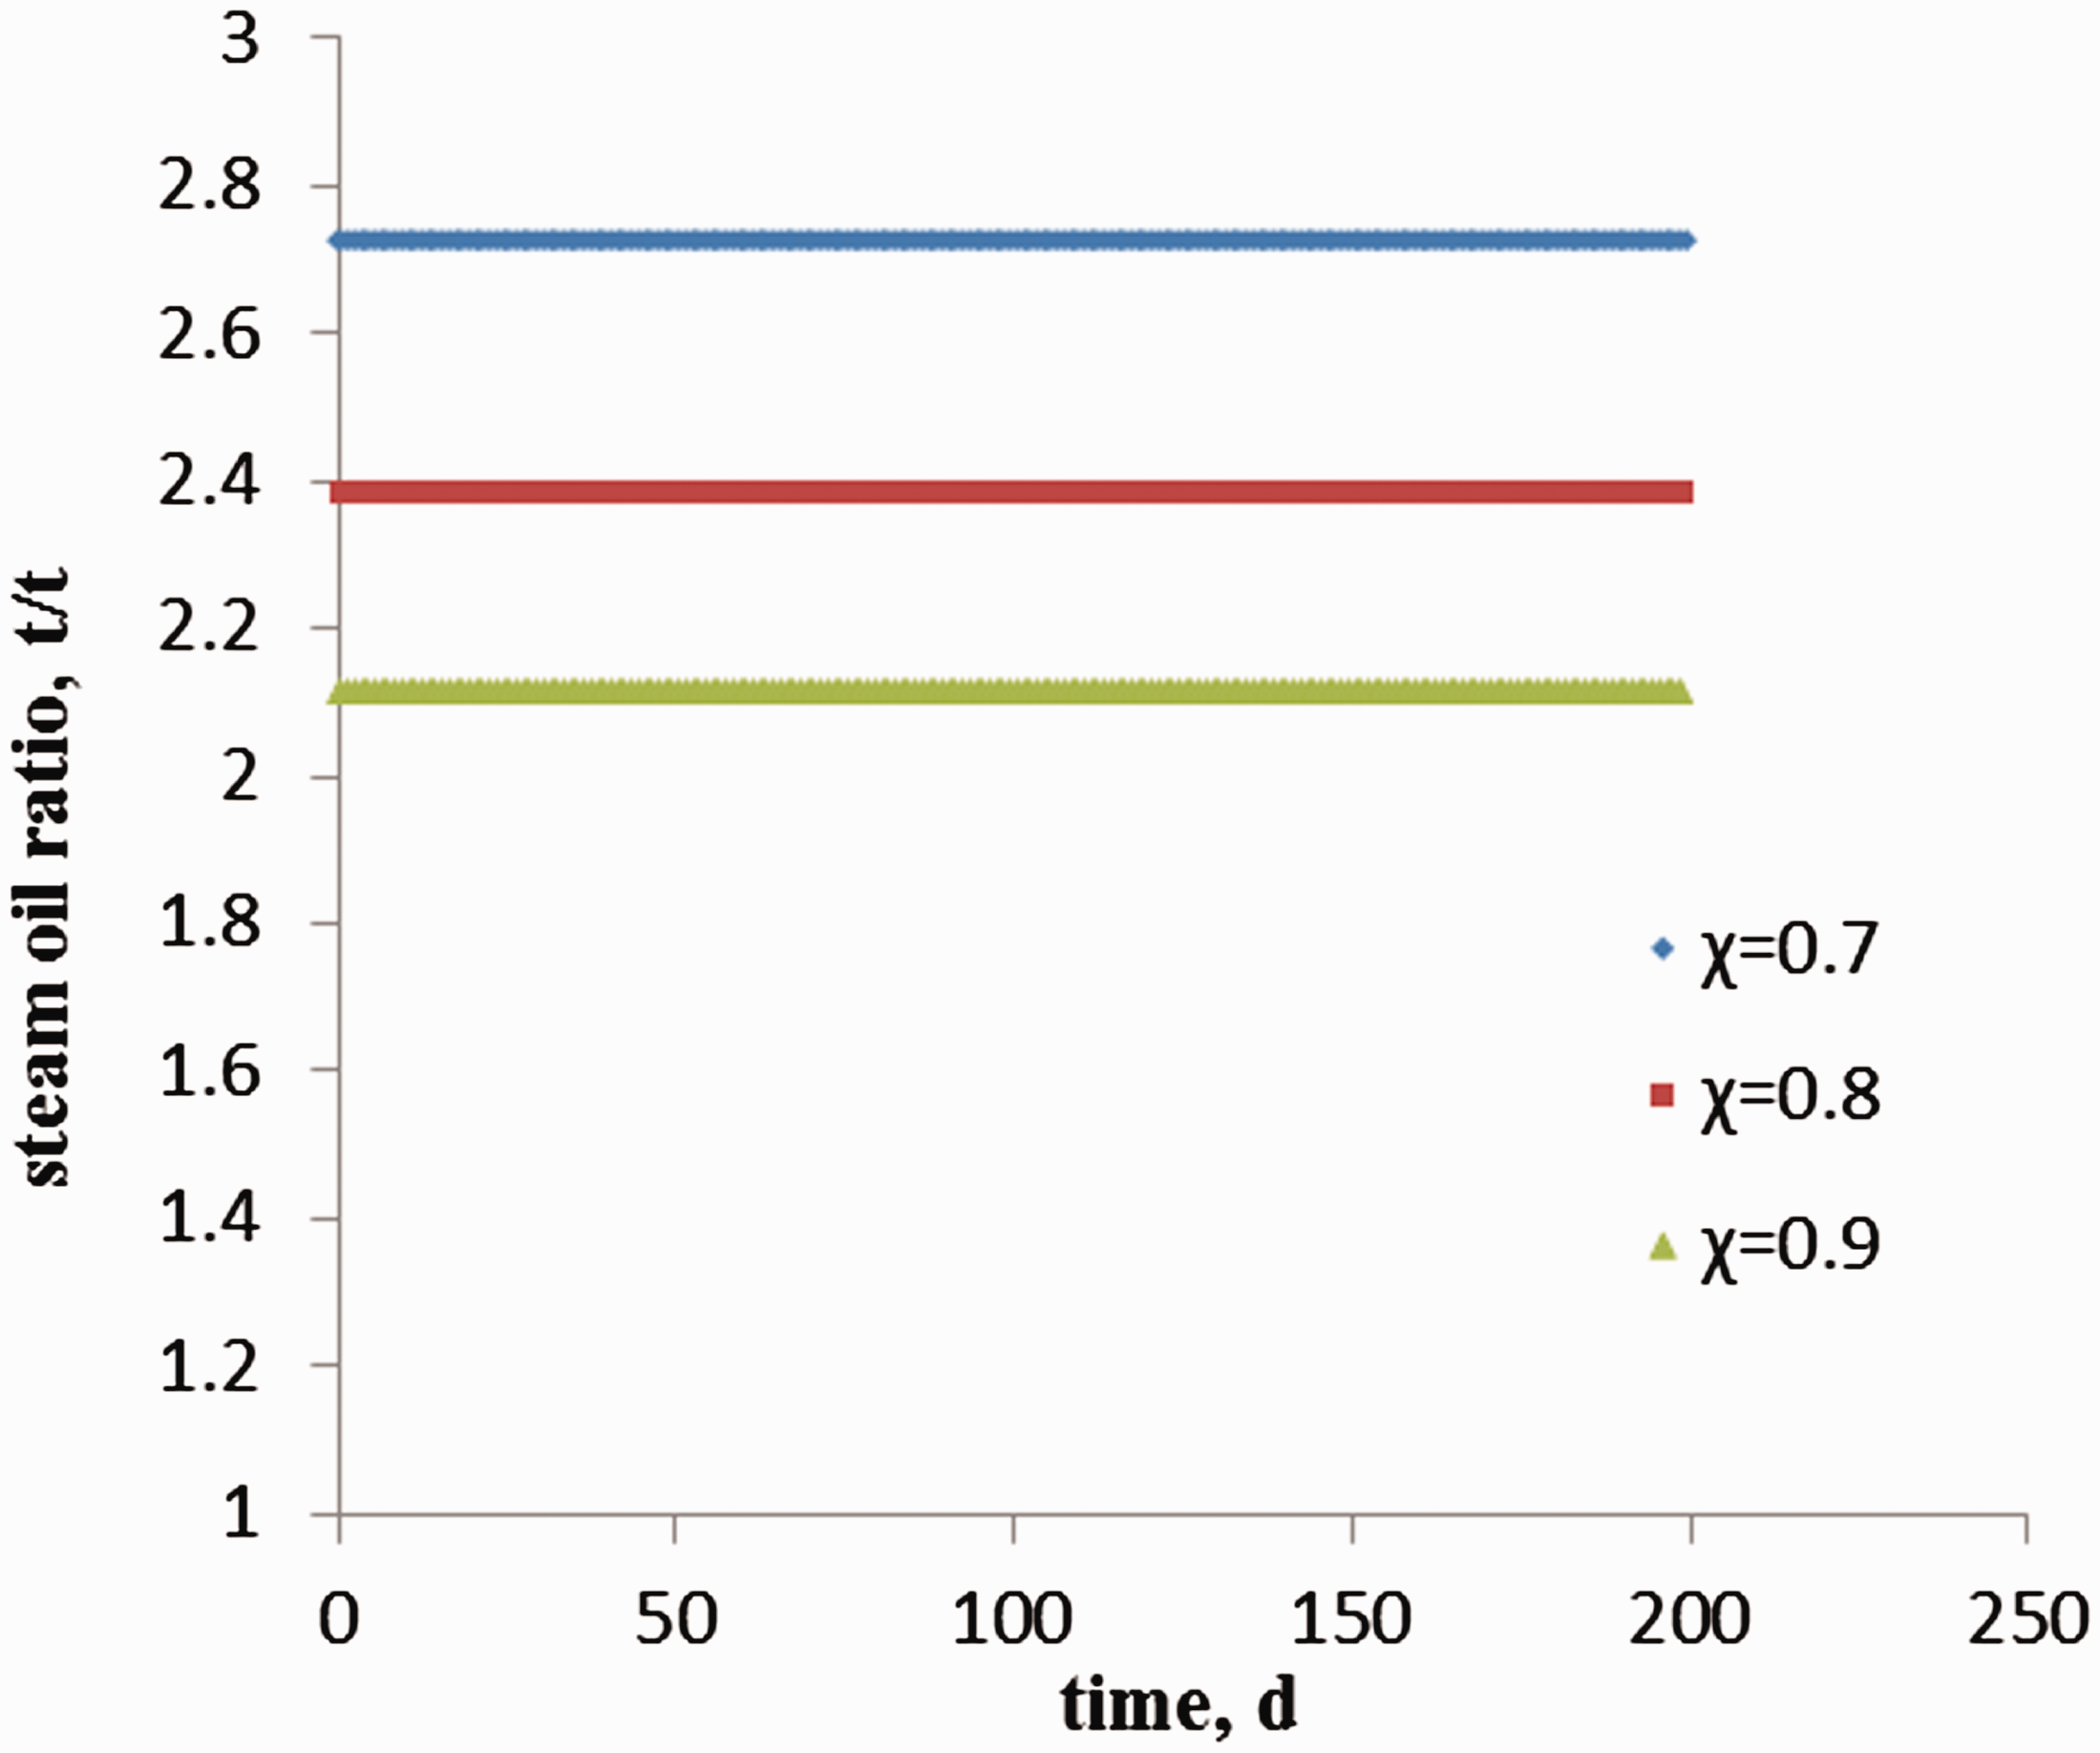
Steam oil ratio curves controlled by different steam qualities.
Under a group of fixed model parameters, i.e. L = 346 m, H = 31.9 m, qs = 90 t/d, and χ = 0.85, the curves of the daily oil production and steam oil ratio were simulated by setting the degree of utilization of the horizontal well to 80%, 90%, and 100%. If a portion of the heavy oil above the horizontal well cannot flow to the production well, the degree of utilization of the horizontal well will decrease. Thus, the smaller the degree of utilization, the smaller the daily oil production, as shown in Figure 8. As the degree of utilization of the horizontal well increases from 80% to 100%, the daily oil production increases from 32.12 to 40.15 t/d, as shown in Figure 8. The daily oil production increases with the degree of utilization of the horizontal well. Thus, the steam oil ratio decreases with this factor under the same steam injection rate, as shown in Figure 9. As the degree of utilization of the horizontal well increases from 80% to 100%, the steam oil ration decreases from 2.80 to 2.24 t/t, as shown in Figure 9. In an oilfield, the reservoir heterogeneity, the mode of steam injection, and the steam channeling may cause a poor degree of utilization of the horizontal well.
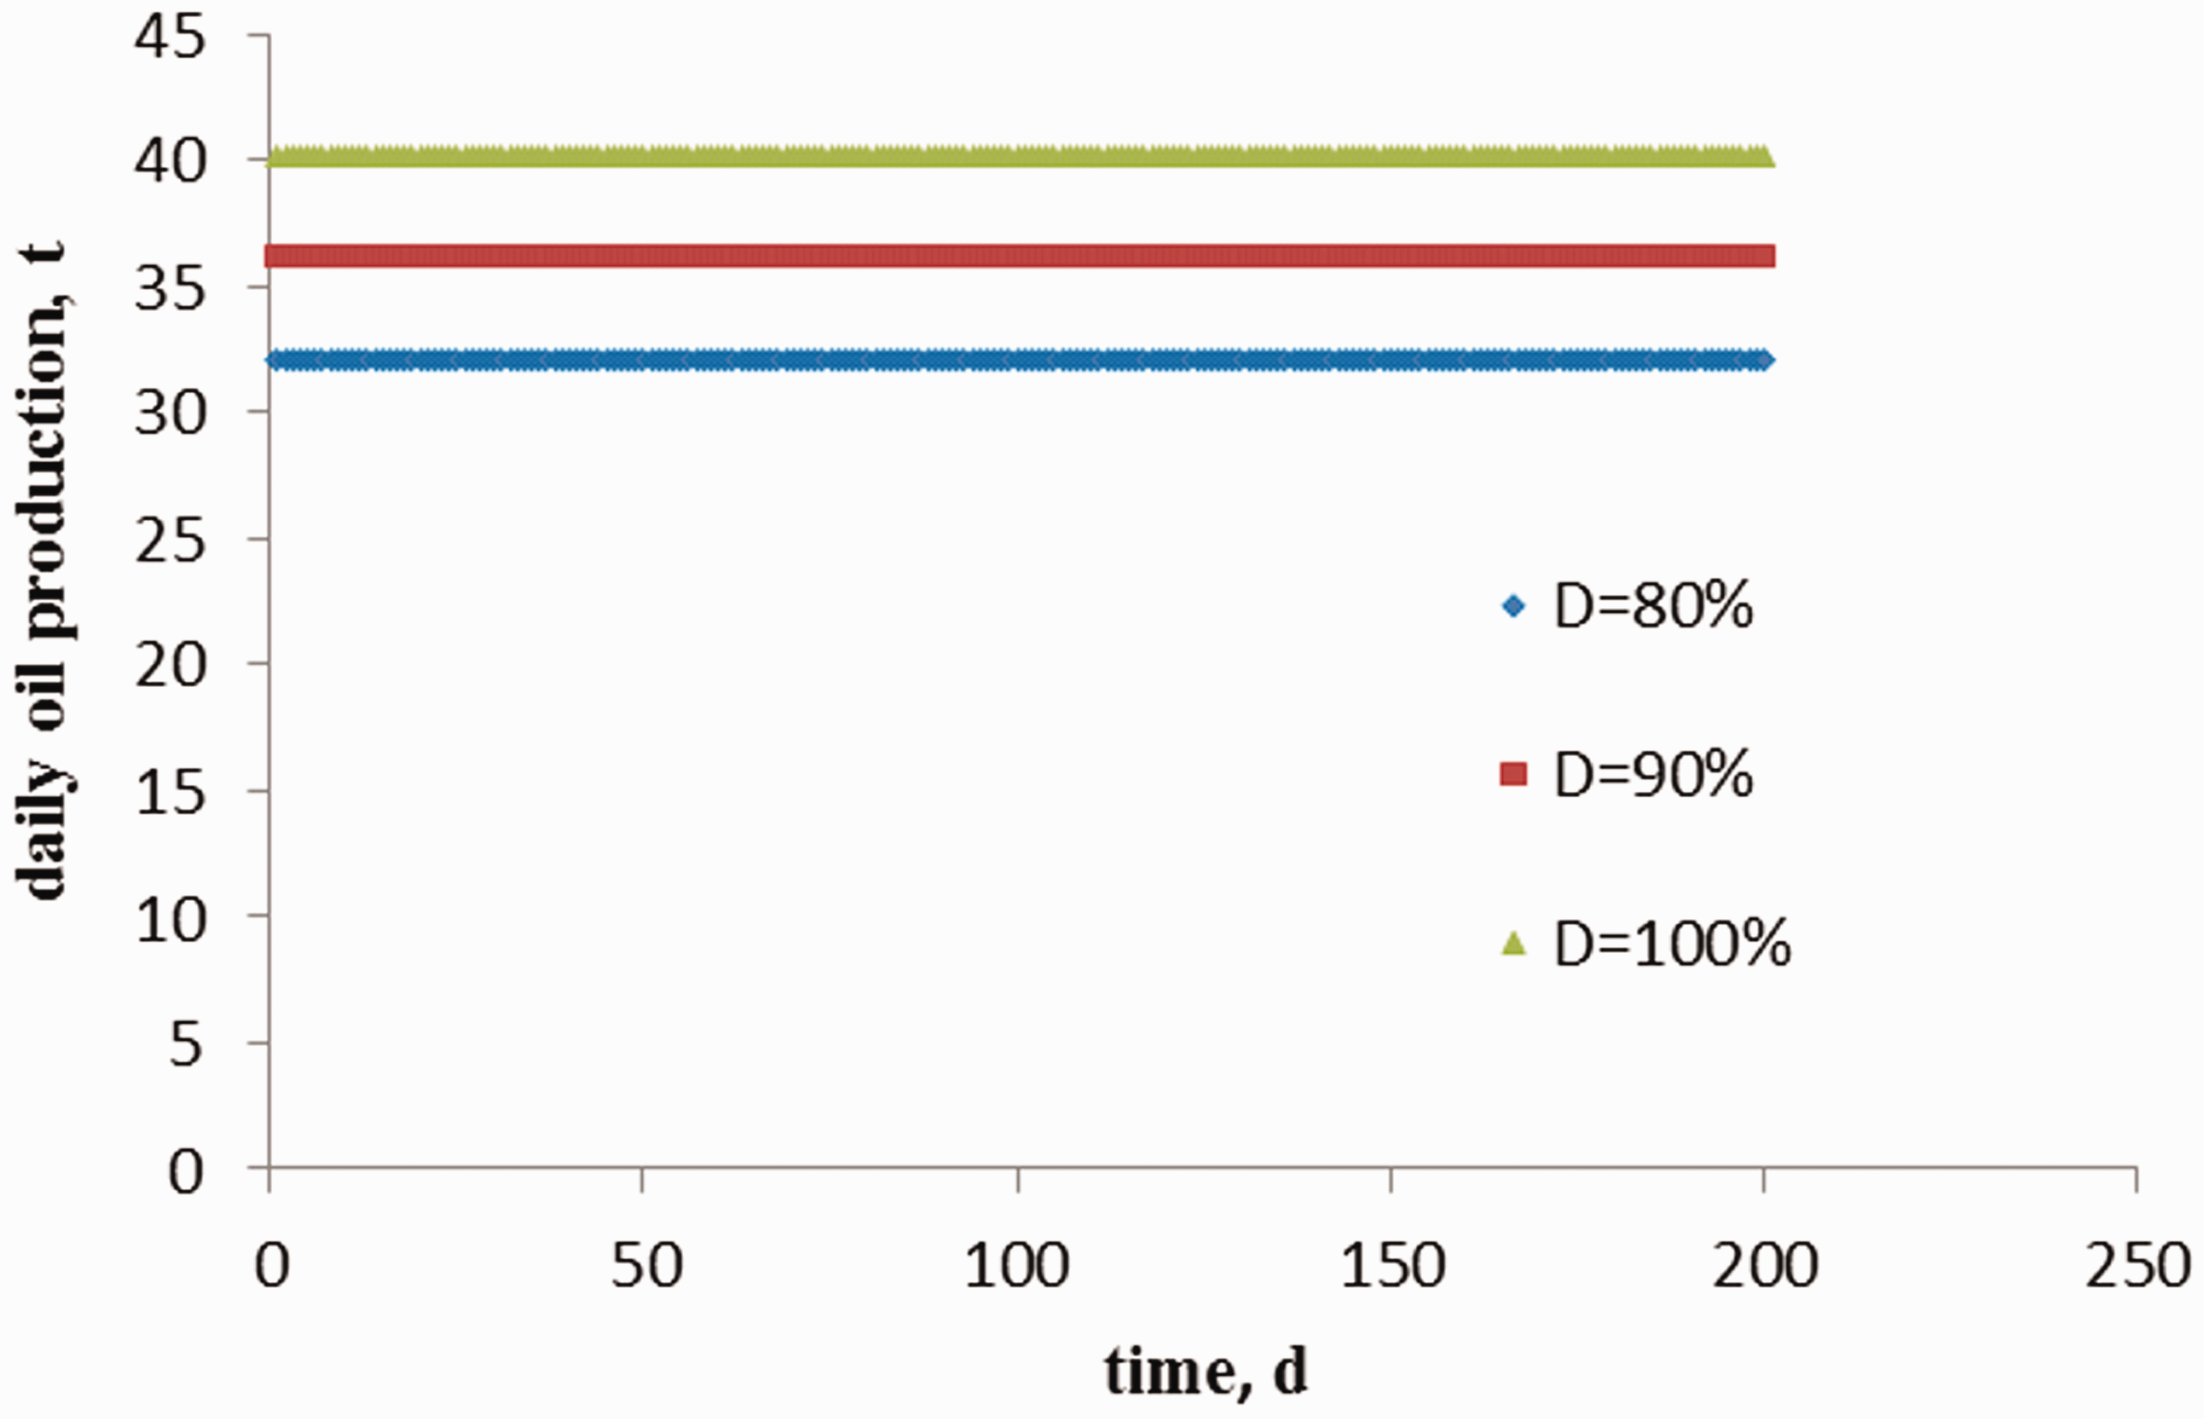
Daily oil production curves controlled by different degrees of utilization of a horizontal well.
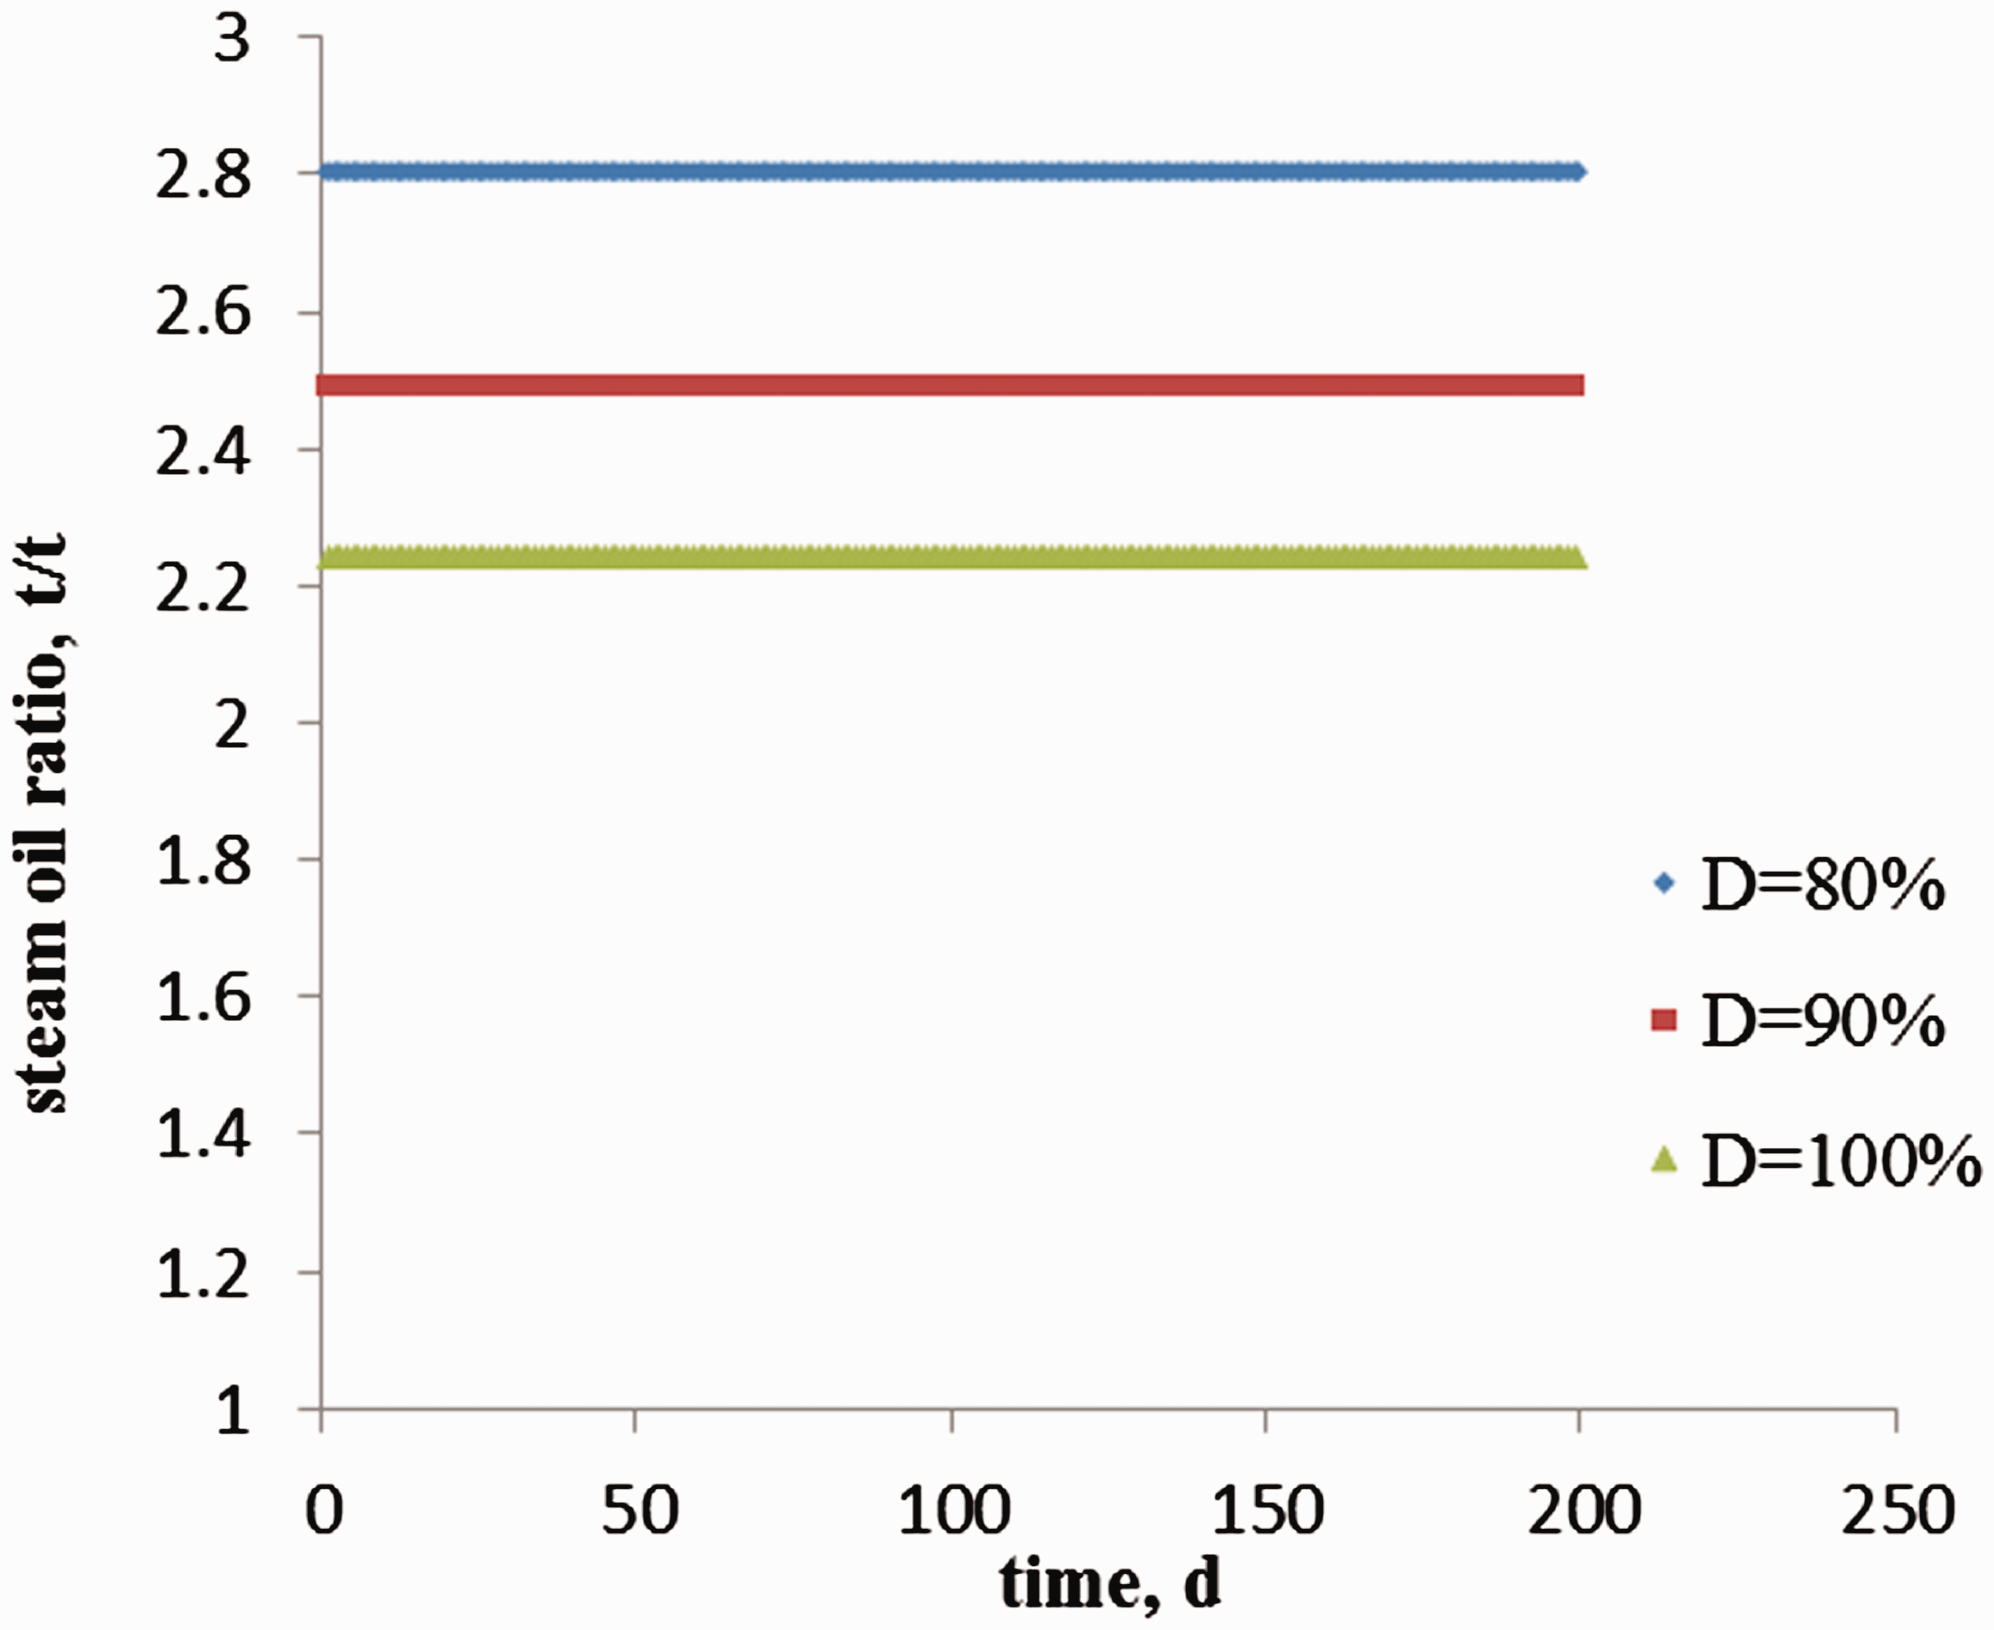
Steam oil ratio curves controlled by different degrees of utilization of a horizontal well.
Model application
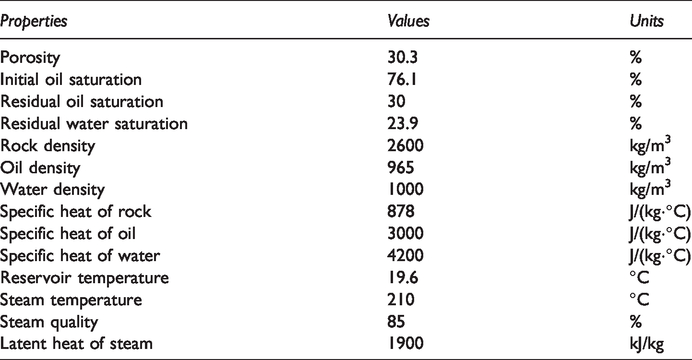
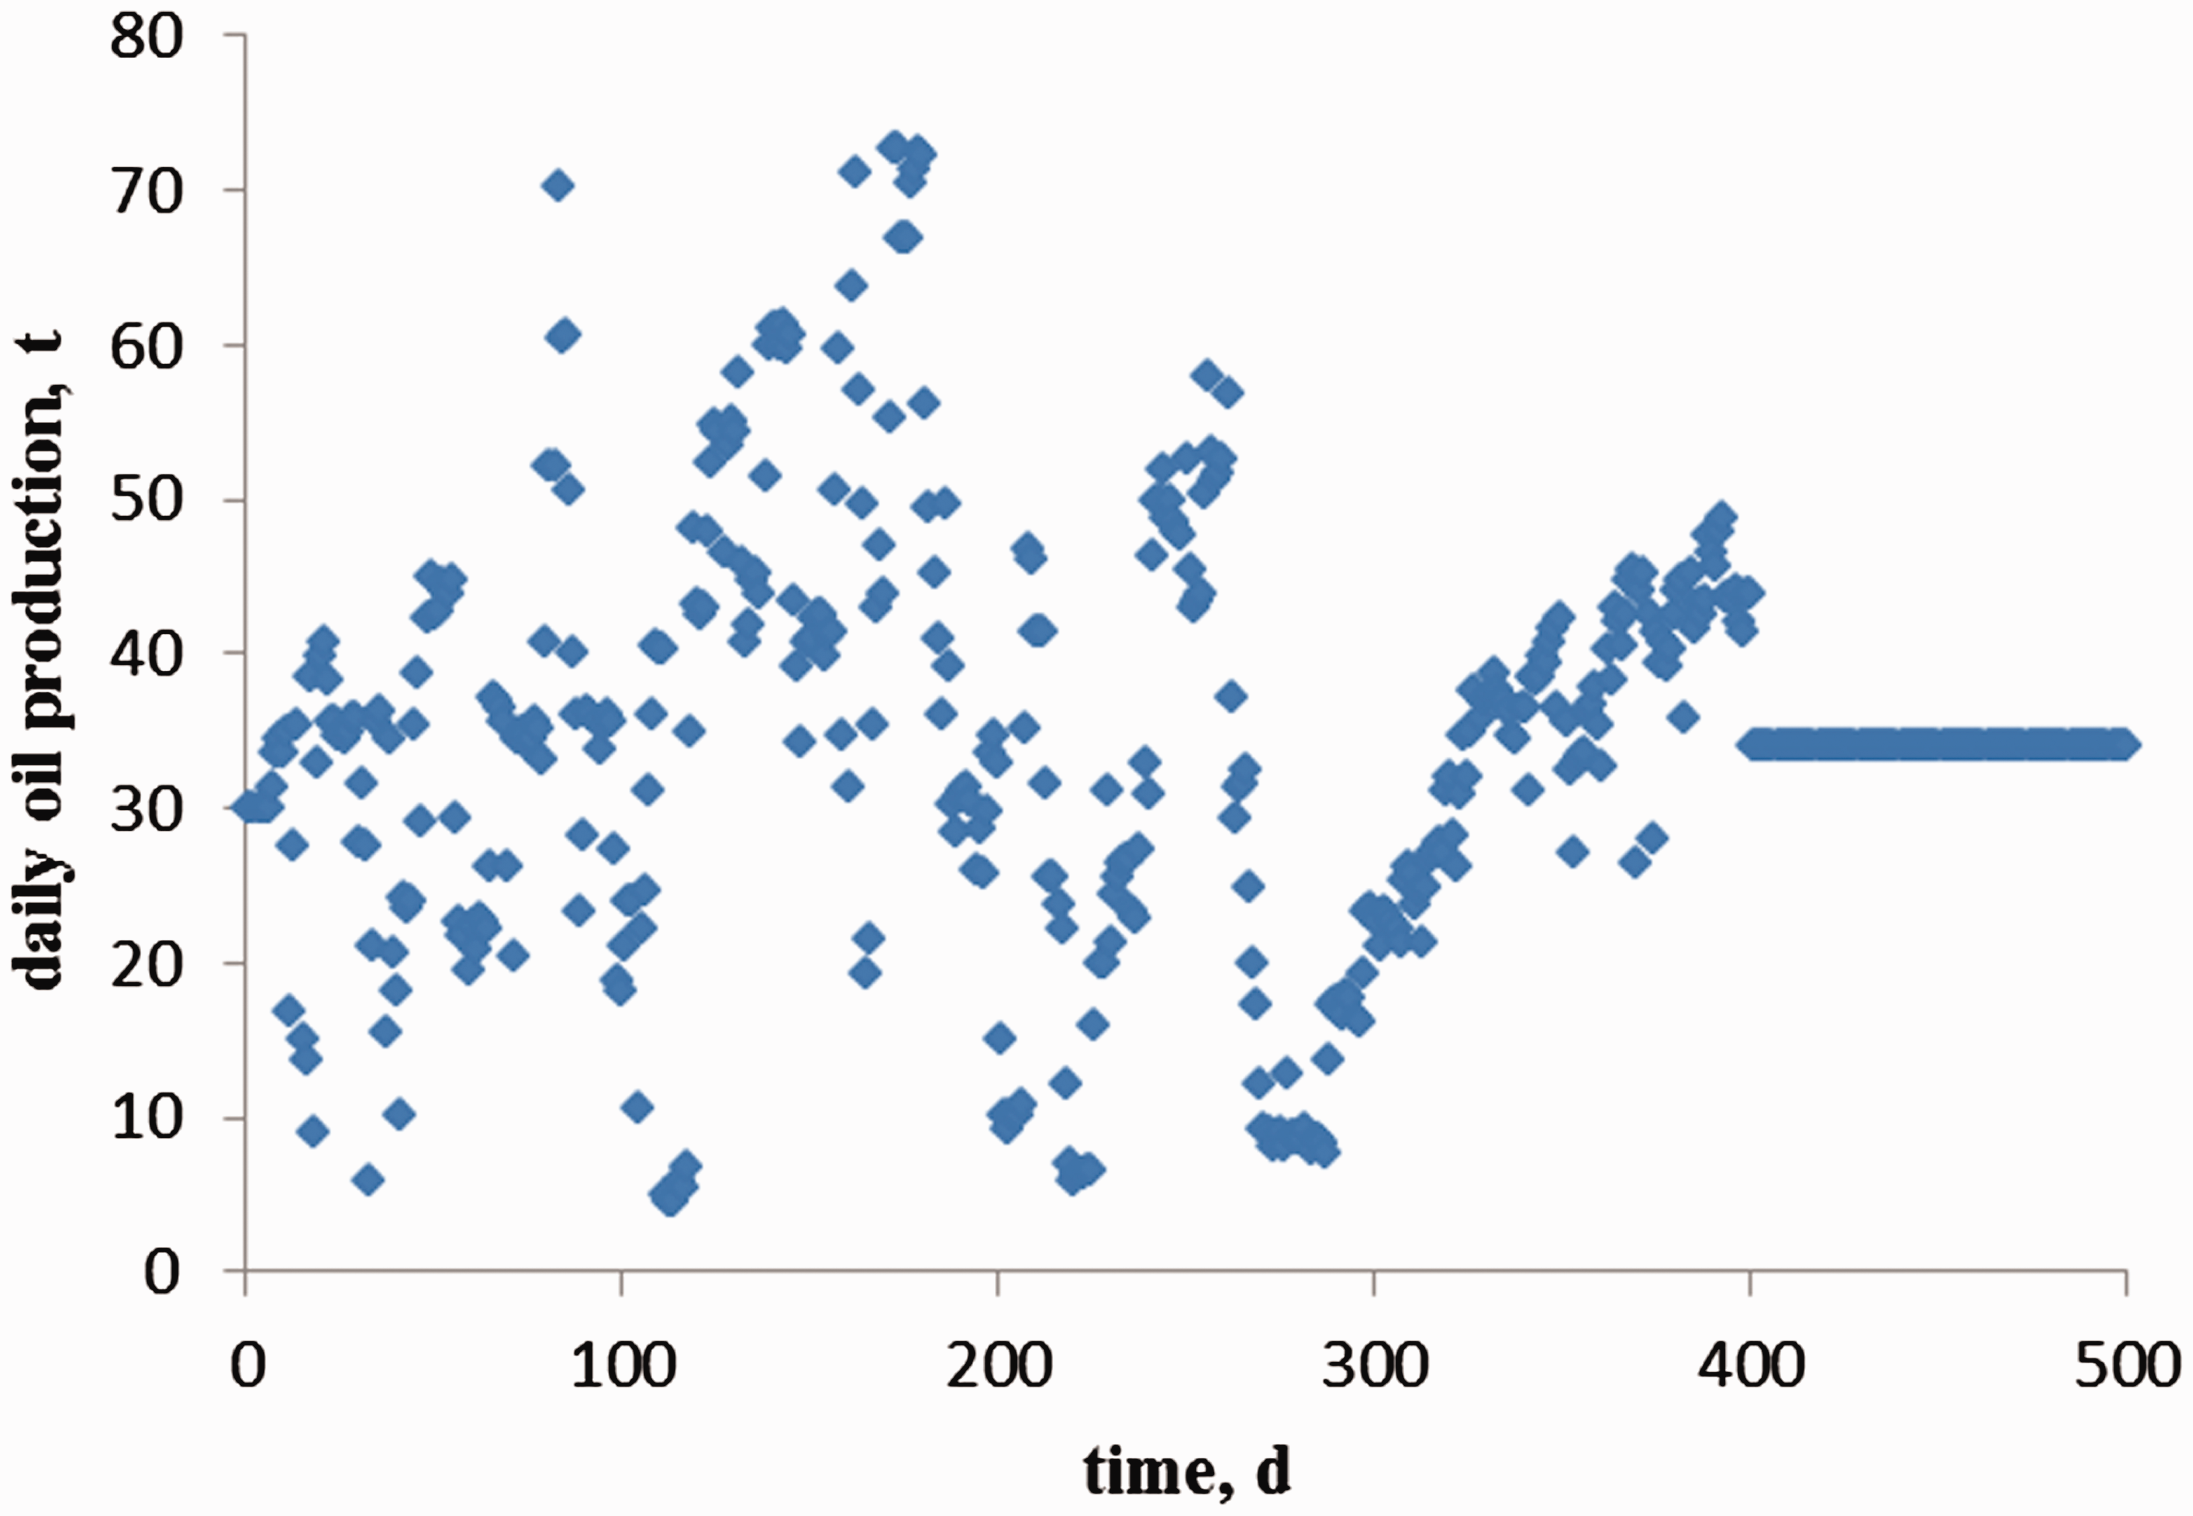
A pair of SAGD horizontal wells are used in Xinjiang oilfield in China. The horizontal well length was 346 m. This pair of horizontal wells implemented SAGD production for 400 d. The formation parameters and thermodynamic parameters are listed in Table 1. The steam injection volume changed each day, as shown in Figure 10.
Formation parameters and thermodynamic parameters of Xinjiang oilfield in China.
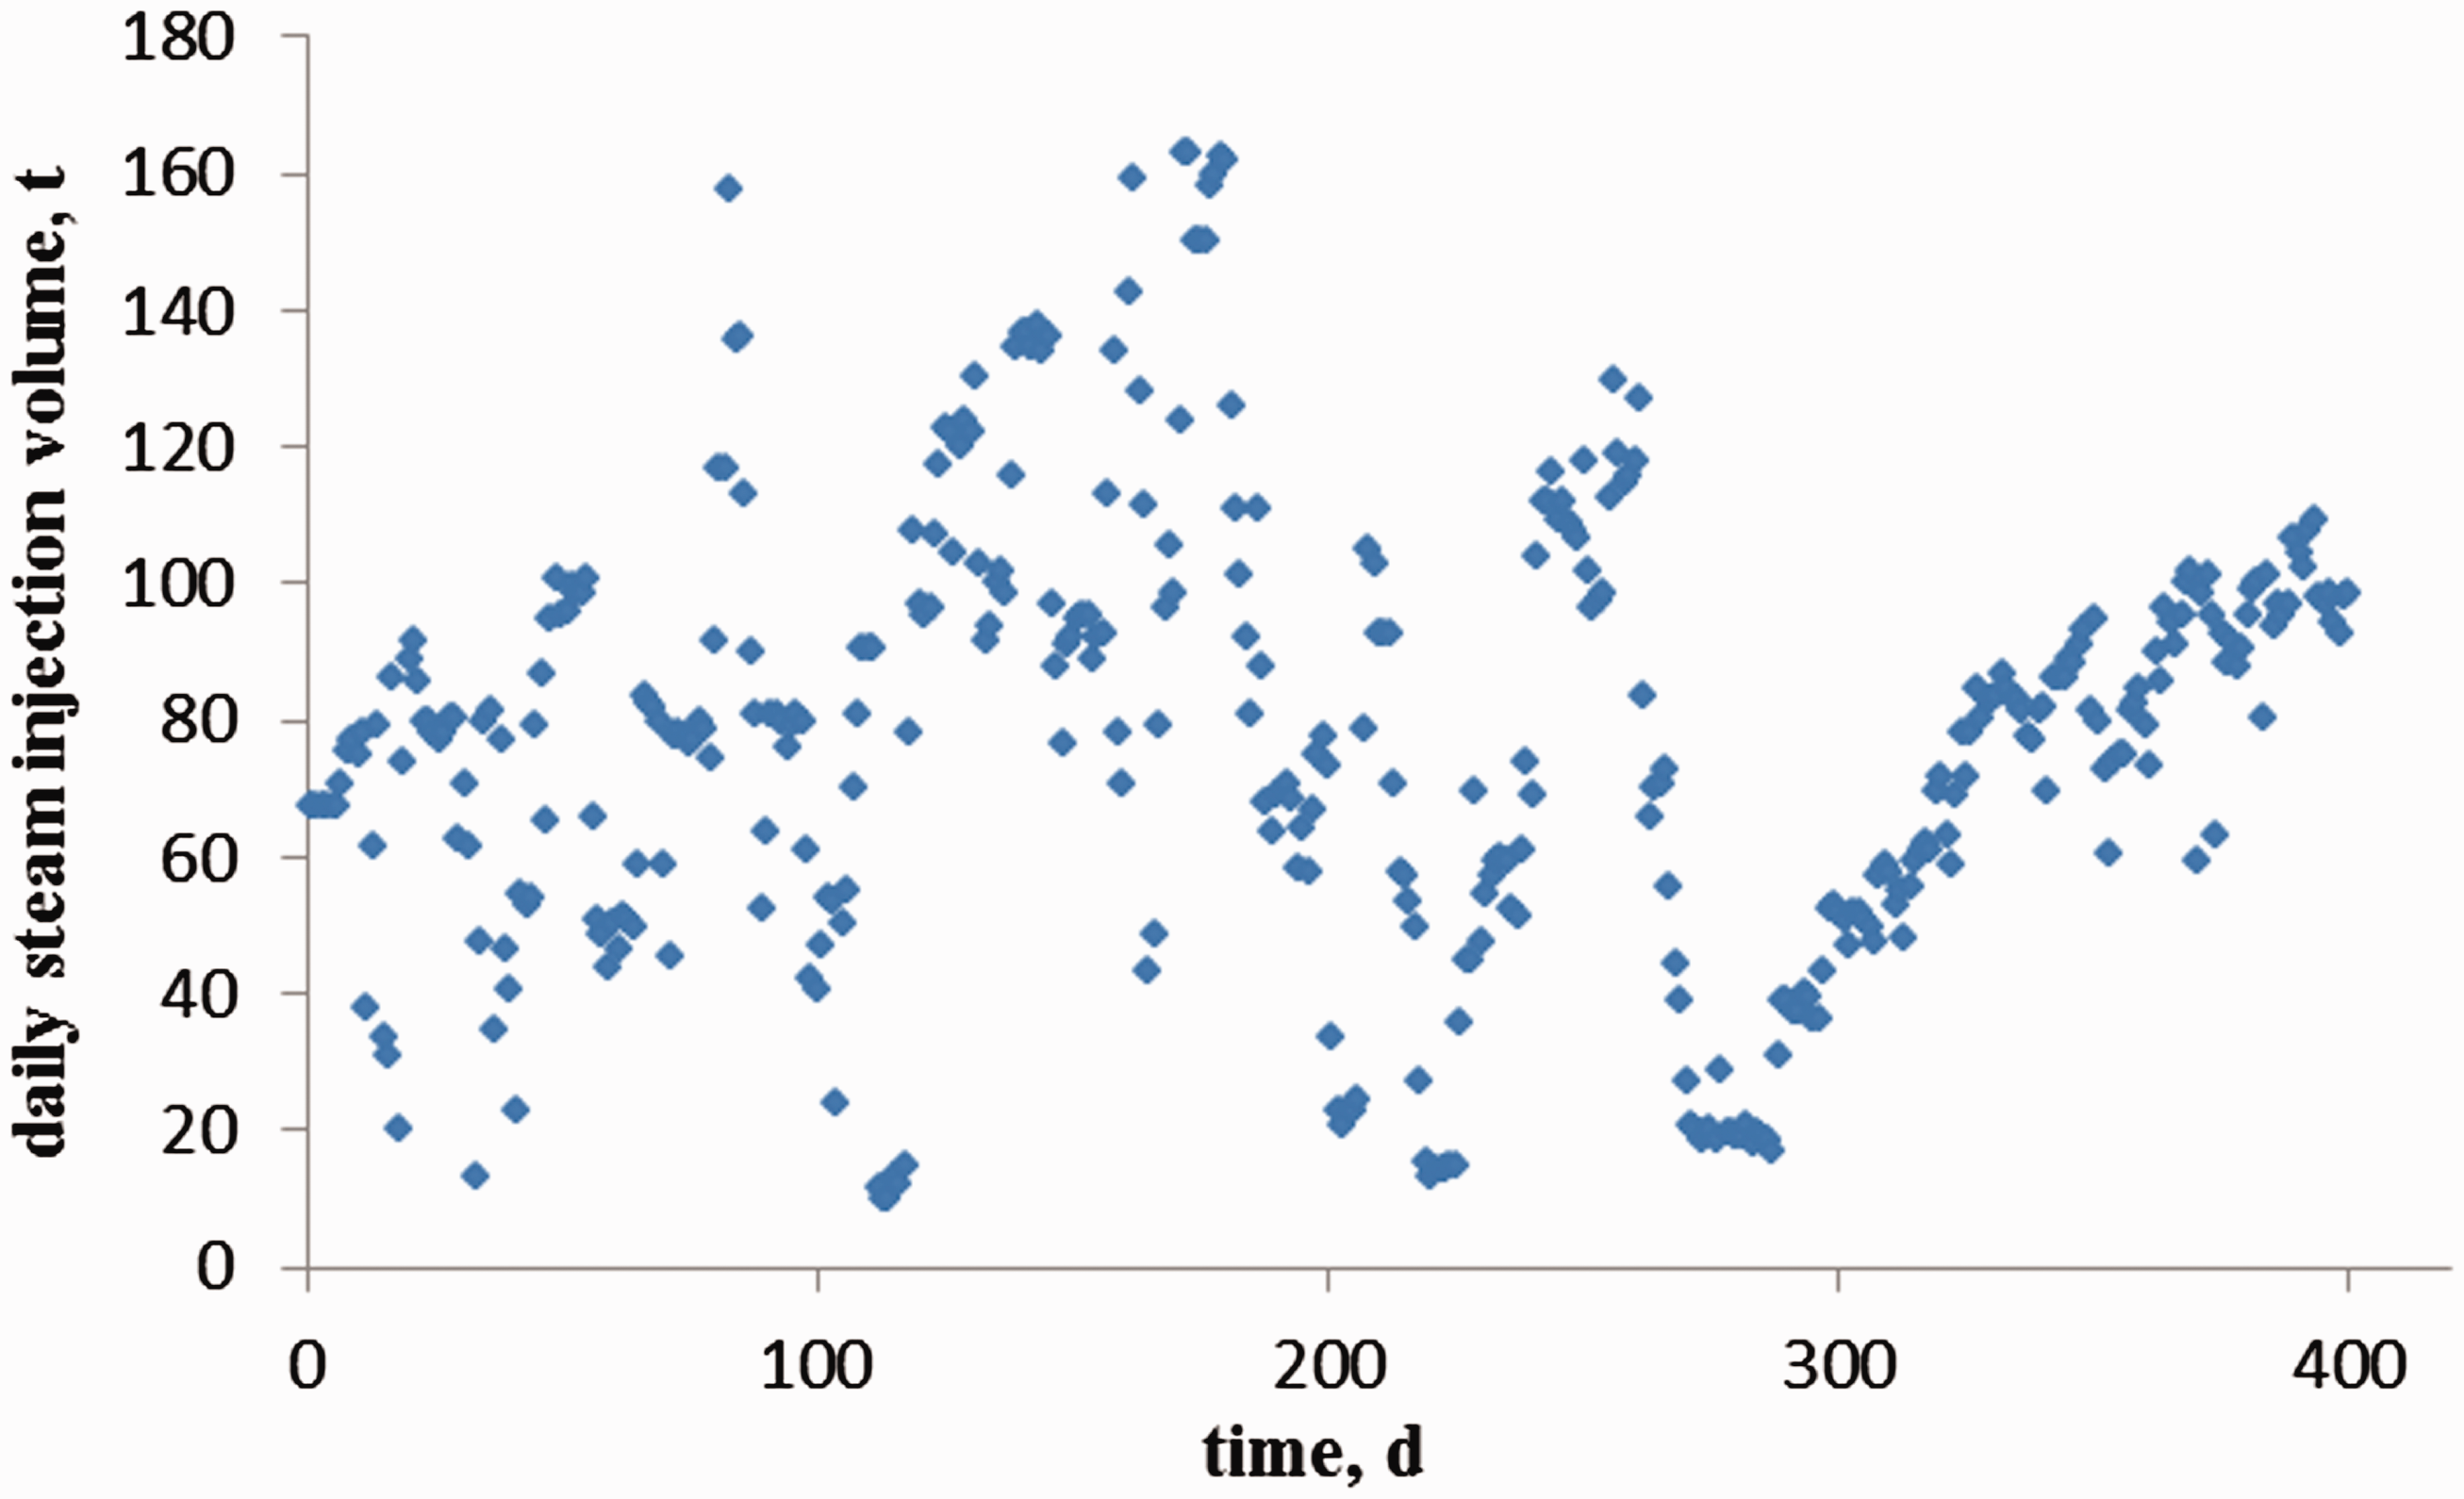
Relationship between the daily steam injection volume and time.
The daily oil production calculated by the proposed model using the exact values from the Xinjiang oilfield was compared with the daily oil production there, as shown in Figure 11. Figure 11 shows that the data calculated by the proposed model successfully match the trend of the daily oil production in the real oilfield, and that the data are suitably matched. To further verify the model, we slightly changed the value of the model parameter and compared the daily oil production calculated by the proposed model with the daily oil production in Xinjiang oilfield. If the steam quality is changed to 0.78 and 0.92, the curves of the daily oil production calculated by the proposed model are as shown in Figures 12 and 13, respectively. In Figures 12 and 13, the daily oil production calculated by the proposed model unsuitably match the data in Xinjiang oilfield. The curve of the daily oil production calculated by the proposed model is below the curve of the daily oil production in Xinjiang oilfield by setting the steam quality to 0.78, as shown in Figure 12. In addition, the curve of the daily oil production calculated by the proposed model is above the curve of the daily oil production in Xinjiang oilfield by setting the steam quality to 0.92, as shown in Figure 13. If the degree of utilization of a horizontal well is changed to 0.9, the curve of the daily oil production calculated by the proposed model is as shown in Figure 14. The curve of the daily oil production calculated by the proposed model is below the curve of the daily oil production in Xinjiang oilfield, as shown in Figure 14.
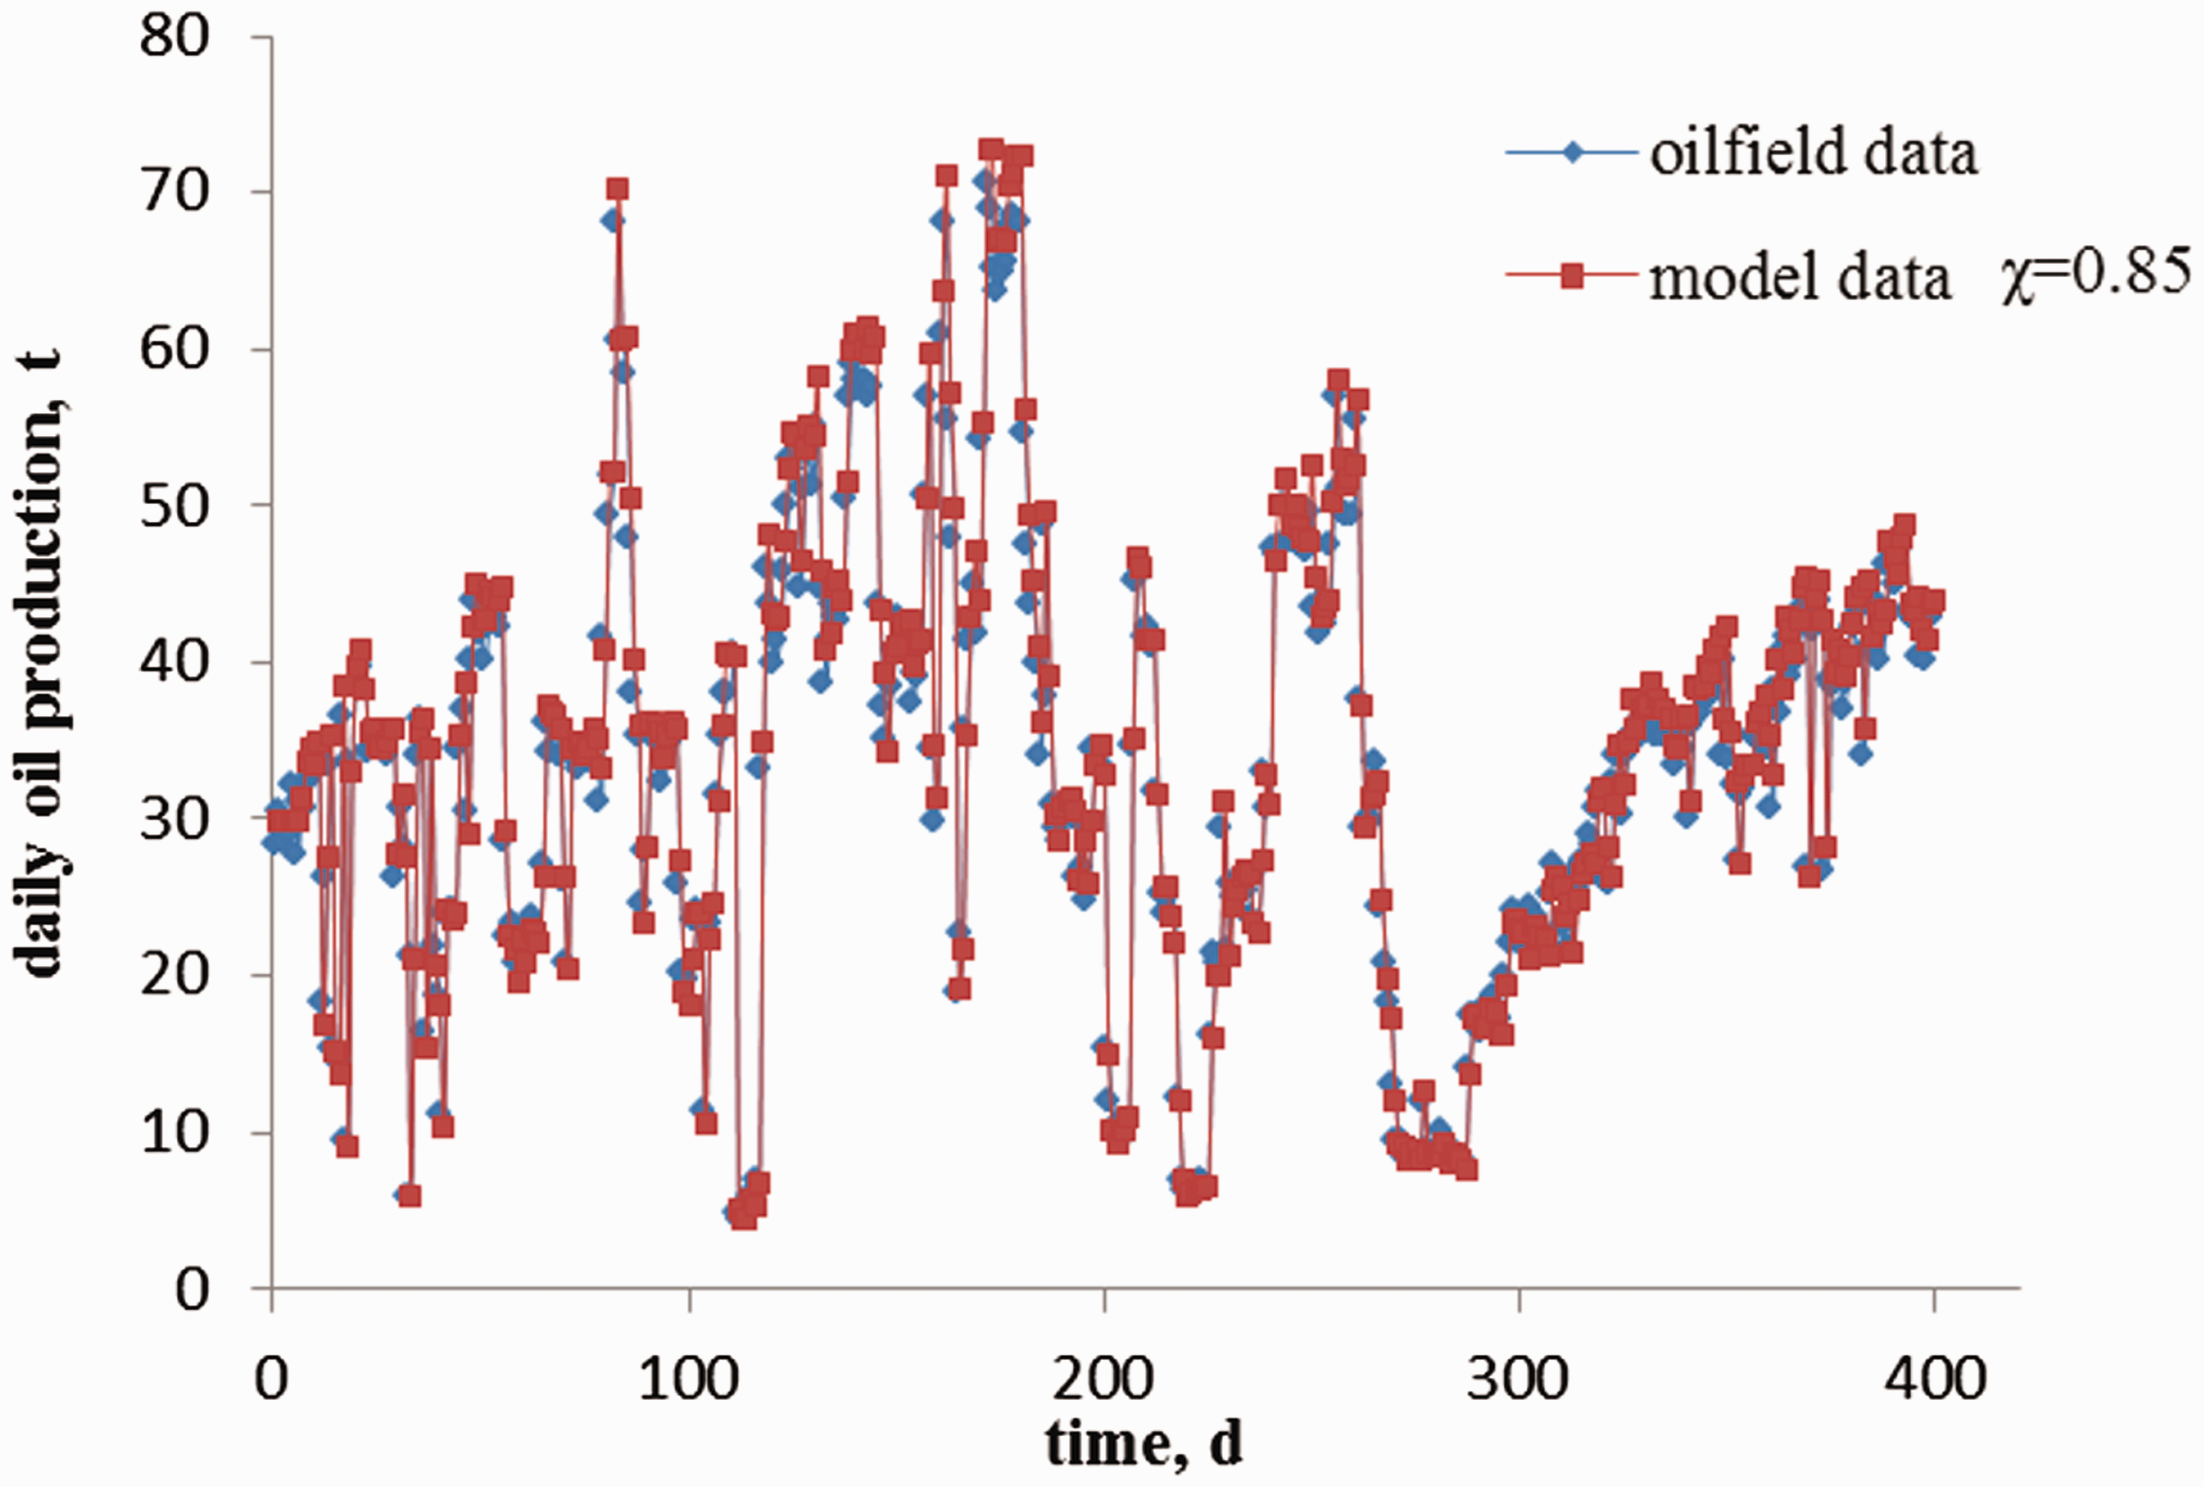
Comparison between the daily oil production in Xinjiang oilfield and the daily oil production calculated by the proposed model by setting the steam quality to 0.85.
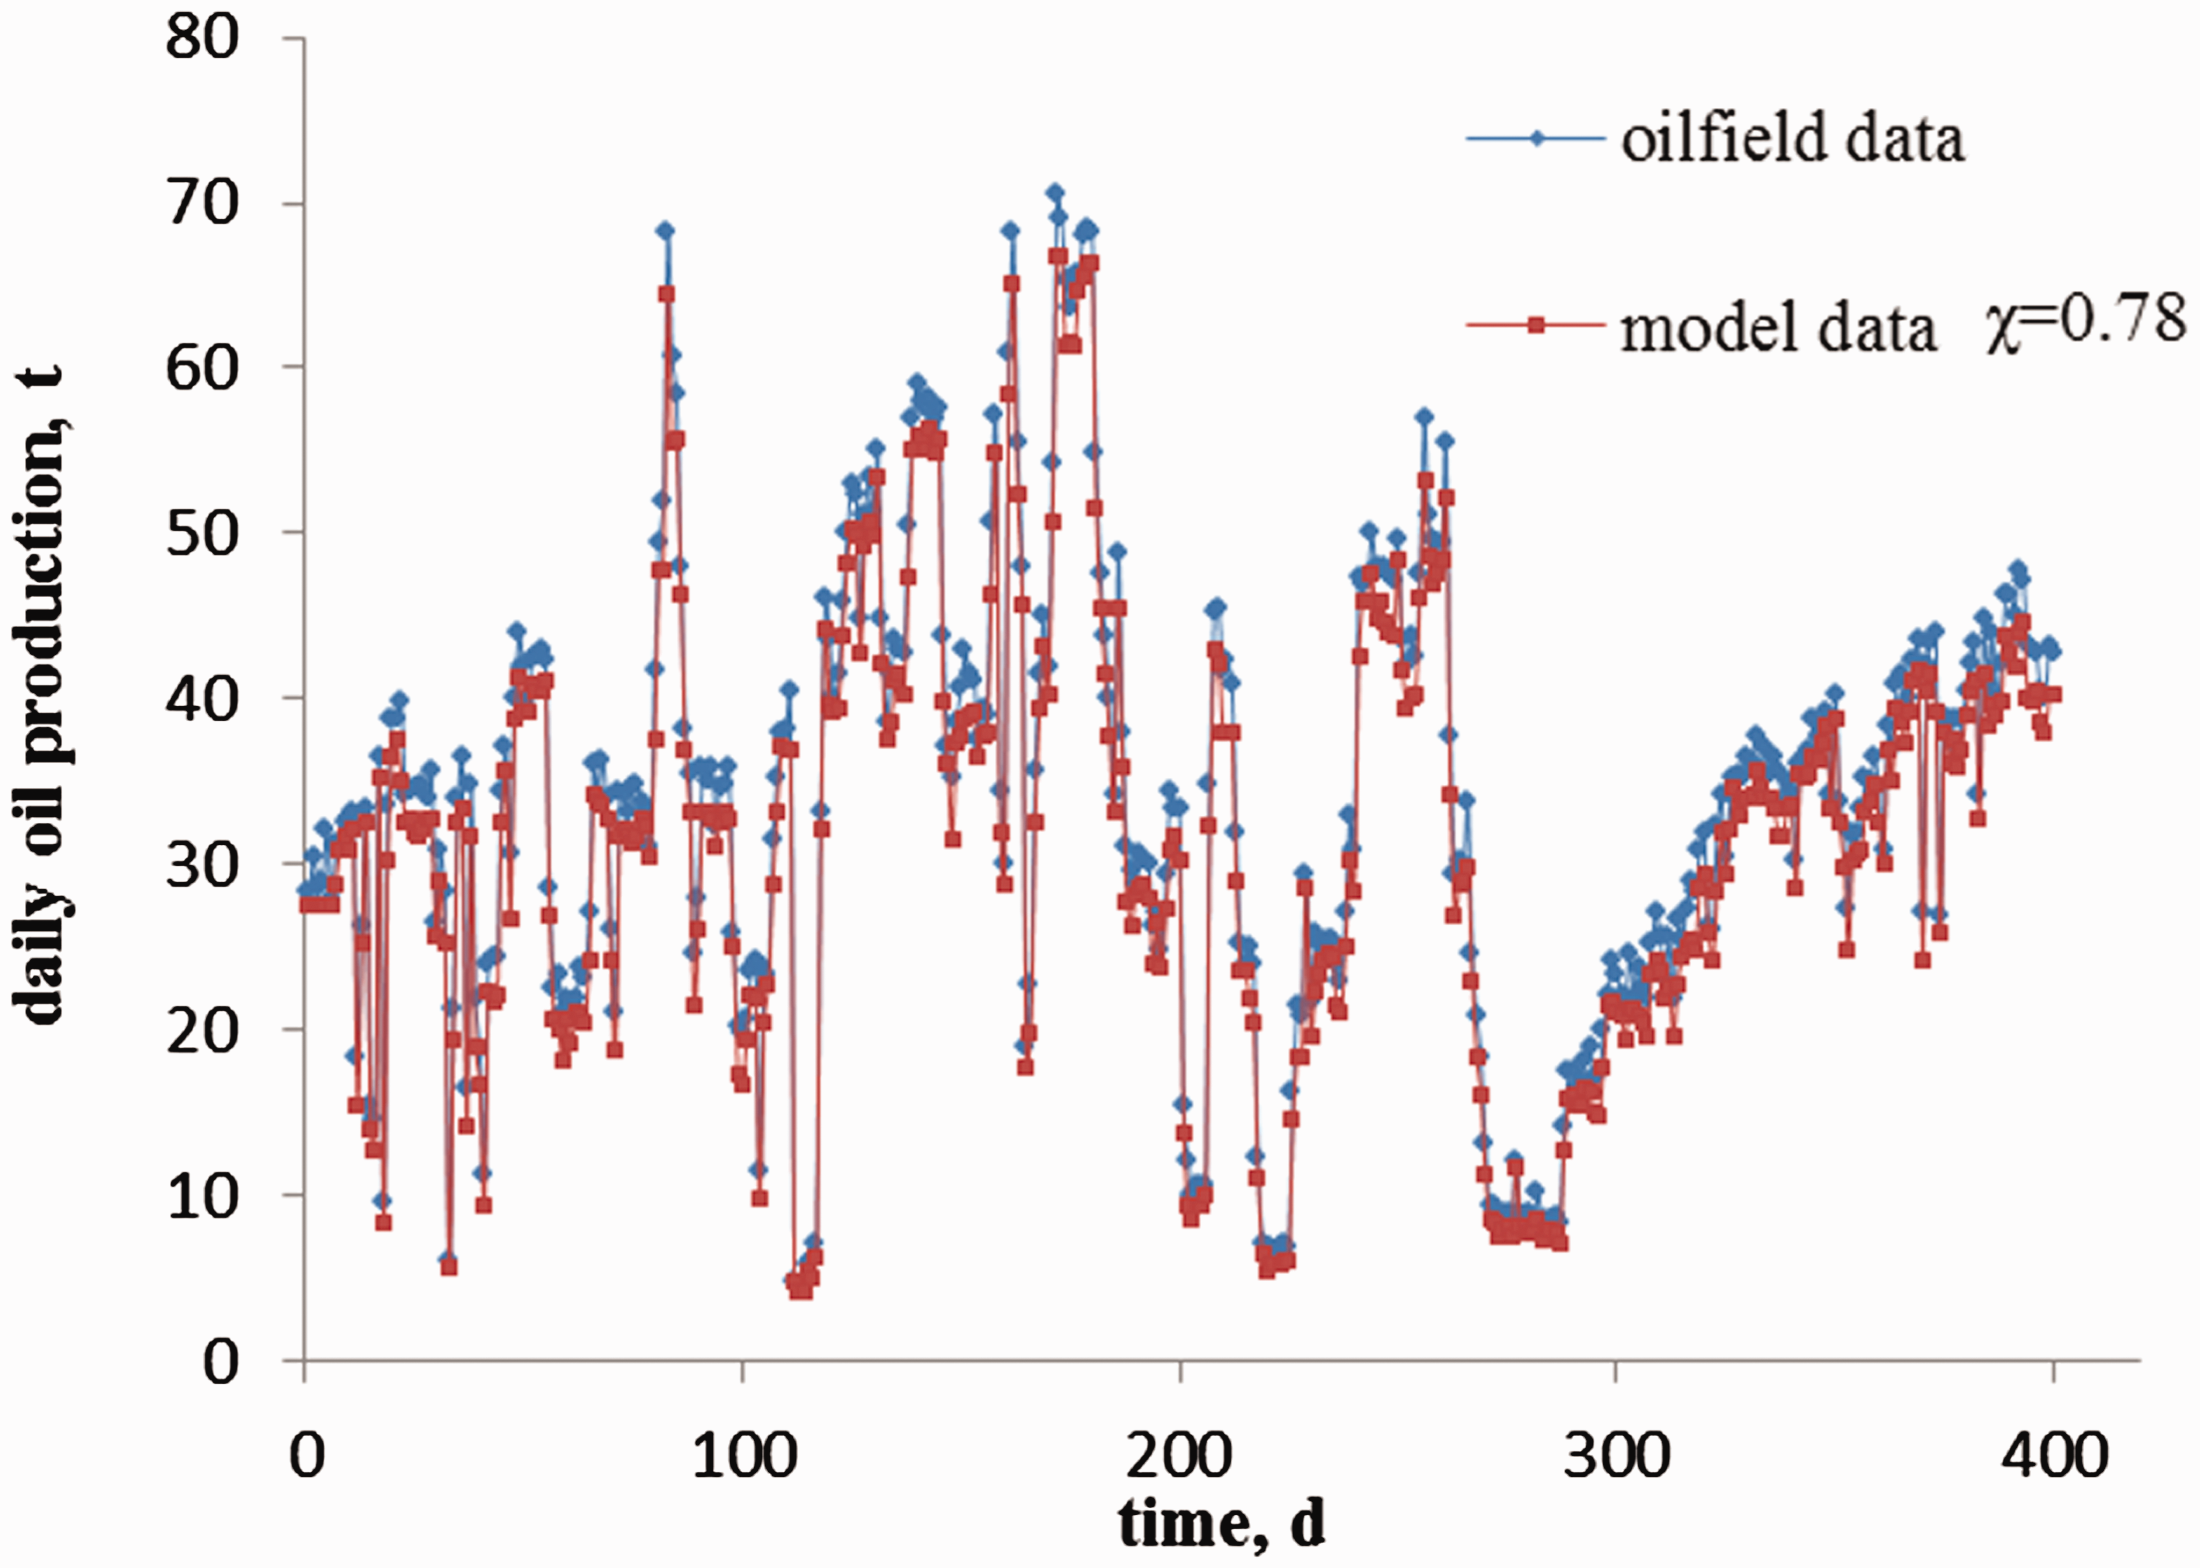
Comparison between the daily oil production in Xinjiang oilfield and the daily oil production calculated by the proposed model by setting the steam quality to 0.78.
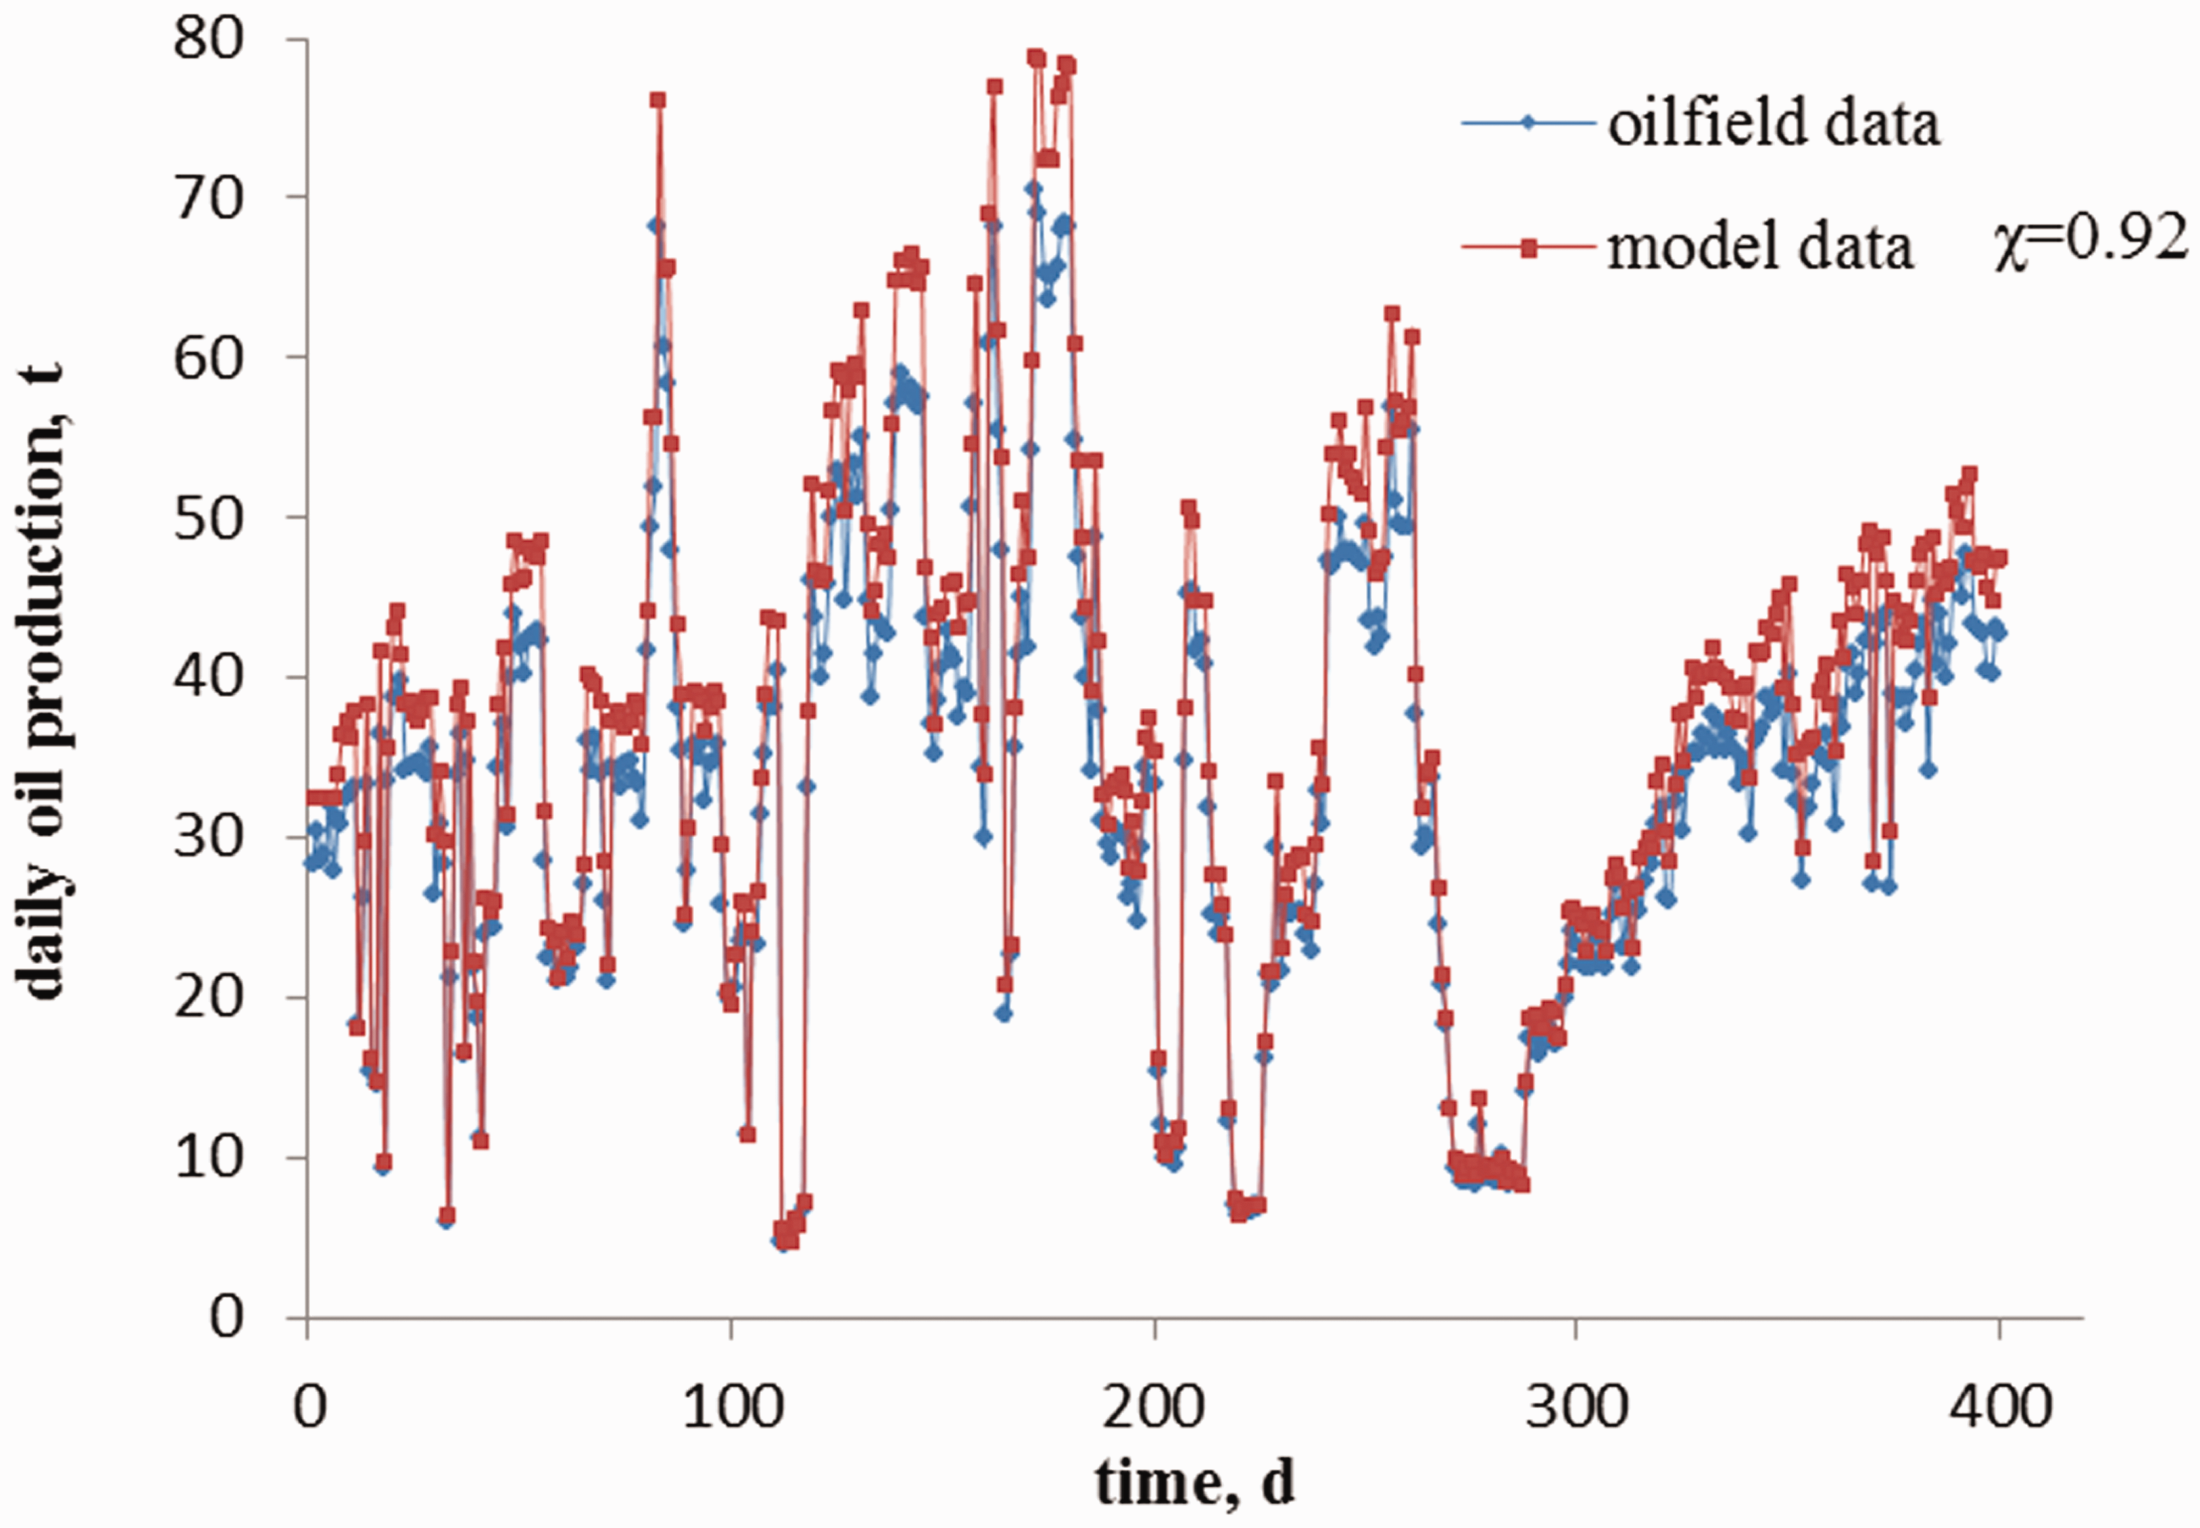
Comparison between the daily oil production in Xinjiang oilfield and the daily oil production calculated by the proposed model by setting the steam quality to 0.92.
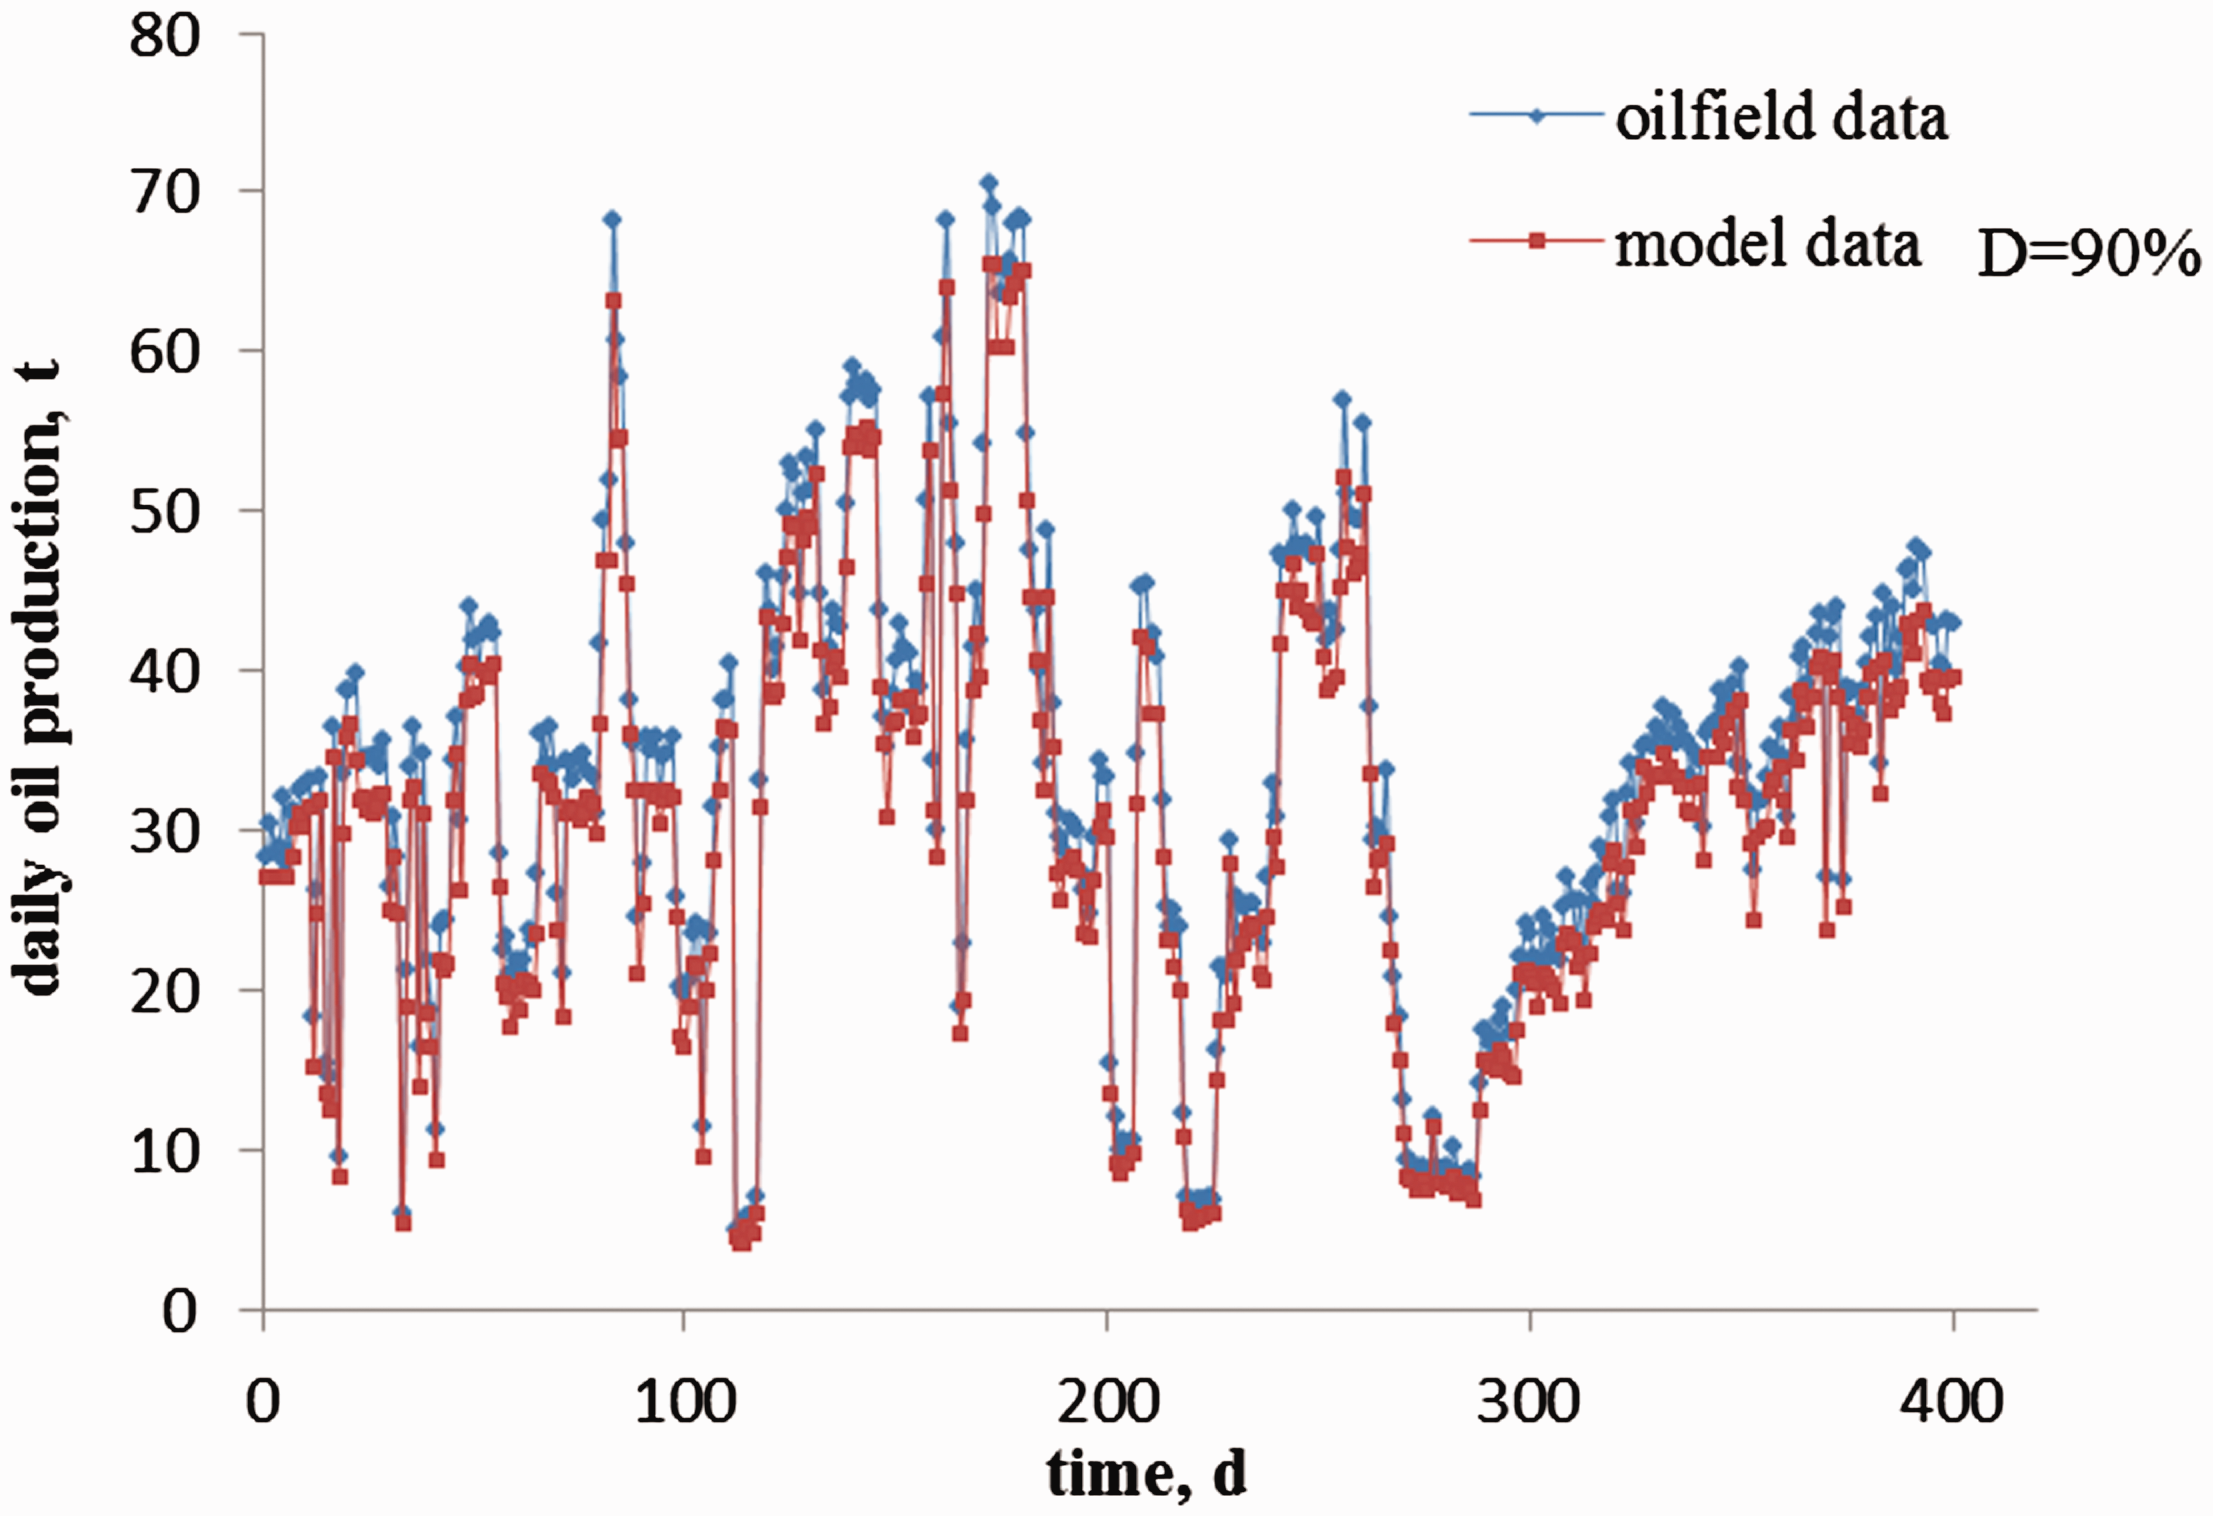
Comparison between the daily oil production in Xinjiang oilfield and the daily oil production calculated by the proposed model by setting the degree of utilization of the horizontal well to 90%.
The curves of the steam oil ratio calculated by the proposed model were obtained and compared with the curve of the steam oil ratio in Xinjiang oilfield, as shown in Figures 15 and 16. In Xinjiang oilfield, the steam quality is 0.85 and the degree of utilization of the horizontal well is 100%, as shown in Table 1. The data on the steam oil ratio in Xinjiang oilfield are evenly distributed on both sides of the curve of the steam oil ratio calculated by the proposed model, in which the steam quality is 0.85, as shown in Figure 15. If the steam quality is changed to 0.78, the curve of the steam oil ratio calculated by the proposed model is above the curve of the steam oil ratio in Xinjiang oilfield, as shown in Figure 15. In addition, if the steam quality is changed to 0.92, the curve of the steam oil rate calculated by the proposed model is below the curve of the steam oil ratio in Xinjiang oilfield, as shown in Figure 15. The data of the steam oil ratio in Xinjiang oilfield are evenly distributed on both sides of the curve calculated by proposed model in which the degree of utilization of the horizontal well is equal to 100%, as shown in Figure 16. If the degree of utilization of the horizontal well is changed to 90%, the curve of the steam oil ratio calculated by the proposed model is above the curve of the steam oil ratio in Xinjiang oilfield, as shown in Figure 16.
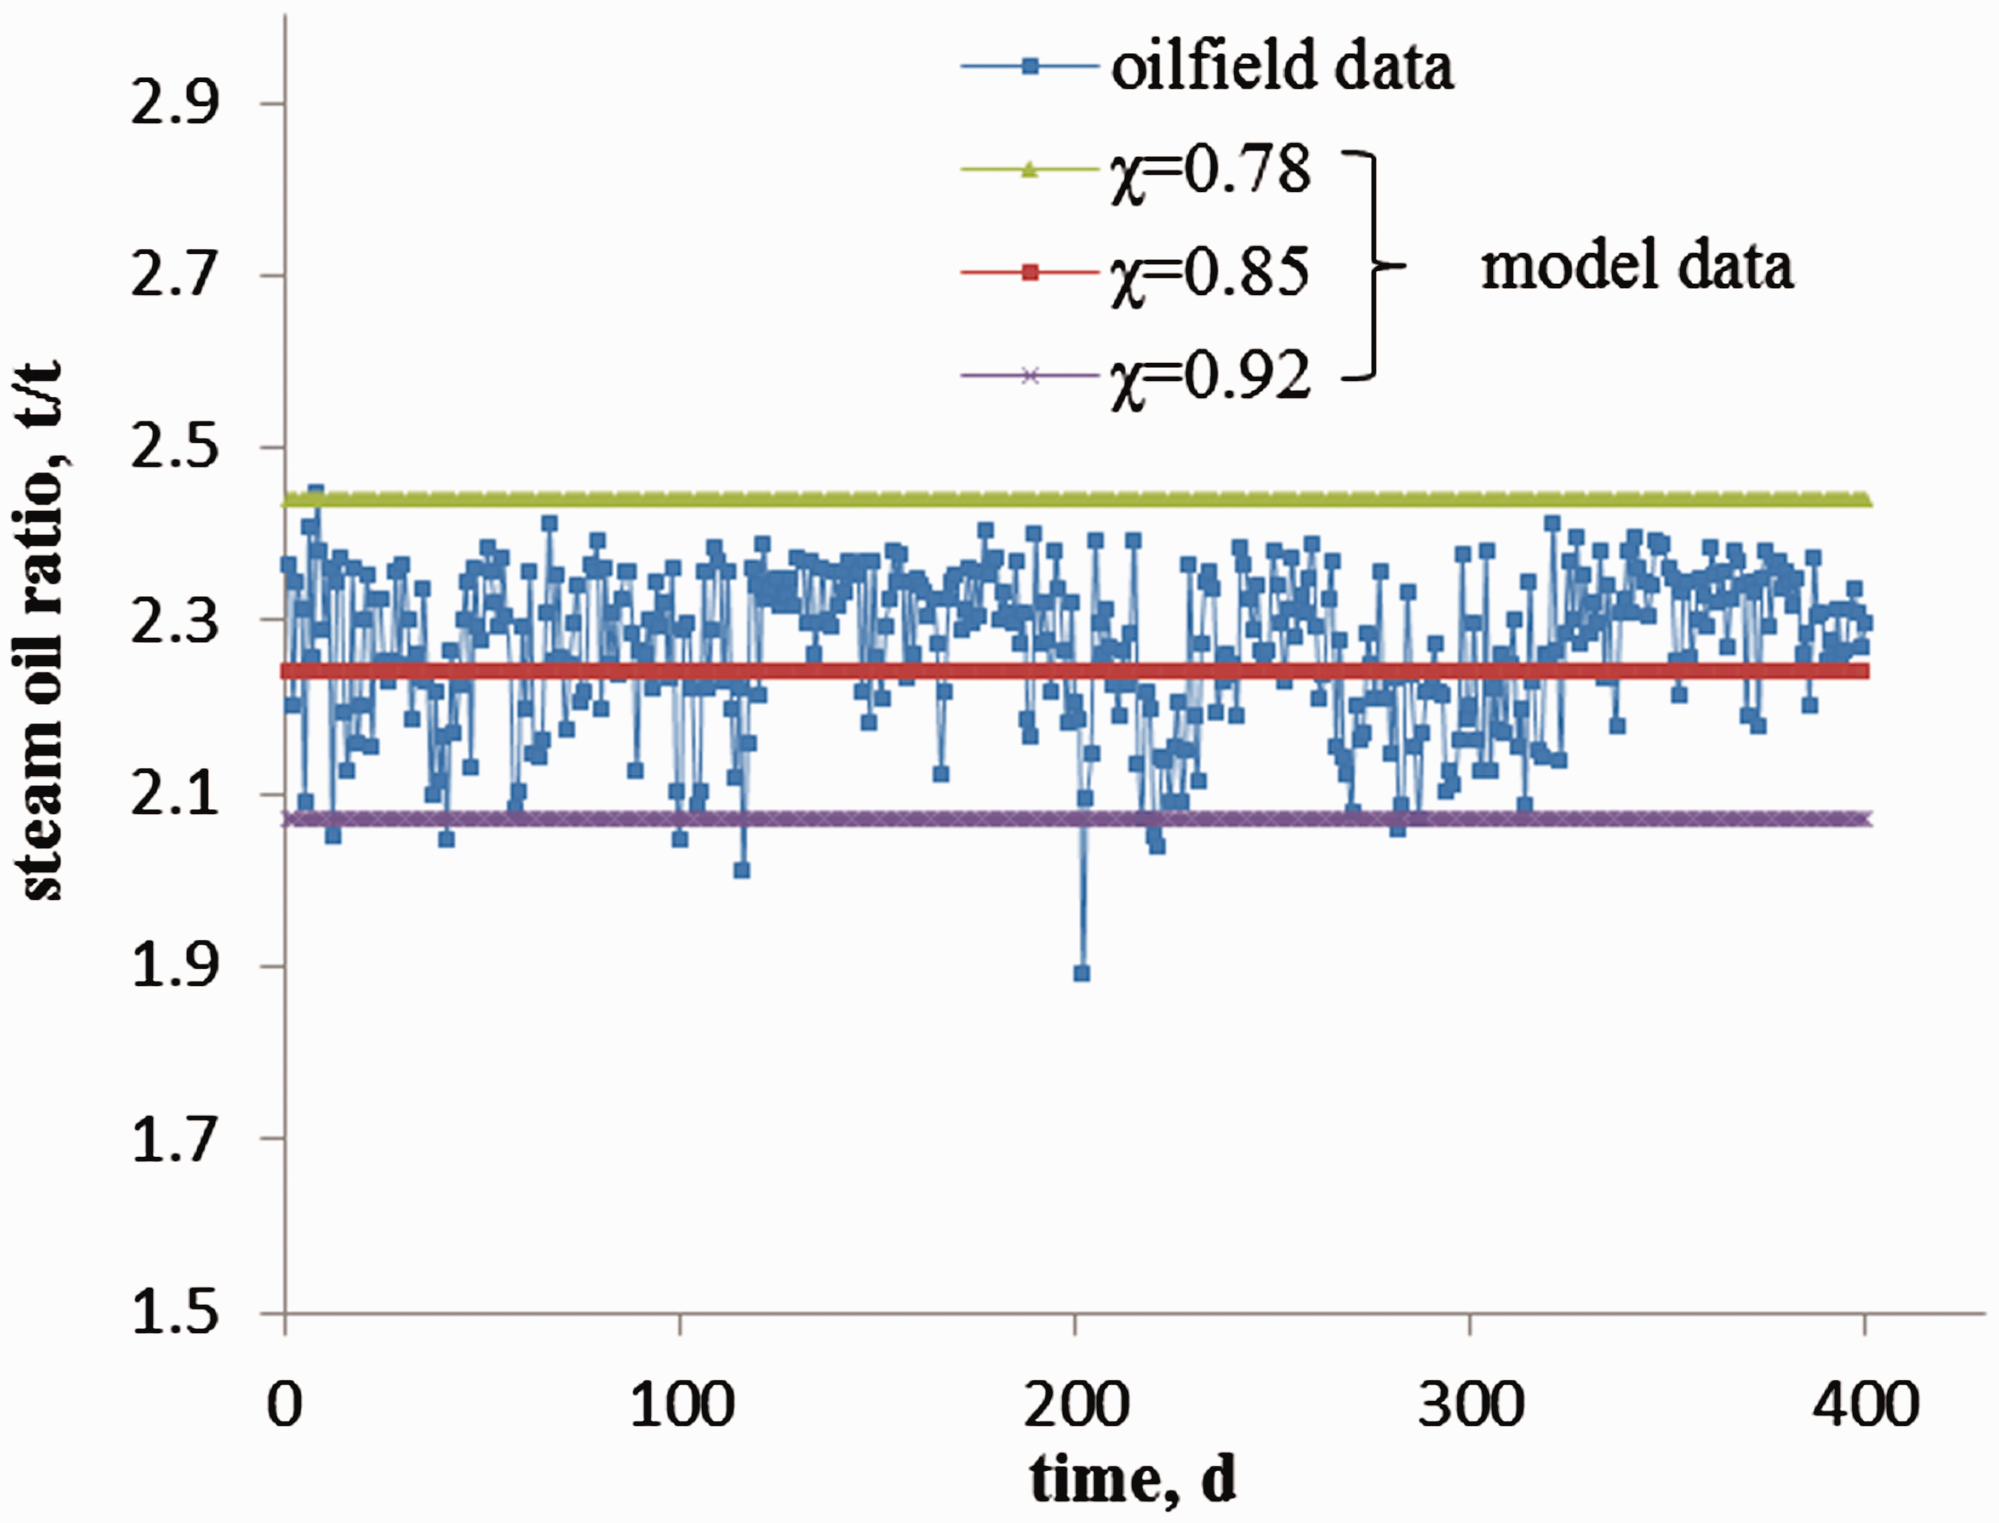
Comparison between the steam oil ratio in Xinjiang oilfield and the steam oil ratio calculated by the proposed model by setting the steam quality to 0.78, 0.85, and 0.92.
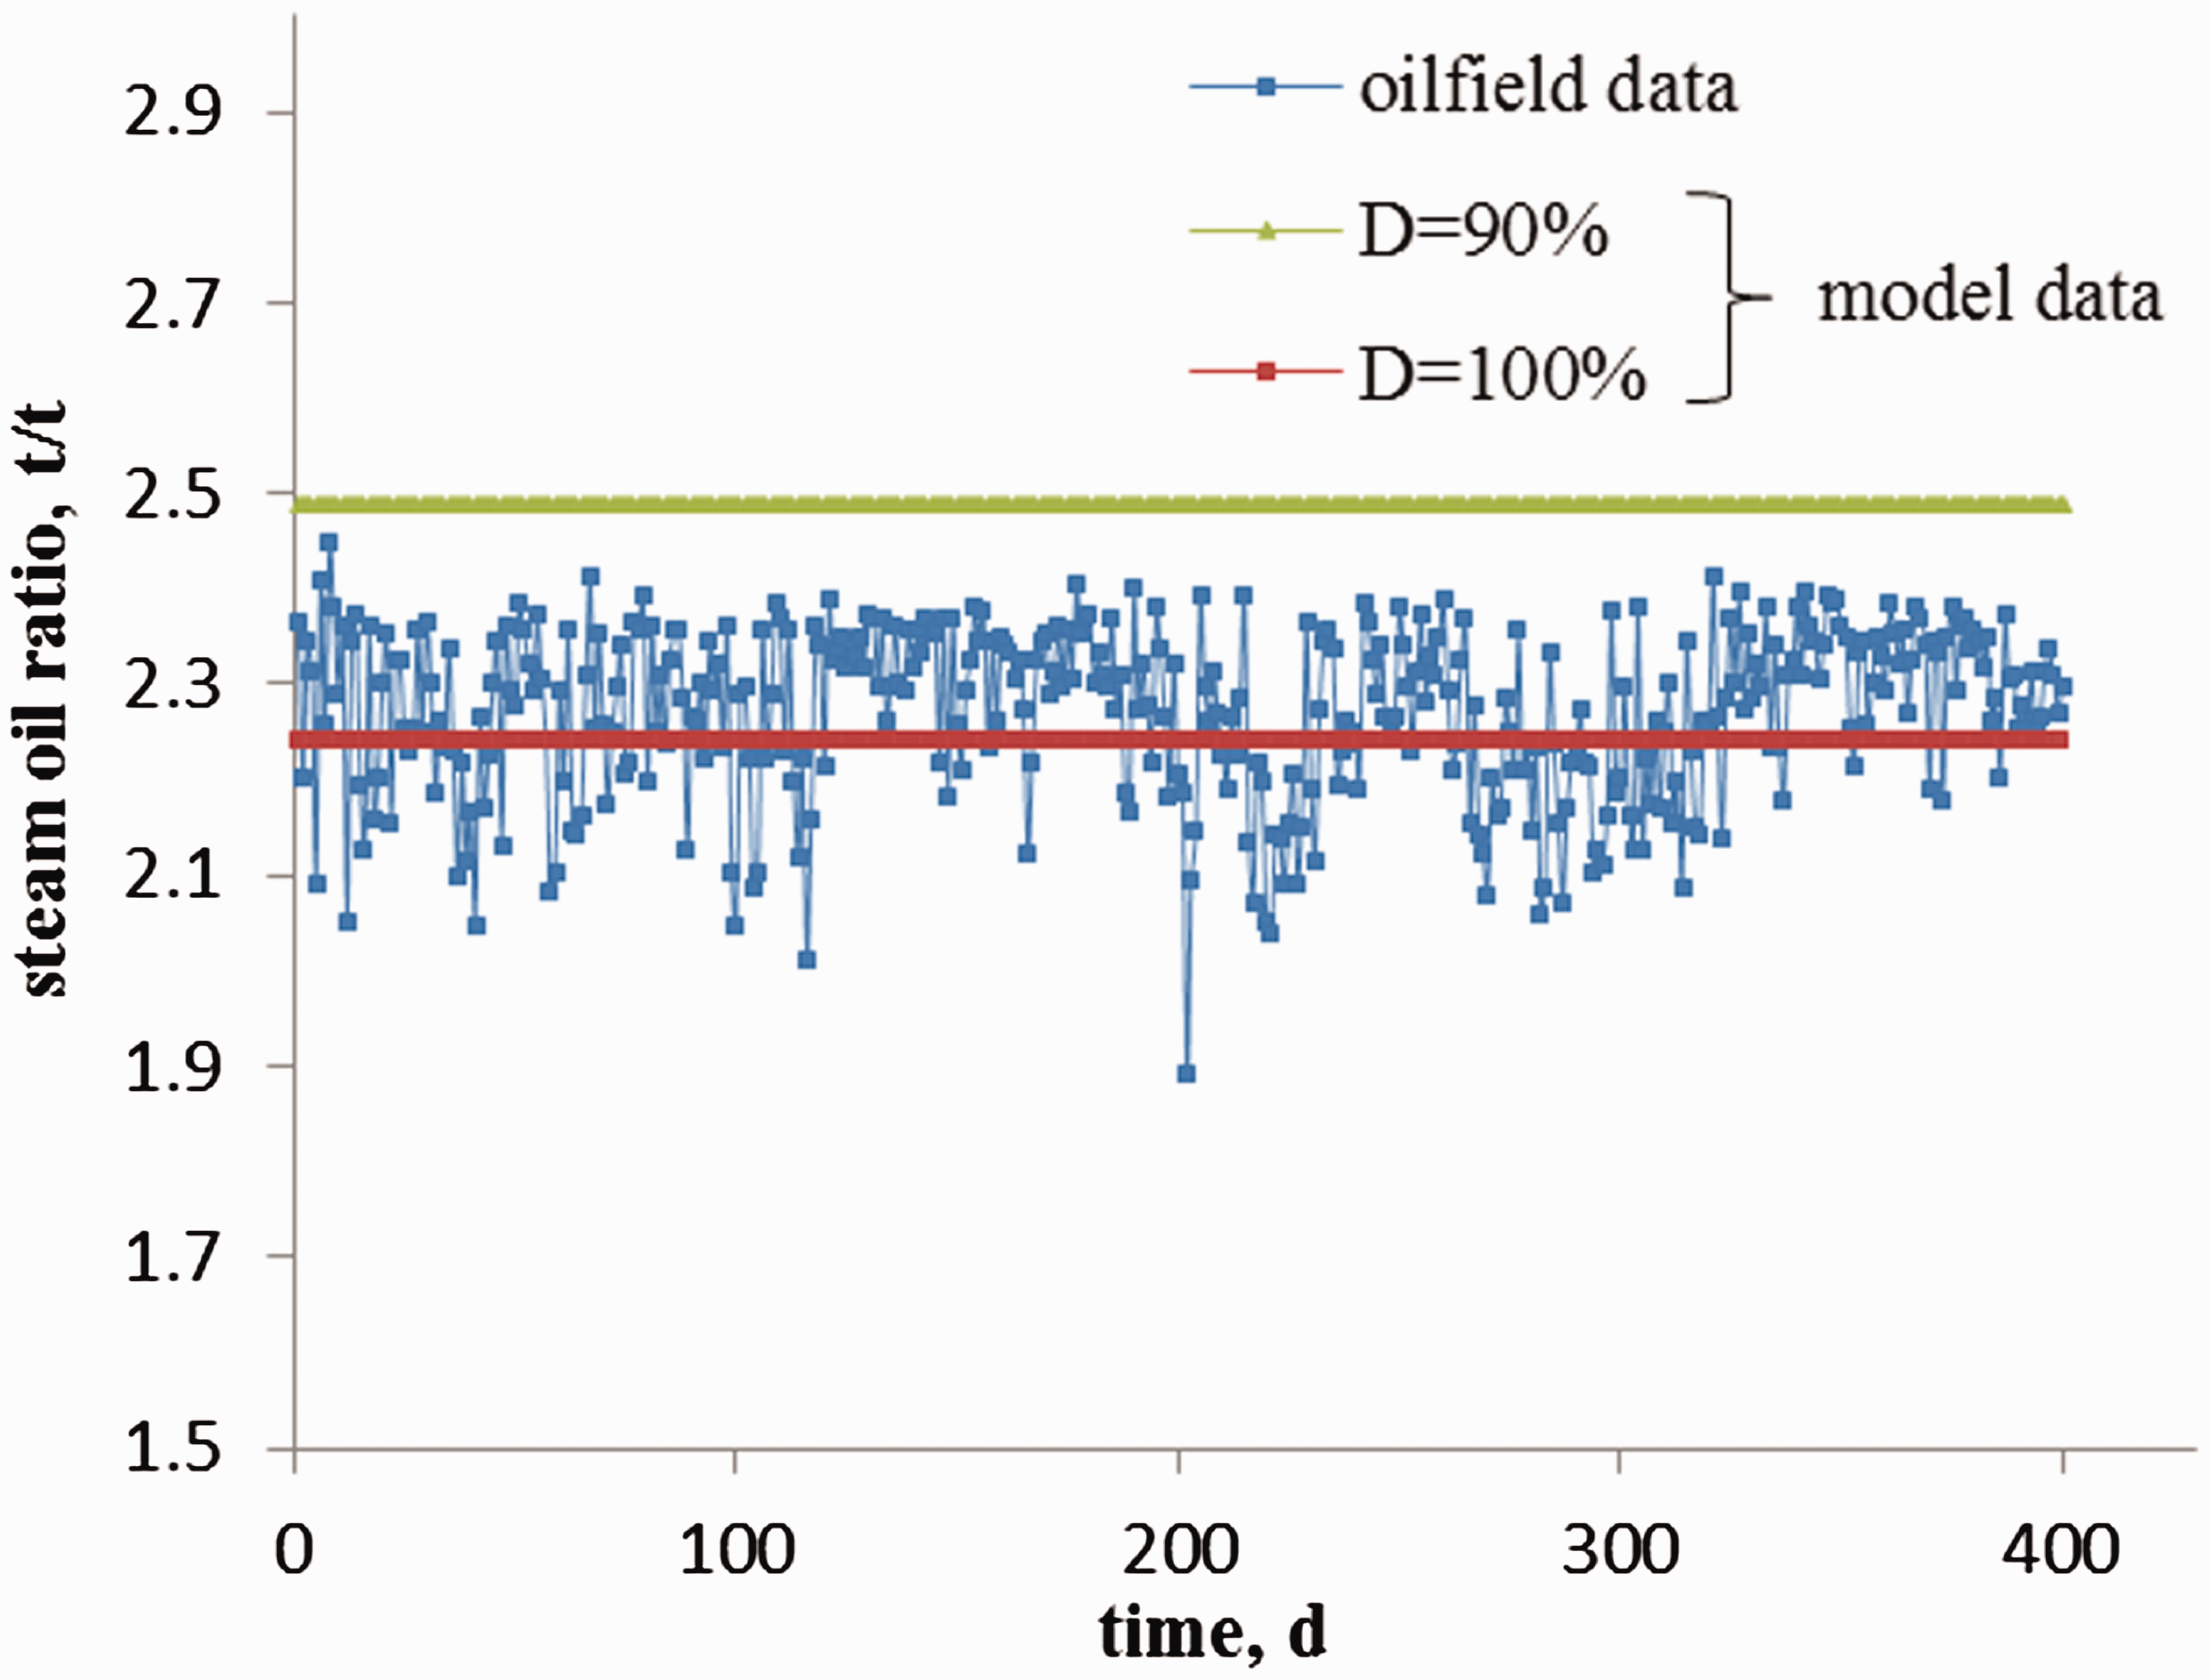
Comparison between the steam oil ratio in Xinjiang oilfield and the steam oil ratio calculated by the proposed model by setting the degree of utilization of the horizontal well to 90% and 100%.
From the above discussion, we found that a change in the model parameter value will cause the daily oil production calculated by the proposed model to unsuitably match the daily oil production in a real oilfield. This means that the proposed model can be used to predict the oil production rate during the rising stage of the steam chamber. Combining Figures 10 and 11, we can see that the curves in the two figures show similar trends and that the steam injection rate has a large influence on the daily oil production.
We determined the average daily steam injection volume to calculate the radius of the steam chamber. The average daily steam injection volume during the period of 1–100 d was 72.66 t, and the radius of the steam chamber on the 100th day was 4.705 m. The average daily steam injection volume during the period of 1–200 d was 83.96 t, and the radius of the steam chamber on the 200th day was 7.152 m. The average daily steam injection volume during the period of 1–300 d was 75.01 t, and the radius of the steam chamber on the 300th day was 8.28 m. The average daily steam injection volume during the period of 1–400 d was 76.48 t, and the radius of the steam chamber on the 400th day was 9.654 m. The locations of the steam chamber interface at days 100, 200, 300, and 400 are shown in Figure 17. By the end of day 400, the rising height of the top of the steam chamber was 19.31 m, which was less than the reservoir thickness of 31.8 m. This result indicates that this pair of SAGD horizontal wells was at the rising stage during SAGD production. In the same way, the steam chamber rising rate was calculated based on the average daily steam injection volume. The steam chamber rising rates and average daily steam injection volume at days 50, 100, 150, 200, 250, 300, 350, and 400 are listed in Table 2.
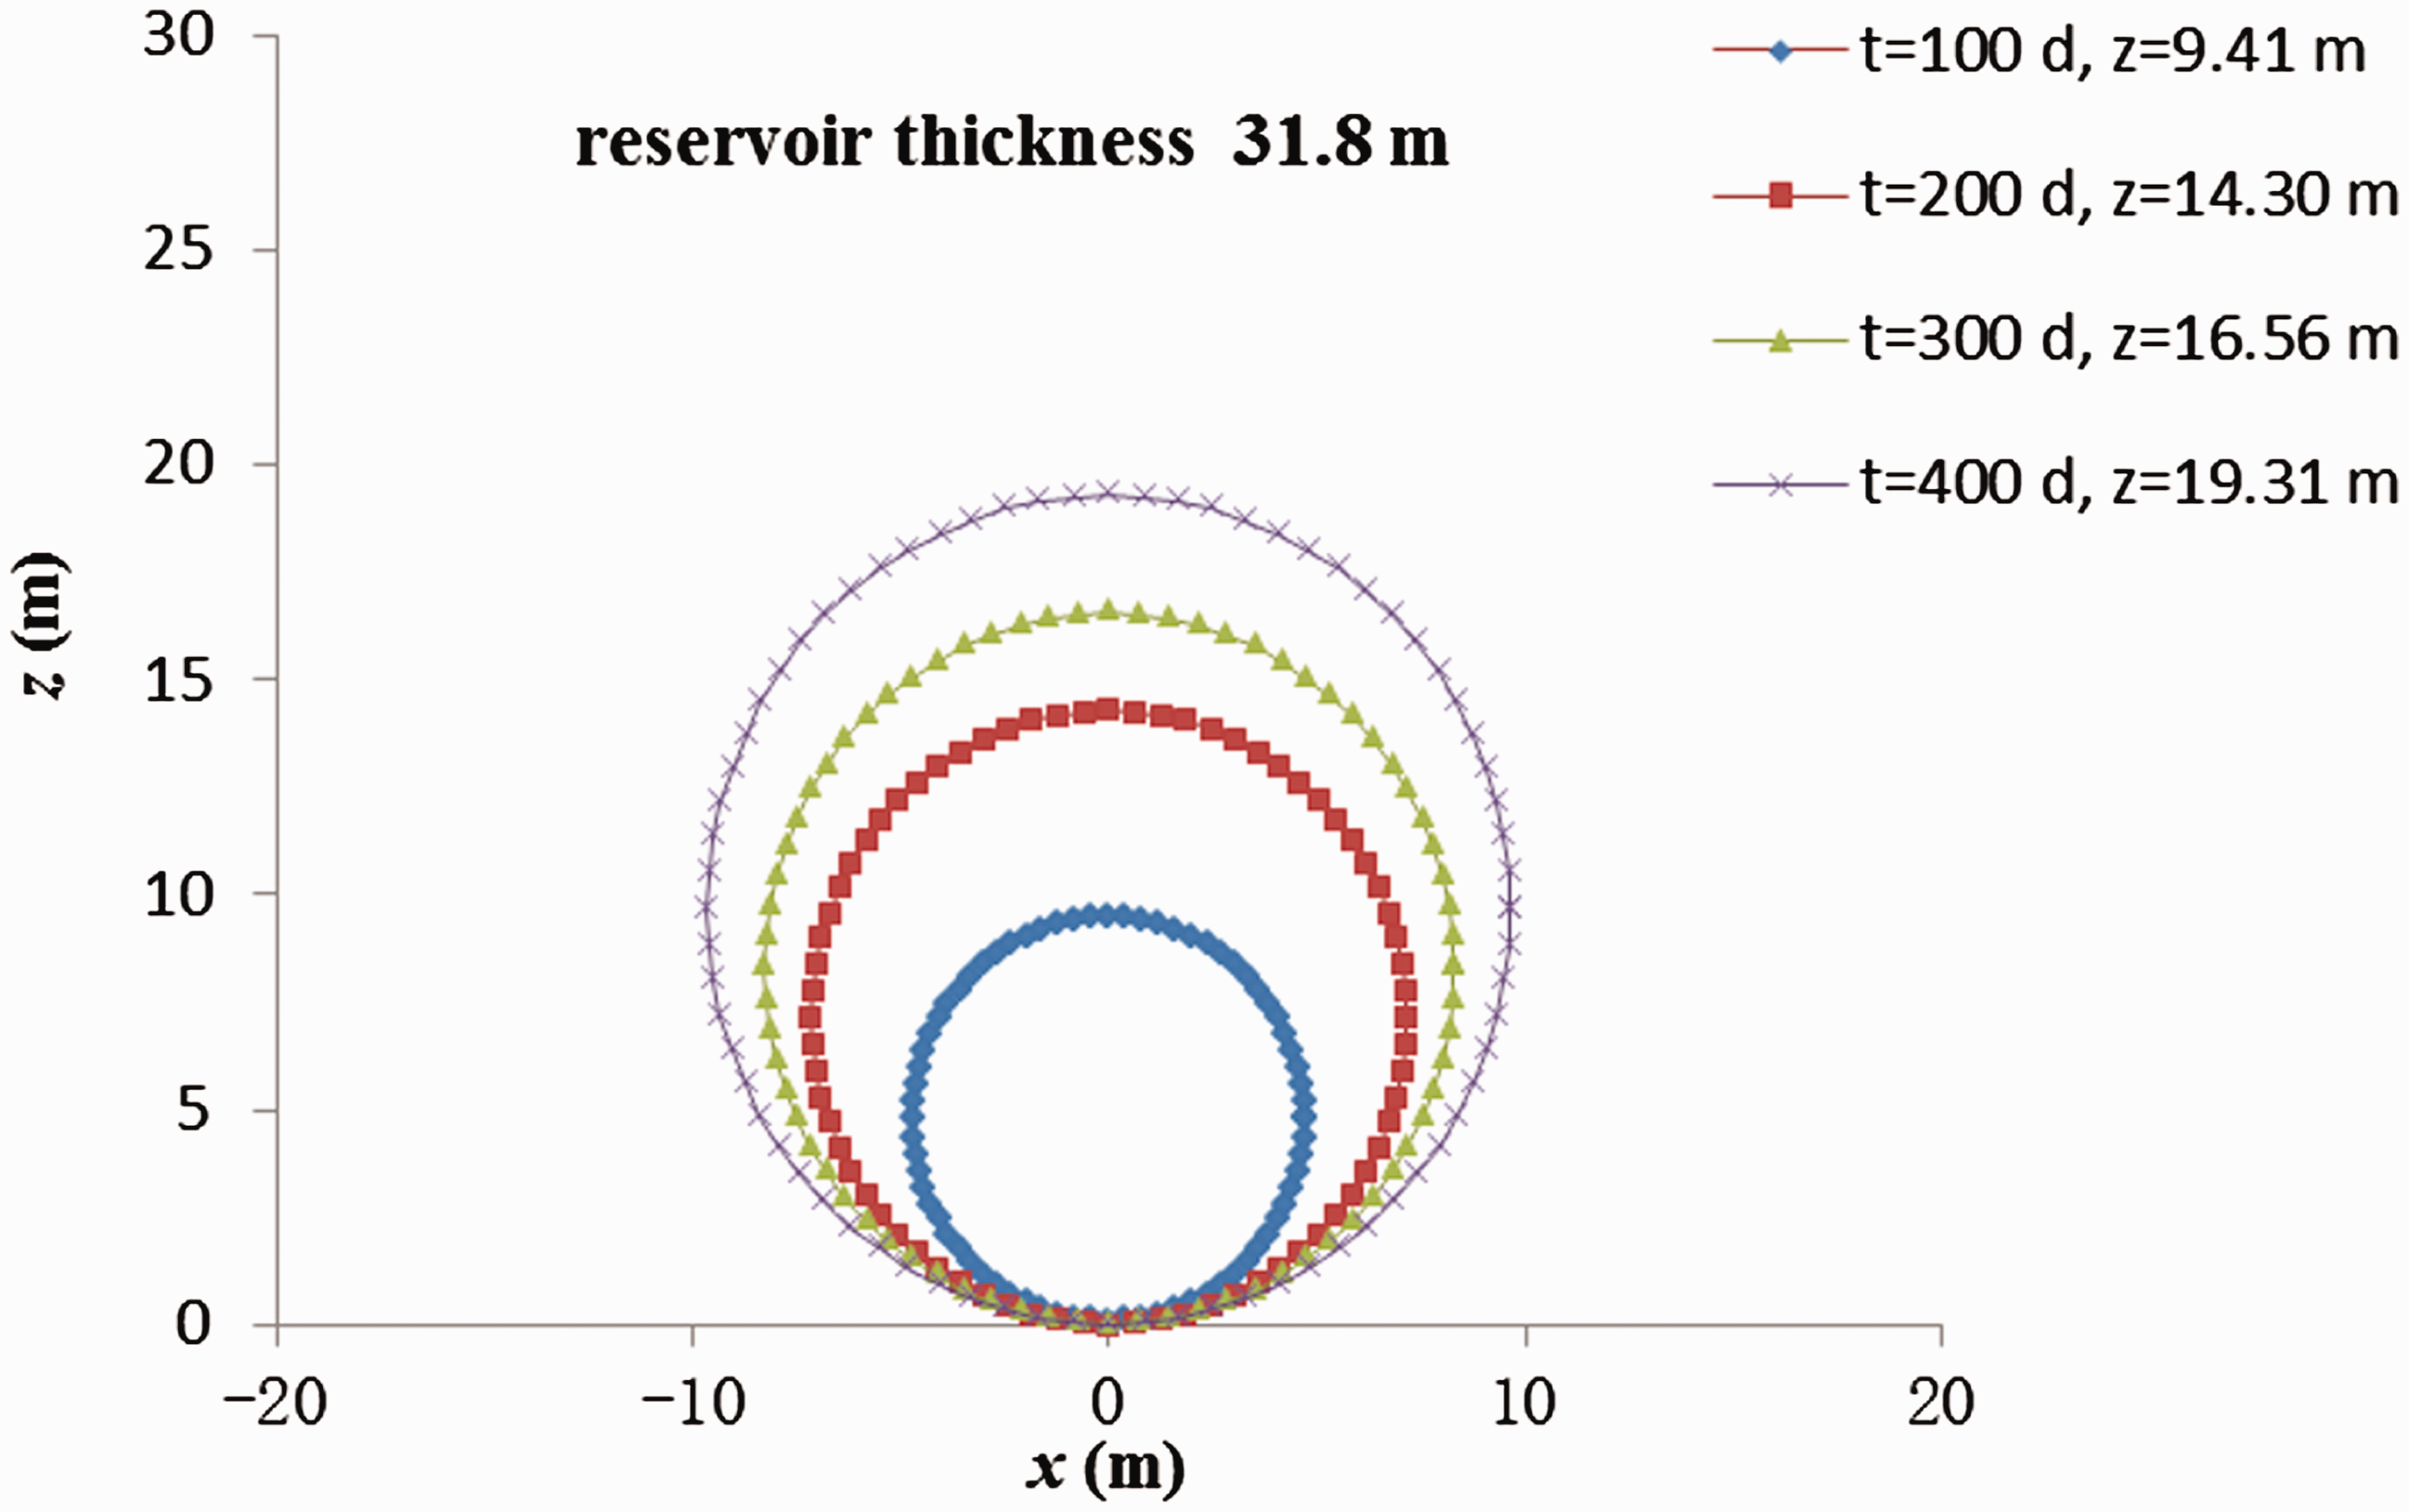
Locations of the steam chamber interface at days 100, 200, 300, and 400.
Steam chamber rising rates at different times.
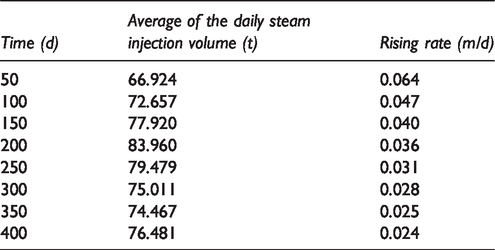
To predict the rising time and daily oil production, we assumed that the daily steam injection volume was a constant, which was equal to the average of the daily steam injection volume at day 400. The daily steam injection volume at day 400 was 76.481 t, as shown in Table 2. According to the calculated results, the rising time of the steam chamber was 1085 days. This result indicates that the steam chamber would reach the cap rock after 685 days under the assumption that the daily steam injection volume was 76.481 t. The predicted steam chamber rising rates at different times are listed in Table 3. The predicted locations of the steam chamber interface at days 500, 600, 700, 800, 900, 1000, and 1085 are shown in Figure 18. The oil production rate after day 400 was predicted to be 34.12 t/d, as shown in Figure 19.
Predicted steam chamber rising rates at different times.
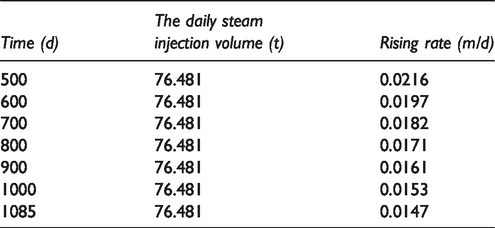
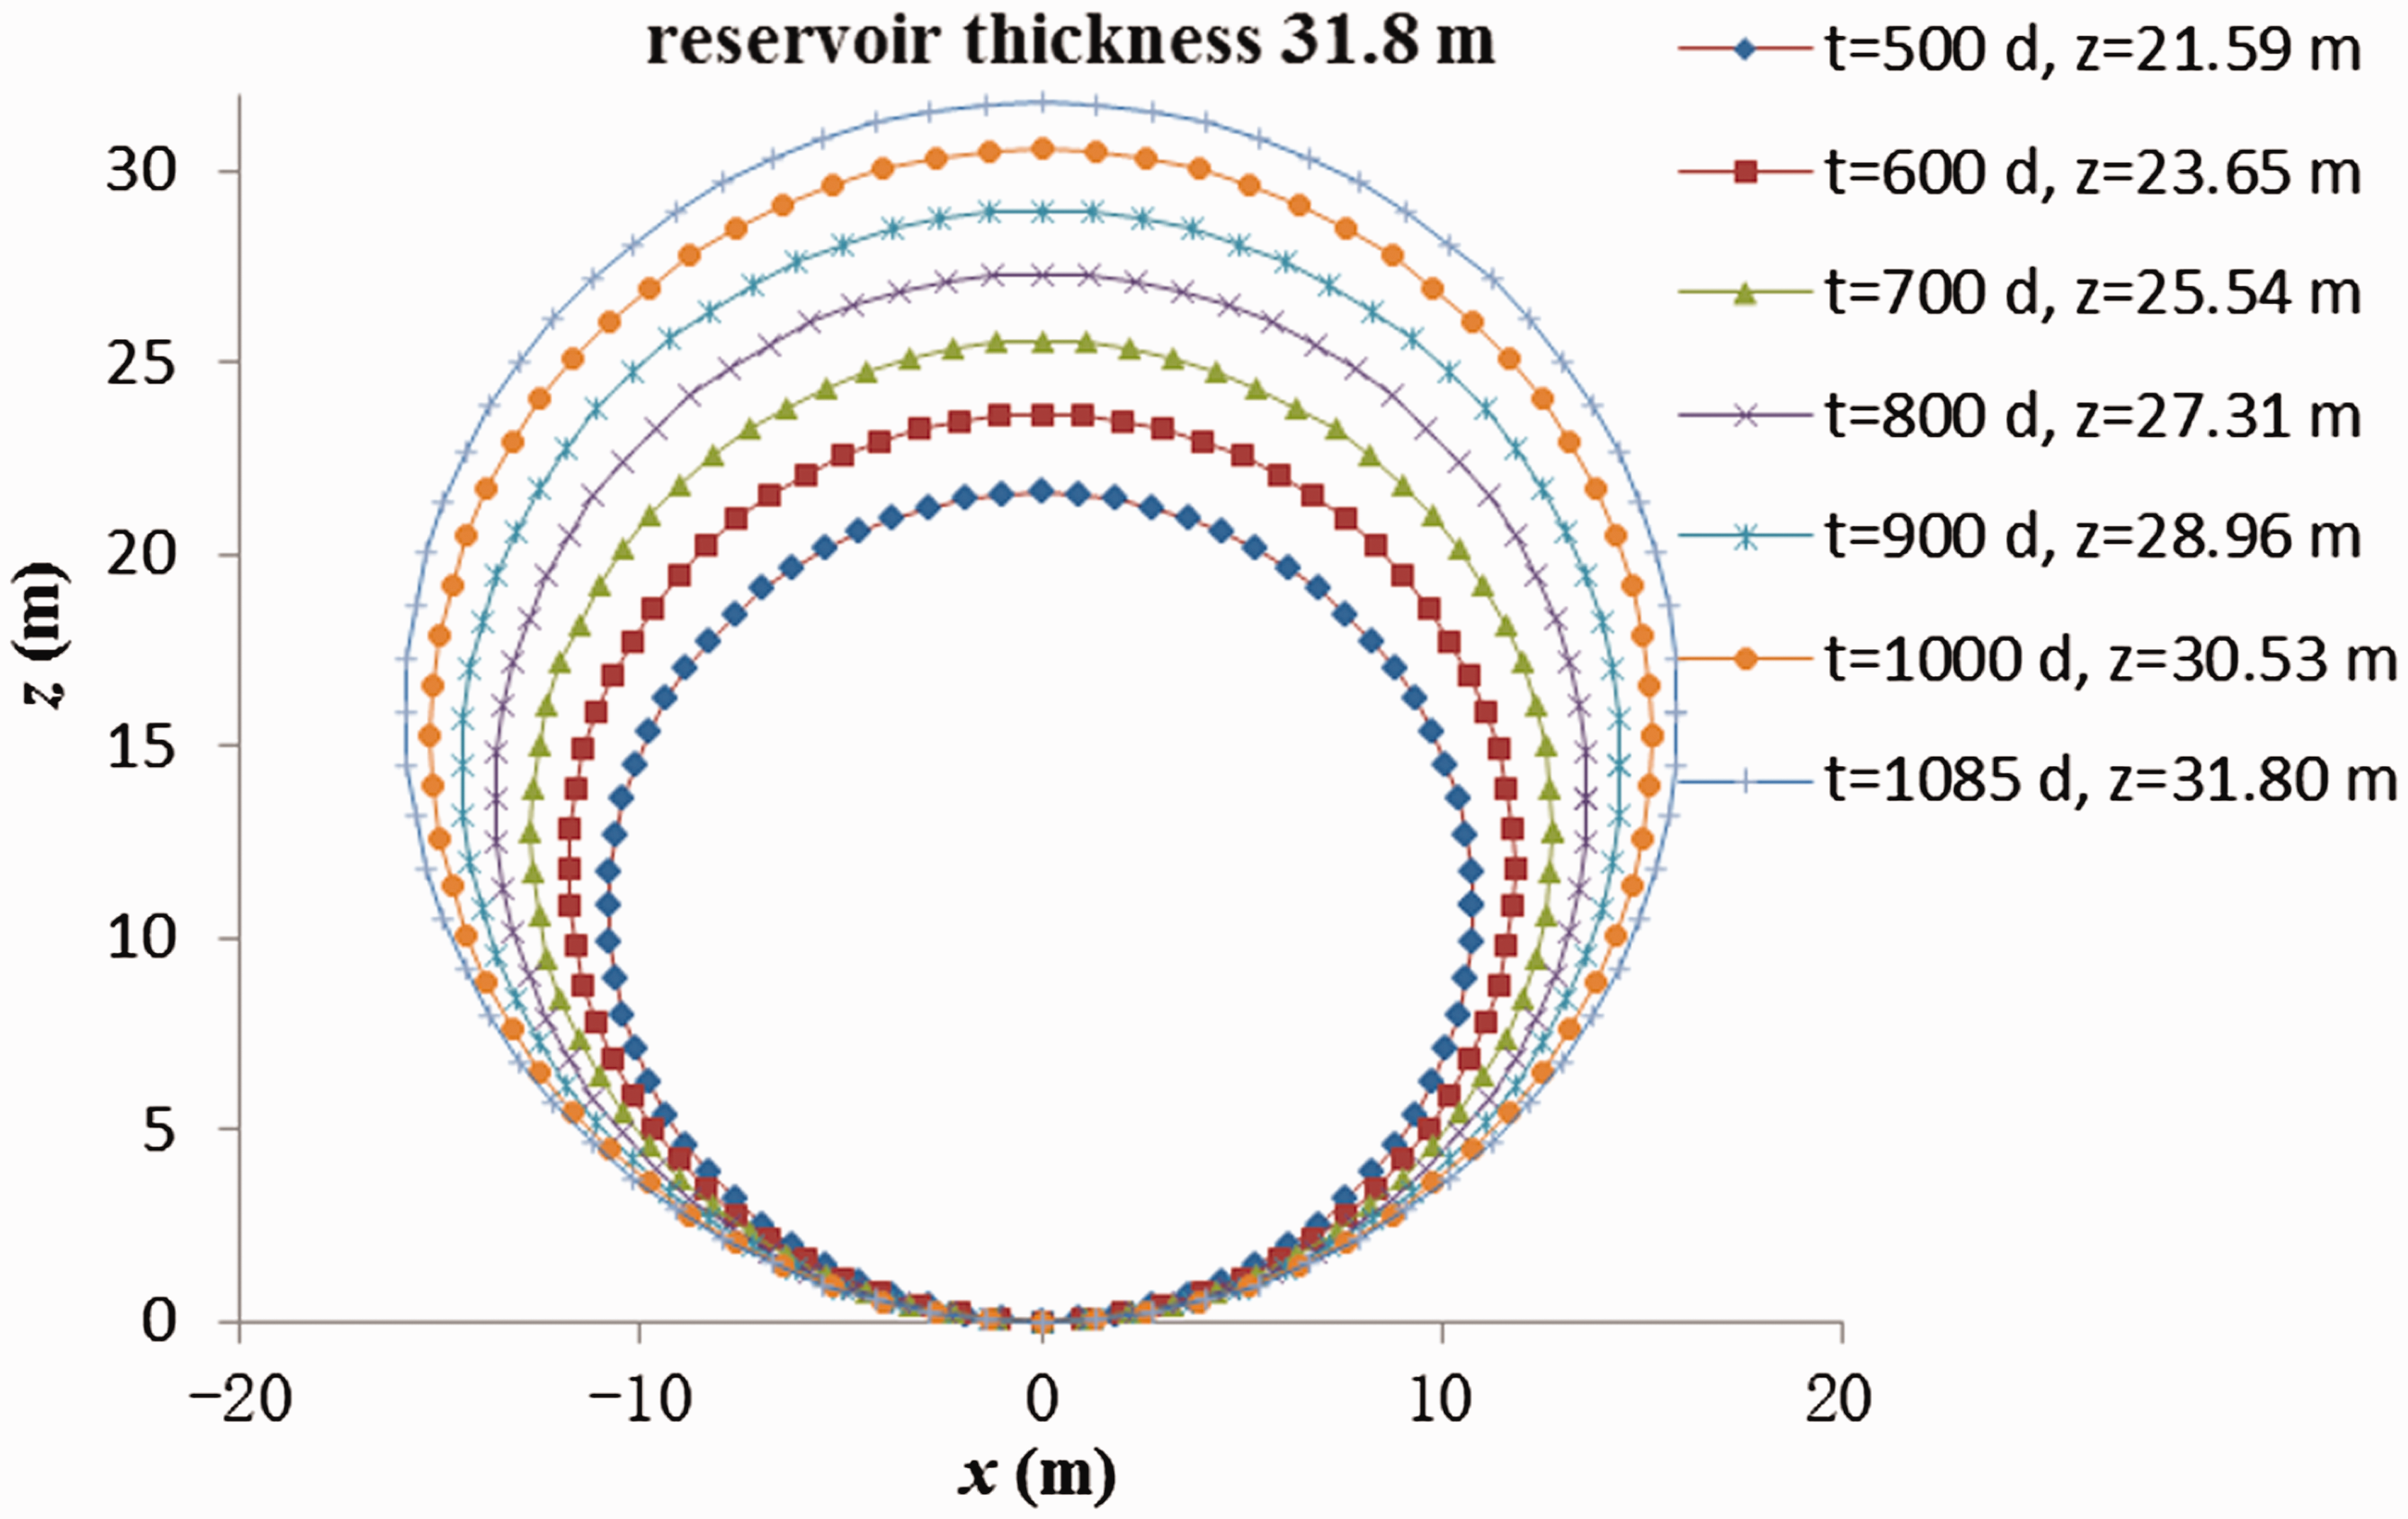
Predicted locations of steam chamber interface at different times.
Relationship between daily oil production calculated by the model and time.
Conclusions
This paper proposed a new model to mimic the steam chamber development and predict the oil production rate during the steam chamber rising stage. The model establishes the relationship between the steam chamber development and production performance. The steam chamber rising rate is not a constant, but decreases over time. It was found that the model parameters, such as the steam injection rate and steam quality, have a significant influence on the SAGD production performance and development of the steam chamber. A comparison between the data calculated by the proposed model and the data from a real oilfield verified the ability of the new model, which can be used to predict the daily oil production, the location of the steam chamber interface, and the rising rate at any time before the steam chamber reaches the cap rock.
Footnotes
Declaration of conflicting interests
The author(s) declared no potential conflicts of interest with respect to the research, authorship, and/or publication of this article.
Funding
The author(s) disclosed receipt of the following financial support for the research, authorship, and/or publication of this article: The authors would like to thank the NSFC (National Natural Science Foundation of China) for supporting this article through a Joint Fund of petroleum and chemical industry under Grant No. U1762109. The paper was financially supported by the Fok Ying Tung Education Foundation for Young Teachers in the Higher Education Institutions of China (Grant No. 151050).