
Abstract
Ventilation and air conditioning system in subway stations accounts for about 50% of the total energy consumption of the subway stations. The energy consumption ratio of public area to equipment room is about 6.5:3.5. In order to understand the energy saving potential of public areas and equipment rooms, a field measurement for a typical subway station in central China was conducted from 19 to 29 September 2018. The field testing parameters include weather conditions, indoor air temperature and humidity, supply and return air flow rate, chilled water temperature, and flow rate. Meanwhile, some parameters recorded by the system control panel, such as pump frequency, chiller power demand, and energy consumption, were also collected. The paper studied the operating characteristics of the ventilation and air conditioning system and the cooling load pattern of the subway station, focusing on the following three aspects: cooling capacity and power demand of the chiller under different conditions, dynamic cooling capacity of the air handling units, and cooling load characteristics of the equipment rooms. Different operation conditions influence the operation of chiller. It was found that the real power demands under two operation conditions, i.e. minimum and all fresh air modes, are 121 and 77 kW, and the corresponding coefficient of performances are 4.33 and 4.77, respectively. The actual cooling capacity at night is about 80% that of the daytime, and is about 40% of the design value, which indicates that the air handling units operate under partial load. During the testing period, the actual cooling load is about 10–50% of the design load, of which 50–95% is sensible cooling load. These data can help readers understand the overall situation of a typical subway station adequately and provide numerical basis for energy saving optimization of the ventilation and air conditioning system.
Keywords
Introduction
In recent years, the increasing requirement of municipal transportation has led to a significant growth in the number of the subway transportation systems. According to the recent report from the China Association of Metros (China Urban Rail Transit Association, 2019), subway transportation systems were constructed in 35 cities, with a total of 185 lines and 4354 km in 2018. Compared with 2017, the growth ratio is about 23% (Yang et al., 2019; Zhang et al., 2019a). The annual energy consumption of non-transfer subway station ranges from 1.8 to 2.3 million kW h, while the energy consumption of the ventilation and air conditioning (VAC) system accounts for at least 50% (Ampofo et al., 2003; Guan et al., 2018; Philip and Eric, 2013). The energy consumption is becoming increasingly severe. The VAC system for a typical subway station consists of four subsystems: public area VAC system (the large system), equipment room VAC system (the small system), water system, and tunnel ventilation system (Kuang and Yu, 2003; Zhang et al., 2018a). Among them, the cooling load ratio between public area and equipment rooms is about 6.5:3.5, while the area ratio between them is 7:3 (He, 2007; Yang et al., 2014). Zhang and Wei (2012) analyzed the disadvantages of a VAC system: large equipment investment and high operation cost were among them. Furthermore, the chiller is in partial load operation, which causes energy consumption waste. Zhang et al. (2018b) studied the characteristics of the cooling load in subway stations. The cooling load per unit area of the public area and the equipment rooms was 141 and 300 W/m2, respectively. Pan et al. (2017) studied the practical operation conditions of the chiller in 10 underground subway stations. The results showed that the average coefficient of performance (COP) of the chiller was about 4.4. Li et al. (2017) proposed practical measurement of the equipment rooms and compared the deviation between heat generation and design load to provide a basis for optimization. However, from literature review, most of the current researches about energy consumption aim at one certain aspect of the subway, such as chillers or equipment rooms. There is little research on the whole VAC system. In addition, the energy consumption under different operation modes is not considered.
Subway stations are much different from commercial buildings. It needs to be cooled all year round. Furthermore, the plane layout of a subway station is generally very long and narrow, as shown in Figure 1. The characteristics of operational feature and the cooling load of subway stations still need to pay more attention. Thus, a field test was conducted around the public area, equipment rooms, and water system. There are three operation modes during the testing period: minimum fresh air mode, all fresh air mode, and ventilation mode. This paper analyses the operating characteristics of the VAC system from three aspects. First, the energy consumption of the chiller under different operation modes is analyzed. Upon literature review, research on the energy consumption of cooling system in subway stations was only divided into the air conditioning season and ventilation season. However, the cooling outputs and power demands of cooling system are completely different between the minimum fresh air mode and all fresh air mode. The air conditioning season needed to be subdivided. It is necessary to identify the operating performance of the VAC system under different operating modes. Second, the cooling capacity of the air handling units (AHUs) is analyzed. The real operation status is always unknown because of the lack of sensors in the system. The actual operation status of AHUs can be obtained only through field investigation. Third, there is a general phenomenon that the temperature of equipment rooms is much lower than the design value. It causes energy consumption waste inevitably. Analyzing the cooling load of equipment rooms is the key to solve this problem. Thus, the sensible cooling load and latent cooling load of the equipment rooms are calculated. The dynamic characteristics of the ventilation system are also analyzed.
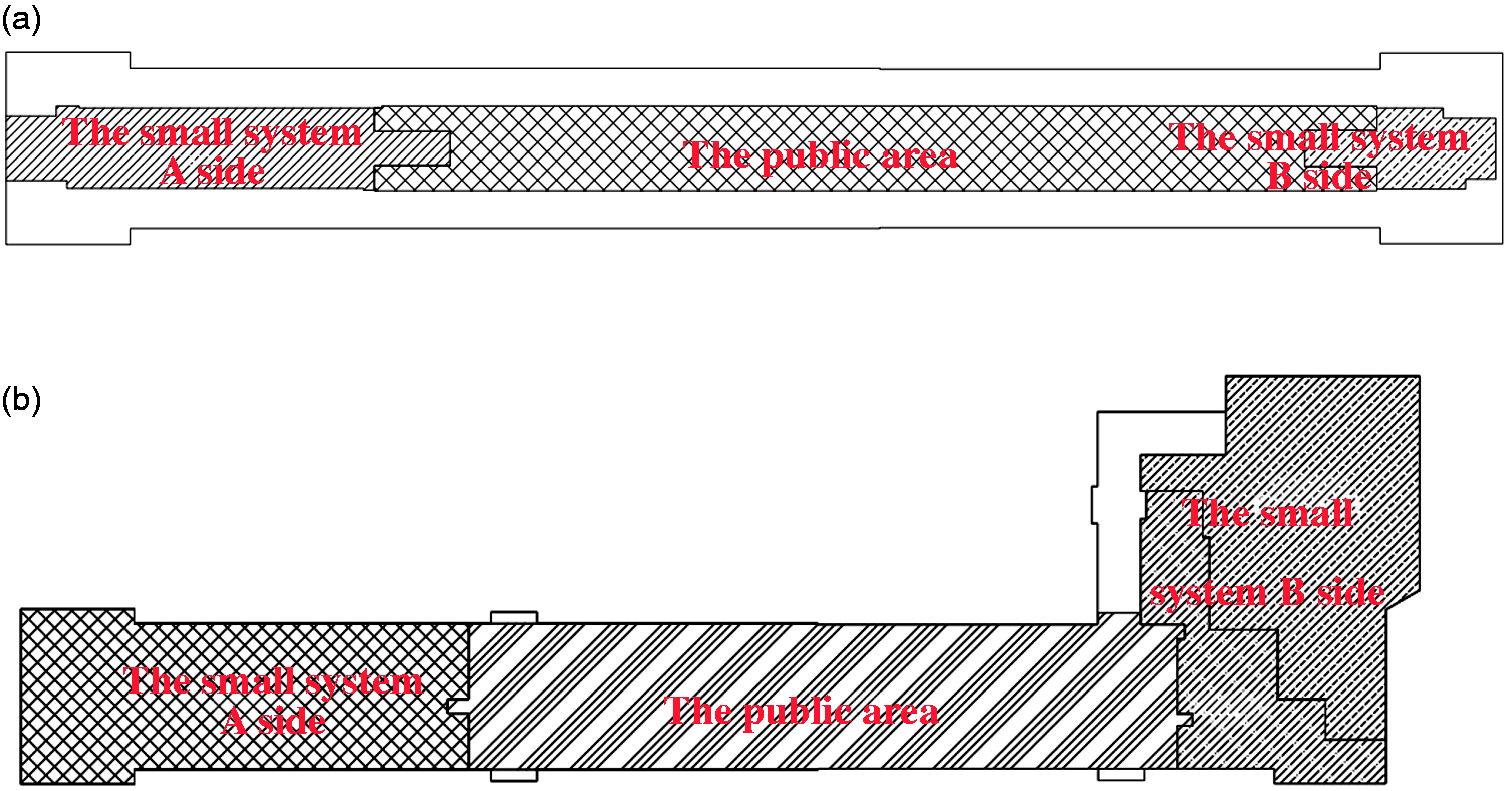
Subway plan: (a) platform floor plan and (b) station floor plan.
Engineering situation
The investigated subway station is located in Changsha, which is a standard non-transfer island station with 177.5 m in length and 18.7 m in width. The main building area is about 7657 m2. The public area of the station floor is 1630 m2, mainly used for ticket checking. The public area of the platform floor covers 1120 m2, which is used for passenger waiting. The equipment rooms are distributed at both ends of the subway station, with total area of 768 m2, as shown in Figure 1.
The all-air system was adopted for this subway station, and its schematic diagram is shown in Figure 2. The detailed technical specifications of the cooling components are shown in Table 1. AHU-101 and AHU-201 provide the cooling to the public area. The heat dissipation of the equipment room is removed by AHU-B101, AHU-B201, and AHU-B901. AHU-B101 serves the equipment rooms on the A side of the small system, including environmental control room, signal equipment room, commercial equipment room, and so on. The design air temperature is 27°C. AHU-B201 serves the rest of equipment rooms on the A side of the small system, including transformer and distribution room and 40.5 kV switch cabinet room. The design air temperature is 36°C. AHU-B901 is designed for the equipment rooms on the B side of the small system, including lighting distribution room and environmental control room. The design air temperature is 27°C.
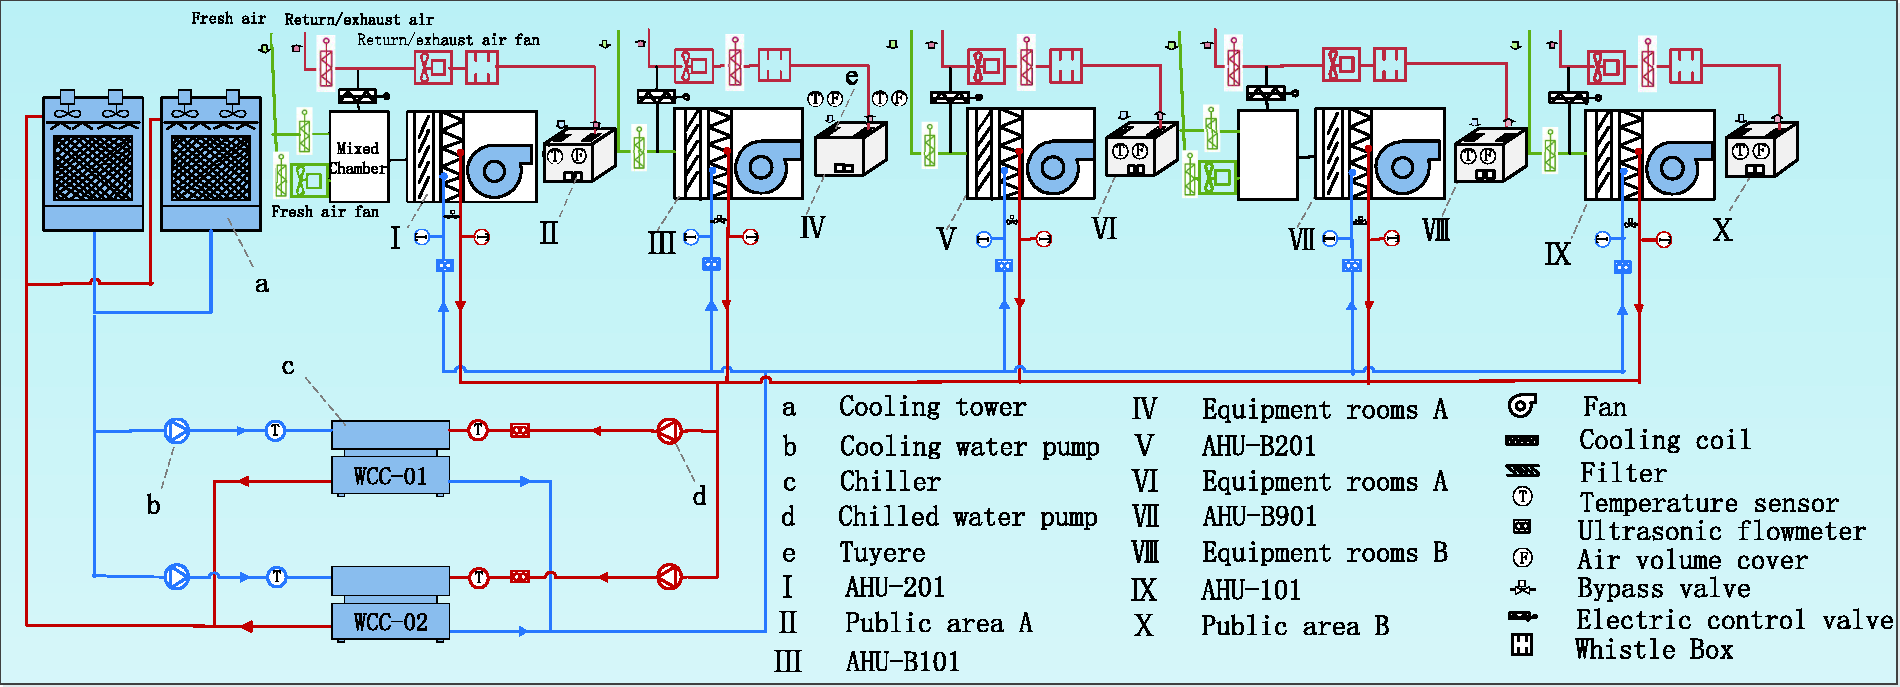
Schematic diagram of the VAC system.
Technical specification of the cooling components.
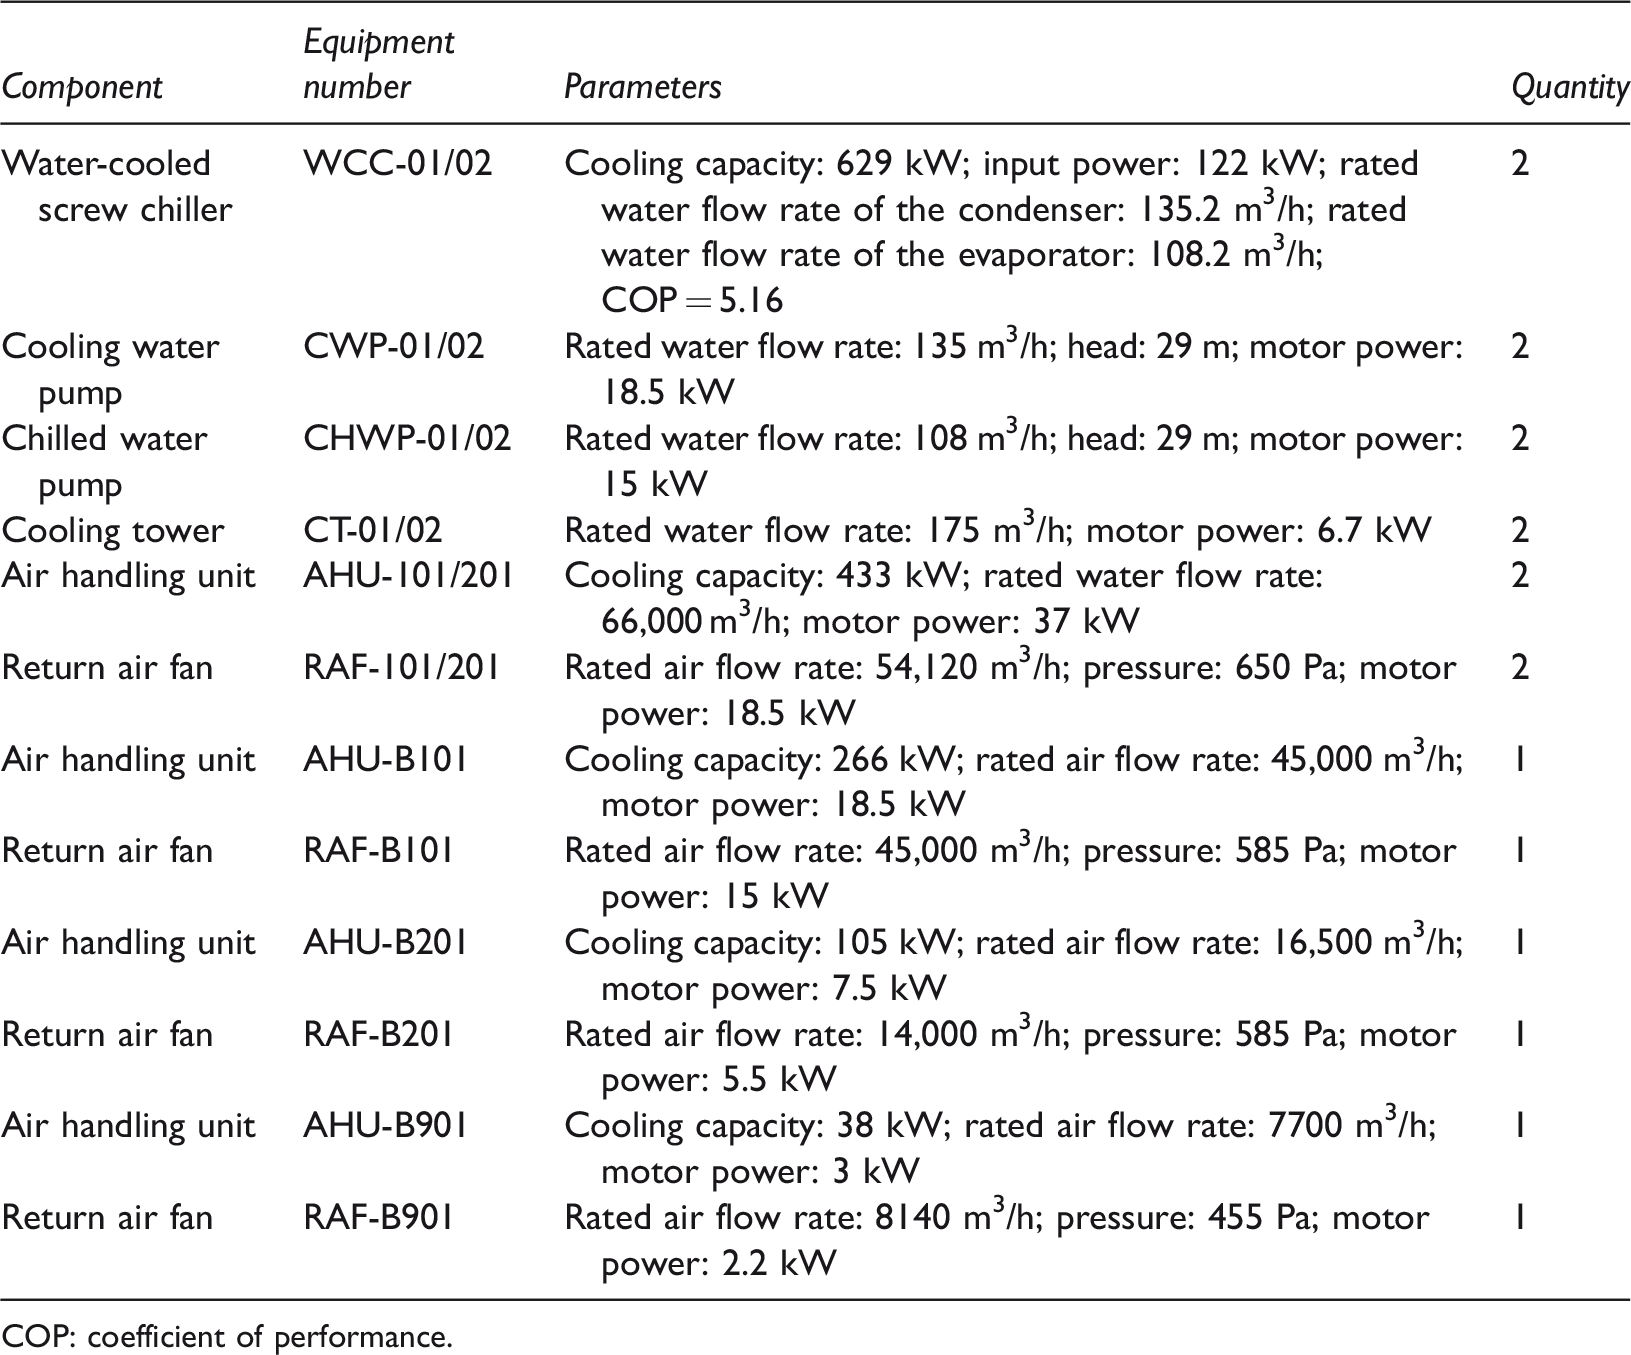
COP: coefficient of performance.
Unlike commercial buildings, subway stations need to be cooled all year round. Since passengers flood into the subways in peak hours, the cooling load demands increased rapidly, and the VAC system always operates in different cooling modes according to the different indoor and outdoor parameters. There are three operation modes: the minimum fresh air mode, the all fresh air mode, and the ventilation mode (Yang, 2006). The VAC system will switch to the different modes according to indoor set points, ambient weather conditions, and returning air status, and the equipment and energy consumption characteristic varies dramatically.
Calculation methods
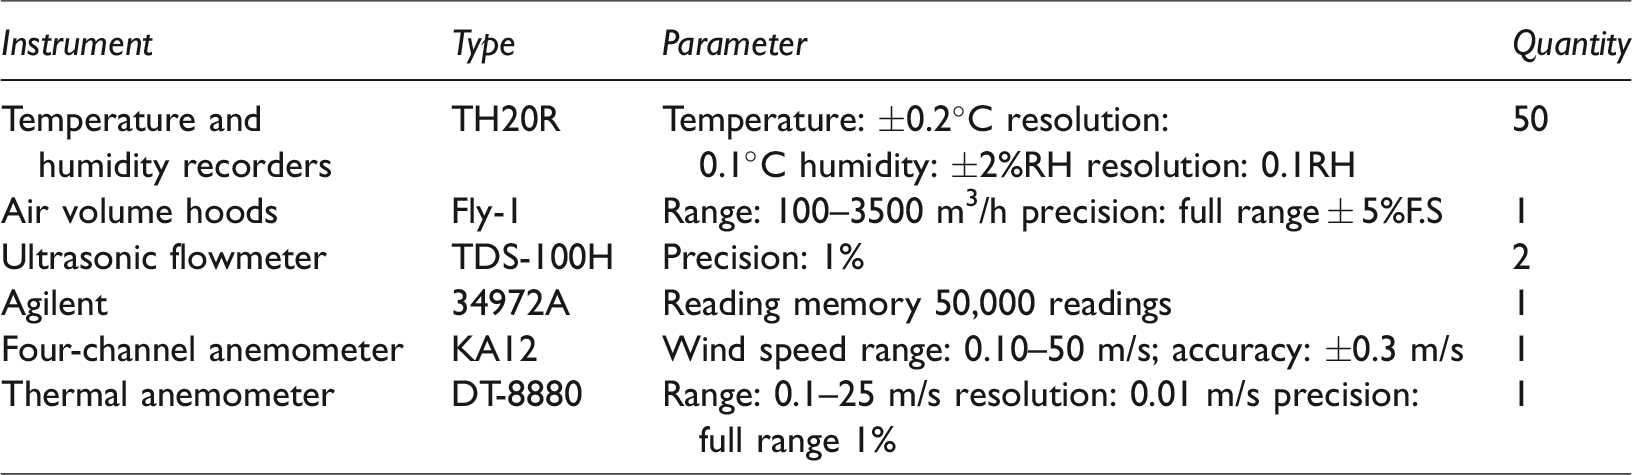
In order to obtain the specific energy consumption of the VAC system, practical test of each component is carried out. The chilled water flow rate is collected by the ultrasonic flowmeter to calculate the cooling capacity of the chiller and the AHUs. The test interval is 30 min. The water temperature is measured by the Agilent and K-type thermocouple. The test interval is 10 s. Thus, the hourly cooling capacity for each component can be obtained. The air flow rate and the air temperature were collected using air volume hoods and temperature and humidity recorders. The test interval of temperature and humidity recorders is 1 min. The cooling load of the equipment rooms is thus calculated using the measurement data and the dynamic load characteristics are also analyzed. The concrete measuring instruments are shown in Table 2.
Measuring instruments and parameters.
Calculation methods of the chiller performance
The supply and return water flow rate and water temperature were measured as mentioned above. In addition, the cooling capacity of the chiller and AHUs are calculated as follows

The energy efficiency ratio COP of the chiller is defined as equation (2)
Calculation methods of the cooling load
The cooling load of the equipment rooms is mainly the sensible load. The latent load is only from the fresh air and infiltration. In this test, the cooling load Q is calculated through air enthalpy difference. The relationship between the saturation humidity ratio and the dry-bulb temperature can be obtained from equation (3), and then the enthalpy value can be obtained from equation (4). At last, the cooling load of the equipment rooms can be calculated via equation (5)


The sensible heat load Qx can be obtained by equation (4), as follows

Results and analysis
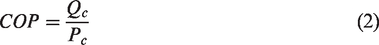
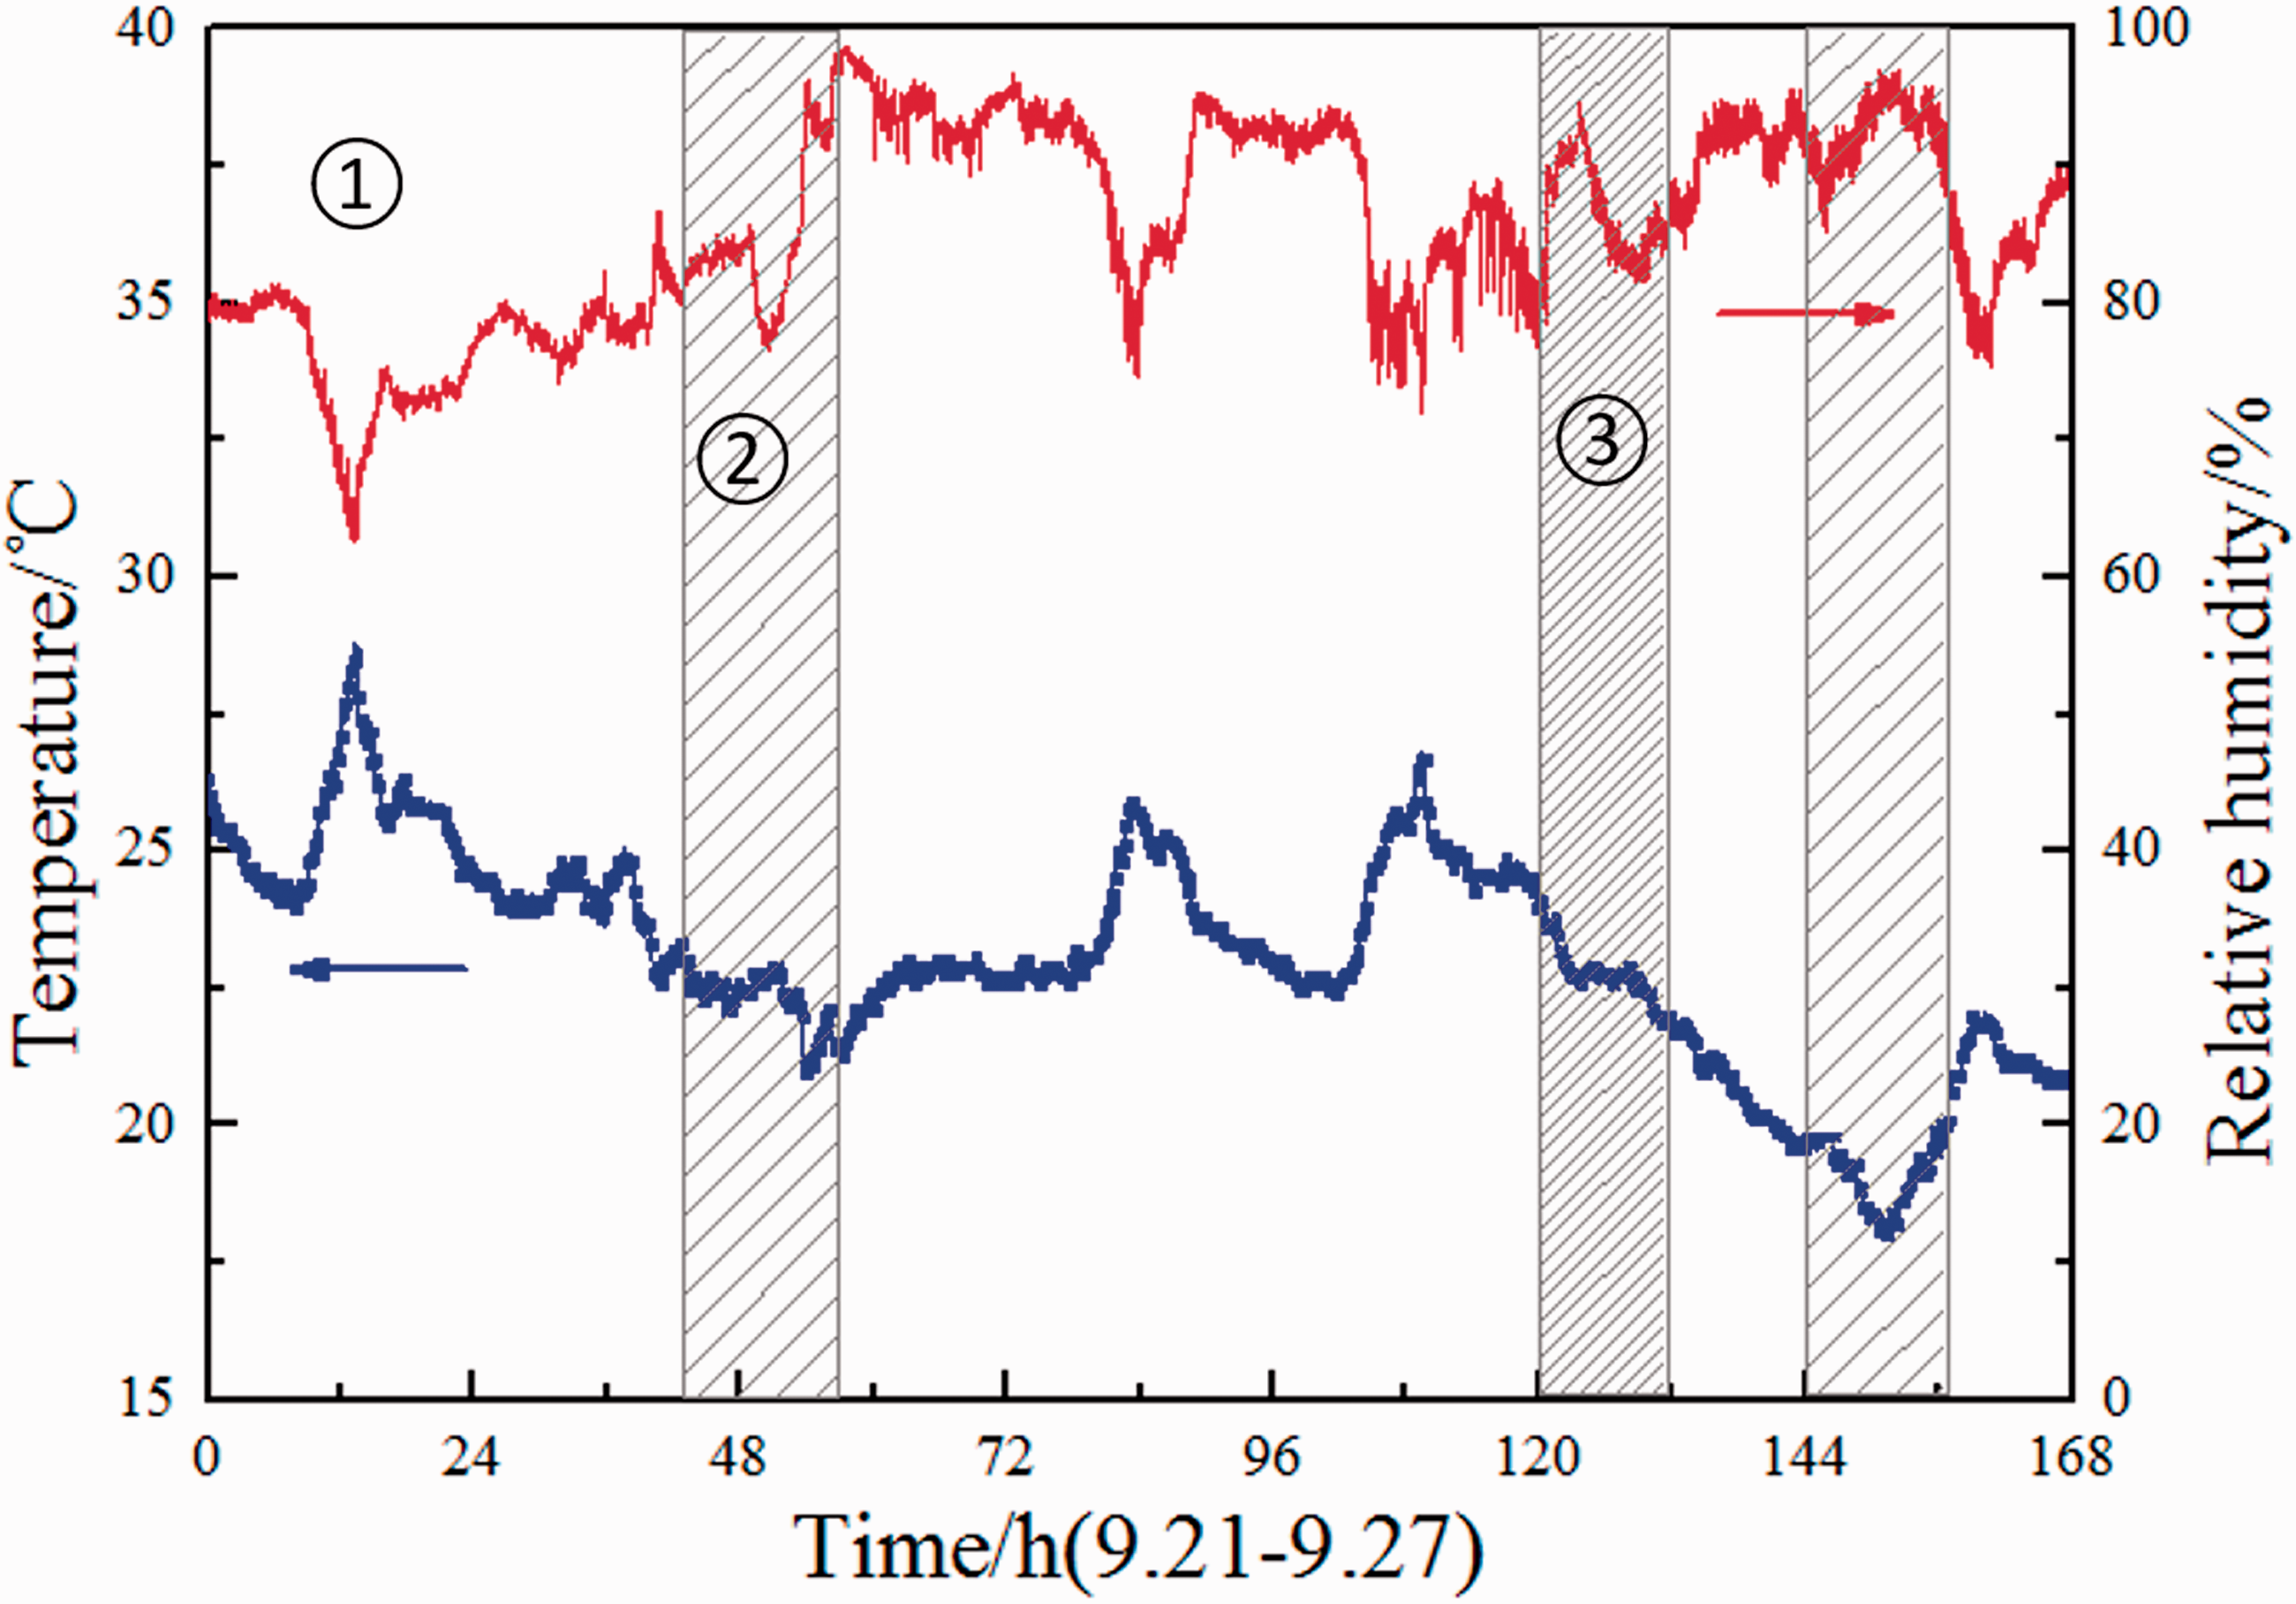
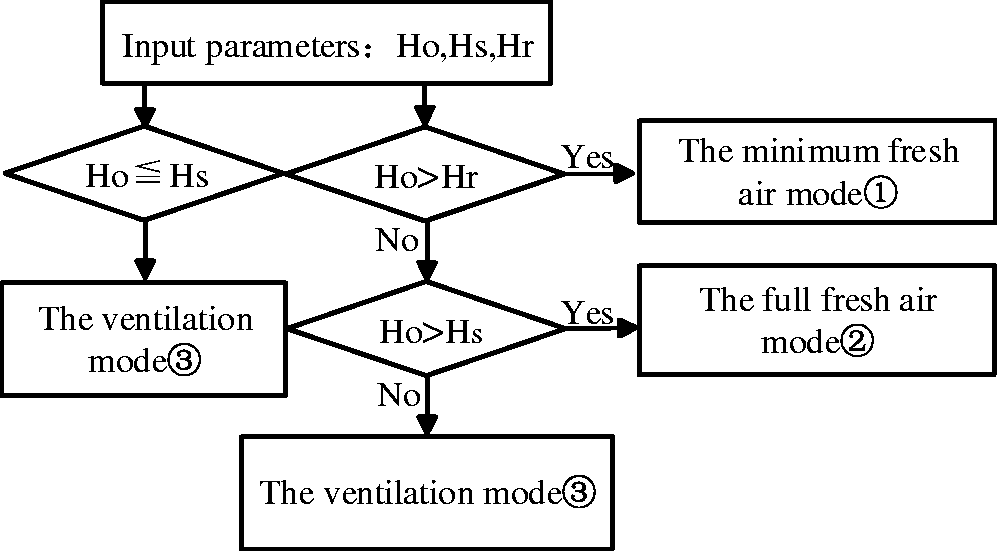
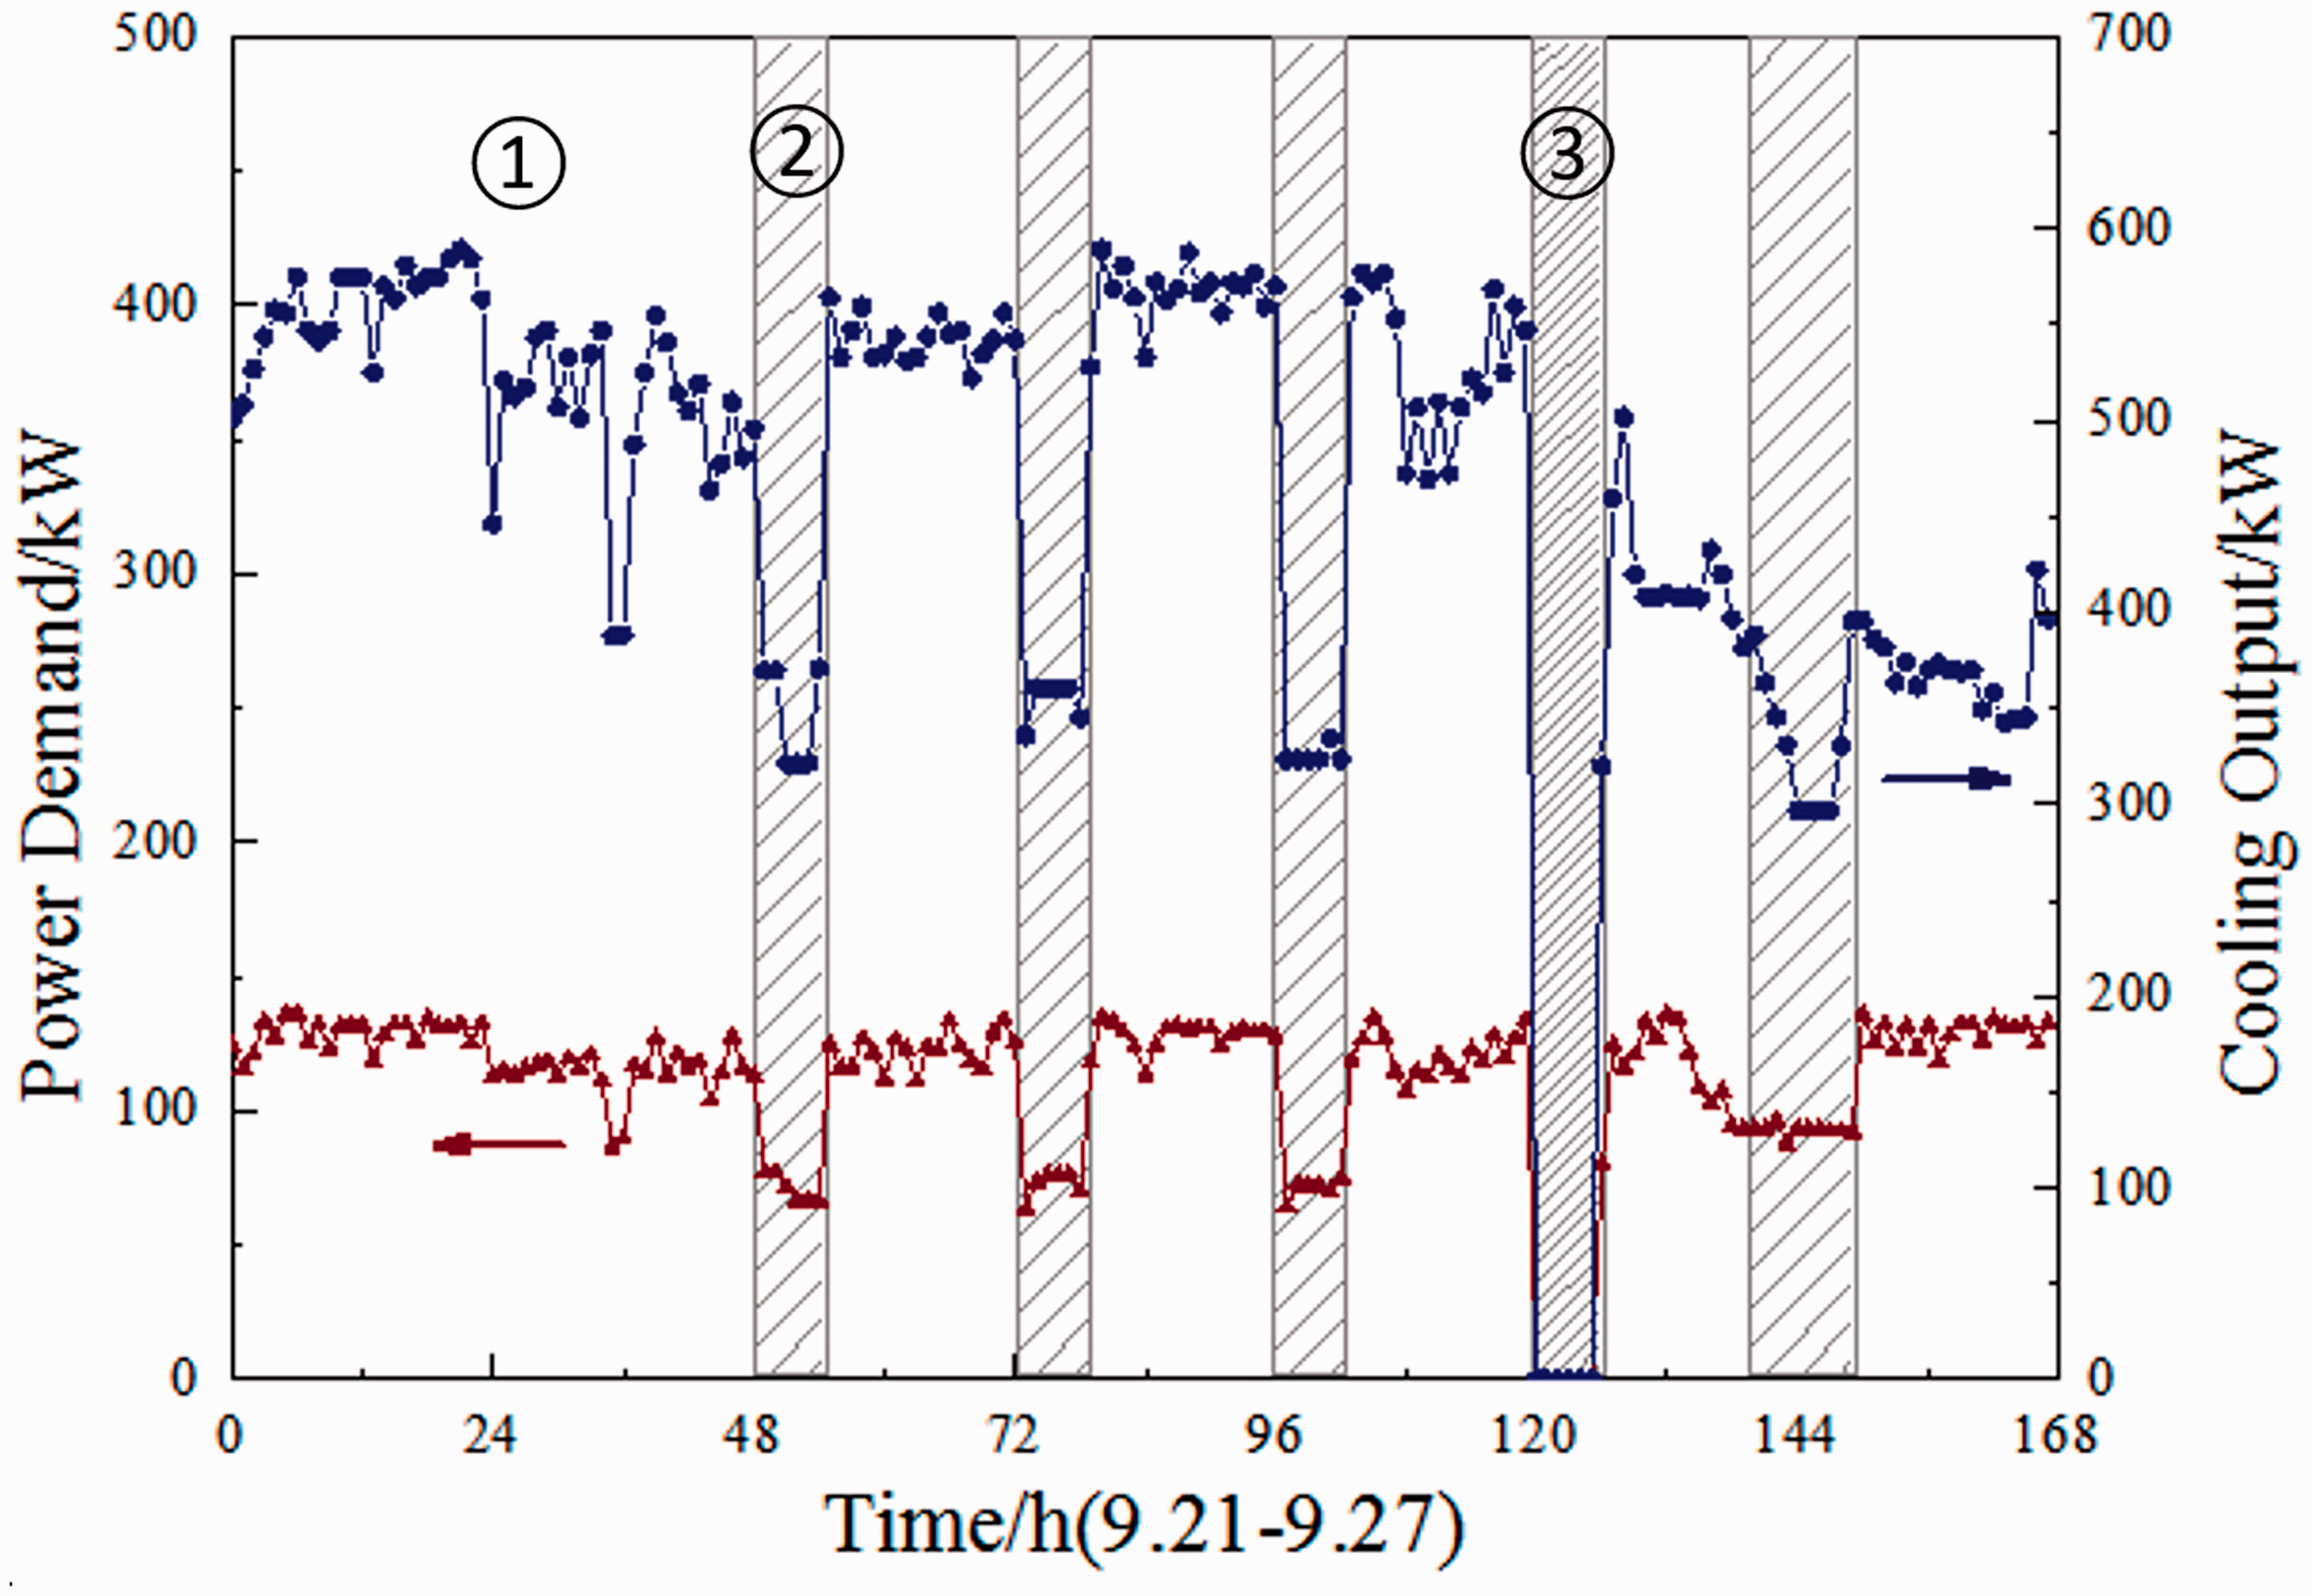
The subway station is located in Changsha, China. The weather condition is shown in Figure 3. The operation mode of cooling system is switched based on the outdoor weather and indoor environmental parameters. Specifically, the VAC system operation mode is switched according to the relationship among the outdoor air enthalpy Ho, the supply air enthalpy Hs, and the return air enthalpy Hr, as shown in Figure 4. In the study, the minimum fresh air mode, the all fresh air mode, and the ventilation mode are expressed by ①, ②, ③, respectively. When Ho is greater than Hr, the water system is turned on and the minimum fresh air mode ① is adopted. When Ho is lower than Hr, and greater than Hs, the water system is activated and the all fresh air mode ② is adopted. When Ho is lower than Hs, the water system is turned off and the ventilation mode ③ is adopted. However, when the outdoor temperature decreases and remains at a certain time, the system will be the first to start the ventilation mode to save energy consumption. If the temperature of the equipment rooms complies with the design requirement, the system will keep on running ventilation system. If the temperature exceeds the design value, the operation modes will be determined by the comparison result of tested enthalpies. The detail enthalpy value was tested from AHU-B101 during the test period, as shown in Figure 5. From Figure 5, we further confirmed that AHU-B101 worked at the different modes according to the variation of the relative enthalpy difference. The values of diagram also serve as a reference for Figures 6, 12, and 13.
Outdoor weather parameters.
VAC system operation modes.
Enthalpy during the test period.
Chiller performance analysis
The VAC system provides cooling for the public area and the equipment rooms during the daytime. However, cooling is not required in the public area when the metro is out of service at night. Thus, the VAC system only needs to provide cooling for the equipment rooms. The large difference of the load pattern between day and night inevitably affects the performance of the chiller. Furthermore, the chiller performance is also affected by different operation modes. The cooling output and power demand of the chiller under three operation modes are shown in Figure 6. First, under the minimum fresh air mode ①, the chiller operates at constant frequency. The day and night cooling outputs are 548.41 and 516.28 kW, respectively, while the corresponding power demands are 125.73 and 122.77 kW. When the public area is out of work, the cooling outputs decrease as shown in Figure 6. The cooling output at night is little smaller than that in the daytime. It should be mentioned that the load demand at night is only 240.64 kW. The cooling output at night is far larger than the load demand and the reasons for the little cooling output difference between nighttime and daytime are as follows: In order to prevent the refrigerant in the evaporator from condensing, the flow rate of chilled water will set a lower limit. Furthermore, the cooling capacity adjustment range of the constant frequency chiller is limited. Thus, the chilled water will be reheated by AHUs to meet the requirements of the supply air temperature, causing much energy wasted. Second, the all fresh air mode ② only exists at night. The average cooling output of the chiller is 341.51 kW, and the power demand is 71.63 kW. The COP is about 4.77. Third, part ③ shows the ventilation mode. During the ventilation mode, the chiller stops running and the cooling capacity is 0 kW. It should be pointed out that the power consumption fluctuations at 72 and 96 h cannot correspond to the operation modes shown in Figure 5. The reason is that the measured enthalpy in the study only corresponds to the AHU-B101. In fact, the switch of operation modes is determined by all the AHUs. Due to the difficulty of field measurement and the complexity of the system, all data are not obtained. Further investigation will be carried out in the near future.
Cooling output and power demand of the chiller.
AHUs’ performance analysis
The AHU-101 and AHU-201 provide cooling to the public area, and the AHU-B101, AHU-B201, and AHU-B901 remove the dissipated heat generation in the equipment room. The measured water flow rate of the AHUs is presented in Figure 7. The x-coordinate is the measured period, which starts from 11:30 in 25 September to 9:30 in 26 September. The flow fluctuation throughout the day is not large, because the chilled water pump operates at constant frequency. AHU-101 was switched off at night, and the flow rate was 0 m3/h. However, there was a temperature difference between the supply and return water. The reason is that the inlet valve was turned off. The chilled water could not flow through the return pipe, and the measured return water temperature was affected by the environment. However, the condition of AHU-201 is different. The average water flow rate of AHU-201 was 42.87 m3/h, but there was no temperature difference between the supply and return chilled water. The reason is that there was bypass water flow between the supply and return pipes, as shown in Figure 8. From Figure 9, we can find that the supply water temperatures of AHU-101 and AHU-201 are slightly different, due to the different pipe path and insulation effect. Furthermore, the temperature is about 10.26°C. It leads to the VAC system unable to handle the latent load. According to the temperature difference between the supply and return water shown in Figure 9(a) and (b), the dynamic cooling output of the AHUs is calculated, as shown in Figure 10. The whole average cooling outputs of AHU-101 and AHU-201 are 352.95 kW during the daytime and 0 kW at night, while they are 253.86 and 205.9 kW for AHU-B101/B201/B901. The whole rated cooling outputs of AHU-B101/B201/B901 are 364 kW, which are marked on the equipment nameplate. The nighttime cooling output is 81.2% of the daytime value, and the average cooling output is 36.8% of the rated value. Thus, the AHUs operate under partial load.
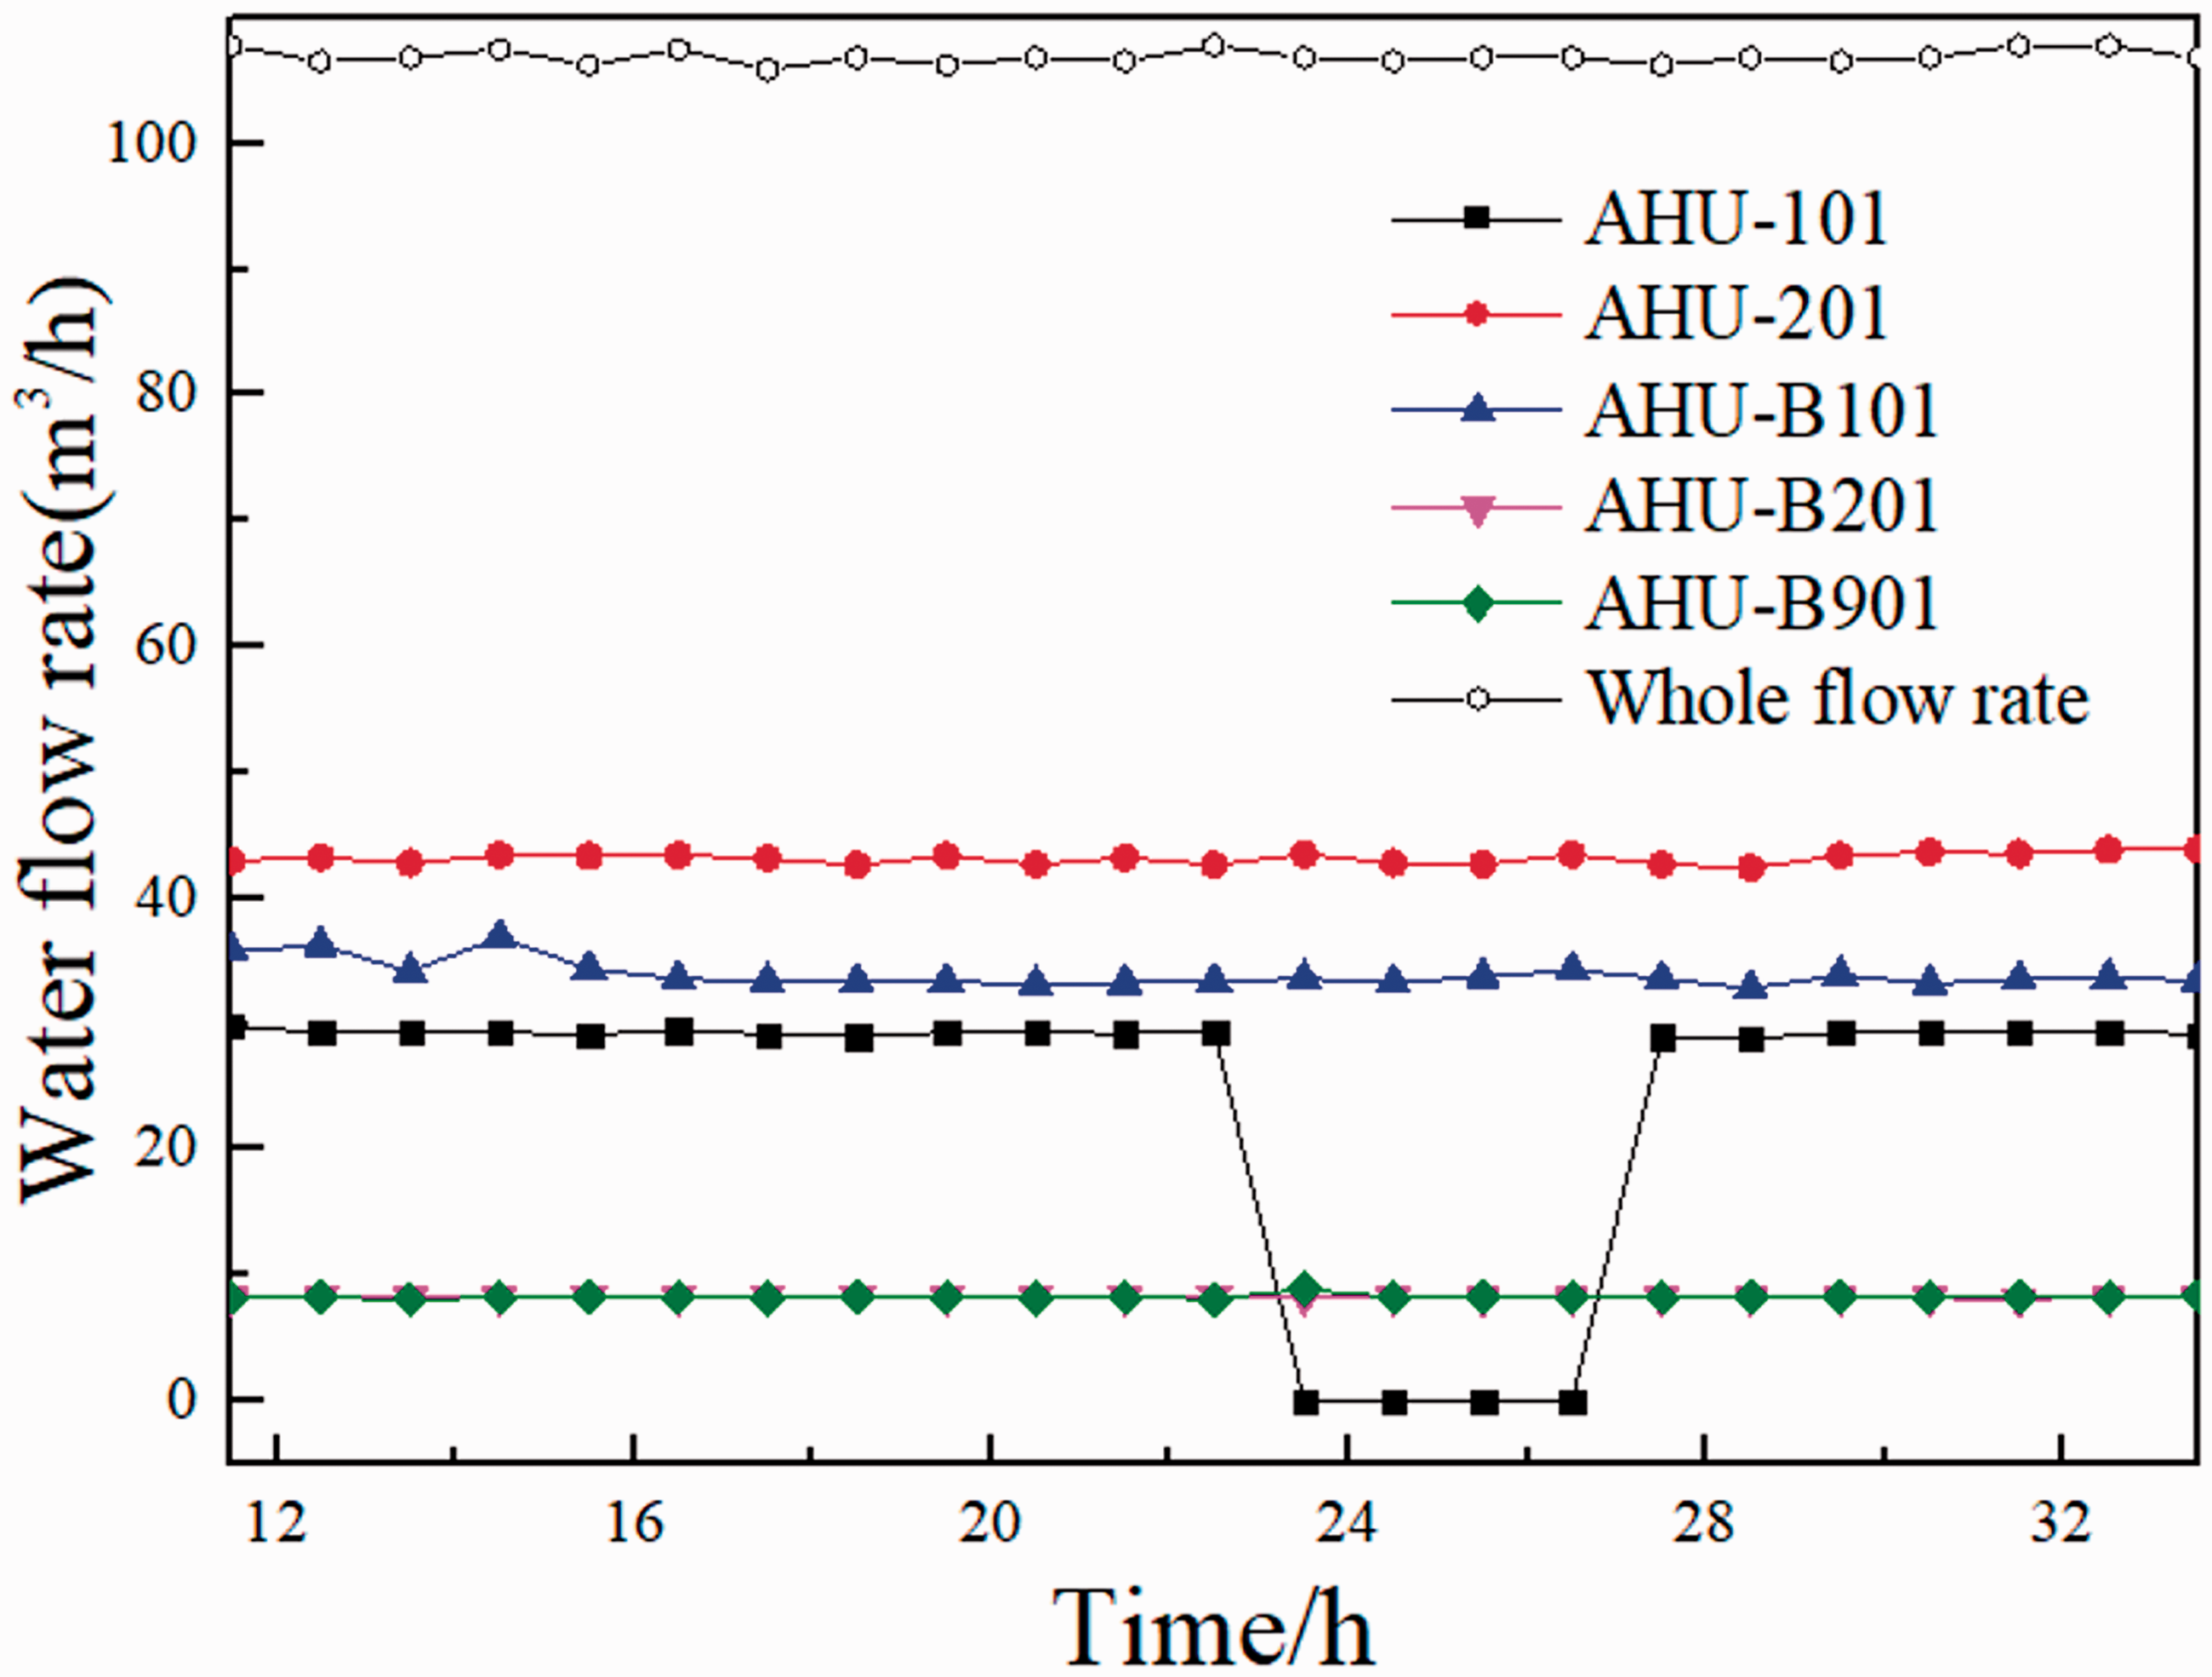
Measured water flow rate.
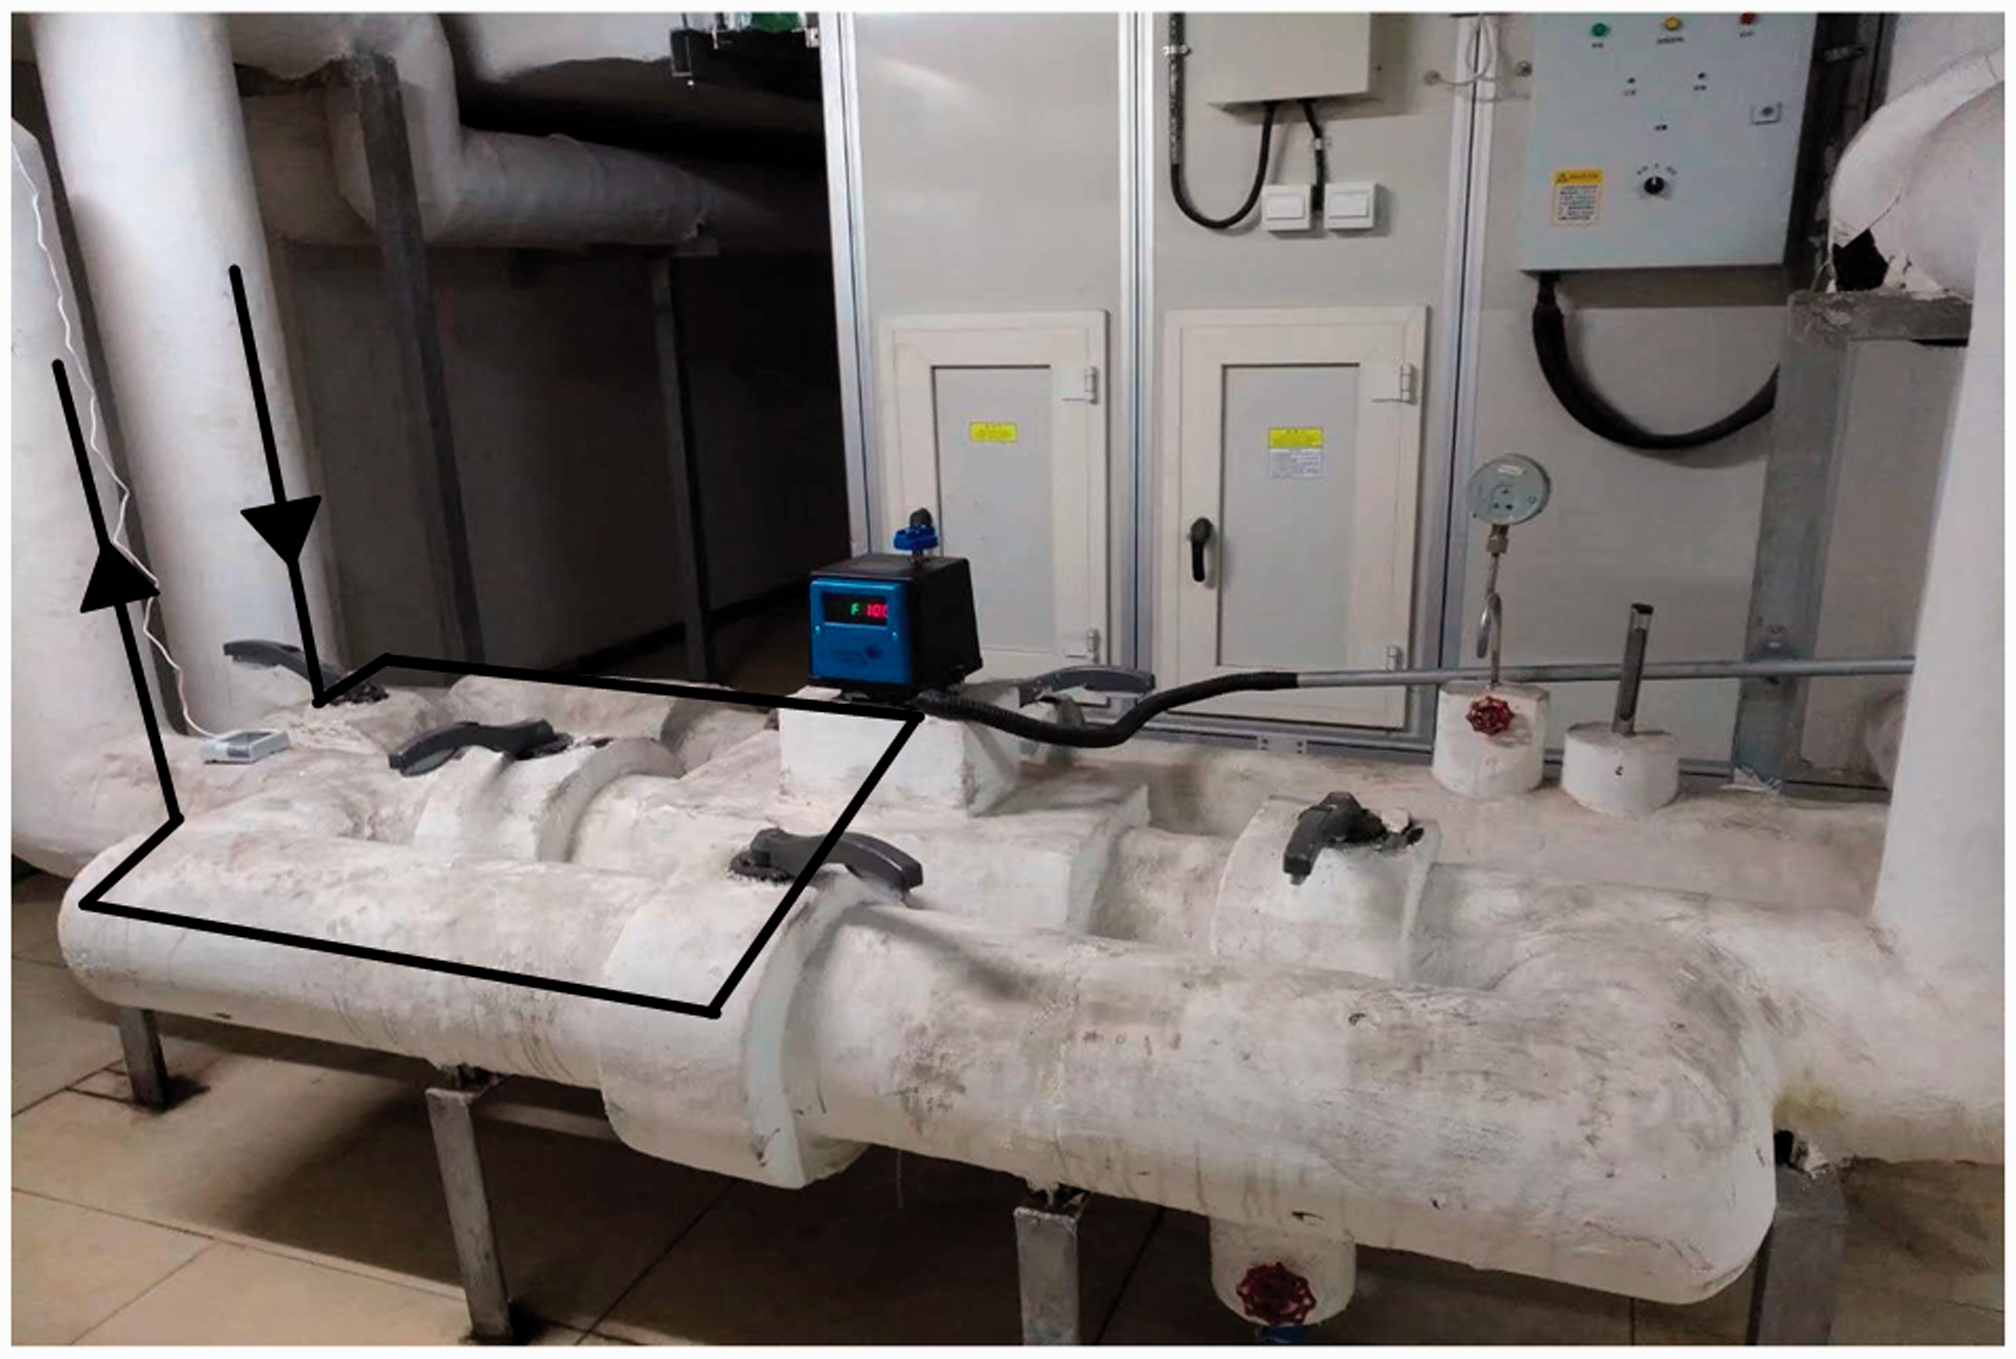
Bypass valve of the AHUs.
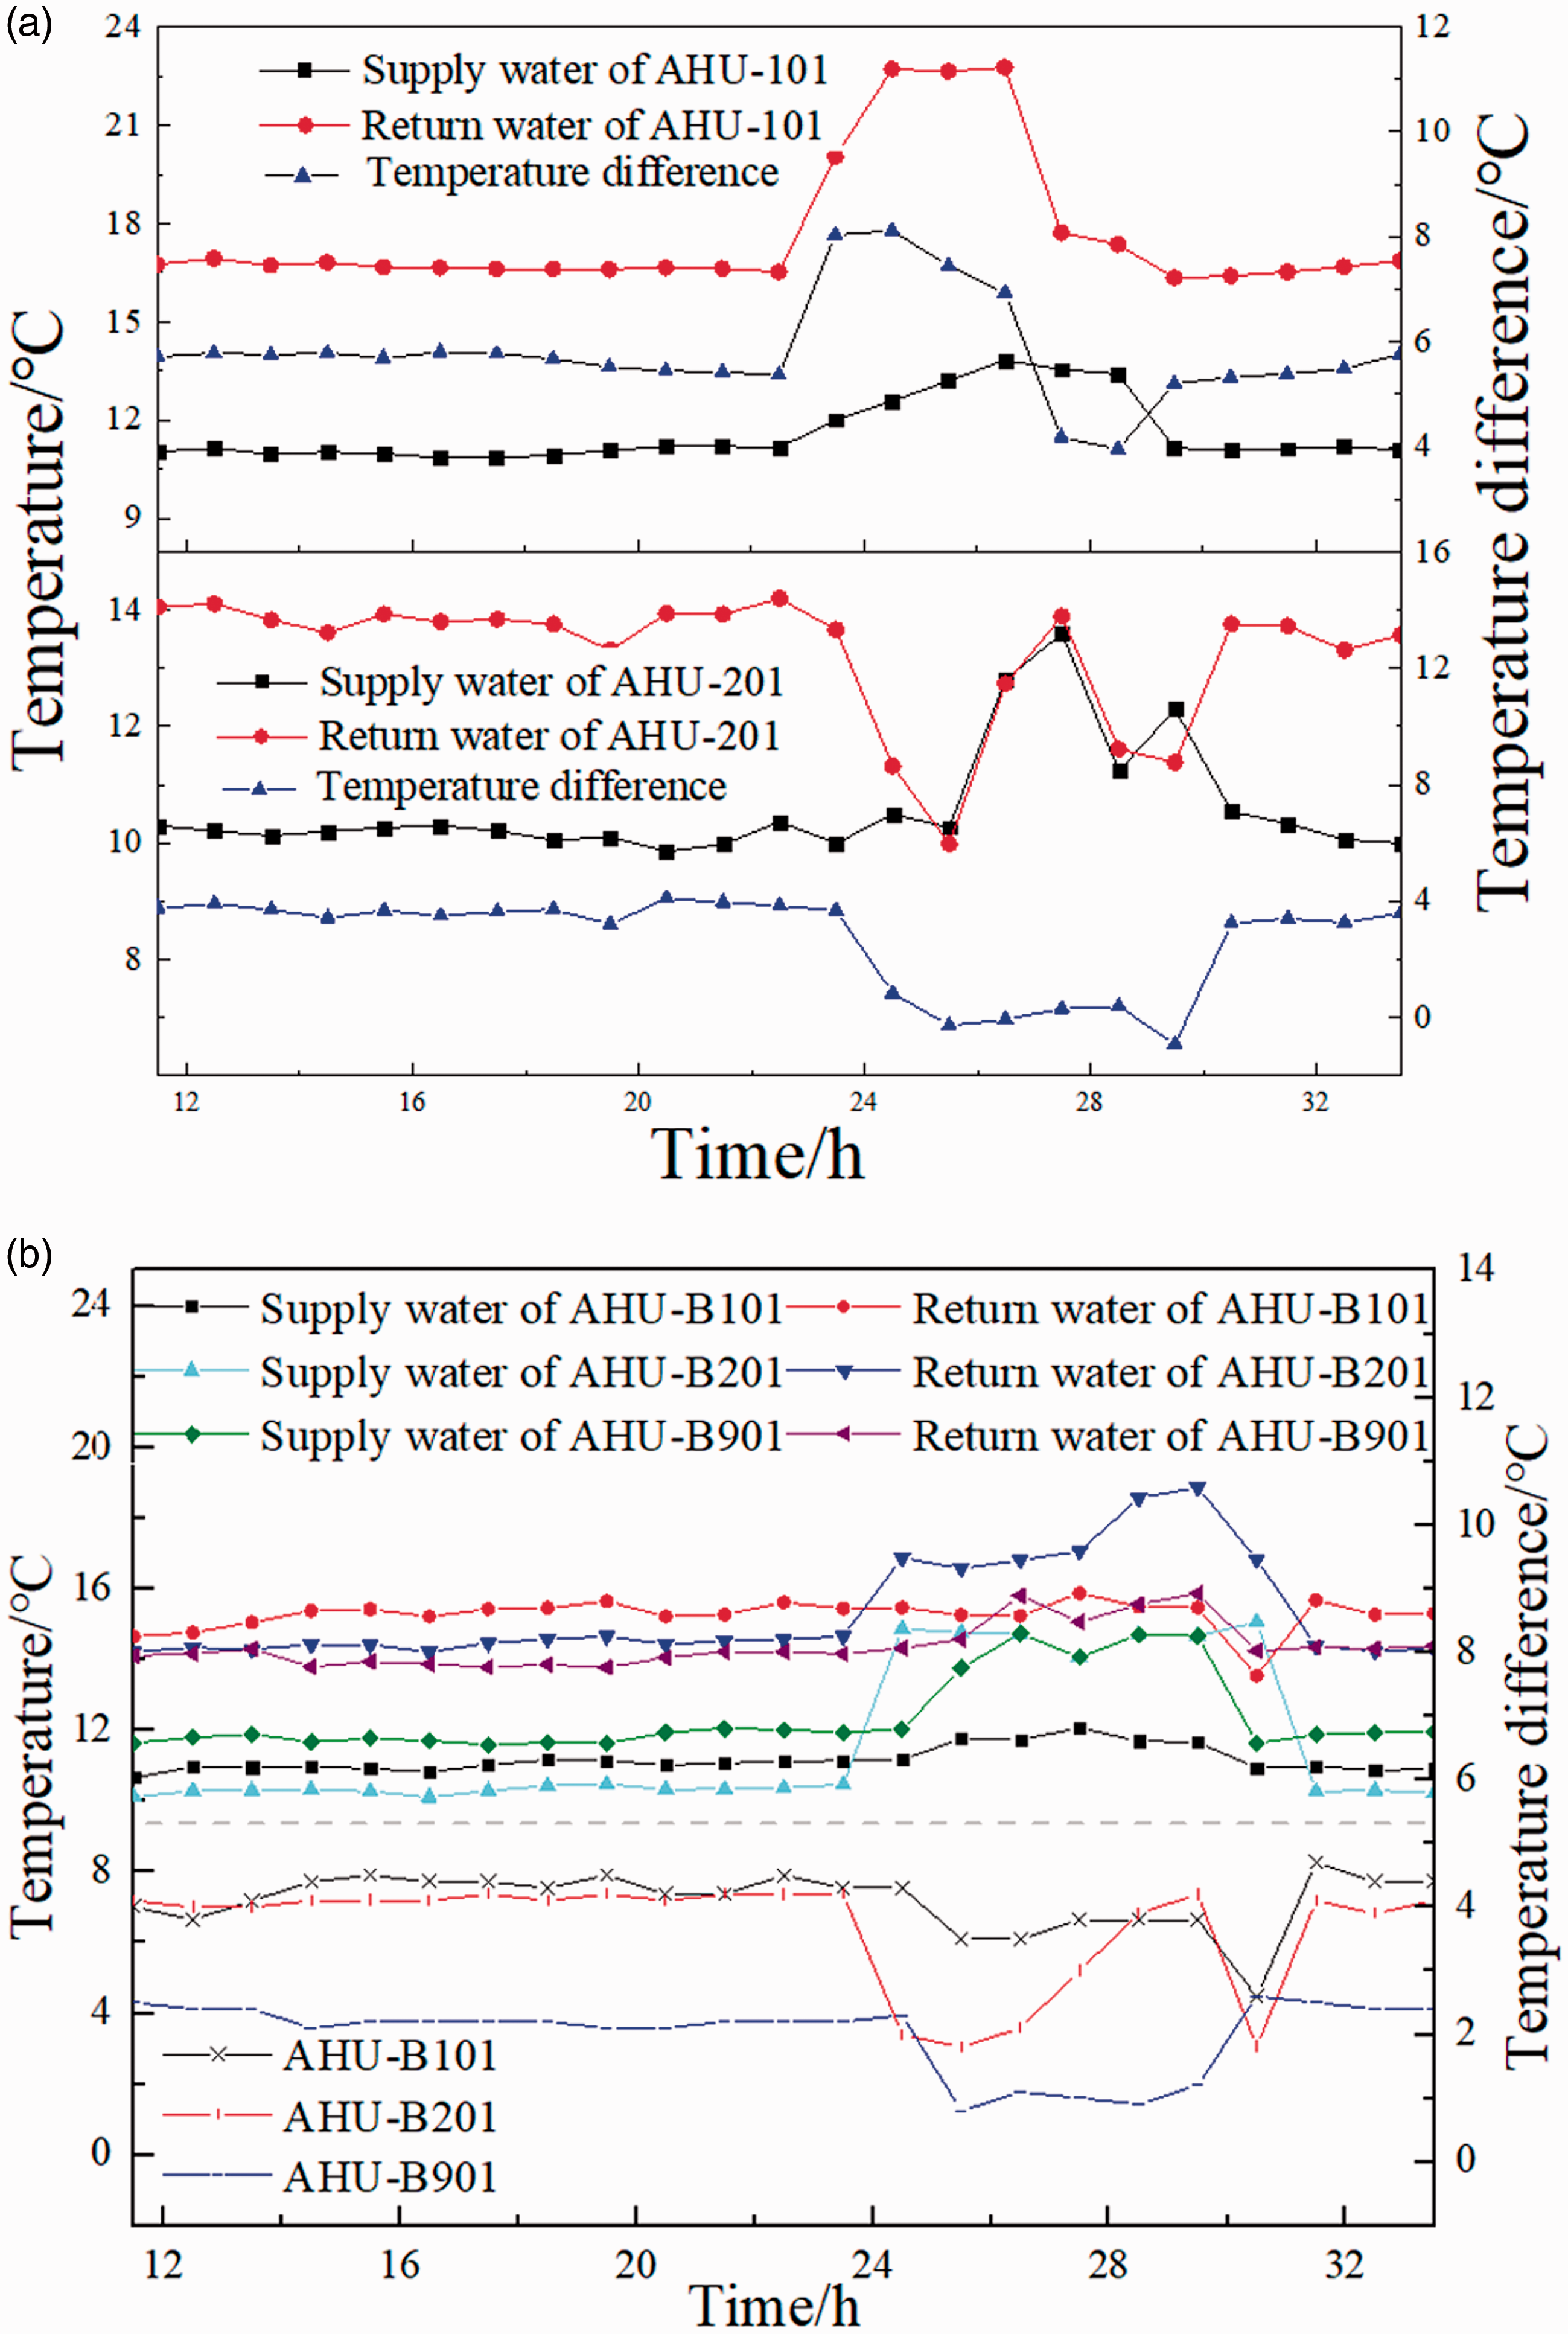
Measured water temperature of AHUs: (a) measured water temperature of AHU-101/201 and (b) measured water temperature of AHU-B101/201/901.
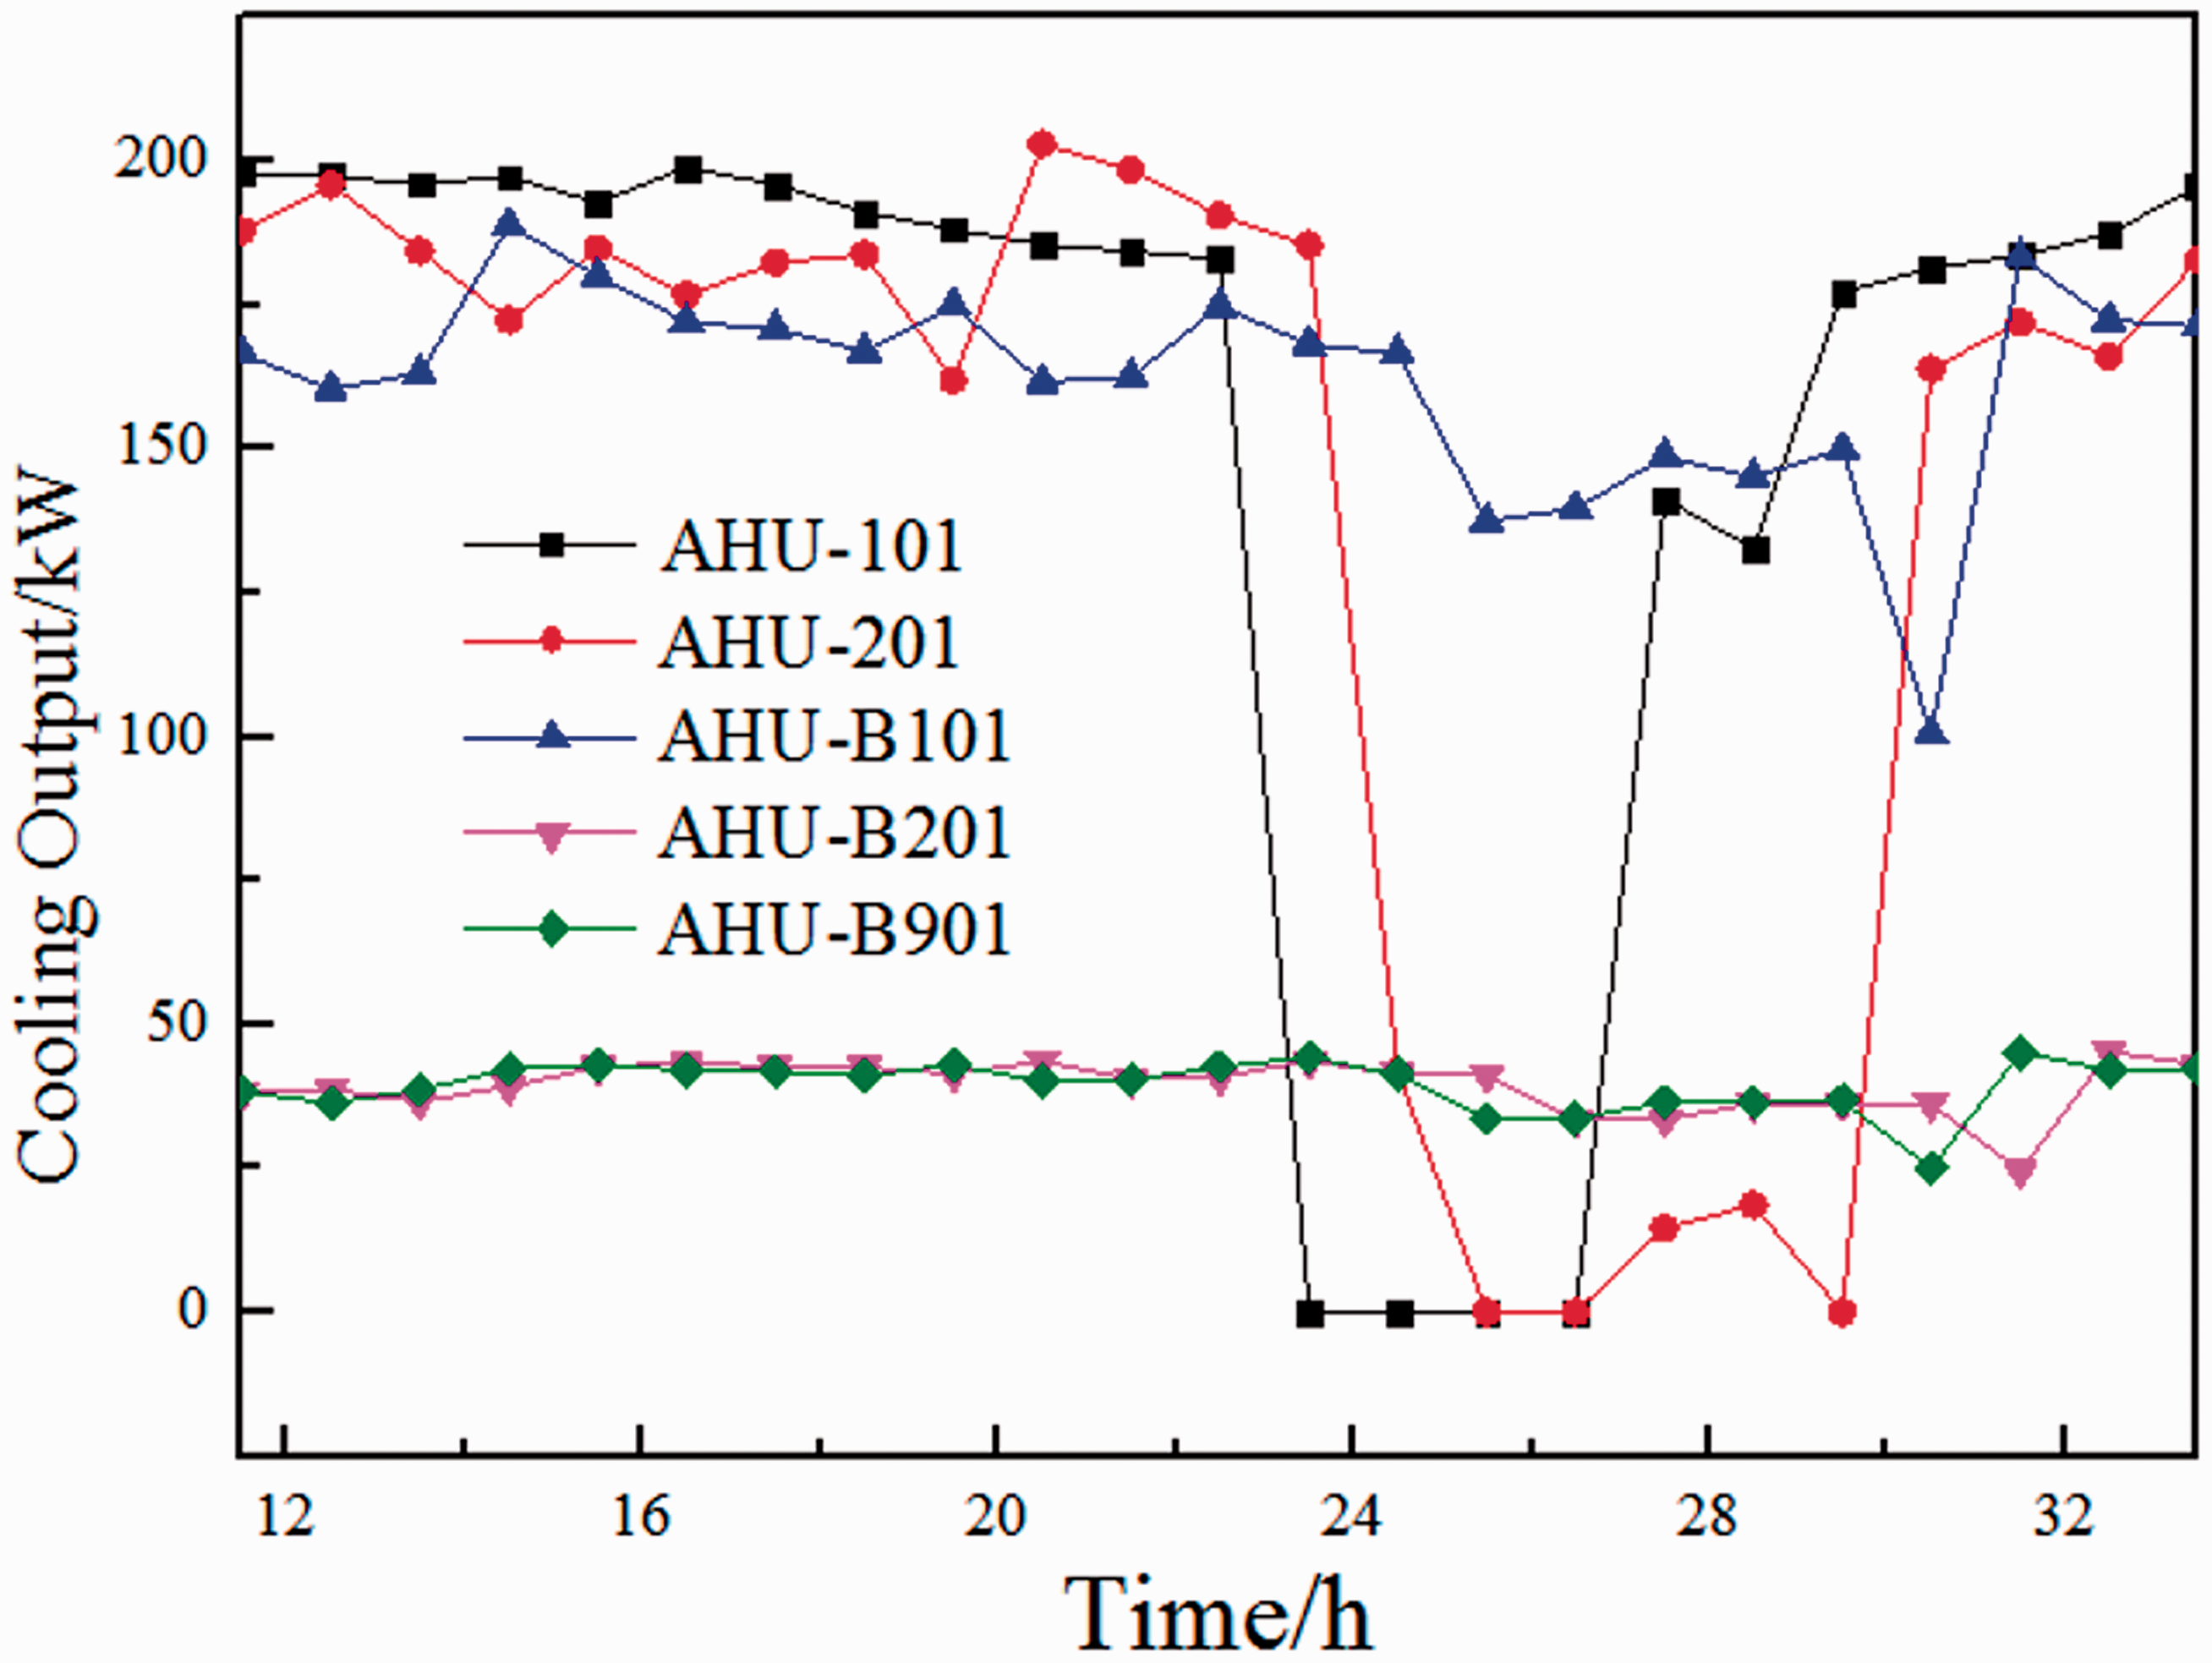
Measured water temperature of AHUs: (a) measured water temperature of AHU-101/201 and (b) measured water temperature of AHU-B101/201/901.
Cooling load analysis for the equipment rooms
According to the equipment characteristics and design requirements, the equipment rooms are divided into two types: high-power equipment rooms and low-power equipment rooms. Both of them need the VAC system operating 24 h every day. The cooling load of the equipment rooms is mainly the sensible load and is mainly taken from equipment heating. The small amount of latent load is taken from the fresh air and infiltration. The whole cooling load of equipment rooms could not be directly tested. It is obtained according to the cooling outputs of AHUs. The supply and return air temperatures are measured, so the supply and return air enthalpy can be calculated by equations (3) and (4). The total cooling load and sensible cooling load are calculated by equations (5) and (6), respectively. The testing results are as follows: during the test period, the cooling load accounts for 10–50% of the design value, generally varies around 25%. The design cooling load is obtained from the designer, who calculated it using the Hongye software. It is mainly taken from equipment heat dissipation. When calculating the design cooling load, the value is amplified with safety factor. It will cause the design value to be overlarge. The sensible load accounts for 50–95% of the cooling load, generally fluctuates around 75%, as shown in Figure 11.
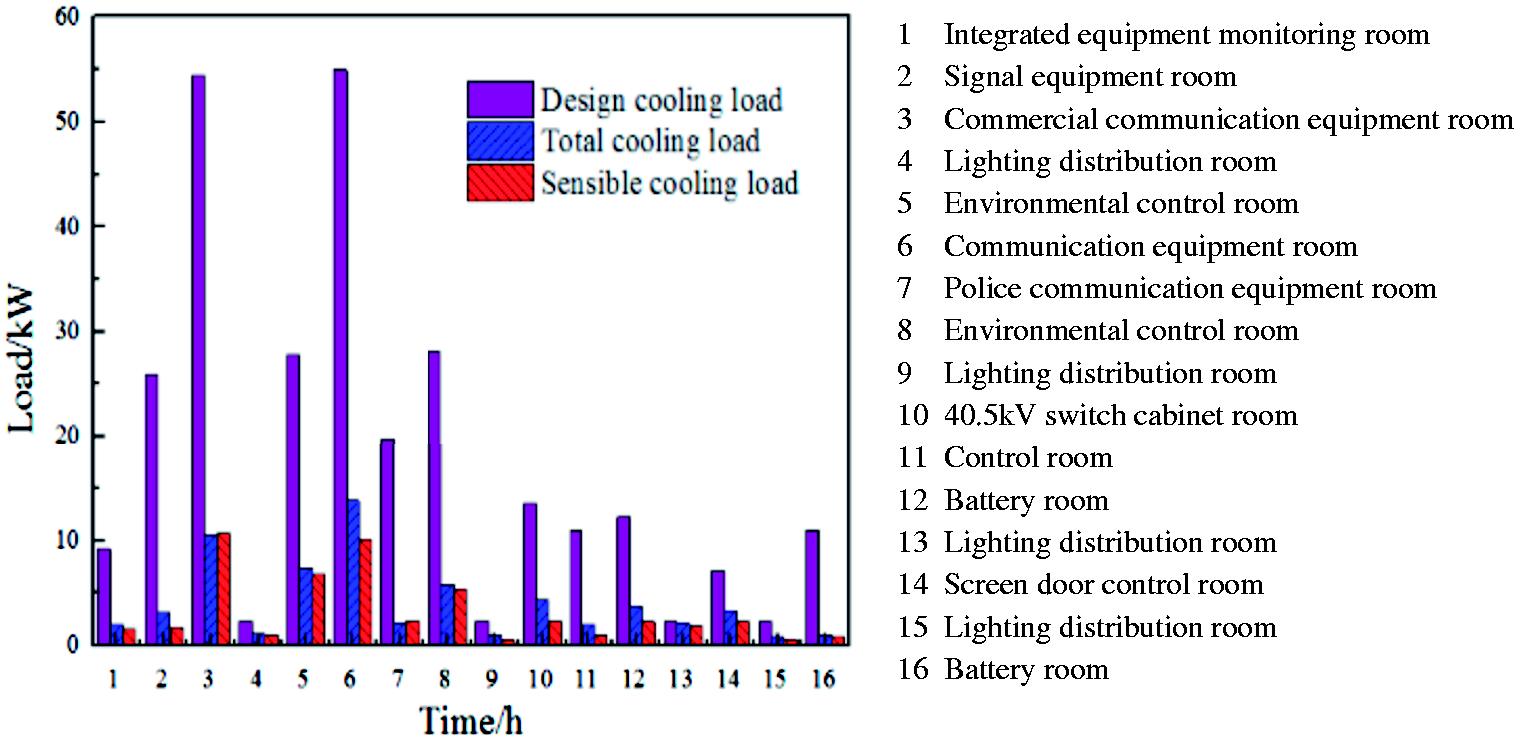
Design cooling load, total cooling load, and sensible heat.
In order to analyze the cooling load under three operation modes, the environmental control room with an area of 77.9 m2 is taken as an example. The design cooling load is 27.8 kW, but its real cooling load and sensible load are 7.33 and 6.77 kW, respectively. The cooling load, of which 92.4% is sensible load, accounts for 26.3% of the design value. The temperature and load fluctuations are shown in Figures 12 and 13, respectively. First, part ① presents the minimum fresh air mode, and the average cooling load is 8.52 kW. Second, part ② presents the all fresh air mode between 23:00 and 5:30 at night. The average cooling load is 6.15 kW, and the supply air temperature increases about 1.5°C. Third, part ③ presents the ventilation mode. When the public area is out of service at 11:30, the chiller shuts down to save energy. At this moment, the temperature monitored increases, but still meets the design requirement. The ventilation mode is adapted during the whole night, but the shutdown of the chiller leads to the sudden increase of the air enthalpy. During this period, the supply air enthalpy (h2) increases, but the return air enthalpy (h1) does not change simultaneously. It appeared as a sudden increase of h1 and h2, and h2 is greater than h1. The reason is that the enthalpy is influenced by the outdoor parameters. During this moment, the cooling load goes to a minimum or even a negative value. After five and a half hours of ventilation, the supply air enthalpy (h2) became stable, and the return air enthalpy (h1) was under steady state due to the heat dissipation from equipment, as shown in Figure 13, circle a. At 4:30 am shown in Figure 14, circle b, the supply air enthalpy (h2) increased with the increase of the outdoor temperature. Until 5:30 am, the chiller restarted. The supply air enthalpy (h2) suddenly decreased, but the return air enthalpy (h1) could not respond timely. Depending on equation (5), the cooling load of the environmental control room reached the maximum value. As the indoor state gradually stabilized, the peak value quickly dropped to the normal level.
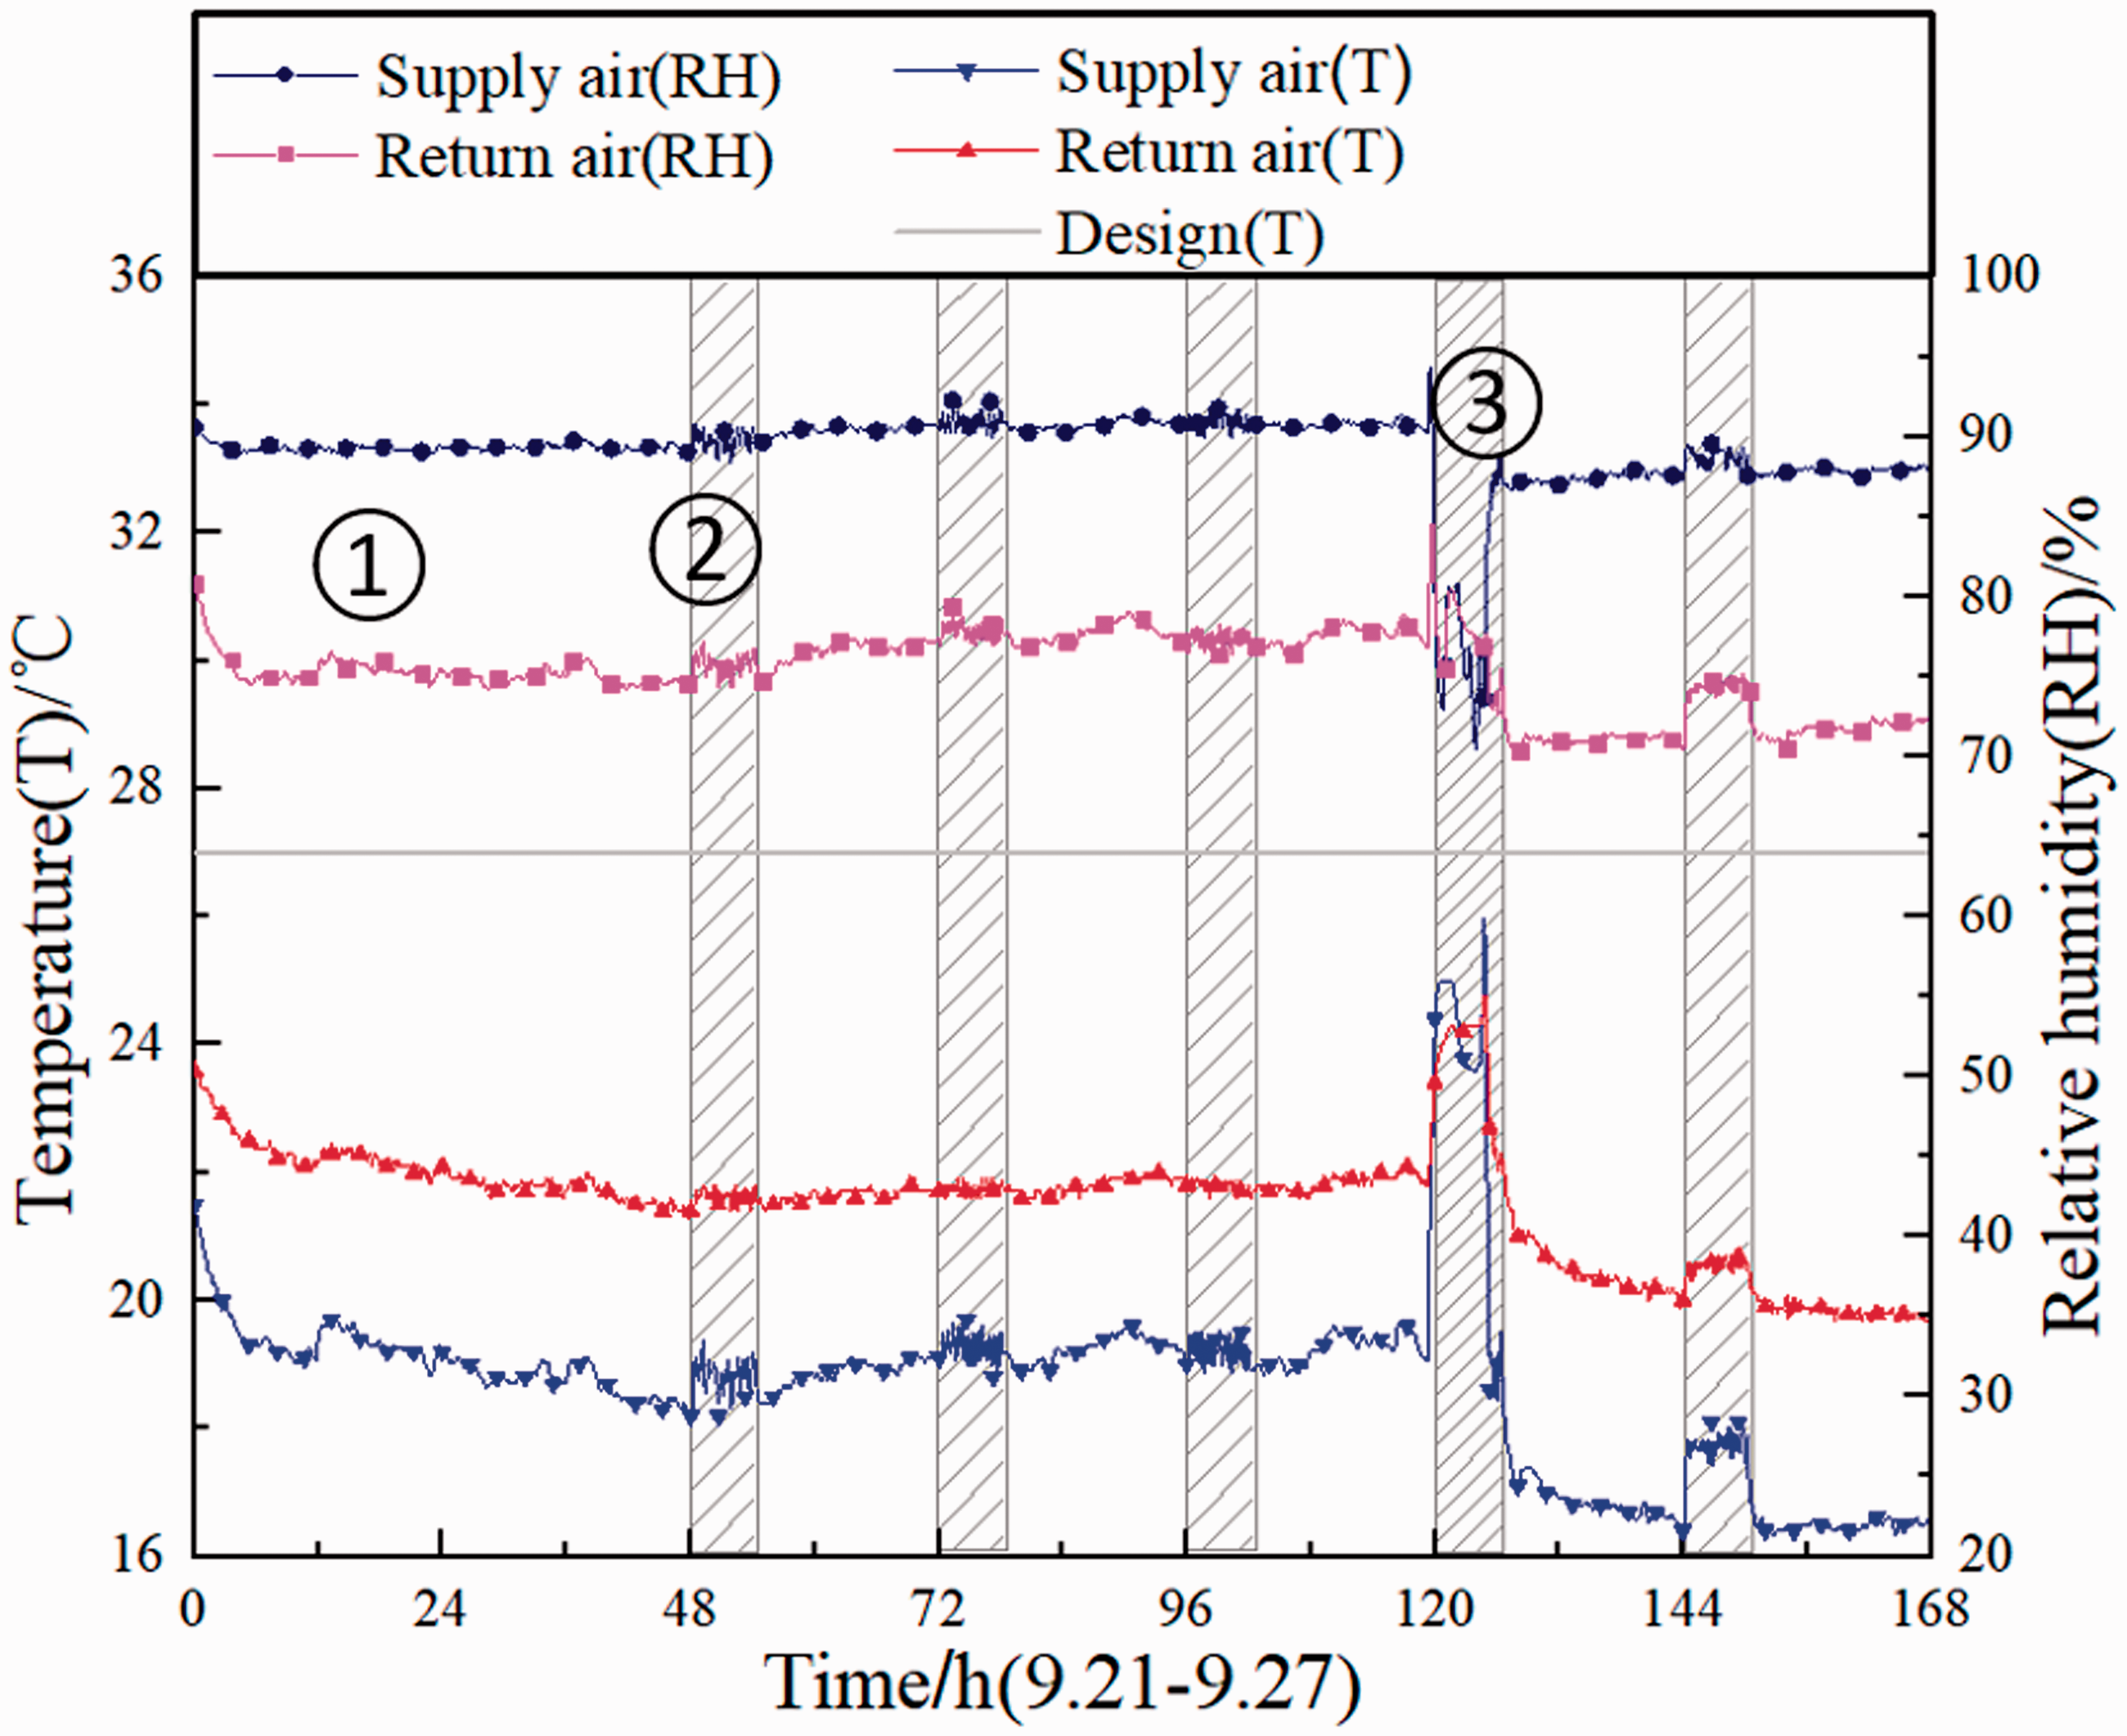
Dynamic temperature of the environmental control room.
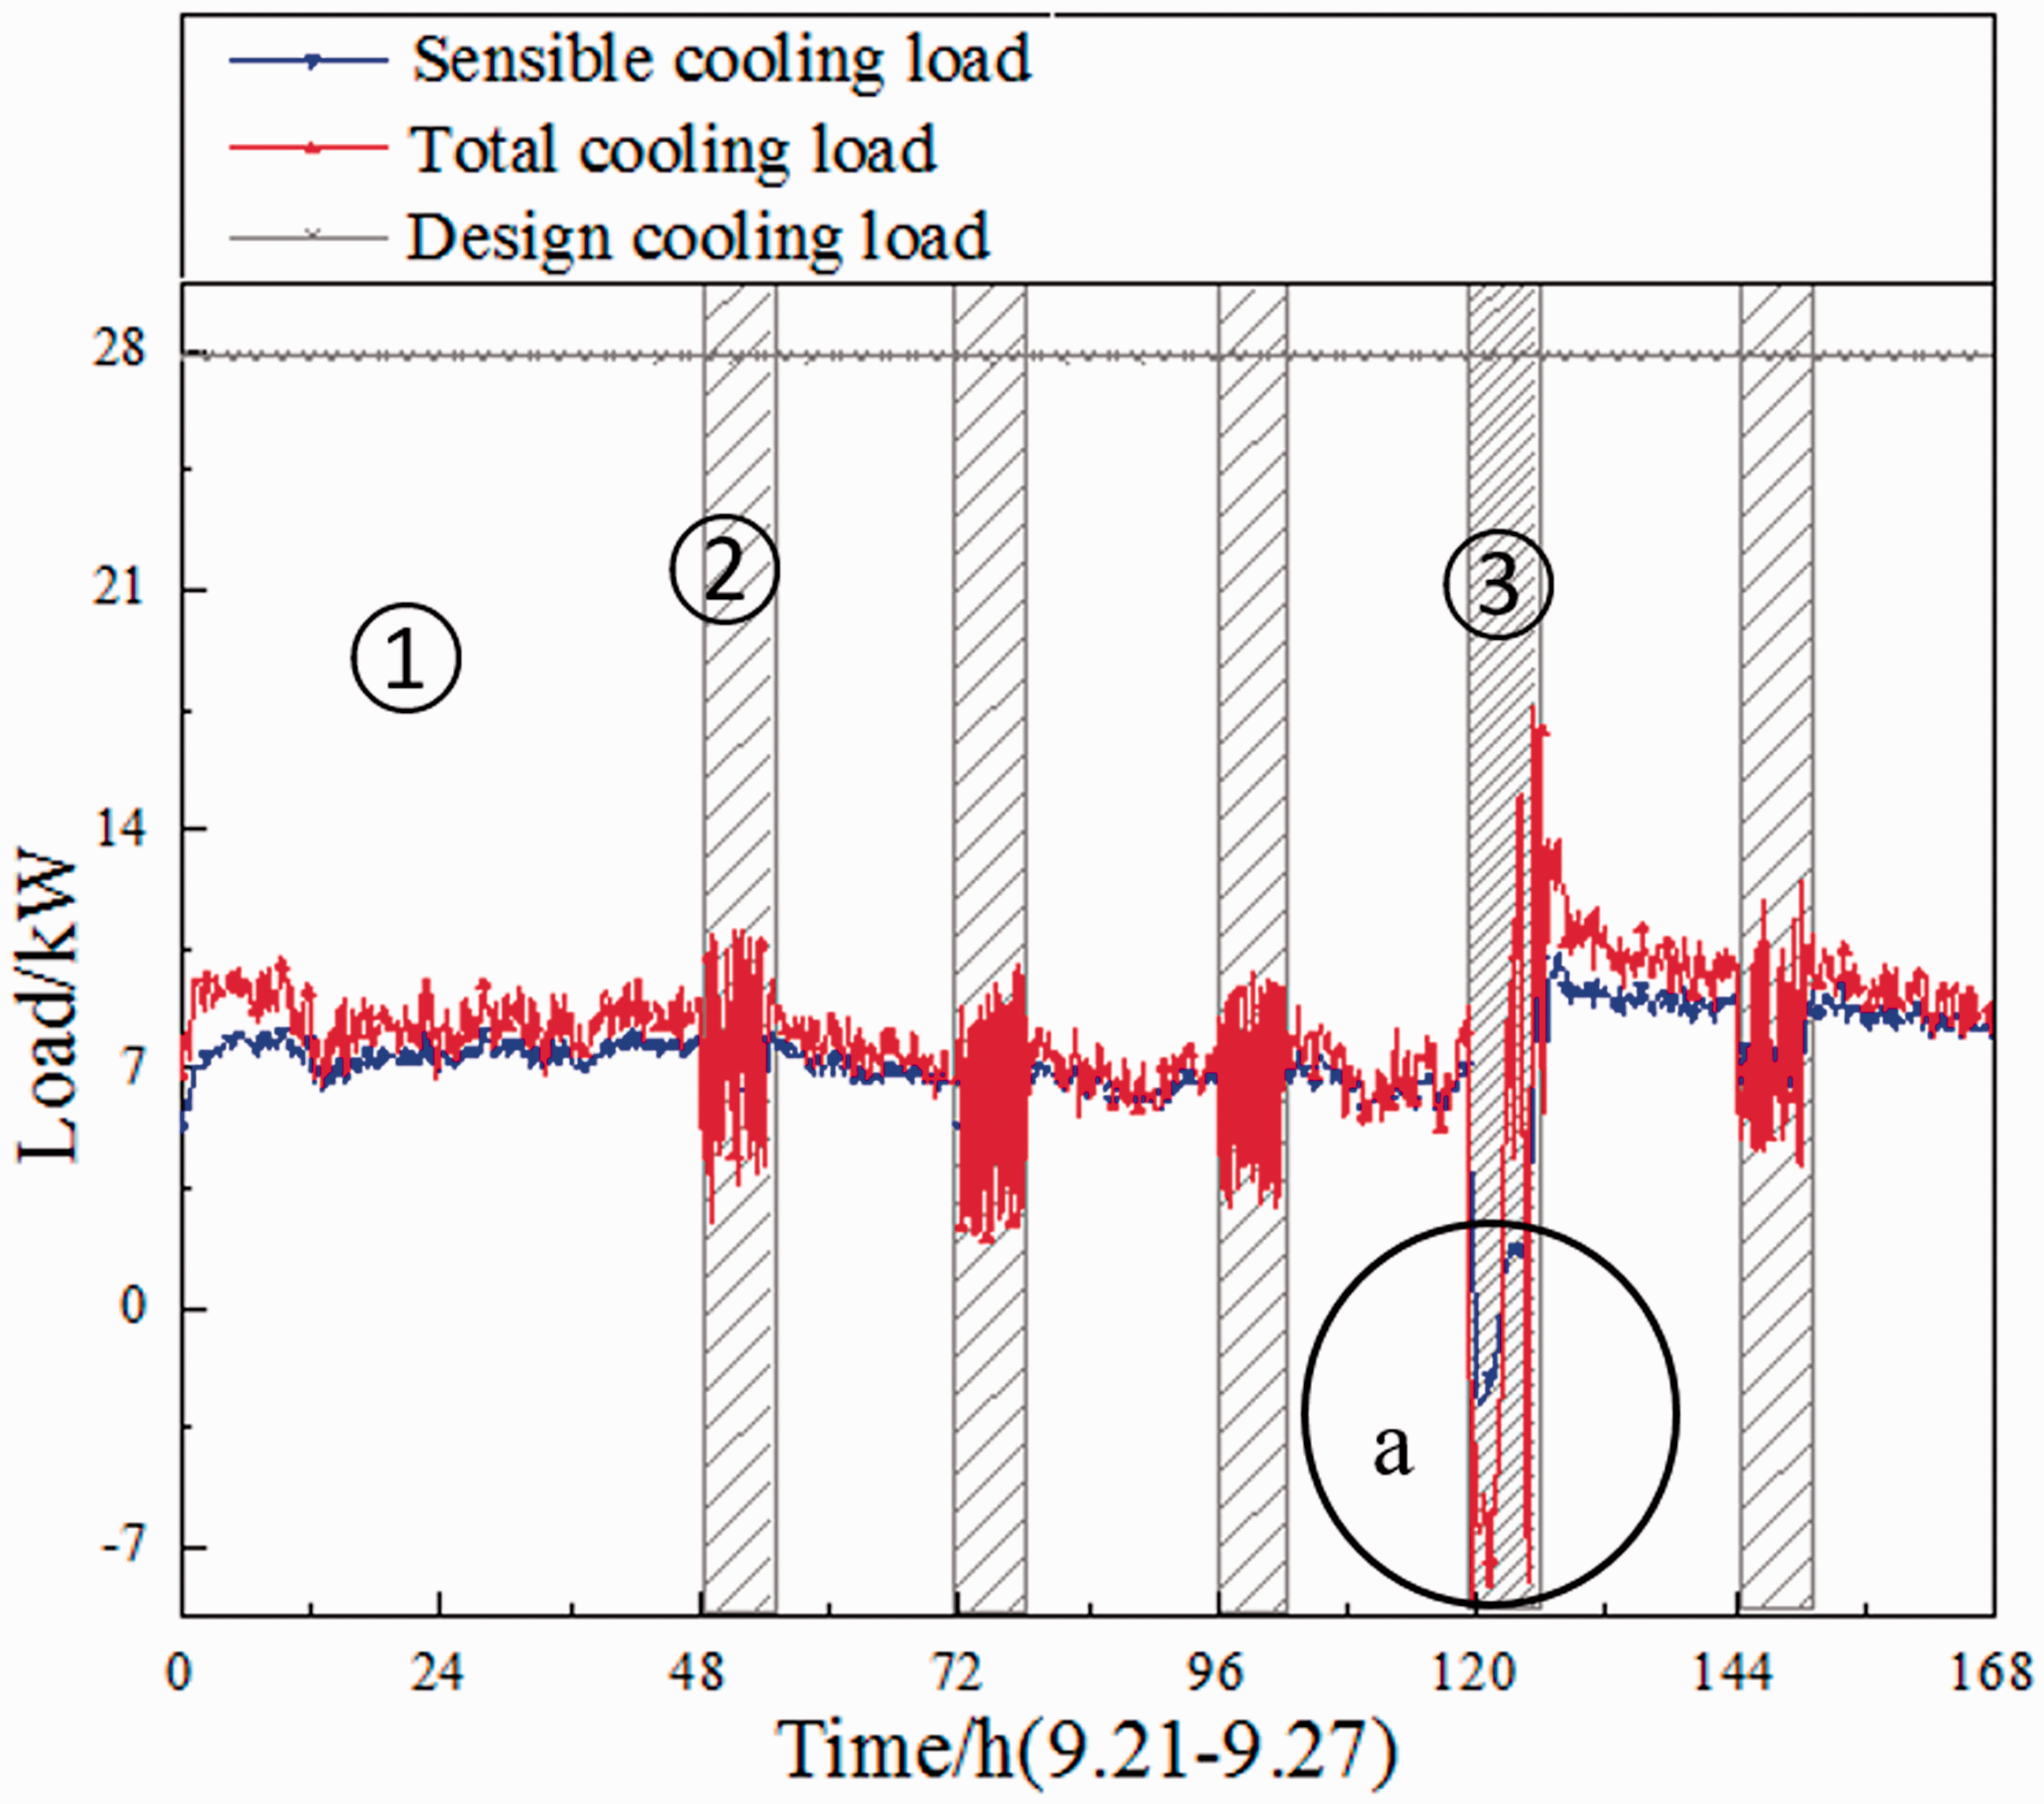
Dynamic cooling load of the environmental control room.
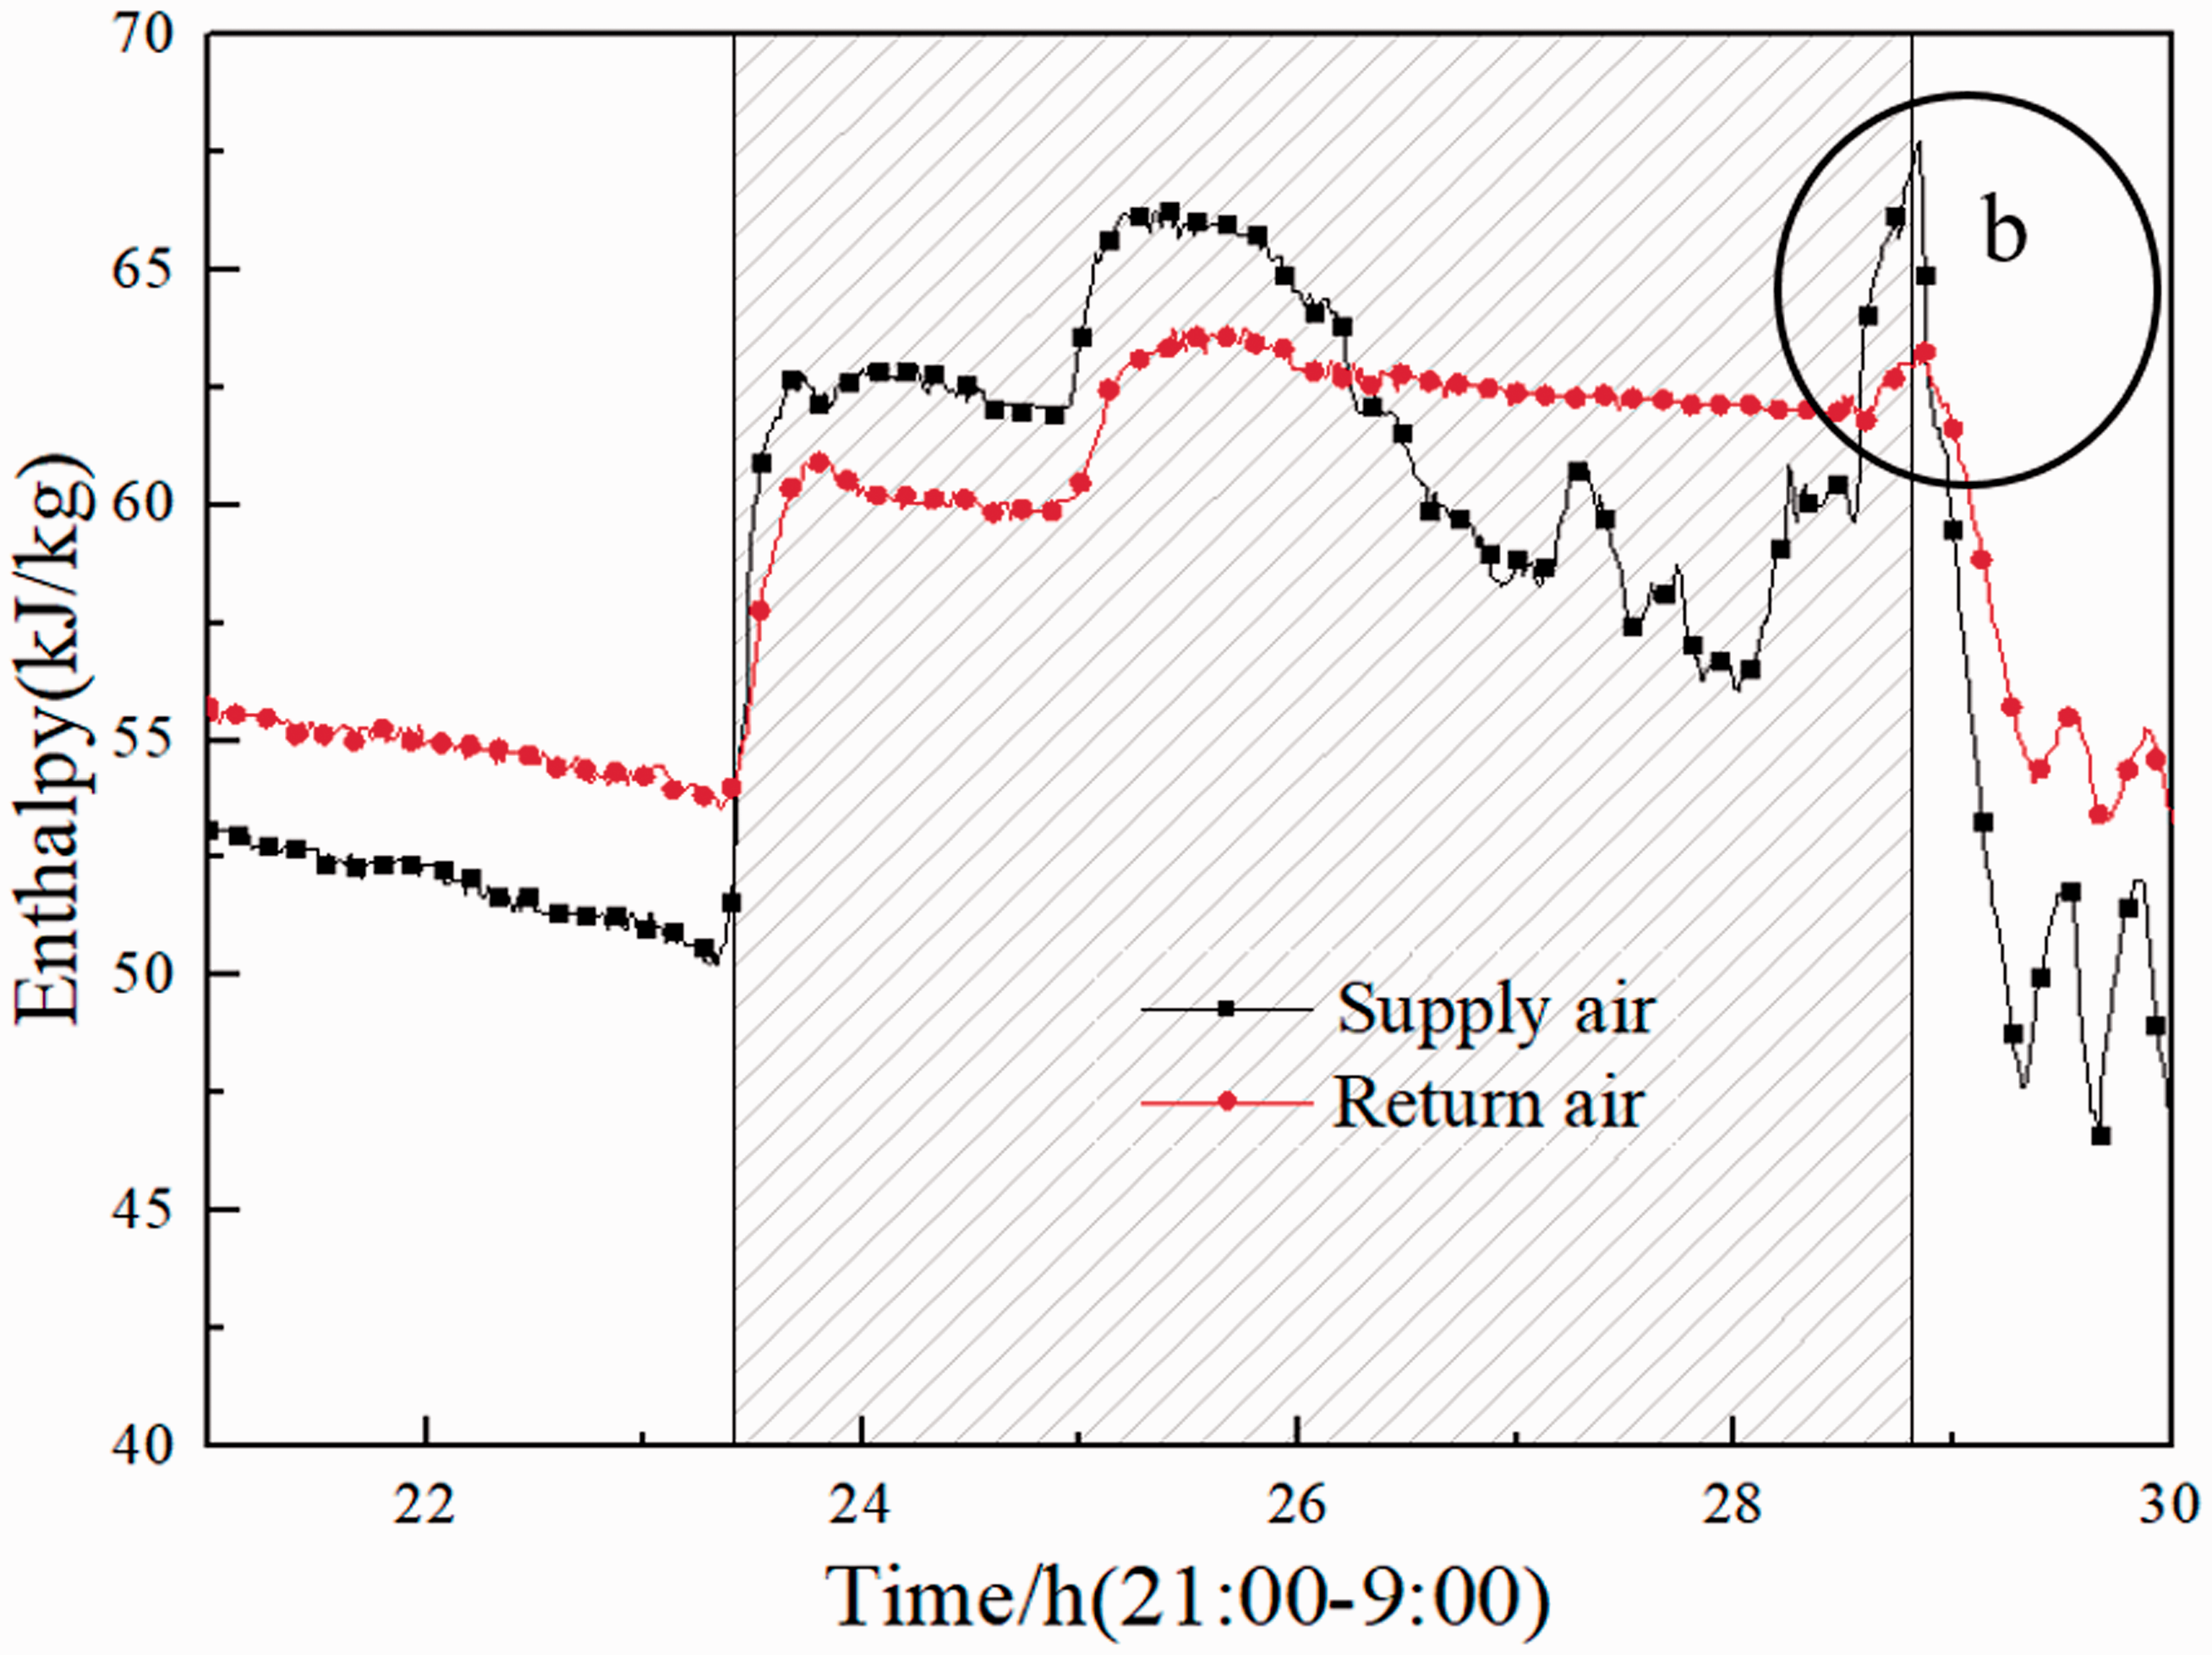
Supply air enthalpy and return air enthalpy.
Furthermore, the average relative humidity of the equipment rooms is about 73%, which is higher than the design value of 45–60%. The reason is that the supply water temperature is about 10.26°C as shown in Figure 8, and it is unable to handle the latent load completely. It is noted that high relative humidity may have a side effect for the service life of the equipment.
Energy saving scheme analysis
The frequency of fan and pump of VAC system was constant. All return air was processed through AHUs and distributed to different equipment rooms. Thus, the cooling output of central AHUs could not match well with the actual cooling load due to its dynamic feature. It was suggested that variable frequency control method should be applied in the VAC system to save energy (Pan et al., 2017; Wang et al., 2017). Furthermore, the plane layout characteristic of subway station is long and narrow. The cooling devices such as chiller and cooling water pump are arranged on the A side where the small system locates. Thus, the power demands for the fluid transportation and distribution are much higher due to the long distance. It was suggested that the traditional central VAC system could be substituted by distributed VAC system, such as heat pipe system because of its high heat transfer efficiency by phase change and water temperature at condenser side (Ling et al., 2017; Yue et al., 2019). The heat pipe system was suitable for the high sensible heat dissipation application (Ding et al., 2016; Zhang et al., 2019b; Zou et al., 2019). The high water temperature at condenser side could prolong the natural cooling source utilization period and also improve chiller’s operation performance. The distributed innovative system can easily provide the required dynamic airflow rate adjusted by the fan’s frequency and reduce the supply and return air’s transportation distances. Thus, the heat pipe system could be applied in subway stations to optimize the current VAC system. The related research will be carried out in near future.
Conclusions
The VAC system operated under three operation modes, including the minimum fresh air mode, all fresh air mode, and ventilation mode. In order to understand the power demand under different operation modes and real operating characteristics of a typical subway station, field test and detail analysis are conducted. The main conclusions are as follows:
The cooling output and power demand under different operation modes were analyzed. Under the minimum fresh air mode, there are no obvious fluctuations of the cooling output and power demand. Specifically, the cooling output and power demand during the daytime (5:30–23:30) are 548.41 and 125.73 kW, respectively. At night (23:30–5:30), the corresponding values are 516.28 and 122.77 kW. The all fresh air mode only occurs at night and the values are reduced to 341.51 and 71.63 kW. The cooling output and power demand are influenced by different operation modes, which is the main influential factor for energy consumption during the air conditioning season. The average cooling output of AHUs that served public area is 352.95 kW during the daytime and 0 kW at night. The average cooling output for equipment rooms is 253.86 kW during the daytime and 205.9 kW at night, and it was affected by the use of subway train. The supply water temperature is above 10°C, which causes the relative humidity of the equipment rooms exceeding the design value. It may have a side effect for the service life of the equipment. During the test period, the cooling load is mostly sensible load, which accounts for about 75%. Furthermore, the real cooling load only accounts for 30% of the design value. The design cooling load is overlarge due to the consideration of safety factor and further expansion.
Footnotes
Acknowledgements
The authors are grateful for the assistance of Xiaolin Lin and Yanping Luo. The authors would like to thank the editors and anonymous reviews for their constructive suggestions and comments.
Declaration of conflicting interests
The author(s) declared no potential conflicts of interest with respect to the research, authorship, and/or publication of this article.
Funding
The author(s) disclosed receipt of the following financial support for the research, authorship, and/or publication of this article: This work was supported by International Science and Technology Cooperation Project of China (2017YFE0105800) and National Natural Science Foundation of China (NSFC) (Grant No. 51878254), project of cooling and heat recovery technology of multi-connected heat pipe in subway transportation systems.