
Abstract
Laser welding is an indispensable part of competitive manufacturing, but it has a critical issue with energy consumption. The existing literature is limited to the energy supplied to the laser-material interaction for the material welding, and the welding quality is not well considered for energy saving. To reduce the total energy consumption of laser welding without compromising the welding quality, this study investigates the effects of process parameters including the laser power, welding speed and focus position on the specific energy consumption (SEC), welding quality and related energy effectiveness (EE) of the laser welding of 6061 aluminium alloy. The results reveal that adjusting the laser power to improve the welding quality will inevitably lead to a significant increase in the SEC. Energy can be saved with a relatively stable welding quality by varying the welding speed, and the welding quality can be improved without appreciably increasing the energy consumption by setting the focus position to approximately −0.5 mm. The EE can be enhanced with a higher laser power within a moderate welding speed range at the negative focus position. A case demonstrated that with a reasonable process parameter configuration, an energy savings of 12.45% could be realised for laser welding, while the tensile strength was increased by 4.29%, and the weld bead integrity remained stable (a decrease of 0.11%).
Keywords
Introduction
Rapid economic development and an increasingly tense energy situation have imposed tremendous pressure on society and the environment. Statistical data from the International Energy Agency (IEA) show that manufacturing activity accounts for approximately one-third of the gross final energy consumption in Organisation for Economic Cooperation and Development (OECD) countries. 1 Therefore, energy conservation in manufacturing has become a critical issue and must be addressed to improve economic benefits and minimise environmental impacts.2,3
Laser processing has become an increasingly indispensable part of competitive manufacturing throughout the world. 4 In particular, laser welding has attracted considerable attention in the automotive, aerospace, nuclear, medicine and petrochemical industries.5,6 Compared with traditional welding, laser welding has the advantages of high energy density, high productivity, manufacturing flexibility and ease of automation.7,8 However, the energy consumption of laser welding has been identified to be quite high, 9 which has limited the further application and popularisation of laser welding. Therefore, it is necessary to study the energy consumption of laser welding to achieve energy savings for sustainable manufacturing.
As quality assurance is a prerequisite, energy consumption cannot stand alone in achieving improved sustainable. As recognised in the existing research on laser welding, the welding quality is a primary concern. Process parameters affect the temperature distribution, microstructure and defect formation of the welded zone, which consequently affect the welding quality.10–12 Accordingly, many studies have investigated the effects of process parameters on welding quality. Because the weld bead profile is closely related to the welding quality,13,14 the relationship between the weld bead profile and various process parameters has been studied. Balasubramanian et al. 15 investigated the effects of laser power, welding speed and beam incident angle on butt weld bead geometry, and the results showed that increasing the laser power and decreasing the welding speed increased the depth of penetration and bead width, whereas the beam incident angle is the minor parameter influencing the weld bead geometry. Jiang et al. 16 investigated the effects of the laser beam diameter, laser average power and laser pulse energy on the temperature domain and weld bead profile (welding depth and welding width). It was reported that the average power had a more significant effect than the beam diameter on the increase in the melt pool dimensions. Moreover, the penetration depth increased with an increase in the pulse energy. Elmesalamy et al. 17 suggested that the weld bead integrity was crucial to the welding quality. Zhang et al. 18 reported that the weld bead appearance and integrity could be improved by a high welding speed slightly below the critical welding speed for full-penetration welding at a specified laser power. It should be noted that weld beads with similar profile characteristics may have very different mechanical properties owing to the presence of defects such as spatters, pores, holes and cracks. Therefore, many researchers have combined the mechanical properties and weld bead profile to evaluate the welding quality. Sathiya et al. 19 established relationships between the process parameters (laser power, welding speed and focus position) and welding quality (depth of penetration, bead width and tensile strength) and found that a lower welding speed may cause a decrease in the weld bead strength but an increase in the depth of penetration. Chen et al. 20 revealed the influence of parameter interactions on the weld bead integrity and tensile strength in ultra-narrow gap laser welding and improved the comprehensive welding properties by increasing the welding speed and laser power. However, the energy consumption was not considered in these studies.
Laser welding is a thermal process, and it has low energy efficiency because the material welding mechanism relies on melting or vaporisation. 21 For energy conservation and improved efficiency of laser welding, some researchers have investigated the influence of process parameters on the energy efficiency. Liu et al. 22 investigated the effects of welding parameters on the utilisation rate of laser power in a hybrid welding process. Wei et al. modelled the energy utilisation rate of hot-wire laser welding based on the energy consumed to generate the laser and to preheat the wire. The results demonstrated that the energy utilisation rate was related to the endpoint temperature of the electrically aided heated wire and the butt gap. 9 These previous studies focussed on reducing energy consumption. However, reducing the energy consumption during laser welding is only meaningful if the welding quality can still meet the relevant requirements. Pastras et al. 4 constructed an energy efficiency model of the laser welding process, which was defined as the ratio of the area of the weld interface formed between the two welded pieces to the laser energy provided to the welding process. However, their research is limited to the energy supplied to the laser-material interaction for the material welding, and the characterisation of welding quality by weld interface area is not comprehensive.
During the laser welding process, energy is not only required for the laser–material interaction at the process level, but also for the creation of stable welding conditions and auxiliary functions. Understanding how the process parameters affect the total energy consumption and welding quality simultaneously is key for realising the energy effective laser welding. Motivated by these remarks, this paper attempts to fill the research gap and makes contributions in the following three aspects. First, the effects of process parameters including the laser power, welding speed and focus position on specific energy consumption (SEC) which is used to evaluate energy consumption, and welding quality characterised by the weld bead profile and tensile strength are studied. Second, the relationship between the SEC and the resultant welding quality is jointly analysed to understand how energy can be effectively consumed to produce the required welding quality. Third, the concept of energy effectiveness (EE) is introduced for laser welding, which can be expressed as the ratio of the required quality to the total energy consumption, and the relationship between the process parameters and EE is investigated to explore the potential to reduce energy consumption within the constraint of the welding quality requirements.
The remainder of this paper is organised as follows. In Section 2, the experimental details are presented. The results are presented and analysed in Section 3. In Section 4, the limitations and potential applications are discussed, followed by the conclusions and outlooks in Section 5.
Experimental study
Materials and experiment setup
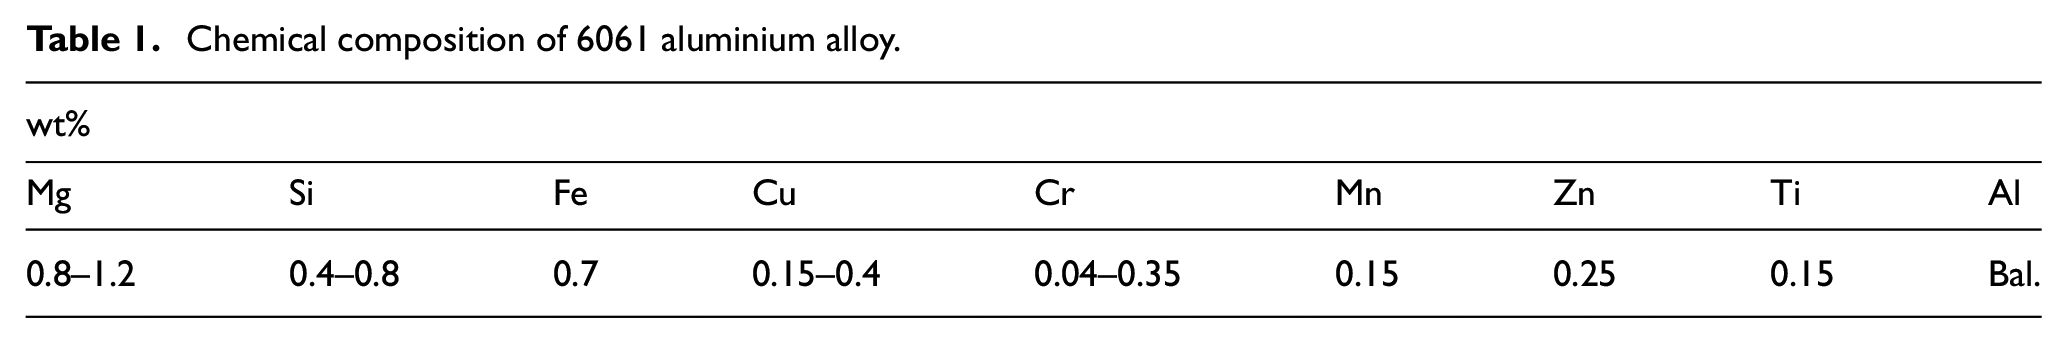
The 6061 aluminium alloy, characterised by a high specific strength and excellent weldability23,24 is selected for the experiments because of its high relevance to manufacturing industries; its chemical composition is listed in Table 1. The dimensions of the welding specimens are 120 mm × 80 mm × 2 mm. Before welding, the butt surfaces of the specimens are milled smooth. The specimen surfaces are pretreated using mechanical polishing and swabbed with acetone to avoid the interference of oil pollution and oxide films.
Chemical composition of 6061 aluminium alloy.
A schematic representation of the setup of the laser welding process is shown in Figure 1. Welding experiments were conducted using a specific laser welding system. This system employs a continuous-wave ytterbium fibre laser (IPG YLR-4000) with a wavelength of 1070 ± 10 nm. The fibre laser possesses a maximum achievable power of 4 kW and a beam parameter production of 4.5 mm mrad. The spot diameter is focussed to 0.3 mm with a lens having a focal length of 250 mm. The laser head (YW50) equipped with a coaxial air blowing protection device is attached to a six-axis welding robot (ABB IRB4400). The welding specimens were clamped to the bench with a 0 mm gap. Laser welding was performed with a head angle of 10°, which was determined based on the recommendation of experienced workers and previous experimental experience, 23 to prevent the reflected laser from damaging the protective lens. Pure argon was selected as the shield gas and supplied with a 45° nozzle angle at a flow rate of 25 L/min.
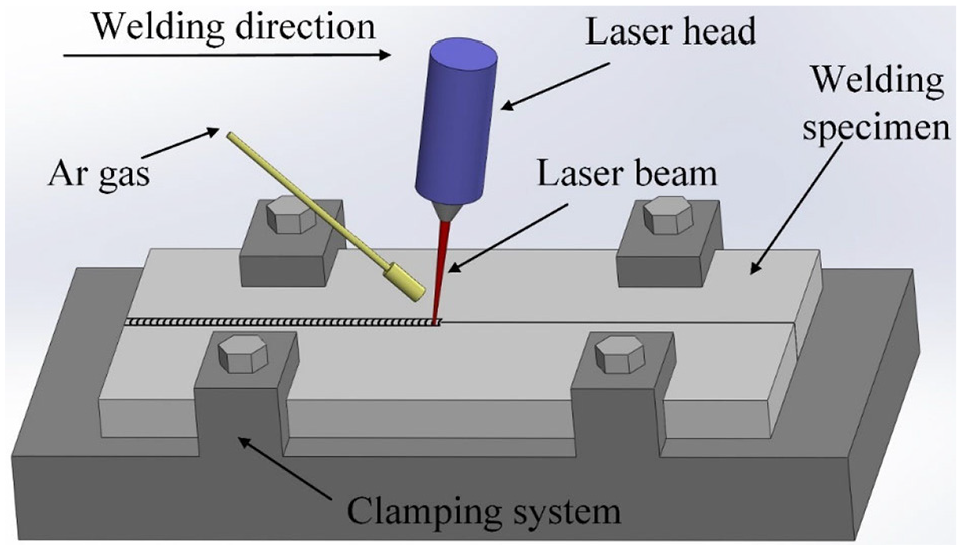
Schematic diagram of the laser welding process.
The energy consumption of the laser welding system and the quality of the weldments were measured. The energy consumption of laser welding is primarily composed of the energy consumed by the laser, welding robot and cooler. During the welding experiments, the energy consumption of each component was measured separately using an energy monitoring system composed of EDA9033A data integrated acquisition modules, current clamps and a laptop. The energy monitoring system enabled continuous recording of the current, voltage and power with a 0.05 s sample interval. The experimental setup for monitoring of the energy consumption is shown in Figure 2. To measure the current of each component, three current clamps were installed on the corresponding electrical supply wires, and the other side was connected to the power analyser. Meanwhile, the voltage monitoring was performed by bringing the power analyser into the circuitry. Thus, power data were obtained for each component of the laser welding system. The laser welding process included five states: off, start-up, standby, welding and shut-down. The energy consumption in the welding state is responsible for the weld bead formation and welding quality; therefore, it is considered in this study. The SEC is used to evaluate the energy consumption, and it is defined as follows:
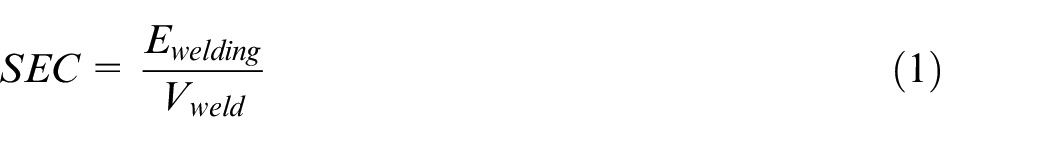
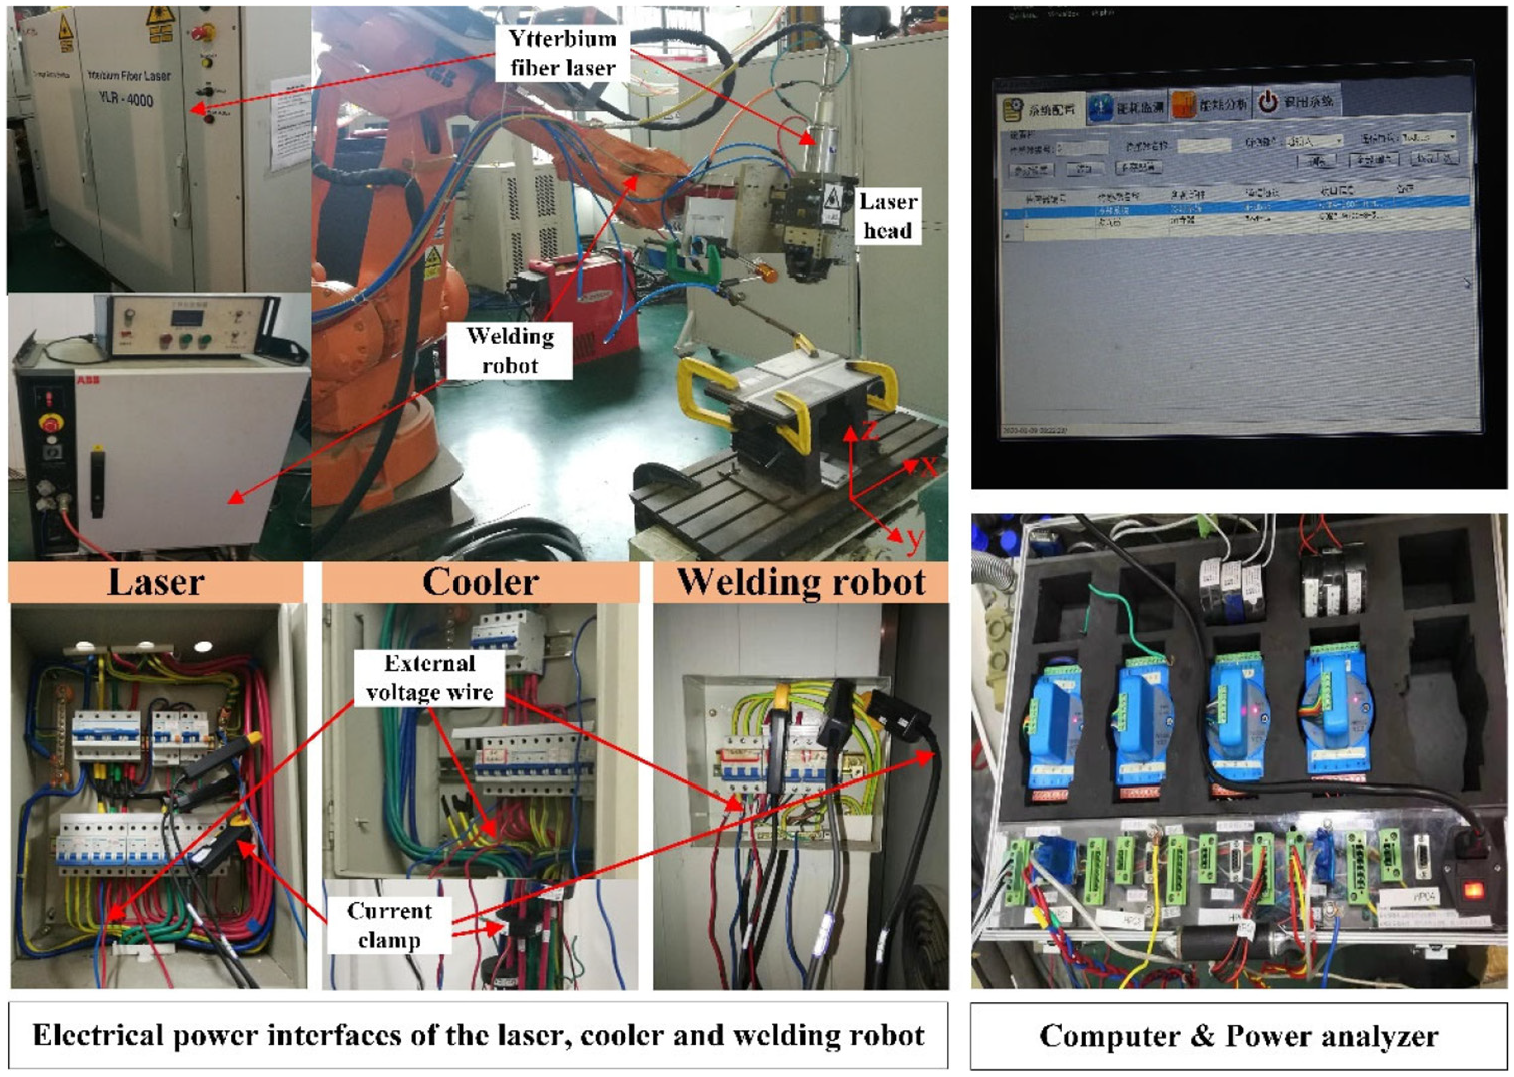
Experiment setup for monitoring energy consumption.
where Ewelding represents the total energy consumption in the welding state (J), and Vweld represents the volume of the weld bead (mm3). Because the positioning unit, CNC controller, and other auxiliary units require little energy, the welding energy consumption, Ewelding, is approximated as:
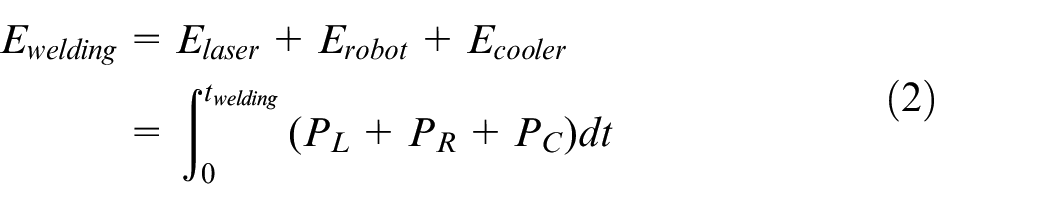
where Elaser, Erobot and Ecooler represent the energy consumption of the laser, welding robot and cooler during the welding phase (J), respectively; PL, PR and PC represent the power of the laser, welding robot and cooler (W), respectively. In addition, twelding represents the welding time (s), which can be written as follows:
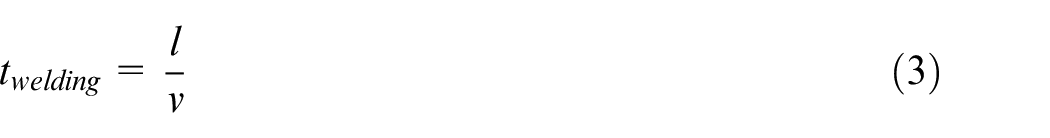
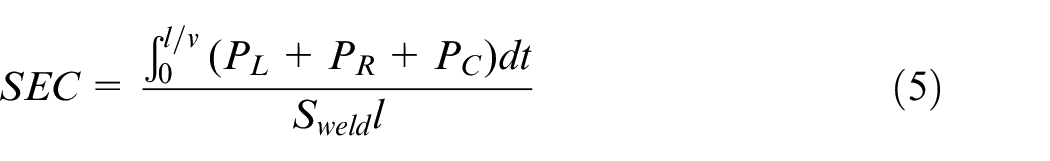
where l represents the welding length (mm), and v represents the welding speed (mm/s). Vweld is calculated as:

where Sweld represents the cross-sectional area of the weld bead (mm2). Substituting equations (2)–(4) into equation (1), the SEC (J/mm3) is calculated as follows:
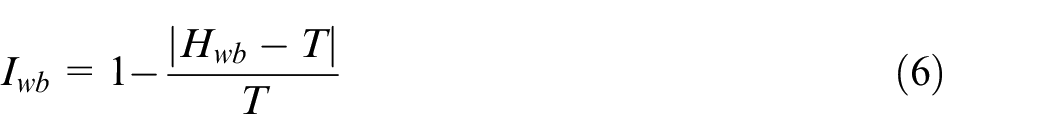
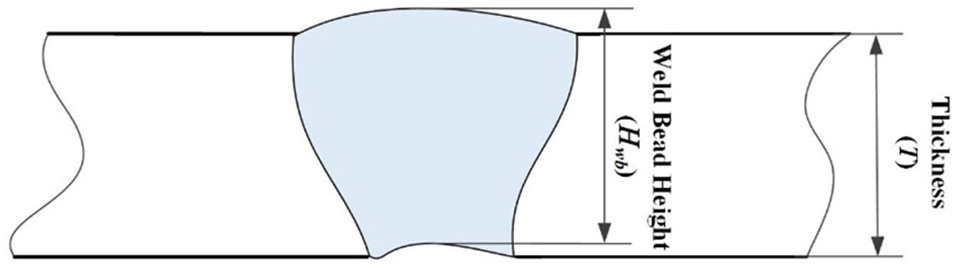
The weld bead integrity and tensile strength were selected as the welding quality requirements in this study. Imperfections in the weld bead are strongly related to the height of the weld bead, and the weld bead integrity was calculated using equation (6). 25 A schematic diagram of the weld bead is shown in Figure 3. After welding, the transverse samples with dimensions of 20 mm × 20 mm × 2 mm were cut from the weldments by wire electric discharge machining (EDM). The metallographic samples were polished with waterproof abrasive paper (400–4000 mesh) and a polishing agent until the scratches on the surface were uniform, and then the samples were corroded with Keller etchant. The macrostructures of the weld bead profiles were observed using a KEYENCE VHX-1000C digital microscope, as shown in Figure 4. Image analysis software was employed to measure the heights and cross-sectional areas of the weld beads.
Schematic diagram of weld bead.
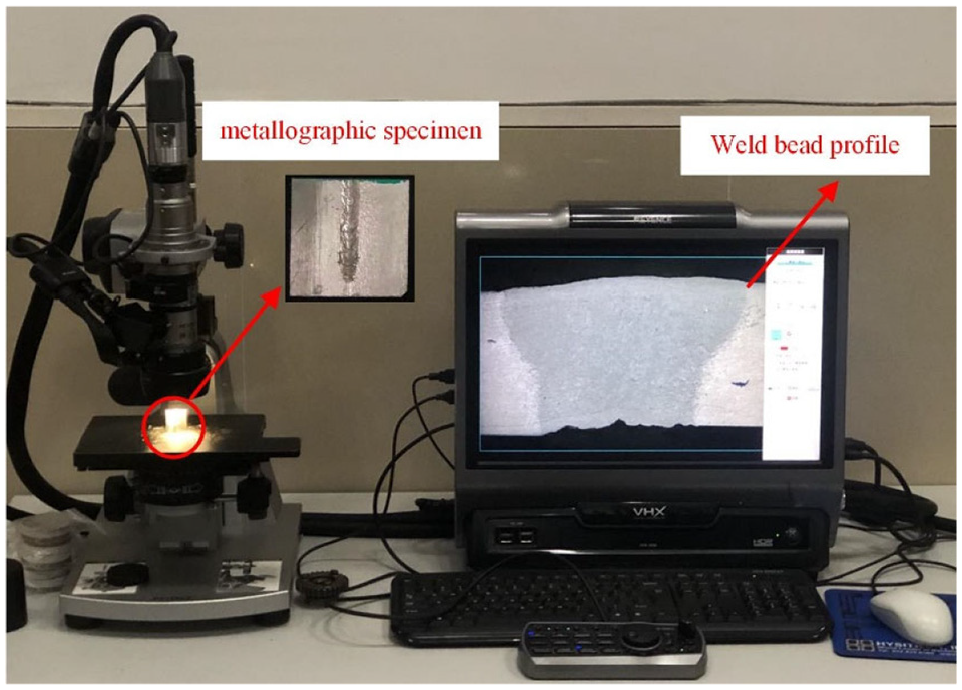
Observation of weld bead profile with VHX-1000C digital microscope.
where Iwb represents the weld bead integrity, Hwb is the weld bead height (mm) and T is the thickness of the specimens (mm).
The tensile strength was measured using an electronic universal tester (CMT5105) according to the GB/T 228.1-2010 standard, which is equivalent to the ISO 6892-1:2009 standard. The dimensions of the tensile samples are shown in Figure 5. Tensile tests were conducted at a fixed strain rate of 2 mm/min at room temperature.
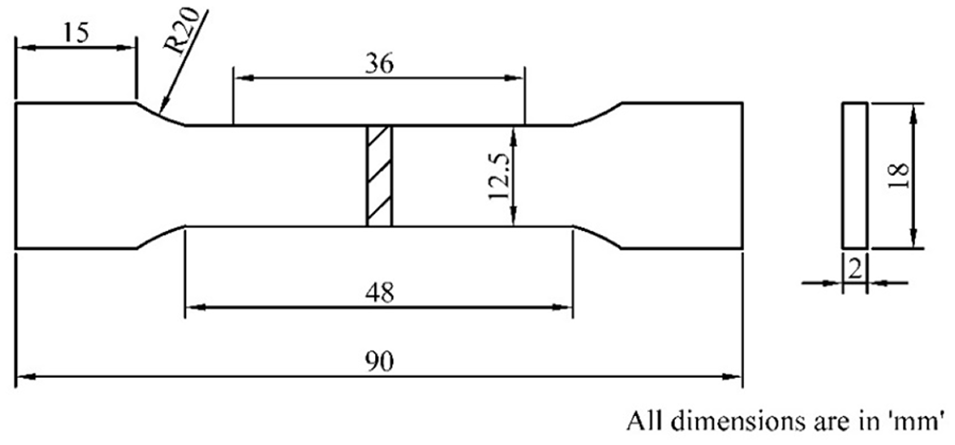
Dimension of tensile samples.
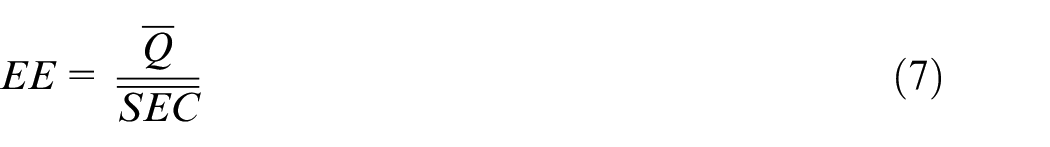
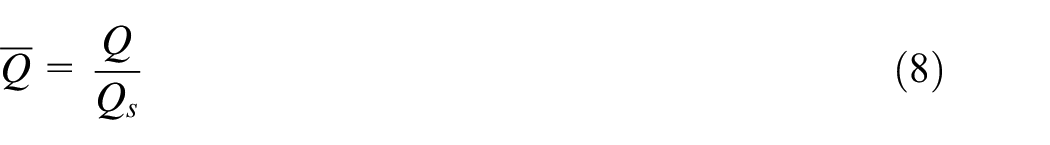
Energy effectiveness is a systematic method to minimise the total energy consumption in achieving the quality requirements. 26 In this study, to express the energy effectiveness of laser welding, the EE index is introduced and defined as the ratio of the equivalent welding quality to the equivalent SEC:
where
If the value of
where

If the value of
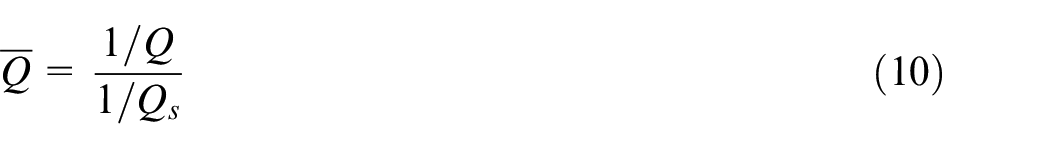
where

Consequently, the equivalent welding quality,
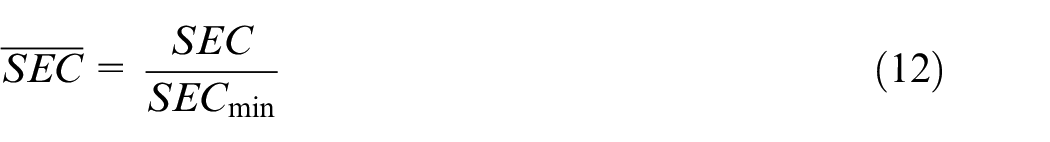
where

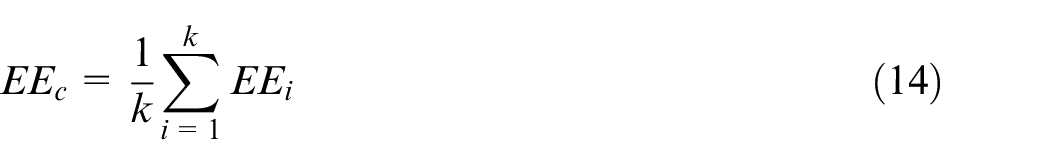
where k is the amount of welding quality requirements.
Experimental design
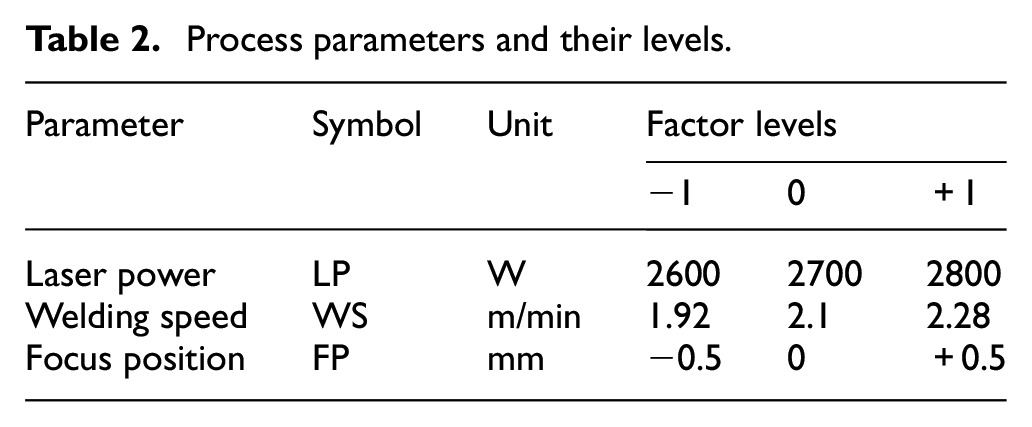
The laser power, welding speed and focus position were selected to investigate the energy consumption and welding quality. Because the experimental conditions (including the welding process, materials, geometric dimensions, etc.) were similar, we referred to the selection of parametric windows published by Xia et al., 27 and the parameter ranges were determined according to specialised handbooks, worker experience and preliminary tests. Preliminary experiments were conducted by varying one parameter, while the others remained unchanged to determine the process parameter ranges and levels. The determination criteria were as follows: (a) the minimum laser power and maximum welding speed based on the full welding penetration in keyhole mode, (b) the maximum laser power and minimum welding speed based on a continuous and stable weld bead without perforation and (c) the range of focus position based on a weld bead with good macrostructure. Accordingly, the ranges and levels of the process parameters were determined, as listed in Table 2. Figure 6 shows the weld surface morphologies of selected samples within the scope of the experimental design. It can be observed that all of the weld beads are continuous and stable. Figure 6(a) and (b) show that the spatter and collapse in the weld bead surface increase with increasing laser power. In contrast, a higher welding speed reduces the spatter and collapse defects, as shown in Figure 6(c) and (d). Furthermore, collapse occurs at the focus position of −0.5 mm (Figure 6(e)), while undercut and additional spatters are generated at a focus position of 0.5 mm (Figure 6(f)).
Process parameters and their levels.
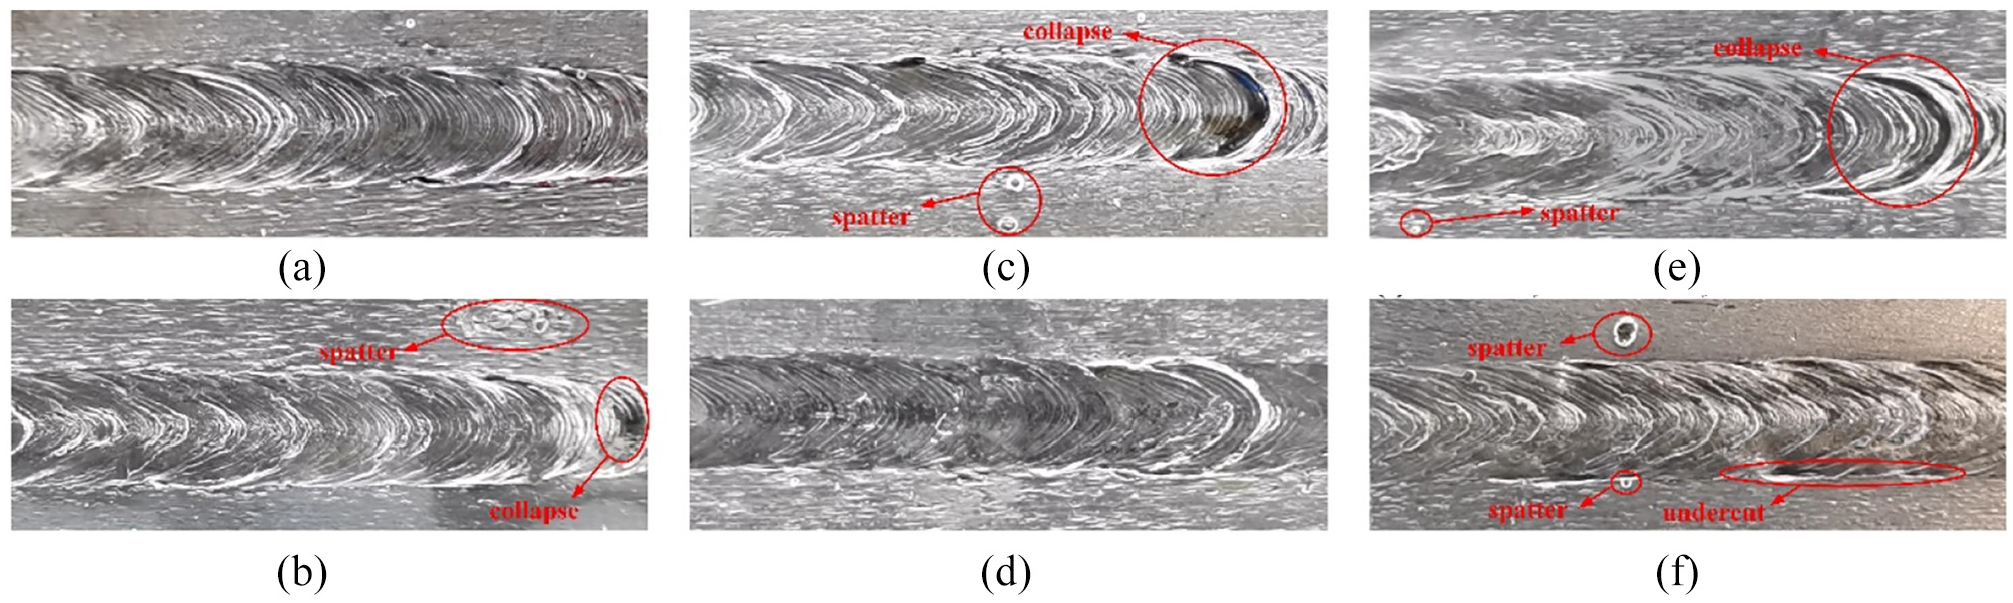
Weld surface morphologies obtained for different process parameters: (a) 2600 W, 2.1 m/min, 0 mm, (b) 2800 W, 2.1 m/min, 0 mm, (c) 2700 W, 1.92 m/min, 0 mm, (d) 2700 W, 2.28 m/min, 0 mm, (e) 2700 W, 2.1 m/min, −0.5 mm and (f) 2700 W, 2.1 m/min, 0.5 mm.
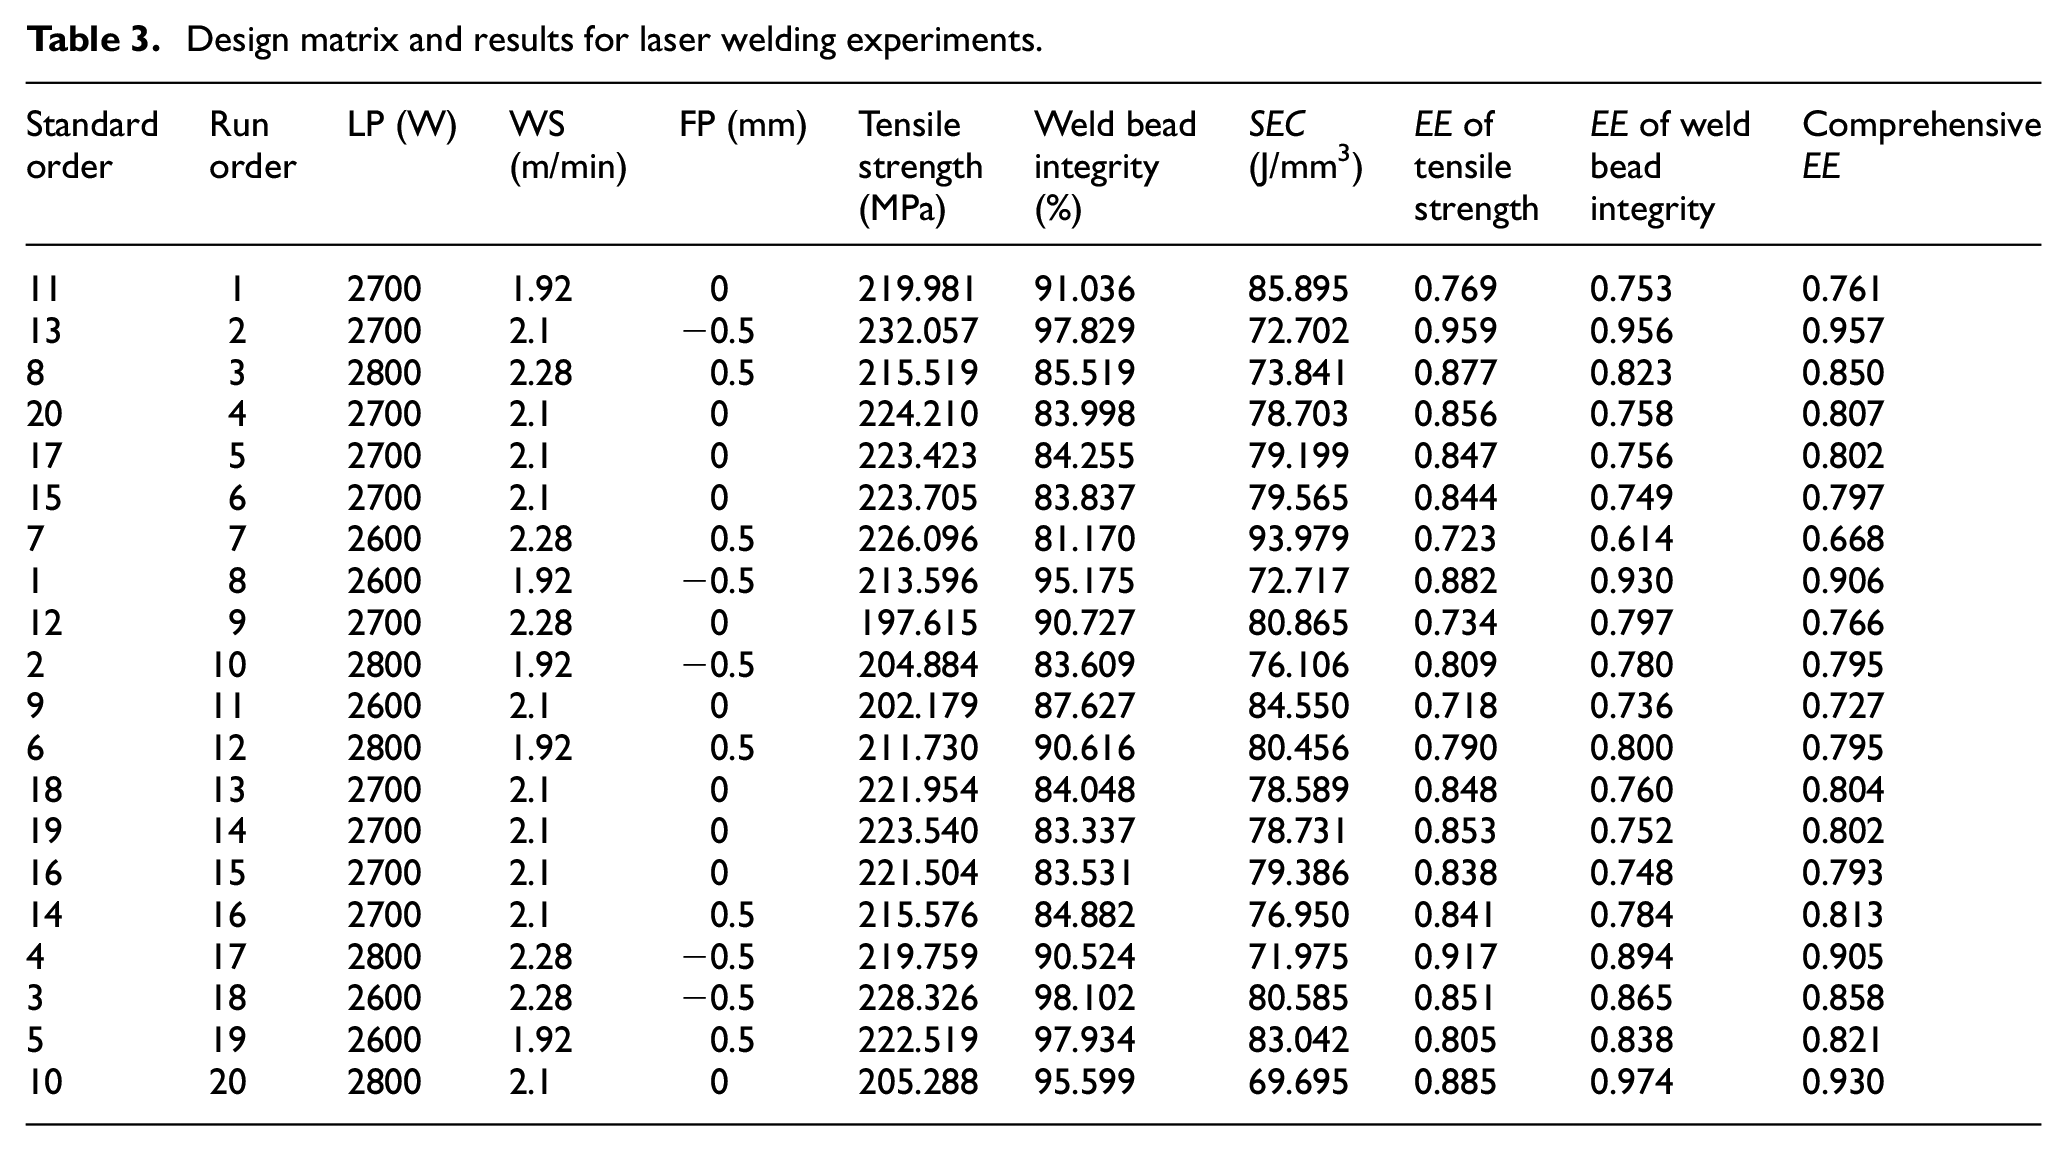
Taguchi design, full-factorial design and central composite design (CCD) are widely used experimental techniques to determine the effects of different process parameters on welding problems. The Taguchi method is a design method that considers only discrete control factors. 28 Through this method, the main effects of the parameters can be analysed, but the interaction and the quadratic effects are difficult to evaluate. The full-factorial design examines the all combinations of all levels of all factors. As a result, the number of experiments is large, and the cost of the experiments is high. Therefore, to investigate the effects of process parameters on the energy consumption and welding quality, the CCD method was employed to obtain as much information as possible regarding the effects of parameter with fewer required experiments. 29 The experimental design matrix is listed in Table 3. The laser welding experiments were performed according to a random experimental run order which is generated by Design-Expert V12 to minimise potential systematic bias.
Design matrix and results for laser welding experiments.
Results
The welding bead integrity and SEC were calculated according to the measured heights and cross-sectional areas of the weld beads. Furthermore, the EE was obtained based on equations (7)–(14), as summarised in Table 3.
Effects of process parameters on the SEC
Main effects plots are used to analyse the effects of the process parameters on the SEC, as shown in Figure 7(a). It can be observed that the SEC is strongly affected by the laser power and focus position owing to the higher slopes, while the welding speed has a less significant effect on the SEC. The SEC decreases with increasing laser power, which can be explained as follows. In the keyhole mode of the laser welding process, a higher laser power enhances the intensity of the reflected laser beam within the keyhole, which exacerbates the difference in surface tension and non-homogeneous recoil pressure along the keyhole depth. A stronger clockwise vortex is thus developed in the melt pool. This leads to a significant increase in the lower-half area of the melt pool. 30 As shown in Figure 8, increasing the laser power from 2600 to 2800 W increases the weld root width by approximately 65%. Consequently, the increase in the weld bead volume outweighs the increase in energy consumption caused by the higher laser power, resulting in an overall decrease in the SEC. In contrast, increasing the focus position increases the SEC. A negative focus position, in which the focus of the laser beam is below the metal surface, causes the laser beam to converge inside the metal. Therefore, a higher laser energy density acts on the interior of the metal, forming stronger melting and vaporisation effects. This causes the laser energy to be transmitted to the deeper part of the metal; consequently, the weld bead is enlarged and the SEC decreases. The SEC also decreases as the welding speed is increased from 1.92 to 2.1 m/min. This is because as the welding speed increases, the welding time is reduced; correspondingly, the time-dependent energy consumption is reduced and dominates the SEC. However, when the welding speed is increased from 2.1 to 2.28 m/min, the laser energy input decreases, which reduces the bead width. At the same time, the weakened intensity of the reflected laser beam within the keyhole reduces the difference in surface tension and non-uniform distribution of recoil pressure in the lower half of the melt pool. Consequently, the recoil pressure is counterbalanced by the surface tension and the root of the keyhole tends to close, which narrows the bottom area of the weld bead. In Figure 9, it can be observed that the weld root is reduced by more than one-third. As a result, the weld bead volume decreases significantly, thereby causing an increase in the SEC.
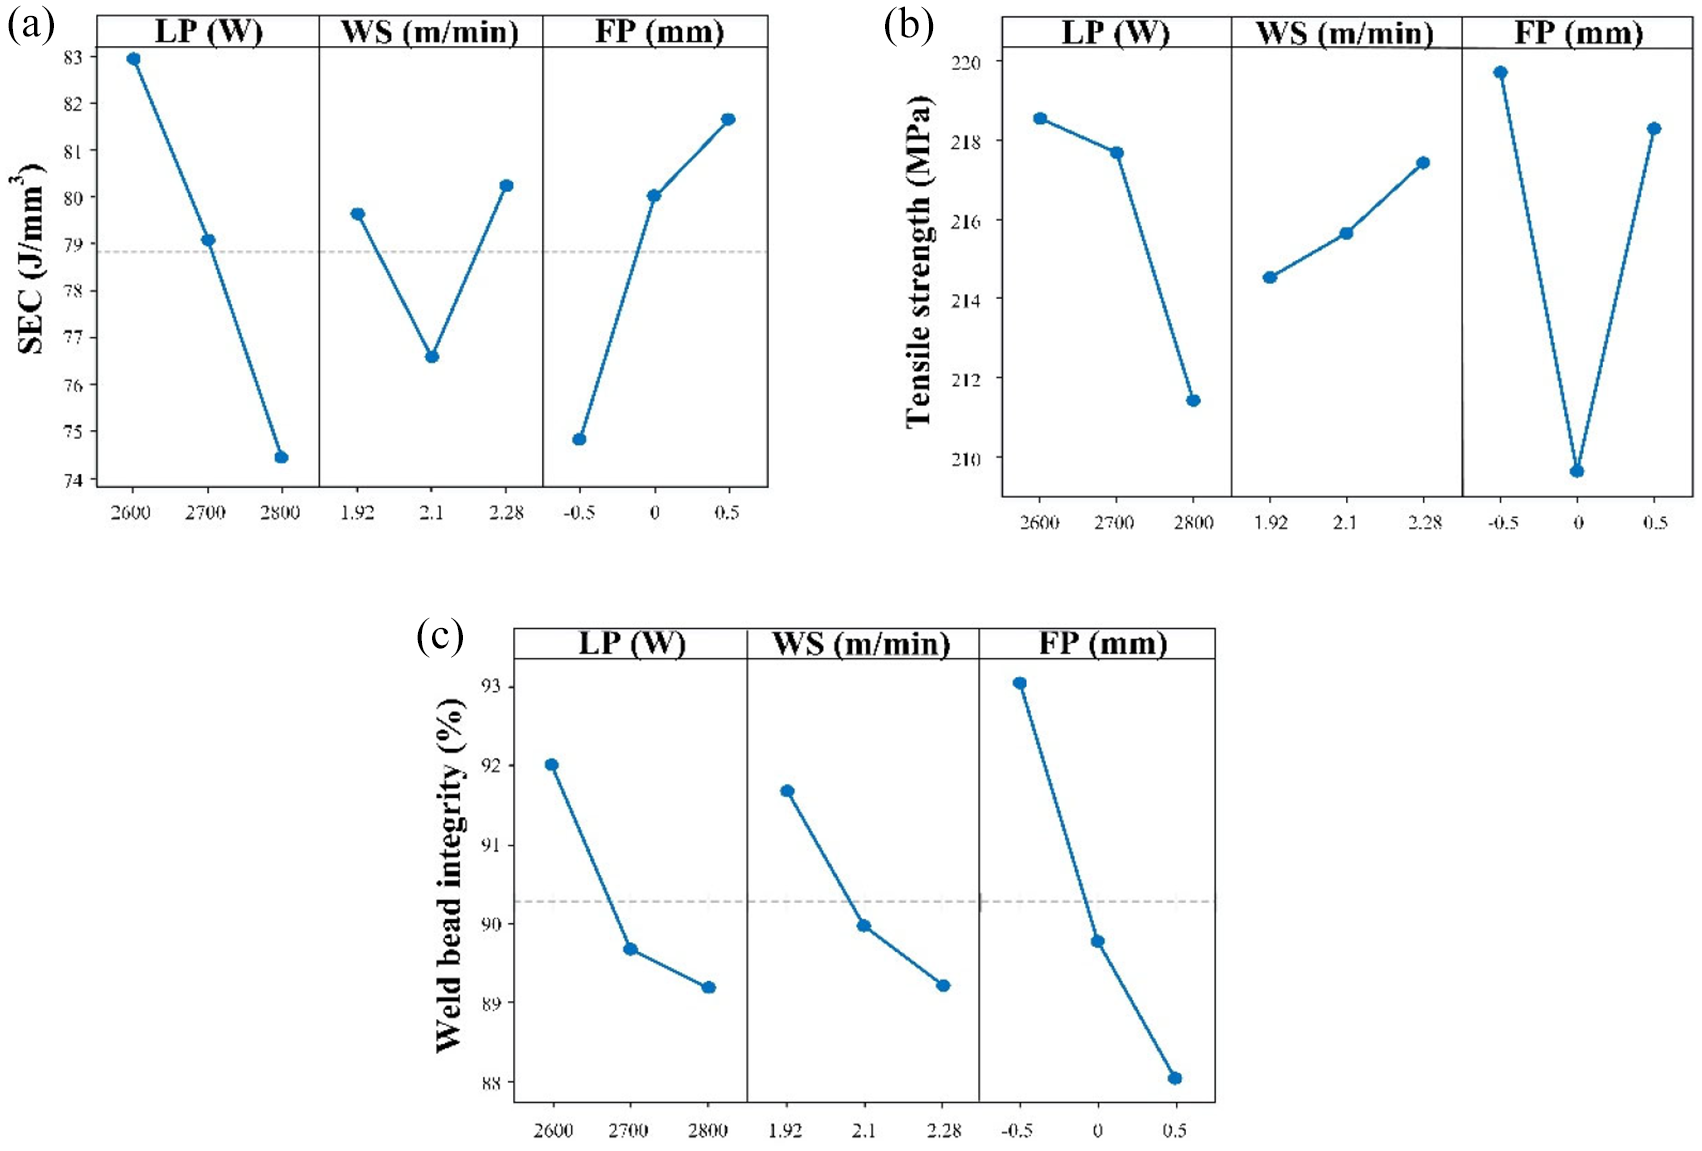
Main effects plots for: (a) SEC, (b) tensile strength and (c) weld bead integrity.
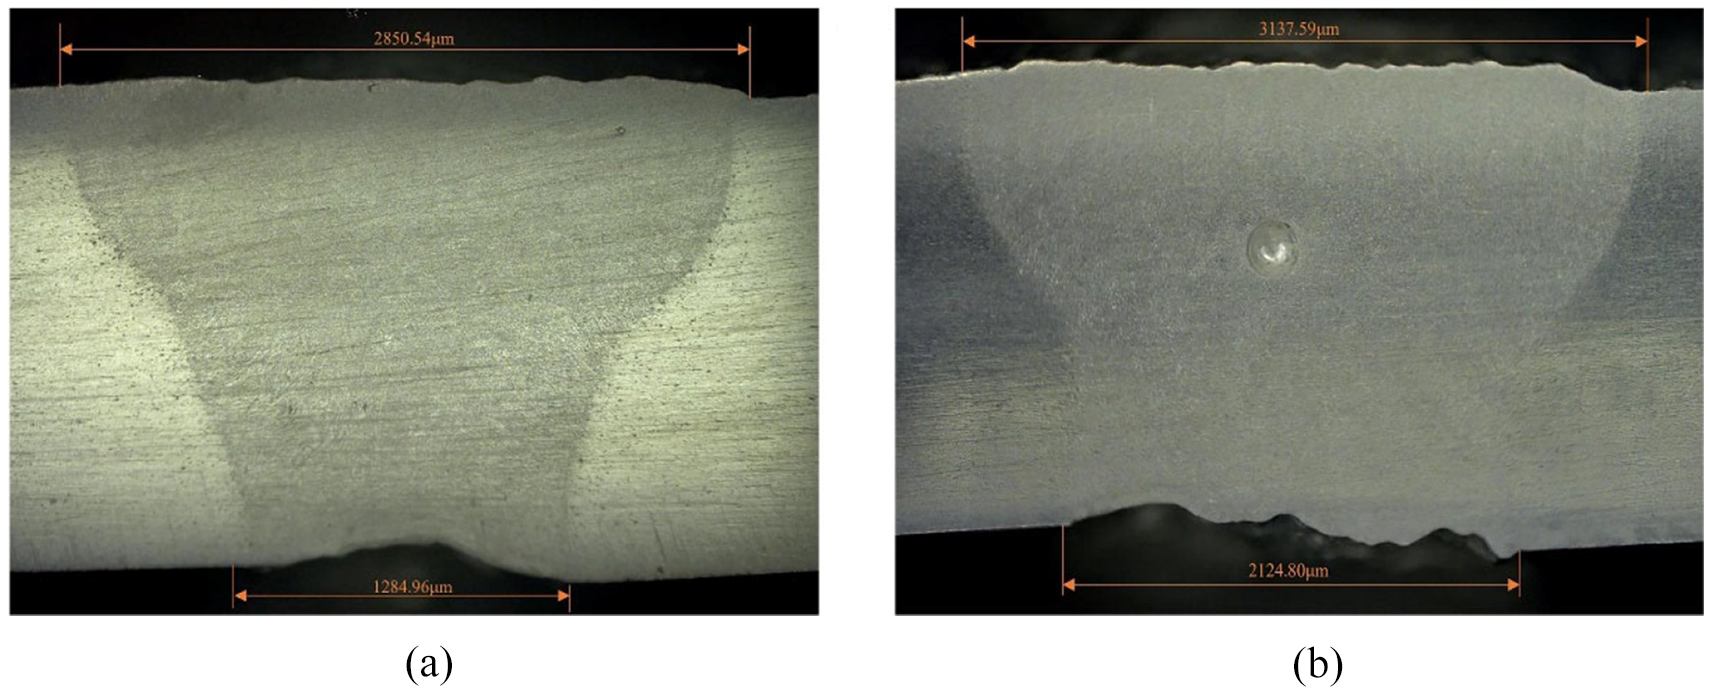
Weld bead profiles of welding specimen at: (a) LP = 2600 W, WS = 2.1 m/min, FP = 0 mm and (b) LP = 2800 W, WS = 2.1 m/min, FP = 0 mm.
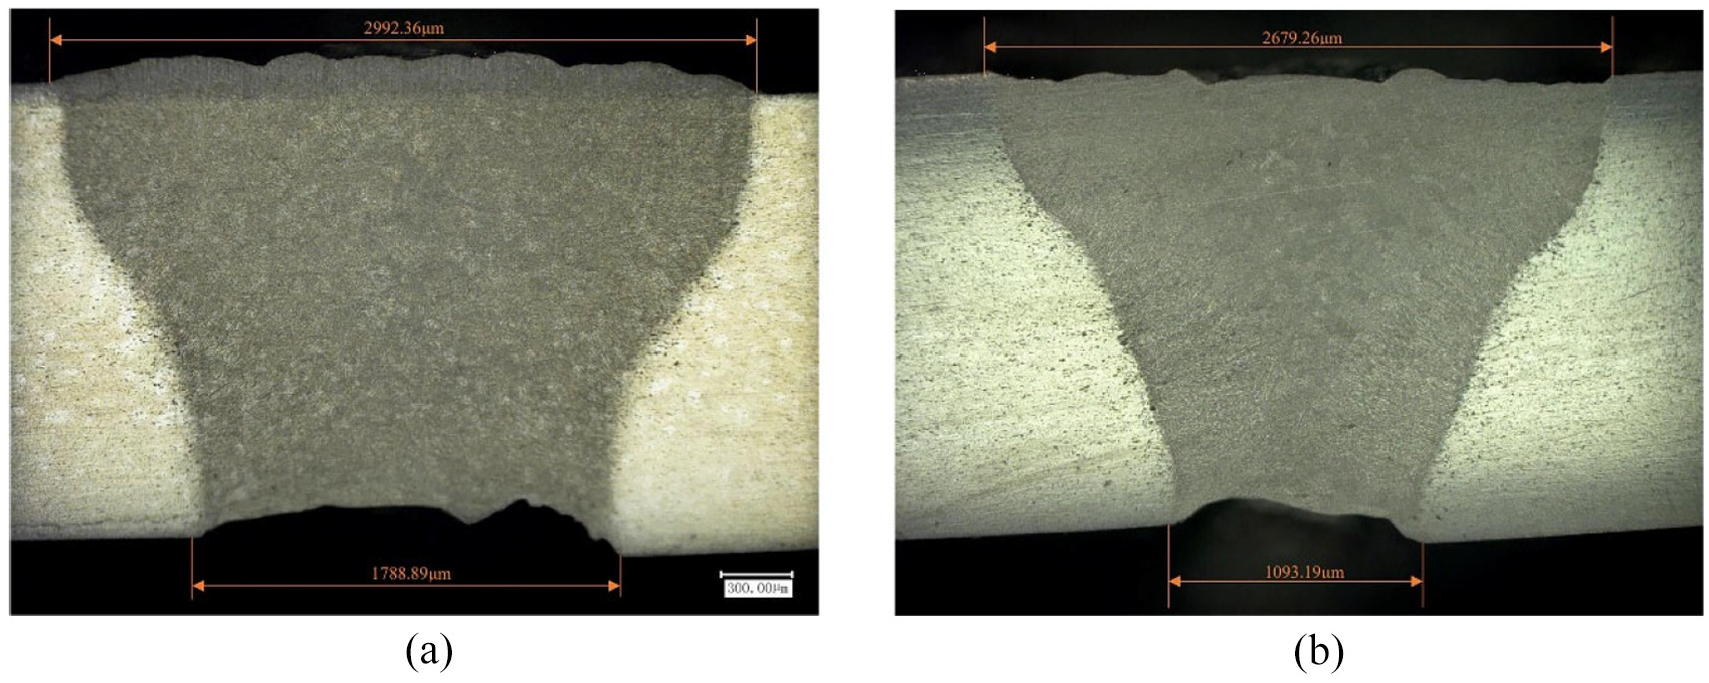
Weld bead profiles of welding specimen at: (a) LP = 2700 W, WS = 2.1 m/min, FP = 0 mm and (b) LP = 2700 W, WS = 2.28 m/min, FP = 0 mm.
Effects of process parameters on the welding quality
Figure 7(b) shows plots of the main effects of process parameters on the tensile strength. It is found that increasing the laser power decreases the tensile strength. This observation can be explained by considering the aspects of grain coarsening and weld interface reduction. On one hand, coarser grains are generated in the fusion zone owing to the higher heat input caused by increased laser power, according to the research of He et al. 31 and Xia et al. 27 Moreover, given that the increase in heat input decreases the cooling rate, 32 a longer time is available for grain coarsening during solidification, which causes a reduction in tensile strength. On the other hand, a high heat input aggravates the evaporation loss of the weld material; consequently, the underfill of the weld bead increases. This leads to a decreased area of the weld interface for load bearing, which reduces the tensile strength. Therefore, under both conditions, the tensile strength of the joints decreases. In contrast, an increase in the welding speed has a positive effect on the tensile strength. The increase in welding speed reduces the heat input due to the inversely proportional relationship between the welding speed and heat input, resulting in finer grains. Moreover, grain growth can be minimised at high welding speeds. These may be the reasons for the increase in the tensile strength. It is worth noting that the tensile strength is significantly affected by the focus position and reaches a minimum at a focus position of 0 mm. The optimum power density is characterised by the formation of finer precipitates in the fusion zone, and consequently, an increase in the tensile strength. 33 The maximum power density is obtained at a focus position of 0 mm owing to the minimum spot size at the weldments. The power density is lower at focus positions of −0.5/+0.5 mm. In this study, the power density at focus positions of −0.5/+0.5 mm is closer to the optimal power density. Therefore, a higher tensile strength is obtained at focus positions of −0.5/+0.5 mm.
In terms of the effects of the process parameters on the weld bead integrity shown in Figure 7(c), it can be observed that increases in the laser power, welding speed and focus position all have negative effects on the weld bead integrity. With increasing laser power, the evaporation loss of the material becomes severe owing to the higher specific heat input. Therefore, the molten metal is insufficient to fill the depressions formed by material expulsion, 34 resulting in worsening underfill and, consequently, decreased weld bead integrity. A high welding speed is not conducive to the flow of the molten metal. Eventually, welding defects such as incomplete root penetration and excessive convexity are generated, and the weld bead integrity will decrease. Moreover, a greater focus position will reduce the laser absorptivity of the welding material and cause root concavity and incompletely filled grooves, eventually decreasing the weld bead integrity. 35
Joint analysis of the SEC and welding quality
The welding quality and SEC results are jointly analysed (see Figure 10). The tensile strength exhibits an increasing trend with the increase in SEC, as shown in Figure 10(a). However, it is not inevitable for weldments with a higher SEC to have a high tensile strength. At a SEC of 72.702 J/mm3, the maximum tensile strength of 232.057 MPa is achieved. As shown in Figure 10(b), the weld bead integrity displays a trend of initially increasing and then decreasing with the increase in SEC. The maximum weld bead integrity of 98.102% is achieved at an SEC of 80.585 J/mm3. It is worth noting that the worst weld bead integrity and highest SEC are obtained simultaneously in experiment No. 7, which is located at the far-right side of Figure 10(b), because of the lack of penetration. The red dots represent the Pareto fronts of the experimental results. It can be observed that experiments No. 10 and 13 under the standard order represent the Pareto fronts for both combinations of the welding quality indexes and SEC, which means that the EE in these two experiments are better.
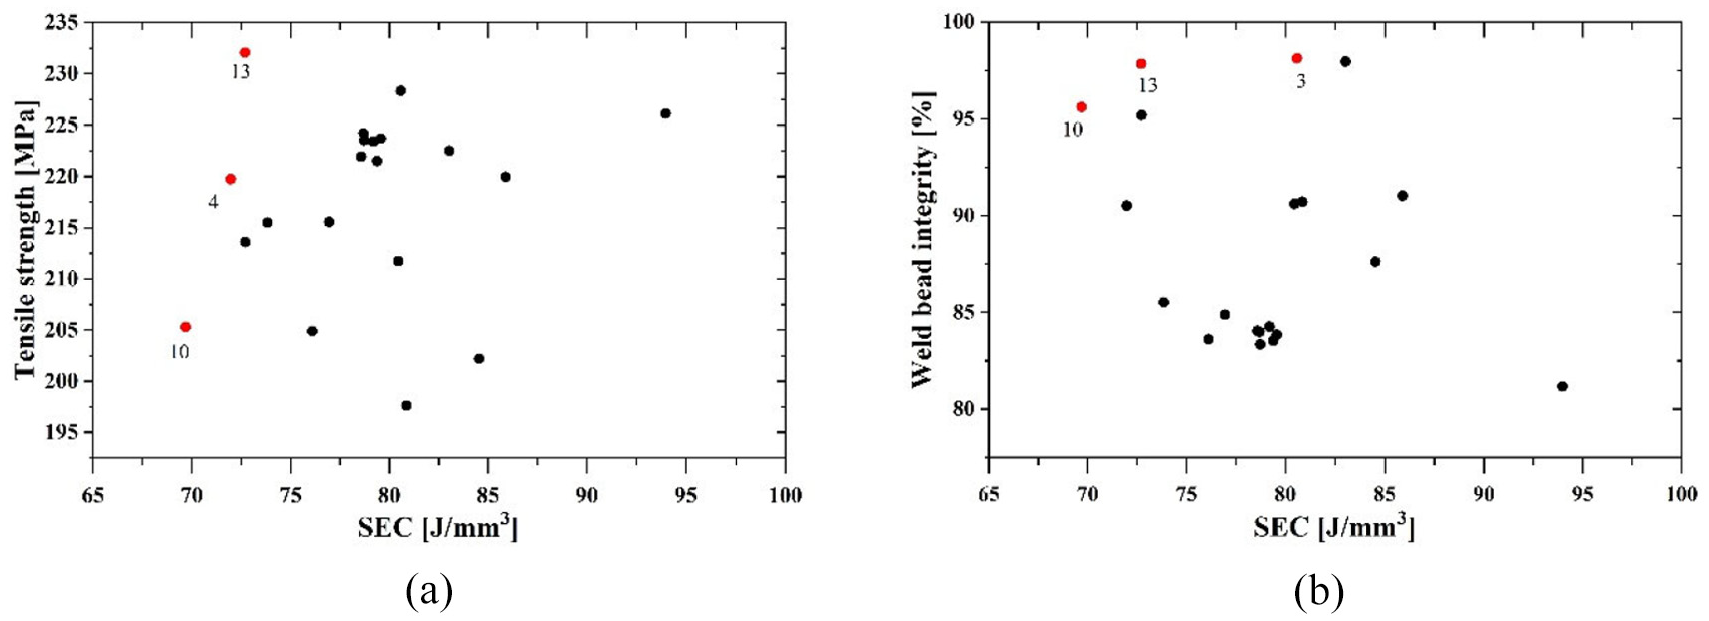
Joint analysis of quality and SEC of 6061 aluminium alloy weldments: (a) tensile strength versus SEC and (b) weld bead integrity versus SEC. Numbers below the red dots represent the experiment number under standard order.
To compare the SEC and welding quality more deeply, the growth rate (GR) is used for the joint analysis of the SEC and welding quality in terms of various process parameters. 36 The GR is described as the growth rate (%) of the energy consumption (or the welding quality) of the sample compared to the minimum energy consumption (or the same welding quality), as shown in equation (15). Various trends in welding quality (i.e. tensile strength and welding bead integrity) and the SEC can be compared for process parameters including the laser power, welding speed, and focus position using this method.
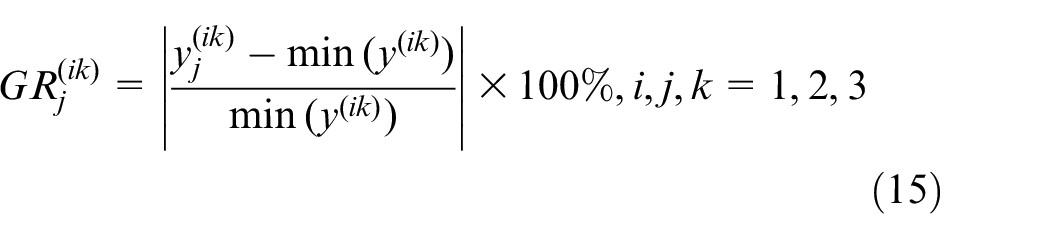
where
In Figures 11 to 13, the red and black solid curves illustrate the variation in the welding quality and SEC, respectively. In Figure 11, the GRs of the SEC, tensile strength and weld bead integrity exhibit the same trend with the variation in laser power, and the GRs of the tensile strength and weld bead integrity are lower than those of the SEC with respect to the laser power. This indicates that adjusting the laser power to improve the welding quality will inevitably lead to a significant increase in the SEC. Furthermore, the GR of the tensile strength varies slightly with laser powers of between 2600 and 2700 W. This suggests that the SEC can be effectively reduced with a negligible loss of tensile strength by varying the laser power between 2600 and 2700 W. In the case of weld bead integrity, the energy consumption can be reduced without sacrificing the weld bead integrity for laser powers of between 2700 and 2800 W owing to the slight change in the GR of the weld bead integrity in this region.
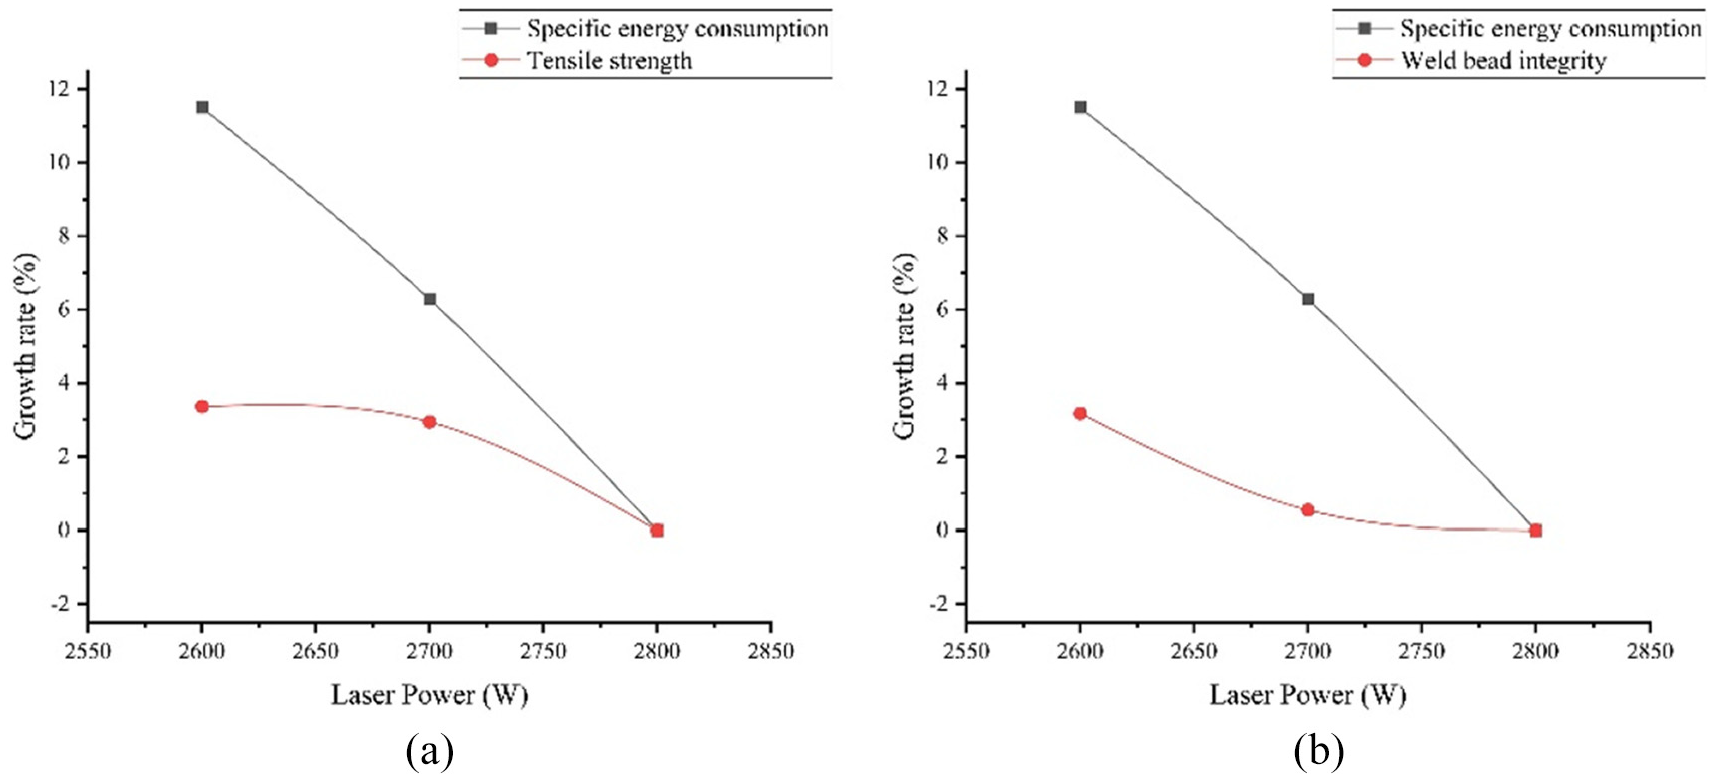
GR of SEC and welding quality on laser power: (a) tensile strength and (b) weld bead integrity.
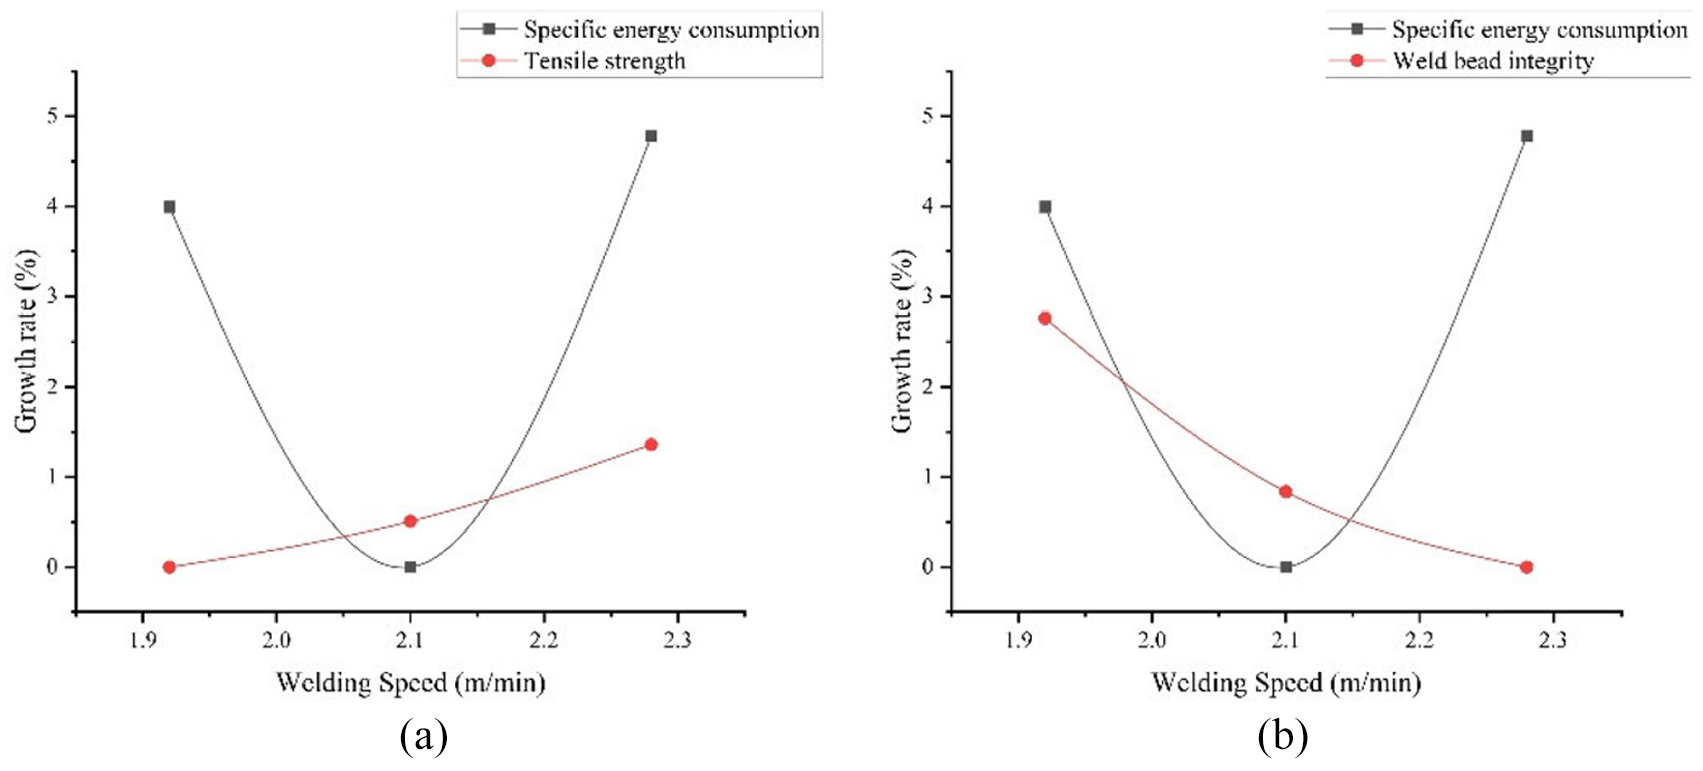
GR of SEC and welding quality on welding speed: (a) tensile strength and (b) weld bead integrity.
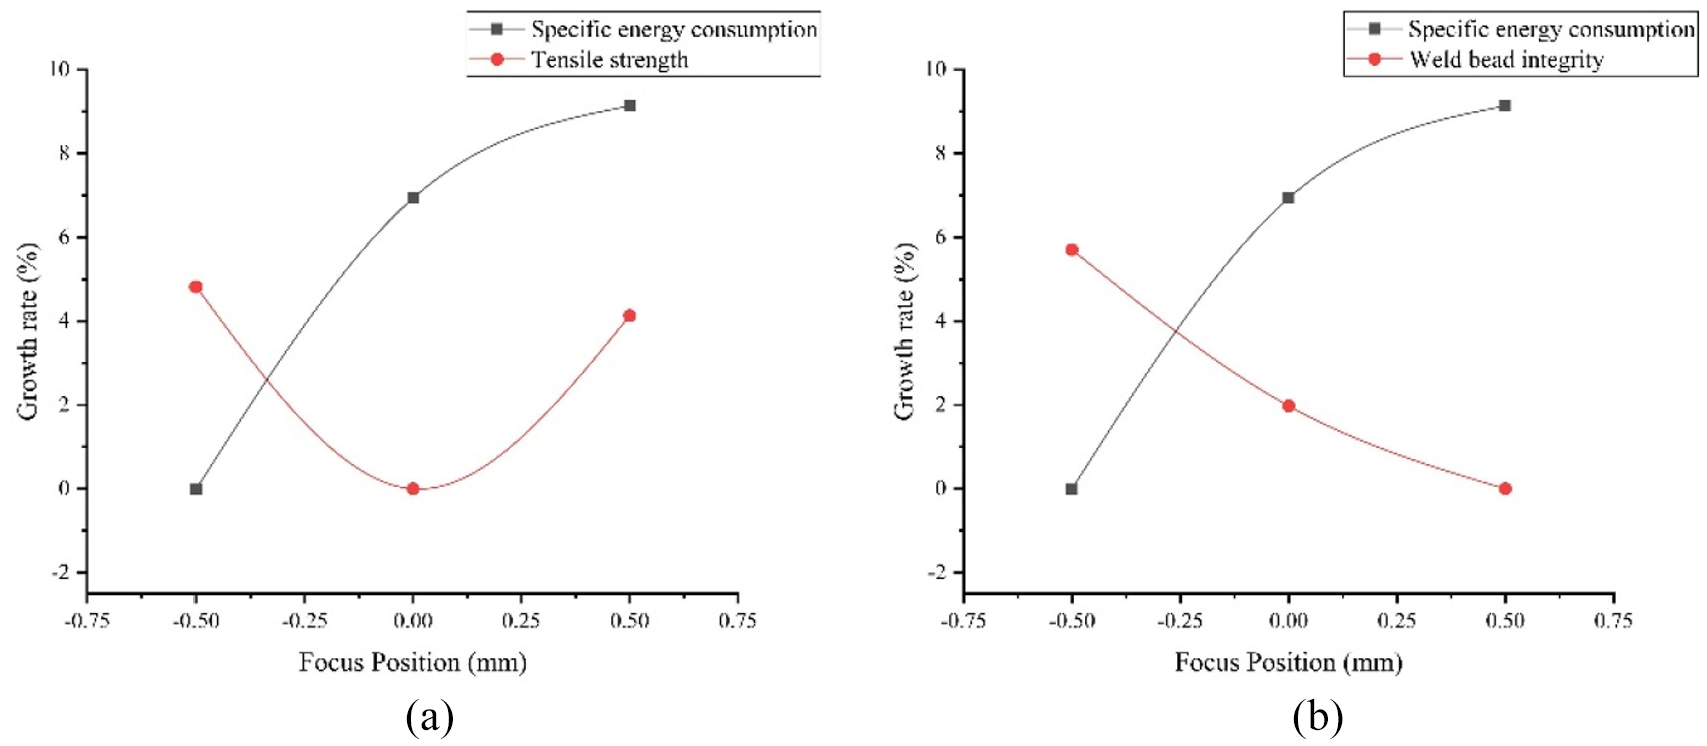
GR of SEC and welding quality on focus position: (a) tensile strength and (b) weld bead integrity.
Figure 12 shows the effects of the welding speed on the GRs of the SEC and the welding quality. The tensile strength is less affected by the welding speed owing to a maximum GR of less than 1.4%. The GR of the SEC decreases sharply with increasing welding speed from 1.92 to 2.1 m/min. Thus, the energy consumption can be greatly reduced with a relatively stable tensile strength by increasing the welding speed from 1.92 to 2.1 m/min. The GR of the weld bead integrity decreases with increasing welding speed and is higher compared to the SEC near a welding speed of 2.1 m/min. This indicates that it is difficult to reduce the energy consumption without compromising the weld bead integrity; however, once the weld bead integrity meets the requirements, increasing the welding speed to 2.1 m/min can effectively reduce the energy consumption.
The influence of the focus position on the GRs of the SEC and welding quality is shown in Figure 13. The GRs of the welding quality are lower than that of the SEC for focus positions of 0–0.5 mm, while the GRs of the welding quality higher than that of the SEC near a focus position of −0.5 mm. This indicates that increasing the energy consumption does not effectively improve the welding quality when the focus position is varied. Moreover, the welding quality can be improved without increasing the energy consumption by setting the focus position at approximately −0.5 mm.
Energy effectiveness analysis of laser welding
The two optimal comprehensive EEs were achieved in experiment No. 10 (0.930) and No. 13 (0.957) under the standard order (see Table 3), which is consistent with the results shown in Figure 10. Figure 14 graphically shows the main effects of the process parameters on the EE. It is concluded that the focus position has the most significant effect on the EE, followed by the laser power and welding speed based on the slopes of the curves. With an increase in the laser power from 2600 to 2800 W, an increase in EE is observed. This is because the GRs of the welding quality and SEC increase with decreasing laser power, while the GR of the welding quality is less than that of the SEC, as shown in Figure 11. This leads to a decrease in the EE with decreasing laser power. When the welding speed is increased from 1.92 to 2.28 m/min, the EE first increases and then decreases. This observation can be explained as follows. Regardless of whether the welding speed is low (1.92 m/min) or high (2.28 m/min), the GR of the SEC is higher than that of the welding quality, as shown in Figure 12. Moreover, a negative focus position is conducive to improving the EE. This observation coincides with Figure 13. The GR of the welding quality is higher than that of the SEC at the negative focus position, resulting in a higher EE.
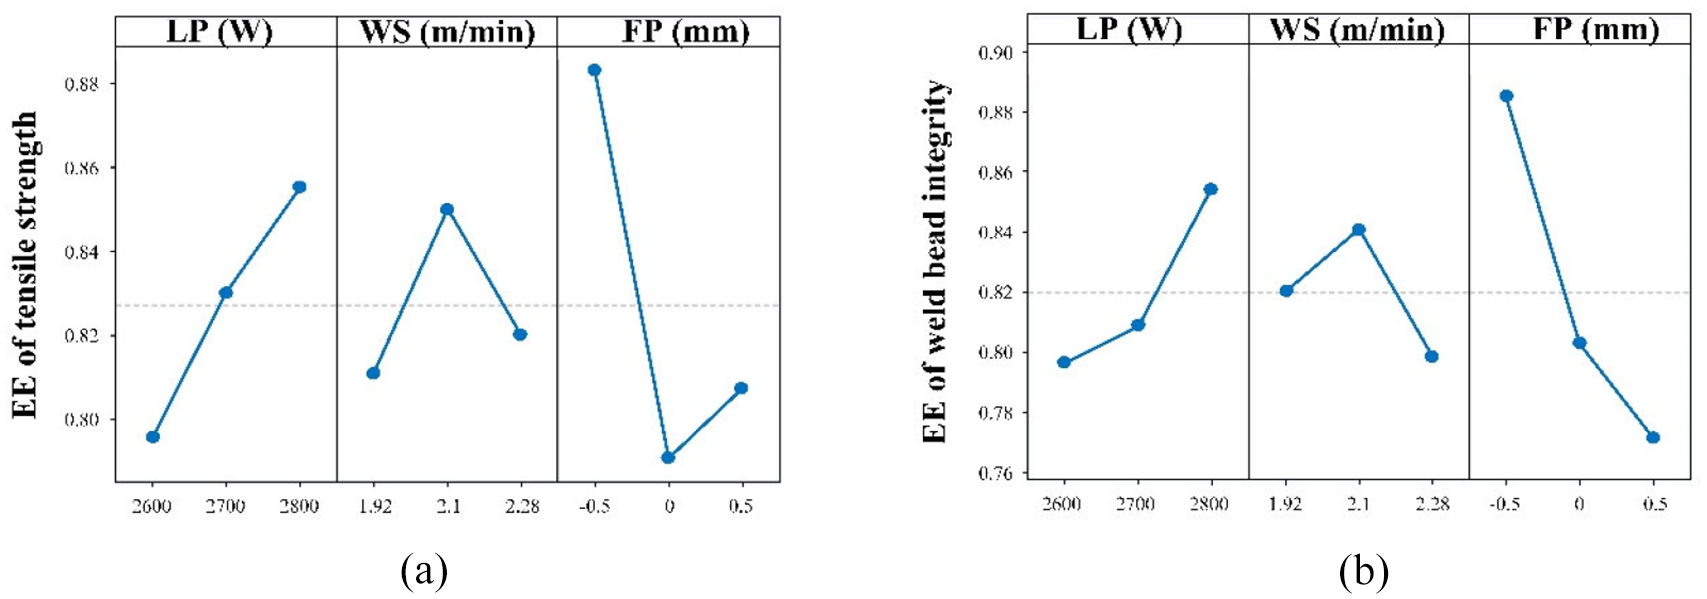
Main effects plots for: (a) EE of tensile strength and (b) EE of weld bead integrity.
Three-dimensional curved surfaces and their contour plots were drawn using the Kriging method in MATLAB R2016b to further analyse the interaction effects of the process parameters, as shown in Figure 15. Kriging is a black-box modelling approach that can map intermediate points. Overall, the negative focus position and an increase in the laser power result in a better EE. With increasing welding speed, the EE first increases and then decreases. These observations are consistent with the main effect analyses. When the focus position is positive, the effects of the welding speed and laser power on the EE are insignificant. Moreover, variations in the laser power have a significant impact on the effects of the welding speed and focus position.
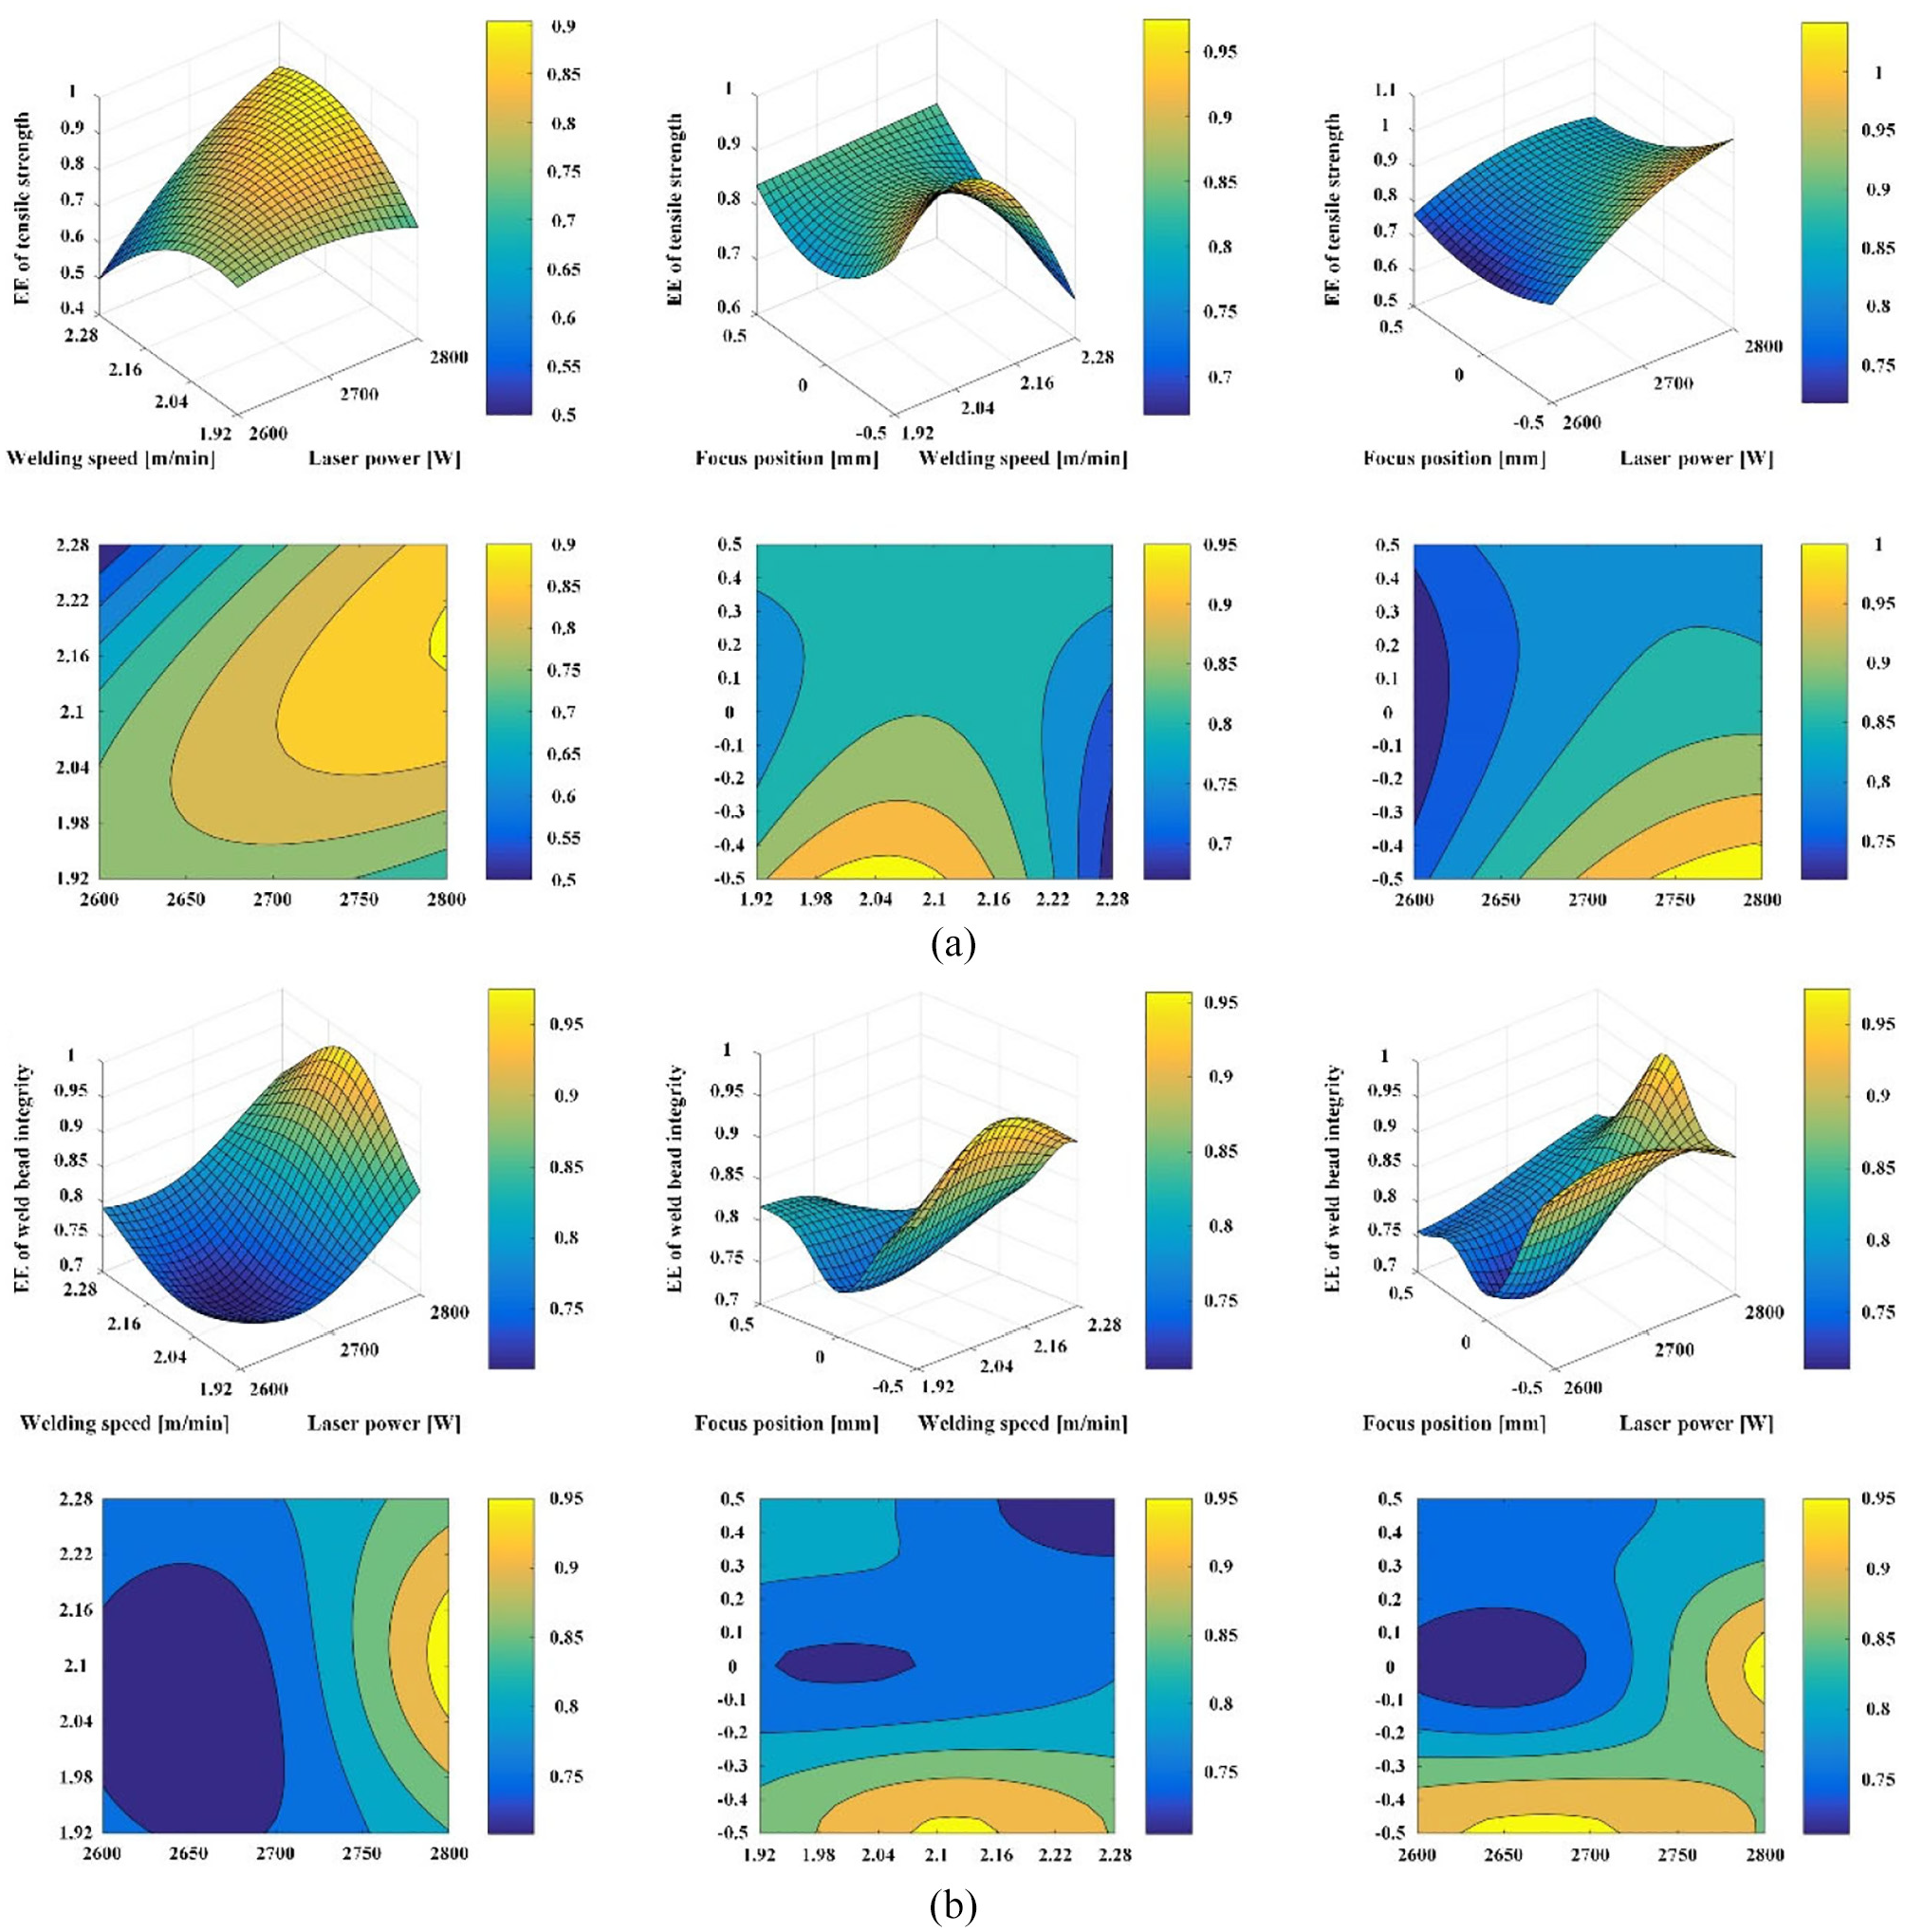
The three-dimensional curved surfaces and their contour plots for: (a) EE of tensile strength and (b) EE of weld bead integrity.
The analysis results indicate that the performed laser welding operation has significant potential for energy savings while ensuring the welding quality requirements are met via the selection of process parameters. A higher laser power should be selected within a moderate welding speed range at a negative focus position to obtain a greater EE, thereby reducing the energy consumption with an acceptable welding quality. For example, with the welding quality requirements of a tensile strength ≥220 MPa and weld bead integrity ≥95%, the energy consumption can be reduced while the specified welding quality is satisfied by conducting laser welding at a laser power of 2700 W, welding speed of 2.1 m/min and focus position of −0.5 mm. At this time, the SEC is 72.702 J/mm3, and the EE reaches 0.957. In contrast, at a laser power of 2600 W, welding speed of 1.92 m/min and focus position of 0.5 mm, where EE is 0.821, the SEC is reduced by 12.45%, the tensile strength is increased by 4.29%, and the weld bead integrity remains stable (a decrease of 0.11%).
Discussion
Combining the analysis results for the welding quality and EE, it can be concluded that with the increase in EE, the improvement in the welding quality varies. The EE can be enhanced without compromising the welding quality. However, in some cases, enhancement of the EE will cause a significant reduction in the welding quality. This is because a poor welding quality may be generated at a low SEC, and consequently, the EE is increased overall. For instance, in experiment No. 1 under the standard order, an acceptable EE (0.882) is achieved, which is better than 80% of the experimental results. However, poor tensile strength (213.596 MPa) is observed. Therefore, the EE needs to be optimised with an acceptable welding quality. The results of the EE and the corresponding welding quality are compared in Figure 16.
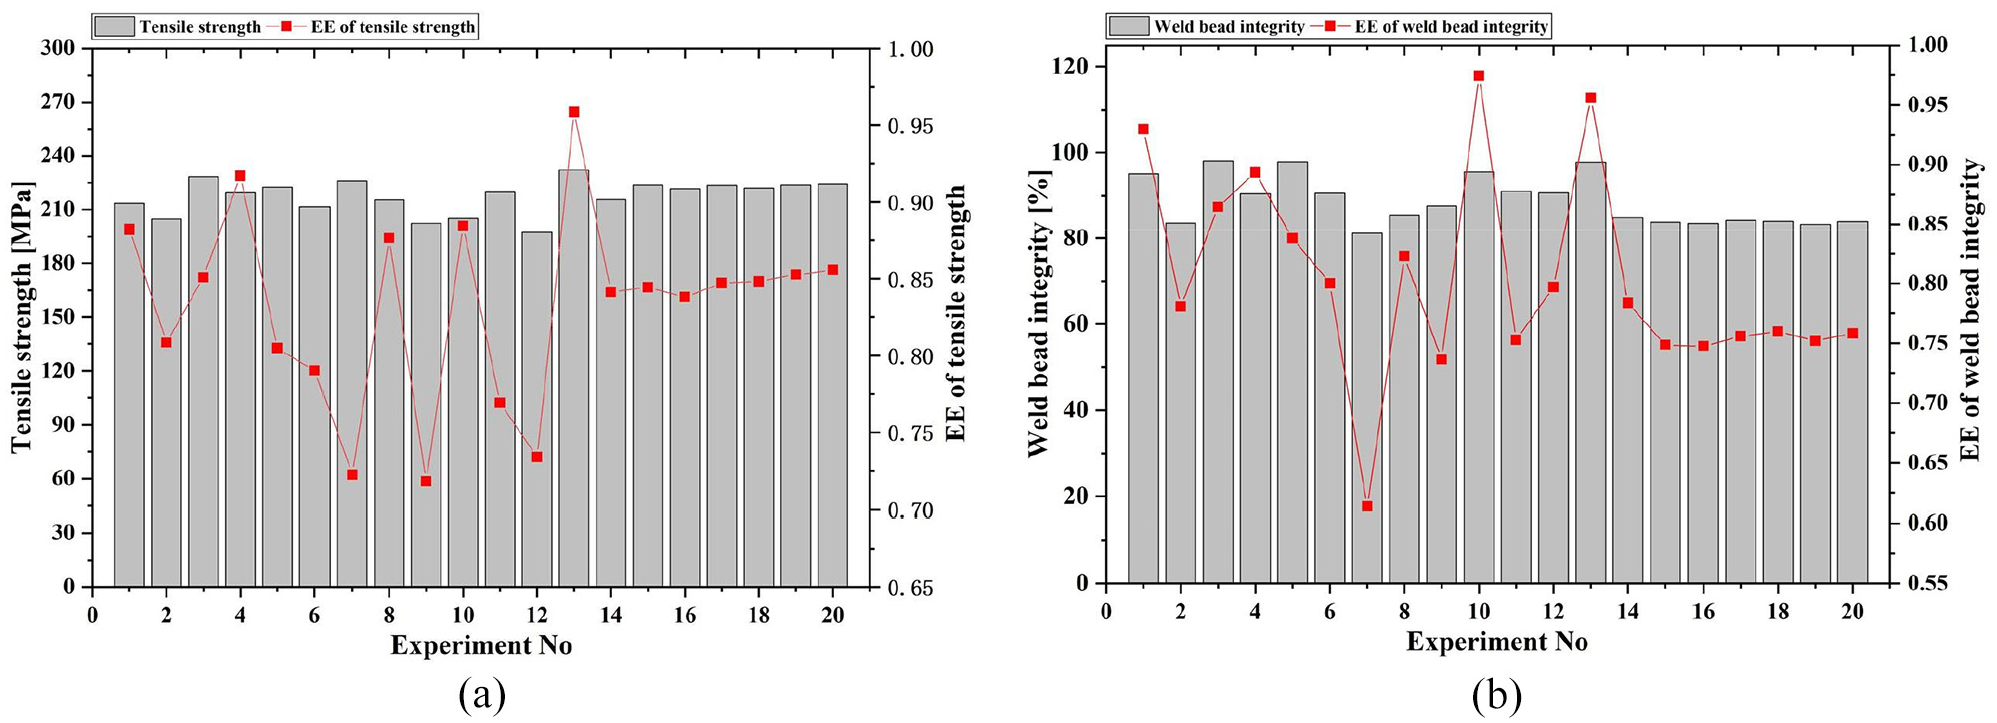
(a) Tensile strength and EE of tensile strength and (b) weld bead integrity and EE of weld bead integrity.
As shown in Figure 16(a), obtaining a high tensile strength may result in a low EE in some cases (experiments No. 7 and 11) owing to the high welding energy consumption. It is possible to achieve both good tensile strength and EE via a reasonable process parameter configuration (experiment No. 13). Moreover, a higher EE can also be achieved with a relatively high weld bead integrity, as shown in Figure 16(b) (experiments No. 1, 10 and 13). It is worth noting that a high EE with good comprehensive welding quality is achieved in experiment No. 13. Therefore, energy consumption can be reduced while maintaining an acceptable welding quality.
Different welding quality requirements should be determined for different industrial application scenarios. In this study, laser welding is considered from a new perspective of energy effectiveness to determine how energy savings can be realised efficiently without significantly compromising the welding quality. In addition to the tensile strength and weld bead integrity considered in this study, other welding quality requirements such as the welding depth-to-width ratio, welding reinforcement, bead microhardness and flexural strength can also be considered as primary indexes. In this study, 6061 aluminium alloy is considered. Process parameters such as application absorbers, preheating and beam wobbling need to be further considered, as these can improve the material’s absorption and consequently affect the energy use and welding quality of aluminium alloy laser welding. Moreover, the EEs of other industrial materials for laser welding, such as 304L, Ti-6Al-4V, Inconel 617 and AZ31B also need further study.
The environmental performance of laser welding requires significant attention and improvement. On one hand, a process parameter configuration that comprehensively considers energy consumption and welding quality, that is, the energy effectiveness, can assist process designers and machine operators in making better decisions for sustainable process design and operation. On the other hand, energy effectiveness can be estimated for different materials. Materials with a higher EE can be selected while satisfying the specified welding quality.
Conclusions
The present study demonstrated the feasibility of reducing the total energy consumption of laser welding without significantly compromising the welding quality in laser welding. The influence of process parameters on the welding quality, SEC and related EE of 6061 aluminium alloy laser weldments was investigated experimentally. Moreover, a joint analysis of the correlation between the SEC and welding quality was performed based on comparison of the GRs. The primary conclusions can be drawn below:
The SEC is predominately affected by laser power, followed by focus position, whereas the effect of welding speed is least pronounced. Increasing the laser power exacerbates the difference in surface tension and non-homogeneous recoil pressure along the keyhole depth, resulting in an extra increase in the lower-half area of the melt pool. This leads to an overall decrease in the SEC.
The tensile strength is weakened with decreasing welding speed and increasing laser power, because high heat input and low cooling rate bring more possibilities for grain coarsening. The focus position of 0 mm may have a negative effect on tensile strength due to the unsuitable power density in this study.
The focus position has a predominant effect on weld bead integrity, followed by laser power and welding speed. Process parameters all have negative correlations with the weld bead integrity for the covered experimental hyperspace.
Adjusting the laser power to improve the welding quality will inevitably lead to a significant increase in the SEC. The energy consumption can be significantly reduced with a slight variation of tensile strength and weld bead integrity by varying the welding speed. The welding quality can be improved without appreciably increasing the energy consumption by setting the negative focus position.
The change of EE depends on the struggle between the GR of welding quality and that of the SEC. The EE can be improved by the negative focus position and the increase in laser power, while the EE initially increases and then decreases with the increase in welding speed. A higher laser power should be selected within a moderate welding speed range at a negative focus position to obtain a greater EE.
It has great energy saving potential while not sacrificing welding quality through the reasonable process parameter configuration.
This study presents the first step in energy-effective laser welding research. At present, only the energy effectiveness of discrete design points is estimated, and the possibilities of improving the energy effectiveness with the constraint of welding quality requirements is discussed based on the process parameter configuration. The optimisation of EE and quality should be considered in future work by combining the Kriging and optimisation algorithms to further determine the optimal parameter combination for laser welding to minimise the total welding energy consumption while achieving specific quality requirements.
Footnotes
Declaration of conflicting interests
The author(s) declared no potential conflicts of interest with respect to the research, authorship, and/or publication of this article.
Funding
The author(s) disclosed receipt of the following financial support for the research, authorship, and/or publication of this article: Supported by the Project of International Cooperation and Exchanges NSFC (Grant No. 51861165202), Chongqing General Program of Natural Science Foundation (Grant No. cstc2020jcyj-msxmX0639) and the Science Fund for Distinguished Young Scholars of Chongqing (Grant No. cstc2020jcyj-jqX0011).