
Abstract
During the development of shale gas reservoirs, the mechanical parameters of shale rocks are greatly significant to guide reservoir drilling design, reservoir stimulation, scheme design, and wellbore stability evaluation. Compared with conventional gas reservoirs, the mechanical properties of shale gas reservoir are more complex and lack of the comprehensive understanding. In this study, the uniaxial and triaxial compression experiments of the Longmaxi shale in South China were conducted to understand the mechanical characteristics and damage mechanism of shale rocks. Combined with the characteristics of shale microstructure, the effects of the mechanical properties such as mineral composition, deformation, stress–strain, and fracture damage characteristics were analyzed and discussed. The results show that the stress–strain curves of shale are two main types of elastic deformation and elastic–plastic deformation. There is a significant difference in effective pressure of yield platform in different shale post-peak deformation. The effective pressure of rigid shale is 60 MPa while that of other shales is 30 MPa. With the increase of effective pressure, the increase of peak compressive strength decreases gradually, and the effect of effective pressure on compressive strength decreases gradually with the transition from the brittleness to the ductility. The higher the effective pressure of the brittleness to the ductility is, the greater the change of compressive strength with effective pressure is, and the smaller the compressive strength under low effective pressure is, the smaller the variation with pressure is. Shale rocks with relatively high brittleness under different effective pressures are mainly characterized by brittle split fracture dominated by tensile fracture, while other shales with low brittleness are dominated by single shear fracture plane.
Keywords
Introduction
As an important unconventional oil and gas resource in the world, shale gas is widely distributed around the world and has great potential for development. In 2015, the International Energy Agency estimated that there is 2.13 × 10¹⁴ m3 of recoverable shale gas worldwide, which was mainly located in the United States, China, Australia, and Canada (Guo et al., 2018; Shen et al., 2017). In recent years, the advances in horizontal drilling and fracturing technologies have led to the breakthroughs in shale gas exploration and development in North America, with shale gas production reaching 5.268 × 10¹¹ m3 in 2015, which accounted for about 50% of the total natural gas production (Mohaghegh, 2013; Shen et al., 2018; Tokunaga et al., 2017). However, although China is rich in shale gas resources and has broad prospects for exploitation, the exploration and exploitation of shale gas are still in the research and development stage (Liu et al., 2017; Shen et al., 2019). Therefore, there is extreme significance to develop the relevant theories and technologies for efficient exploitation of shale gas in China based on the North America’s successful experience and the characteristics of shale gas reservoirs.
Shale is a fragile rock formed by the deposition of clay materials at the specific pressure and temperature, which has a complex mineral composition, apparent bedding structures, and varying degrees of anisotropy (Shen et al., 2015; Wei et al., 2013). Due to the unique storage and low permeability characteristics of shale gas reservoirs, horizontal drilling and hydraulic fracturing are the two key technologies for the successful development (Li et al., 2015; Shen et al., 2016; Zhu and Qi, 2016). During the hydraulic fracturing process, the bedding plane has a low degree of cementation, and it tends to crack before the shale, which inhibits the formation of hydraulic fractures and has a significant impact on hydraulic fracturing design and borehole instability (Heng et al., 2015; Parisio et al., 2015; Wei et al., 2016; Zhao et al., 2019). To accomplish the efficient exploitation of shale gas reservoirs, it is very helpful to determine the mechanical characteristics and damage mechanisms of shale, which can provide a theoretical reference for hydraulic fracturing design and prevent borehole instability during the shale gas exploitation.
Over the past decades, a lot of studies have been carried out widely on the mechanical properties, strength, and failure modes of shale. Jager (1960), Tien and Kuo (2001), and Nasseri et al. (2003) conducted anisotropic tests and theoretical analyses on the elastic parameters of stratified rock masses, and they proposed the theoretical criterion that was universally applicable to isotropic rock masses. Golshani et al. (2007) considered the expansion of microcracks was one of the causes of rock damage, and microcrack propagation resulted from tensile stress rather than compressive or shear stress. Niandou et al. (1997) analyzed the mechanical anisotropy of the Tournemire shale, and Kuilaa et al. (2011) studied the stress anisotropy and velocity anisotropy in low porosity shales and the relationship between them. Tavallali and André (2010) analyzed the effect of layering on tensile strength, fracture length, and energy dissipation in a sandy slate. Josh et al. (2012) discussed the shale gas blocks in foreign countries, the results of which showed that there were different degrees of anisotropy in the microstructure, sonic logging data, electrical parameters, and mechanical properties of shale. Cho et al. (2012) studied the anisotropy of the elastic parameters and strength of shale by conducting uniaxial compression tests and the Brazilian test at different angles. Heng et al. (2014) and Hou et al. (2017) conducted direct shear tests on a shale at different angles and analyzed the causes of shear strength anisotropy. Shen and Zhao (2017) conducted the combined effect of symmetrical normal and shear stresses in hydraulic fracturing using the integral-transform method. Based on the characteristics of the reservoirs, Rui et al. (2018) established a coupled flow-stress-damage model of hydraulic fracture propagation with gravels. Although most studies focus on the anisotropy of mechanical parameters and the compressive strength of rock masses, a detailed understanding of the static mechanical properties and damage mechanism of shale rocks is lacking. Therefore, there is a necessity to understand the mechanical properties and damage mechanism in shale so as to optimize fracturing treatment and enhance gas productivity in shale gas reservoirs.
In this study, the experiments of the uniaxial and triaxial compression from the Longmaxi Formation shale in southern Sichuan Basin, China were conducted to understand the mechanical characteristics and damage modes of shale under different conditions. The effects of mineral composition on the mechanical properties of shale were analyzed, and the deformation and stress–strain characteristics of shale were discussed, respectively. Furthermore, based on the internal cracks and stress evolution process, the fracture characteristics and damage mechanism were determined. These results can provide the necessary parameters and theoretical basis for developing hydraulic fracturing design and increasing borehole stability during the development of shale gas reservoirs.
Experimental materials and methods
Experimental samples
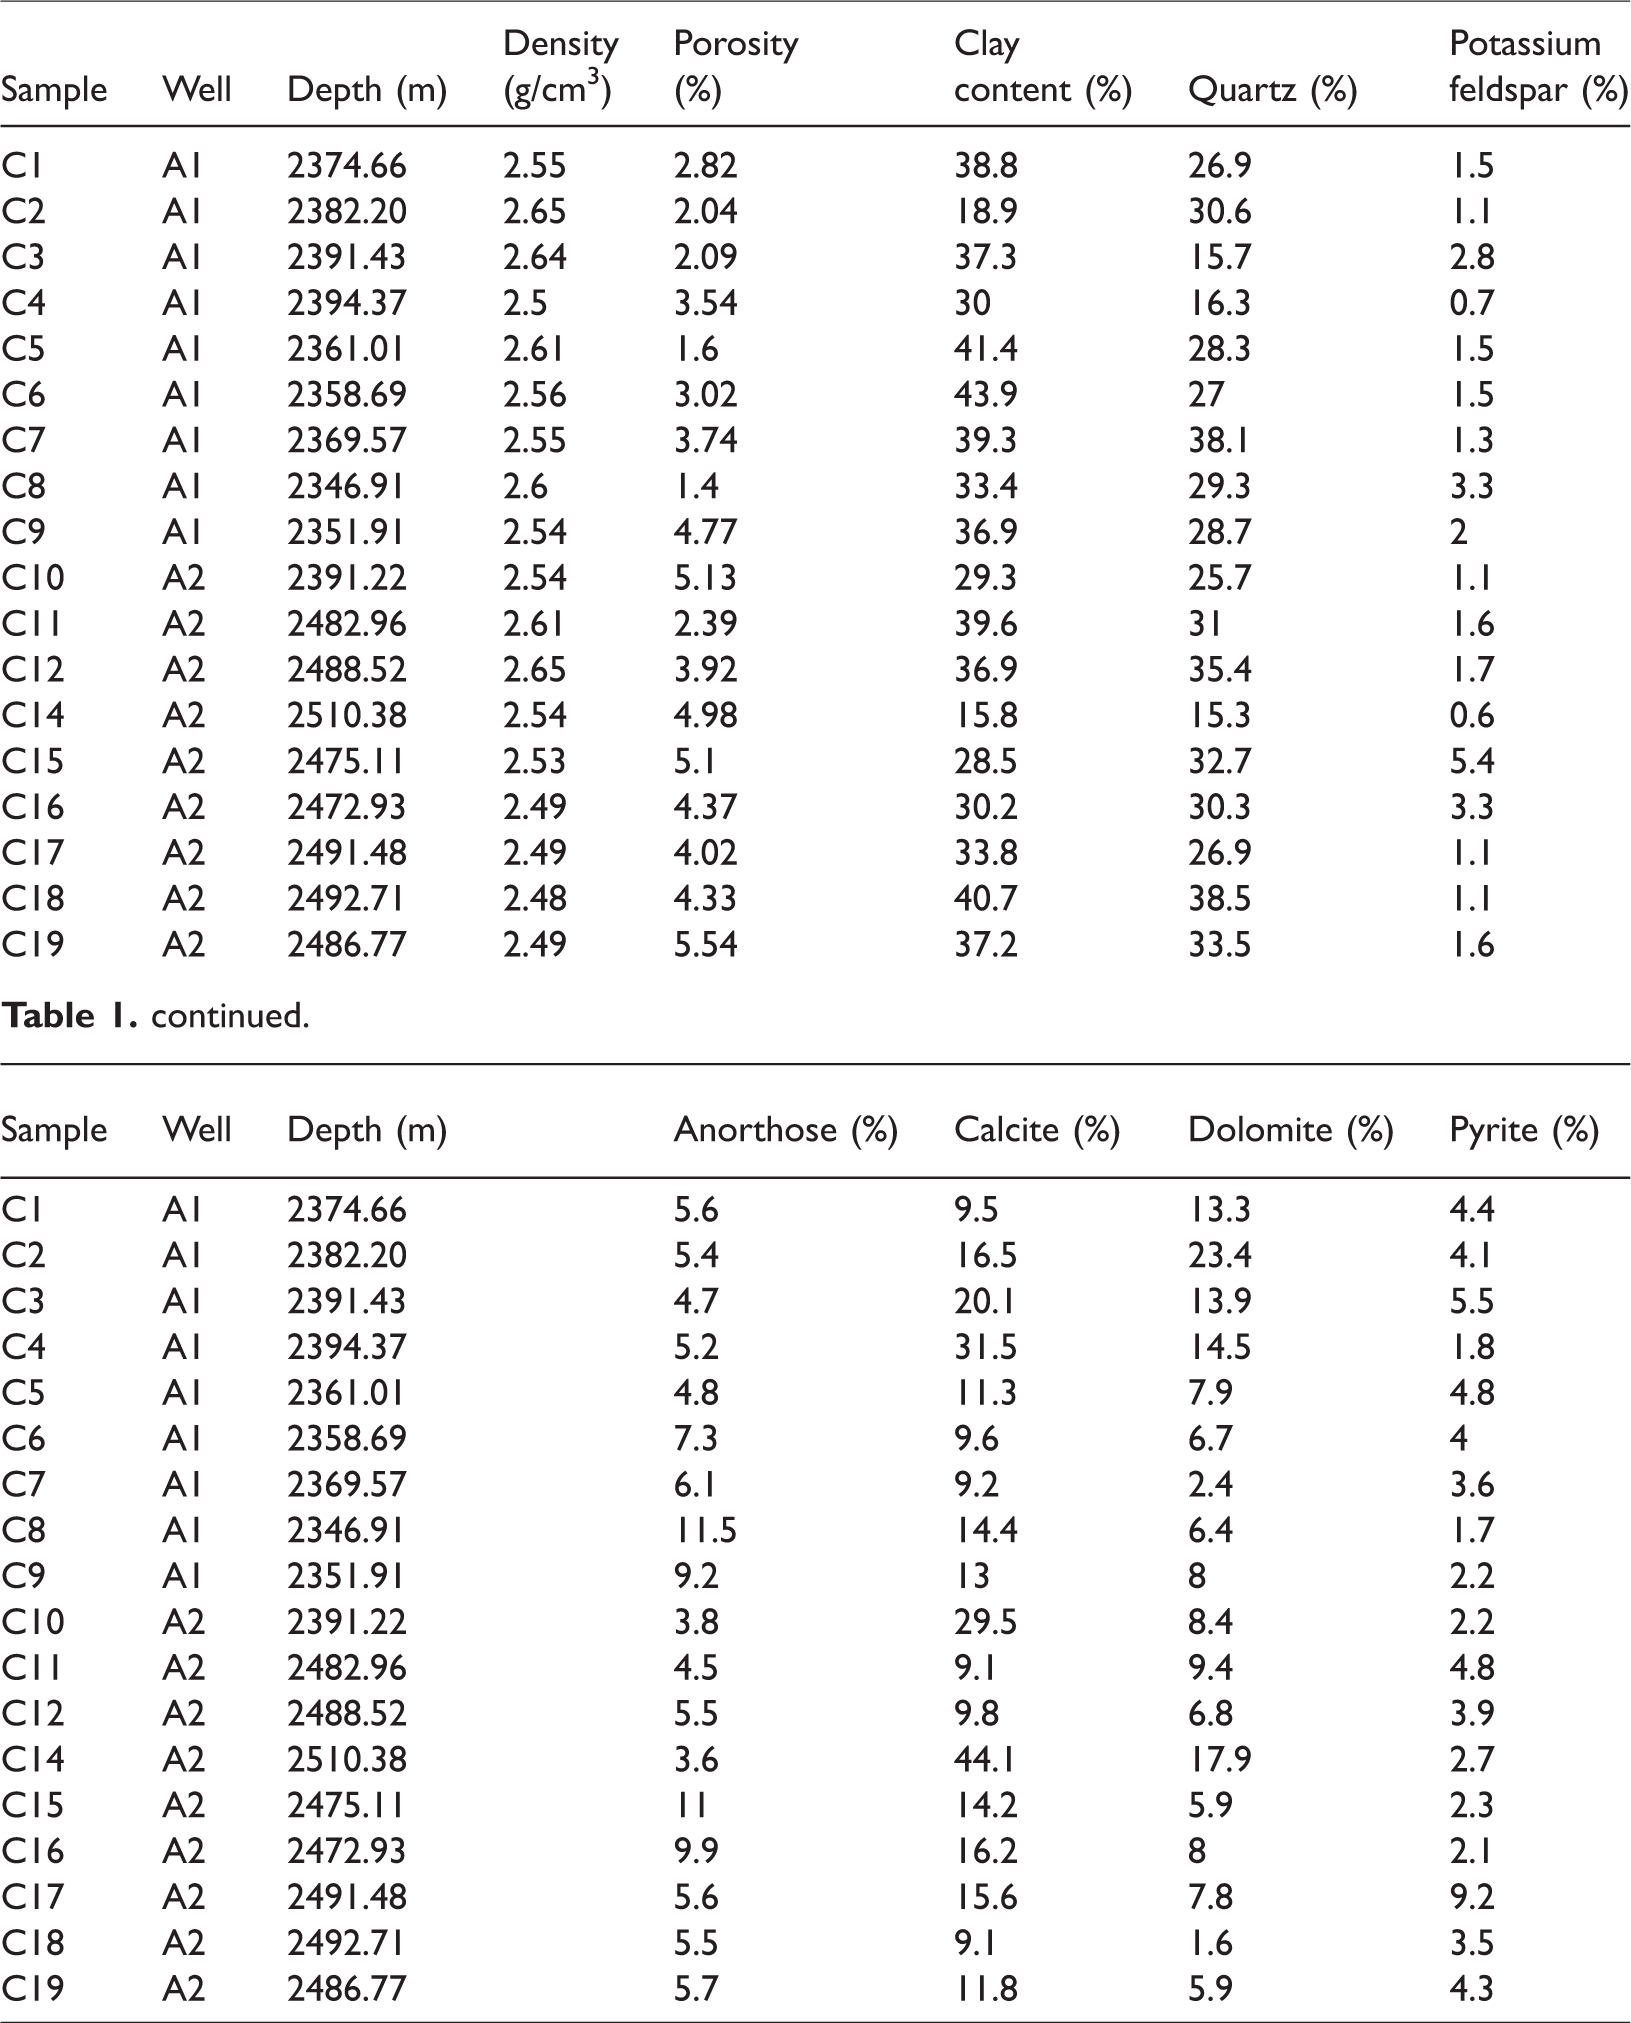
In this study, shale samples were collected from various shale wells within the Longmaxi Formation in southern Sichuan Basin, China, which ranged from 2346.91 to 2510.38 m. First, to prevent mineral dehydration of the clay due to damage of the rock skeleton, the shale samples were uniformly dried in an oven at 70°C for 48 h to achieve a “relatively” dry condition (the samples contained only crystal water and clay-bound water), and the dried shale was placed in a moist, open air space for over 24 h to obtain “dry” samples containing about 2–3% moisture. Due to the low-porosity and low-permeability of shale reservoirs, it was difficult to obtain accurate results using conventional porosity and permeability measurement. After obtaining the mineral components of shale and their mineral compositions using XRD, the equivalent particle density of the shale can be determined. Based on the density of the dry shale, the porosity (total porosity) of shale samples can be computed more accurately. To accurately measure the anisotropic characteristics of shale samples, these samples were cut into cylinders along the parallel bedding (perpendicular to the symmetry axis), along the vertical bedding (parallel to the symmetry axis), and at a specific angle to the symmetry axis (usually greater than 30°). All samples were cut to a diameter of 25.4 mm at a height of 40–55 mm with a polishing slope at both ends of less than 0.05 mm.
Experimental methods
In this study, the MTS815 program-controlled servo testing experiment system is shown in Figure 1, and the system had an extremely rigid loading frame, a stable computer control, and high precision sensors. So it can be used to control the loading speed of the axial load, axial displacement, and hoop displacement, and the control mode can be arbitrarily changed during the experiment. The axial pressure was controlled using the axial servo control devices, including the four-channel measuring instrument containing the force sensor, displacement sensor, axial deformation sensor, and radial deformation sensor. The lateral pressure was controlled by the pressure chamber, the lateral hydraulic source, the supercharger, and the lateral servo control device. The longitudinal and transverse deformations of shale samples were measured using a three-dimensional extensometer. During the experiment, the confining pressure was determined in advance, and then the axial pressure was gradually applied until shale samples became damaged. The recording system automatically recorded the curves of the relationship between the force (P), the longitudinal strain (ε1), and the transverse strain (ε3) of shale samples under various confining pressures. According to the geometry of shale samples, P–ε1 (ε3) was converted to (ε1–ε3)–ε1 (ε3), and then the corresponding (ε1–ε3), ε1, and ε3 were used to plot the stress–strain curve of shale samples. The fracture strength of shale samples features below, and (ε1–ε3) is the maximum value on the stress time–history curve (ε3 = 0 in the case of uniaxial conditions). The secant Young’s modulus E50 of shale samples was defined as the ratio of stress to strain corresponding to a fracture strength of 50%, and the average elastic modulus Eav was defined as the slope of the straight line of the relationship between stress and longitudinal strain. The corresponding Poisson’s ratio (υ50) was defined as the ratio of the transverse strain to the longitudinal strain.
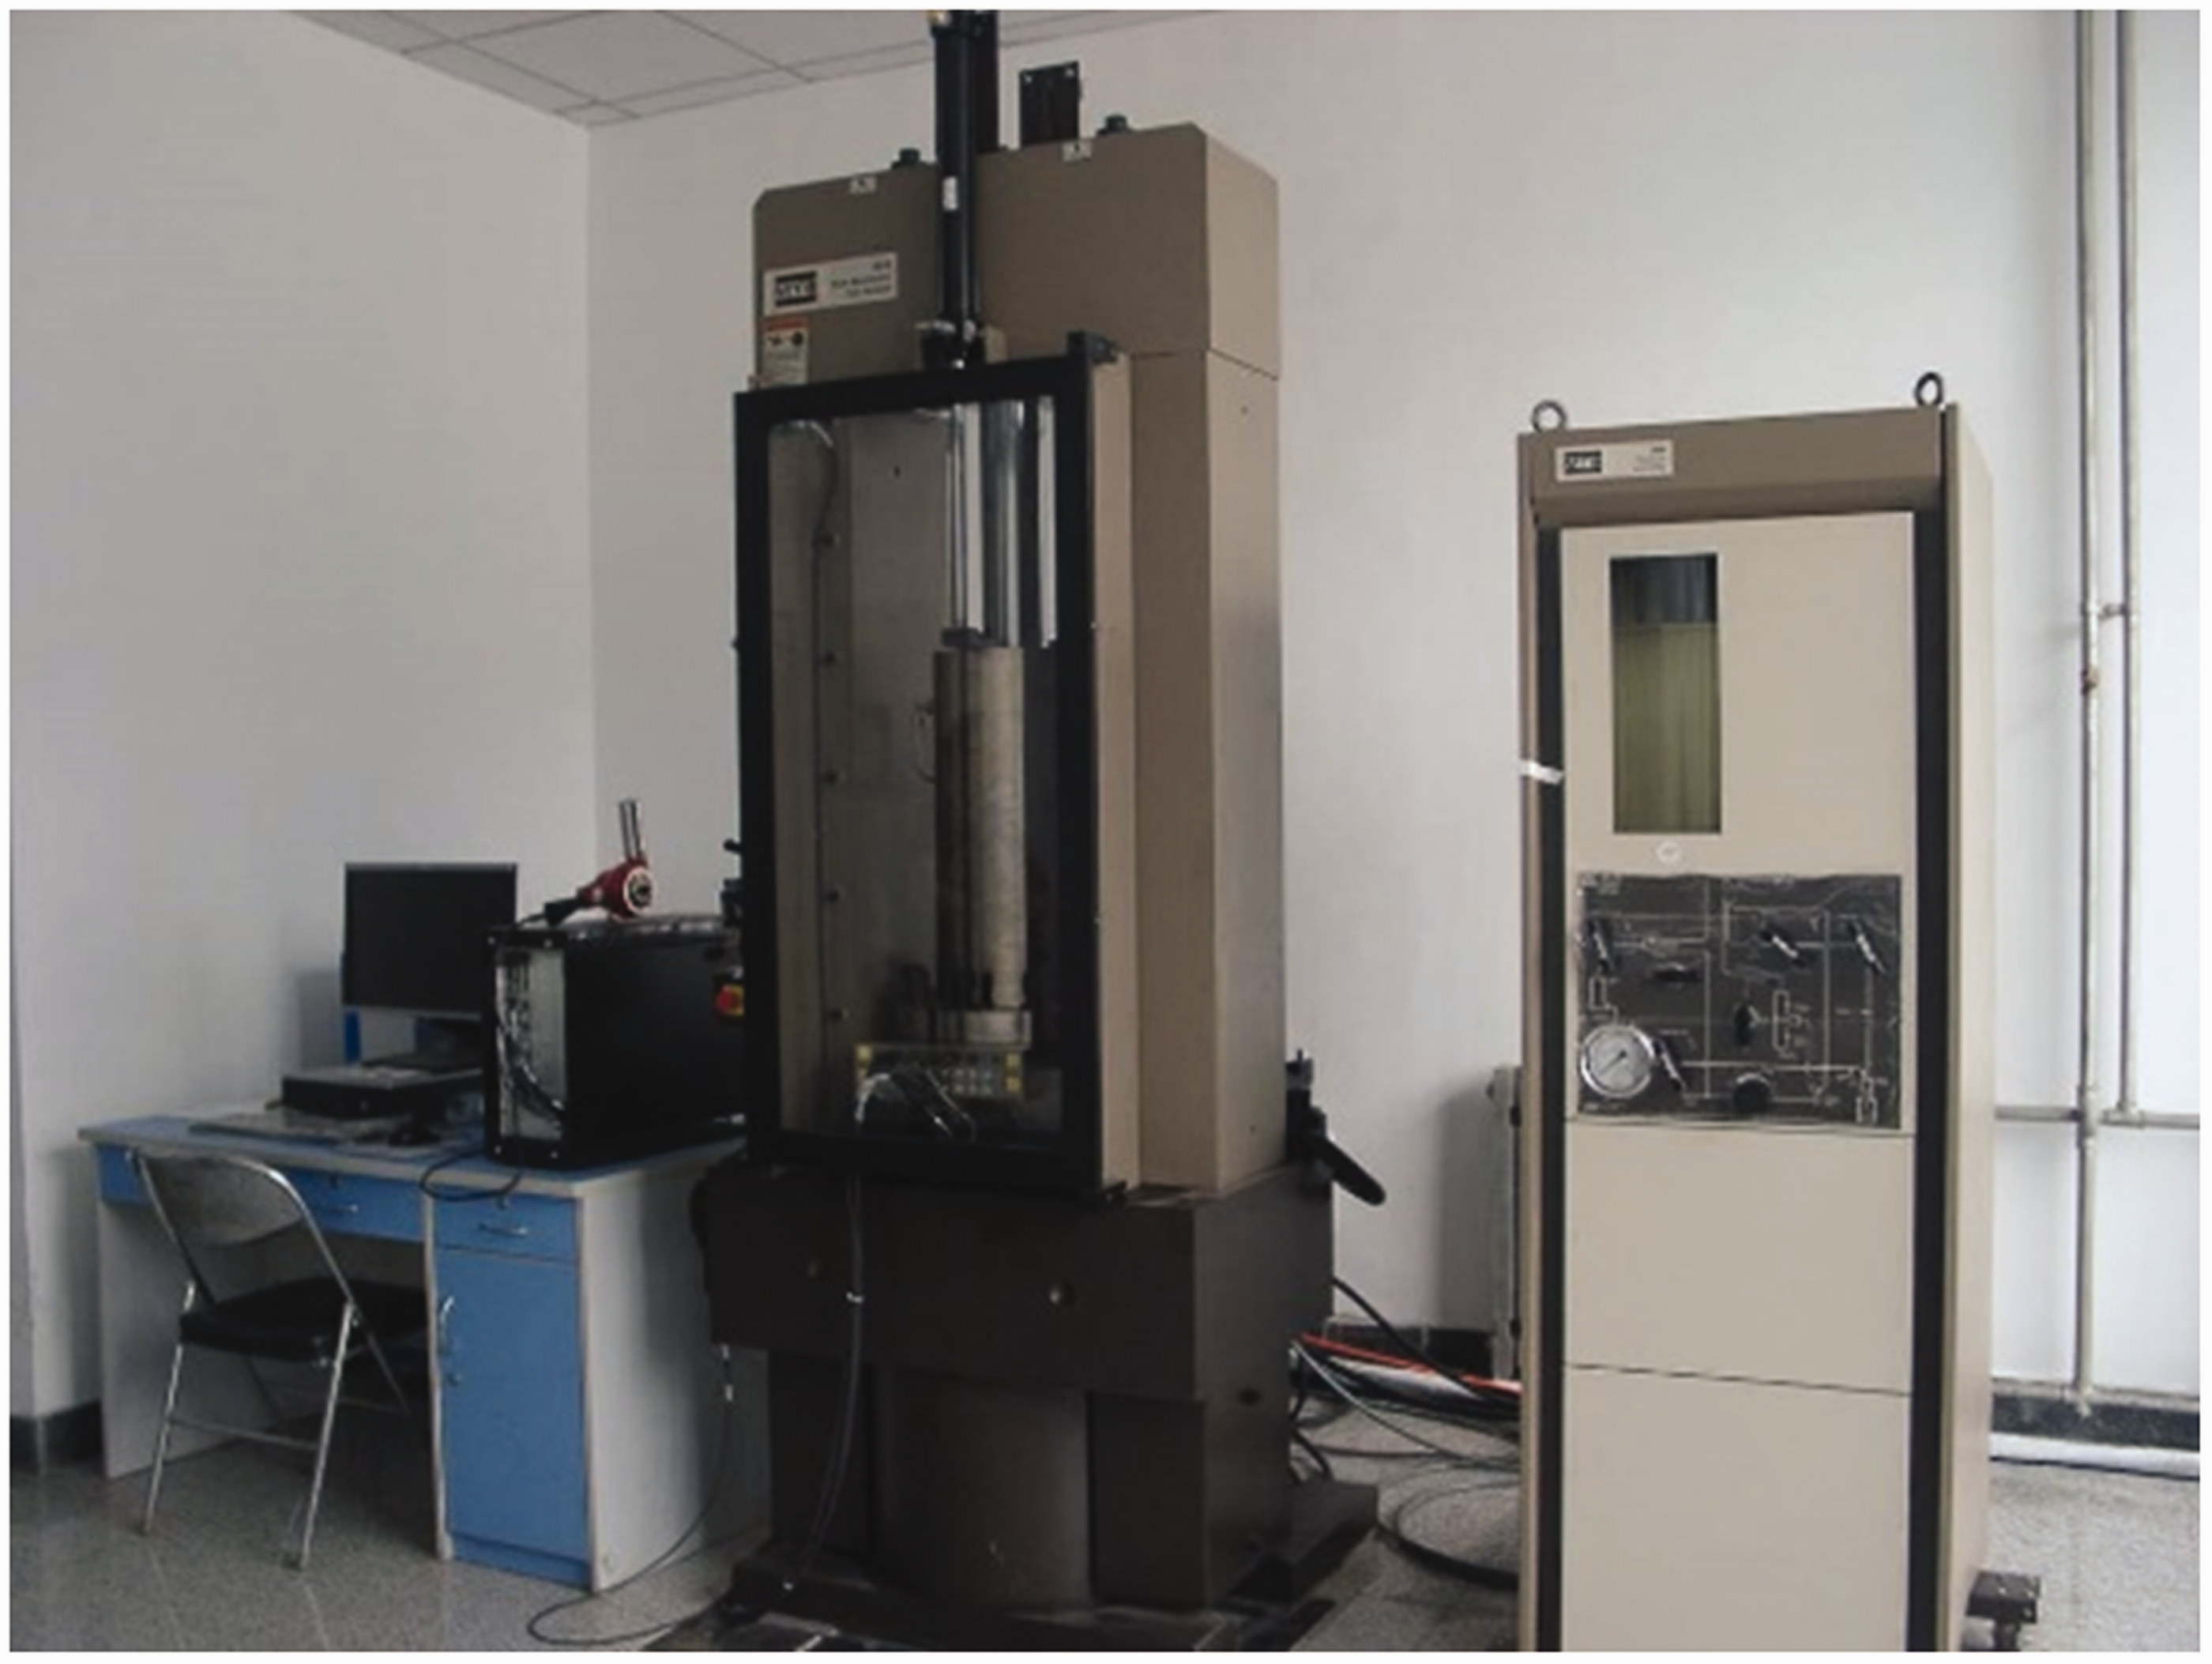
MTS815 experimental device system.
In this experiment, four different lateral pressures (20, 30, 40, and 50 MPa) were applied to each sample. The lateral pressure of each level was kept constant, and the axial stress was applied at a loading speed of 0.5 MPa/s until 120 MPa was reached. Then the axial stress was decreased to 1 MPa at the same speed to complete the first loading and unloading cycle. A lateral pressure of 30 MPa at the second level was applied with the lateral pressure kept constant, and the axial stress was applied at a loading speed of 0.5 MPa/s until 120 MPa was reached. After this, the axial stress was decreased to 1 MPa at the same speed to complete the second loading and unloading cycle. Similarly, the third loading and unloading cycle of 40 MPa of lateral pressure and the fourth loading and unloading cycle of 50 MPa of lateral pressure were performed, and finally the damaged samples were removed and examined. The axial stress, axial strain, and hoop strain of the samples were automatically recorded by a computer, and the experimental temperature was controlled at a room temperature of 20°C. During the experiment, the hydraulic oil in the pressure chamber was heated to a set value by a heating device, and then it was kept at this temperature for 2 h to ensure uniform heating of the samples before applying the confining pressure and axial pressure. The axial and transverse deformations of the samples under axial pressure at various temperatures and confining pressures were automatically recorded by the triaxial apparatus.
The method for determining the strength and deformation of the samples at different temperatures and confining pressures was the same as the method to conduct the rock triaxial experiment at room temperature, which was with the pore pressures of 5, 10, 15, and 20 MPa. In this experiment, the confining pressure was first applied, and then the pore pressure and the axial pressure were applied successively. During the vertical loading process, the pore pressure was applied to the top of the samples through the water inlet device of the triaxial apparatus, and the micro-fractures and pores of the shale were constantly changing. A constant pore pressure was applied to the samples through the pore pressure servo machine, and the triaxial apparatus was used to automatically record the axial and transverse deformations of the samples under axial pressure, pore pressure, and confining pressure. The method for determining the strength and deformation of the samples under different pore pressures and confining pressures was the same as that of the rock triaxial experiment at room temperature.
Results and discussion
Shale mineral composition
The shale samples used in this study were obtained from Well A1 and Well A2 in the Wufeng–Longmaxi Formation in southern Sichuan Basin, China, and Table 1 lists the results of the X-ray diffraction whole rock analysis. As shown in Figure 2, the shale consists of 4 lithofacies combinations (classes) and 16 lithofacies (sub-classes) according to the tertiary siliceous minerals (quartz + feldspar)–carbonate minerals–clay minerals diagram. When the siliceous mineral content is greater than 50%, the shale samples are a combination of various siliceous shale facies, and when the carbonate mineral content is greater than 50%, the samples are a combination of various carbonaceous shale facies. When the clay mineral content is greater than 50%, the samples are a combination of clayey shale facies, and when the siliceous, carbonate, and clay mineral contents are between 25 and 50%, the samples are a combination of mixed shale facies. As illustrated in Figure 2, the above four combinations of shale facies can be further divided into 16 shale sub-lithofacies demarcated by contents of 25, 50, and 75% of the three end members. By projecting the siliceous, carbonate, and clay mineral contents of the samples onto the tertiary diagram, eight sub-lithofacies were primarily present in the study area: a siliceous shale facies (S), a mixed siliceous shale facies (S-2), a siliceous shale facies containing clay (S-3), a mixed shale facies containing ash/silica (M-1), a mixed shale facies containing clay/silica (M-2), a mixed shale facies (M), a clayey shale facies containing silica (CM-1), and a mixed shale facies containing clay/ash (M-3). As can be seen from Figure 2, most shale samples belong to the siliceous shale facies containing clay (S-3), the mixed shale facies containing clay/silica (M-2), and the clayey shale facies containing silica (CM-1), while only four samples belong to the carbonaceous shale facies. The clayey shale facies containing silica are mainly distributed in local parts of the Wufeng Formation and the main gas-bearing section in the lower part of the Longyi Section where the siliceous mineral content is 51.58% on average, the clay mineral content is 29.21%, the carbonate mineral content is less than 25%, and the total organic carbon (TOC) is 3.01%. The core is mainly black with lamellation development, and some of the layers are stratified, in which pyrite nodules can be found. The high organic matter content of these lithofacies indicates that the siliceous minerals contribute significantly to the organic matter enrichment, and the generation of siliceous minerals may be related to biological activity. Mixed shale facies containing clay/silica are mainly developed in the middle of the Longyi Section, which has an average of clay mineral content of 43.28%, an average siliceous mineral content of 39.29%, an average carbonate mineral content of less than 25%, and an average TOC of 2.08%. Clayey shale facies containing silica are mainly developed in the upper part of the Longyi Section, which has an average clay mineral content of 56.53%, an average siliceous mineral content of 34.52%, an average carbonate mineral content of less than 25%, and an average TOC of 1.59%. Compared with the facies distribution characteristics of typical shale gas regions in other countries, the mineral composition of the shale in the study area is similar to that of major gas-producing basins in other countries (Hackley and Cardott, 2016; Sayed et al., 2017). The projection points of the high-quality shale mostly fall within areas with a high silica content. The difference is that the proportion of mixed carbonaceous shale facies is relatively small in China, whereas, in some typical examples of other countries, the facies account for a larger proportion.
Mineral composition of the Wufeng–Longmaxi Formation.
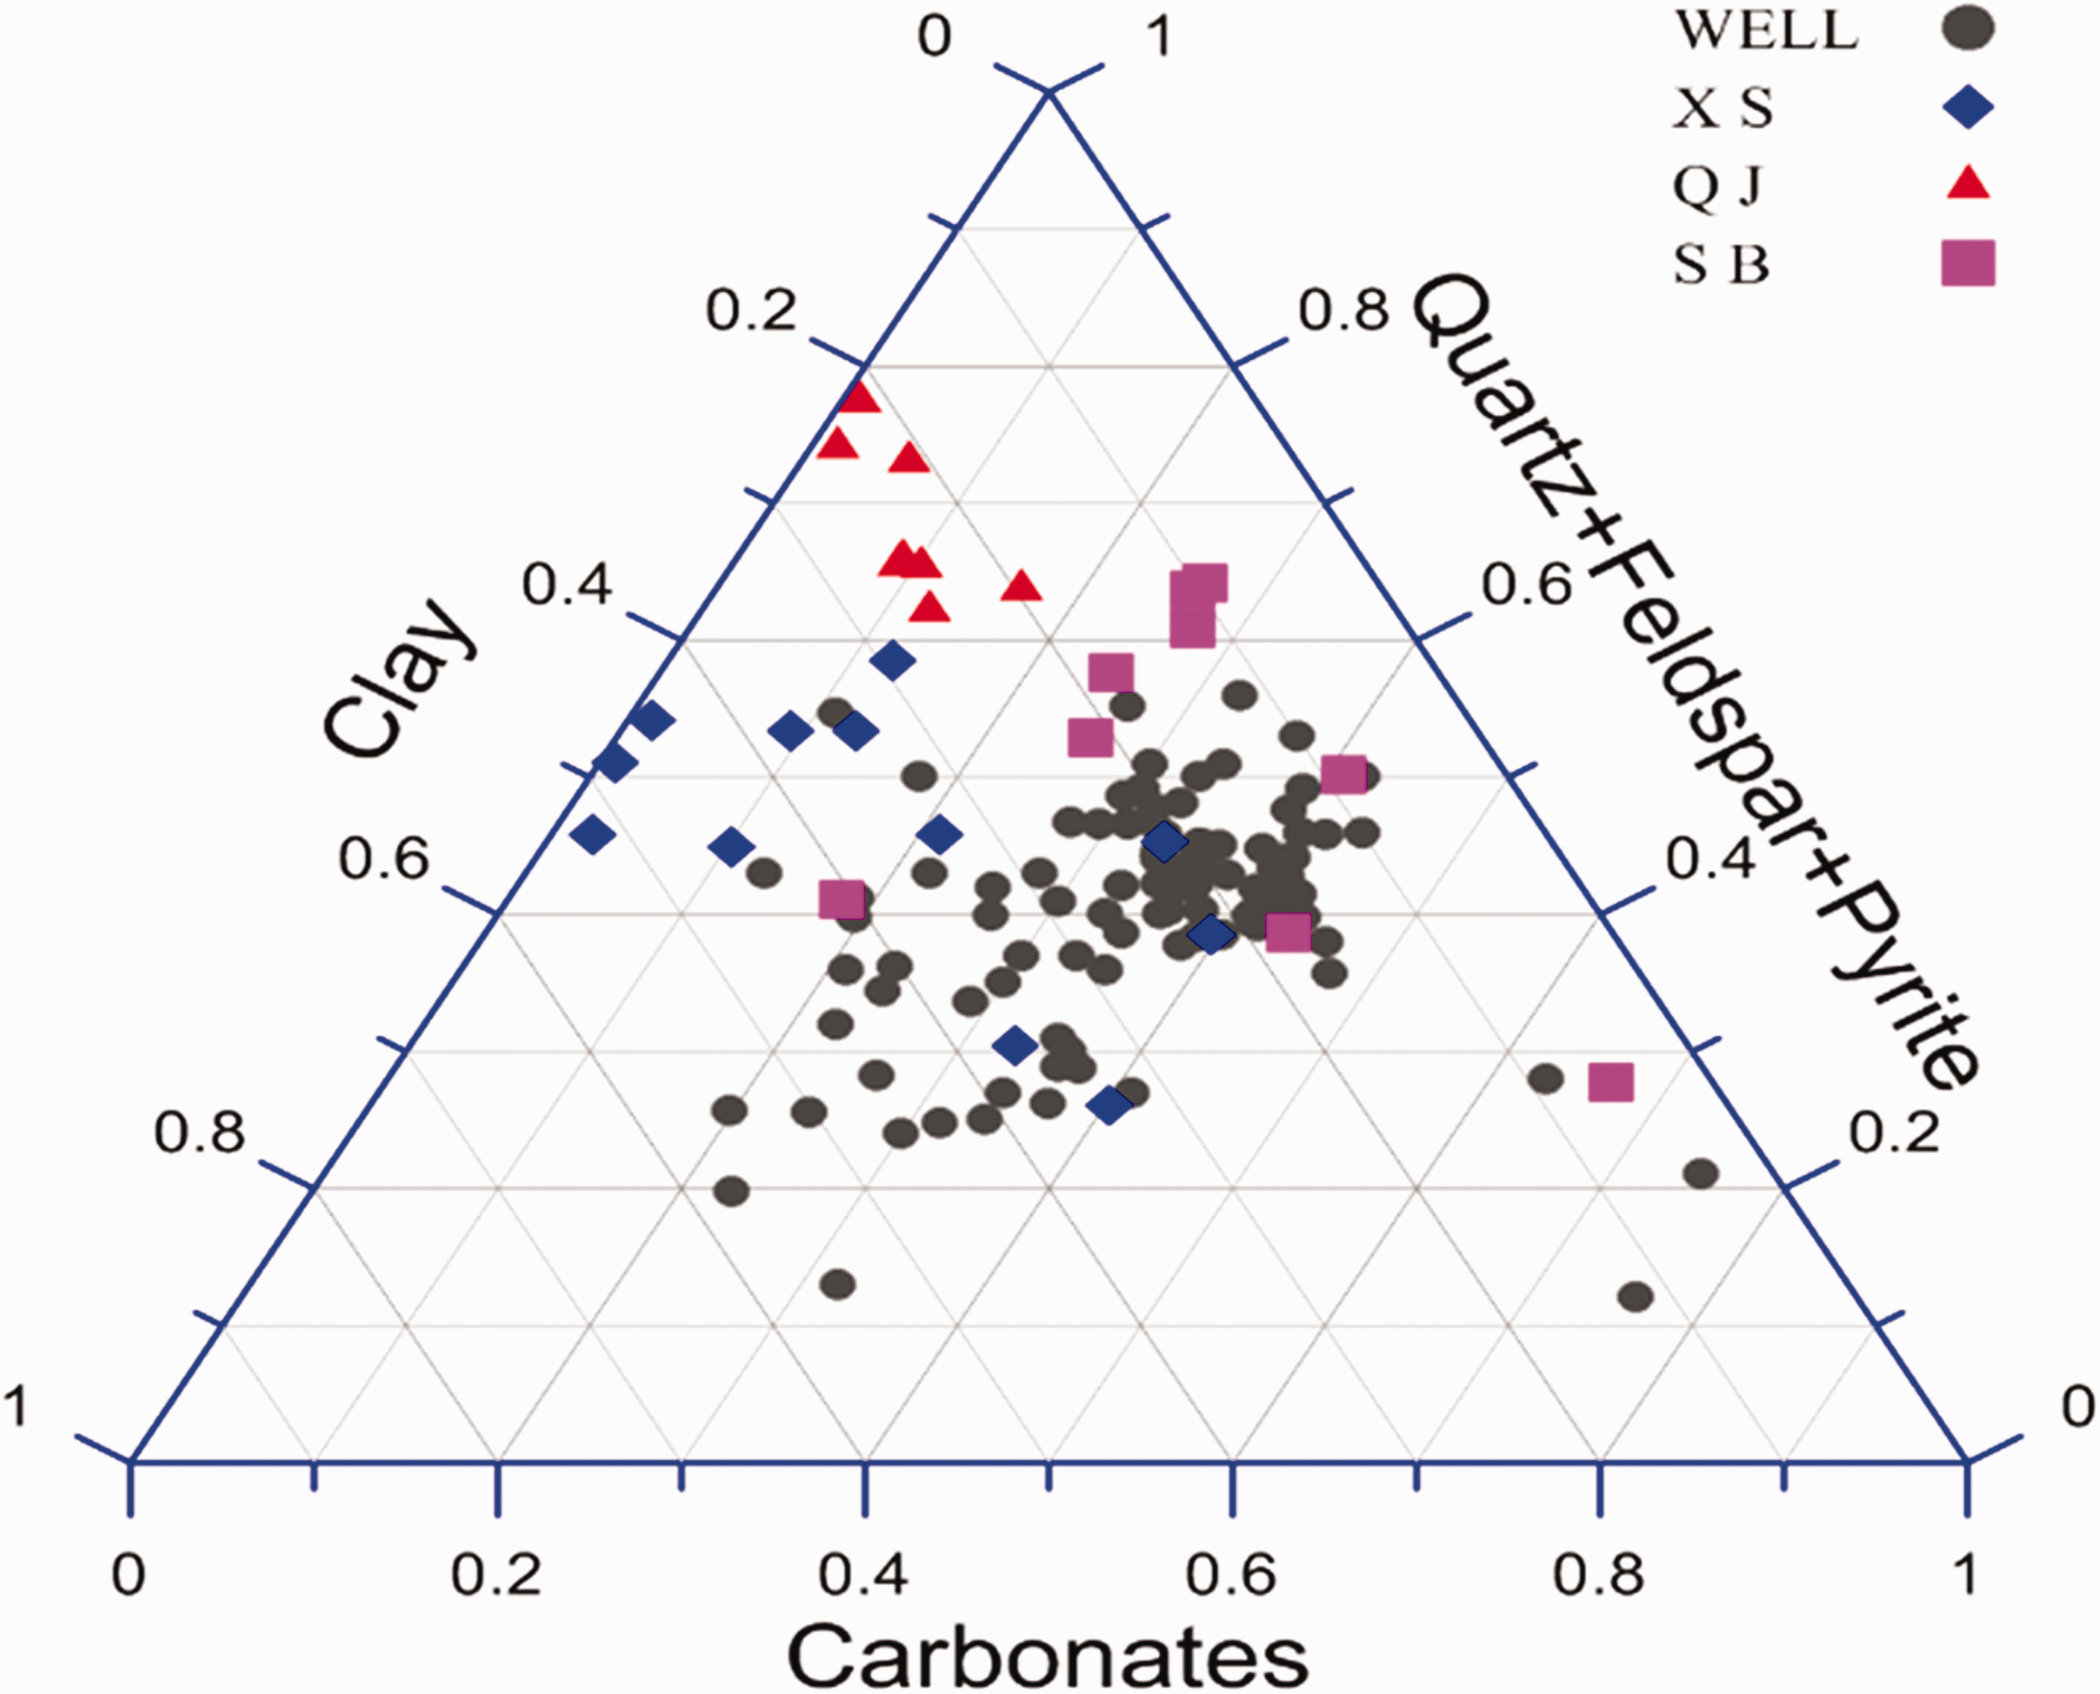
Mineral composition triangle of gas shales.
Different types of lithofacies indicate different sedimentary environments. The siliceous shale facies containing clay (S-3) is rich in algae, radiolarian, and organic-rich shale, and the development of pyrite indicates an oxygen-deficient reducing environment. Both the organic carbon content and the silica content of the mixed shale facies containing clay/silica (M-2) are lower, which indicates a transition from the previously strongly oxygen-deficient environment to a weakly reducing environment. The clayey shale facies containing silica (CM-1) is mainly present in the upper part of the Longyi Section, where both the organic carbon content and the silica content are relatively low, which indicates that the sedimentary environment is dominated by oxidation-weak reduction.
Deformation characteristics of shale under uniaxial compression
During the uniaxial compression, the compression curve was generally divided into four sections, including the pore compaction section, the stable development section with elastic deformation and micro-fractures, the development section with unstable fractures, and the post-peak strain softening section (Hou et al., 2017; Liu et al., 2018; Lu et al., 2019). Figure 3 shows the deformation characteristics of shale under the uniaxial compression of Peff=20 MPa (σ1 and σ3 are the axial stress and the radial stress, respectively). As can be seen from Figure 3, the first section is the pore compaction section (OA), in which the curve is curved upward and the slope gradually increases, because the primary or open fractures in the shale are gradually compacted. As the micro-fractures close, the slope of the curve increases quickly initially, and then its growth rate gradually decreases. As the modulus of deformation is low during this stage, it is known as the compaction section. Since the shale used in the experiment is relatively complete, it can be seen from Figure 3 that the compacted section is relatively short. The second section is the stable development section, which contains elastic deformation and micro-fracture (AB), where the curve is approximately a straight line, and the initial part of which represents recoverable elastic deformation, while the latter part is locally deflected from being a straight line toward the longitudinal axis because of the micro-fractures and the decreased volume compression ratio. The third section is the development section with unstable fractures (BC). With increasing axial stress, the yield strength of the shale samples in the low and medium-strength parts first decreases, resulting in a redistribution of the stress, which leads to a decrease in the yield strength of other low strength materials. When the peak strength occurs, the samples transition from volume compression to expansion, and the volumetric strain rate significantly increases. The fourth section is the strain softening section (after point C). Once the weakest section of the samples reaches its load-bearing limit, the axial stress decreases and the overall shale samples are weakened. As the axial stress decreases due to axial compression deformation, the yield area of the shale samples gradually increases in the weakest section, while the other positions remain in an unloaded state. The yield after the stress peak only occurs in a localized area, and the bearing capacity of the samples decreases rapidly as deformation increases.
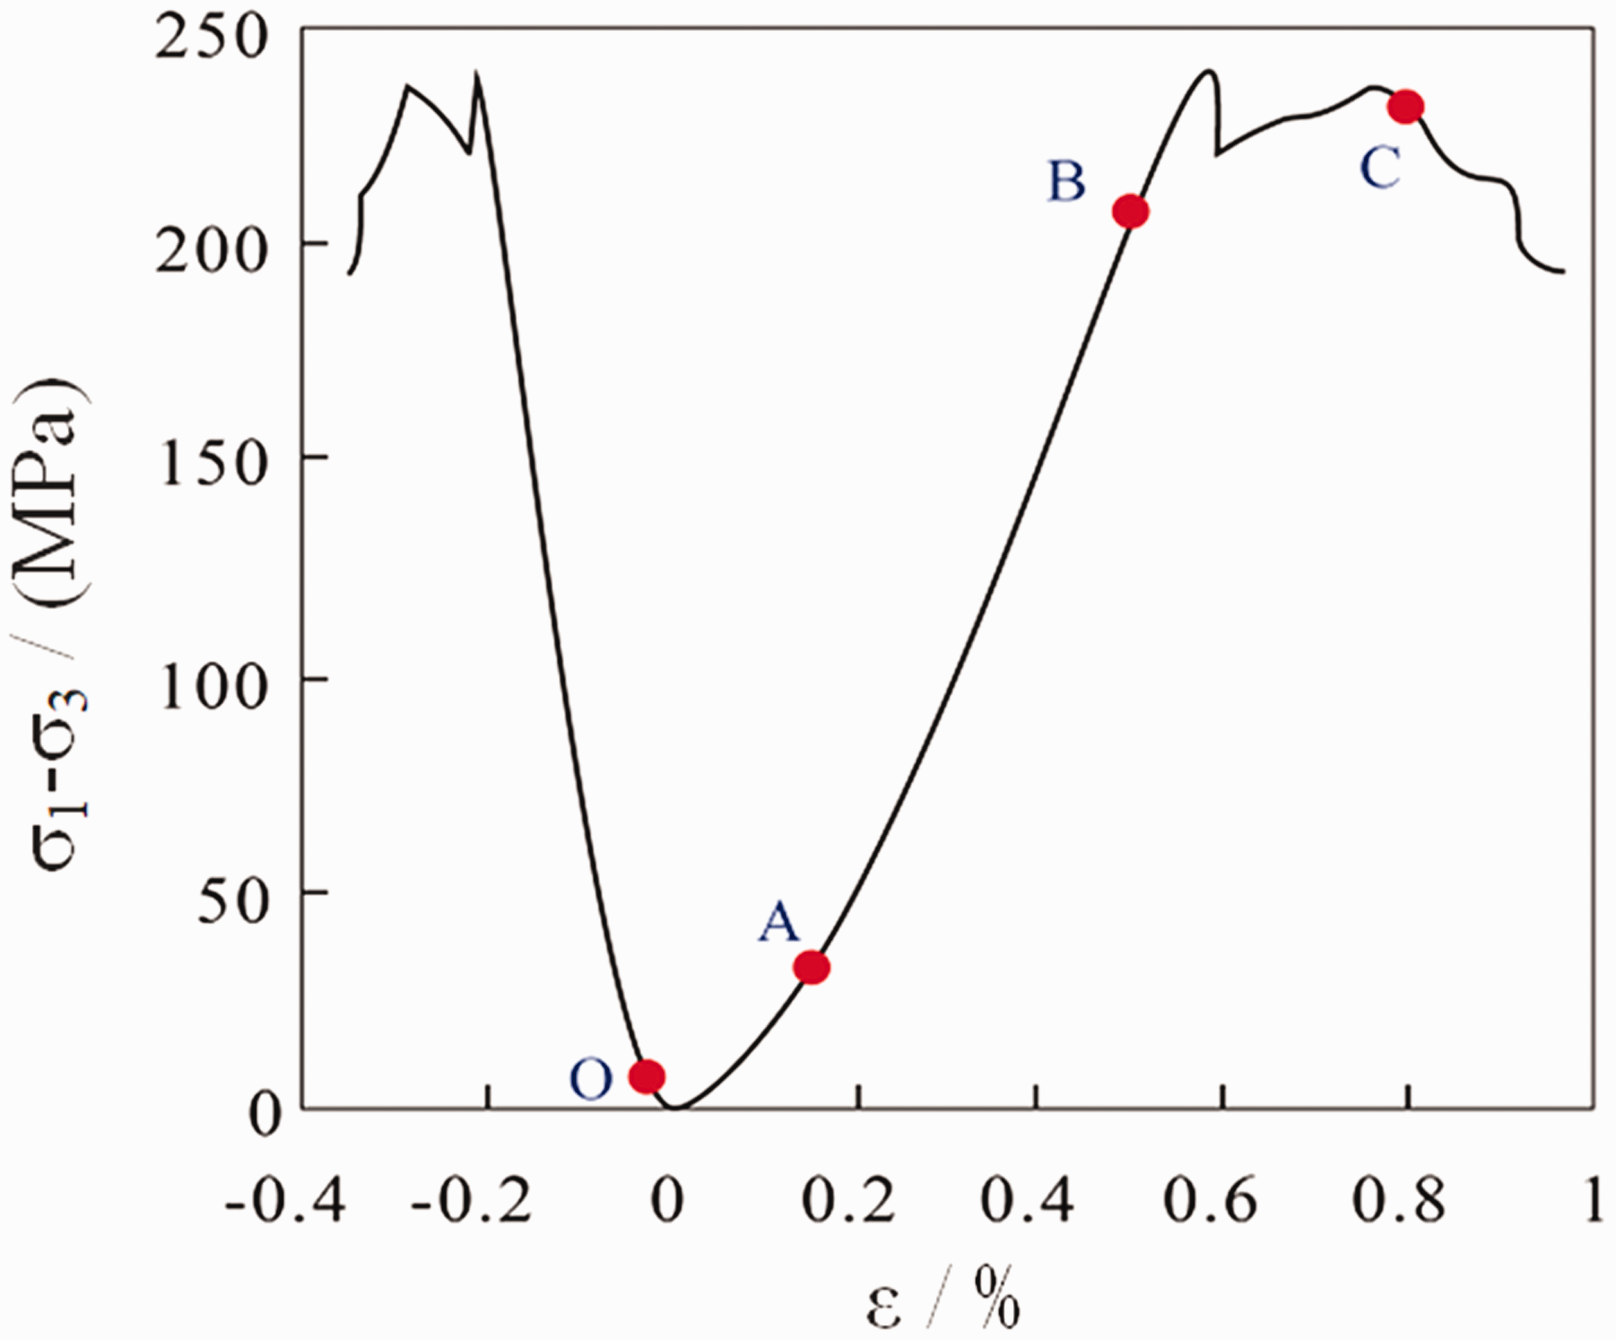
Uniaxial loading stress (σ1–σ3)–strain (ε) curve for shale C8.
In general, the entire process from loading to fracture can be divided into the elastic stage, the inelastic stage (expansion stage), and the post-failure stage (Liu et al., 2018; Lu et al., 2019). Figure 4 shows the typical compression deformation characteristics of shale samples under simulated formation conditions, and the shape of the stress–strain curve can be divided into two types: elastic deformation and elastic–plastic deformation. Sample C2 collected from Well A1 is characterized by elastic deformation, while sample C6 and C11 collected from Well A1 and Well A2 are characterized by elastic–plastic deformation. The stress–strain curve is initially slightly concave upward, and then it becomes approximately a straight line, which is primarily caused by the closure and compression of the micro-fractures and pores of shale. (1) Elastic deformation: As a typical representative of elastic deformation, sample C2 has an approximately linear stress–strain curve. The shale has been primarily affected by elastic deformation, with little or no plastic deformation. The yield point is difficult to identify, the yield stress almost coincides with the strength limit, and the deformation of the stress–strain curve directly enters the fracture stage. (2) Elastic–plastic deformation: Represented by samples C6 and C11, the stress–strain curve consists of an approximately linear elastic deformation stage and a pre-destruction small plastic deformation stage. Some shale samples still have a certain residual strength after failure, which indicates relatively strong plastic deformation. The yield points of most rocks are difficult to determine, the curves of which exhibit continuous transition, and the strength is comparatively low.
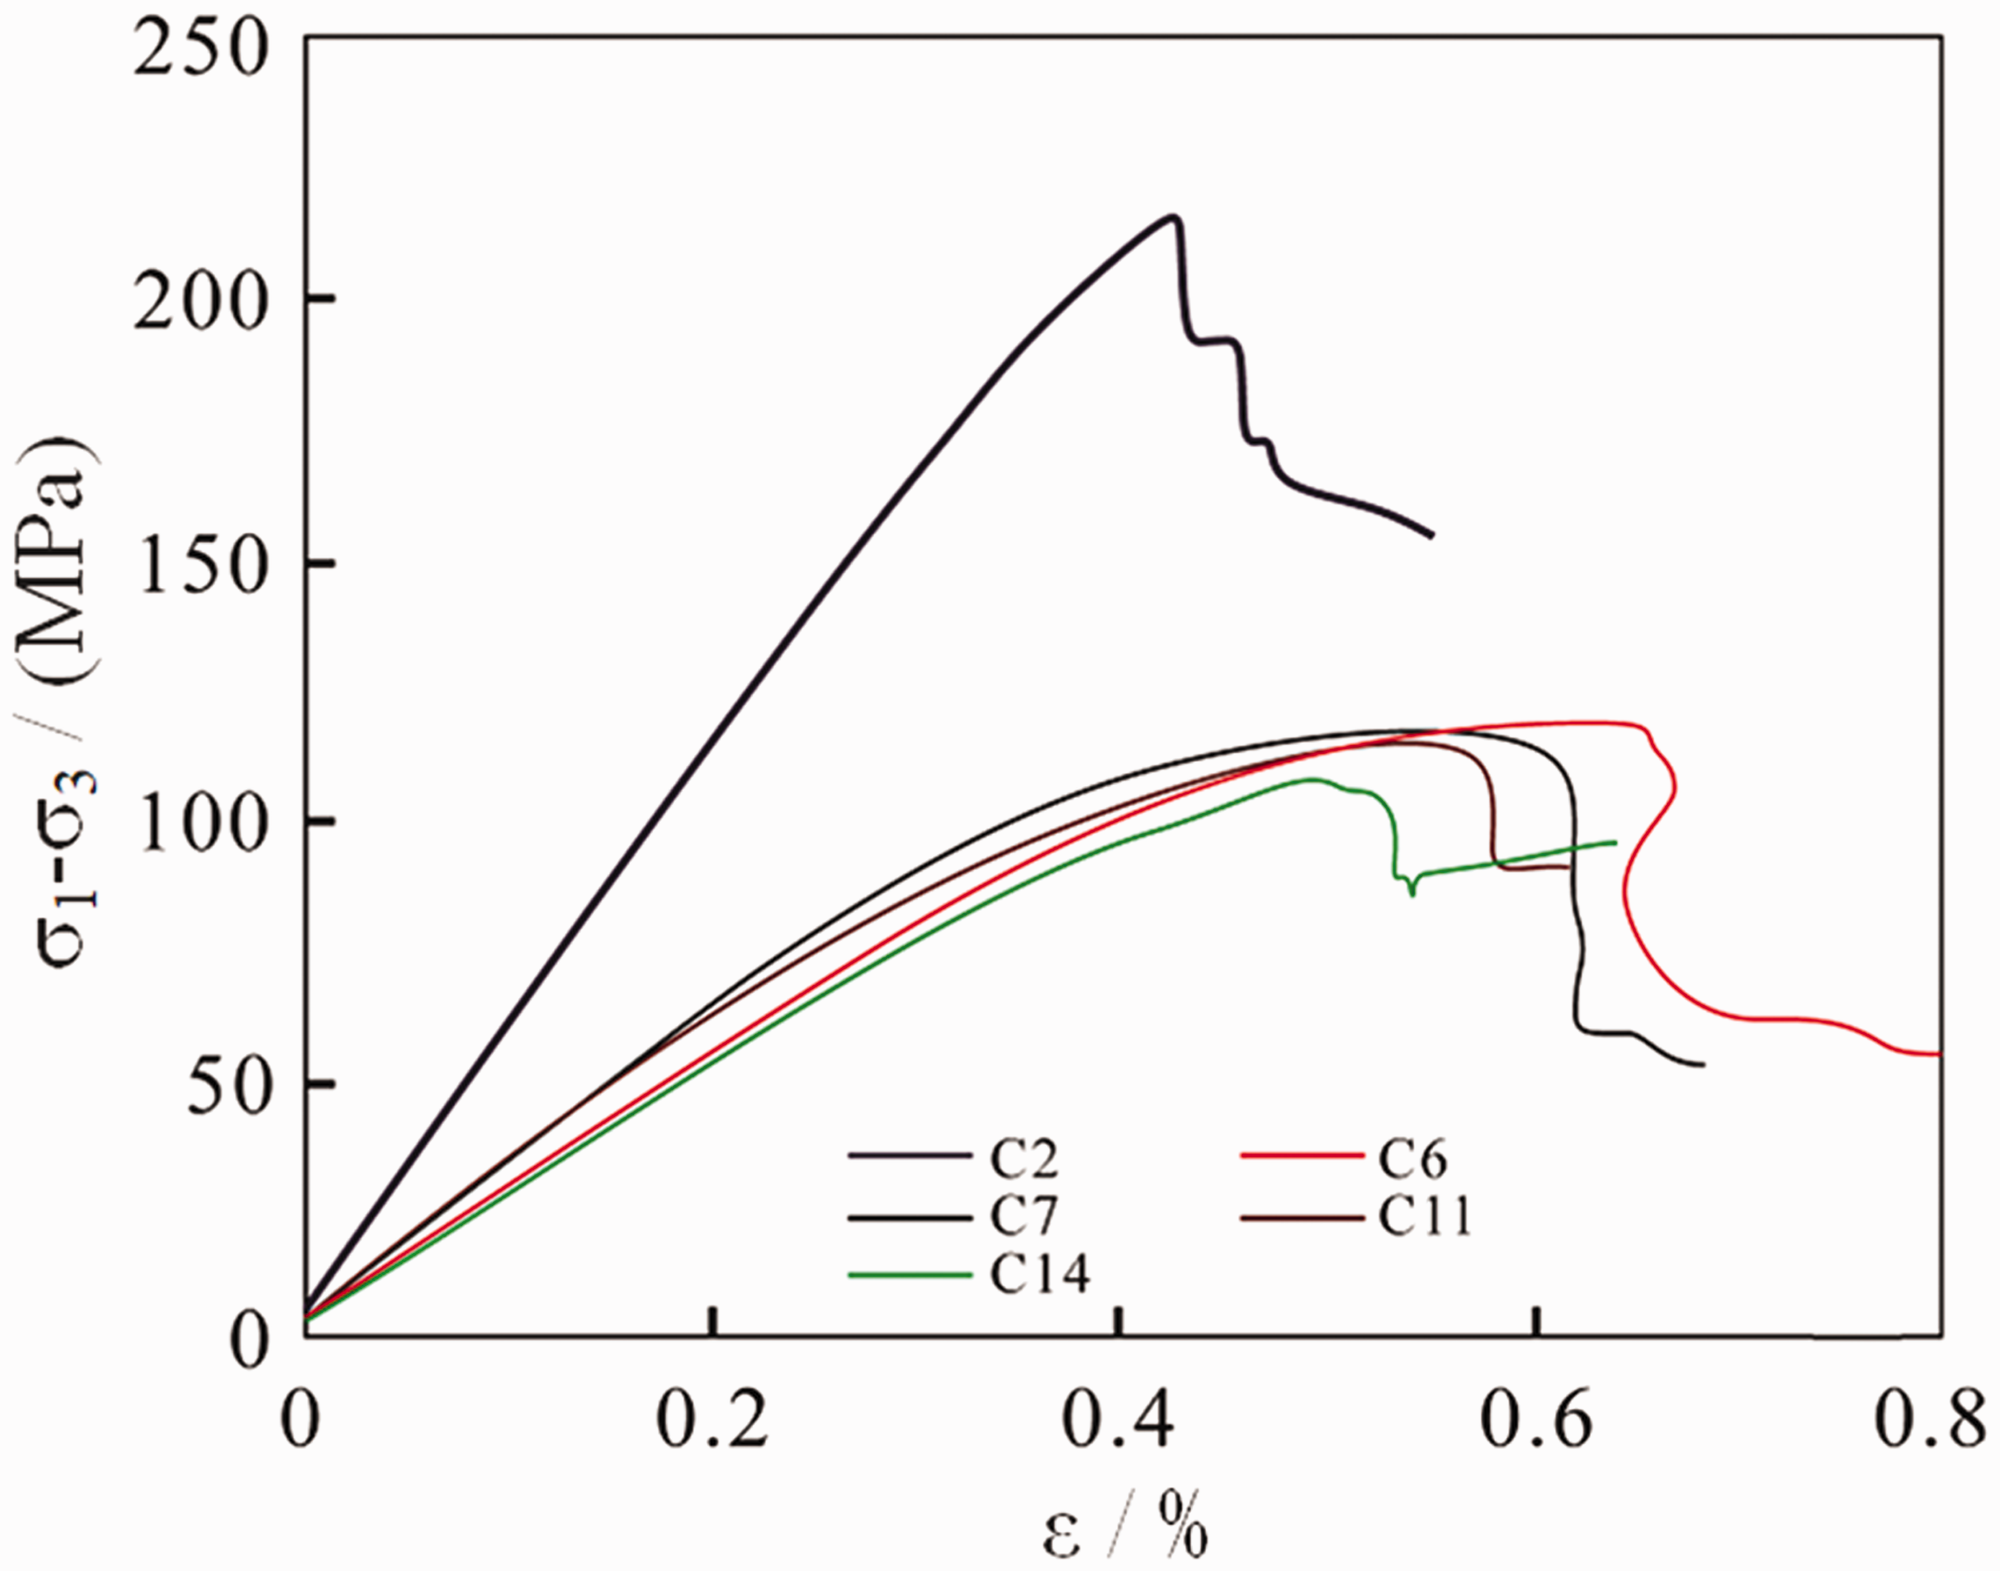
Stress (σ1–σ3)–strain (ε) curves for shale samples.
The brittle plasticity of the shale is divided based on the axial peak strain of the three axes. Brittle failure occurs when the peak strain is less than 1% and brittle ductile failure occurs at a peak strain of 1–5%, while ductile failure occurs when the peak strain is greater than 5% (Sone and Zoback, 2013; Tavallali and André, 2010). Thus, the shale samples used in this experiment are mainly characterized by brittle failure and brittle ductile failure. Under the reservoir condition (Peff=20 MPa, which is the difference between the loading confining pressure and the pore pressure), the average peak strength of the shale samples is 123.9 MPa and the average elastic modulus (Young’s modulus) is 30.9 MPa, and the peak axial strain is between 0.35 and 1.0%. At a low effective pressure, materials with low strength reach their load-bearing limit first and their yield strength decreases, resulting in plastic deformation. When high-strength materials reach their stress peak, as their axial load-bearing capacity decreases, the materials are unloaded because they fail to reach their load-bearing limit, so the plastic deformation of the shale samples does not tend to be uniform. Therefore, with the reduction of the axial load-bearing capacity, further plastic deformation of the shale samples is concentrated on the low-strength materials that have undergone more deformation, thereby localizing the deformation and thus the shale is featured by strain softening. At a high effective pressure, as the load-bearing capacity increases, materials with low strength reach their load-bearing limit first as their yield strength decreases, resulting in plastic deformation. Then the load-bearing capacity of the shale increases with increasing deformation. Hence, we need to continue increasing the axial stress to damage the shale samples. This causes the high strength materials within the shale samples to reach their load-bearing limit, resulting in plastic deformation. Therefore, the decreases in the yield strength and deformation of the materials in the shale samples tend to be uniform, the plastic deformation of the shale samples also increases, and a yield platform appears near the residual strength. When the effective pressure of transformation is reached, all of the materials in the shale sample will yield, resulting in plastic flow, which transforms the shale from brittle to ductile.
As for the transient failure modes of the shale samples caused by triaxial compression under different confining pressures, sample C6 mainly suffers from macro shear failure. By observing the macro-fractures of the shale samples, it can be found that the fracture surface is rough and the shear fracture surface is covered by white powder generated by strong friction. The brittle shale represented by sample C2 suffers from split fractures, while the plastic shale represented by samples C5 and C11 suffers from a single shear fracture. According to the results obtained by mechanical testing of the major shale gas reservoirs in North America and China, the strength and elastic parameters of the shale span a relatively large range, i.e. a compressive strength of 14.8–391.3 MPa, an elastic modulus of 4.9–70.4 MPa, and a Poisson’s ratio of 0.19–0.95. For the same confining pressure, the Barnett shale has the highest average compressive strength and elastic modulus. The Longmaxi Formation shale has the second highest and the Haynesville shale has the third highest, and the Eagle Ford shale has the lowest average compressive strength and elastic modulus. The Longmaxi Formation shale is similar to the Barnett shale in terms of brittleness.
Determining the brittleness based only on the strain of the shale is somewhat limiting. There are more than 20 methods for quantitatively characterizing the brittleness of rocks, which can be divided into three main types according to the differences in the measurement methods. First, the brittleness can be computed based on the difference between the hardness and firmness of the rock (Honda and Sanada, 1956; Parisio et al., 2015; Sone and Zoback, 2013), but this method fails to consider the influence of the loading conditions on brittleness, resulting in some differences between the computed results and the actual situation. Second, the brittleness can be computed based on the mechanical parameters extracted from the static full stress–strain curve of the rock. Since this method can satisfactorily represent the stress and strain characteristics of the brittle failure of rocks, it is the primary approach to computing brittleness. For instance, the normalized average of the Young’s modulus and the Poisson’s ratio can be used to compute the brittleness of rocks. The Poisson’s ratio reflects the initial fracture capacity of the rock under stress, while the Young’s modulus reflects the ability of the fracture to maintain its characteristics. Brittle rocks possess a high Young’s modulus and a low Poisson’s ratio. Third, the brittleness of rocks can be evaluated based on the brittle and plastic mineral compositions of the rock, but this method ignores the influence of diagenesis, which can also lead to differences between the computed results and the actual fracturing results.
Stress–strain characteristics of shale under triaxial compression
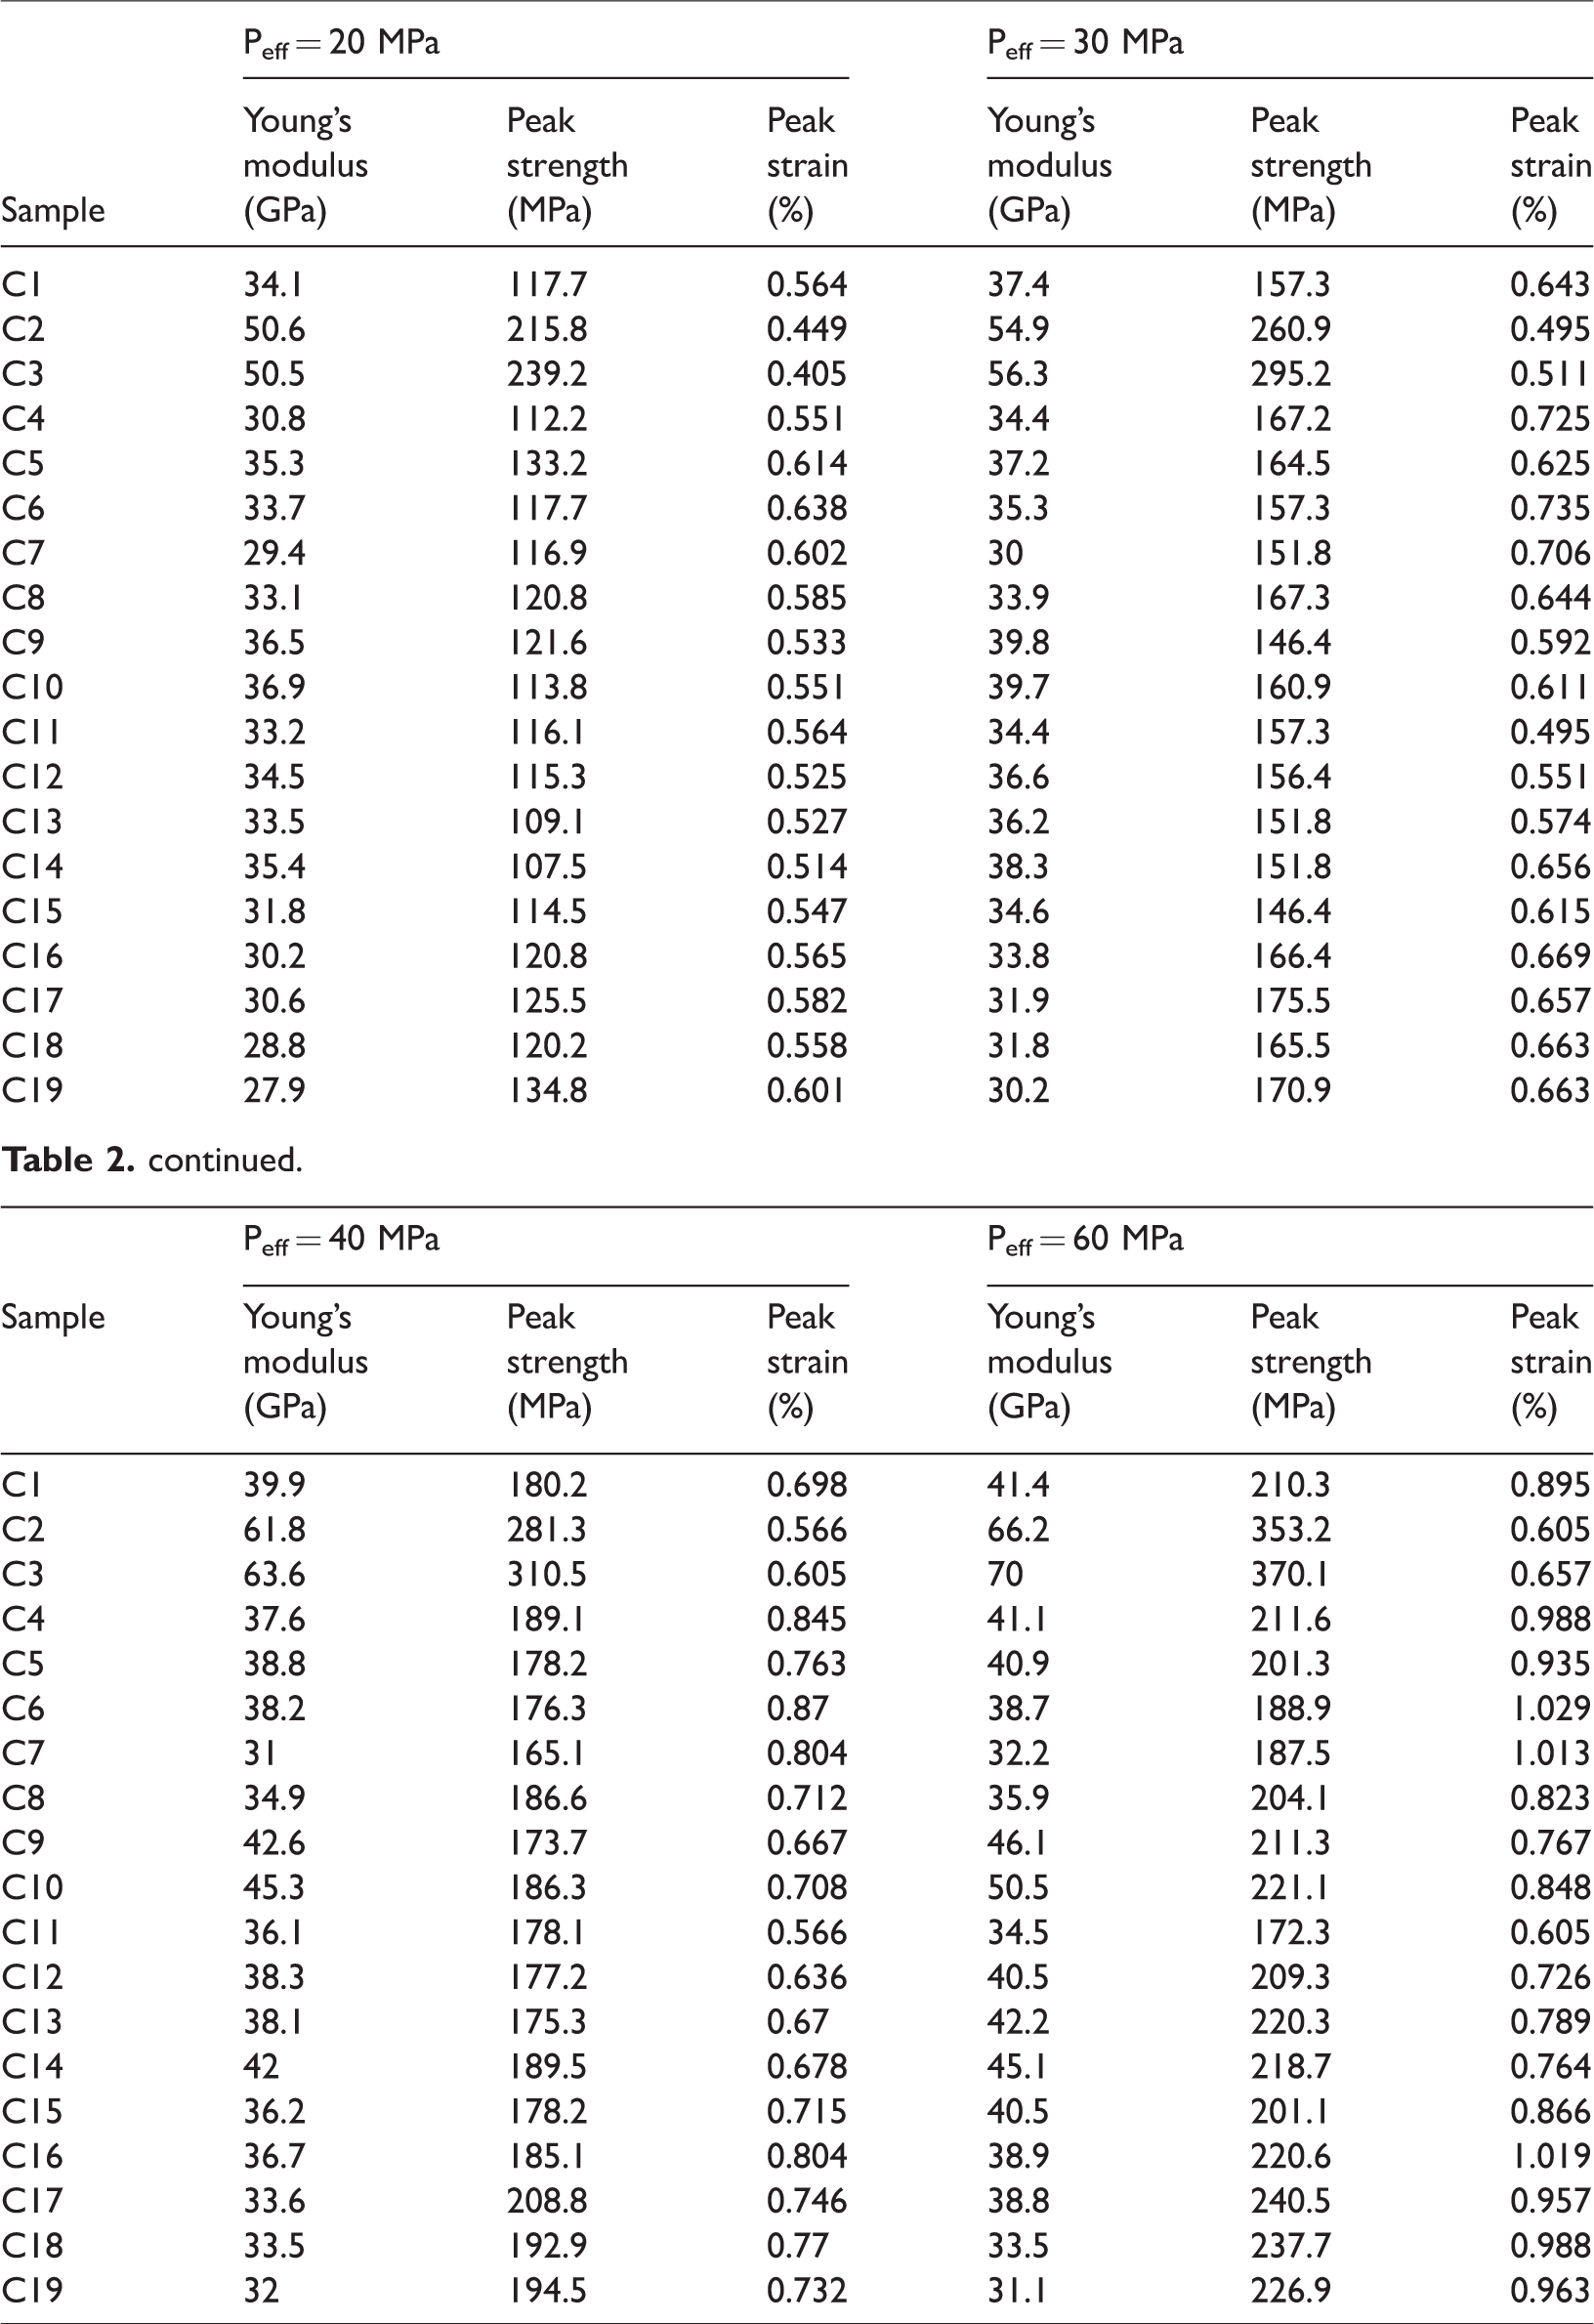
In this study, a conventional triaxial compression experiment was performed on the shale samples. First, hydrostatic pressure was slowly applied to the samples manually to make the three principal stresses equal (σ1=σ2=σ3). Then an appropriate loading rate was set using axial stroke displacement control or force control until the samples were damaged or the displacement limit was reached. During the experiment, the effective pressures were 20, 30, 40, and 60 MPa, respectively, and the experimental results are listed in Table 2. The stress–strain variation curve is illustrated in Figure 5, as the confining pressure increases, the yield stress and the peak strength of the shale gradually increase, and there is a significant difference in the effective pressure of the yield platform after the post-peak deformation of the different shale samples. For a shale sample with strong rigidity, e.g. sample C2, the weak post-peak yield platform appeared when the effective pressure reached 60 MPa, showing weak plastic flow. For most shale samples from the Longmaxi Formation, e.g. samples C11 and C6, when the effective pressure reached 30 MPa, a relatively obvious post-peak yield platform appeared, featuring an obvious plastic flow and an ideal plasticity. Under the combined effects of normal stress and lateral confining pressure, due to the influence of the increasing normal stress on the failure surface of the shale, the load-bearing capacity of the friction exceeded the cohesive force of the materials, which inhibited the slip of fractures. This led to the slippage of multiple cracks simultaneously, generating a relatively large amount of plastic deformation. In addition, the increase in plastic deformation means that more external energy is needed to expand the volume. According to the stress–strain curves for different pressures, the peak lateral strain and the axial strain of the shale are closely related to the effective pressure. The peak strain is also related to the pores, structure, and chemical composition of the shale itself. The relationship between the strain and the effective pressure is roughly confined to 30 MPa. When the confining pressure is less than 30 MPa, the axial strain of the peak is similar to the volumetric strain. When the confining pressure is greater than 30 MPa, the axial strain of sample C6, which is characterized by strong plasticity, changed from 0.73 to 0.93% within the range of 30–60 MPa, which enhanced the plastic flow. After failure occurred, the axial strain changed greatly as the peak strength decreased to the residual strength, and there was no substantial difference in the slope of the curve of the decreasing section before or after the failure.
Experimental results of the triaxial compression of shale samples.
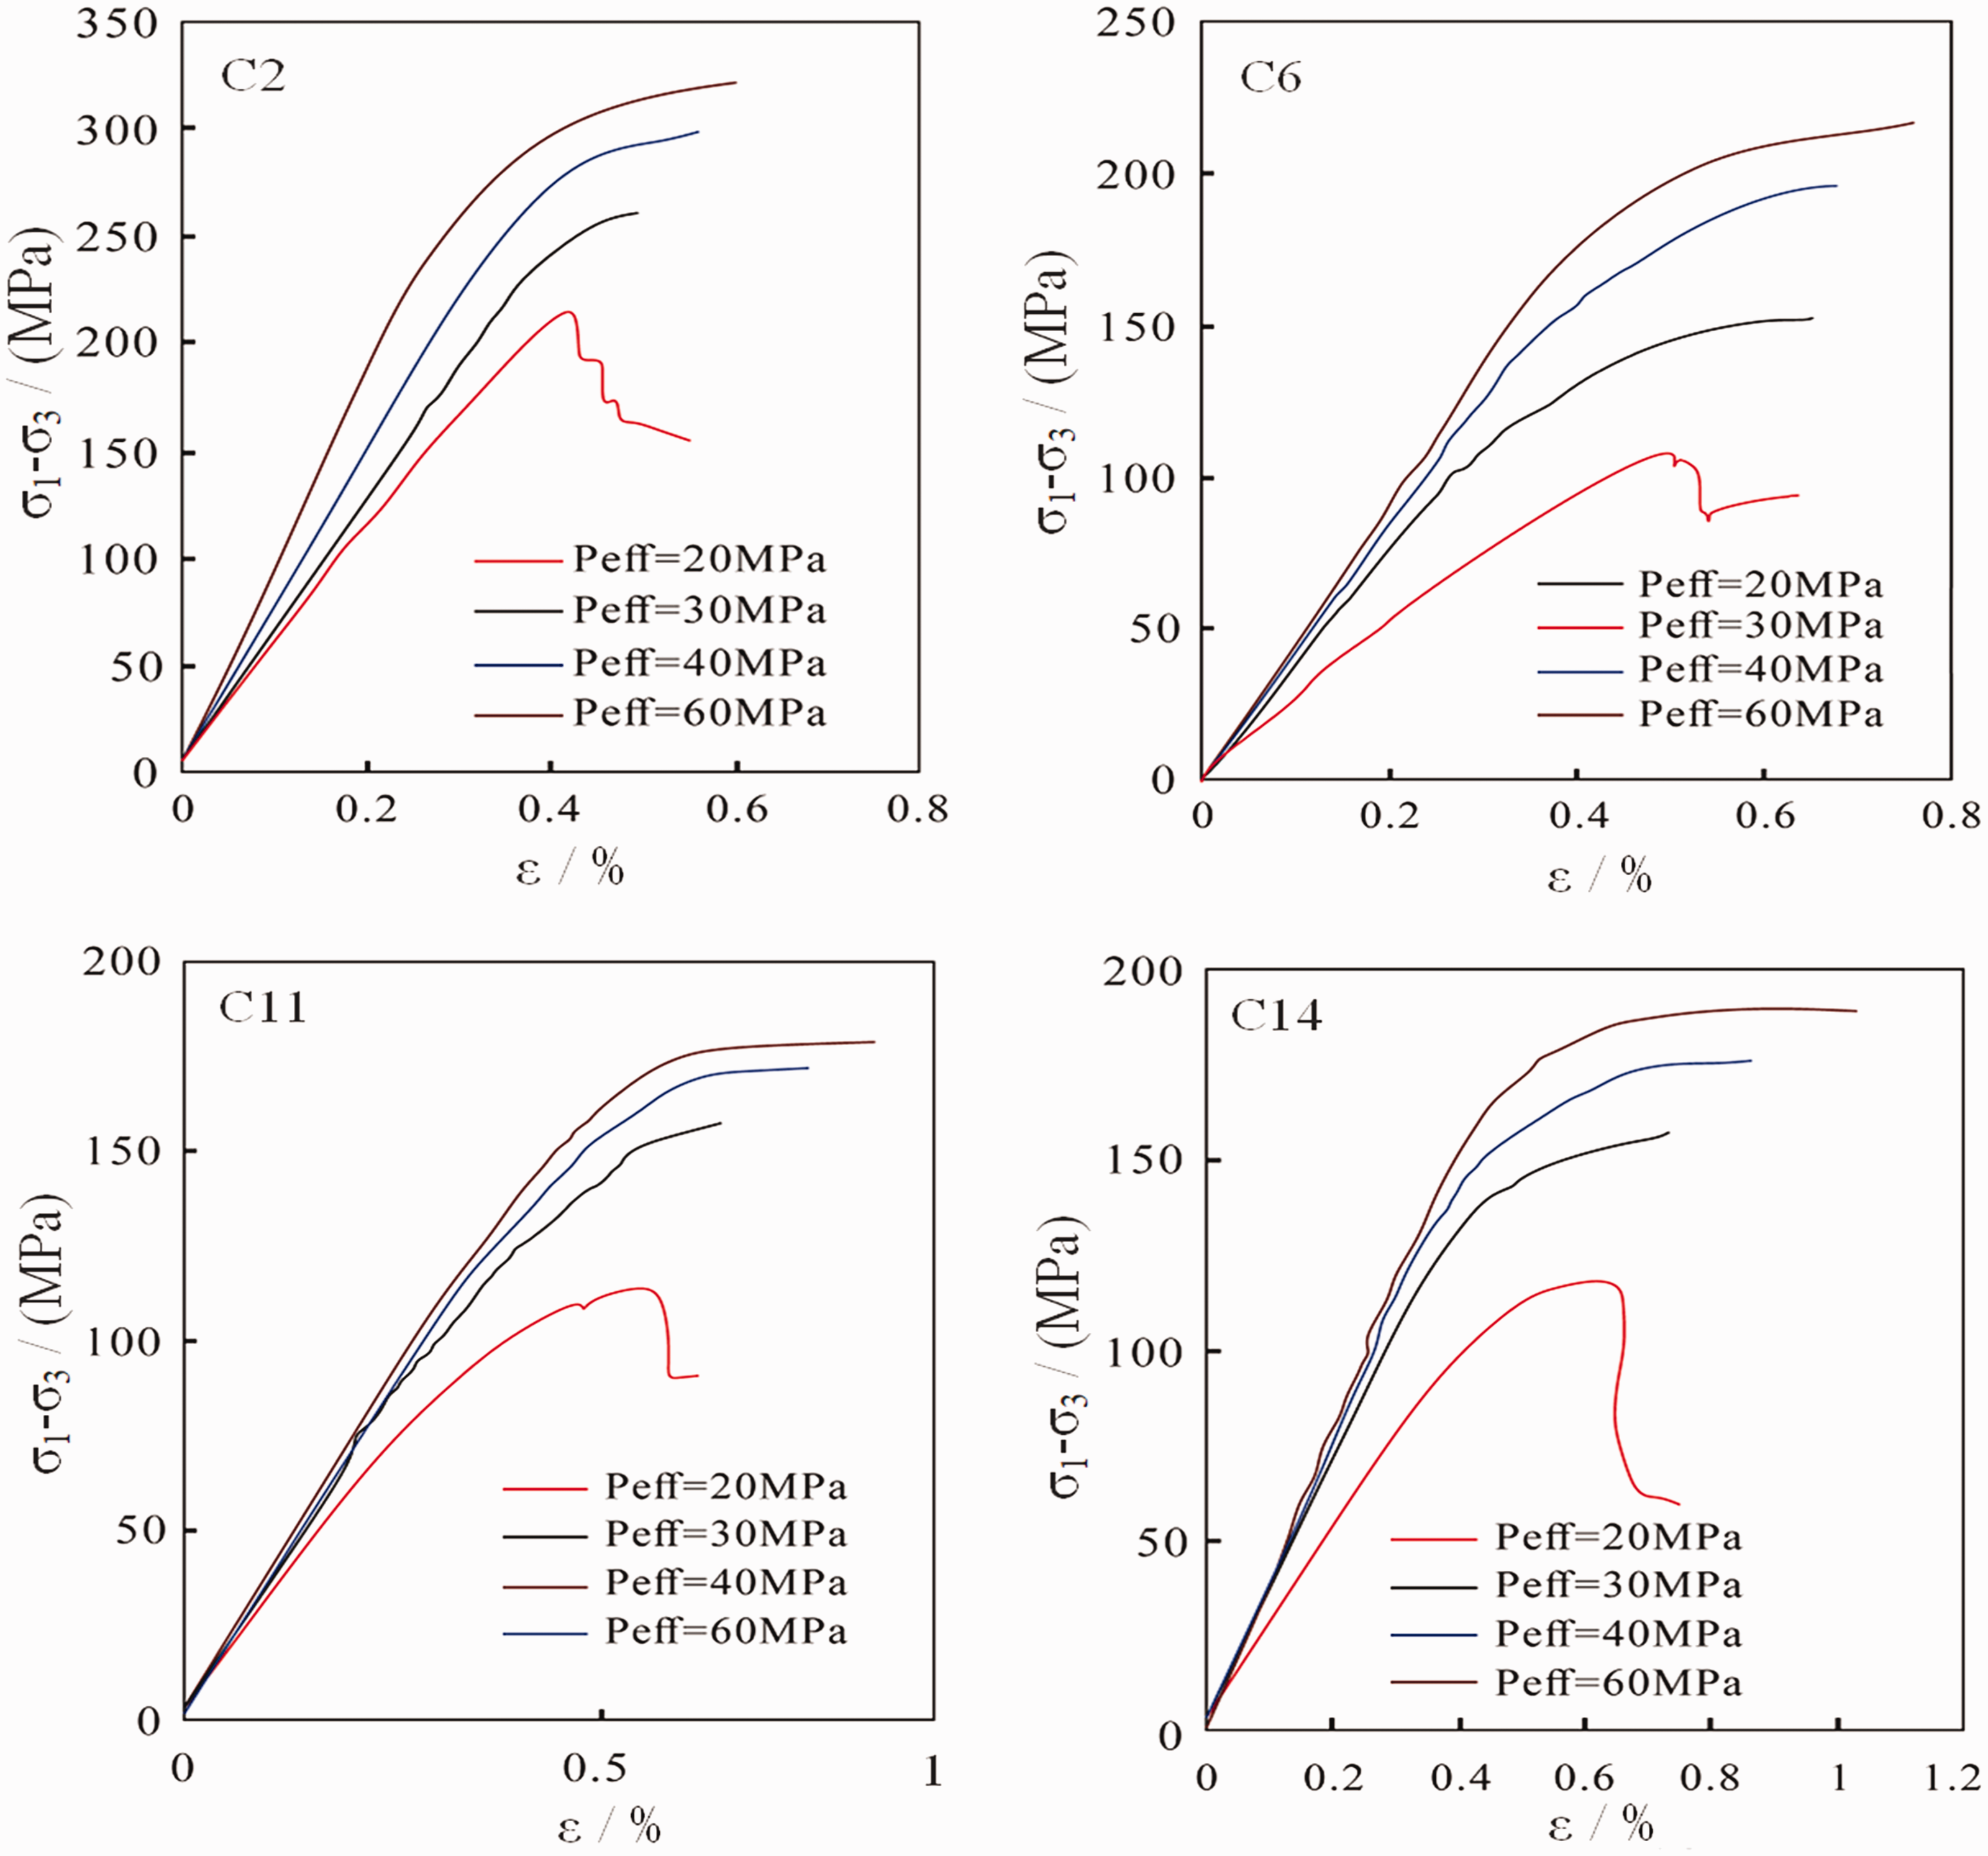
Stress (σ1–σ3)–strain (ε) curves for shale samples under different pressures.
The shape of the stress–strain curve is mainly divided into two types: elastic deformation and elastic–plastic deformation. The siliceous shale with a high quartz content and the shale containing clay are mainly dominated by elastic deformation, the curves of which are approximately linear. This shale is mainly impacted by elastic deformation with little or no plastic deformation. The yield point is difficult to identify and the yield stress almost coincides with the strength limit, and the deformation of the stress–strain curve of the sample directly enters the fracture stage. The clay/silica mixed shale samples containing a high clay content are affected by elastic–plastic deformation. Their deformation curve consists of an approximately linear elastic deformation stage and a small plastic deformation stage before failure. With a certain residual strength after failure, some samples are characterized by significant plastic deformation.
Damage characteristics and mechanism of shale
The shale samples exhibit the cumulative failure characteristics when the confining pressure was applied. Generally, the sound caused by the expansion of cracks and the release of energy could be heard before the failure. The shale samples suddenly lost their load-bearing capacity when they were damaged, and the brittle failure was accompanied by a clear cracking sound. The deformation of the shale was characterized by strong expansion along the direction of the confining pressure. Since the failure was caused by the sudden release of internal strain energy, there were axial extension fractures, a primary conjugate shear failure plane, a secondary conjugate shear failure plane, a micro-extension fracture sandwiched between the shear fractures, and an extension fracture that is generally developed perpendicular to the direction of the confining pressure.
Based on the Mohr–Coulomb strength criterion (Parisio et al., 2015), Hajiabdolmajid and Kaiser (2003) used the CWFS model to explain the brittle failure of rocks. This model vividly reflected the weakening of cohesion and the strengthening mechanism of internal friction during rock failure, which was illustrated in Figure 6. When highly brittle fine-grained rocks are completely damaged, micro-homogeneity competes with macro anisotropy. As indicated by the failure process (①) shown in Figure 6, micro-homogeneity primarily indicates that the mineral particles of the shale are fine, and the micro-fractures are generated from multiple angles and in multiple directions during nucleation, which has a significant influence on whether multiple fracture surfaces can be formed when the shale is completely fragmented. As demonstrated by the failure process (②) shown in Figure 6, macro anisotropy mainly plays a role in the competition among micro-fractures to seek the dominant fracture surface. The mechanical differences in different directions affect the final fracture characteristics. As a natural material, rock always has various defects or weak faces in its interior. These weak faces can be cracks, layer or layered surfaces, and component interfaces. When the sample contains these structural weak faces, they significantly reduce the rock’s ability to resist external forces, such as reduce the compressive strength and Young’s modulus of the rock sample. The structure and texture variation of the layered sedimentary rocks in two directions, differences in distribution orientation of mineral particles, and non-uniformities in the number and distribution of pores and fractures in rocks can cause significant anisotropy. In addition, from the experimental point of view, if the size of the test samples relative to the bedding scale (such as block bedding) is too small, the measured mechanical properties of the shale samples may also exhibit anisotropy. Because of the anisotropy, the macro-fractures expand unstably, forming a complex fracture surface. As they complement each other, neither of the above described two processes can be omitted. The fracture characteristics and failure process of the shale samples are illustrated in Figures 7 and 8. As can be seen in Figure 7, under different effective pressures, shale with relatively high brittleness (sample C3) is mainly affected by brittle split fractures dominated by tensile fissures, while less brittle shale (sample C9) is primarily affected by a single shear fracture. Figure 9 shows scanning electron microscopy images of the fractured shale samples, and it can be seen from Figure 9 that for the less brittle sample (sample C9), rock failure mainly develops between particles with significant differences in stiffness, e.g. between clay particles and quartz particles shown in Figure 9. These fractures gradually connect to form a macroscopically dominant fracture surface. The rigid quartz particles themselves hardly undergo brittle failure, and it is also relatively simple to cause macro-fracture. For the sample with high brittleness (sample C3), the fractures mainly develop inside the quartz particles and between aggregated quartz particles, which is illustrated in Figure 9. It can be seen that Y-shaped fractures are present inside the quartz particles, but these fractures have not been filled by other minerals. Thus, it can be inferred that as pressure increases, the Y-shaped fractures formed inside the different quartz particles connect to form new communication channels and a complicated network of fractures, which causes macro split fractures in the shale. Compared with samples C3 and C9, it can be seen that with increasing initial confining pressure, the failure mode changes from tensile failure to shear failure, and the shear fracture surface is usually developed by partial tracking of the tensile fracture surface.
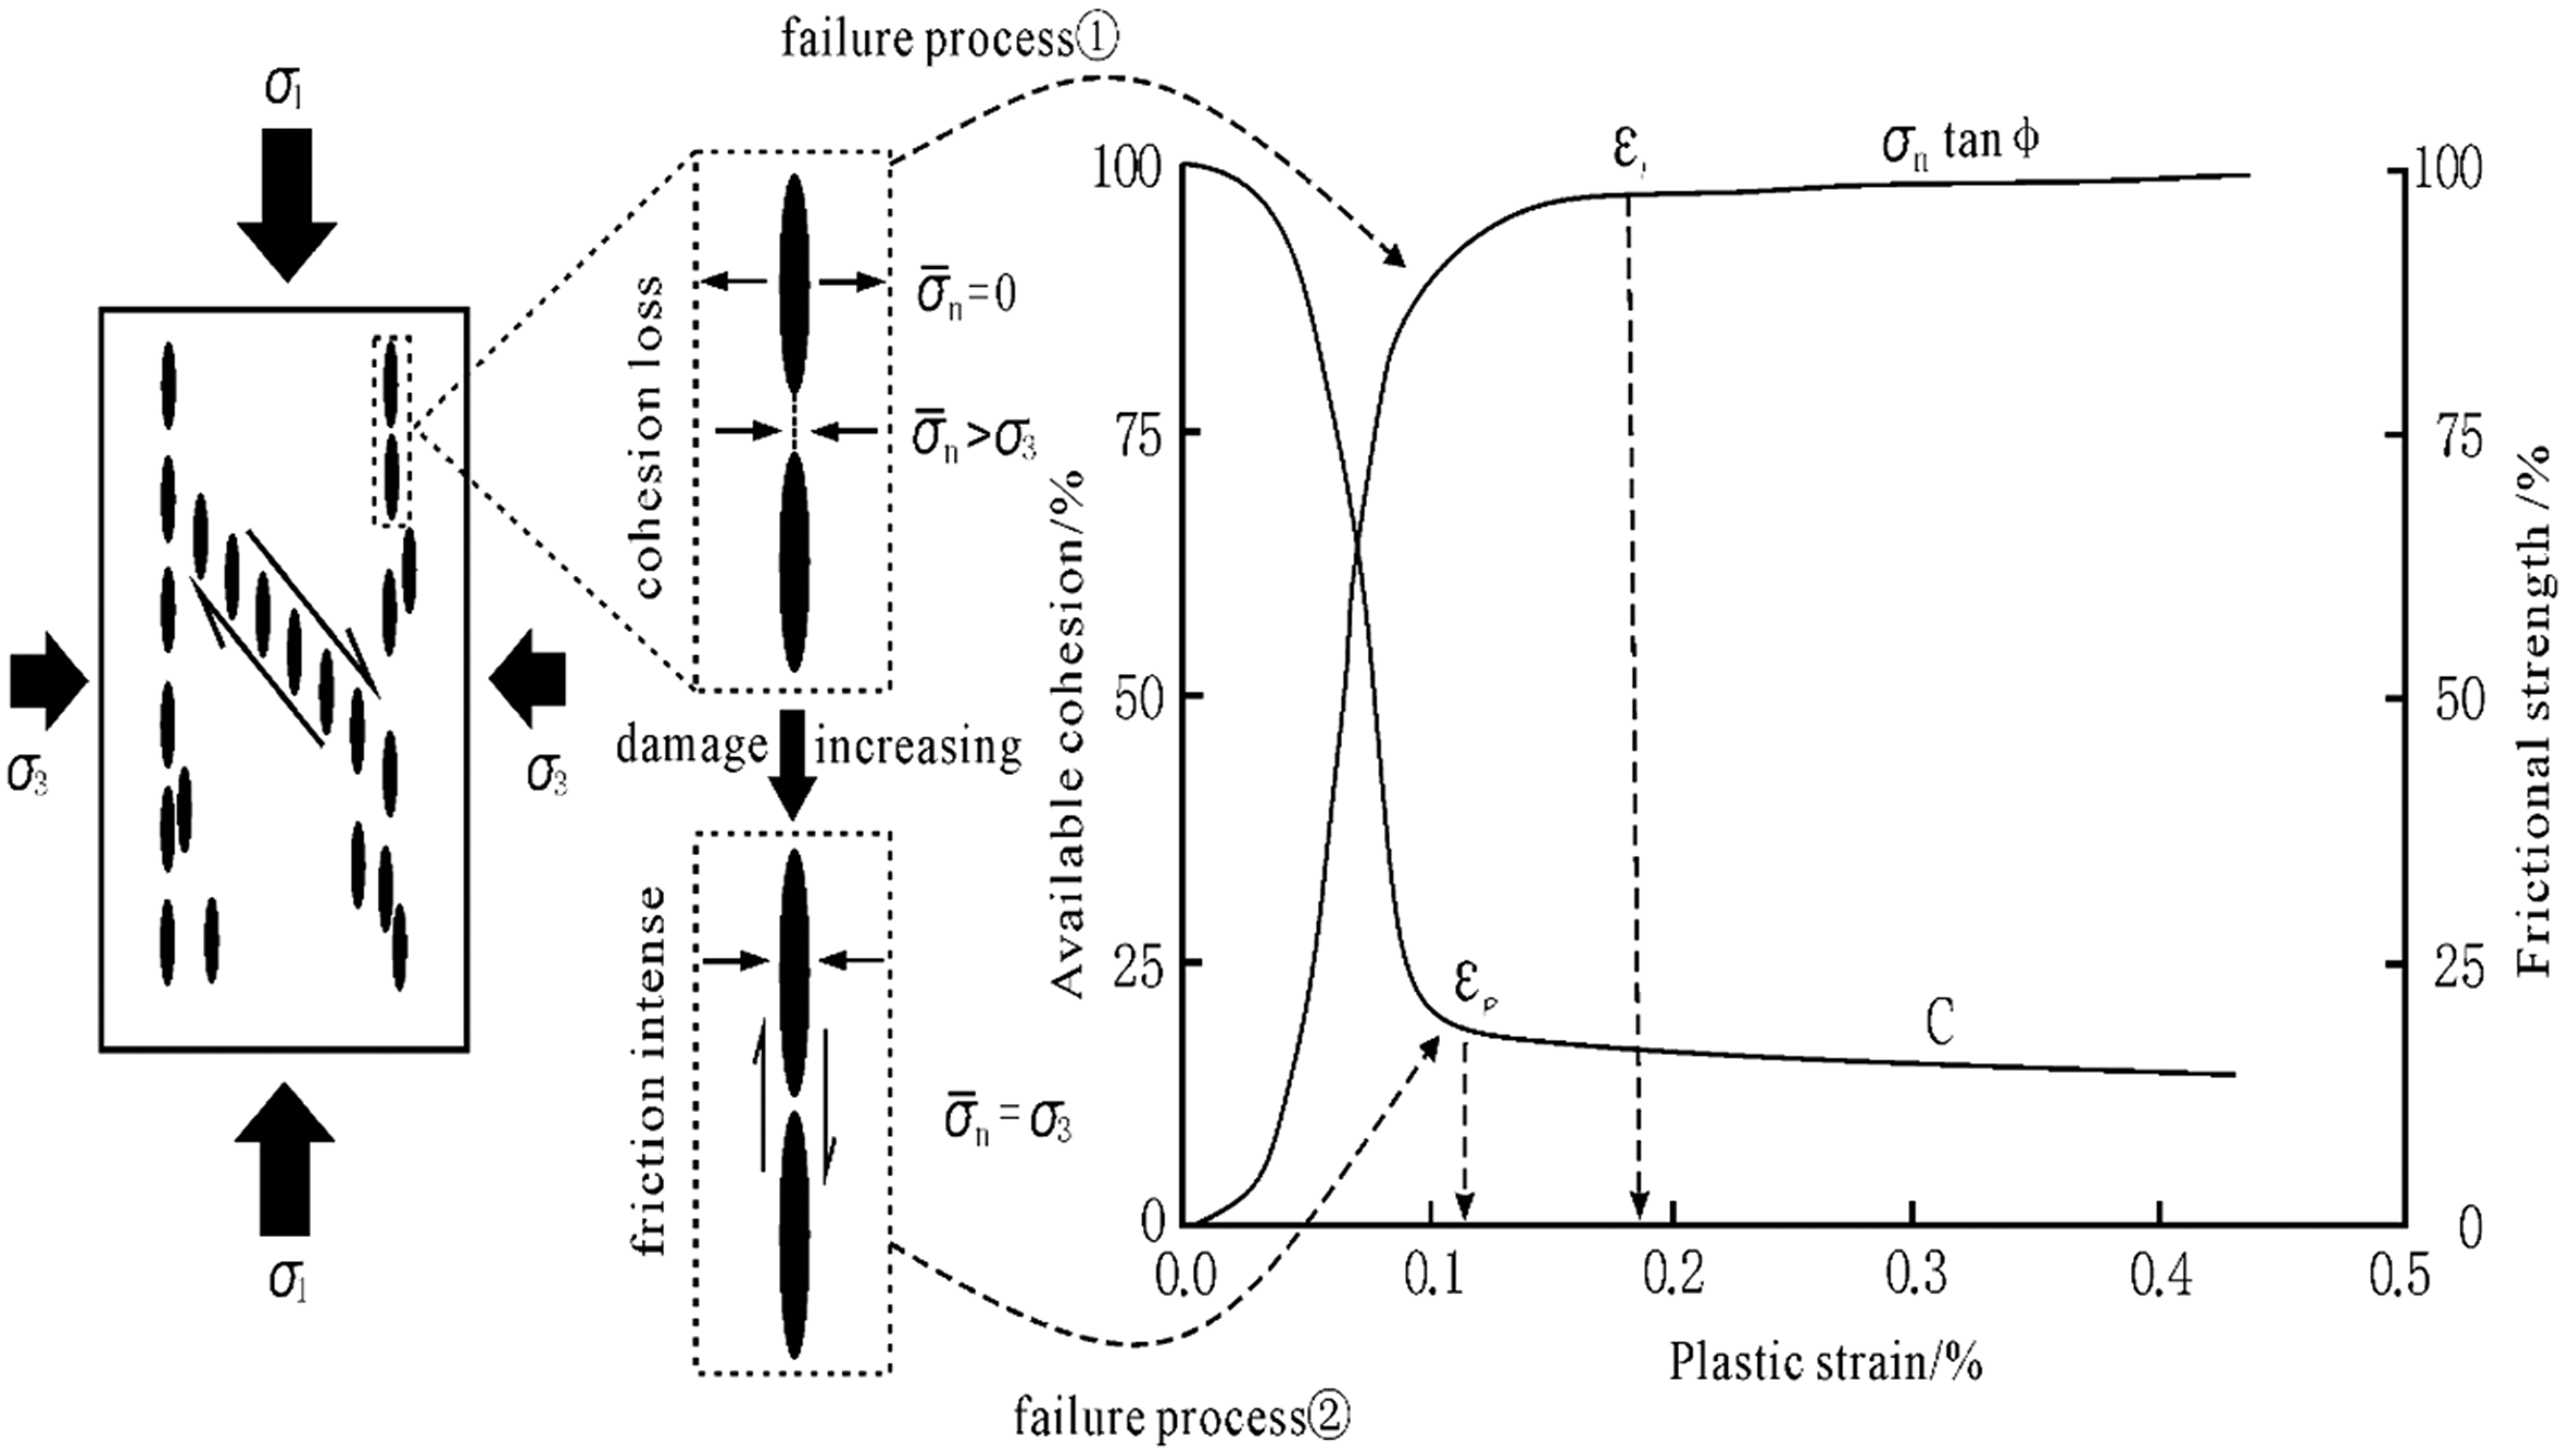
Internal cracks and stress evolution process of materials under brittle failure.
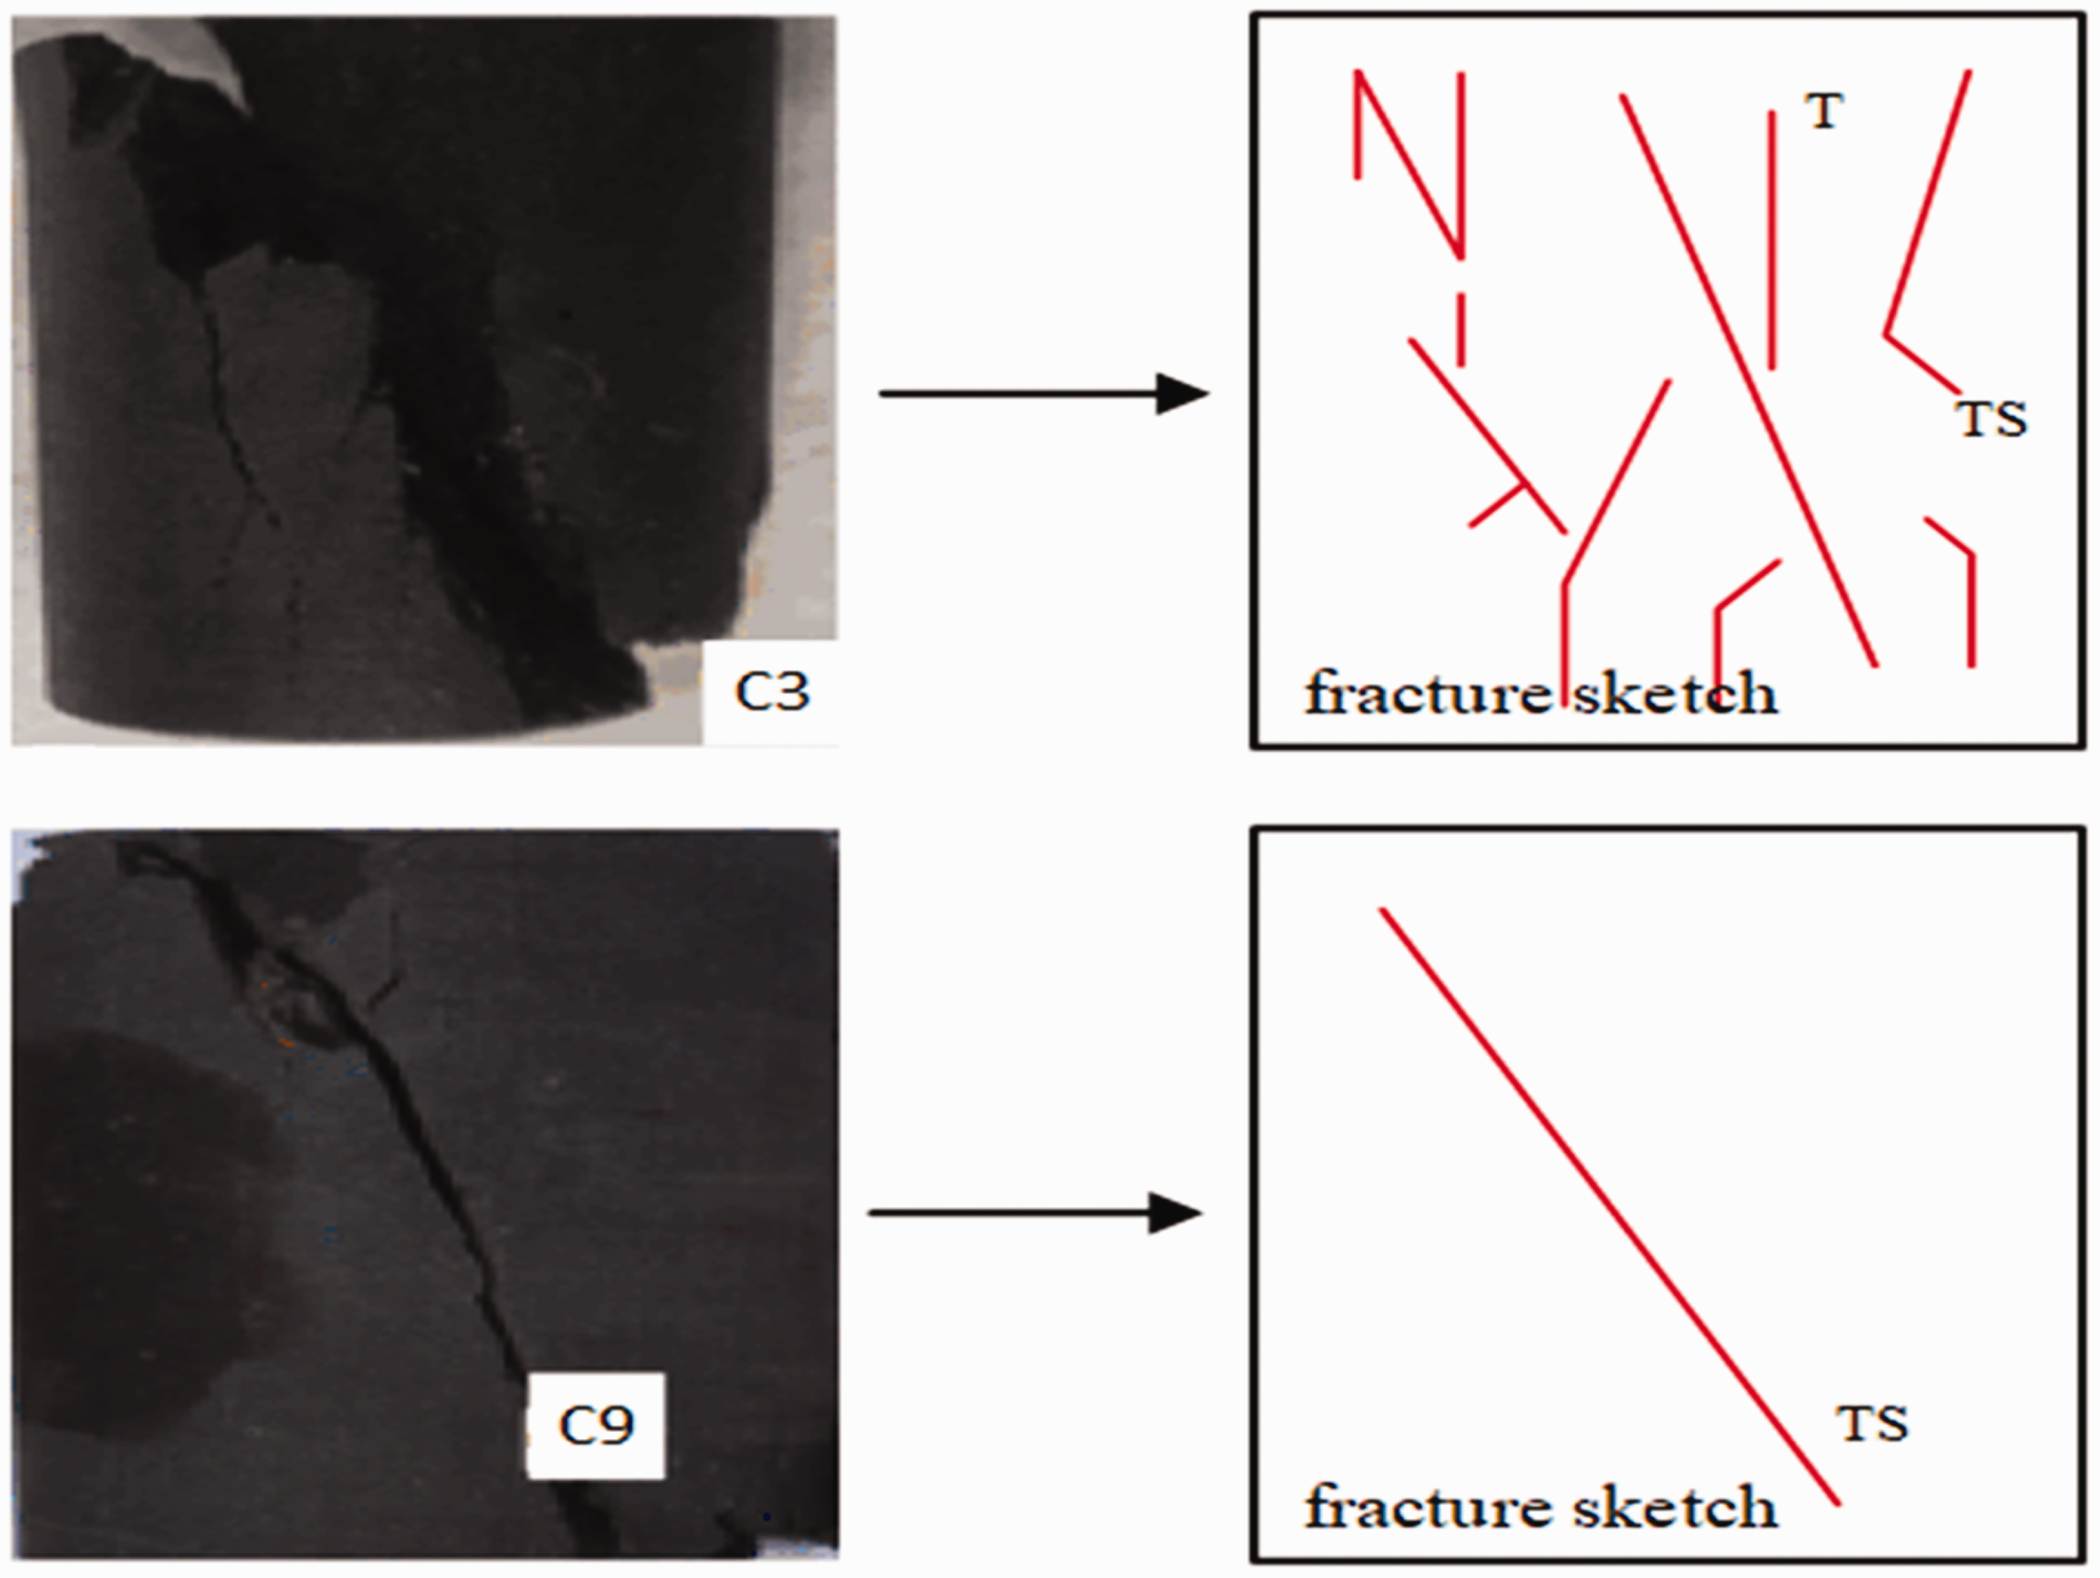
Typical fracture characteristics of shale samples (C3 and C9).
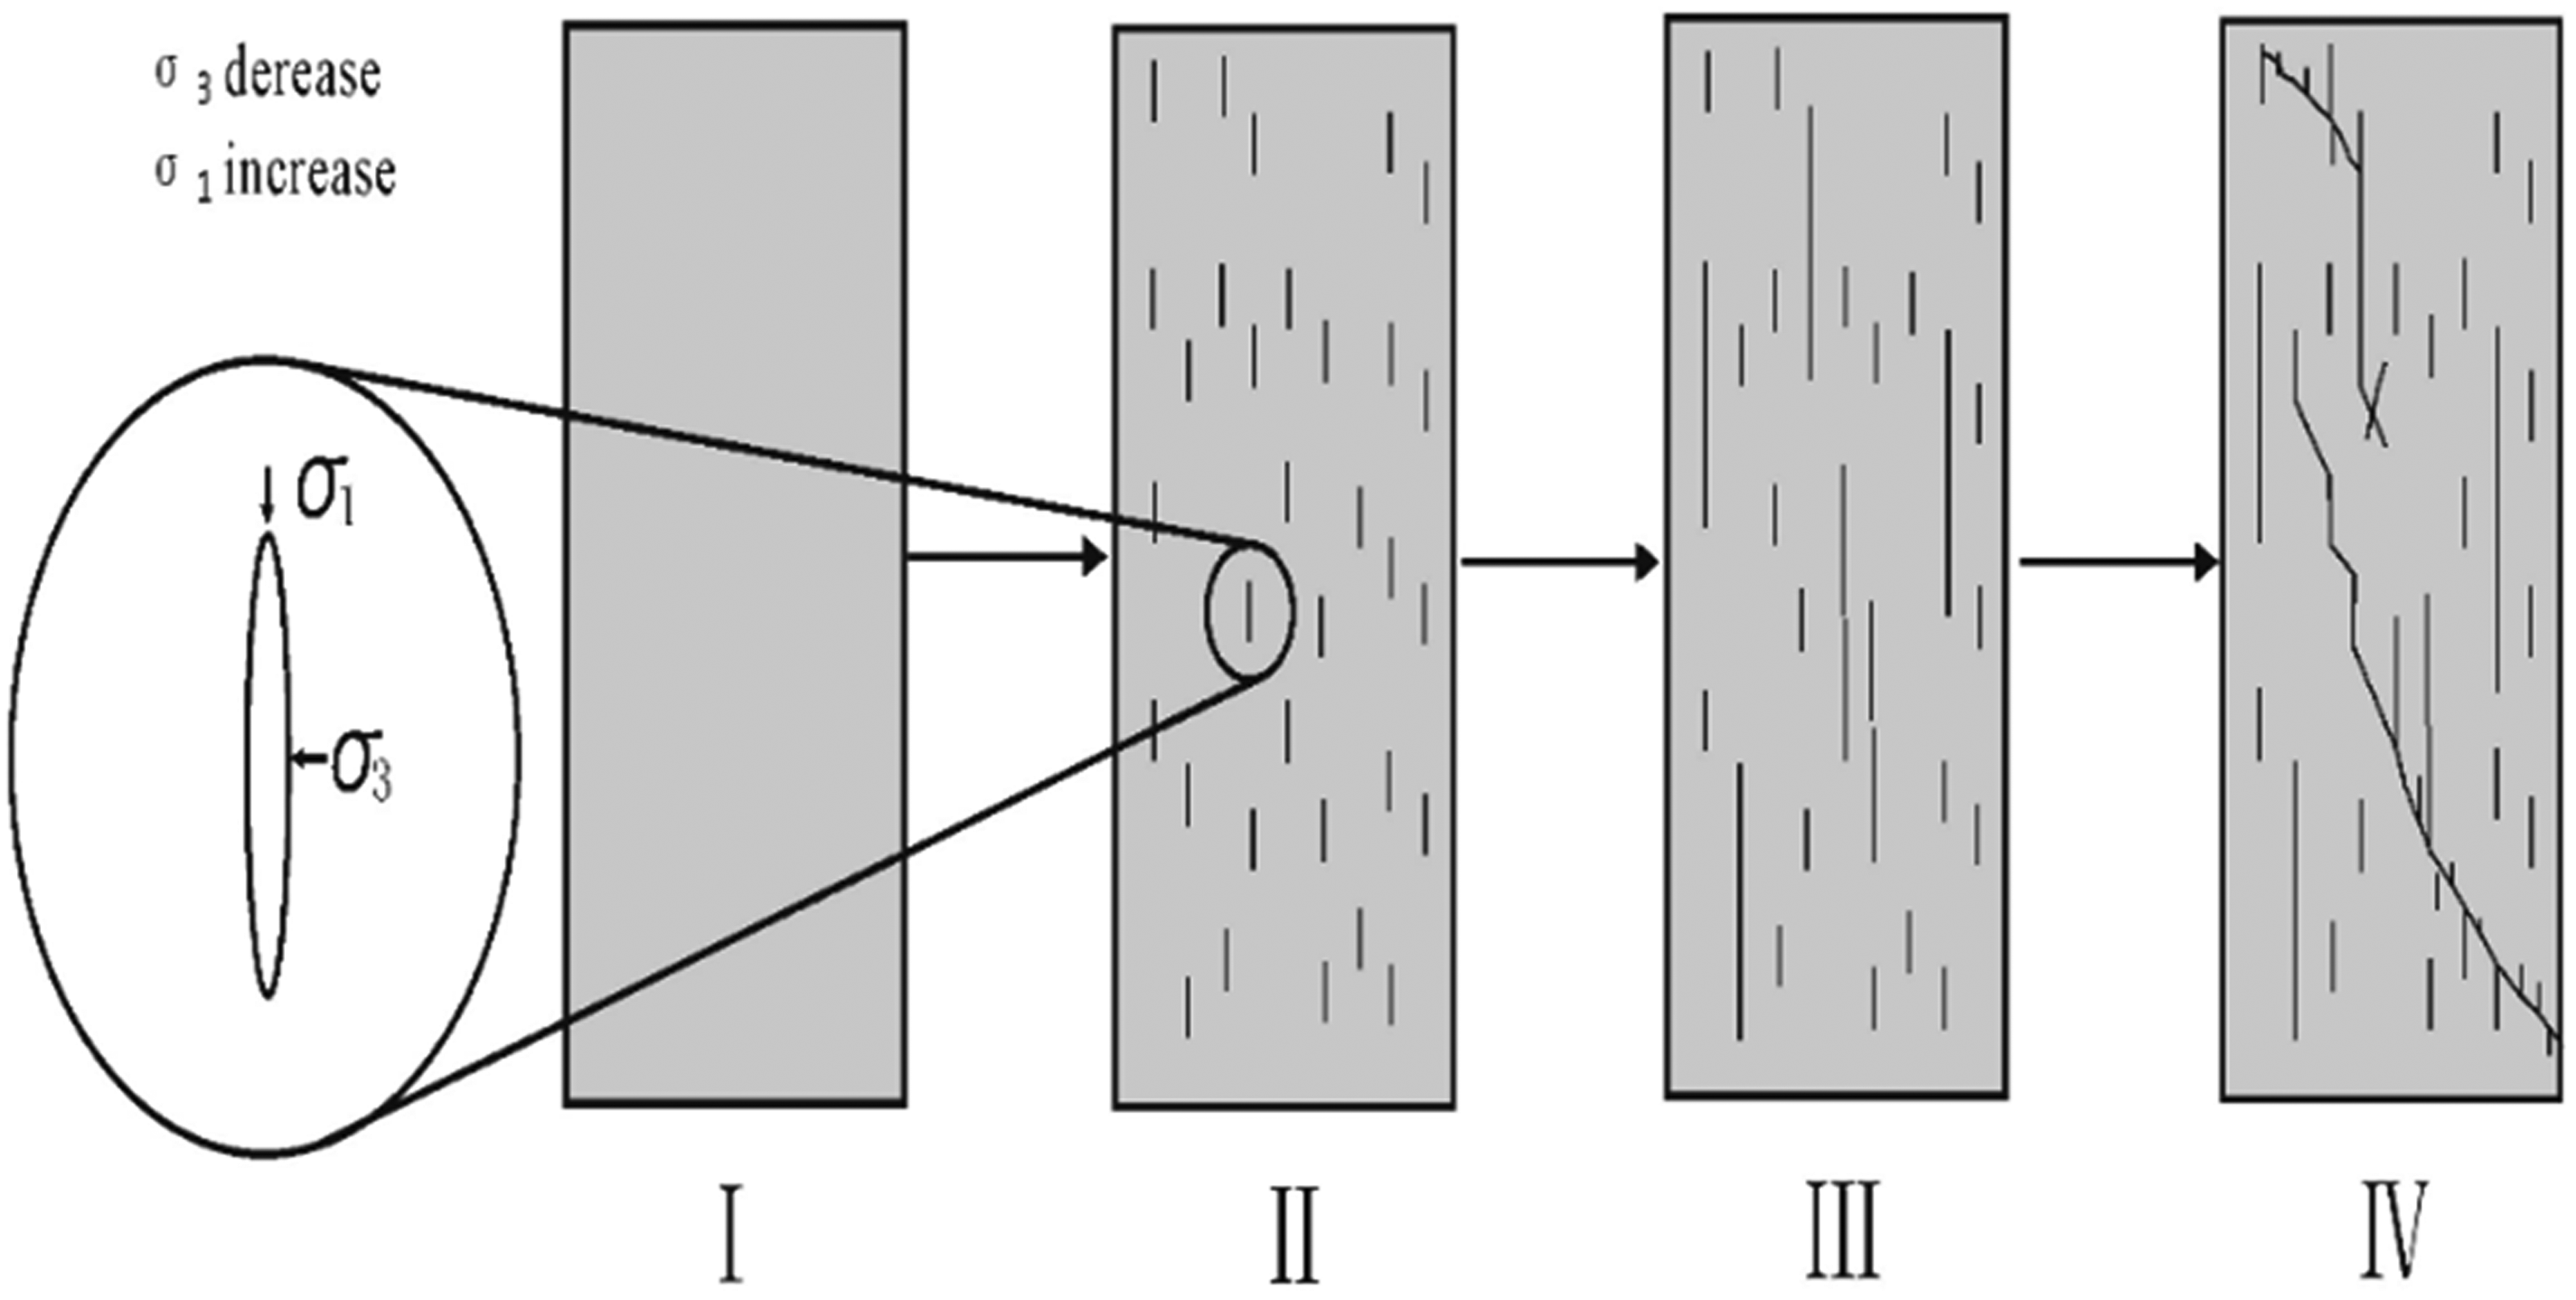
Schematic diagram of damage and failure processes.
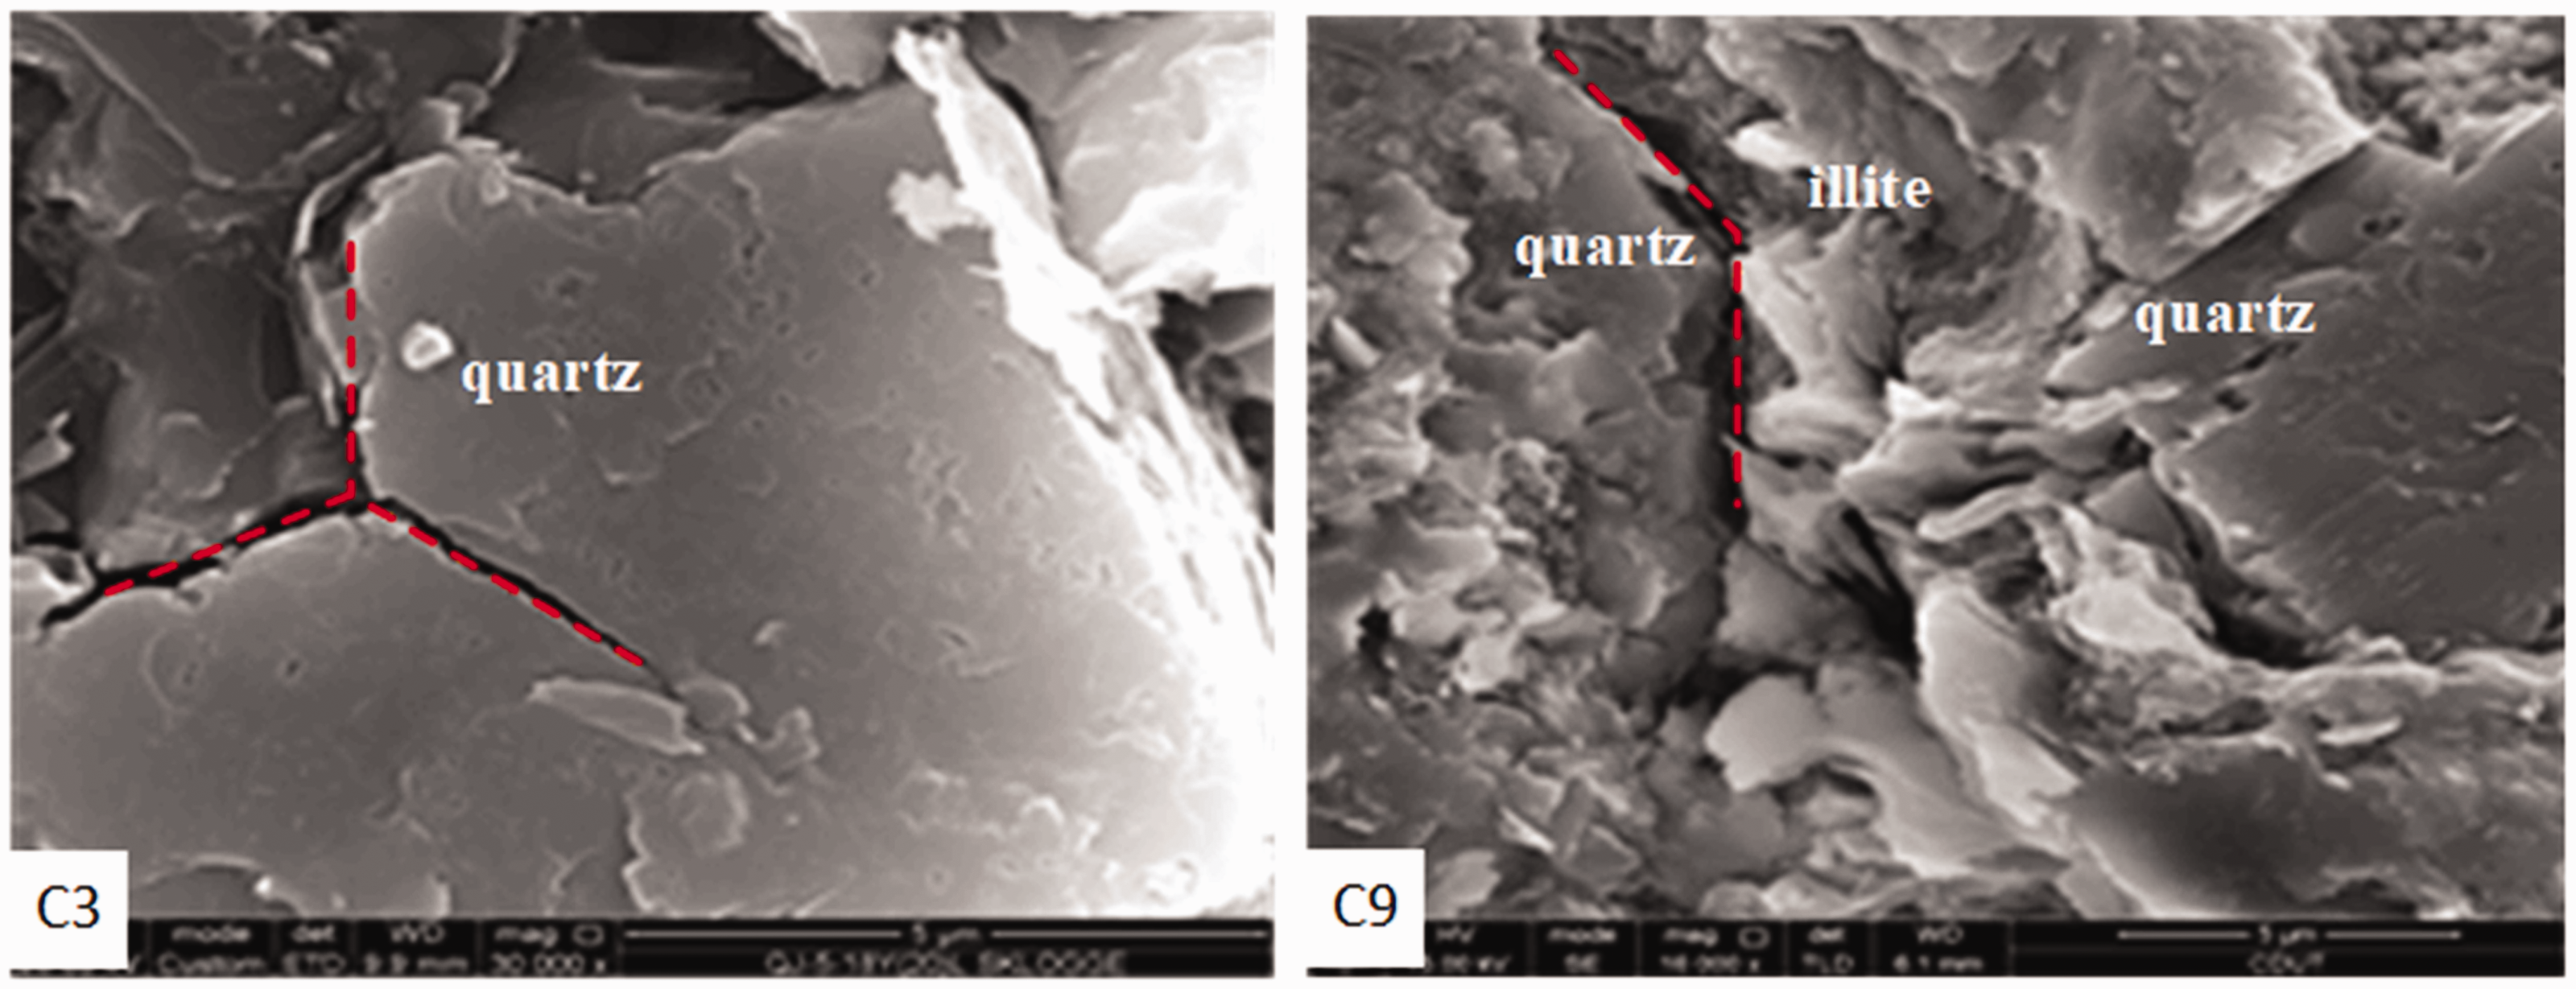
Microscopic crack characteristics of the typical shale samples (C3 and C9) after fracturing.
Conclusions
In this study, the experiments of the uniaxial and triaxial compression from the Longmaxi shale in Southern Sichuan Basin, China were carried out to understand the mechanical characteristics and damage modes of shale under different conditions. The effects of mineral composition on the shale mechanical properties were analyzed, and then the deformation, stress–strain, damage characteristics, and mechanism of shale were determined, respectively. According to the experimental results, the following conclusions can be drawn: (1) The shape of the stress–strain curve for the Longmaxi Formation shale in South China is mainly divided into two types of elastic deformation and elastic–plastic deformation. (2) There is a significant difference in the effective pressures of the yield platforms formed after the peak deformation of different shale rocks. For the shale rocks with strong rigidity, a weak post-peak yield platform appears when the effective pressure reaches 60 MPa, which indicates the weak plastic flow. For most shale rocks, when the effective pressure reaches 30 MPa, a relatively obvious post-peak yield platform occurs, which is characterized by the obvious plastic flow and an ideal plasticity. (3) As the effective pressure increases, the increase in peak compressive strength gradually decreases, and the influence of the effective pressure on the increase in compressive strength gradually decreases as brittle failure transitions to ductile failure. The higher the effective pressure with the transition from the brittleness to the ductility is, the more the compressive strength with increasing effective pressure is. That is to say, the greater the compressive strength of a shale under low effective pressure is, the more the shale’s shape changes with pressure is; and the smaller the compressive strength under low effective pressure is, the less the shape changes with pressure is.
Footnotes
Declaration of conflicting interests
The author(s) declared no potential conflicts of interest with respect to the research, authorship, and/or publication of this article.
Funding
The author(s) disclosed receipt of the following financial support for the research, authorship, and/or publication of this article: This work was financially supported by the National Natural Science Foundation of China (No. U1762216 and No. 11802312), and by the National Science and Technology Major Project of the Ministry of Science and Technology of China Project (No. 2016ZX05037006), and by the Open Fund (PLN201810) of State Key Laboratory of Oil and Gas Reservoir Geology and Exploitation (Southwest Petroleum University). We also thank the support from the Youth Foundation of Key Laboratory for Mechanics in Fluid Solid Coupling Systems, Chinese Academy of Sciences.