
Abstract
The dark marine shales which are thick in the Mesoproterozoic Hongshuizhuang formation and Xiamaling Formation in the Yanshan area are the subject of this study. The material compositions and pore characteristics were analyzed, and the reasons for the differences in the adsorption capacity of shale were emphatically discussed through geochemical analysis, X-ray diffraction, scanning electron microscope, low-temperature nitrogen adsorption, mercury injection experiment, isothermal adsorption, and other analysis methods. The results indicate that the samples are rich in high organic carbon content, and vitrinite reflectance suggests that the degree of thermal evolution is in the late-mature to high-mature stage; the mineral compositions mainly consist of quartz and clay minerals. The micropores are relatively developed, which mainly include intergranular pores, intragranular pores, microcracks, and many other pores. Results from the nitrogen adsorption analysis suggest that the pore structures can be divided into three types. Porosity has obvious fractal characteristics. The fractal dimensions of the adsorption pore are larger than those of the seepage hole. The difference of shale adsorption between the Hongshuizhuang Formation and Xiamaling Formation is mainly determined by the volume of micropores and transition pores and the different mineral compositions.
Introduction
Shale gas is characterized by favorable self-generation and self-accumulation, which is becoming more and more important in unconventional areas of oil and gas resources. It is estimated that the annual output of marine shale gas in 2020 is expected to reach (200–300) × 108 m3, which reveals the good prospect of exploration and development in shale gas field in China (Zou et al., 2015). With the large-scale development of shale gas in the Fayetteville shale of the Arkema Basin and Marcellus shale of the Appalachian Basin, it is found that the adsorbed gas content can account for 20% to 85% of the total gas content of shale gas, which has an important impact on shale gas exploitation plan and its long-term and stable output (Chen et al., 2016; Huang et al., 2012).
The influencing factors of adsorption of organic-rich shale are very complicated, such as total organic carbon (TOC), kerogen type, clay minerals, maturity and so on. Previous scholars have attributed it to the effect of pores of different genesis and their structural evolution on the adsorption capacity of shale gas (Hao et al., 2013; Hou et al., 2014). Many scholars believe that organic components in shale are the important controlling factors for methane adsorption capacity because micropore volume is positively correlated with TOC and micropores are important components of the shale porous media with relatively large internal specific surface area and strong adsorption capacity (Chalmers and Bustin, 2007, 2008; Ross and Bustin, 2007). Ross and Bustin (2009) found that the adsorption control factors of shale with different maturity are different, the high maturity shale sorption capacity is governed by the characteristics of organic carbon, and clay minerals also have a significant impact on shale sorption in shale with low TOC. At present, different scholars hold different views on the adsorption of clay minerals and organic matter, Chalmers and Bustin (2007) considered that the hydrophilicity of clay minerals can reduce the gas adsorption capacity, but Schettler and Parmoly (1990) considered that the adsorption of clay minerals is stronger than that of kerogen. Therefore, the material composition and pore structure on the adsorption capacity of shale need to be further studied.
Previous studies have shown that the Hongshuizhuang Formation and Xiamaling Formation in the Yanshan area, as the high-quality marine source rocks, already have the material basis for the formation of shale gas, but those studies have concentrated more on the characteristics of the hydrocarbon source rocks in the Yanshan area of the Proterozoic shale, and little research has been reported on their reservoir properties (Wang, 1980; Wang and Han, 2011; Xie et al., 2013). In order to strengthen the understanding of the dark shale reservoir property, organic geochemistry and X-ray diffraction (XRD) were used to analyze the composition characteristics of shale, the pore structure parameters of shale were obtained by low-temperature nitrogen adsorption and mercury injection experiment, and the adsorption capacity of shale gas was obtained by isothermal adsorption experiments of high-pressure methane. The influence of different material composition and pore structure characteristics of shale on methane adsorption performance was discussed.
Geological background
Yanshan area lies west to Zhangjiakou, east to Beipiao and Fuxin in nearly an east–west distribution. On the tectonic division, the Yanshan area is located on the northern margin of the North China platform and is an active tectonic unit, which can be divided into two ancient uplifts and five ancient depressions (Figure 1) (Liu et al., 2011; Wang, 1980; Zhong, 2010). The middle and late Proterozoic crustal movement in the area is evolved from relatively active tectonic environment to relatively stable tectonic environment, and the two states alternately appear, and finally tend to be stable (Hao et al., 1990; Pan et al., 2013). The strata are formed in the epicontinental sea environment, characterized by clastic deposits in the early stage and characterized by alternating development between the confined marine carbonate and argillaceous rocks in the middle and late stages (Zhong, 2010).
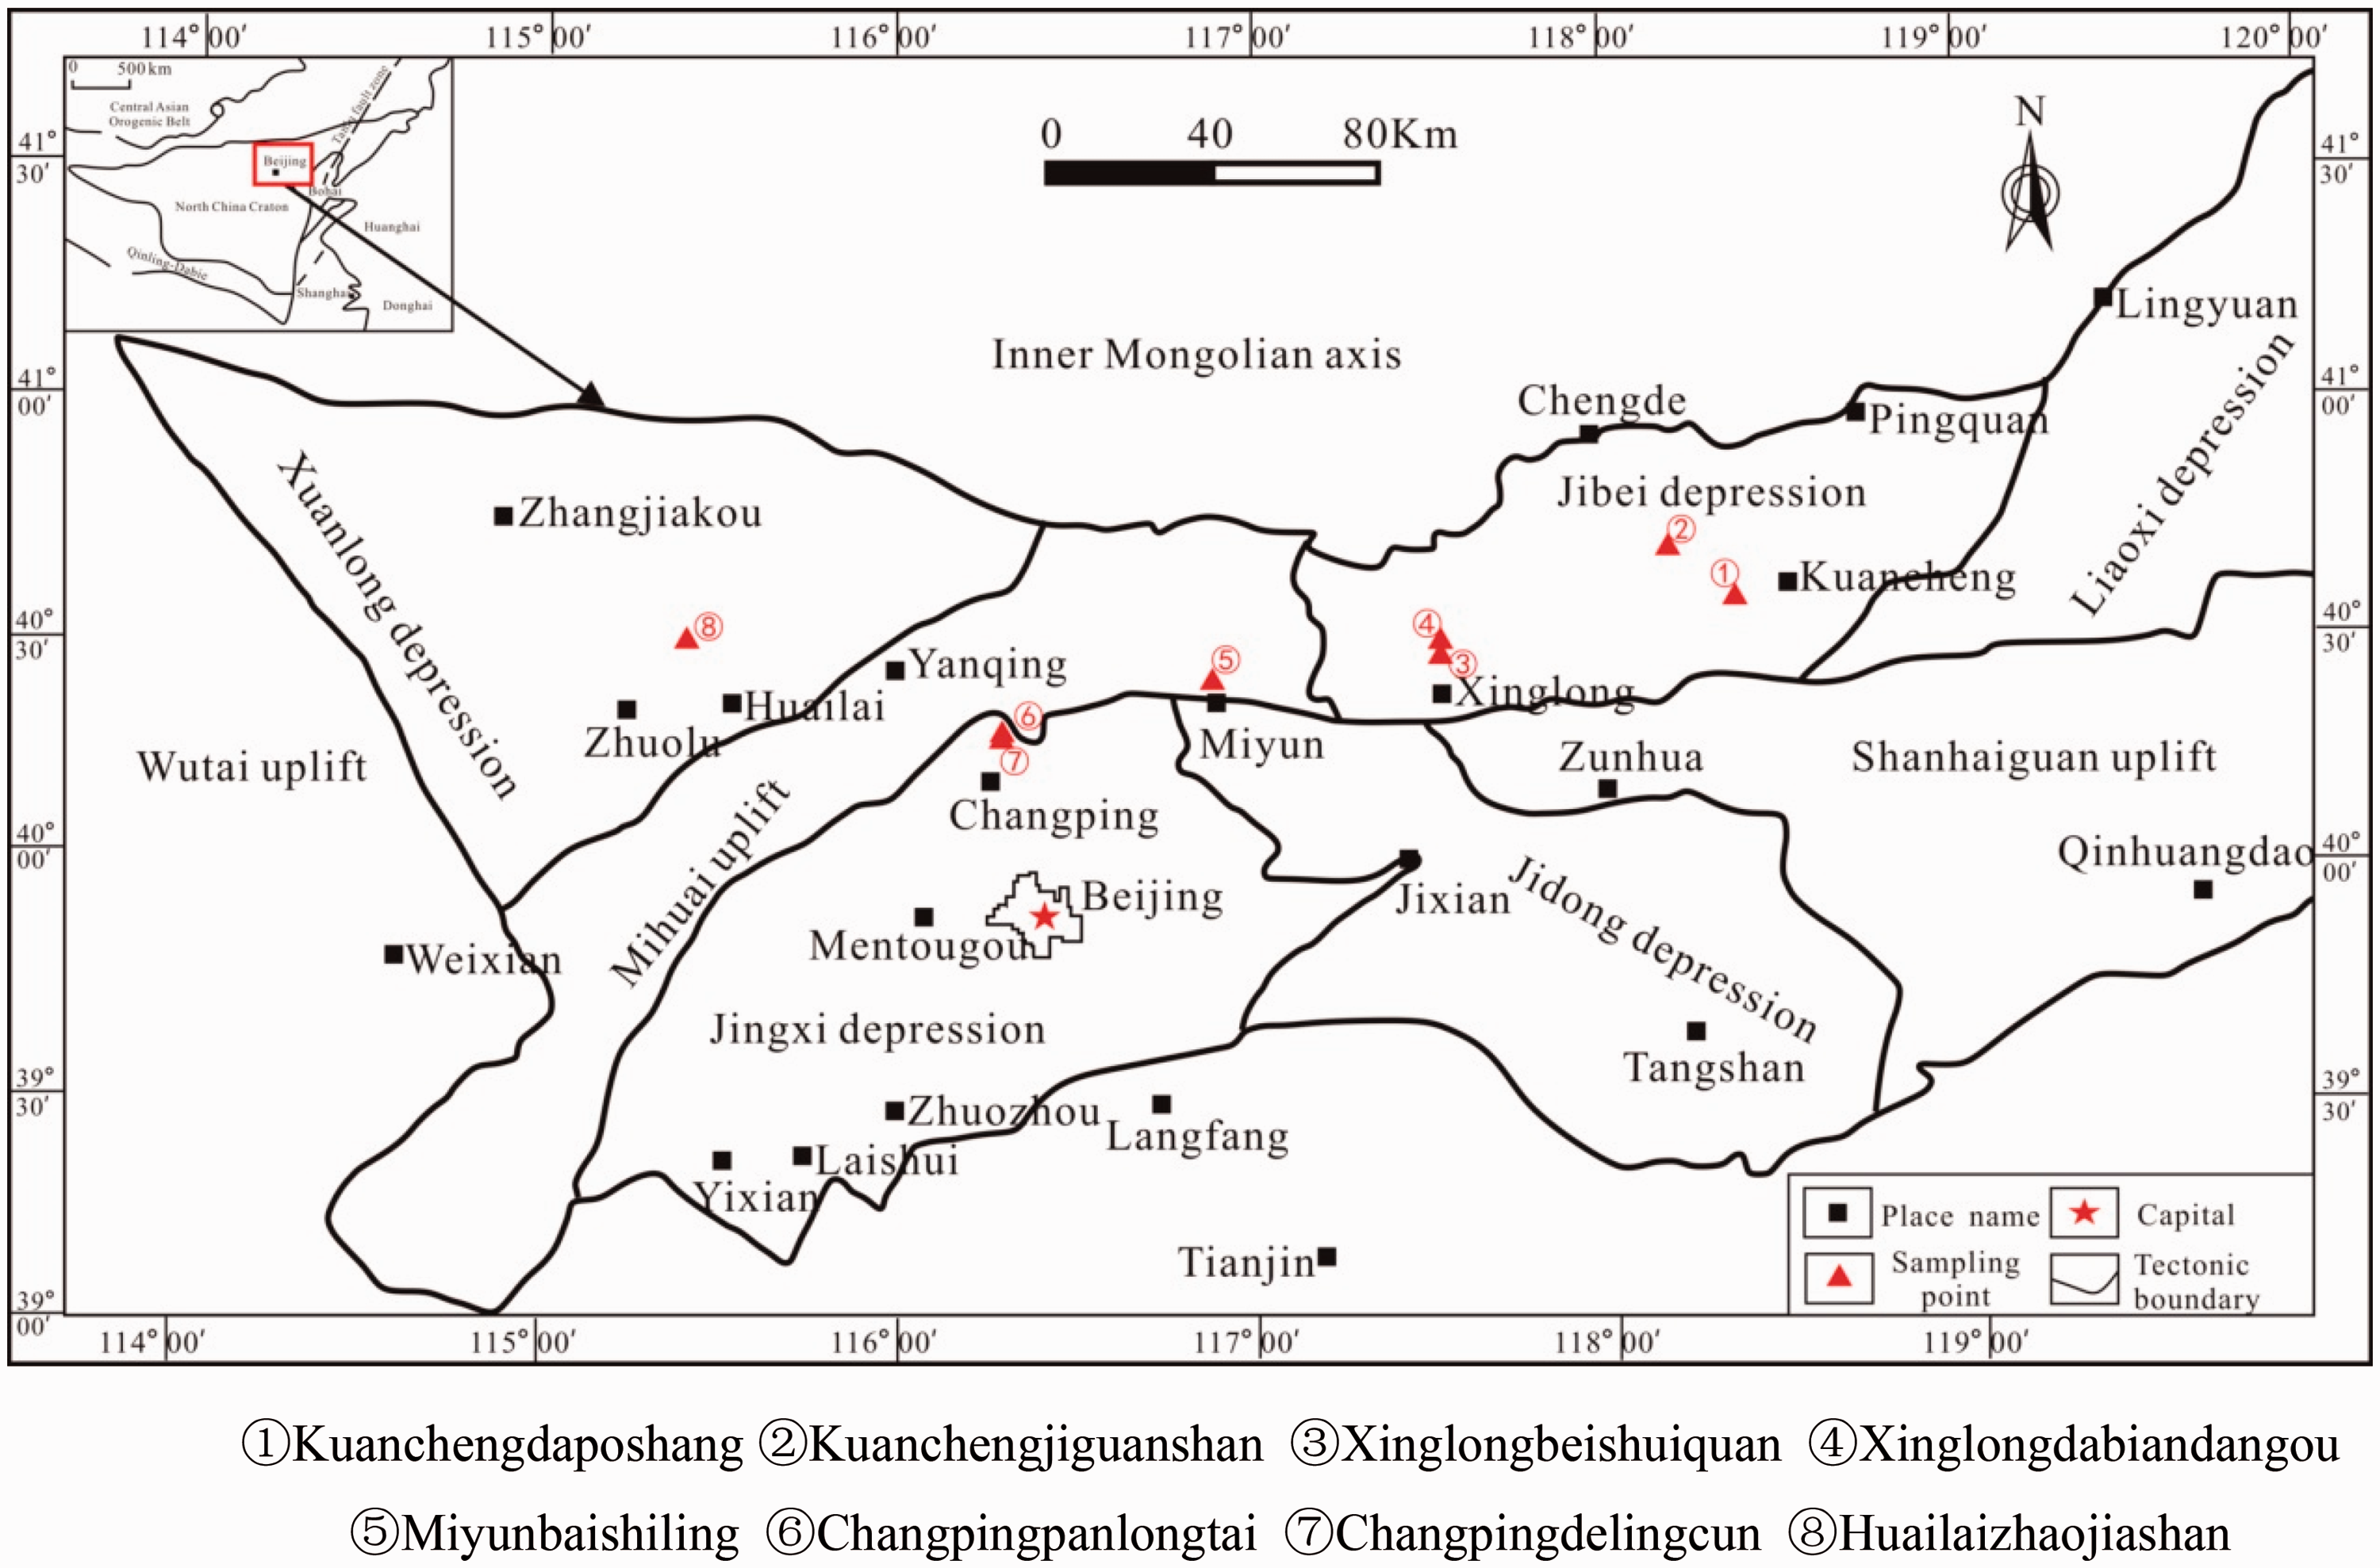
Location of the study area and sampling points.
During the deposition of the Hongshuizhuang Formation, the sea area contracted, and the vast shallow sea turned into an abnormally shallow bay environment with narrow occlusion and underwater detention reduction, which is dominated by black, gray-black shale, argillaceous dolomite, and gray green shale. The sedimentary center is located in Jixian-Xinglong and Kuancheng areas of Yanshan area with a thickness of 0 m–170 m. In the early stage of the deposition of the Xiamaling Formation, the sea water is shallow, and the seafloor is in the condition of weak oxidation to reduction, and the sediments are dominated by mottled sand shale. In the middle and later stages, the seawater is deepened and the reducibility is enhanced. Gray-black and black shale with larger thickness are deposited and interbedded with siliceous mudstone. The sedimentary center is located in Huailai and Xinglong regions with a thickness of 100 m–600 m.
Experimental
Experimental samples
Because few shale gas wells have been drilled in this area, it was thus difficult to obtain shale samples. In this paper, the samples were collected from eight different fresh outcrop profiles in Yanshan area, and the latitude and longitude of profiles are shown in Figure 1. Samples kcd, xld, cpd were collected from three Hongshuizhuang Formation outcrops (Kuanchengdaposhang, Xinglongdabiandangou, Changpingpanlongtai) with the depth of 7 m, 6 m, 7 m, respectively. Samples kcj, xlb, myb, cpd, xmz were collected from five Xiamaling Formation outcrops (Kuanchengjiguanshan, Xinglongbeishuiquan, Miyunbaishiling, Changpingdelingcun, Huailaizhaojiashan) with the depth of 5 m, 5 m, 3 m, 3 m, 10 m, respectively. Samples are taken at a certain distance to ensure that the samples are representative. The organic geochemical parameters and mineral compositions of shale samples are shown in Table 1. The distribution of TOC ranged from 0% to 6.71%, with an average of 2.35%. The TOC content of Hongshuizhuang Formation was relatively high, ranging from 0.04% to 5.63% with an average of 2.73%. The TOC content of Xiamaling Formation was 0.00% to 6.71% with an average of 2.00%. The results of previous studies show that the sedimentary center of Hongshuizhuang Formation is located in Jixian-Xinglong and Kuancheng of Yanshan area, and the sedimentary center of Xiamaling Formation is located in Huailai, Xinglong, Miyun (Yang, 2013). For Hongshuizhuang Formation, the average TOC content of Kuancheng and Xinlong samples (3.17) is larger than that of other regions (0.05). For Xiamaling Formation, the average TOC content of Xinglong and Huailai is larger than that of other regions (1.27). Therefore, the distribution of sedimentary centers is consistent with the distribution of TOC high values.
Organic geochemical parameters of Mesoproterozoic shale samples in Yanshan area.
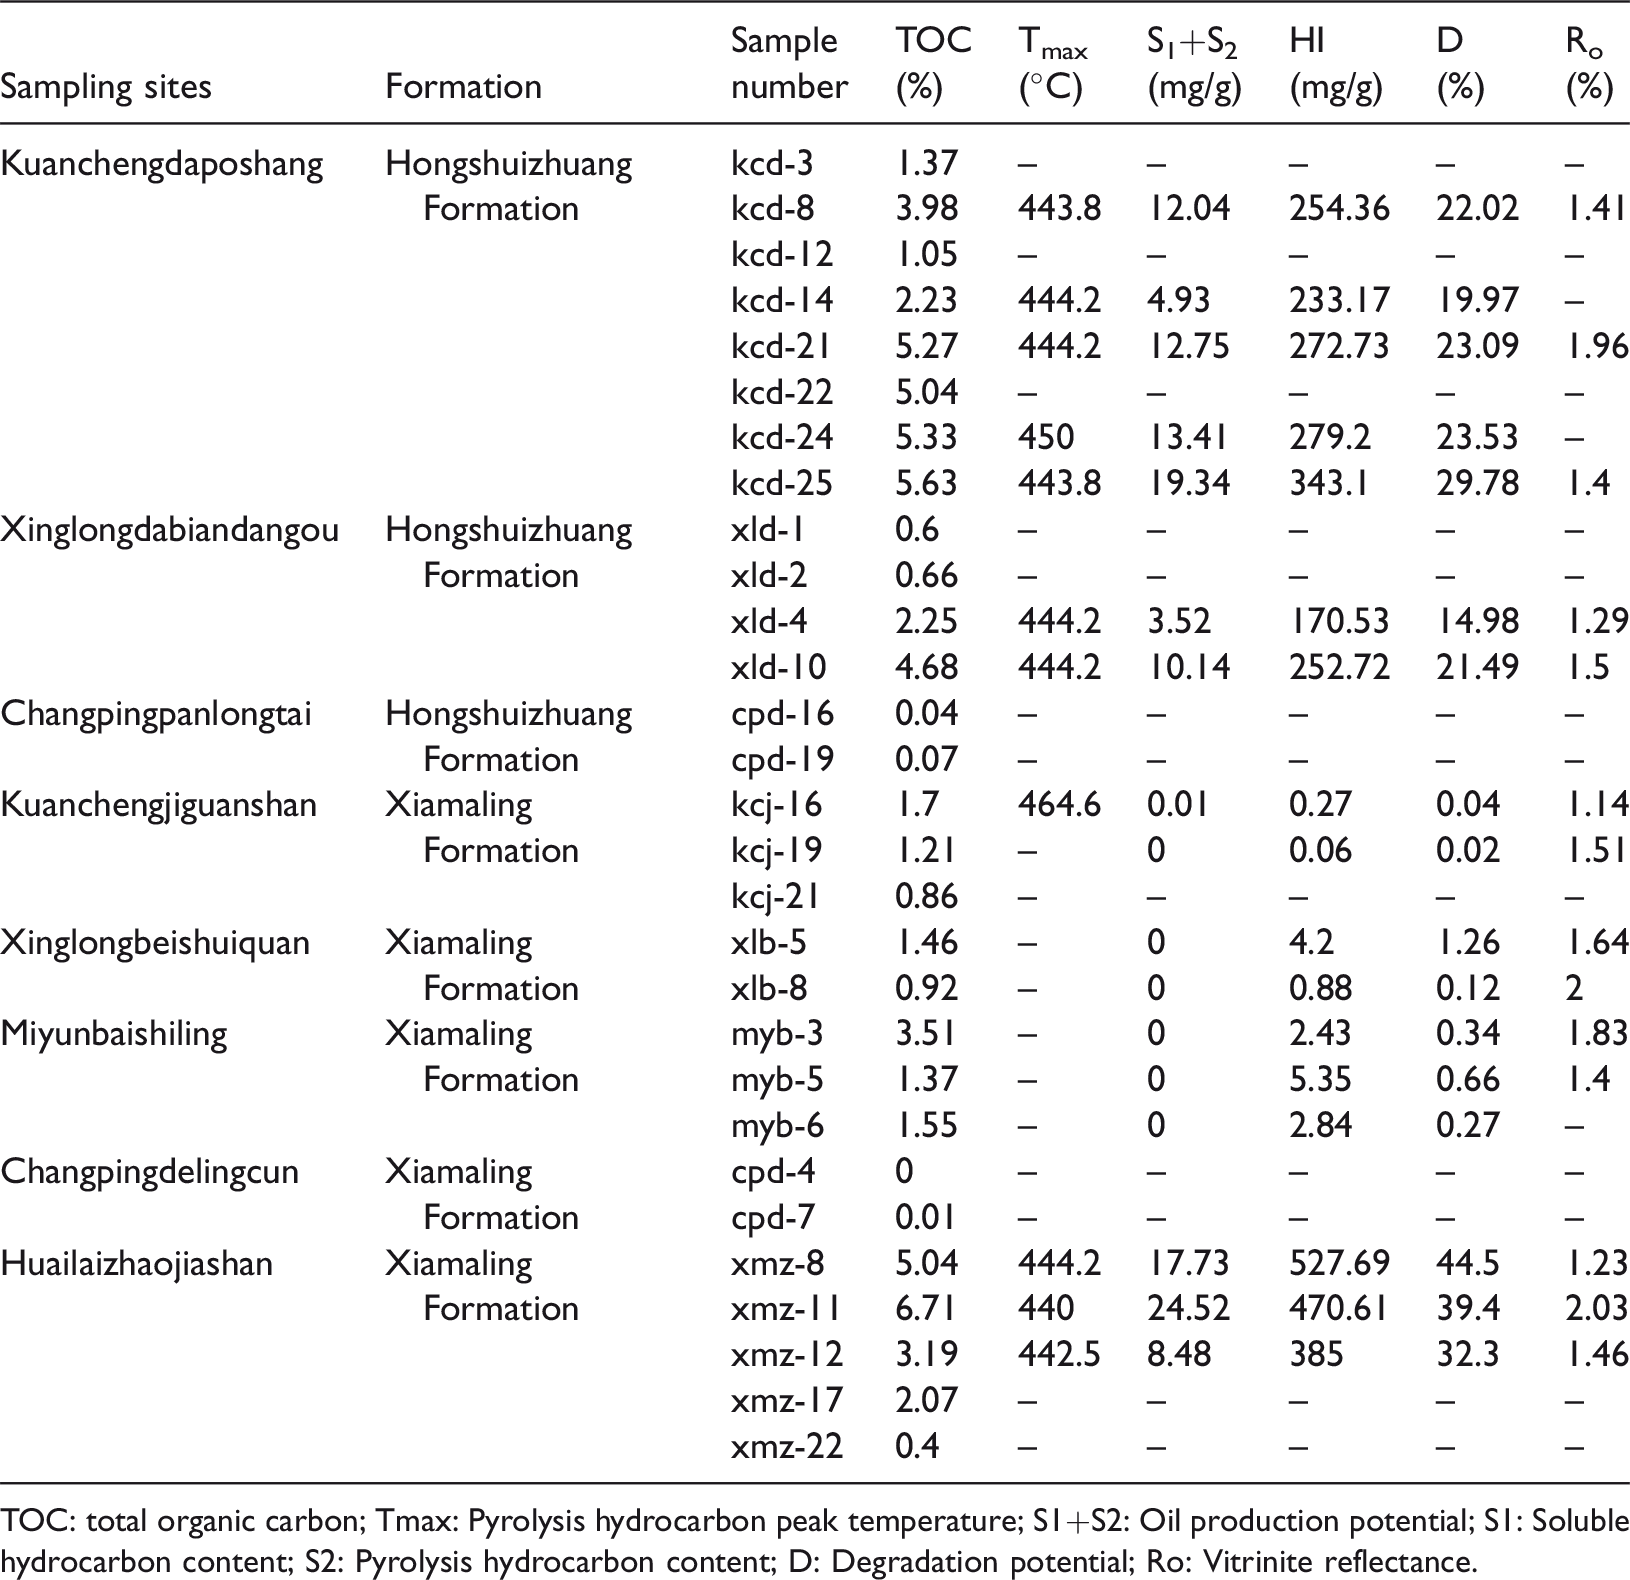
TOC: total organic carbon; Tmax: Pyrolysis hydrocarbon peak temperature; S1+S2: Oil production potential; S1: Soluble hydrocarbon content; S2: Pyrolysis hydrocarbon content; D: Degradation potential; Ro: Vitrinite reflectance.
According to the pyrolysis results, the organic matter types are of types I and II, which is the inevitable result of lower biogenic. The vitrinite reflectance (Ro) of Hongshuizhuang Formation is 1.4% to 1.96%, with an average of 1.51% and that of Xiamaling Formation is 1.14% to 2.03%, with an average of 1.58%. The organic matter of the sample has a high degree of evolution and is in the stage of massive gas production, indicating that they have good shale gas generation conditions.
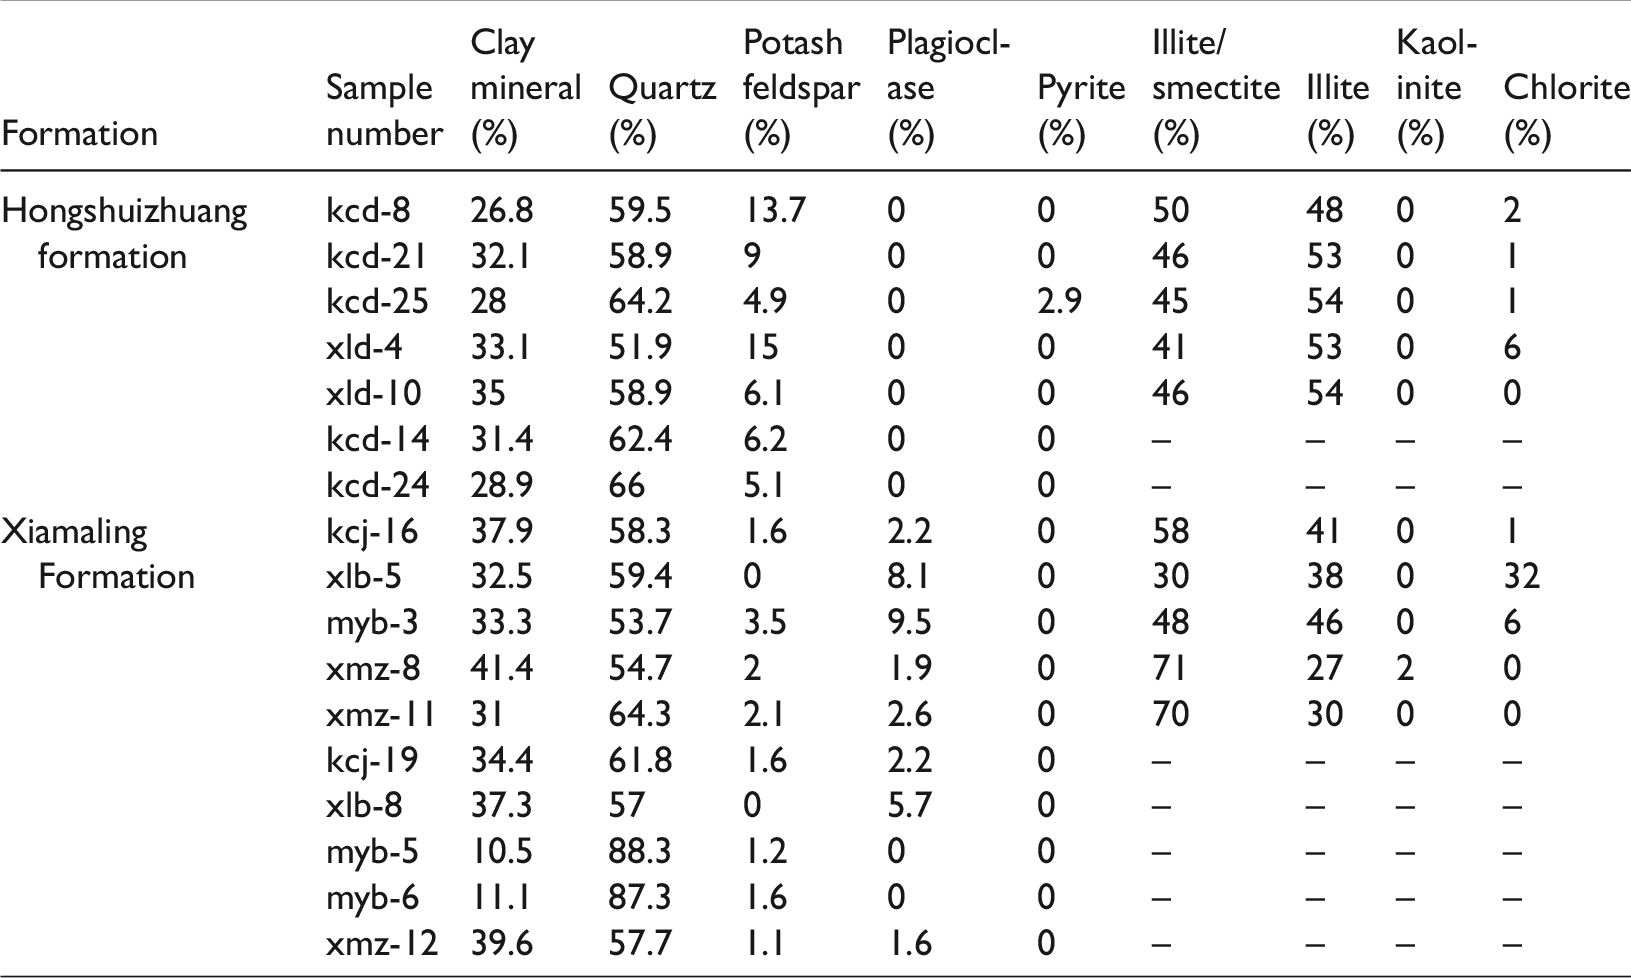
The whole rock XRD analysis of 7 samples from Hongshuizhuang Formation and 10 samples from Xiamaling Formation shows that the mineral composition of the shale mainly consists of quartz and clay minerals (Table 2). Quartz content ranged from 51.9% to 88.3%, with an average of 62.6%; clay mineral content ranged from 10.5% to 41.4%, with an average of 30.8%; potash feldspar content ranged from 1.1% to 15%, with an average of 4.4% (Figure 2). The average contents of clay minerals in the two groups are not the same, which are 30.8% and 30.9%, respectively; the average content of quartz of Xiamaling Formation (64.3%) is higher than that of Hongshuizhuang Formation (60.3%), and the average content of potash feldspar in the Hongshuizhuang Formation is 8.6% and that of the Xiamaling Formation is only 1.5%. Samples of Hongshuizhuang Formation do not contain plagioclase, while samples of Xiamaling formation have plagioclase content of 1.6%–9.5% with an average of 3.4%. Shale reservoirs with commercial development conditions, the content of brittle minerals, such as quartz, are generally higher than 40%, and clay mineral content is less than 30%. The middle Proterozoic shale has high content of brittle minerals, which is beneficial to the formation of artificial fracture (Jarvie et al., 2007; Zou et al., 2010). The results of XRD analysis of clay minerals show that the clay minerals of the two groups are mainly dominated by illite/smectite and illite, kaolinite and chlorite are less (Figure 3).
The mineral composition content of Mesoproterozoic shale samples in Yanshan area.
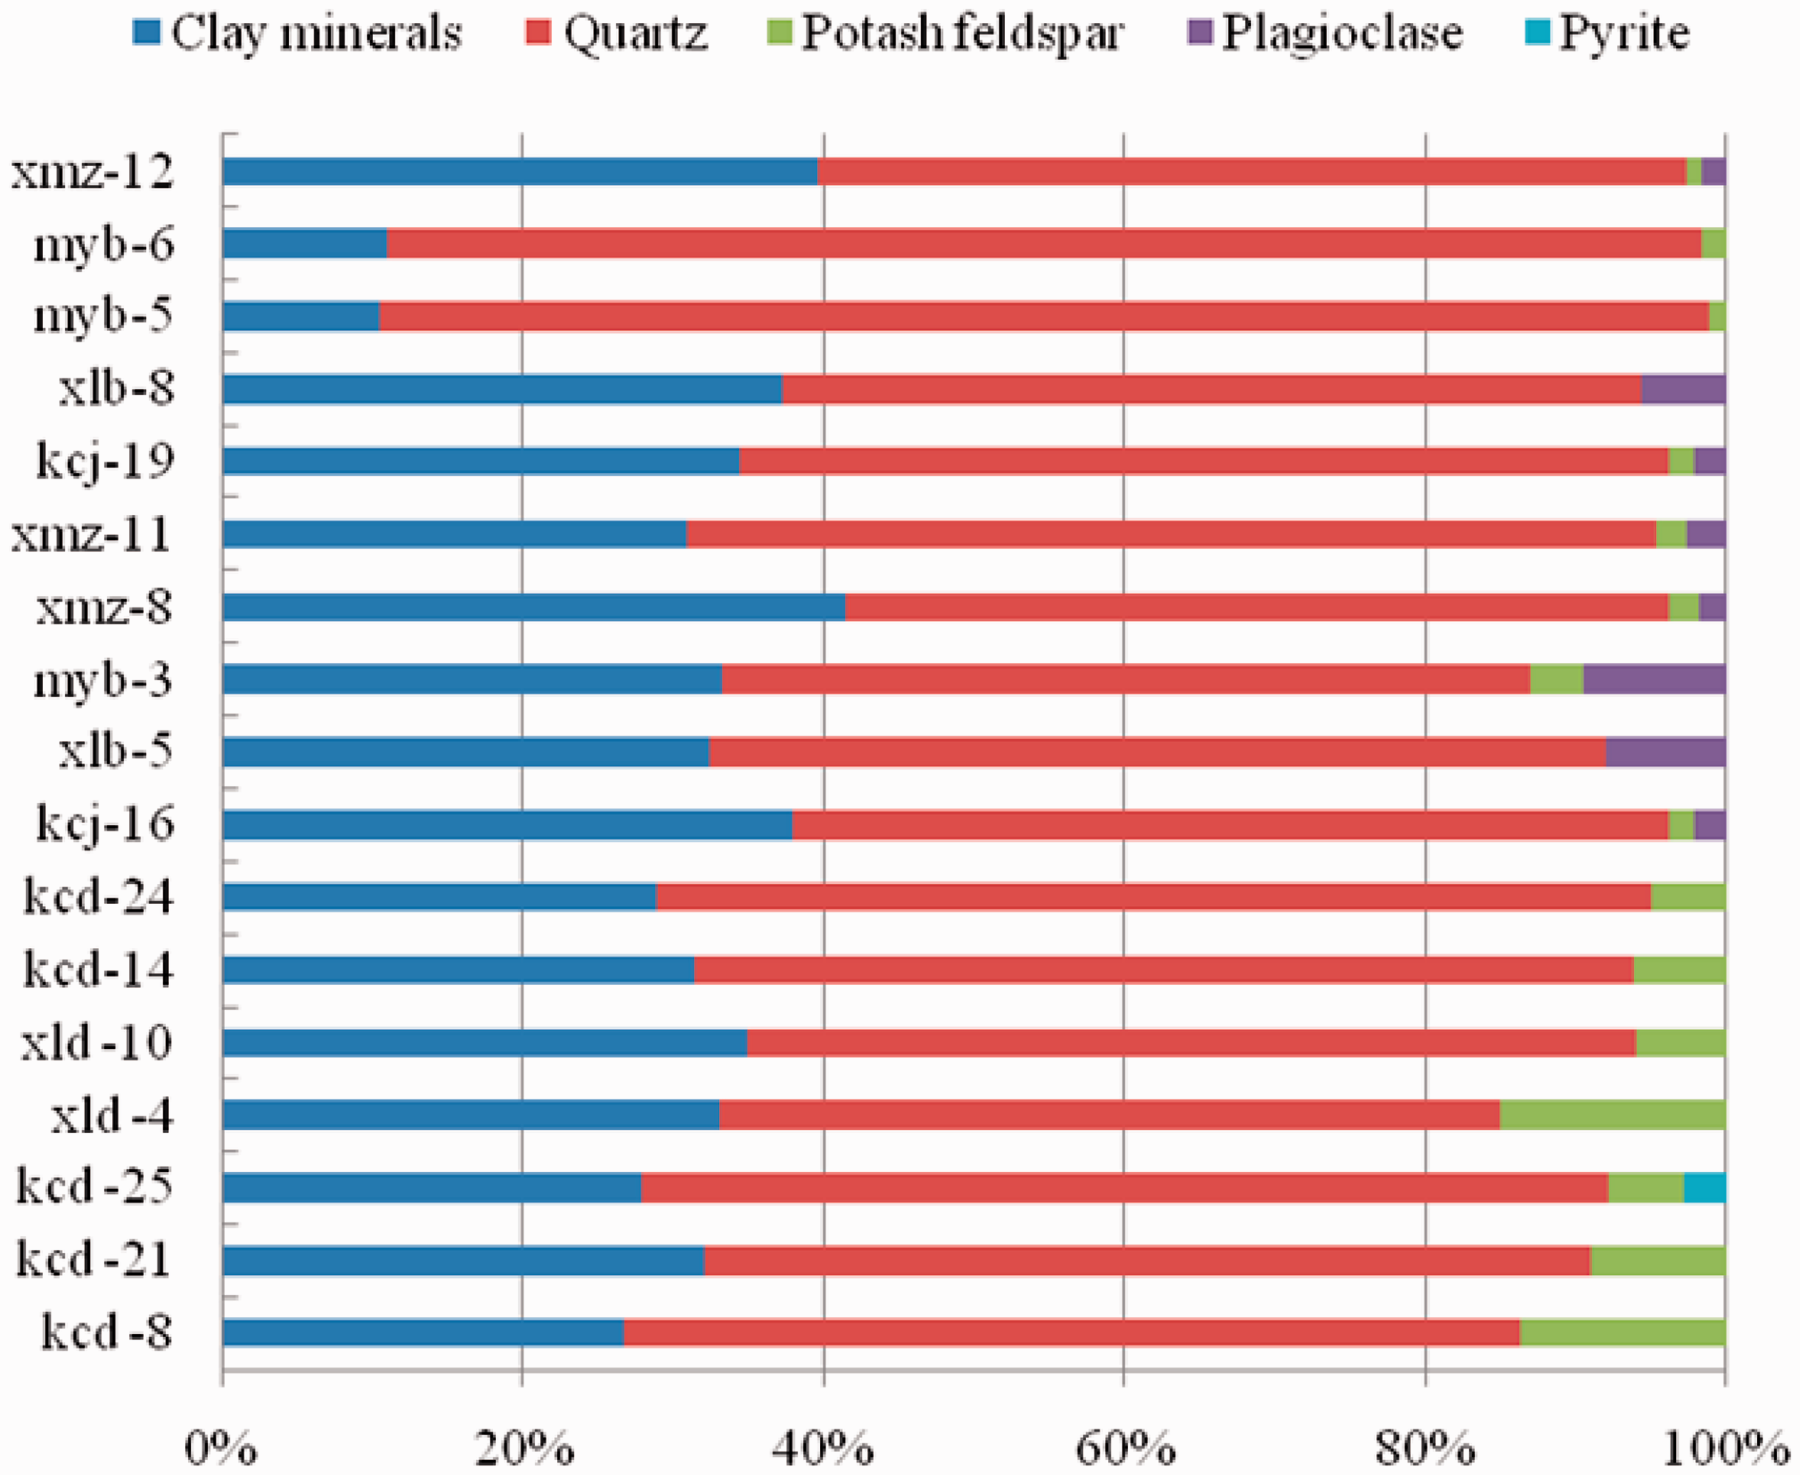
Mesoproterozoic shale mineral composition and content.
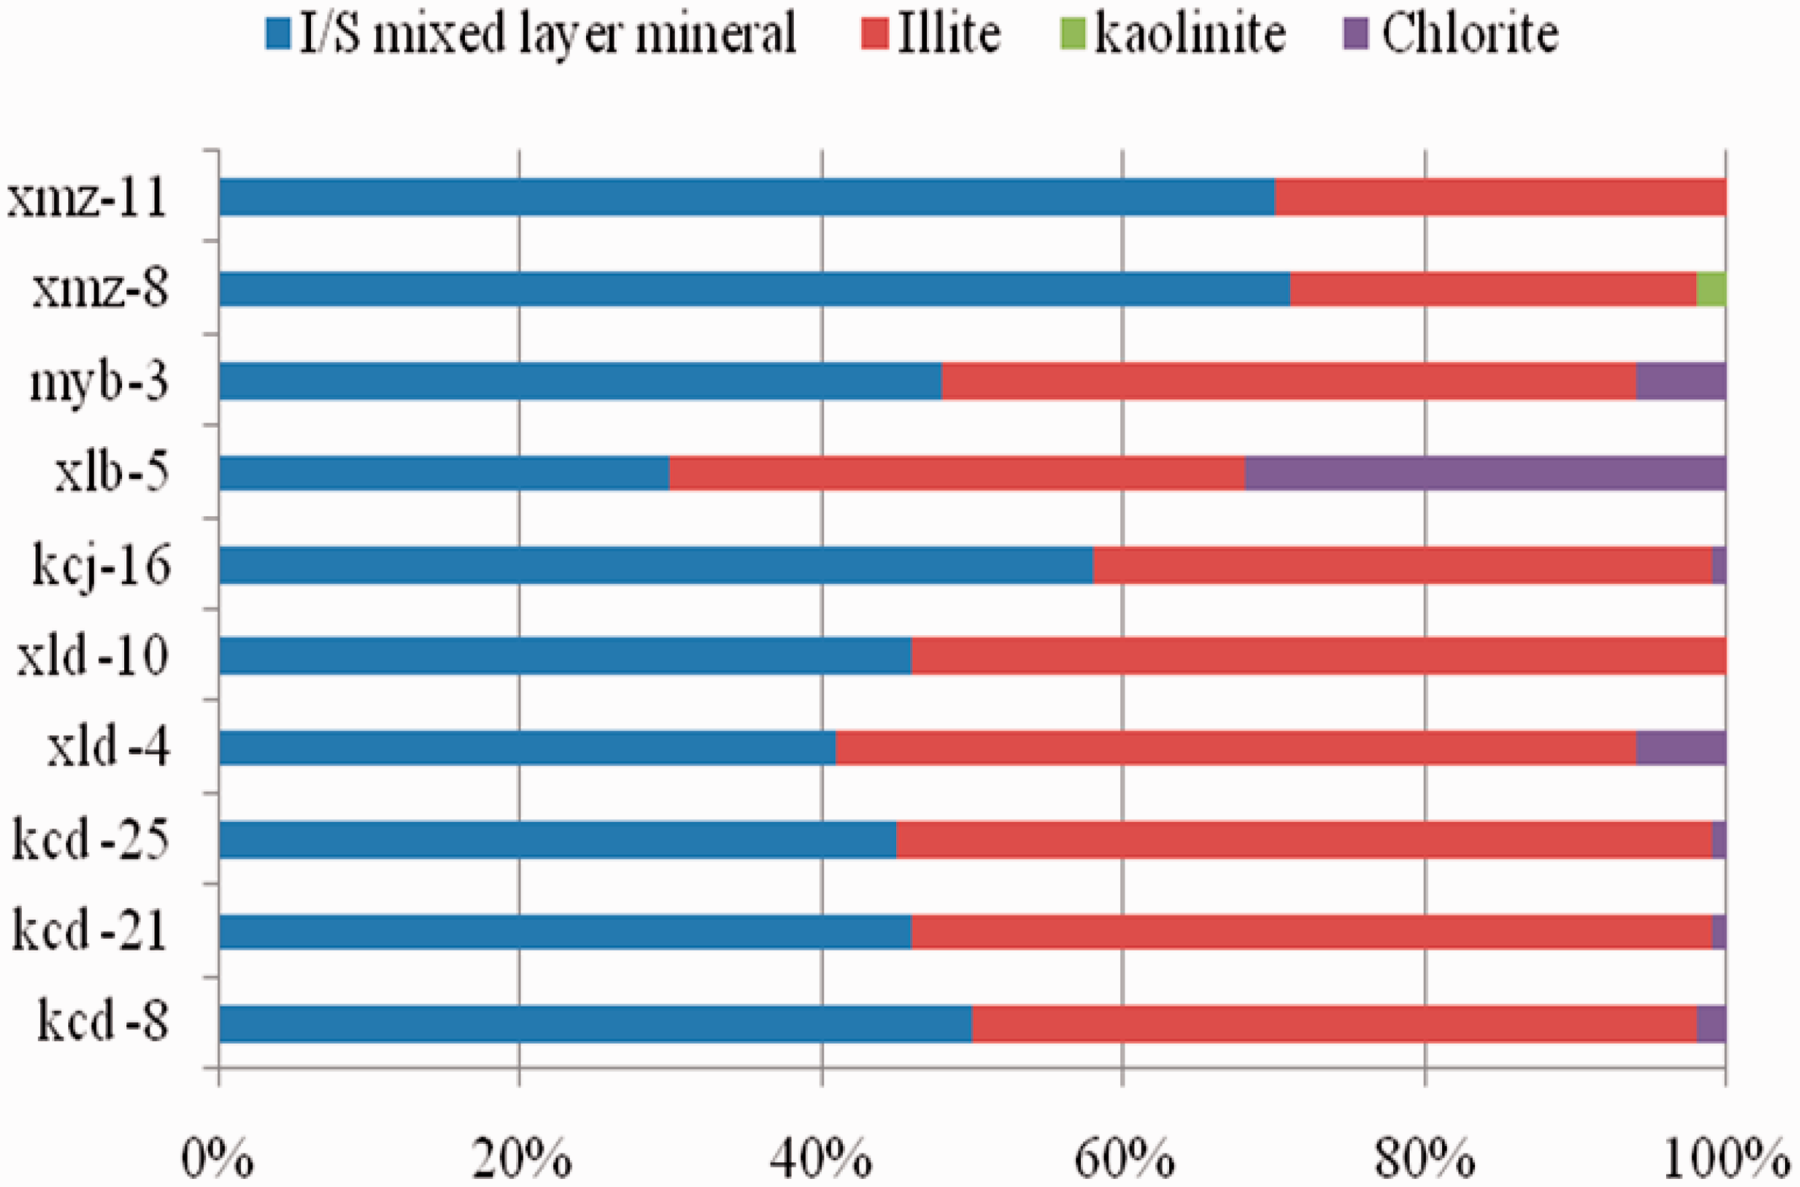
The composition and content of clay minerals in Mesoproterozoic shale.
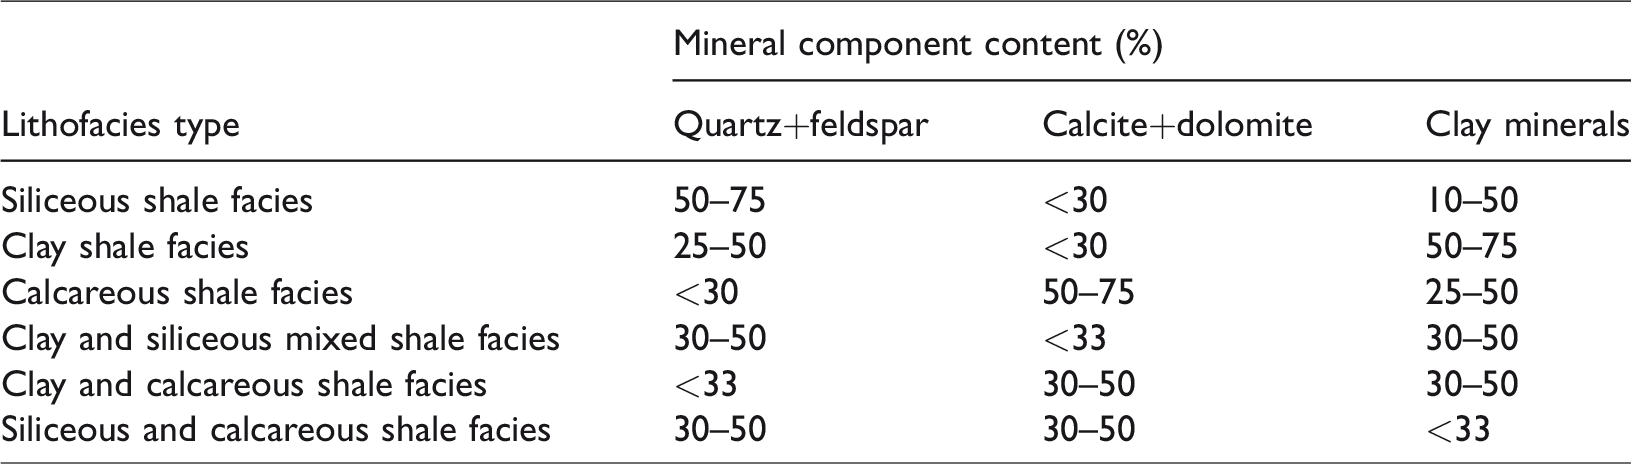
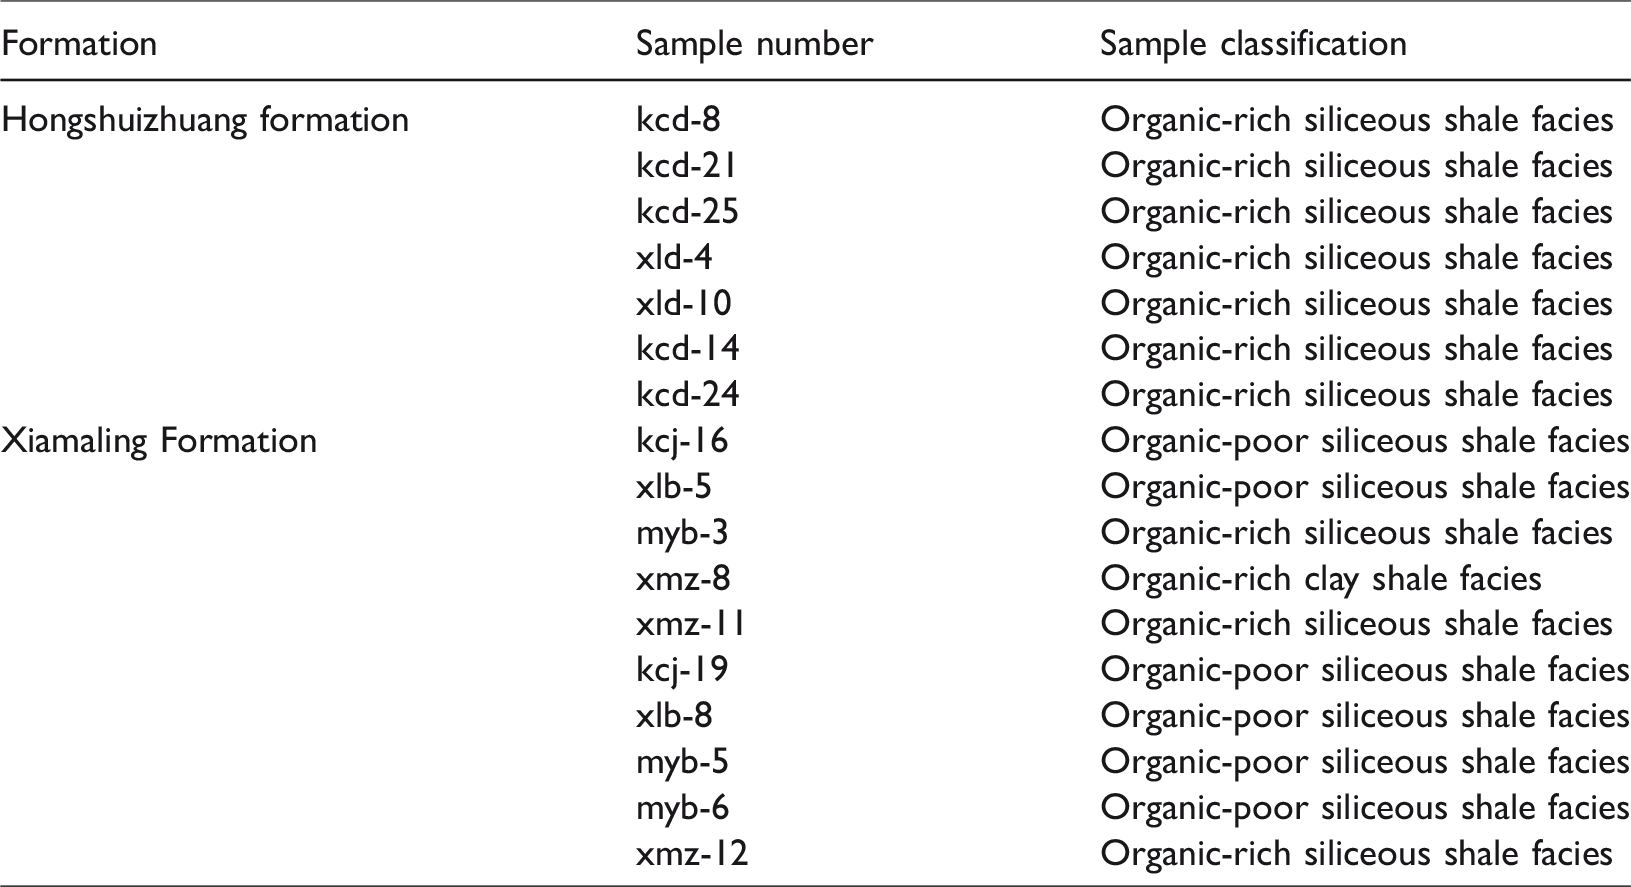
The different rocks can be classified by mineralogy and TOC content of each lithofacies. It is generally considered that the lower limit of TOC content of marine shale with economic exploitation of shale gas is 2% (Jiao et al., 2016). Therefore, the content of TOC in organic-rich shale is higher than 2%, whereas the TOC content of organic-poor shale is less than 2%. Secondly, the content of clay minerals, calcite + dolomite, and quartz + feldspar is used as three terminal members to classify lithofacies. The mineral composition of each lithofacies is shown in Table 2 (Jiang et al., 2016; Wang et al., 2016). The classification for the different rocks is shown in Table 3 and 4.
Classification scheme of marine shale.
Classification of samples.
Experimental methods
Low-temperature liquid nitrogen adsorption test was carried out using V-Sorb 2800TP rock specific surface and pore size distribution instrument based on SY/T 6154-1995. The relative pressure varies from 0.01 to 0.99 with a measurable aperture range of 2 nm to 160 nm. Brunauer, Emmett and Teller (BET) method was used to calculate specific surface area, and pore volume was calculated by Barrett, Joyner and Halenda (BJH) method. The AutoPore IV9510 automatic mercury porosimeter was used for the test. The contact angle between metal mercury and coal surface is 140°, the mercury surface tension was 480 dyn/cm, and the measured pore diameter range was more than 3.0 nm. The shale surface was observed by FEI Quanta450FEG high-resolution field emission scanning electron microscope (SEM). Adsorption test was carried out by the IS-300 isothermal adsorption instrument. The experimental data were processed according to the Langmuir monolayer adsorption principle. The overall temperature error is controlled within 0.2°, the adsorption equilibrium time of each pressure point is more than 12 h, and the methane purity is 99.99%.
Results and discussion
SEM analysis
Intergranular pores, intragranular pores, and organic pores can be seen under an SEM (Loucks et al., 2012). Among them, abundant organic matter has been observed in the dark shale of the Hongshuizhuang Formation and Xiamaling Formation, and a large number of organic pores were formed.
Intergranular pores are commonly found between mineral particles, including intergranular pores formed by the irregular packing of mineral grains (Figure 4(a) and (f)), and the intergranular pores between aggregates of flocculent clay minerals (Figure 4(c)), including intercrystalline pores of mineral particles (Figure 4(e)). The morphology of intergranular pores is irregular. The shape of intergranular pore is different, and it is irregular polygon, the size of which is between nanometer and micron, and the intergranular pores formed by flocculent clay minerals have good connectivity, while the mineral dissolution pores and intercrystalline pores are relatively isolated.
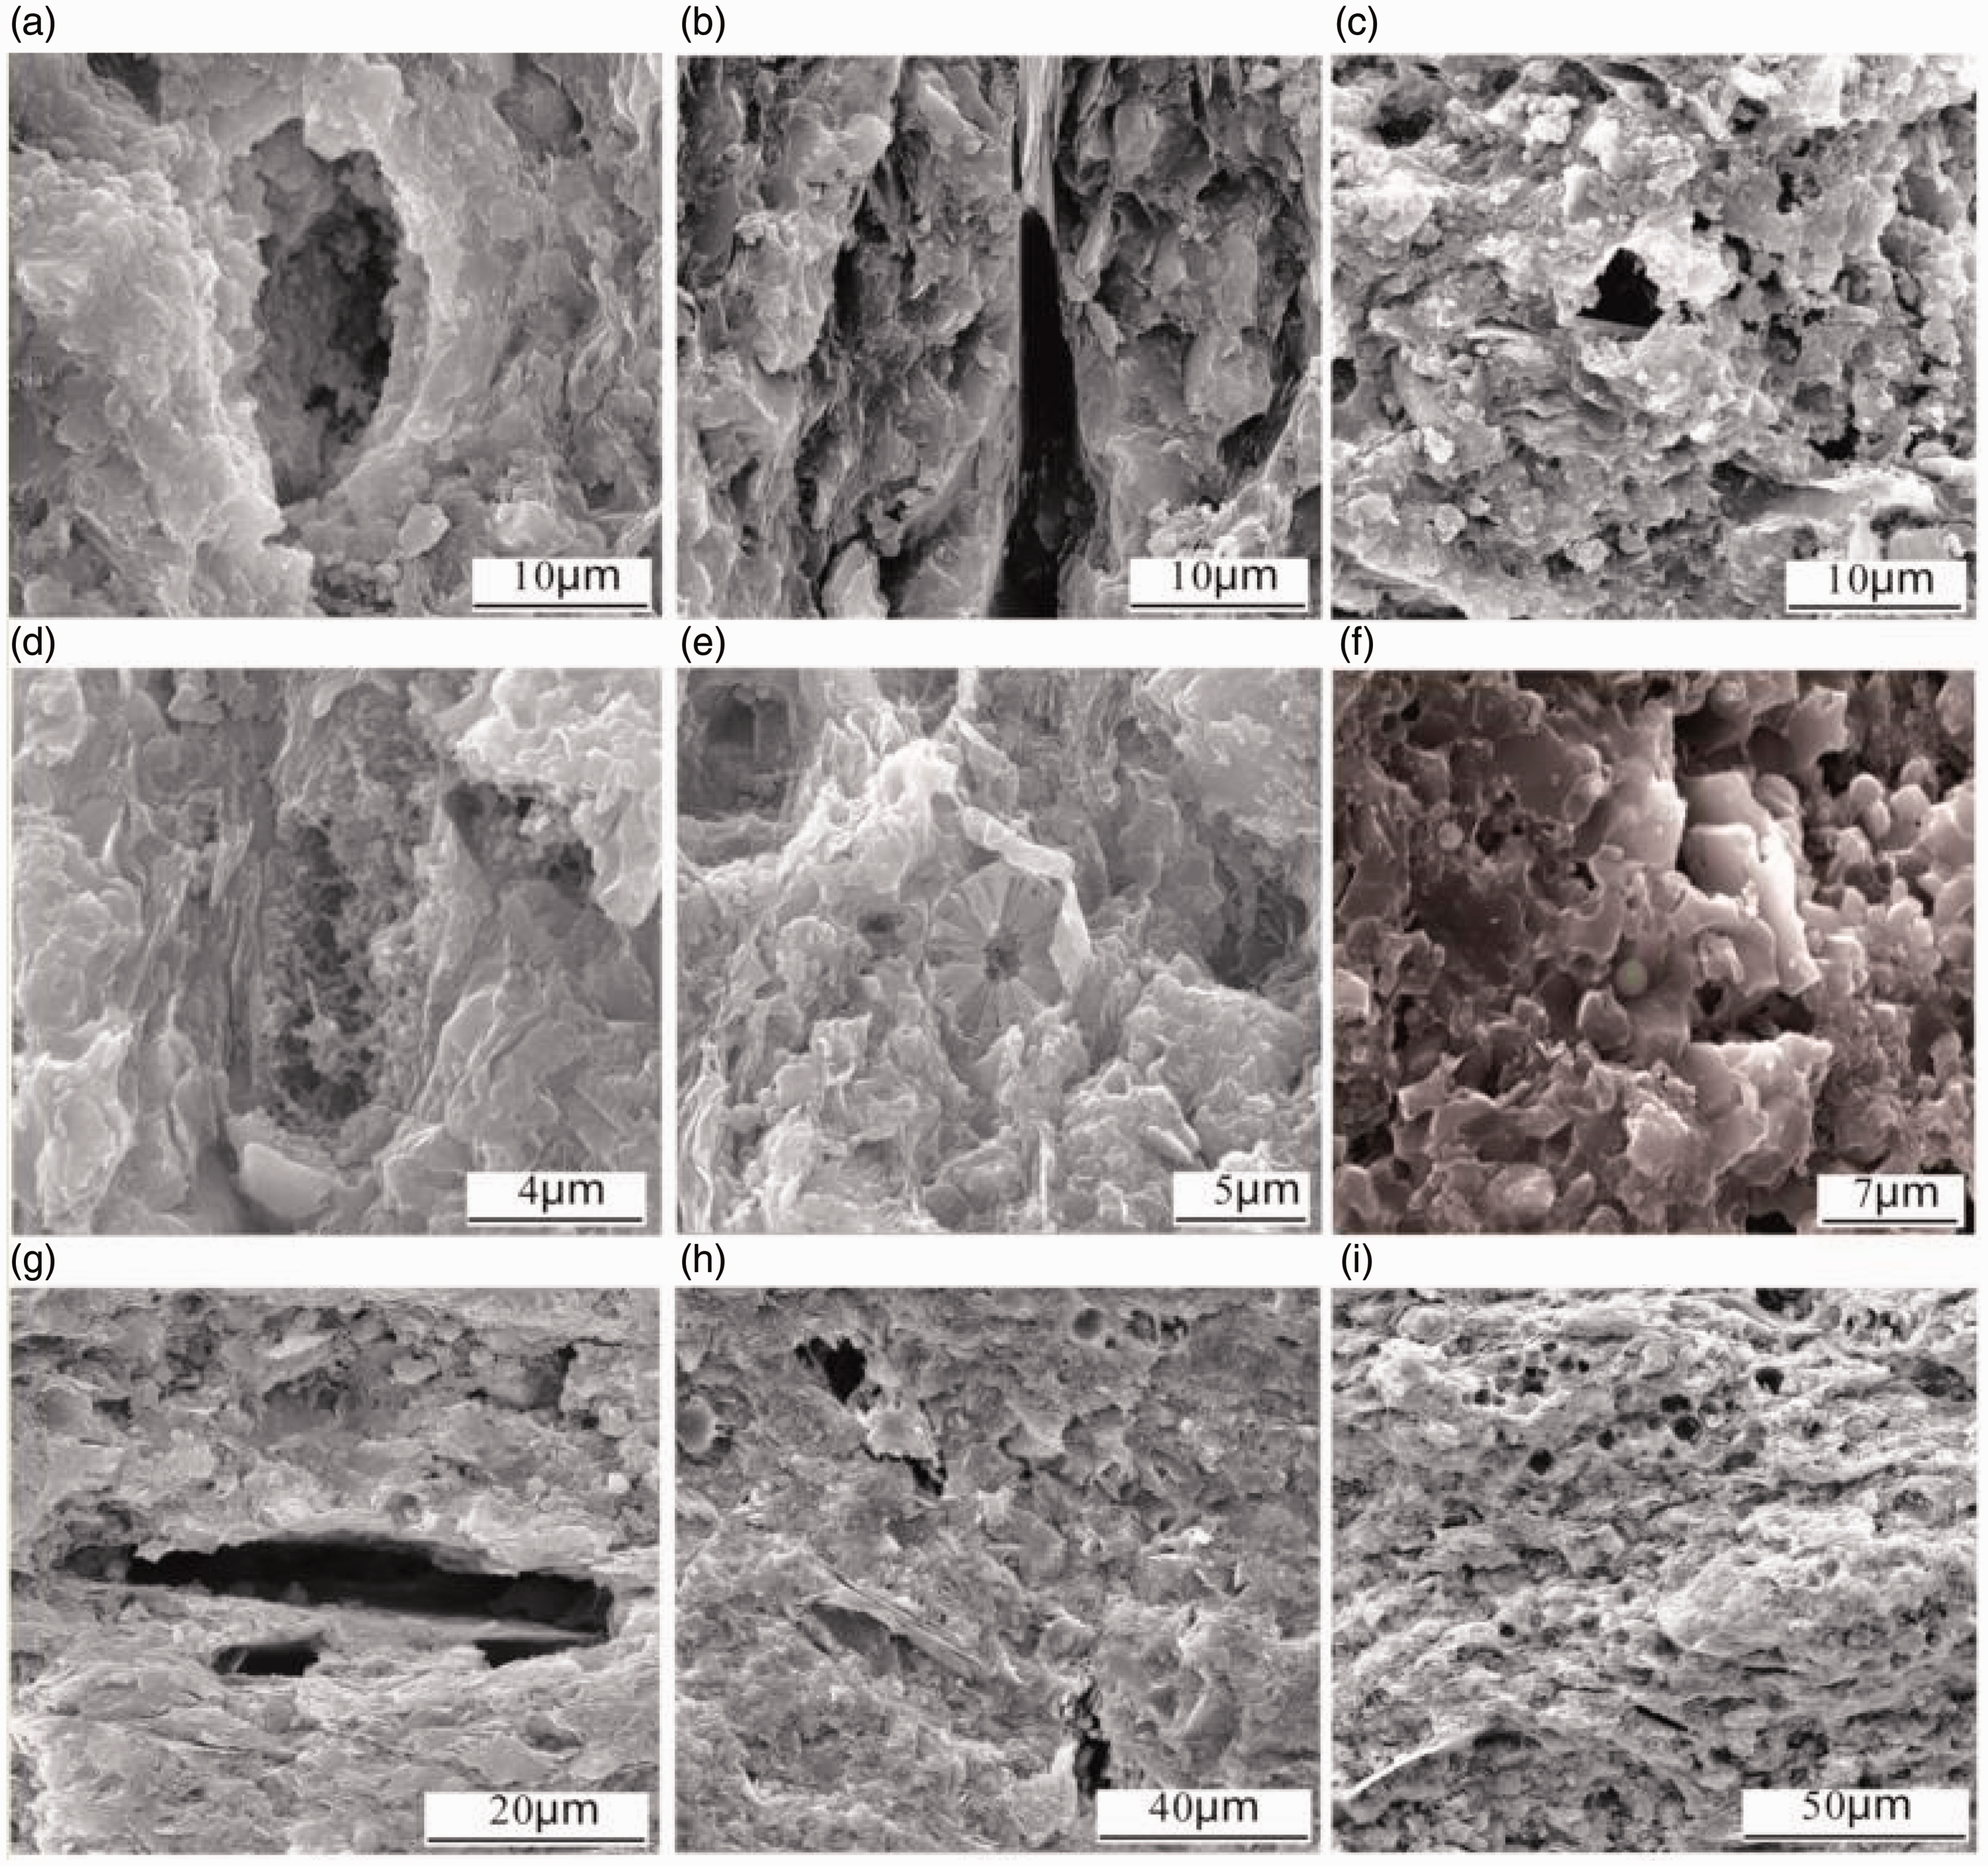
Intergranular and intragranular pore characteristics of Mesoproterozoic shale in Yanshan area. (a) intergranular pore of clay minerals, Hongshuizhuang Formation of Kuanchengdaposhang, (b) interlaminar pores of clay minerals, Hongshuizhuang Formation of Kuanchengdaposhang, (c) piled pore of clay minerals, Hongshuizhuang Formation of Xinglingdabiandan, (d) fossilized pore, Xiamaling Formation of Huailaizhaojiashan, (e) mineral intercrystalline pore, Xiamaling Formation of Huailaizhaojiashan, (f) intergranular pores of quartz, Xiamaling Formation of Miyunbaishiling, (g) interlaminar pore of clay mineral, Xiamaling Formation of Kuanchengjiguanshan, (h) mineral dissolution pore, Xiamaling Formation of Xinglongbeishuiquan, and (i) intragranular pore of mineral, Xiamaling Formation of Kuanchengjiguanshan.
Intragranular pores are develop in the interior of the granule, which are mainly composed of interlayer pores formed during the transformation of clay minerals (Figure 4(b), (g), and (i)), and dissolution pores formed by dissolution of feldspar, calcite, and other mineral particles (Figure 4(h)), also includes fossil pore of Paleontological fossil remains (Figure 4(d)). The shape of intragranular pore varies with the cause of formation. The interlayer pores of clay minerals are generally parallel plates, extending several tens of microns and several microns in width. The dissolution pores are irregular, relatively isolated, and the pore size is mostly of a few microns. There are a small number of fossil holes in the shale, and the fossils are well preserved and well connected, most of which are nanoscale.
A large number of microcracks exist in the Mesoproterozoic samples in the study area, mostly clay mineral interlayer fractures, and the extension is good. The width is generally several microns, and the length is from tens of microns to hundreds of microns. It is generally open and interlinked with other types of pores to form an intricate three-dimensional seepage network that facilitates the seepage and migration of shale gas (Figure 5).
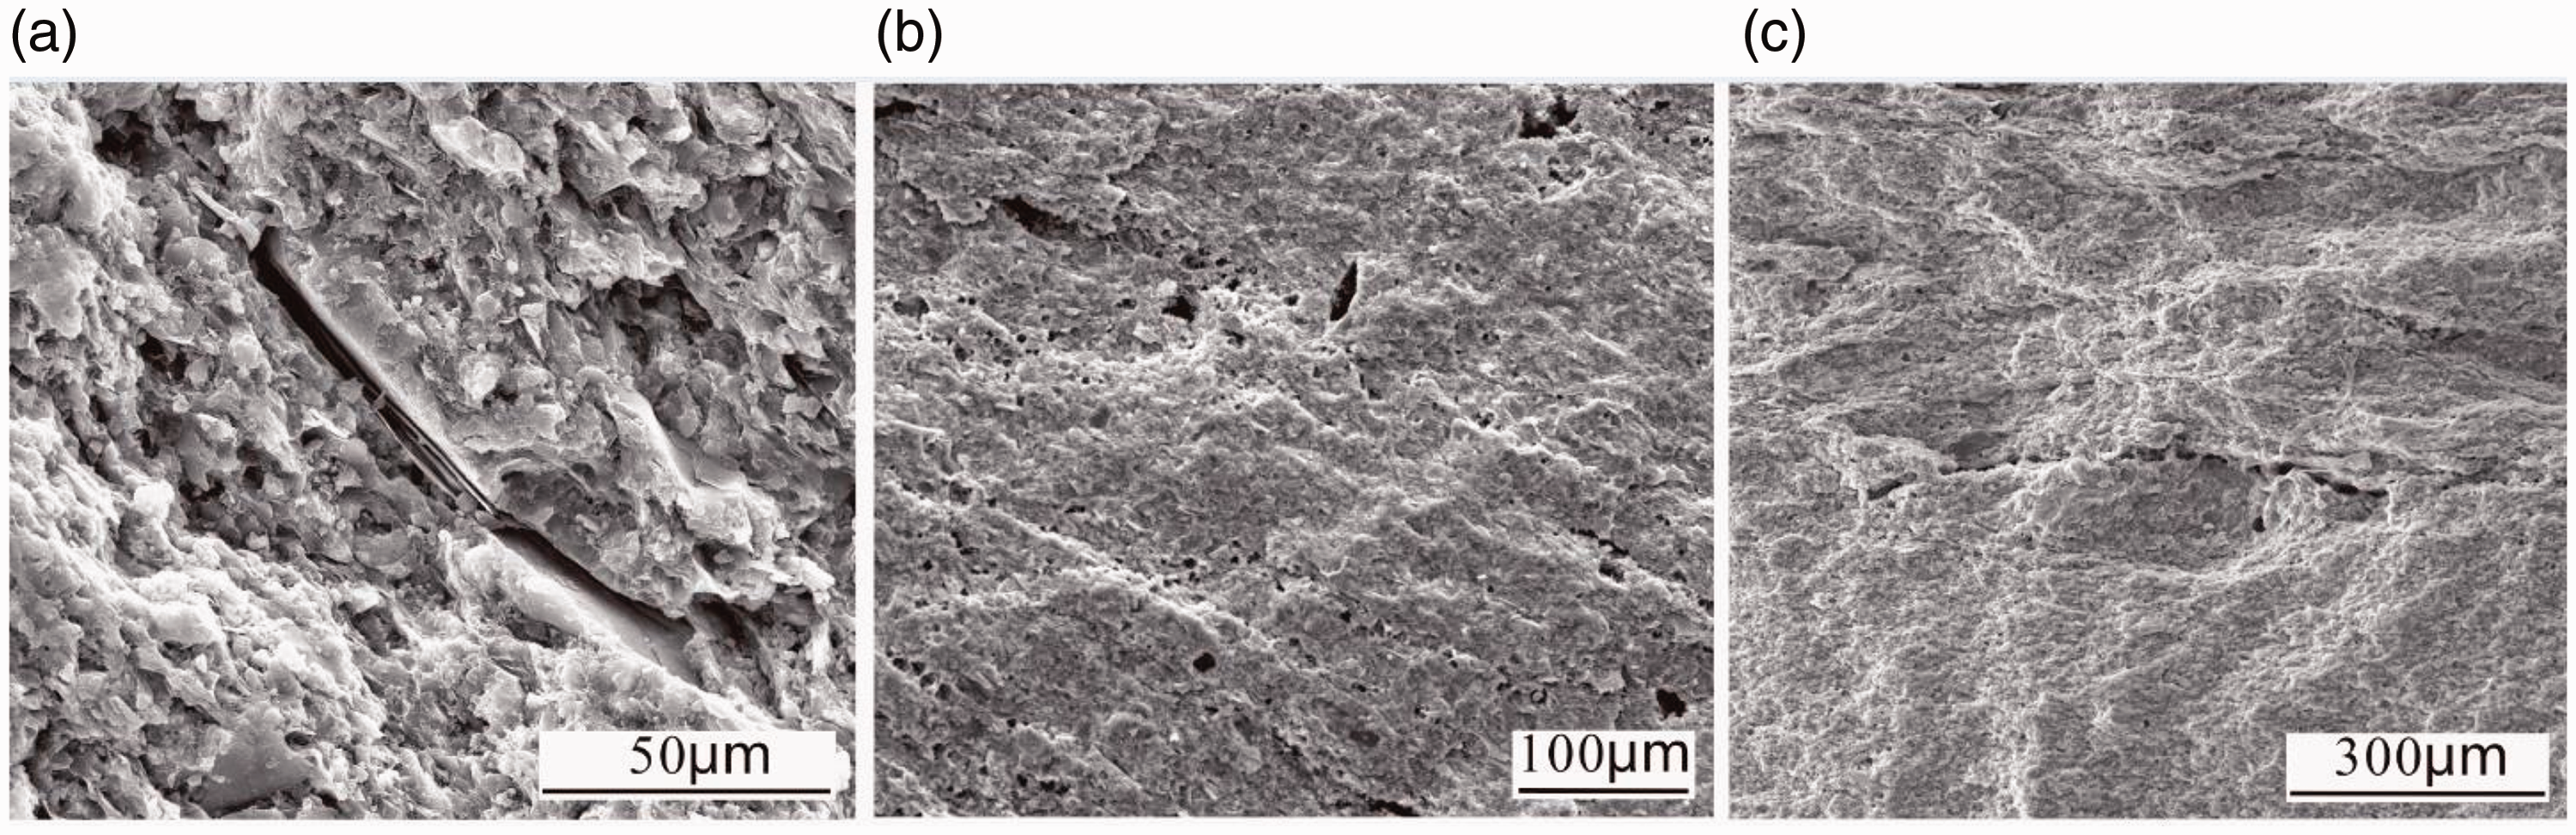
Microfractures in Mesoproterozoic shale in Yanshan area. (a) Interlayer microfracture of clay minerals, Hongshuizhuang Formation of Xinglongdabiandangou. (b) The microcracks between the clay minerals are developed and connected to the other types of microporous gaps to form a system, Xiamaling Formation of Xinglongbeishuiquan. (c) Interlayer microfracture of clay minerals extending up to hundreds of microns, Xiamaling Formation of Xinglongbeishuiquan.
Low-temperature nitrogen adsorption analysis
As shown in Figure 6, the morphology of low-temperature nitrogen adsorption–desorption curves of five samples from Hongshuizhuang formation and nine samples from Xiamaling formation shows an overall anti-S pattern, which is similar to type II adsorption isotherm (Chen et al., 2012). In the section with higher relative pressure (P/P0 > 0.4), the adsorption isotherms and desorption isotherms of the samples do not overlap, forming a hysteresis loop, indicating that there is no adsorption saturation when the saturated vapor pressure is reached, and there are some mesopores and macropores in shale samples (Chen and Tang, 2001). According to the classification of International Union of Pure and Applied Chemistry (IUPAC), the hysteresis loop of the sample is close to that of the H2-type hysteresis loop and has the characteristic of the H3-type hysteresis loop.
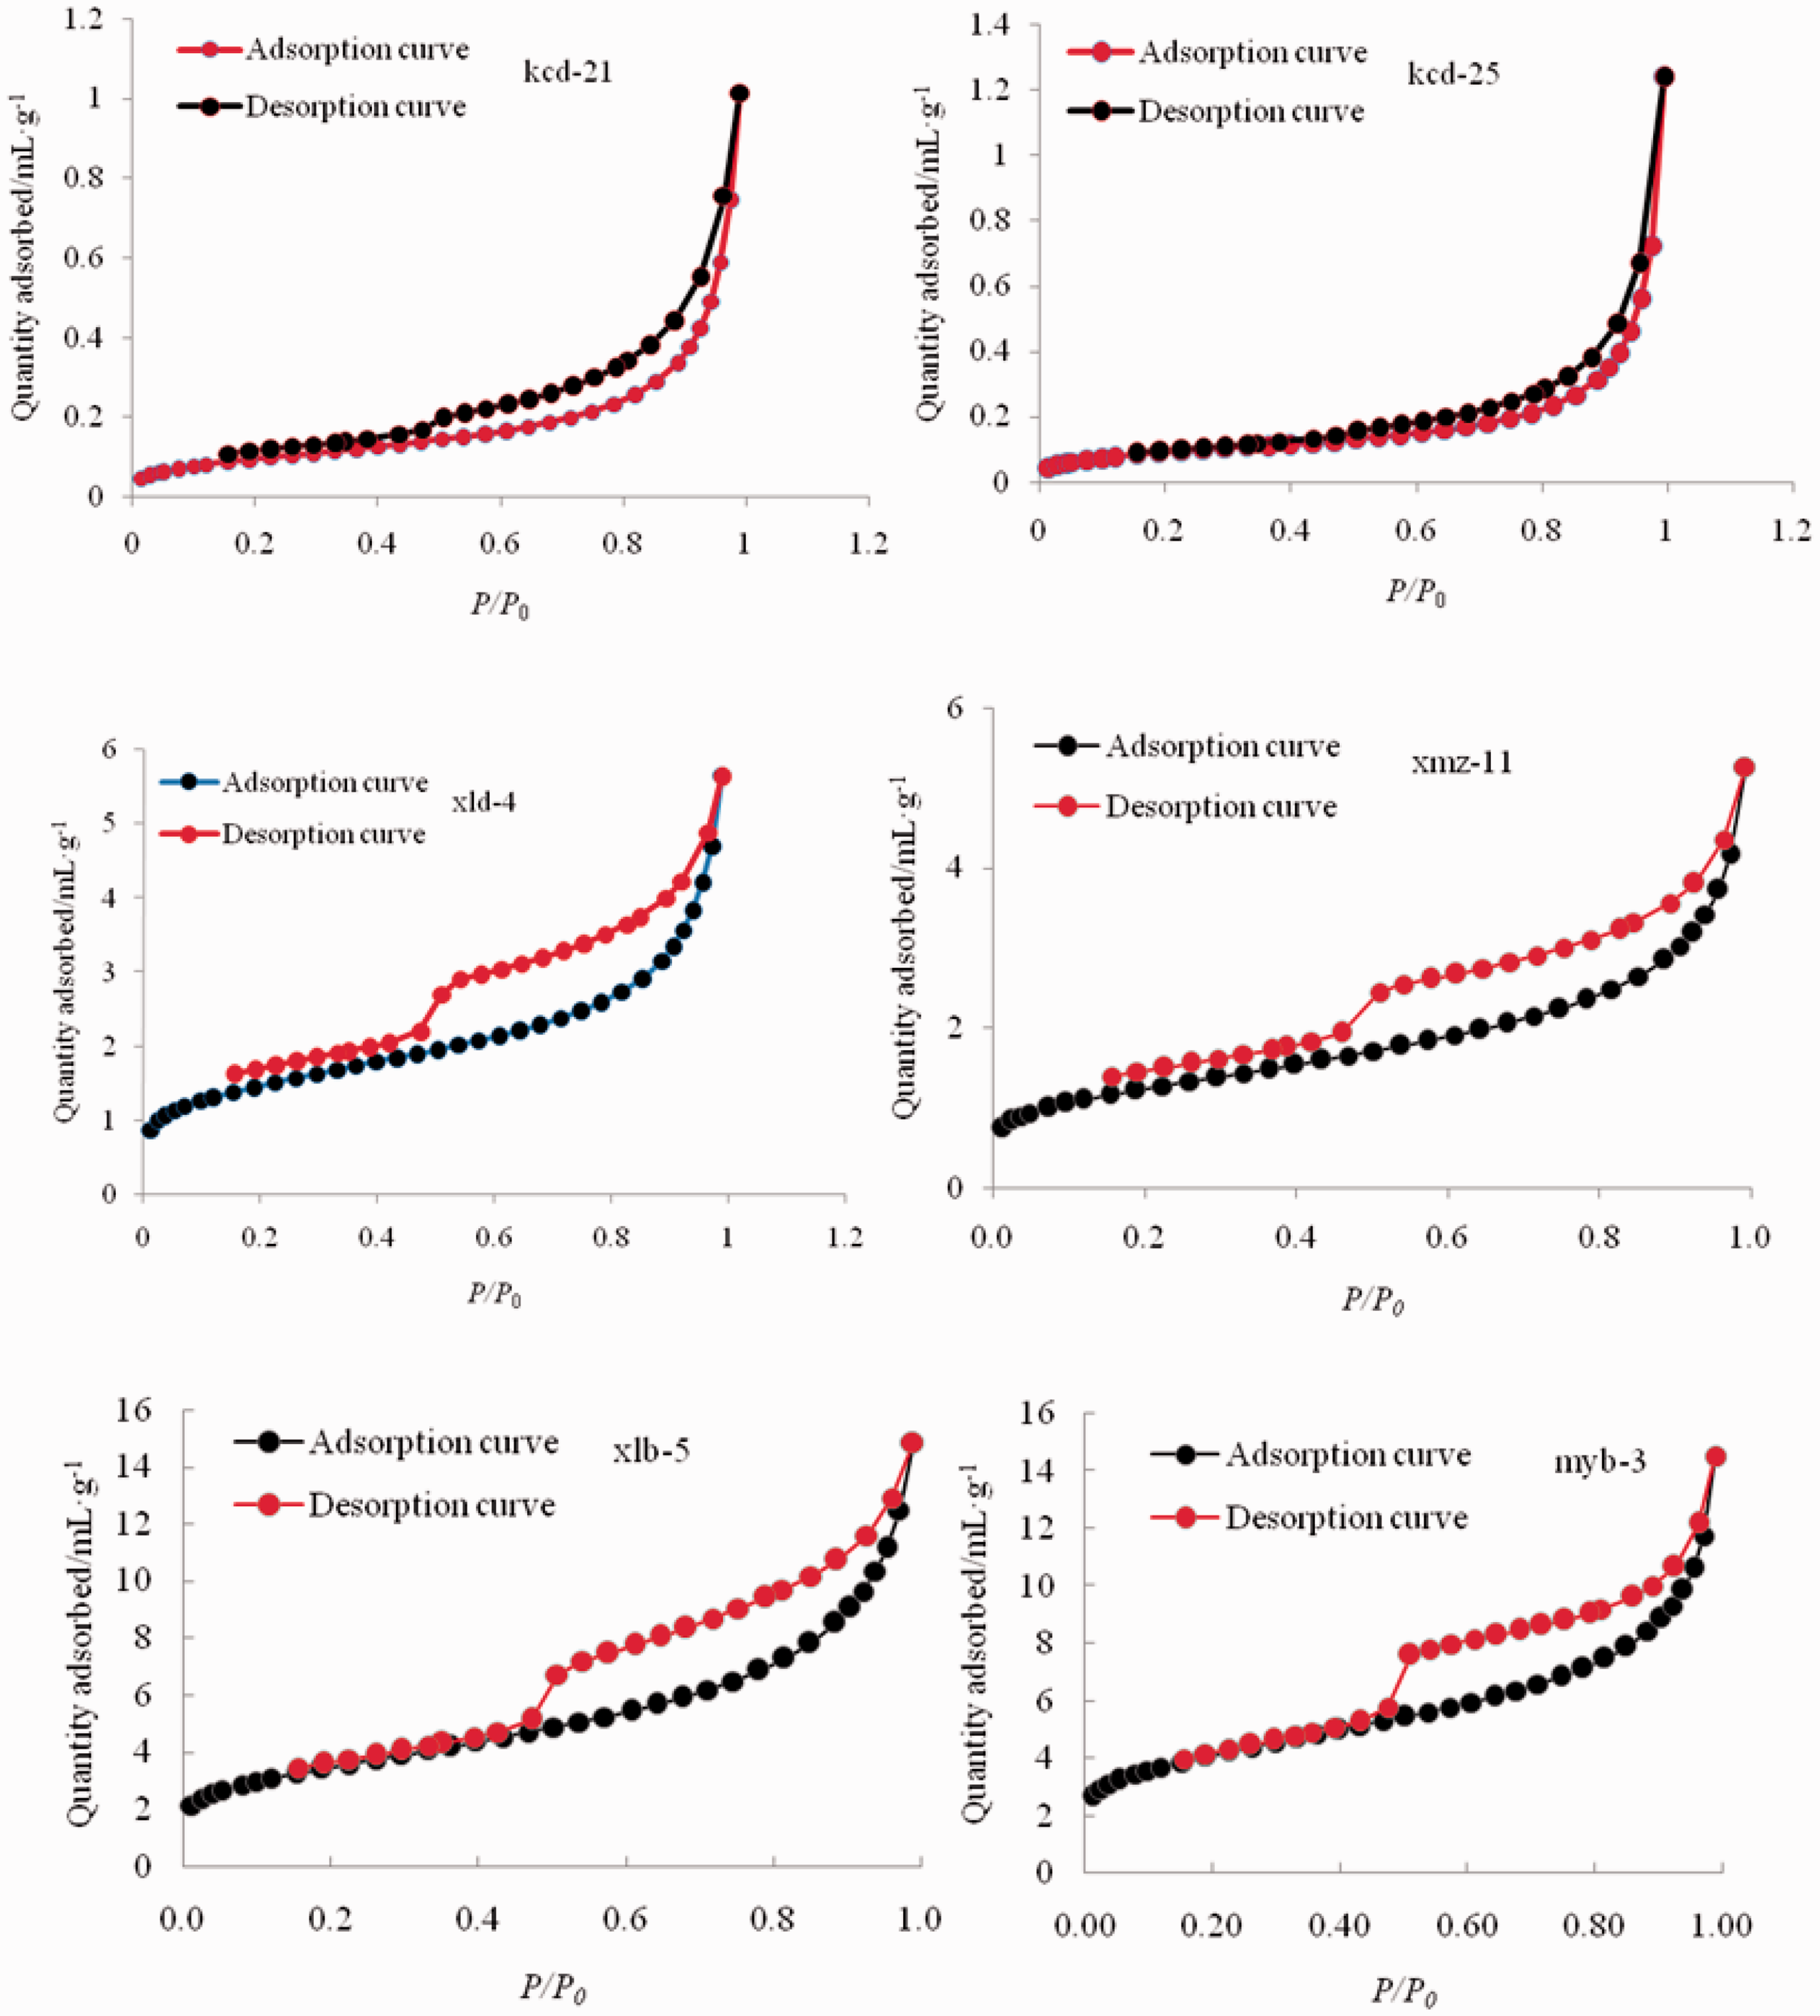
Adsorption–desorption curves of Mesoproterozoic shale samples in Yanshan area.
Further analysis shows that the adsorption–desorption curves of 14 shale samples can be divided into three types (Figure 6).
Type A: Take kcd-21 and kcd-25 as the representatives. There is no obvious turning point in the desorption curve. When the relative pressure is less than 0.4, the adsorption–desorption curve almost coincides, the adsorption volume is small, and the hysteresis loop is narrow. The pores of this kind of shale samples are mainly impermeable pore closed at one end, and also contain a small amount of open pores, which are beneficial to the migration of shale gas and unfavorable to the adsorption of gases.
Type B: Take xld-4 and xmz-11 as the representatives. This type includes kcd-8, xld-10, xmz-8, and xmz-12. When the relative pressure is about 0.5, the desorption curve shows an obvious inflection point. When the relative pressure is less than 0.4, the desorption curve and the adsorption curve do not coincide, indicating that there may be a certain number of micropores in the shale sample, capillary coalescence occurs, and less pressure is required to evaporate and desorption. The adsorption volume is medium and hysteresis loop increases. The pores of these shale samples are mainly cylindrical pores with two ends open, around the opening of a parallel plate pore; they also contain a number of inkwell pores.
Type C: Take xlb-5 and myb-3 as the representatives. This type includes kcj-16, kcj-19, xlb-8, and myb-5. The desorption curve shows an obvious turning point when the relative pressure is about 0.5, and the desorption curve drops faster. When the relative pressure is less than 0.4, the desorption curve and adsorption curve coincide. The adsorption volume and the hysteresis loop are larger. This kind of shale samples contain open pore and inkwell pore, and the number of ink bottle pore is higher than that of Type B.
Pore specific surface area, pore volume, pore size distribution, and porosity
The specific surface area of the 14 shale samples is 0.34 m2/g to 14.57 m2/g with an average of 6.89 m2/g using the BET model. The average surface area of Hongshuizhuang Formation and Xiamaling Formation is 2.46 m2/g and 9.35 m2/g, respectively (Table 5). The pore volume of the samples is 0.004 mL/g to 0.029 mL/g with an average of 0.0128 mL/g. The average pore volume of Hongshuizhuang Formation and Xiamaling Formation is 0.0045 mL/g and 0.0173 mL/g, respectively (Table 5). The average pore size of the samples is 3.728 nm to 12.609 nm with an average of 5.635 nm. The average pore size of Hongshuizhuang Formation is larger than that of Xiamaling Formation.
Liquid nitrogen data of Mesoproterozoic shale samples in Yanshan area.
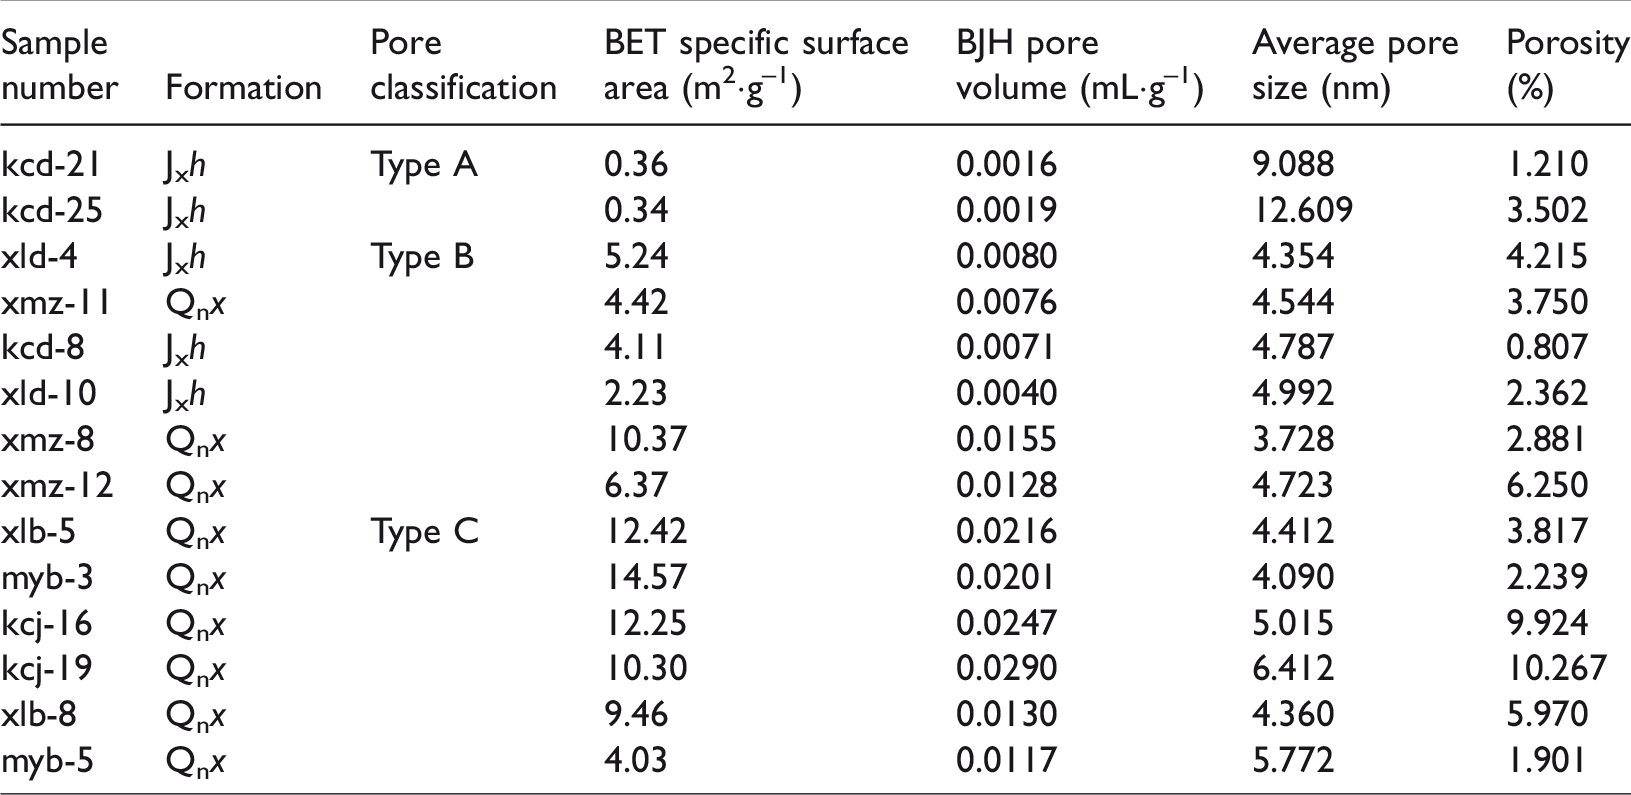
Figure 7 shows the pore size distribution of six typical samples of Type A, Type B, and Type C. The pore size distribution of Type A is mainly between 2nm – 4nm and 18 nm. The peak value of the pore size of Type B and Type C is between 2 nm and 4 nm. The specific surface area, pore volume, and average pore size of three types also have the obvious characteristics of classification. The average pore size of Type A is the largest, the specific surface area and pore volume are the smallest. The pore size of Type B is the smallest, the pore specific surface area and pore volume are moderate. The pore size of Type C is moderate, and the specific surface area and pore volume are generally larger (Table 5).
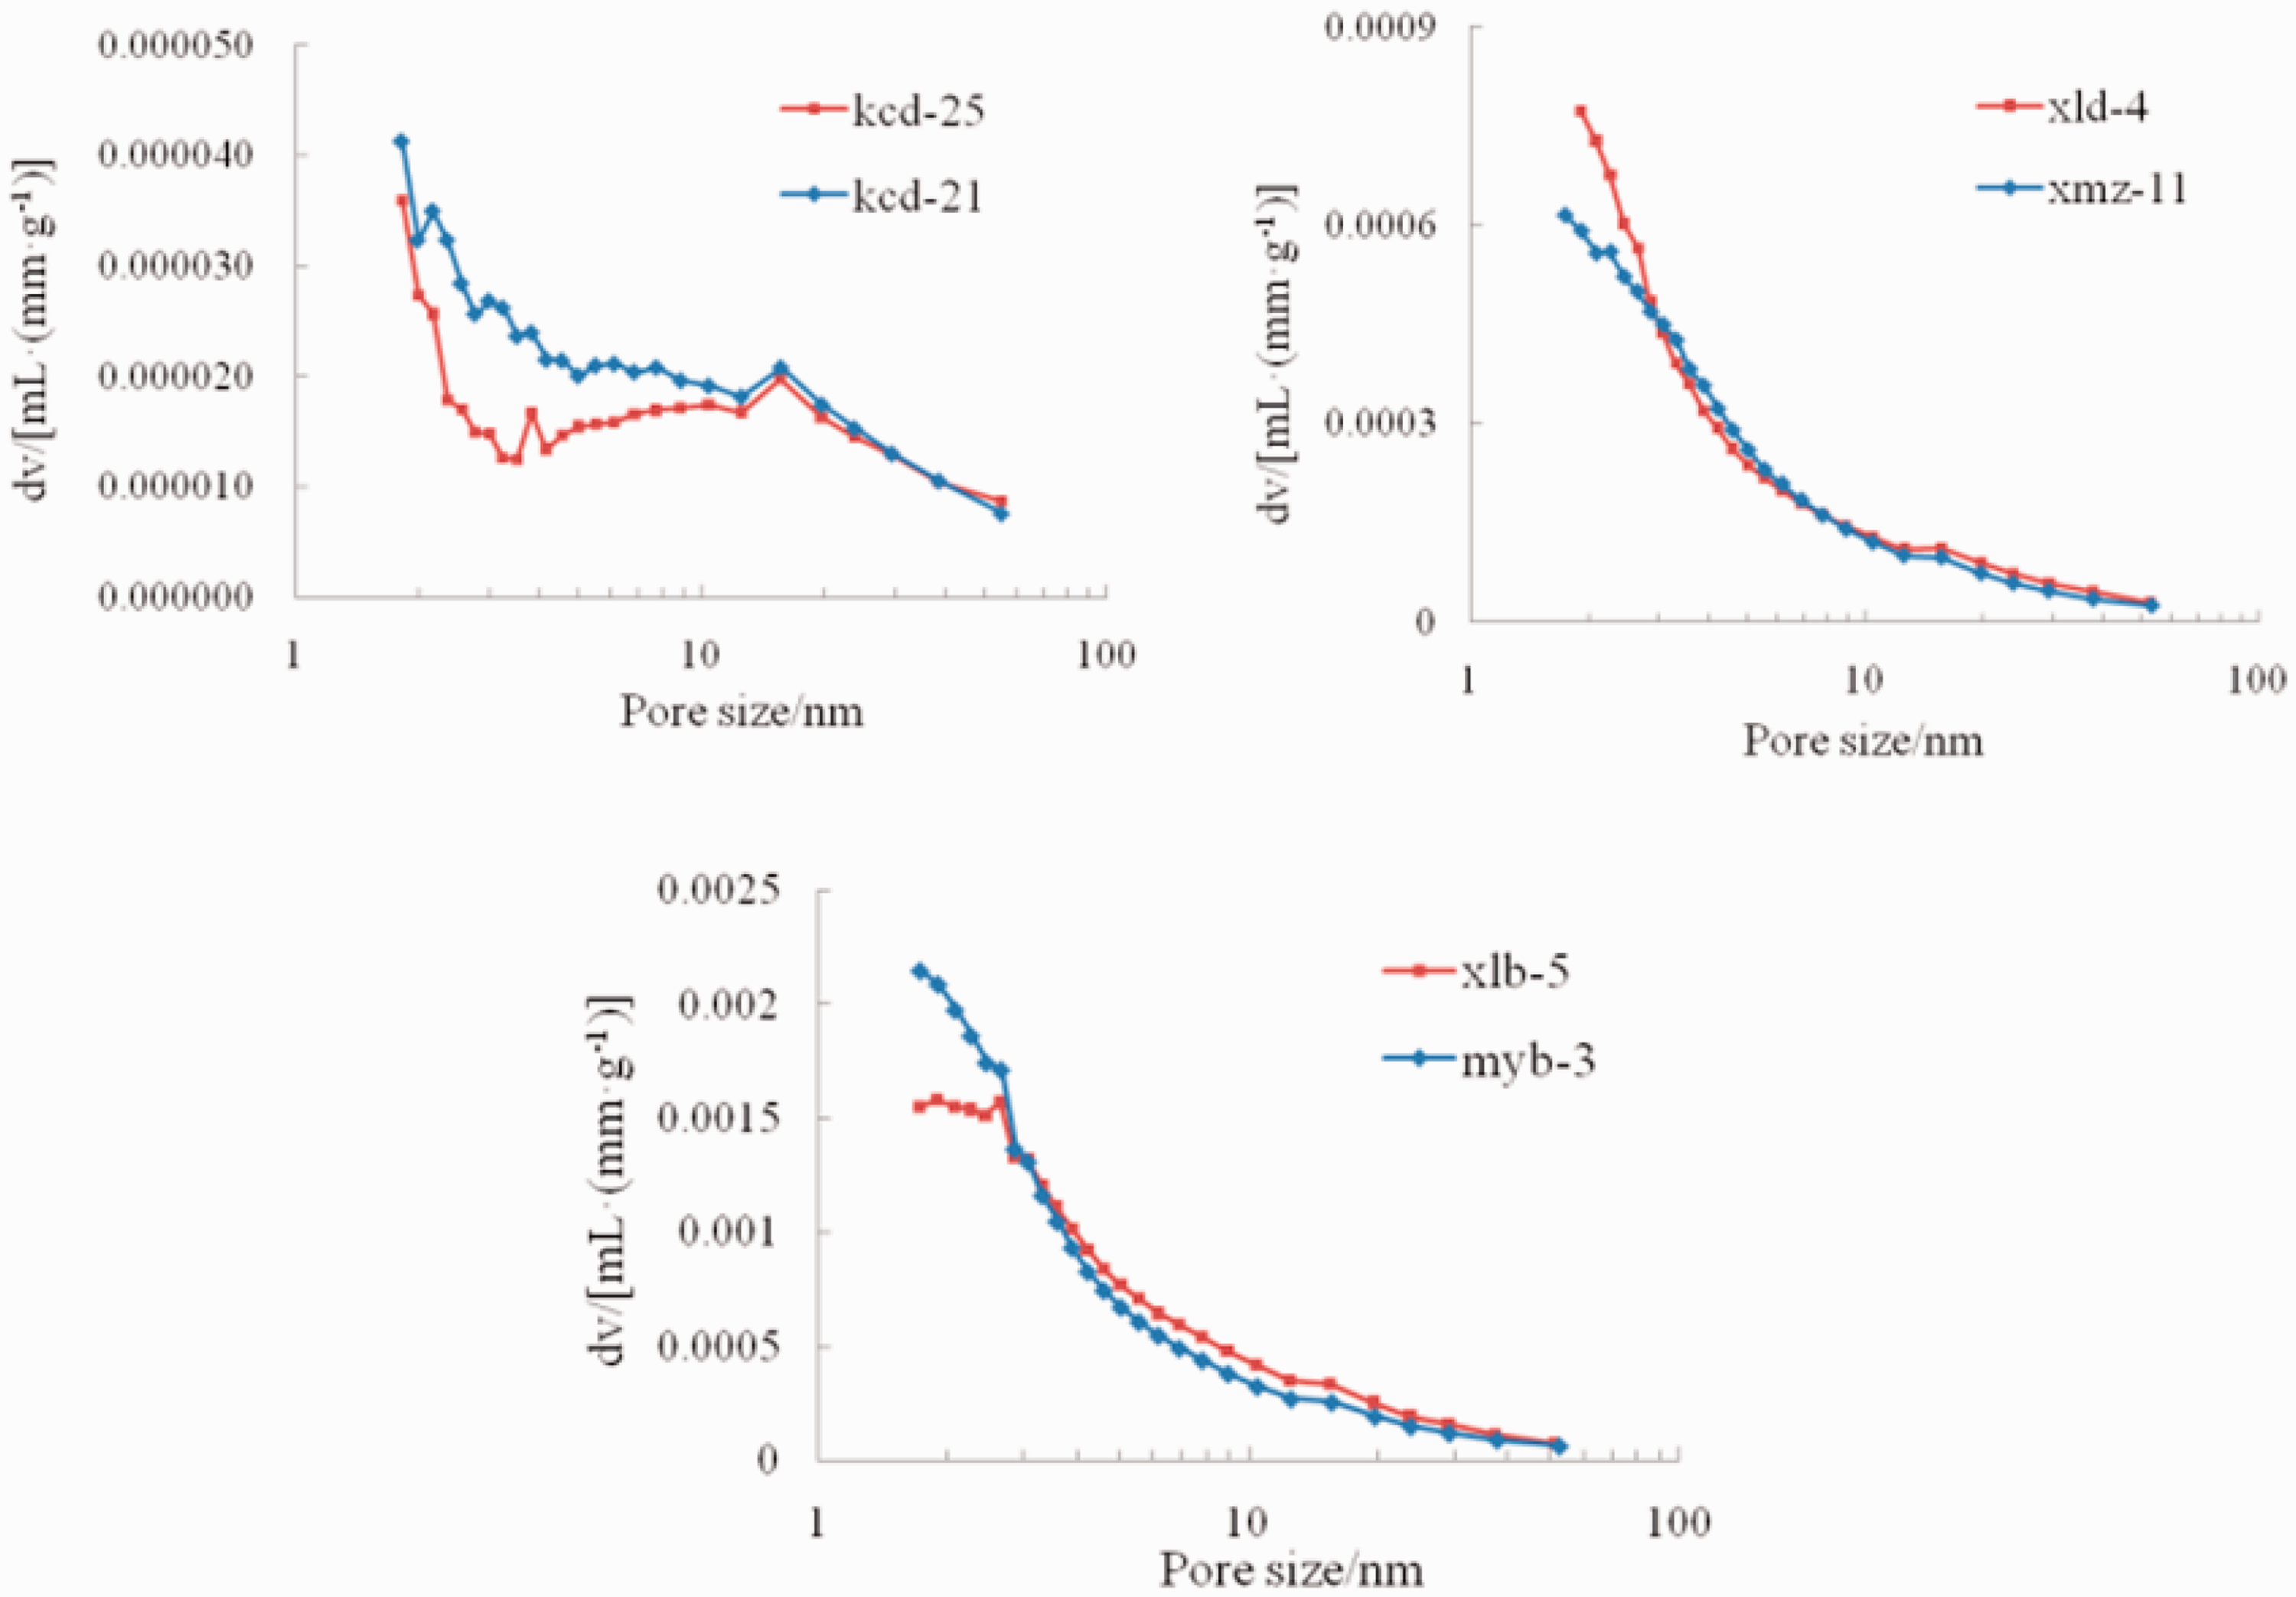
Pore size distribution curves of Mesoproterozoic shale samples in Yanshan area.
According to the test results of true density and apparent density, the porosity of 14 shale samples is between 0.807% and 10.267%, with an average of 4.221%. The average porosity of Hongshuizhuang Formation (2.419%) is lower than that of Xiamaling Formation (5.222%). Compared with the porosity of the shale reservoir in North America, the porosity of the Hongshuizhuang Formation is low and the porosity of Xiamaling Formation is moderate.
Based on the IUPAC classification, the pore volume and pore specific surface area of each pore diameter section of 14 samples were calculated according to the range of <2 nm, 2–10 nm, 10–30 nm, 30–50 nm, >50 nm. The pore volume of the samples is mainly distributed in three aperture sections of 2–10 nm, 10–30 nm, and >50 nm with the ratios of 25.74%, 28.31%, and 35.94%, respectively. In the pore size range of 2 nm to 10 nm, the average pore volume of Hongshuizhuang and Xiamaling samples was 20.10% and 28.88%, respectively. In the pore size range of more than 50 nm, the average pore volume ratios of Hongshuizhuang and Xiamaling samples were 42.79% and 32.13%, respectively (Figure 8). Comparing the above pore volume distribution characteristics, the Xiamaling formation shale is more conducive to adsorption, and the Hongshuizhuang shale is more conducive to seepage. The specific surface area of the sample is mainly contributed by the pores of <2 nm, 2–10 nm, and 10–30 nm, with the average ratios of 10.65%, 62.46%, and 18.28% (Figure 8). More than half of the specific surface area of the two groups of samples comes from the pore size range of 2 nm to 10 nm, all of which have favorable pore conditions for adsorption.
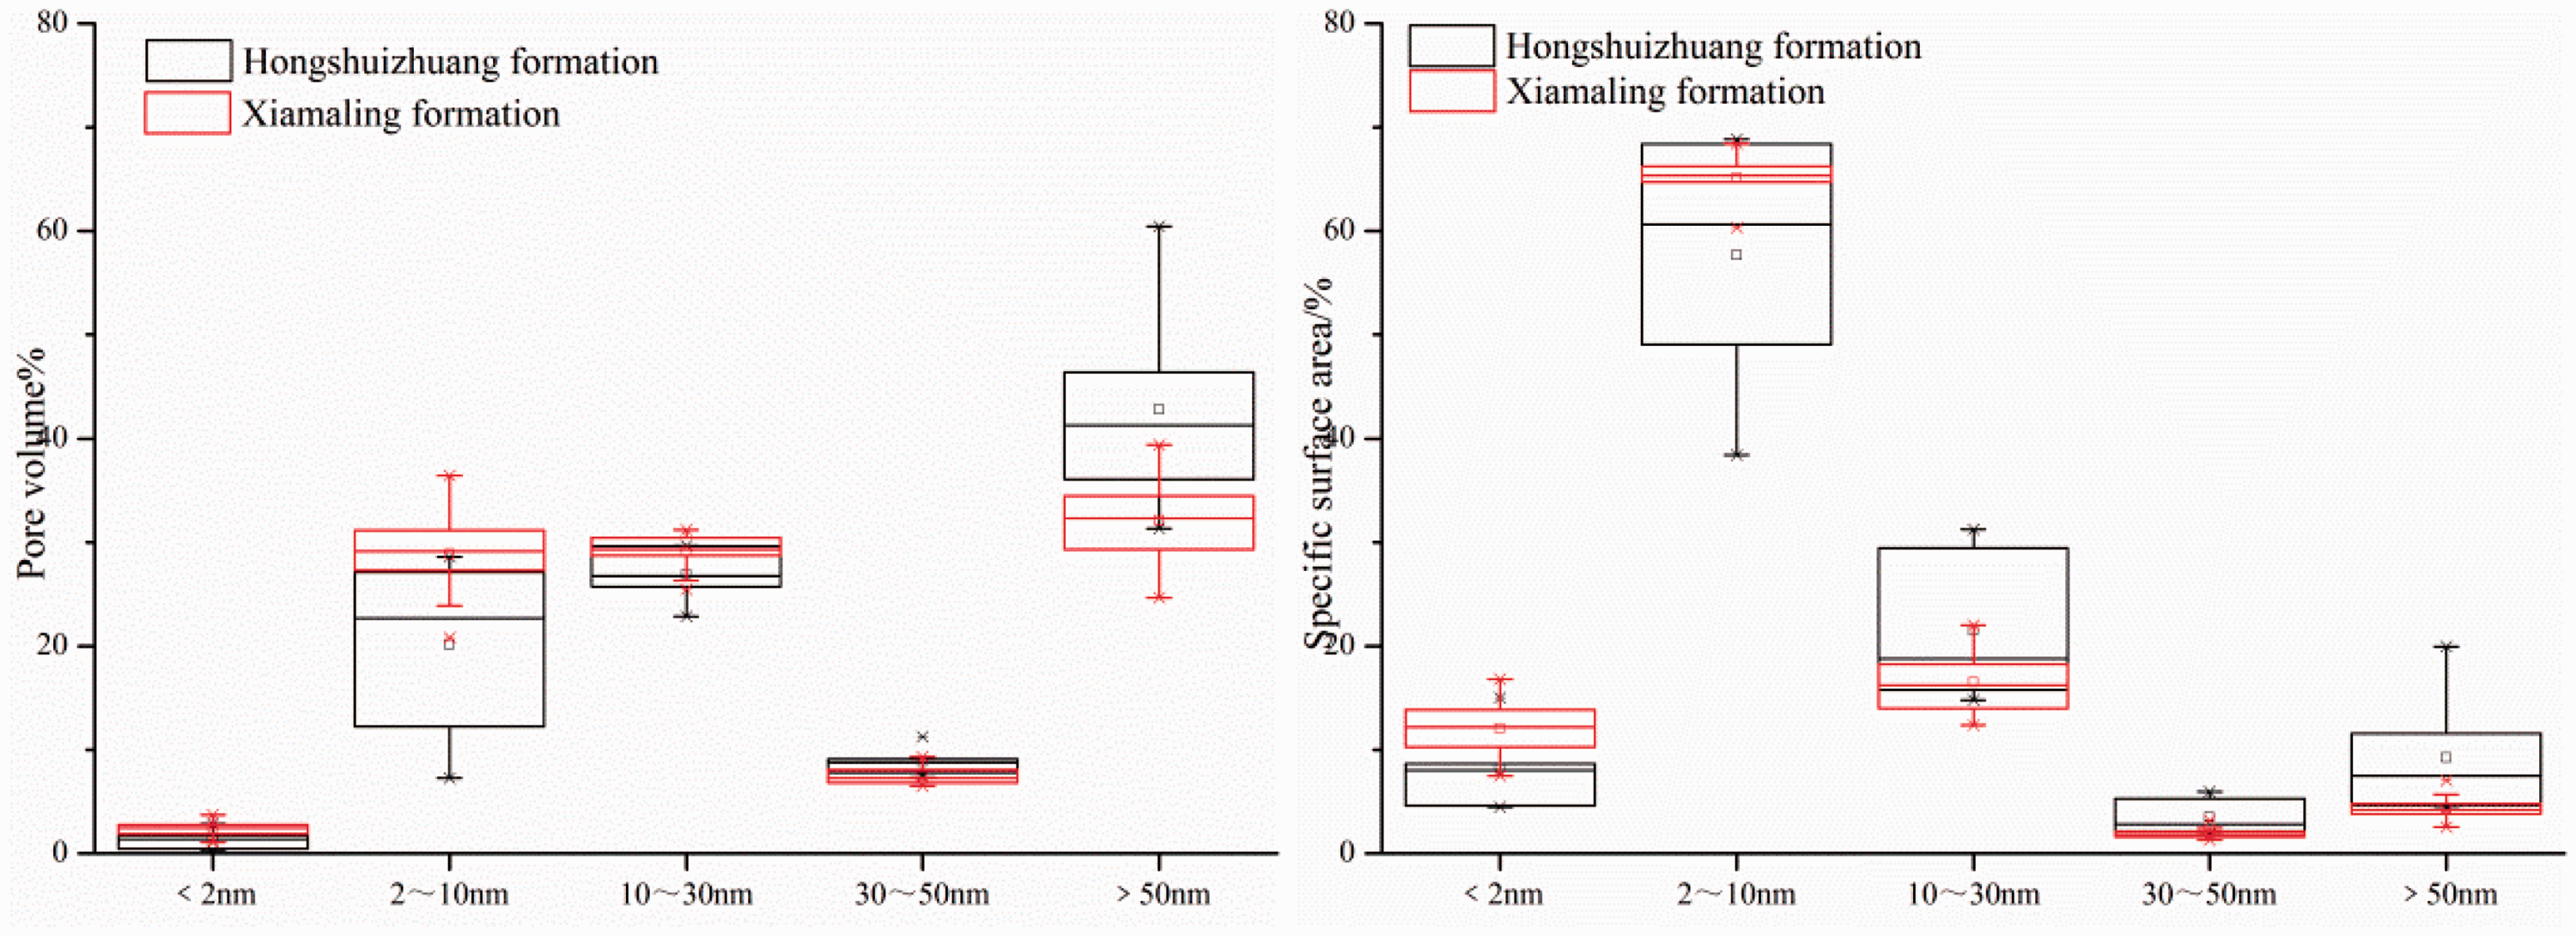
Pore volume and pore structure distribution of Mesoproterozoic shale samples in Yanshan area.
Pore fractal dimension characteristics
Surface fractal dimension can quantitatively characterize the pore surface complexity, which deserves to be obtained by mercury intrusion method and low-temperature nitrogen adsorption method. As high-pressure mercury destroys the micropores and mesopores and causes errors, N2 adsorption can avoid this error and provide information about pore structure information on micropore and mesopore from a few nanometers to hundreds of nanometers (Cai, 2015).
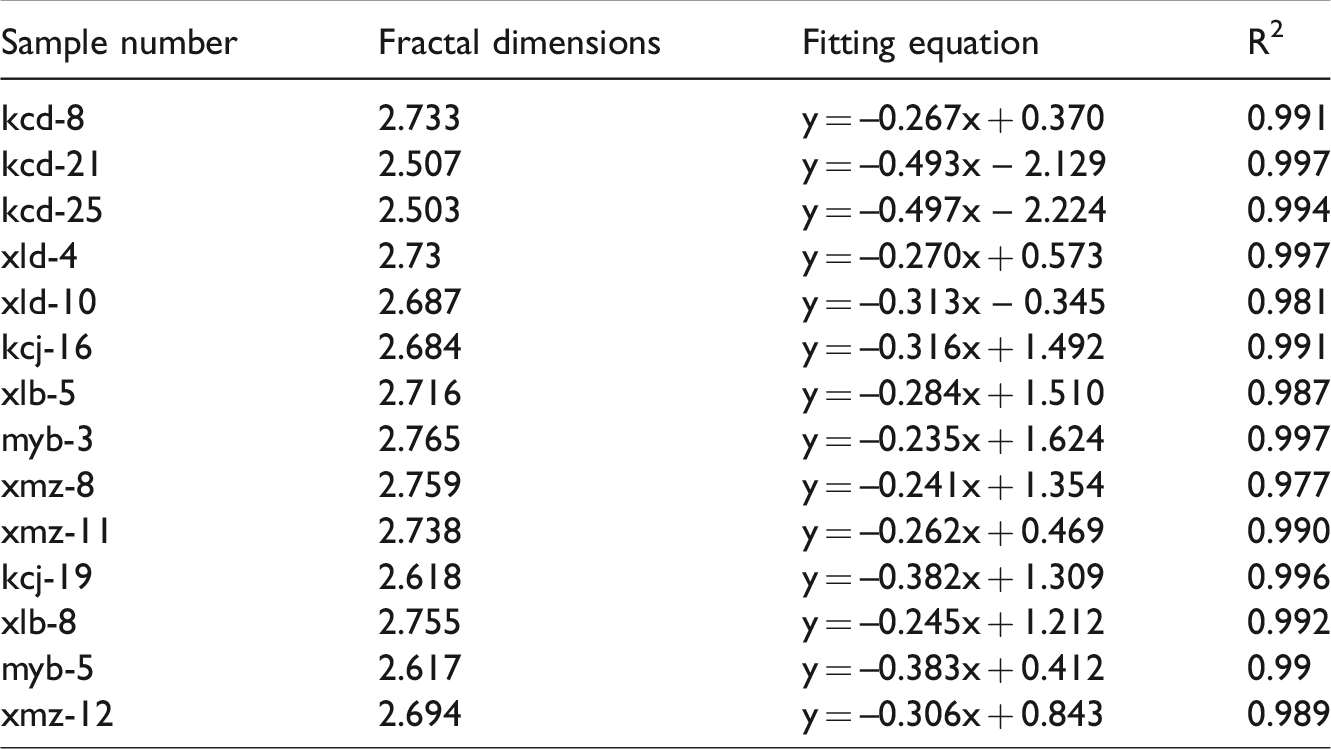
Therefore, this paper studies the shale nanoscale pore through the low-temperature nitrogen adsorption method and uses the Frenkel-Halsey-Hill (FHH) model to calculate the fractal dimension of the pore. The calculation of pore fractal dimension by FHH model has been discussed in detail in the literature (Xie et al., 2014; Zhao et al., 2014). The calculation method of fractal dimension is as follows

When the relative pressure is greater than 0.45, different samples show different degree of hysteresis loops, capillary condensation occurs on the nitrogen adsorption. Therefore, the pore fractal dimension is calculated by the experimental data of adsorption process at relative pressure larger than 0.45. The fitting curves of ln V and ln(ln(p0/p)) are made, and the fractal dimension D can be calculated by the slope (λ) and the formula as follows

The shales in the study area all have significant fractal characteristics (R2 is greater than 0.98), and the fractal dimension is between 2.503 and 2.765 (Table 6), indicating that the pore space of samples is very small, and the pore structure is extremely complicated with strong heterogeneity. Previous studies have shown that for samples with good correlation, the curve can be divided into two parts with the mean free path of methane molecules (the corresponding p/p0 is between 0.85 and 0.9 when r is 7.5 nm). The r of seepage pores is larger than 7.5 nm and adsorption pores is opposite, and the corresponding fractal dimensions are obtained. The results show that the fractal dimension of the adsorption pore is greater than that of the seepage pore, indicating that the pore structure of the overall adsorption pores of shale in the study area is more complex than that of the seepage pore. The roughness and the irregular shape of the pore surface are higher, the pore connectivity is worse, and the heterogeneity is stronger (Table 7) (Zhao et al., 2014).
Pore fractal dimensions of Mesoproterozoic shale samples in Yanshan area.
Fractal dimension of seepage and adsorption pore of Mesoproterozoic shale samples in Yanshan area.
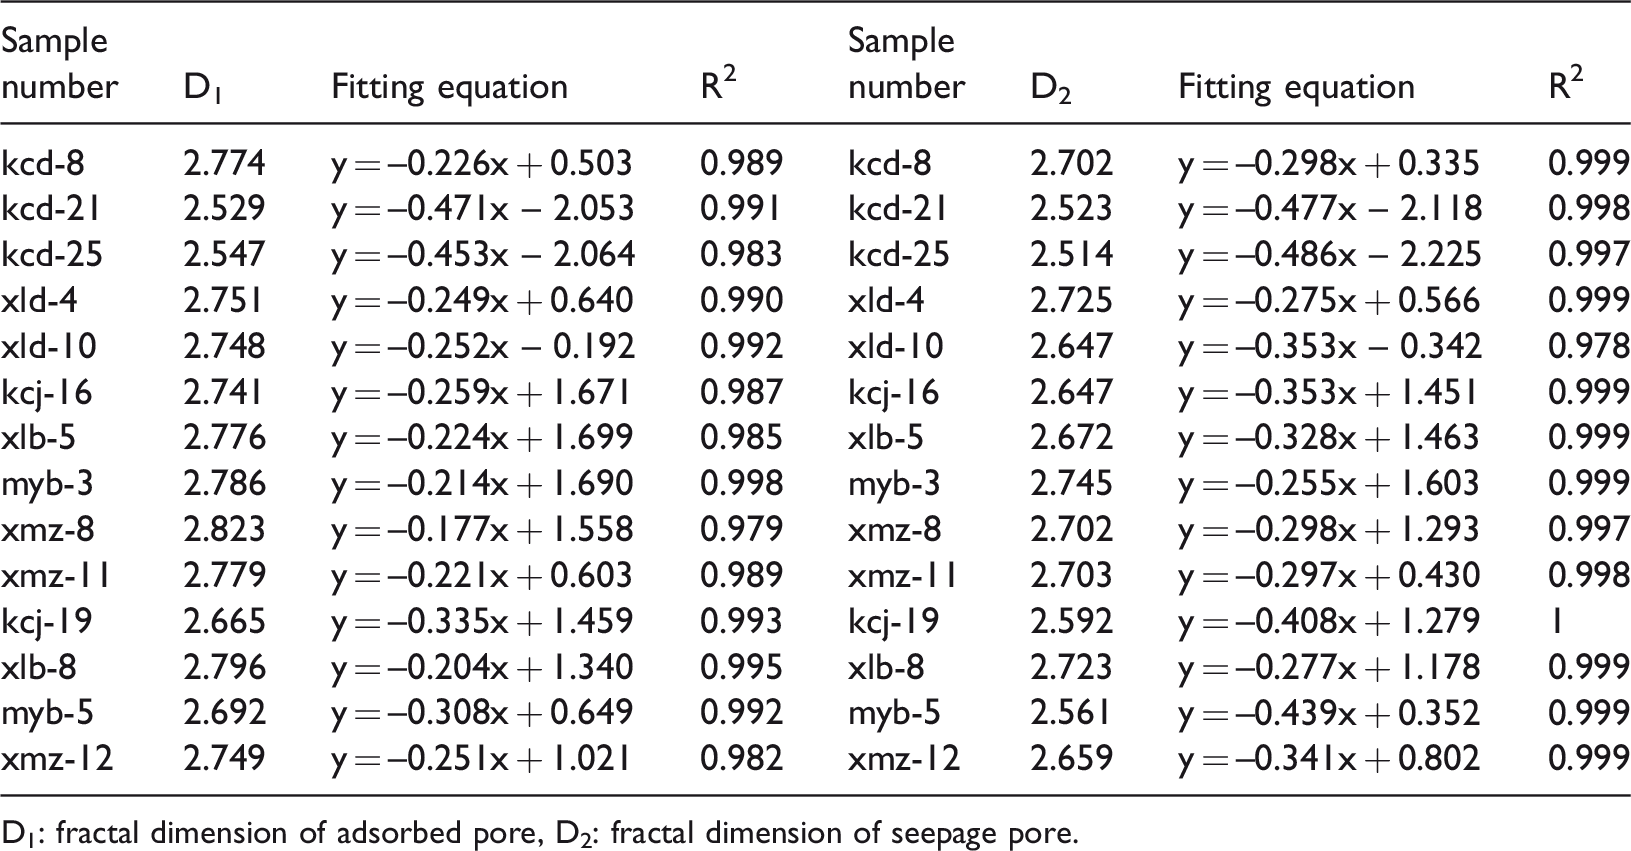
D1: fractal dimension of adsorbed pore, D2: fractal dimension of seepage pore.
Influence factors of pore fractal dimension
The fractal dimension of pore of Xiamaling Formation has a positive correlation with the increase of organic carbon content (Figure 9(a)), this is mainly related to the development of a large number of micropores in the organic matter of shale. The higher the content of organic matter in shale, the more the micropores are developed (Figure 10), and the more complex the pore structure is, the larger the fractal dimension of shale is (Chalmers and Bustin, 2008). The pore fractal dimension of Hongshuizhuang Formation is negatively correlated with organic carbon content (Figure 9(a)), this is mainly related to the development of a large number of macropore in the organic matter of shale. With the increase of organic matter content, the development of macropore is more obvious (Figure 10), and the pore structure of micropores tends to be simple, and hence the fractal dimension decreases.
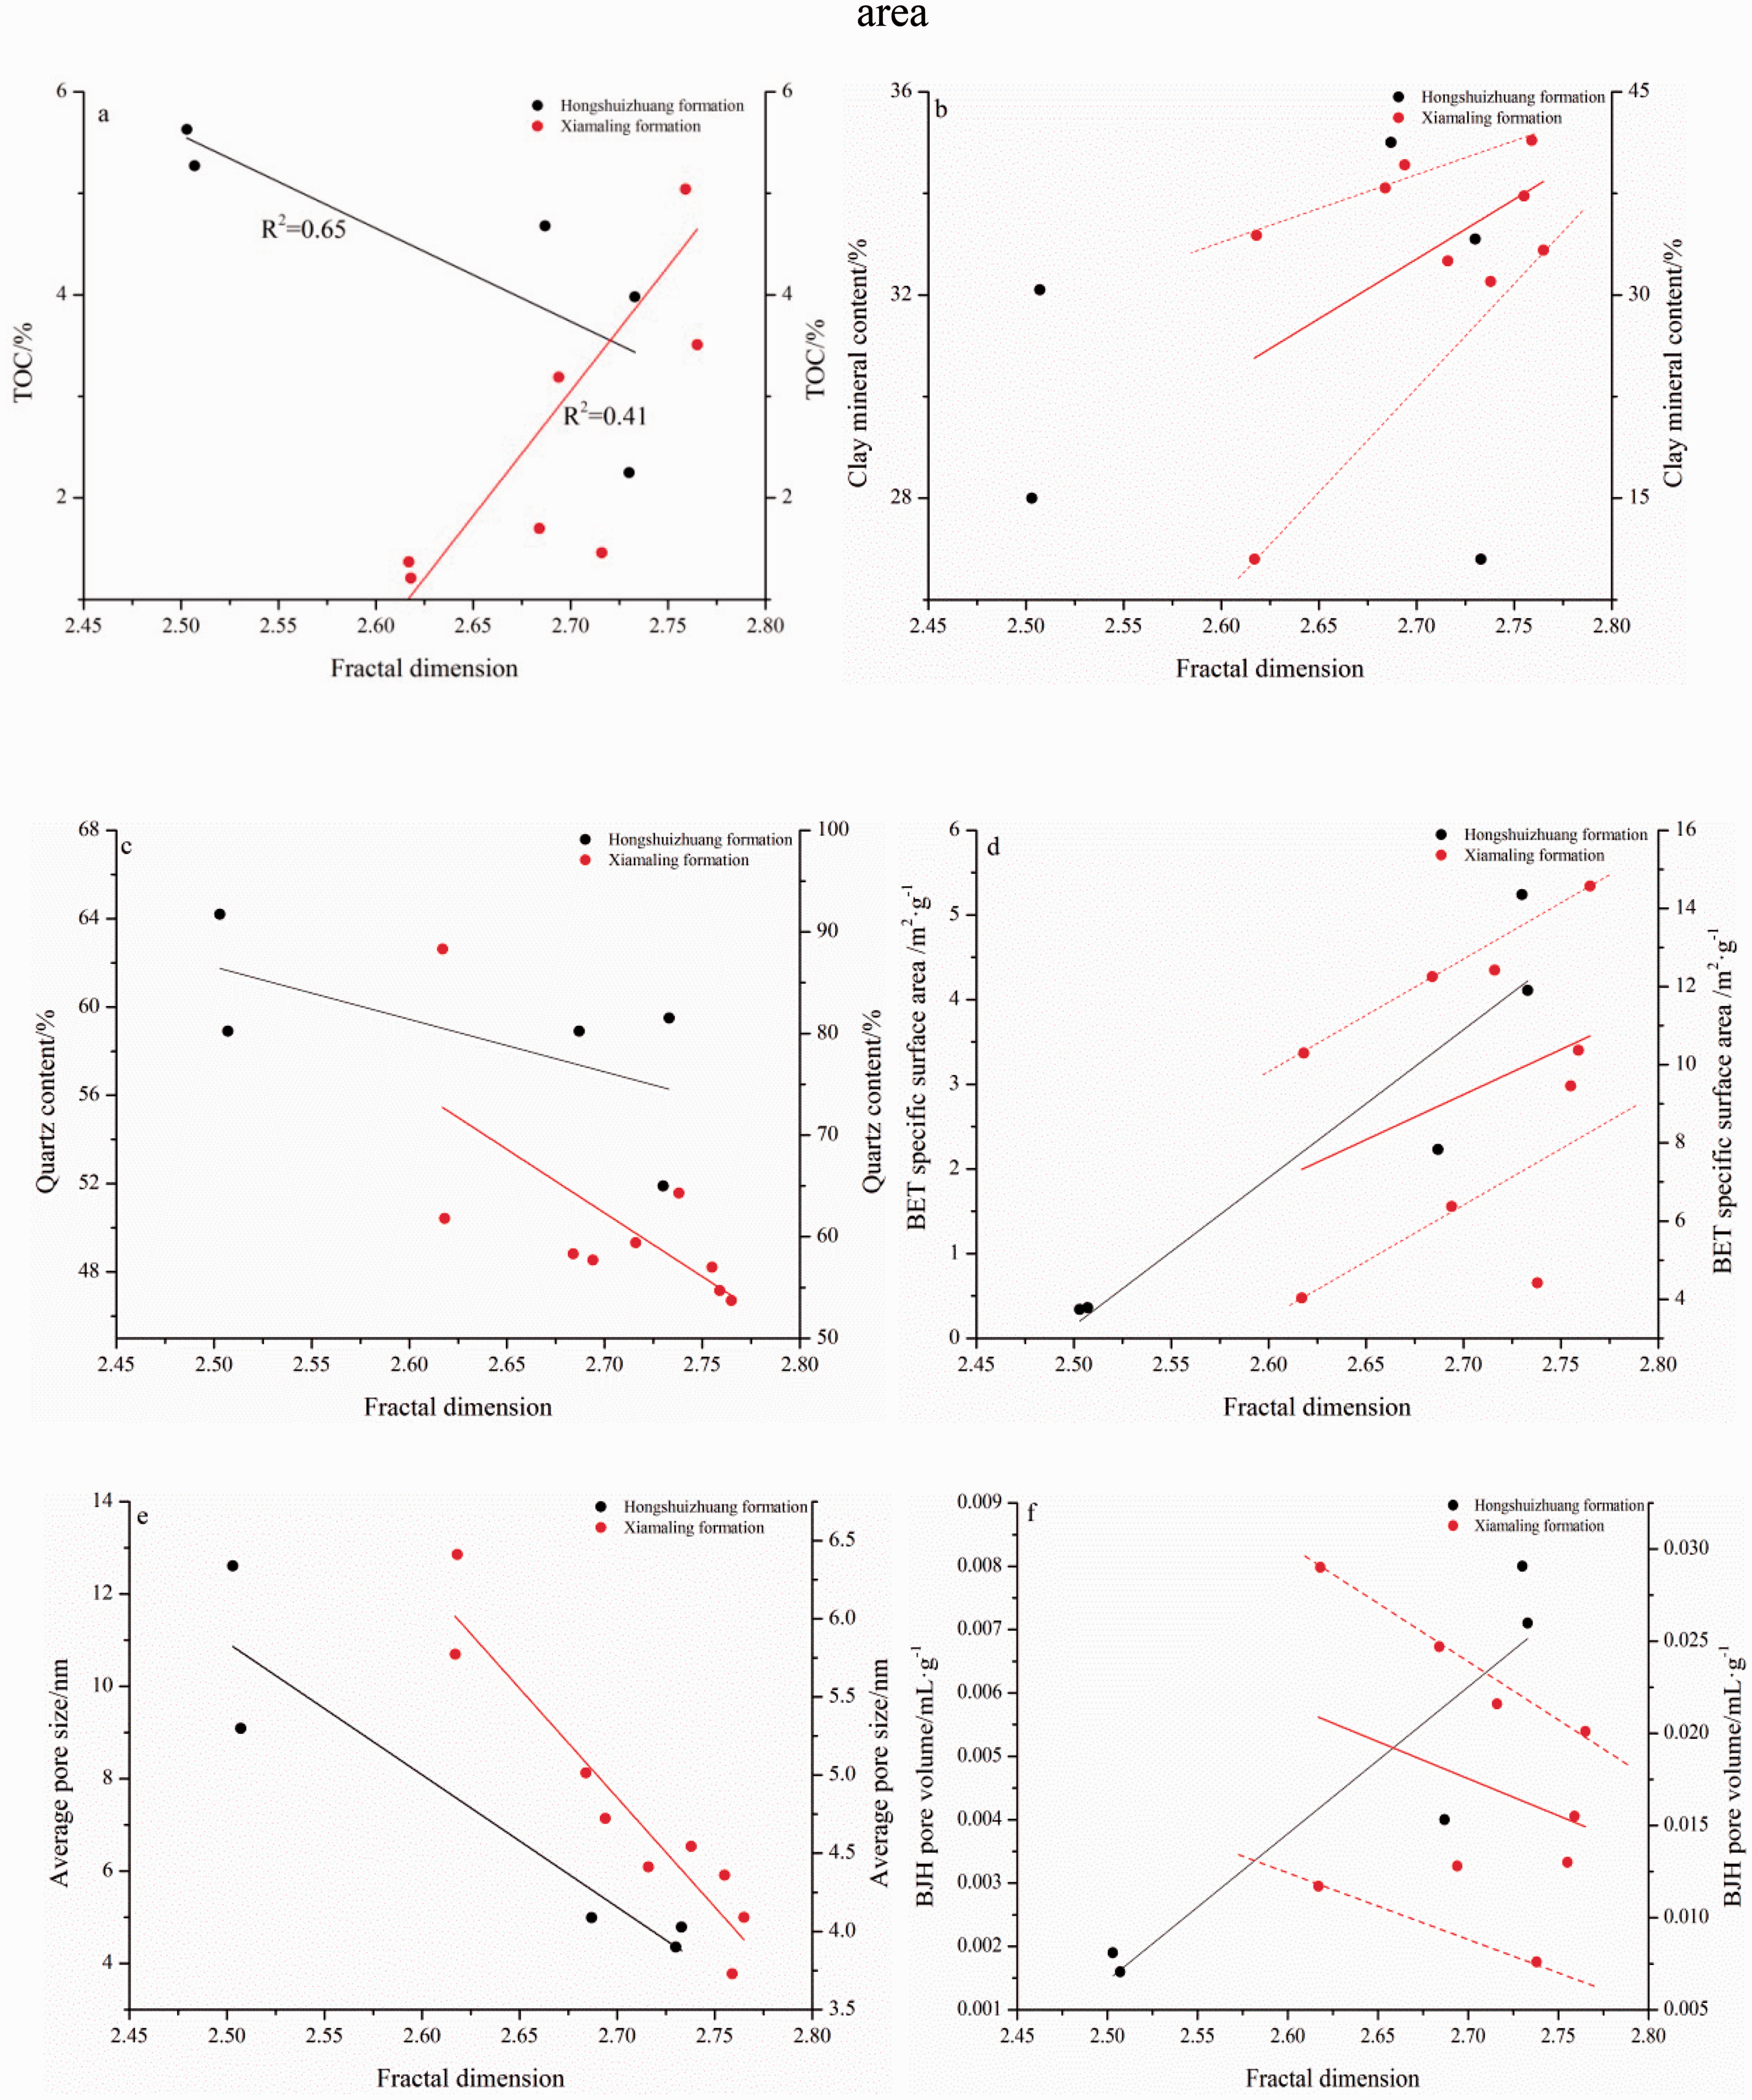
The relationship between pore fractal dimension and its influencing factors.TOC: clay mineral content, quartz content; BET: specific surface area, average pore size; and BJH: pore volume.
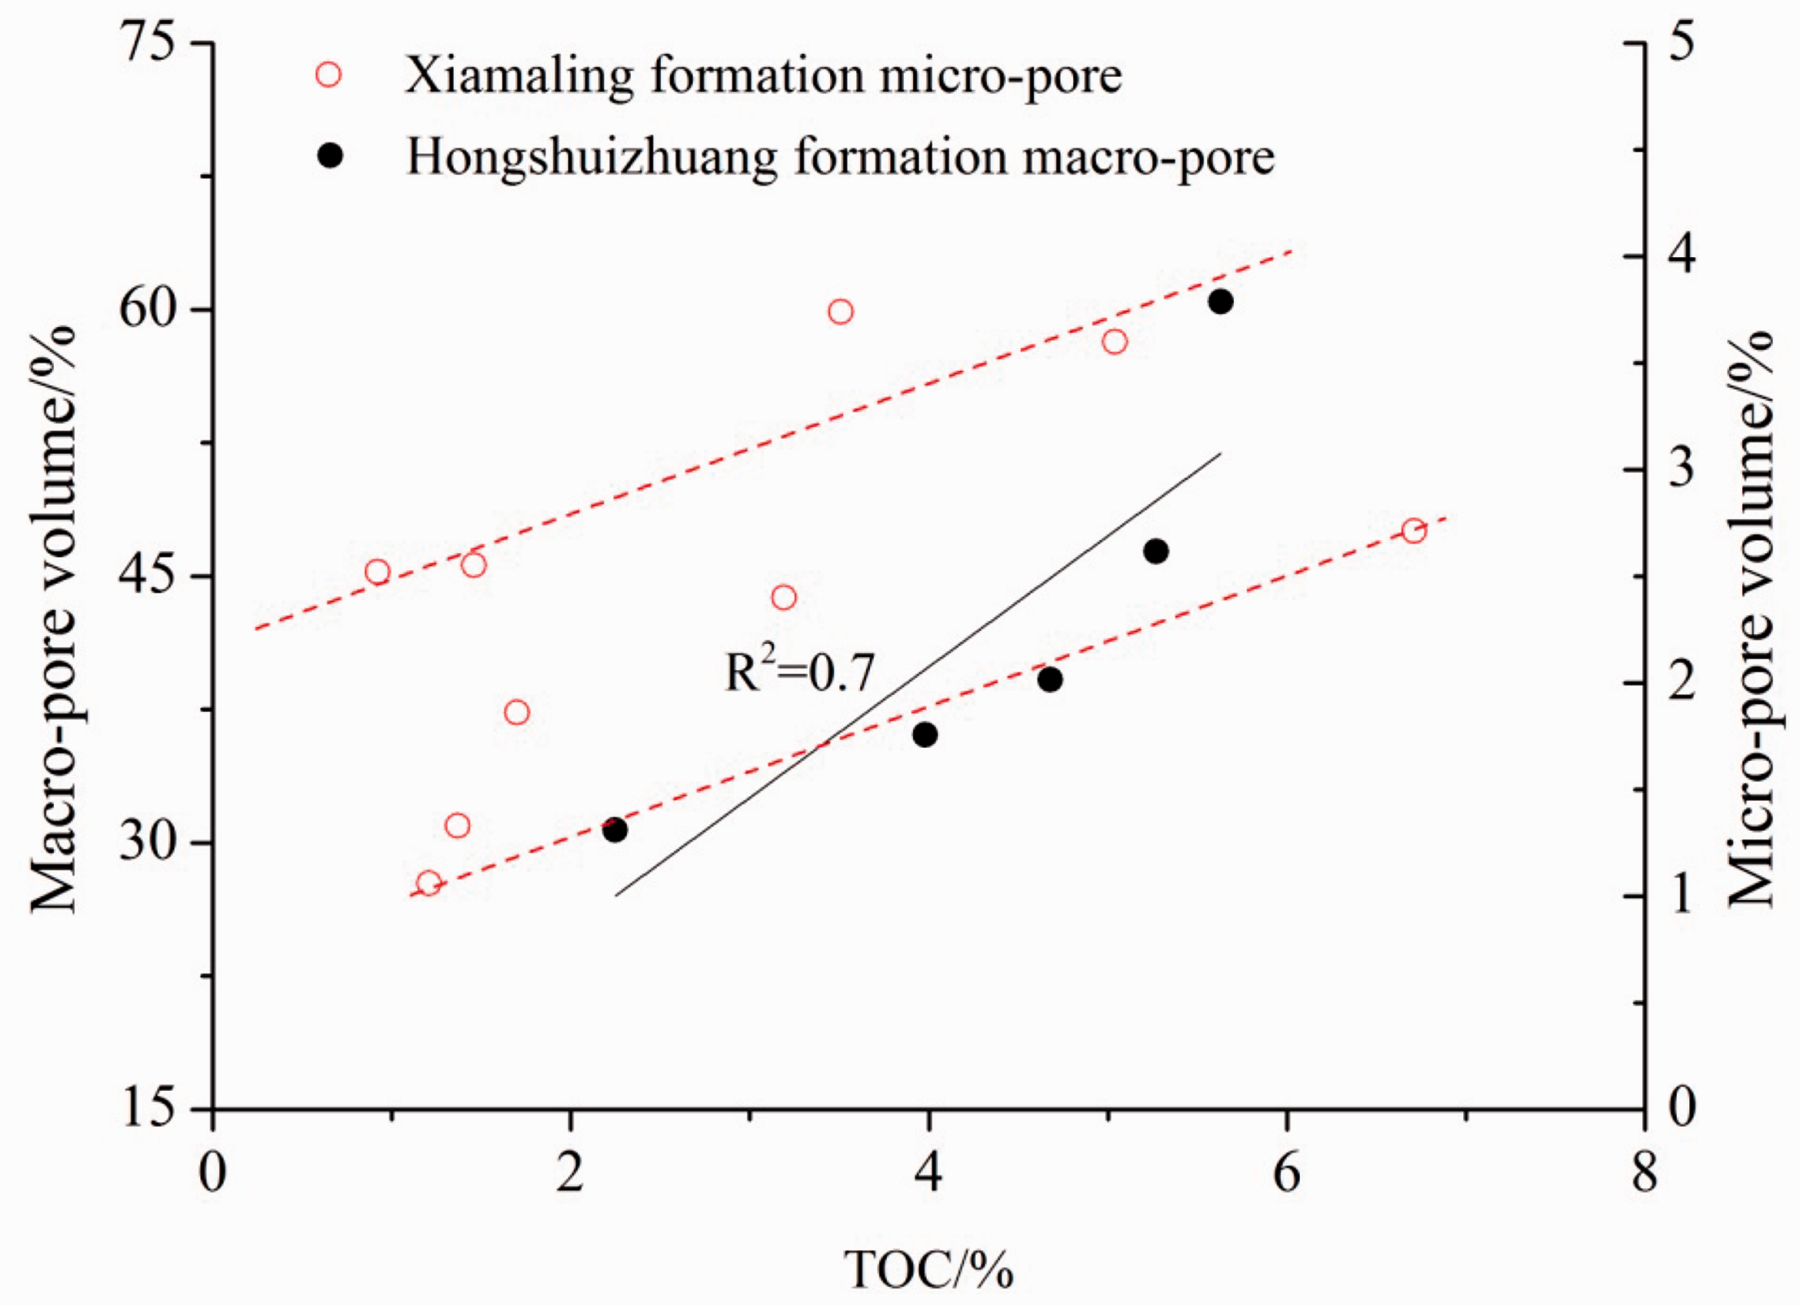
The relationship between TOC content and pore volume.
The pore fractal dimension of Xiamaling Formation is positively correlated with the increase of clay content, while the pore fractal dimension of Hongshuizhuang Formation is weakly related or not (Figure 9(b)). SEM observation shows that the clay mineral pore of Xiamaling Formation is mainly composed of small pores such as intragranular pores and intercrystalline pores. However, clay mineral pore of Hongshuizhuang Formation is mainly composed of large pores such as interlaminar pores and intergranular pores. Compared with Hongshuizhuang Formation, the Xiamaling Formation experienced a longer evolution of diagenesis and was more strongly compacted, the larger pores of clay minerals were closed or filled under the stress, and only pores developed within the particle contribute more to reservoir porosity. The existence of clay minerals in the pores will cause the increase of pore roughness, the more complex pore structure, and the larger fractal dimension of shale (Yang et al., 2014).
The pore fractal dimension of Xiamaling Formation and Hongshuizhuang Formation has a negative correlation with the quartz content (Figure 9(c)). It is indicated that the increase of quartz content can effectively improve the pore structure of shale. This is related to quartz as brittle minerals. Under the same compaction conditions, coal with high quartz content can protect against overlying pressure, and macropores and mesopores can be saved. Otherwise, macropores and mesopores are compressed into micropores, which makes the micropore structure complex and the fractal dimension increases.
The pore fractal dimension of Xiamaling Formation and Hongshuizhuang Formation has a positive correlation with the BET specific surface area (Figure 9(d)). Among them, the fractal dimension of Hongshuizhuang Formation is more obvious. It is indicated that the increase of specific surface area caused by small pores with organic matter or intergranular pore will lead to the complicating pore structure of micropores.
The pore fractal dimension of Xiamaling Formation and Hongshuizhuang Formation has a negative correlation with the average pore size (Figure 9(e)), which shows that the smaller the average pore size of the shale, the larger the fractal dimension. The smaller the average pore size is, the more micropores are contained in the shale. The more complicated the pore structure is, the rougher the pore surface is.
There is a positive correlation between the pore fractal dimension of Hongshuizhuang Formation and the pore volume of BJH (Figure 9(f)). According to the above analysis, the specific surface area and pore volume of the micropores of Hongshuizhuang Formation are increased with the increase of the fractal dimension, indicating that the fractal dimension of shale in Hongshuizhuang Formation is related to the development of micropores, which are the main contributors to pore specific surface area and pore volume. The fractal dimension can be used to describe the micropore development. The pore fractal dimension of Xiamaling Formation has only weak correlation with BET specific surface area and BJH pore volume. There is a positive correlation between the BET specific surface area and the BJH pore volume of Hongshuizhuang Formation and Xiamaling Formation. However, the correlation between fractal dimension and BET surface area, BET specific surface area and BJH pore volume of Xiamaling Formation is not significant than that of Hongshuizhuang Formation (Figure 11). The reason is that the micropores of Hongshuizhuang Formation are dominated by organic pores, while the pores of the Xiamaling formation are not only organic pores but also clay mineral intergranular pores. If the pore size of clay mineral intergranular pores is less than that of the organic pores, which will result in a smaller pore volume but the greater the specific surface area, and the greater the difference, the greater the pore contribution rate of clay minerals in the micropores, which will lead to the enhancement of pore heterogeneity.
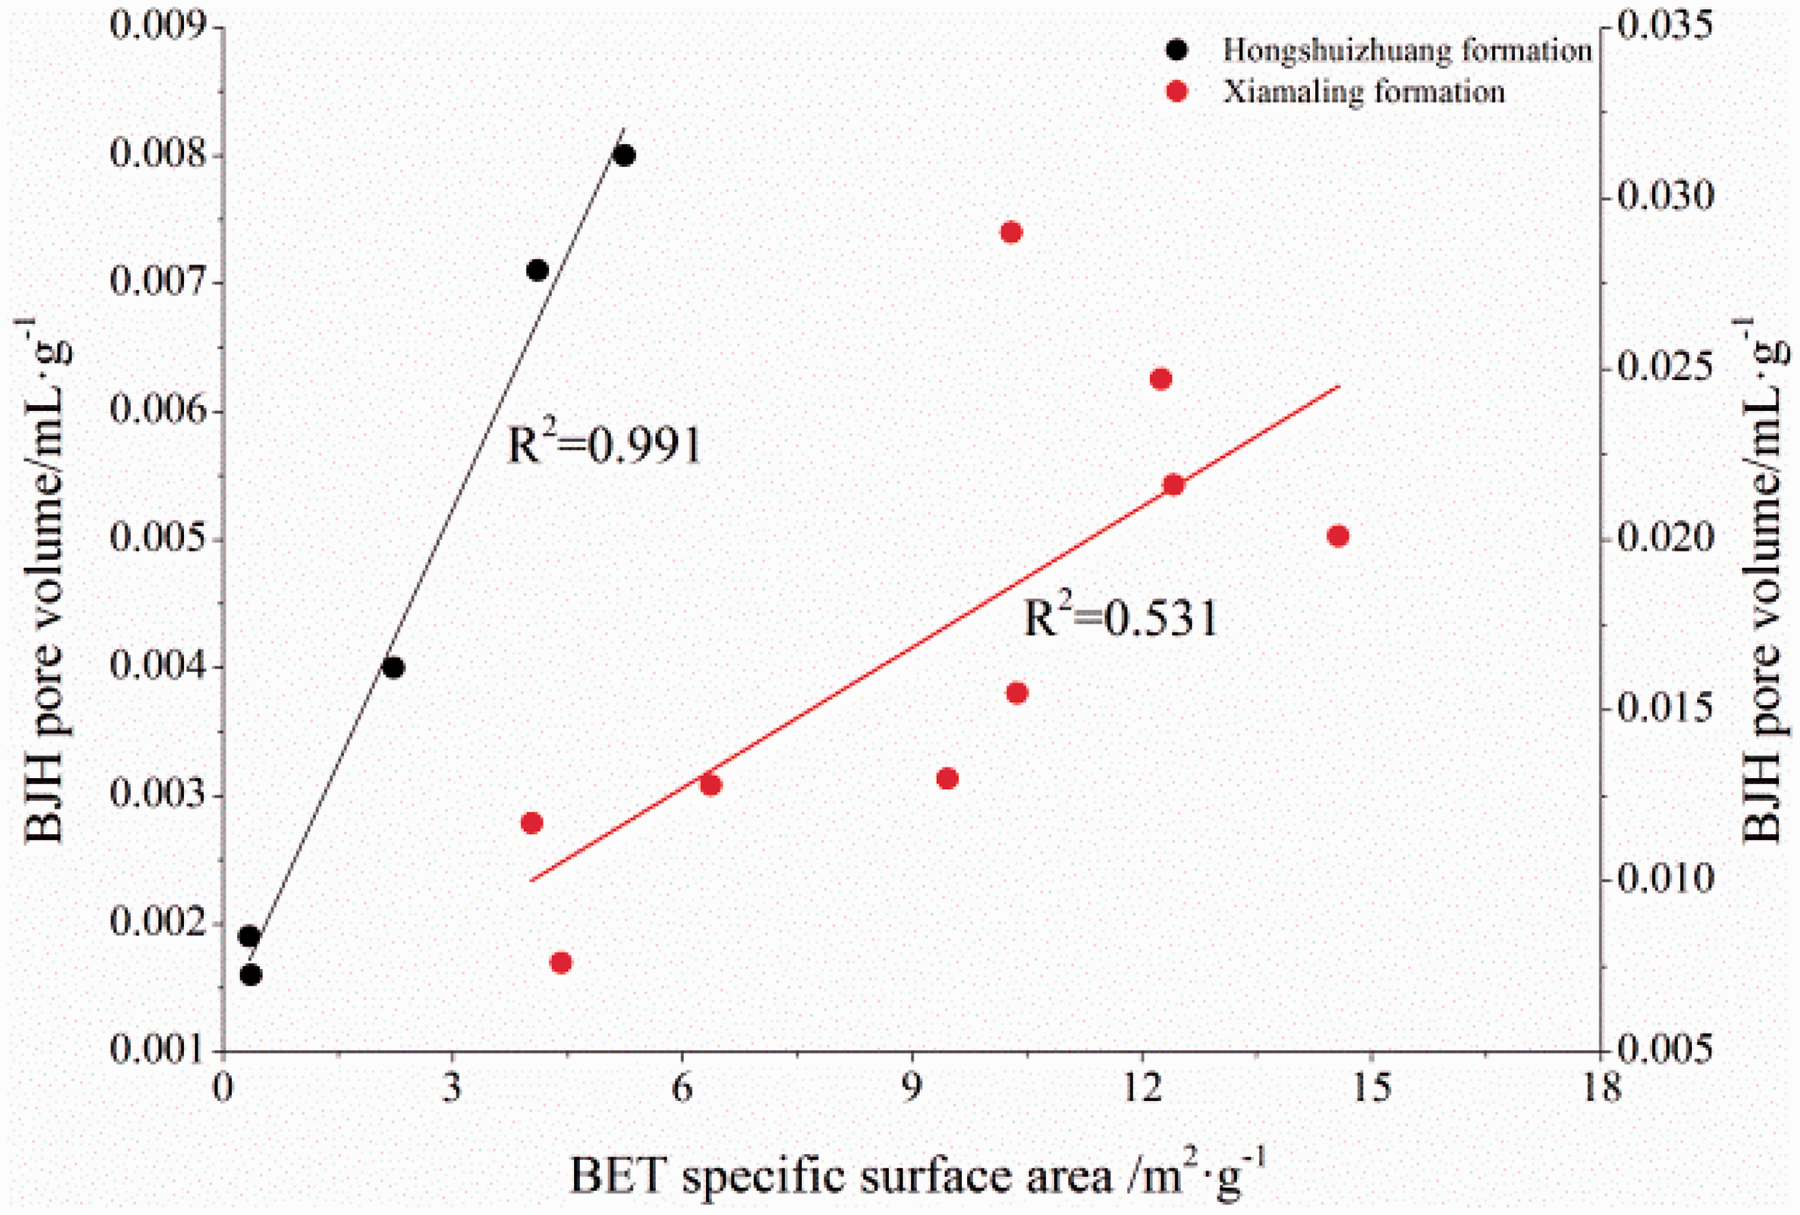
The relationship between BET specific surface area and BJH pore volume.
Analysis of shale reservoir performance and its influencing factors
Evaluation of reservoir performance
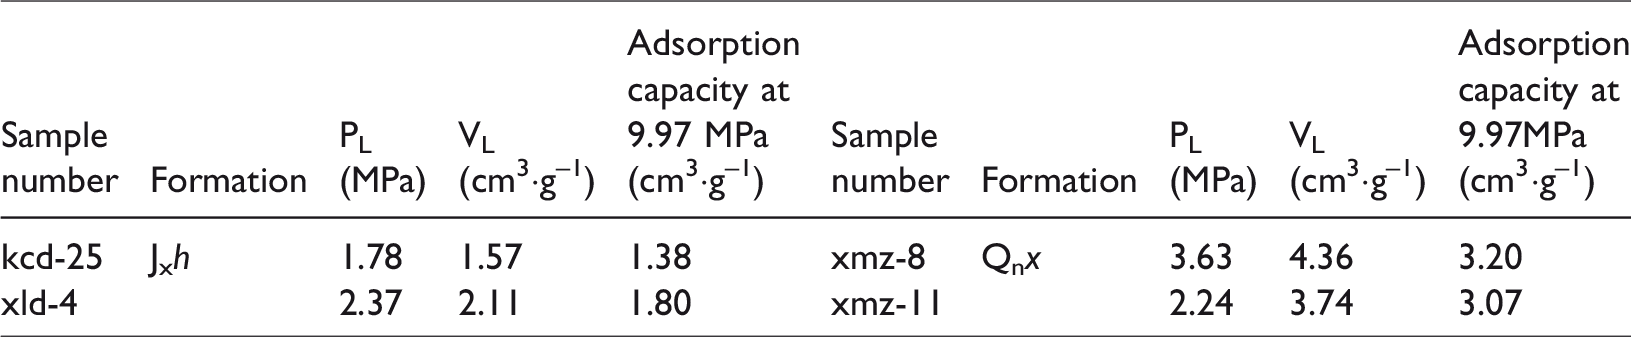
Shale reservoir adsorption is an important indicator to evaluate the potential of shale gas resources. The gas content of the commercial shale in North America is 0.44 m3/t to 9.91 m3/t, and the adsorbed gas content accounts for 20% to 85% of the total gas content (Curtis, 2002; Sondergeld et al., 2010). The methane isothermal adsorption experiment of natural dry shale samples was carried out at 30°C, the Langmuir volume of four samples was 1.57 cm3/g to 4.36 cm3/g (Table 8). Under the adsorption pressure of 9.97 MPa (approximately 1000 m depth), the average adsorption capacity of samples in Hongshuizhuang Formation was 1.59 cm3/g and that of Xiamaling Formation was 3.13 cm3/g. The methane isothermal adsorption experiment results under the conditions of 30°C and humidity of 0.78% to 1.45% show that the adsorption capacity of dark shale of Xiamaling Formation is 1.07 m3/t to 3.33 m3/t with an average of 2.02 m3/t (Liu et al., 2014). Therefore, the potential gas-bearing properties of the middle Proterozoic shale reservoirs in Yanshan area are comparable with those of commercially exploited shale gas reservoirs in North America. The adsorption gas content is high and the potential for resources is high.
Methane adsorption capacity of Mesoproterozoic shale in north China.
Analysis of influence factors of reservoir performance
Previous studies have shown that shale adsorption capacity is related to the influence factors such as pore structure, organic carbon content, mineral composition, water content, and pressure (Bi et al., 2014; Zhao et al., 2016). The above research shows that there is little difference in material composition of Hongshuizhuang Formation and Xiamaling Formation, such as TOC, vitrinite reflectance, and clay mineral content. However, the difference in the adsorption capacity of the two layers is great, and the main controlling factors of its adsorption properties still need to be explored.
As the most direct factor affecting the adsorption capacity of shale, pore specific surface area is mainly affected by micropores and transition pores. Irrespective of Hongshuizhuang Formation or Xiamaling Formation, the contribution rate of micropore and transitional pores to the specific surface area of pores was over 99% (Table 9). In terms of pore distribution, the average volume of micropore and transition pore in Hongshuizhuang formation (59.13%) is much lower than that of Xiamaling formation (79.18%), which is also one of the important reasons for the difference in adsorption between the two layers.
Mercury pressure data of Mesoproterozoic shale samples in Yanshan area.
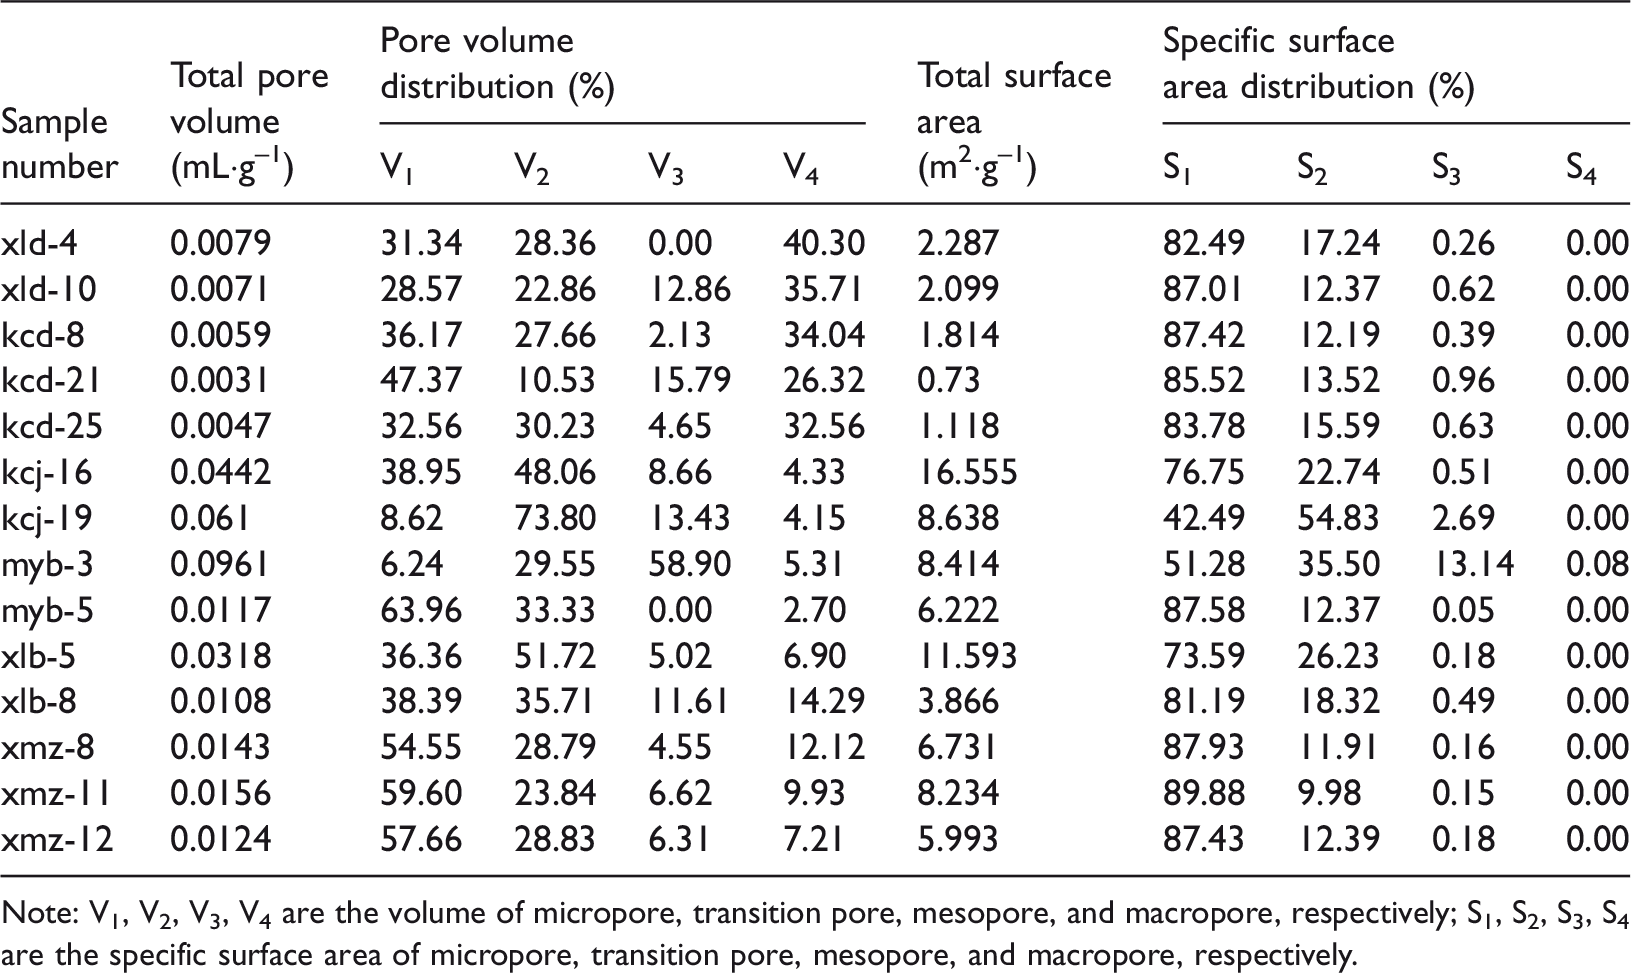
Note: V1, V2, V3, V4 are the volume of micropore, transition pore, mesopore, and macropore, respectively; S1, S2, S3, S4 are the specific surface area of micropore, transition pore, mesopore, and macropore, respectively.
The BET surface area of Hongshuizhuang Formation is mainly influenced by the content of organic matter, and there is no correlation with clay minerals (Figure 12(a)), indicating that the distribution of pore structure (especially micropore and transition pore) in the organic matter is the main factor controlling the adsorption, and the inorganic pore formed by the mineral has a weak influence on it. Although the linear relationship between BET surface area and clay minerals of Xiamaling Formation is relatively low, it presents a certain positive correlation using the envelope method (Figure 12(b)). There is no correlation between the BET specific surface area and TOC (Figure 12(b)). The above phenomena show that the small pores (such as intergranular pores of clay minerals) have a certain contribution to pore specific surface area. The BET surface area of Xiamaling Formation has a positive correlation with the content of I/S mixed layer mineral, but has a negative correlation with the content of illite (Figure 12(c)). The reason is that the average pore size of illite is larger than that of I/S mixed layer mineral (Ji et al., 2014). During the process of diagenesis, the pores are continuously compacted, which may result in the pores of illite being more easily compacted or filled, indicating that the adsorption capacity of Xiamaling Formation mainly depends on the content of the I/S mixed layer mineral.
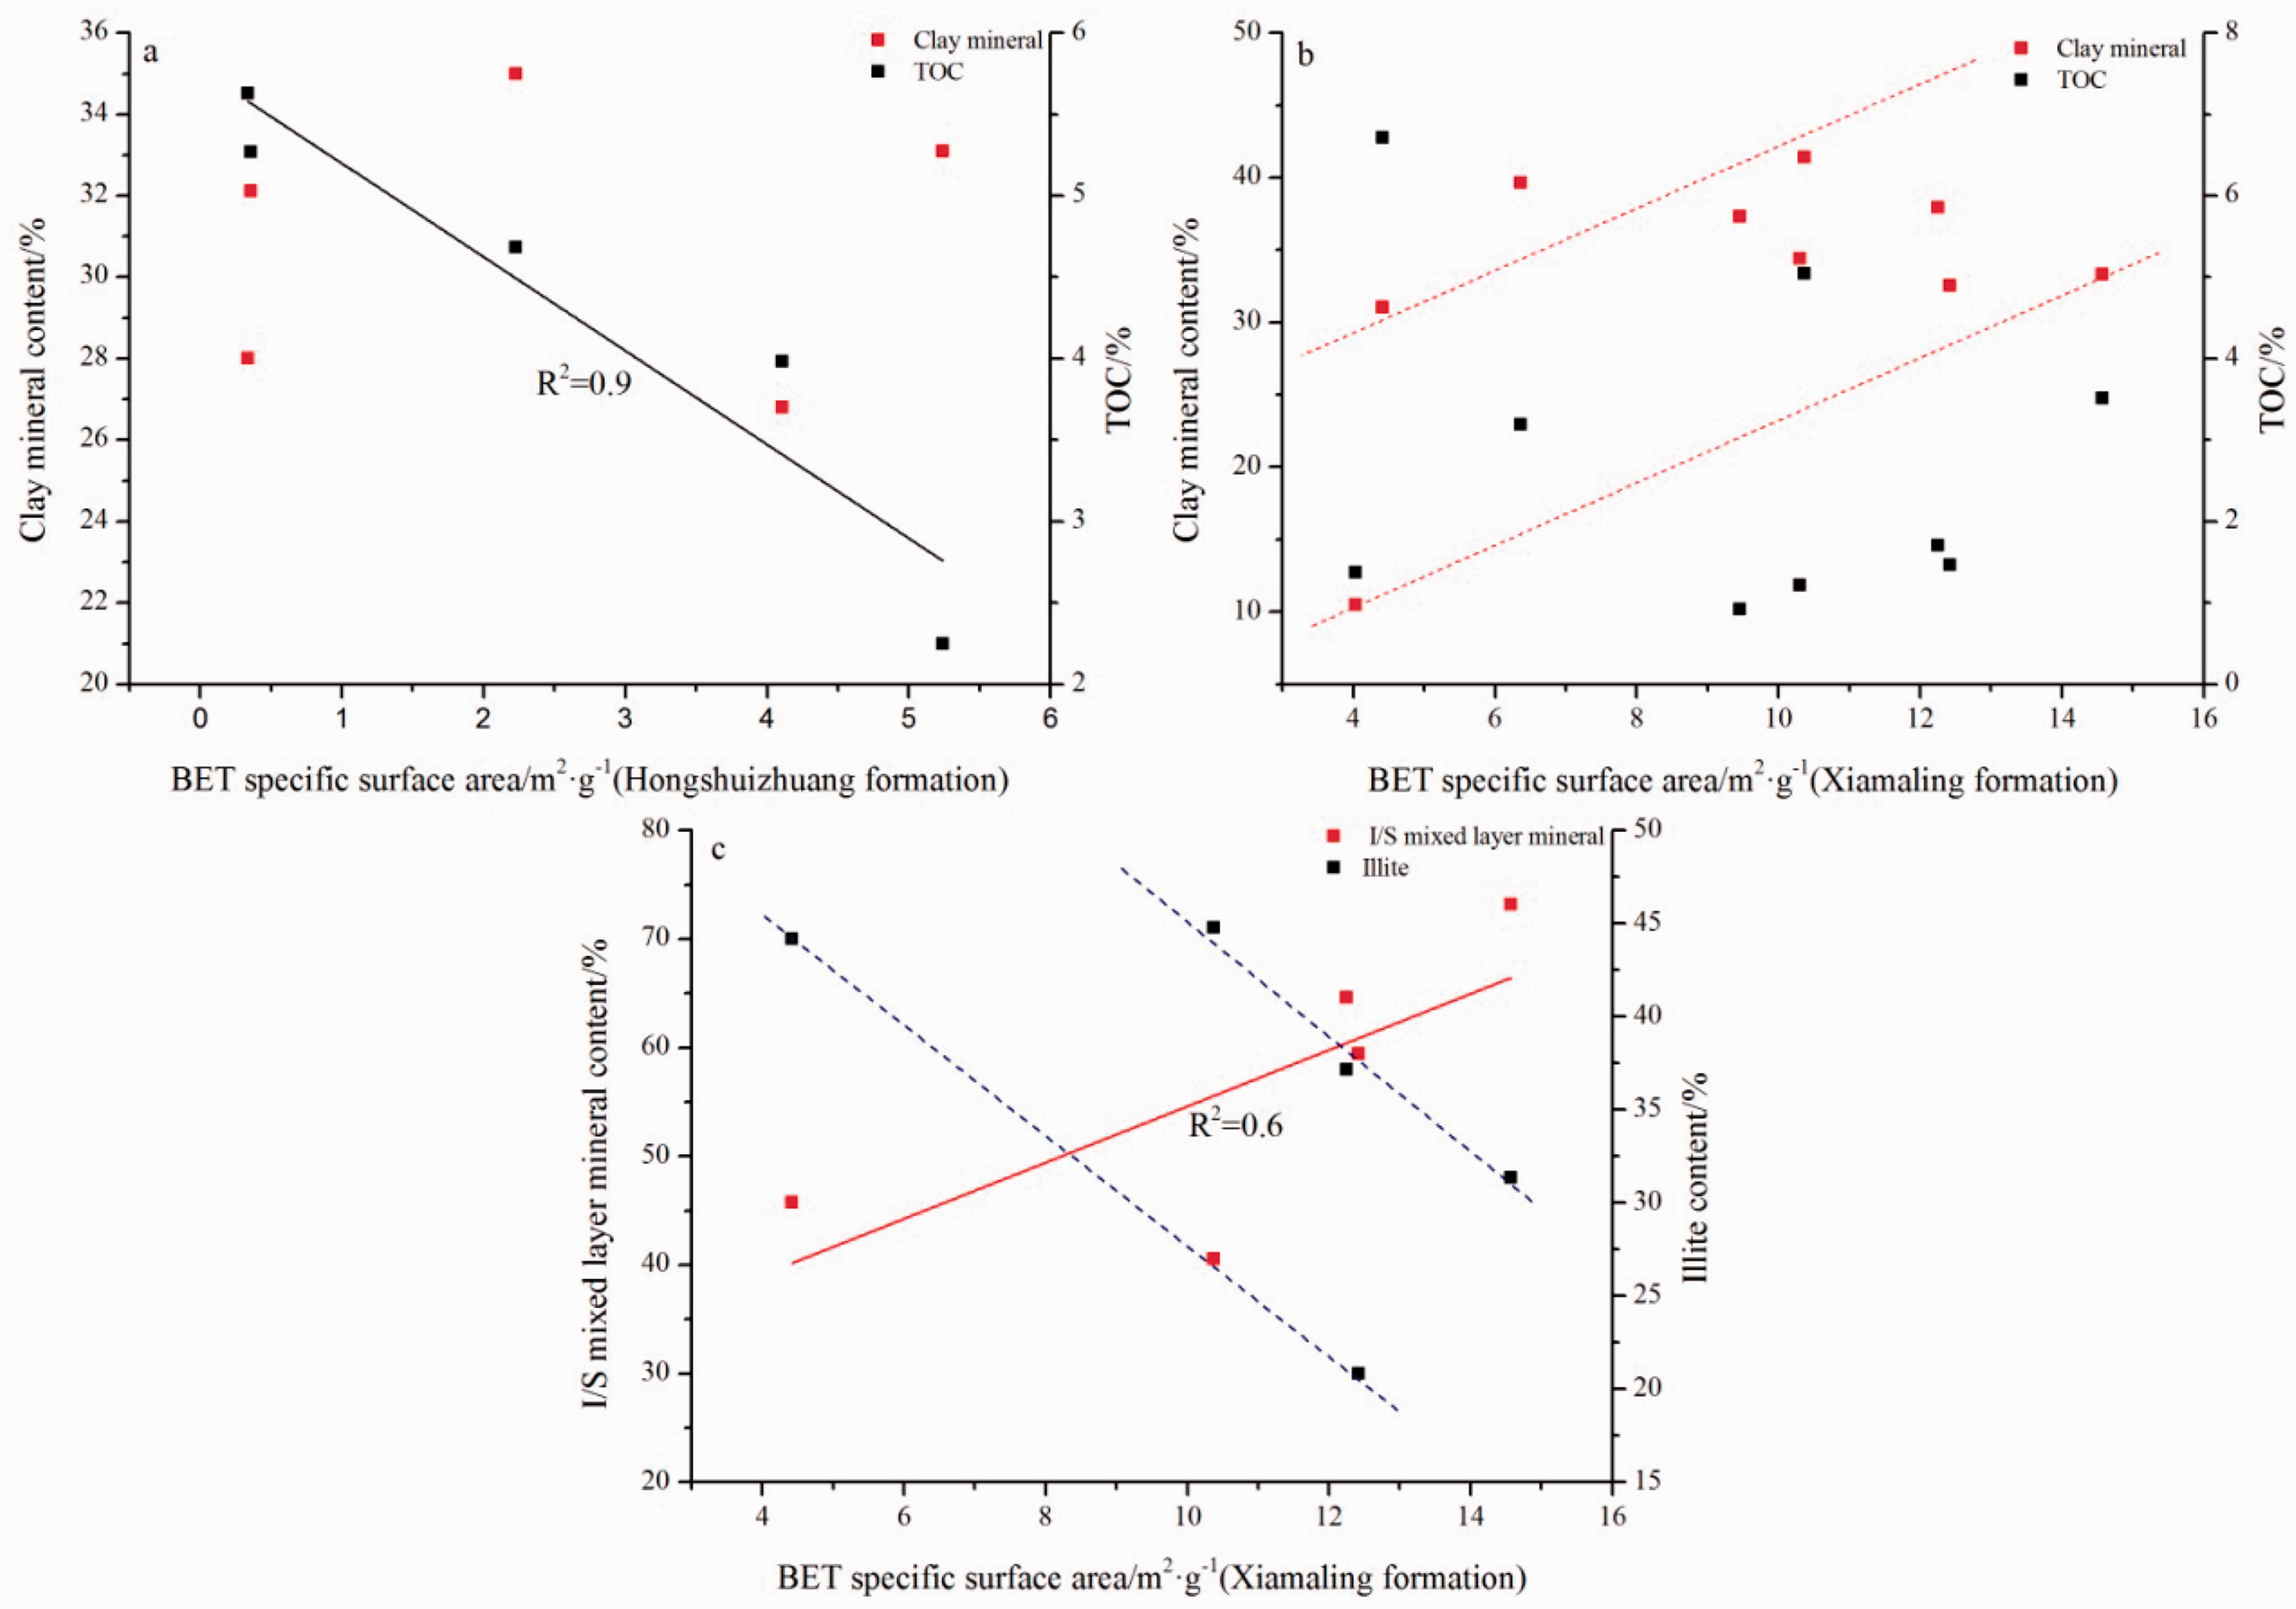
The relationship between BET, clay minerals, and TOC.BET: specific surface area; TOC: clay mineral content, illite content; I/S: mixed layer mineral content.
Conclusion
The organic carbon content of the marine shale is relatively high in the Hongshuizhuang Formation and Xiamaling Formation of the Yanshan area, and is in the main stage of gas generation with late maturity to the highest maturity. The mineral composition of shale is dominated by quartz and clay minerals, of which, the clay minerals of Hongshuizhuang Formation are mainly illite, while the Xiamaling Formation is dominated by the I/S mixed layer mineral.
The pores and microfractures of shale are well developed. The pores are dominated by a cylindrical pore with two ends open, around the opening of parallel plate pore also contain a number of inkwell pore. The pore volume ratio of the shales in Xiamaling Formation is larger than that of Hongshuizhuang Formation within the aperture range of 2 nm to 10 nm, which shows that the Xiamaling Formation is more beneficial to the adsorption. In the aperture range of larger than 50 nm, the average pore volume ratio of the Hongshuizhuang Formation is significantly higher than that of the Xiamaling Formation, which shows that the Hongshuizhuang Formation is more favorable to the seepage. More than half of the specific surface area of the two formations came from the pore size range of 2 nm to 10 nm, all of which had favorable pore conditions for adsorption.
The shale pore in the study area has significant fractal characteristics. The fractal dimension of adsorption pores is larger than that of seepage pores, which indicates that the adsorption pores have poorer connectivity and stronger heterogeneity. The pore fractal dimension of Xiamaling formation is affected by organic carbon content, clay mineral content, quartz minerals, and average pore size, while that of Hongshuizhuang Formation is affected by organic carbon content, quartz mineral, average pore size, BET specific surface area, and BJH pore volume. The study shows that the pores of the Hongshuizhuang Formation mainly consist of organic pores, while the pores of the Xiamaling Formation are not only organic pores but also smaller pores in clay minerals.
The middle Proterozoic shale reservoirs in Yanshan area have higher adsorbed gas content and larger resource potential. The adsorption capacity of Hongshuizhuang Formation mainly depends on the volume of organic pores in its micropores and transition pores. In addition, the adsorption capacity of Xiamaling Formation also is affected by I/S mixed layer mineral content in addition to the above factors.
Footnotes
Declaration of conflicting interests
The author(s) declared no potential conflicts of interest with respect to the research, authorship, and/or publication of this article.
Funding
The author(s) disclosed receipt of the following financial support for the research, authorship, and/or publication of this article: The project was financially supported by the Key Laboratory of Coalbed Methane Resources and Reservoir Formation Process of the Ministry of Education (China University of Mining and Technology) (No. 2018-005), the Fundamental Research Funds for the Central Universities (2015XKZD07), and National Science and Technology Major Project (2016ZX05041-001).