
Abstract
The pore structure of shale plays key role in oil and gas storage capacity and accumulation. Twelve representative samples were selected from Triassic Yanchang Formation in the Ordos Basin and Silurian Longmaxi Formation in the Sichuan Basin with different ages, depositional settings, and maturities to analyze shale pore structure using focused ion beam-scanning electron microscopy and high-pressure mercury intrusion capillary porosimetry. The results show that the pores of lacustrine shale with maturity Ro < 1.3% from the Triassic Yanchang Formation were predominantly composed of pores with pore throat diameter of larger than 30 µm. The pores of marine shale with maturity Ro > 1.3% from the Silurian Longmaxi Formation were predominantly composed of pores with pore throat diameter of smaller than 100 nm. For the porosity, the average porosity of low-mature lacustrine shale is 2.4%, while the average porosity of high-mature marine shale is 1.5%. For the pore type, intergranular inorganic pores predominantly occurred between mineral particles in the lacustrine shale, while the marine shale mainly developed organic pores with pore throat diameters ranging from 5 to 200 nm. Compared to the low-mature lacustrine shale, macropores of high-mature marine shale are less developed and micropores dominant. Importantly, brittle minerals (quartz, feldspar, and carbonate minerals) mainly affect the pore structure of lacustrine shale, while organic matter mainly affects the pore structure of marine shale.
Introduction
Investigation of Chinese shale gas resources started in 2005. Several national shale gas demonstration areas including Yanan, Changning-Weiyuan, and Fuling have been set up by Chinese government (Tang et al., 2016b). Breakthroughs have been achieved and industrial shale gas flow has been reported to produce from the lacustrine shale formation and marine shale formation (Yan et al., 2015; Zeng and Guo, 2015; Zhi et al., 2015). For example, the Liuping-177 well in the SE Ordos Basin was reported to produce shale gas at rate of 2.35 × 10³ m3/day from the lacustrine Yanchang Formation (Wang et al., 2015). The Jiaoye-1 HF well in the SE Sichuan Basin was tested to flow commercial shale gas at average rate of 110 × 103 m3/day and with a maximum of 203 × 103 m3/day from the marine Longmaxi Formation (Fu, 2014). The Jinshi-1 well in the SW Sichuan Basin was tested to produce 25 × 103 m3/day from the marine Niutitang Formation (Dong et al., 2015).
The shale reservoir’s pore space controls gas reserve in situ. The abundance of submicron-scale pores (pore diameter <1 µm) not only can contain free gas but also can increase the specific surface area of the shale, which can enhance its gas adsorption capacity (Ross and Bustin, 2007). Pore shapes directly affect the integrities of rock structures as well as their pore spaces, and pore connectivity is essential for gas flow from shale matrix to their wellbores (Slatt and O’Brien, 2011) or the adjacent sandstone (Sun et al., 2009). Therefore, pore structure is key to evaluating storage capability, gas flow capability, and commercial value. With adequate pore spaces, shale wells can obtain high commercial capacities (Jarvie et al., 2007).
So far, two types of techniques, including direct observation methods and indirect measurement methods, are used to study shale pore structures. Direct observation methods include focused ion beam-scanning electron microscopy (FIB-SEM), transmission electron microscopy, atomic force microscopy, and nano-CT (Cardoso et al., 2013; Shen et al., 2015). Indirect measurement methods include small angle neutron scattering, nuclear magnetic resonance, and fluid injection methods (including mercury intrusion capillary porosimetry (MICP), low-pressure N2 adsorption, and low-pressure CO2 adsorption) (Bahadur et al., 2015; Okolo et al., 2015; Tang et al., 2016a). Fluid injection methods are widely used to quantitatively study the pore structure of shale. Low-pressure N2 adsorption is generally used to measure pores ranging from 1.7 to 300 nm. Low-pressure CO2 adsorption is generally used to measure pores ranging from 0.3 to 1.1 nm (Mastalerz et al., 2012). MICP is generally used to measure pores ranging from 3 to 200,000 nm, depending mainly on the maximum pressure involved (Ju and Wu, 2016; Sondergeld et al., 2010; Tang et al., 2015). FIB-SEM and nano-CT can be used for three-dimensional pore reconstruction and to observe the spatial distribution characteristics of shale pores. The pixel resolution of FIB-SEM images is 0.8 nm, so micro/nano-pore structures are easily observed (Curtis et al., 2010). Although nano-CT can be used for three-dimensional observation of submicron-scale pores, its pixel resolution is low (∼50–70 nm) (Ahmad and Haghighi, 2012). Clearly, these methods are not perfect, but they provide significant metrics for understanding shale pore structures.
Important pore structure characteristics include size, volume, specific surface area, shape, connectivity, and spatial distribution. Shale pore sizes generally range from nanometers to micrometers, and pores are mainly classified into the following three types: organic pores, intergranular inorganic pores, and intragranular inorganic pores (Loucks et al., 2012). Natural fractures are not part of this classification as they are not controlled by individual matrix (Loucks et al., 2012). Different shales usually have significantly different pore types, morphologies, sizes, densities, and connectivity.
Due to the heterogeneity of pore structures, evaluating shale gas resources accurately is challenging. Pore structures are influenced by many geological, geochemical, and mineralogical factors, including depositional setting, total organic carbon (TOC) content, mineral composition (mineral types, sizes, and percentage), and organic maturity (Bernard et al., 2012; Ross and Bustin, 2009; Tang et al., 2015). However, how pores and their structures are affected by organic matter and minerals remain unclear. Particularly the different control factors affecting pore development (pore size, shape, connectivity, spatial distribution, etc.) for both lacustrine shale and marine shale with different maturities are presently unclear.
To elucidate the main factors that determine pore development, 12 shale samples with different maturities and TOC contents from lacustrine shale in Ordos Basin and marine shale in Sichuan Basin in China were selected. Pore structure characteristics were evaluated using FIB-SEM, and pore size distributions were measured using MICP. Combining these two methods, the effects of organic matter and mineral composition on pore structure of lacustrine shale and marine shale with different maturities were revealed.
Sampling and experimental methods
Samples were selected from the Upper Triassic Yanchang Formation’s low-mature lacustrine Yanchang7 (7th member of Yanchang Formation) shale in the southeastern Ordos Basin and the Lower Silurian Longmaxi Formation’s high-mature marine shale in the southeastern Sichuan basin (Figure 1). The two formations are representative, as they have the largest commercial values with regard to exploration and development in China. Their obviously different maturities make it possible to study the relationship between shale pore structure and maturity. The samples were all selected from shale gas wells, so the samples were not weathered as outcrop samples and can reflect the real characteristics of shale gas in situ.
Tectonic and depositional settings, and locations of representative Upper Triassic Yanchang7 lacustrine shale in the Ordos Basin and Lower Silurian marine shale in the Sichuan Basin in this study.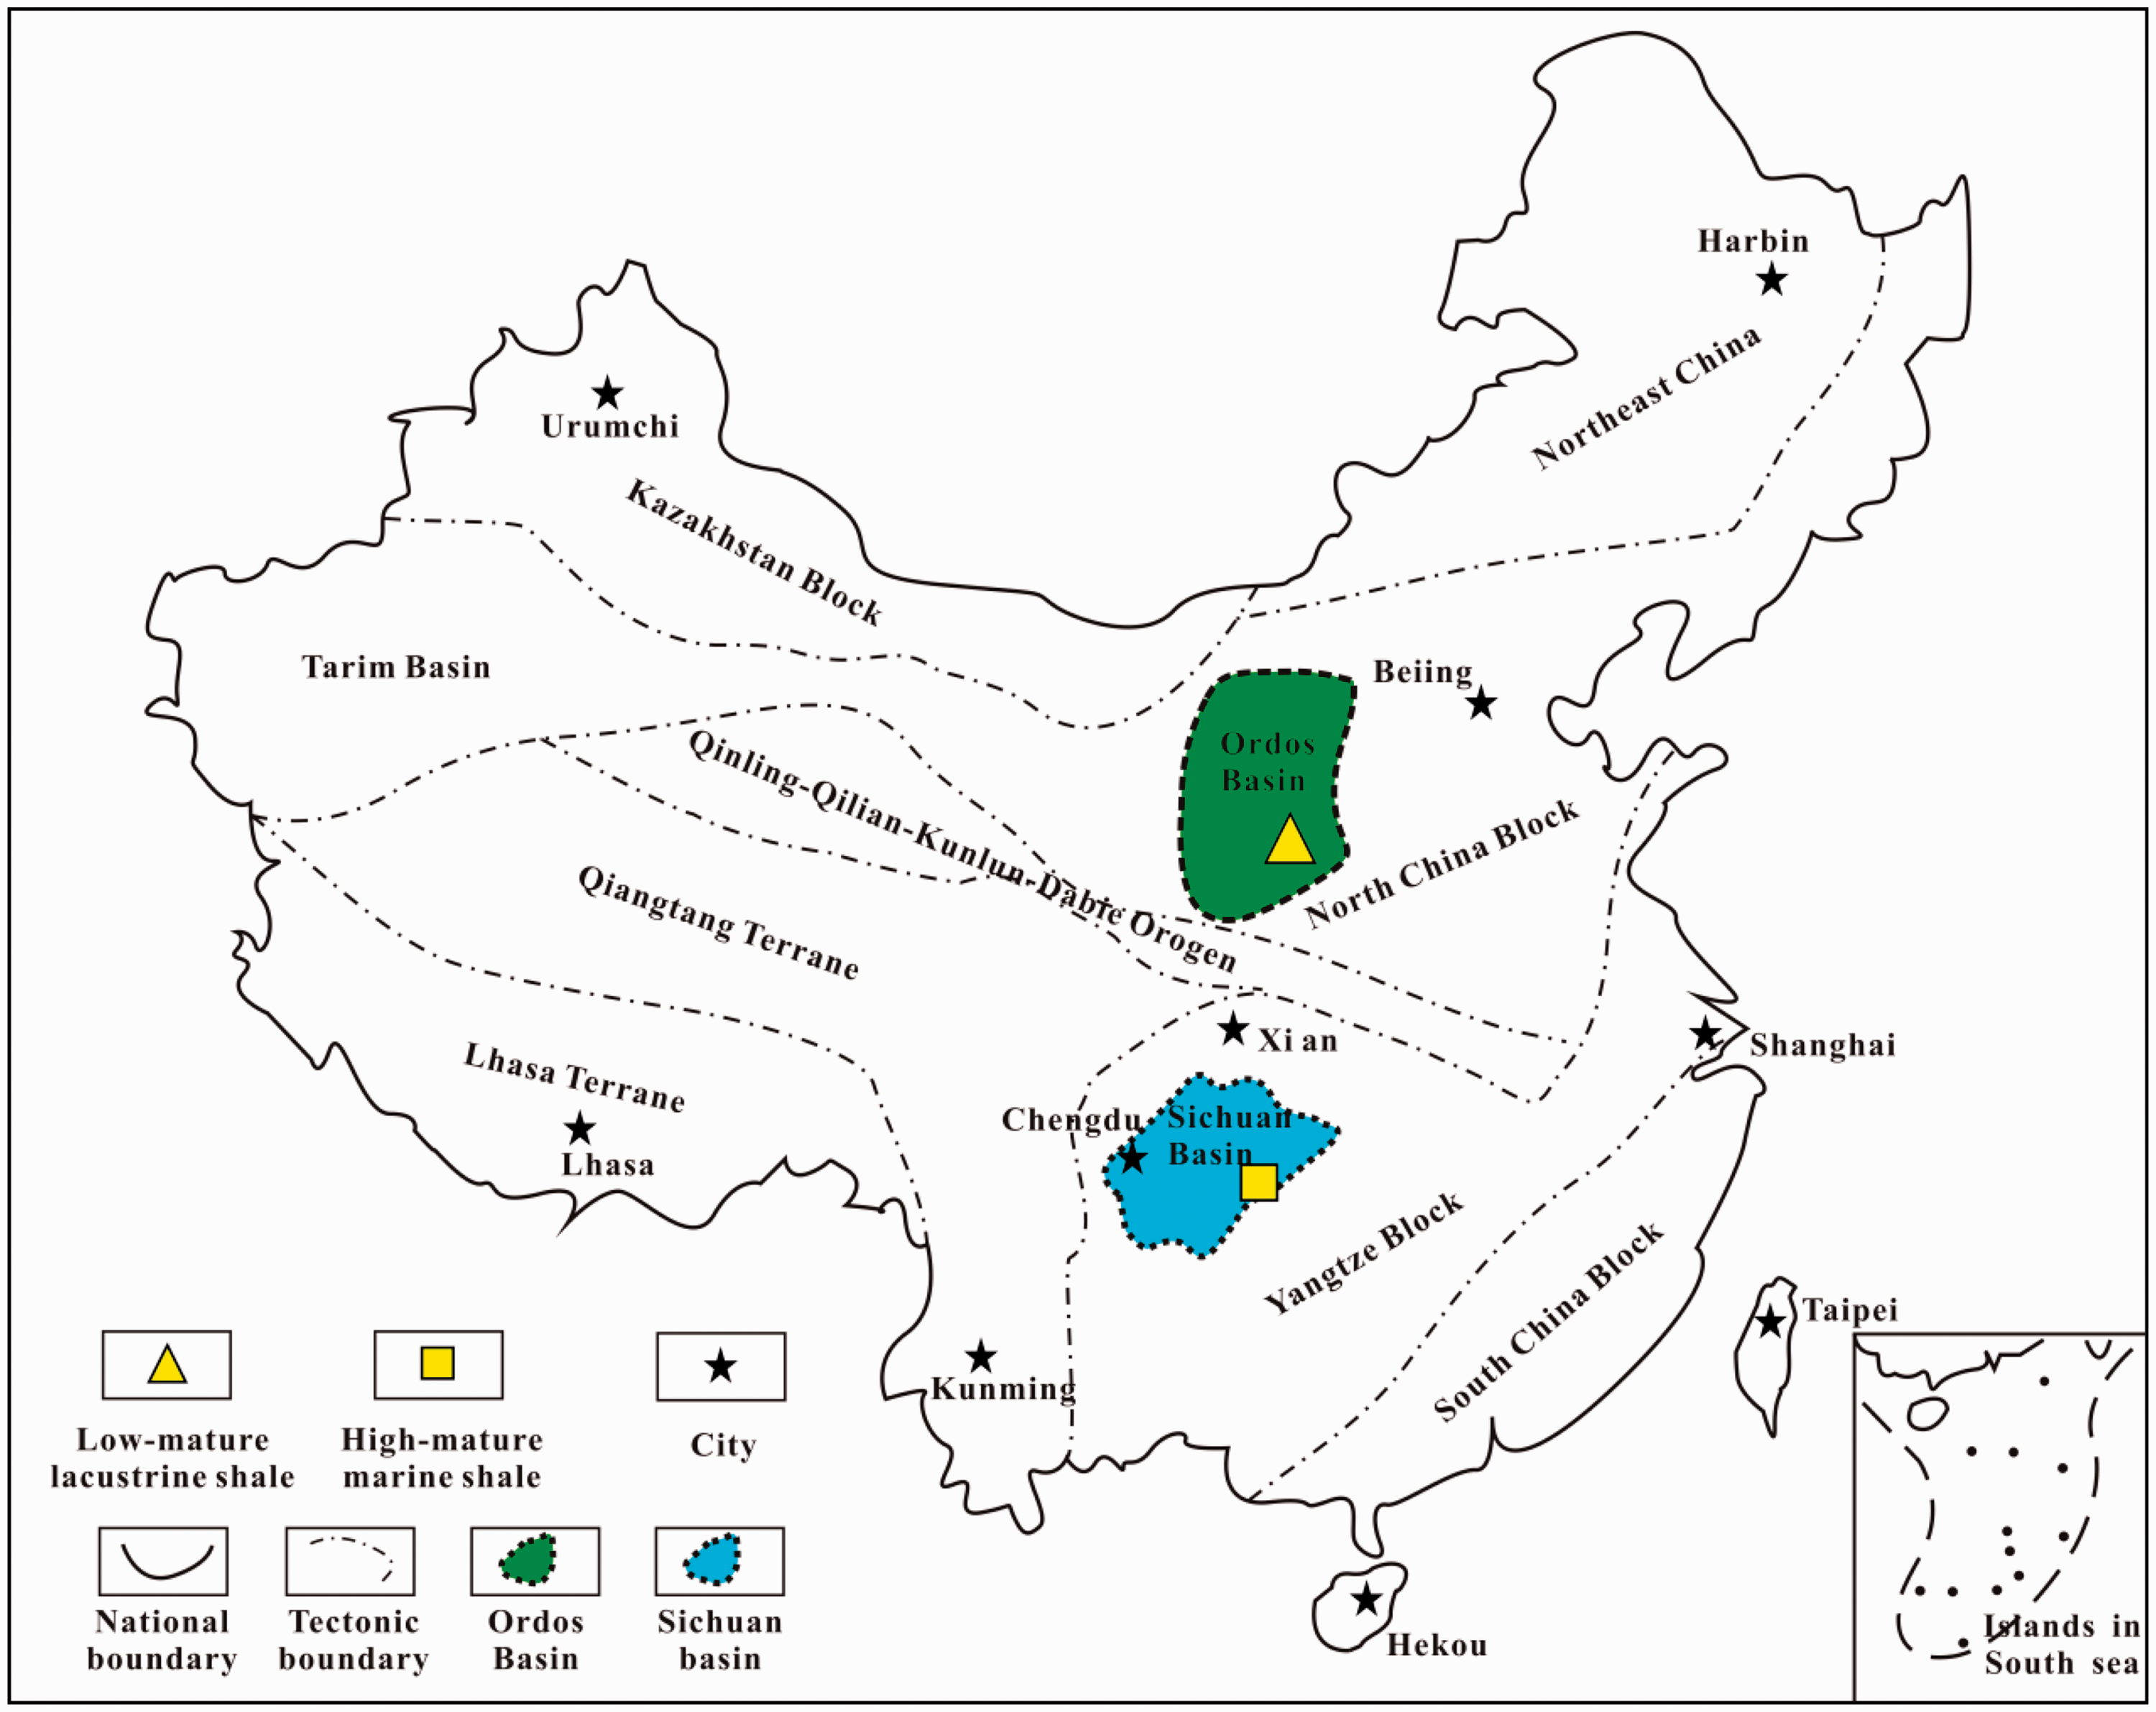
Maturities, organic matter contents, porosities, and mineral compositions of the 12 shale samples from representative Upper Triassic lacustrine Yanchang7 shale in the Ordos Basin and Lower Silurian Longmaxi marine shale in the Sichuan Basin.
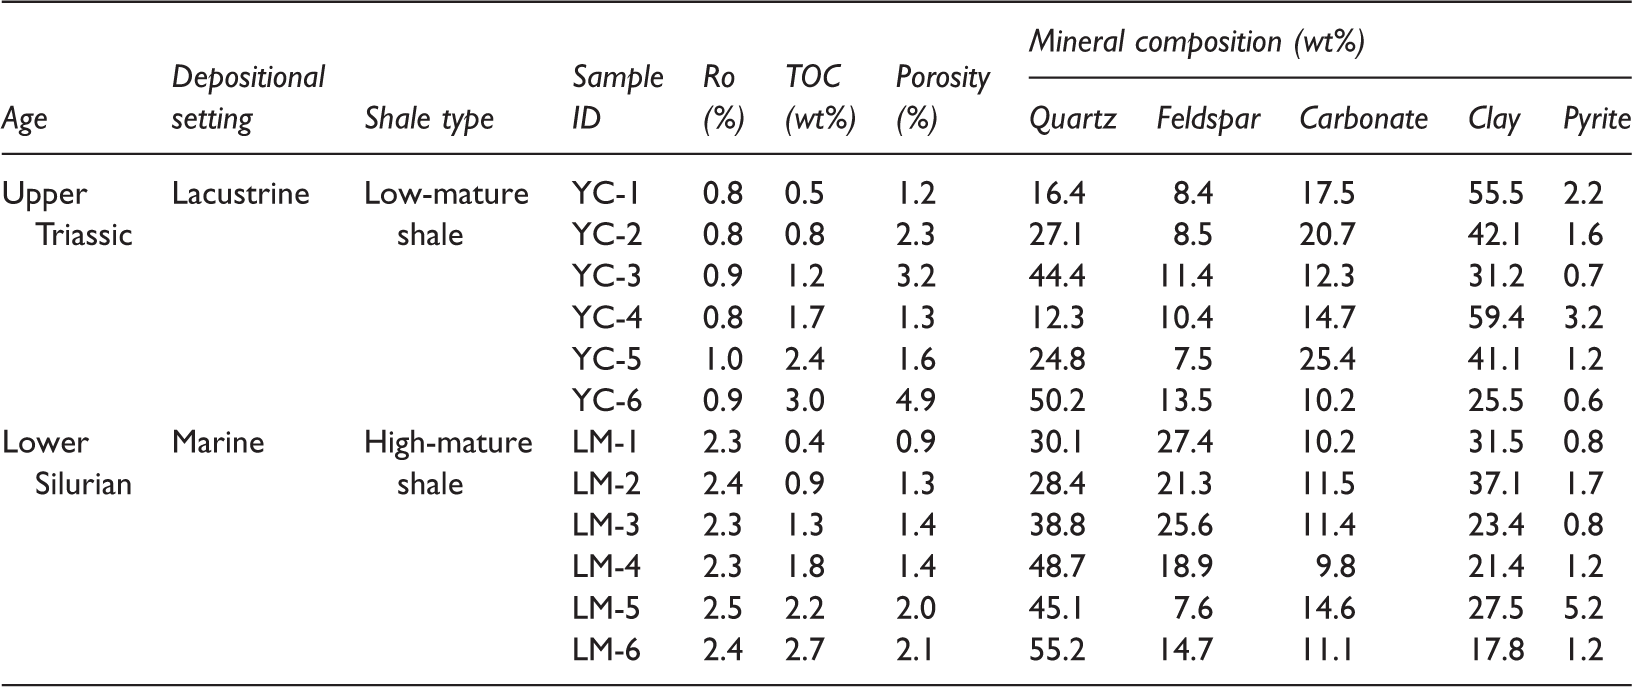
TOC: total organic carbon.
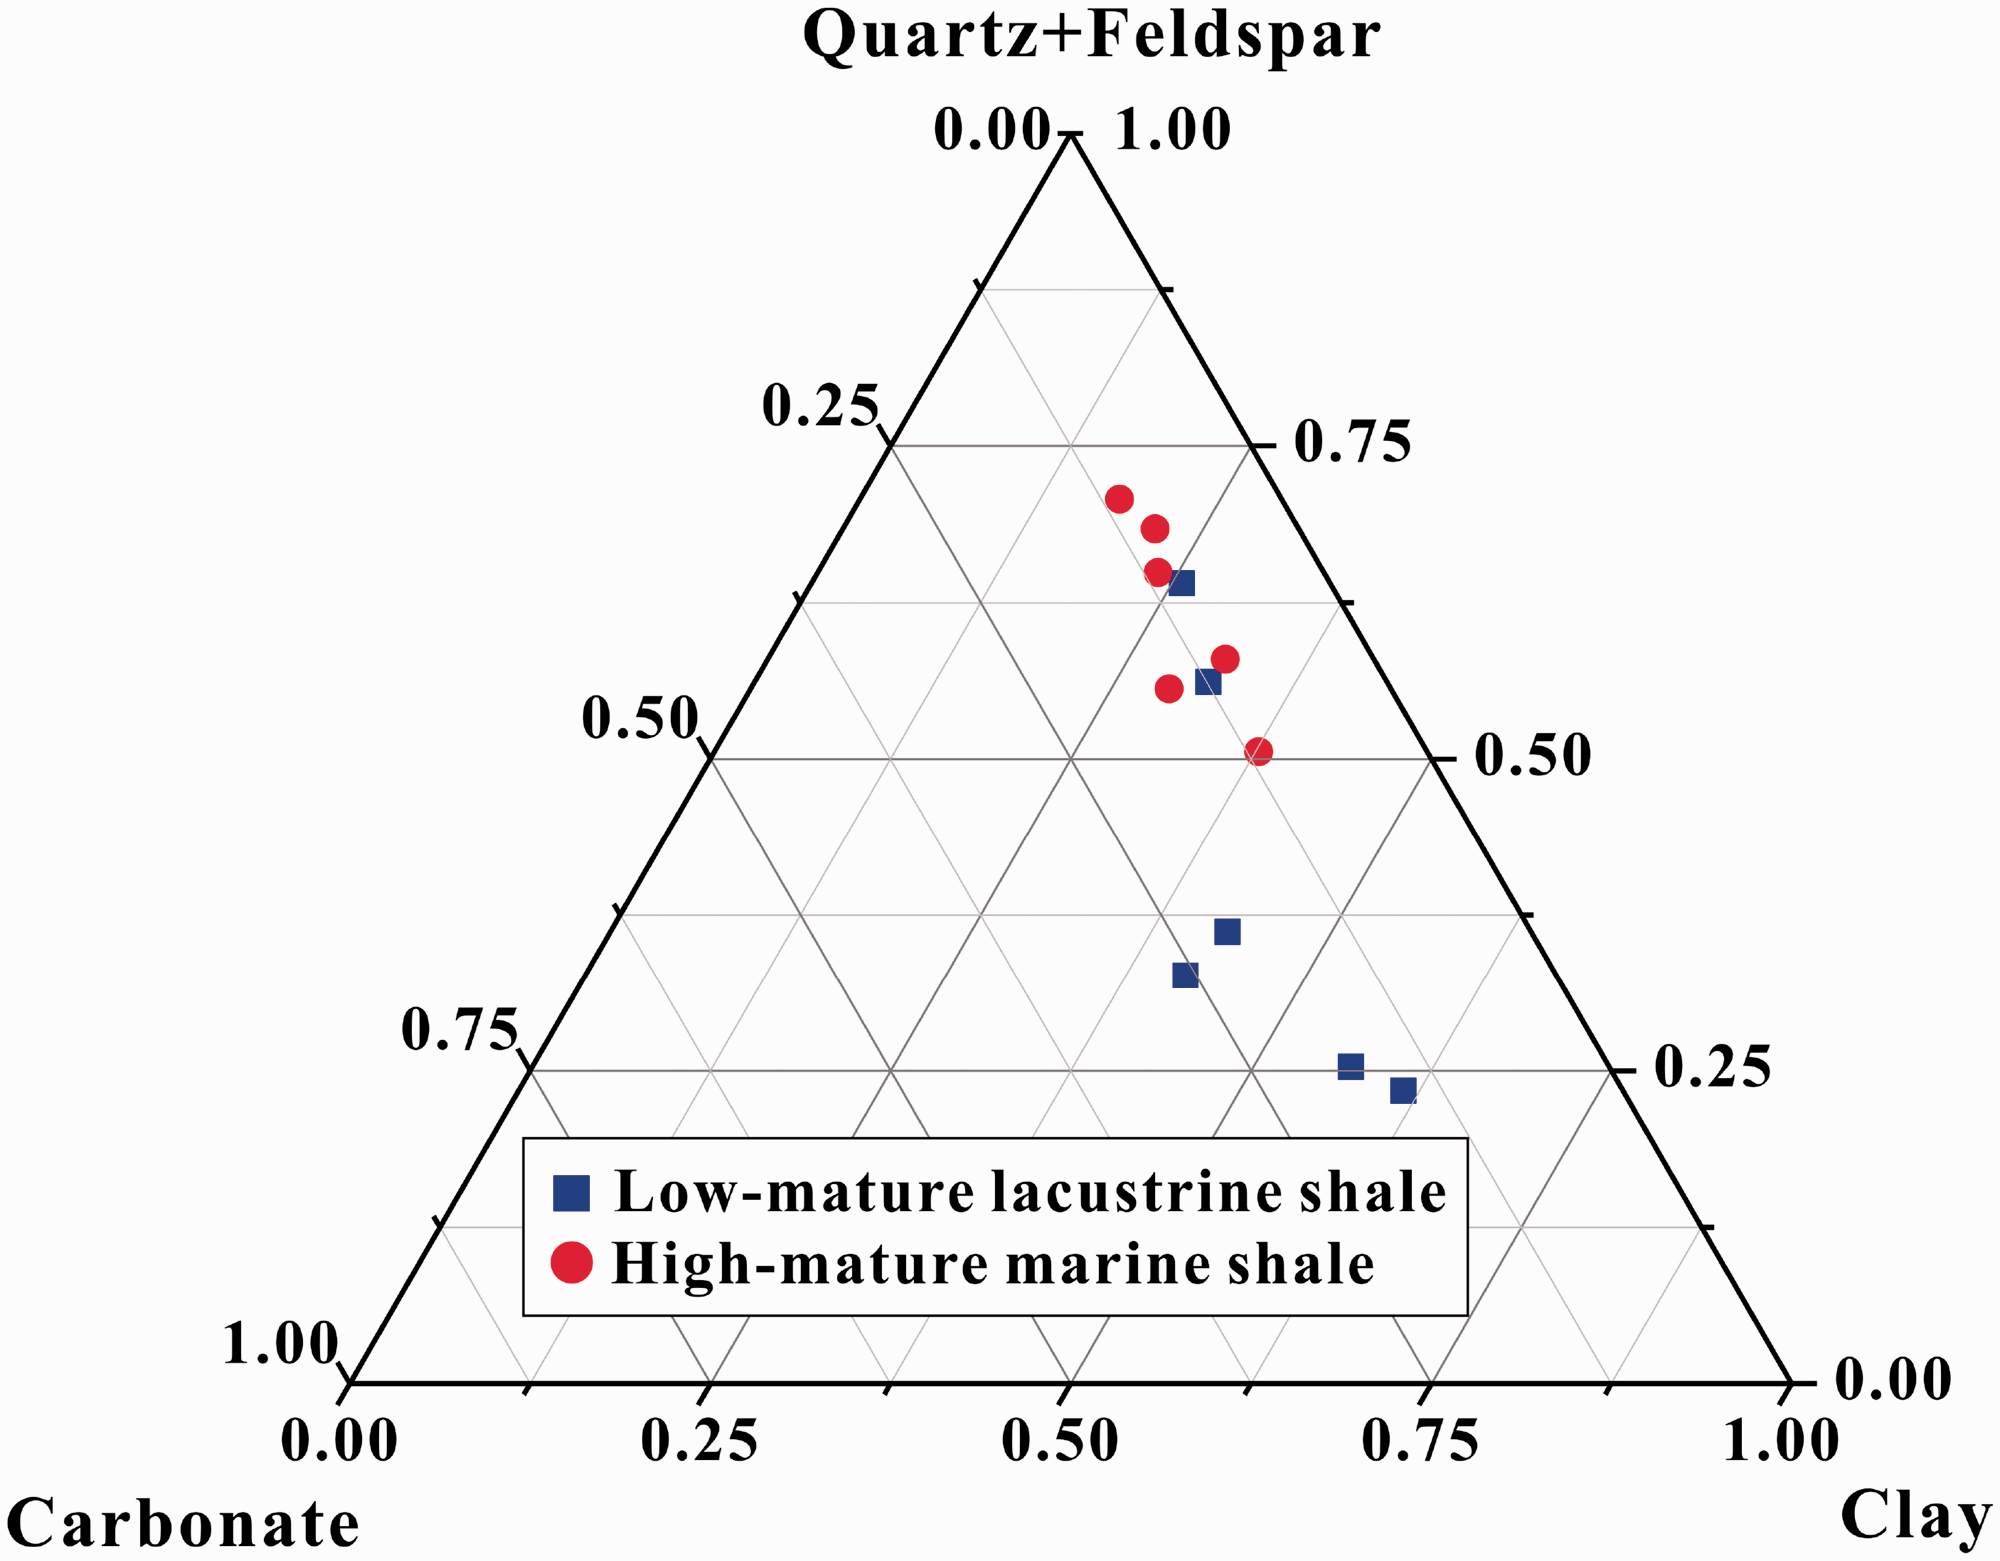
Ternary diagram of mineralogy for lacustrine shale and marine shale with different maturity levels. The clay content of low-mature Upper Triassic lacustrine shale in the Ordos Basin is higher than that of high-mature shale from the marine Longmaxi Formation shale in the Sichuan Basin, while quartz and feldspar levels are lower in low-mature compared to high-mature shale. A lower carbonate value of high-mature marine shale samples compared to low-mature lacustrine shale samples.
An AutoPore IV 9520 (Micromeritics Instrument Corporation) was used for MICP experiments. Pressures ranged from 1.5 to 60,000 psi with pore size measurements ranging from 0.003 to 120 µm. The mercury volume resolution was 0.1 µl. The sizes of the samples used in the test are about 2 mm (rice grain size). Approximately 3 g of each sample was tested. Before MICP testing, all samples were oven dried at 70–80℃ for 12 h. As a nonwetting fluid for most porous media, mercury will not invade pores unless external pressure is applied. At each pressure, the pore diameter can be obtained using the Washburn equation. The amount of mercury equals the pore volume under the measured pressure at each point (Kenvin et al., 2015).
An FEI Helios 650 was used to obtain FIB-SEM images. Samples were mechanically cut and polished by a Leica EM TXP Target Sectioning System, after which ion polishing was performed using a JEOL IB-09020CP cross section polishing instrument, which not only avoids destruction of the rock surface during the mechanical polishing process but can also reflect real shale surface morphologies and pore structures. The working voltage of the argon ion polishing instrument was set to 5 kV, while the current and polishing time were set to approximately 100 µA and 10–12 h, respectively. Next, a 10 nm thick gold film was required to increase the conductivity of the polishing surface. The prepared samples were placed in the FEI Helios 650 to observe pore types, morphologies, distributions, etc. During observation, the minerals were distinguished by their gray levels or by means of energy spectrum analyses. The maximum pixel resolution of the instrument was 0.8 nm, but the pixel resolution of the shale sample was generally only about a few nanometers. The experiments were performed at the China University of Petroleum (Beijing).
Results and discussions
Pore development characteristics and controlling factors
Low-mature lacustrine shale of Triassic Yanchang Formation
Low-mature lacustrine shale samples develop mainly intergranular inorganic pores exhibiting good qualitative connectivity (Figure 3(a) and (b)). There were minor intragranular inorganic pores and organic pores.
FIB-SEM images of different pore types in the low-mature lacustrine shale (sample YC-3) in Ordos Basin. As shown in (a) and (b), the intergranular inorganic pores are well developed and exhibited polygon and elongate shapes with generally irregular arrangements and 0.1–1 µm pore diameters. (c) shows good connectivity between interclay pores. (d) shows that interpyrite pores with pore diameters ranging from 15 to 500 nm have developed and exhibit good connectivity. (e) shows quartz-dissolved pores with 20–500 nm diameters had generally poor connectivity. (f) shows a presence of few organic pores with 5–250 nm diameters. Ca: carbonate; F: feldspar; FIB-SEM: focused ion beam-scanning electron microscopy; OM: organic matter; P: pyrite; Q: quartz.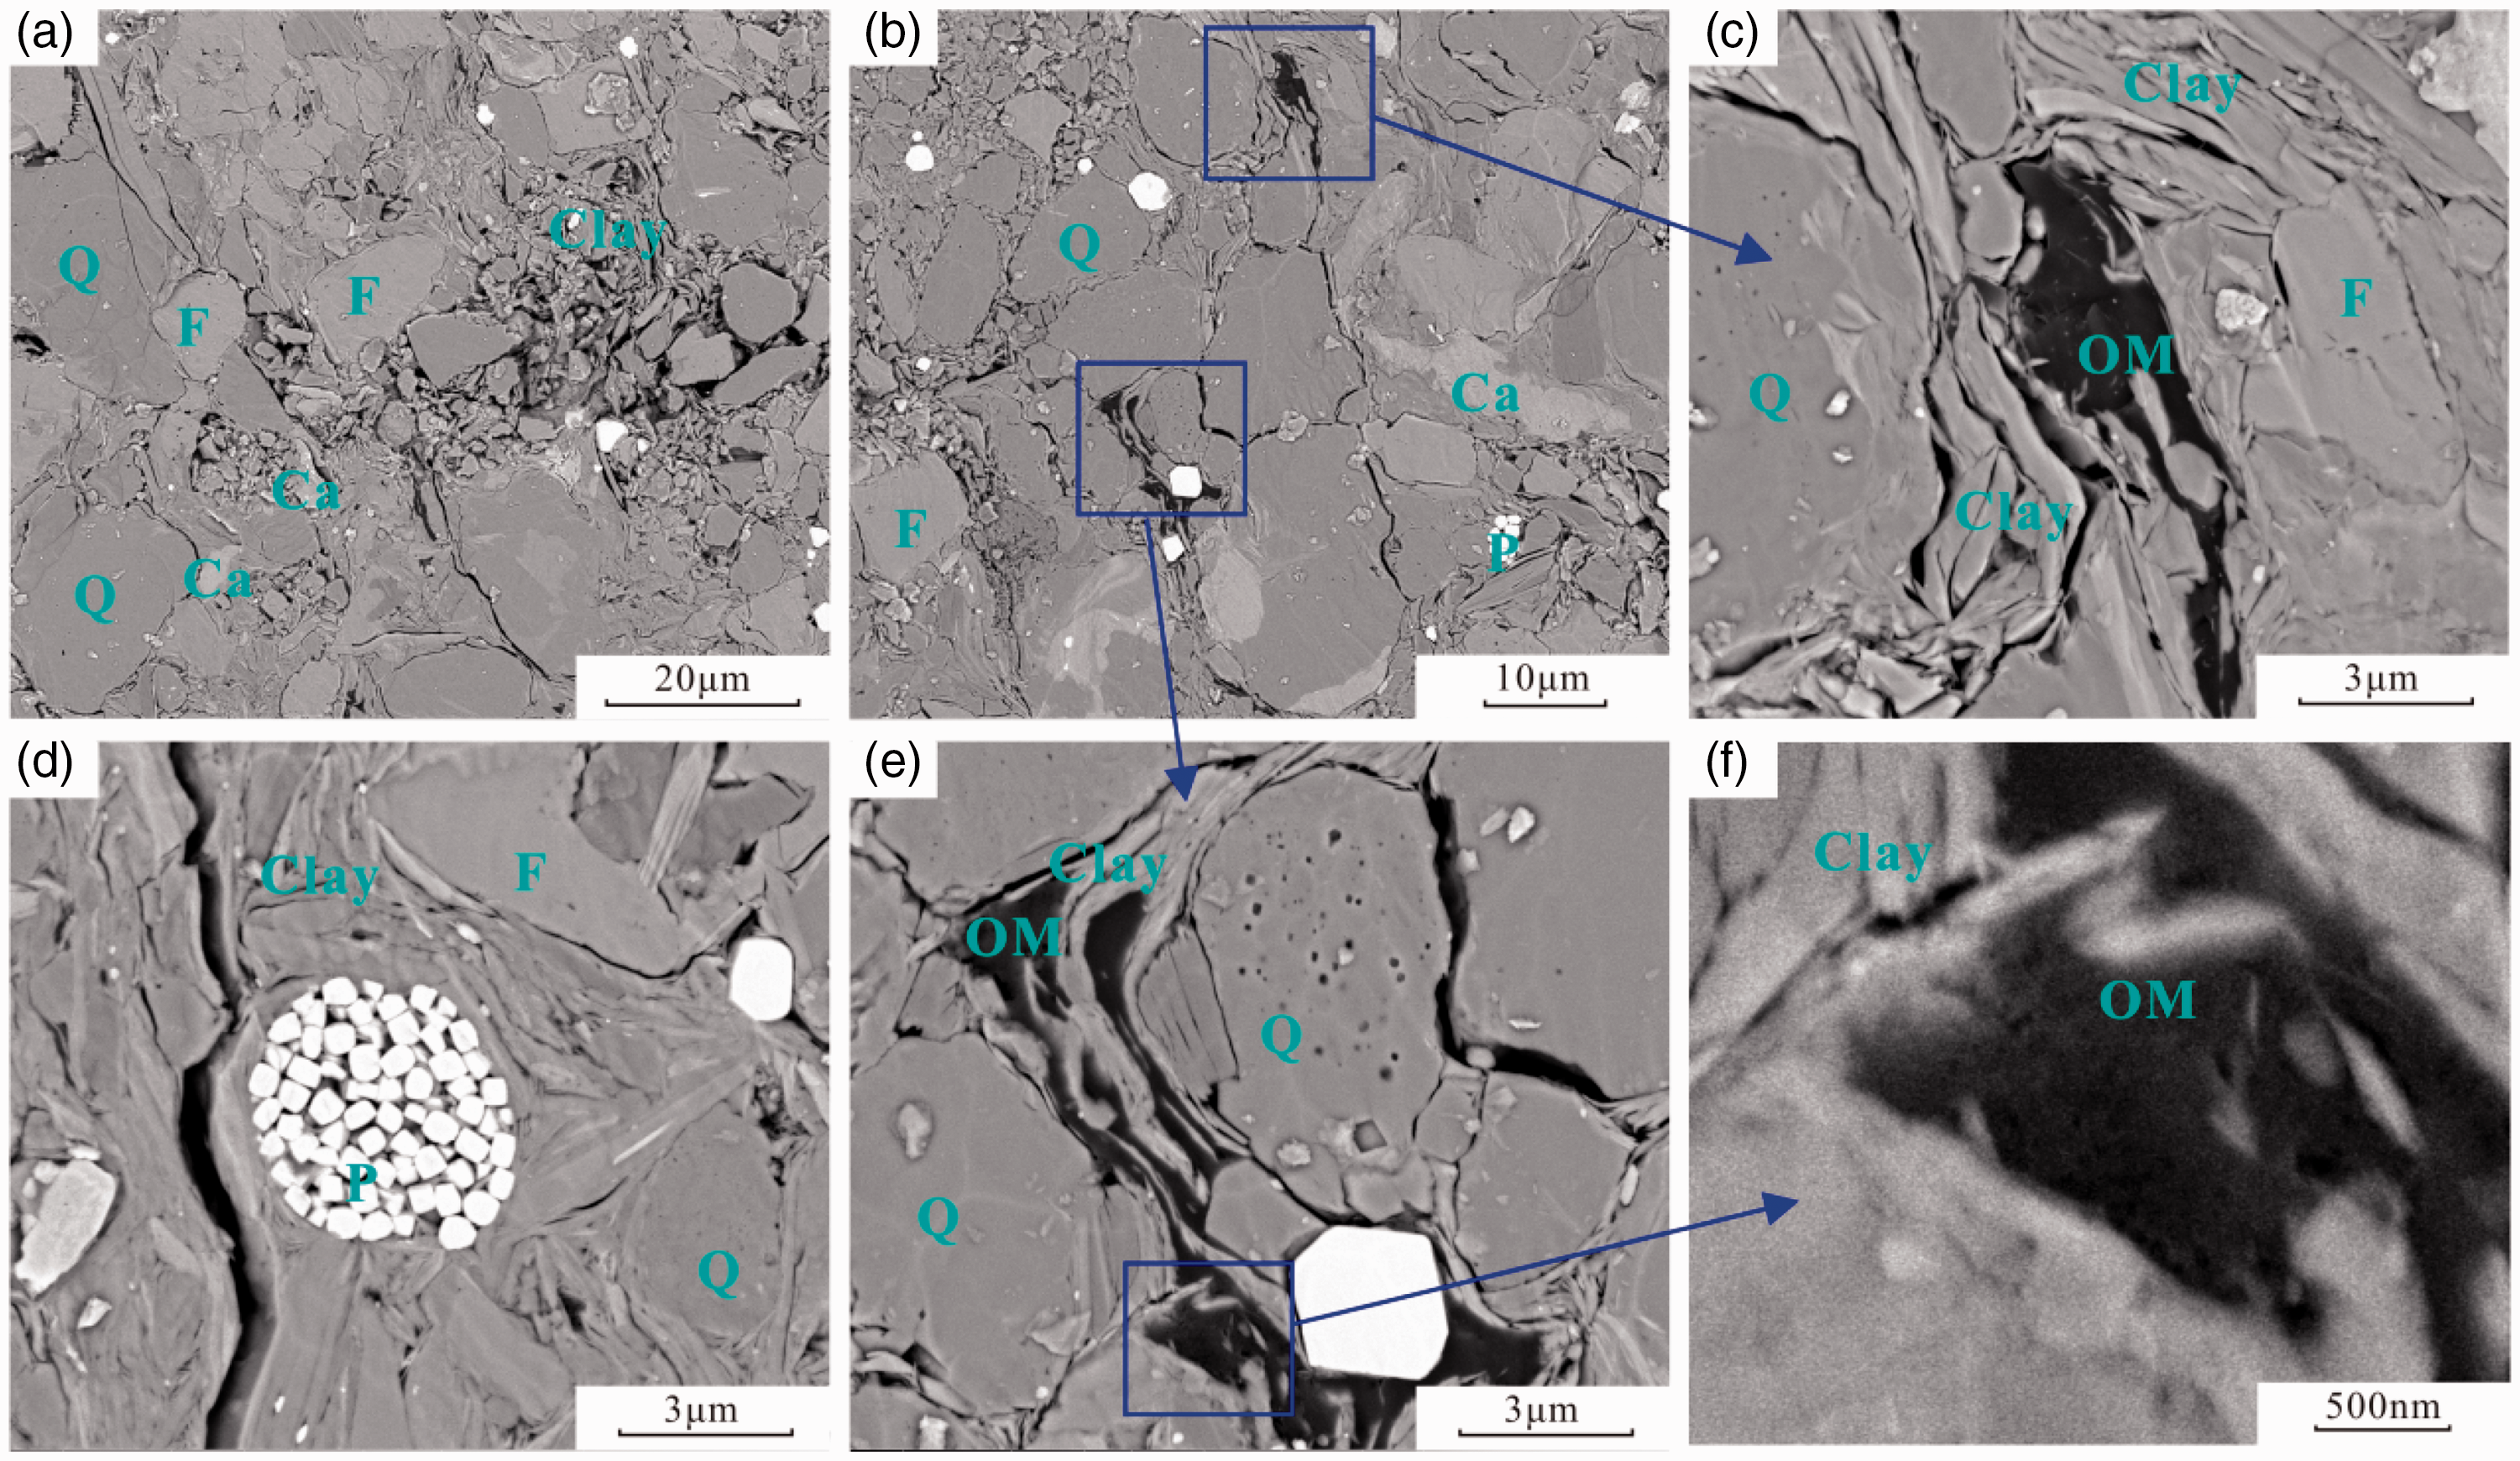
Intergranular inorganic pores, which develop between mineral grains, generally appear as polygon shapes or elongate shapes with irregular arrangements, and pore sizes mainly range from 0.1 to 1 µm (Figure 3(a) and (b)). Polygon-shaped pores constitute mainly residual space after the compaction of clay and brittle minerals, and elongate-shaped pores are associated with layered clay minerals (Figure 3(a) and (b)). As the clay minerals are layered, the interclay pores generally develop in illite/smectite mixed layers with open spaces to other layers; thus, the qualitative connectivity between interclay pores was good (Figure 3(c)). The pyrite framboids are usually spherical, and the pyrite in the framboids is usually cube or octahedron. Intergranular pores with 15–500 nm diameters also develop between pyrite crystals; these types of pyrite pores were well connected with each other (Figure 3(d)). Hydrocarbon fluid and water may control the development of intergranular pores for sandstone, but it has little effect on the development of intergranular pores for shale (Ma et al., 2015).
Intragranular inorganic pores were mainly comprised of dissolved pores on the surfaces of feldspar, carbonate, and quartz (Figure 3(e)) and exhibit different pore sizes ranging from 20 to 500 nm. The dissolved pores generally exhibit poor qualitative connectivity, and, as isolated pores, distribute sporadically within the minerals. Furthermore, only small quantity of dissolved pores develops in the Yanchang Formation lacustrine shale because the maturity of this shale is low. However, the tight sandstone of the Yanchang Formation has a large number of intragranular dissolution pores (Li et al., 2016).
The concentration of organic pores was very low, with only a few submicron-scale pores having developed (Figure 3(c) and (e)). The shapes of the organic pores were mainly circular and oval, with 5–250 nm pore diameters (Figure 3(f)). This low concentration of organic pores is related to the low thermal evolution of Yanchang Formation shale. The formations, distributions, and sizes of organic pores are effected by the abundance, types, and thermal maturity of the organic matter involved (Cao et al., 2015; Chalmers et al., 2012), such that the low maturity of Yanchang Formation lacustrine shale leads to a low number of organic pores.
High-mature marine shale of Silurian Longmaxi Formation
In the high-mature marine shale samples analyzed, organic pores are the main pore type observed, with small amounts of intragranular and intergranular inorganic pores (Figure 4(a) and (b)).
FIB-SEM images of different pore types in high-mature marine shale taking sample LM-2 as an example. As shown by (a) and (b), the high-mature marine shale can be observed to have large amounts of organic pores developed. (c) shows 5–200 nm (diameter) organic pores with oval, nearly spherical, slit, spongy, etc. As shown by (d) and (e), not all organic matter develops organic pores. (f) shows quartz pores with oval or round shapes. (g) shows dolomite pores with oval or irregular shapes. (h) shows residual intergranular inorganic pores preserved by brittle minerals. (i) shows interpyrite pores with good connectivity. Ca: carbonate; F: feldspar; FIB-SEM: focused ion beam-scanning electron microscopy; OM: organic matter; P: pyrite; Q: quartz.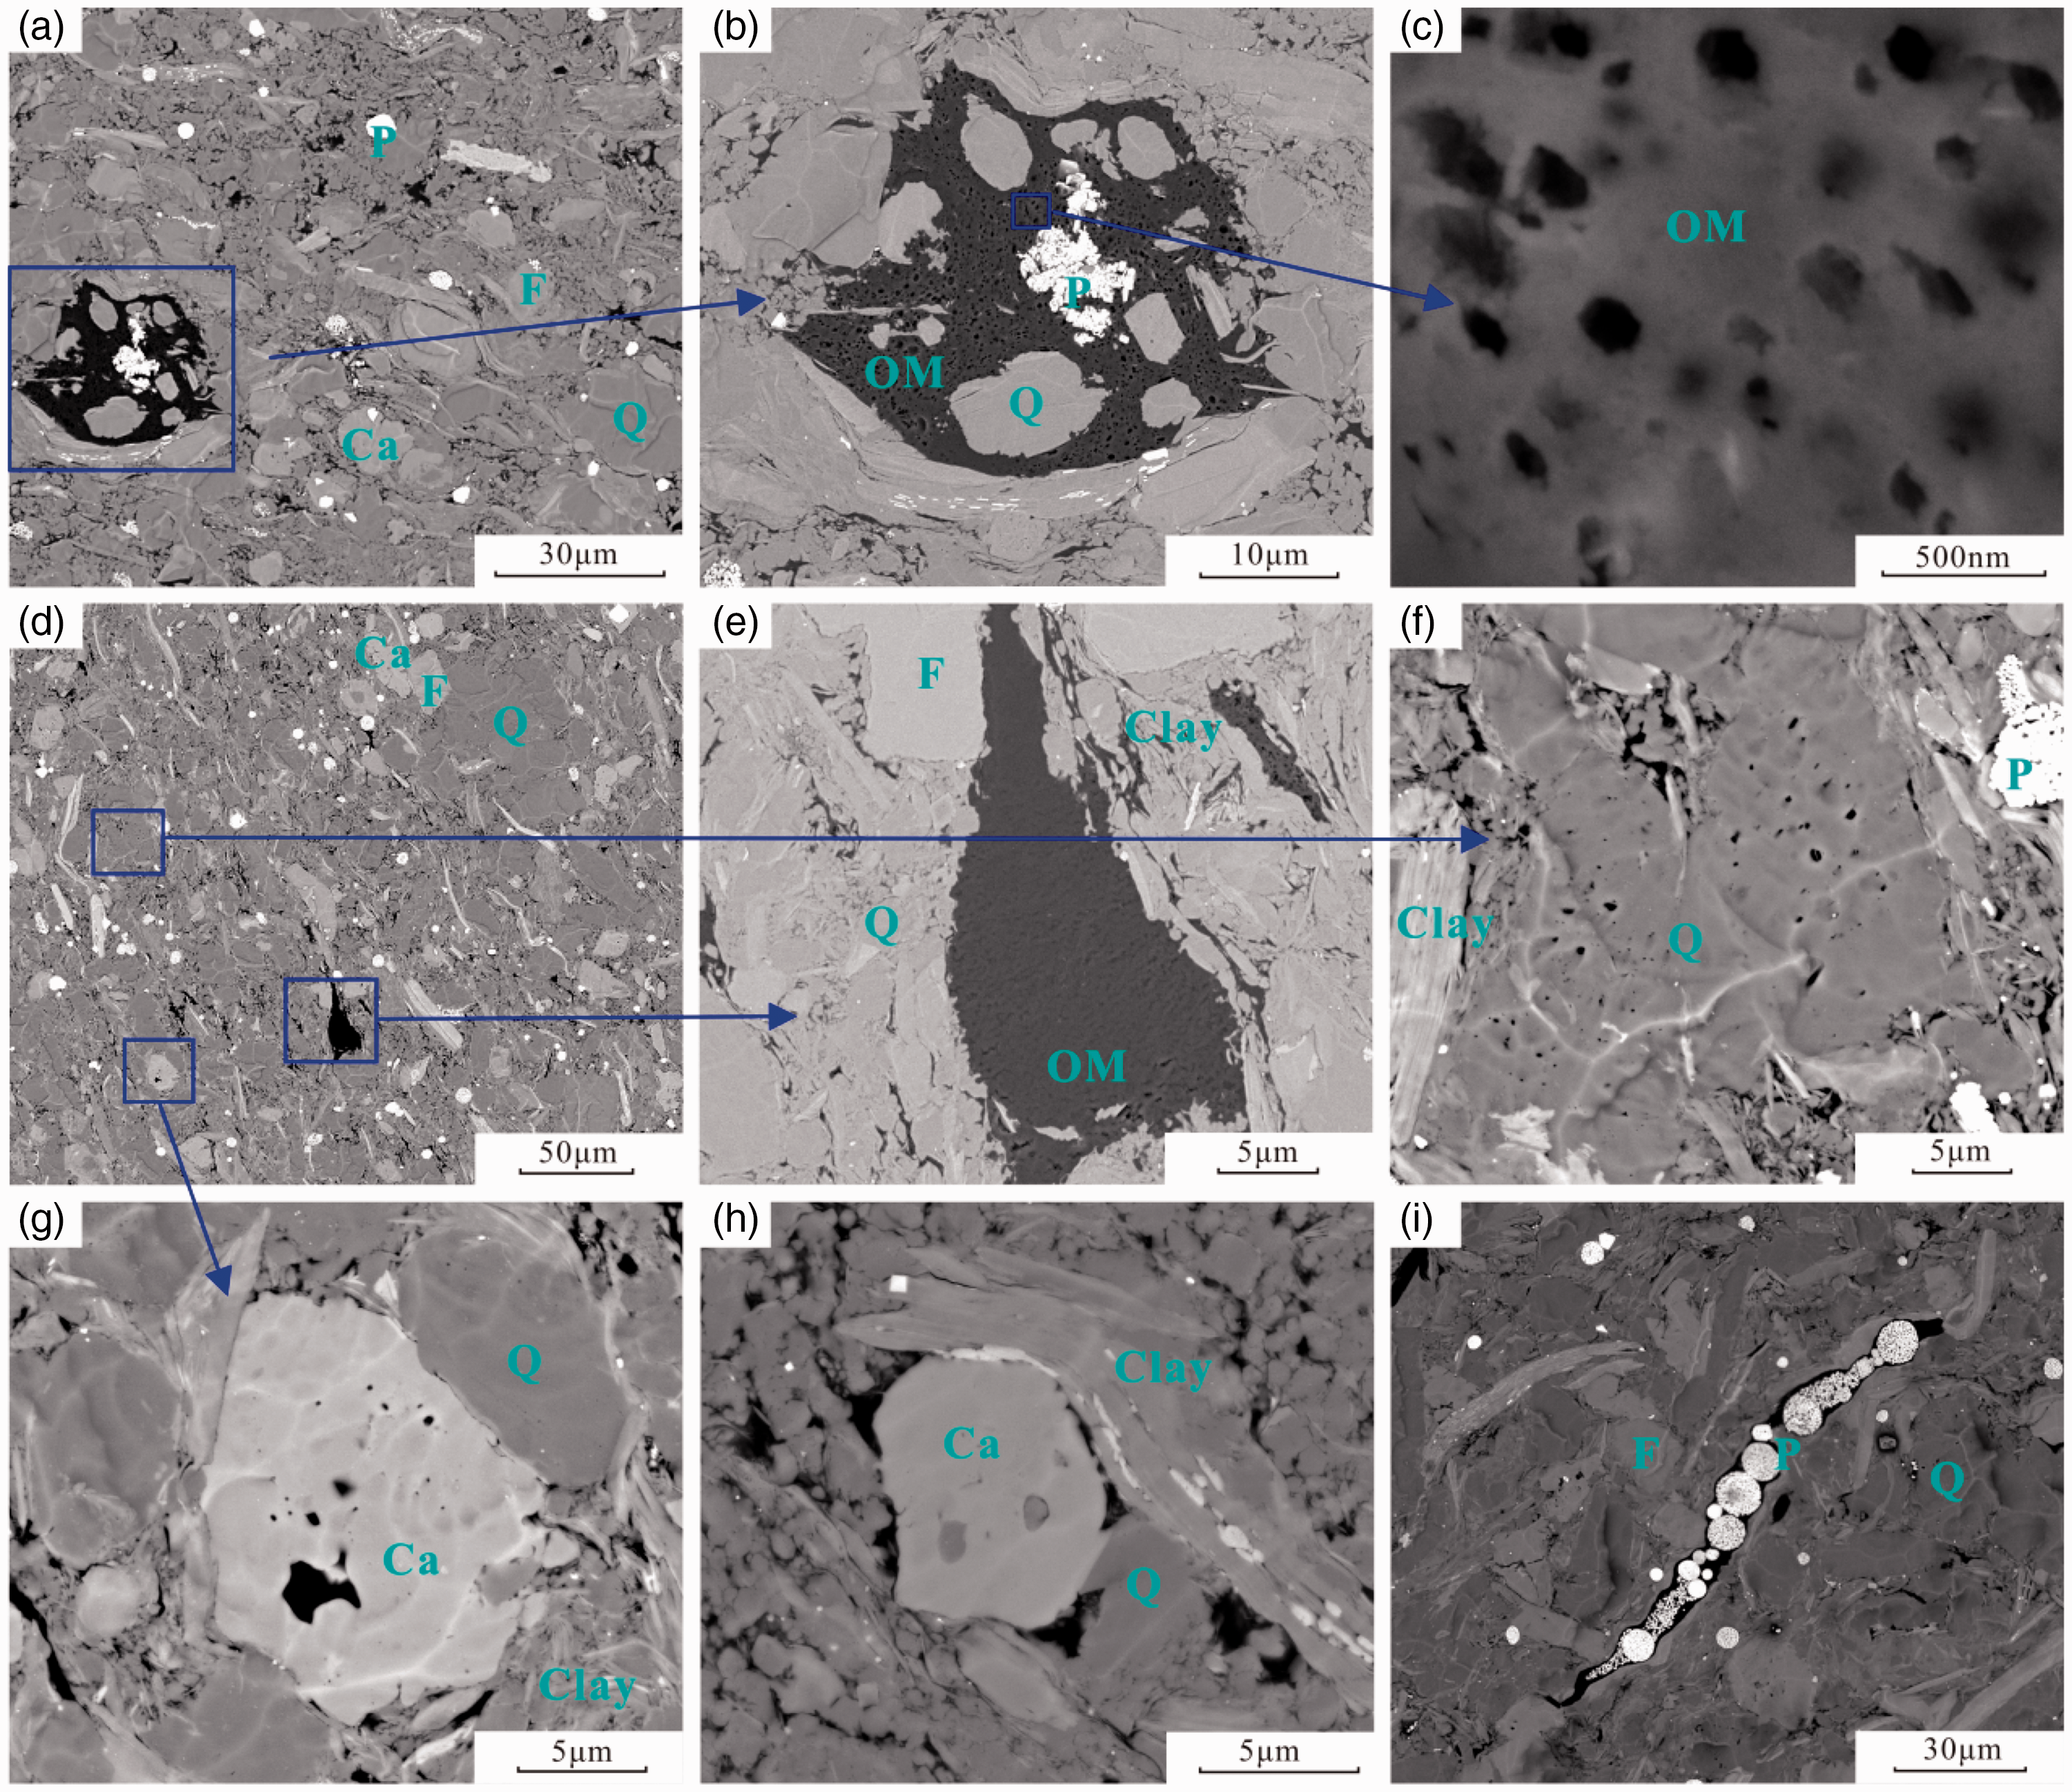
Organic pores developed within organic matter generally exhibit the shapes that were oval, nearly spherical, slit, spongy, etc. and pore sizes range mainly from 5 to 200 nm (Figure 4(b) and (c)). These organic pores form a connected pore network that offers a greater specific surface area for gas adsorption and more space for gas storage (Ross and Bustin, 2009; Zhang et al., 2012). Pore volumes approach more than 40–50% of organic matter volumes, such that the shale porosity could be increased in an obvious manner (Table 1). However, not all organic matters develop pores (Figure 4(d) and (e)), which may be related to the type of organic matter (Curtis et al., 2012). Type II kerogen develops organic pores more easily than type III kerogen (Wang et al., 2015). In addition, the development and connectivity of organic pores may be related to redox conditions and the richness of their organic surroundings during the deposit (Katsube and Williamson, 1994).
The intragranular inorganic pores of the high-mature marine shale can be found in many minerals, such as quartz, feldspar, and carbonate minerals (Figure 4(f) and (g)). The intergranular inorganic pores, generally presented the shape of spherical, groove, or polygon, have poor qualitative connectivity, and the pore size was mainly in the range of 50–500 nm (Figure 4(h)).
High-mature marine shale contains very few intergranular inorganic pores. Original intergranular inorganic pores would have been destroyed by compaction, but because brittle minerals can help resist the compaction, some of these pores can be preserved (Figure 4(h)). The intergranular inorganic pores were mainly interclay pores, which were primarily related to clay mineral transformation (Guo et al., 2014). The interpyrite pores exhibited good qualitative connectivity (Figure 4(i)).
Pore size distribution and controlling factors
Low-mature lacustrine shale
Mercury intrusion can directly reflect the distribution of pore volumes in the MICP. A steep mercury curve corresponds to a high pore volume, while a gentle mercury curve corresponds to a low pore volume. A high cumulative intrusion corresponds to a high total pore volume (Tang et al., 2015). As shown in Figure 5, the mercury was mainly injected at 0–100 psi, accounting for approximately 40–90% of the total mercury intrusion. At pressures higher than 100 psi, the mercury curve became flat, and mercury intrusion amount was low.
MICP of the low-mature lacustrine shale samples analyzed herein, showing the mercury intrusion of 0–100 psi, which accounts for most of the total mercury intrusion. The cumulative intrusion curve is flat during the high-pressure stage. MICP: mercury intrusion capillary porosimetry.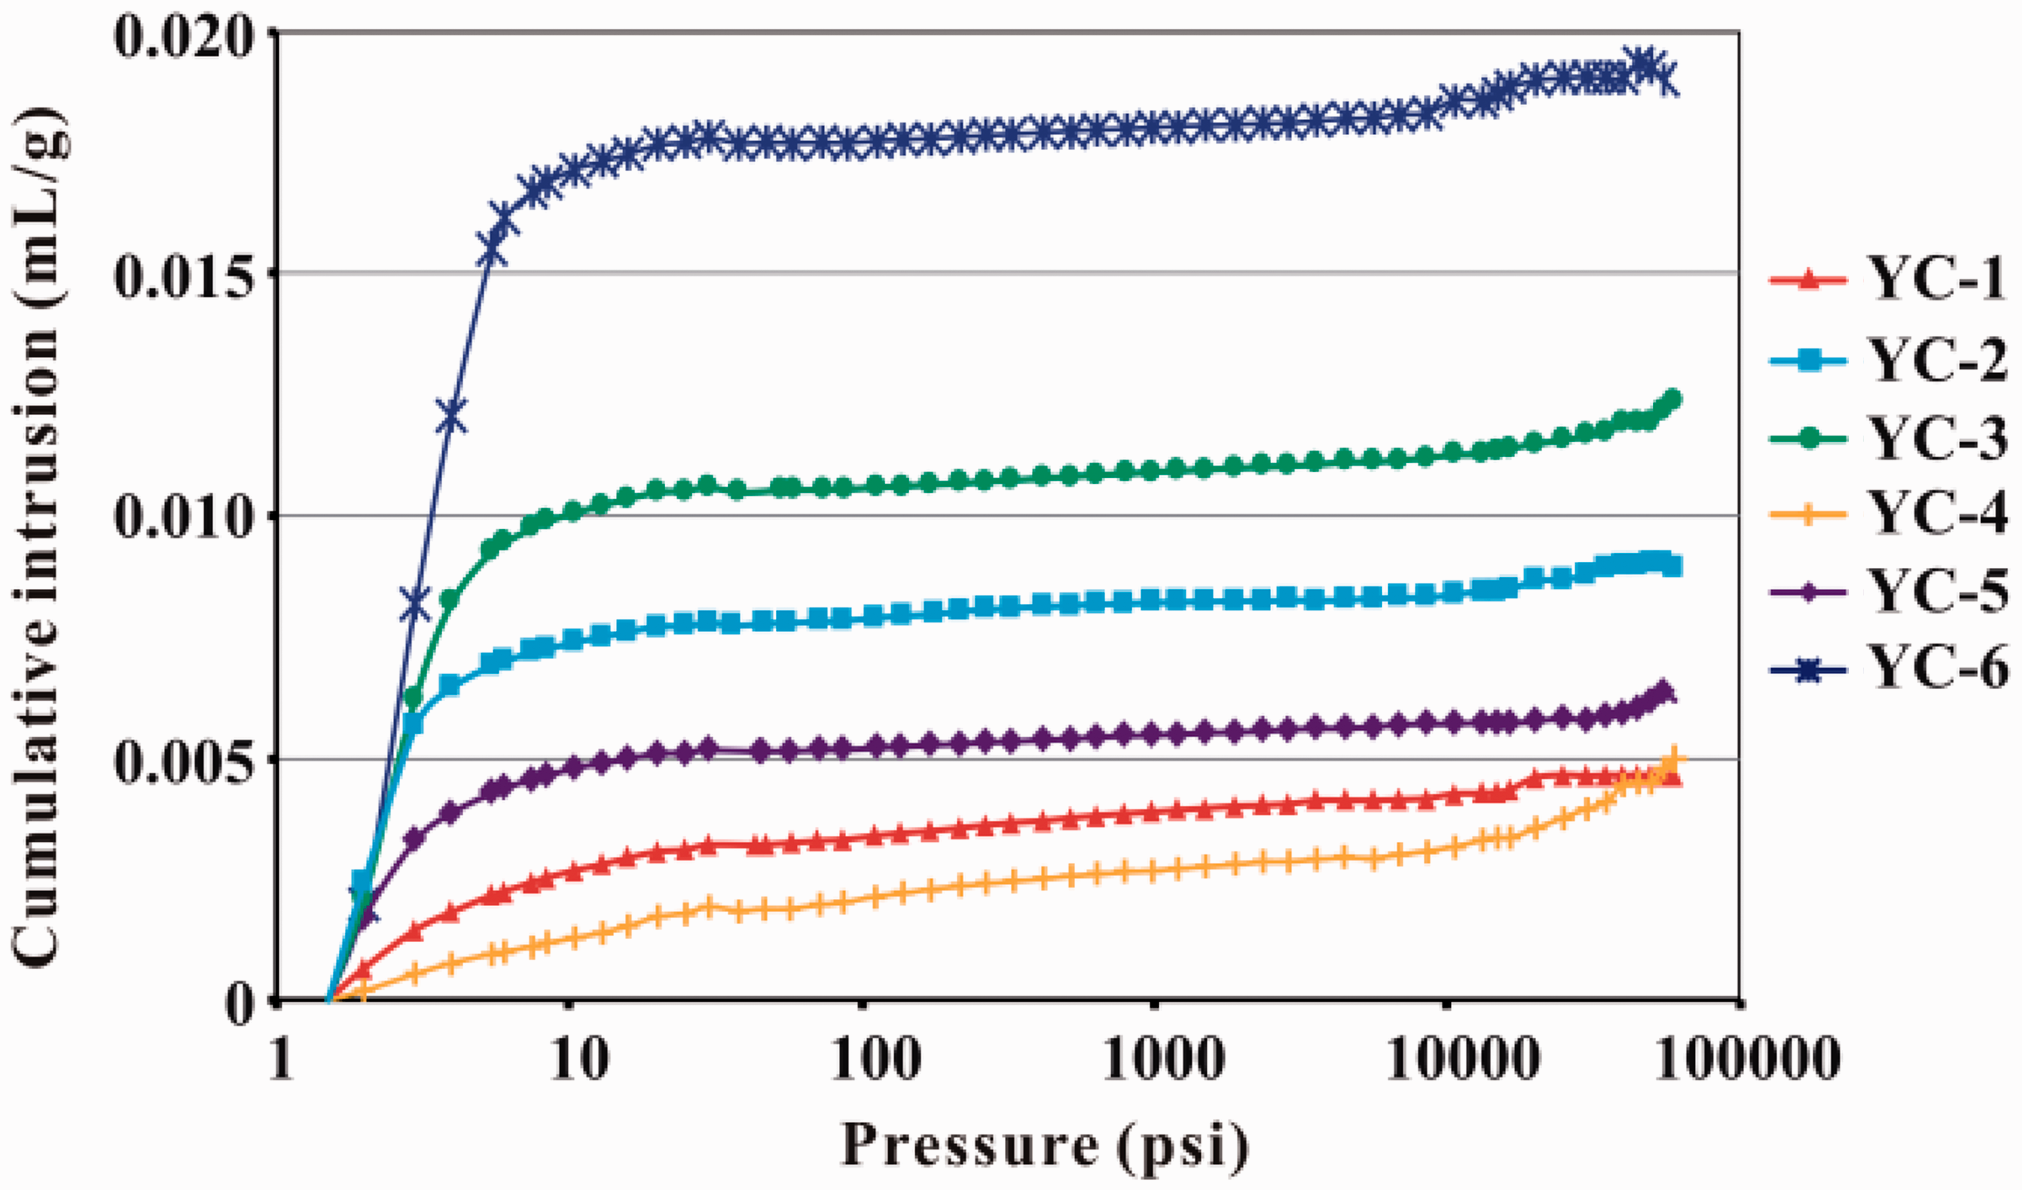
The distribution of pore volumes is predominated by one peak in the range of 30–120 µm, for which the pore volume accounts for approximately 73% of the total pore volume (Figure 6). The submicron-scale pore volume is very low, which may relate to the few organic pores observed in low-mature lacustrine shale (Figure 3). Regardless of how TOC and clay content change, the pore volumes of range 3–1000 nm diameters remain relatively low. However, for YC-1 and YC-2 samples containing lower TOC amounts, the pore volumes range from 3 to 1000 nm diameters lower than other samples; this indicates that high organic matter content may result in higher nano-pore volumes of 3–1000 nm diameters in the YC-3 to YC-6 samples (Figure 6). For the YC-3 and YC-6 samples, which contain high amounts of brittle minerals (quartz, feldspar, and carbonate minerals), pore volumes are mainly contributed by pores with pore throat ranging from 30 to 120 µm and are obviously higher than those found in other samples; the YC-4 sample exhibits the lowest values of pore volumes with pore throat ranging from 30 to 120 µm which has the highest clay contents (Figure 6). This indicates that brittle minerals mainly contributed particular pores with diameter of 30–120 µm and these pores made the largest contribution to the total pore volume. This is because these low-mature lacustrine shale samples predominantly develop intergranular inorganic pores (Figure 3), and brittle minerals can help preserve more intergranular inorganic pores compared to clay.
Pore size distribution of low-mature lacustrine shale samples. Pore volumes are predominantly contributed by pores with diameter of greater than 30 µm; the contribution from pores with diameters <1 µm is very low.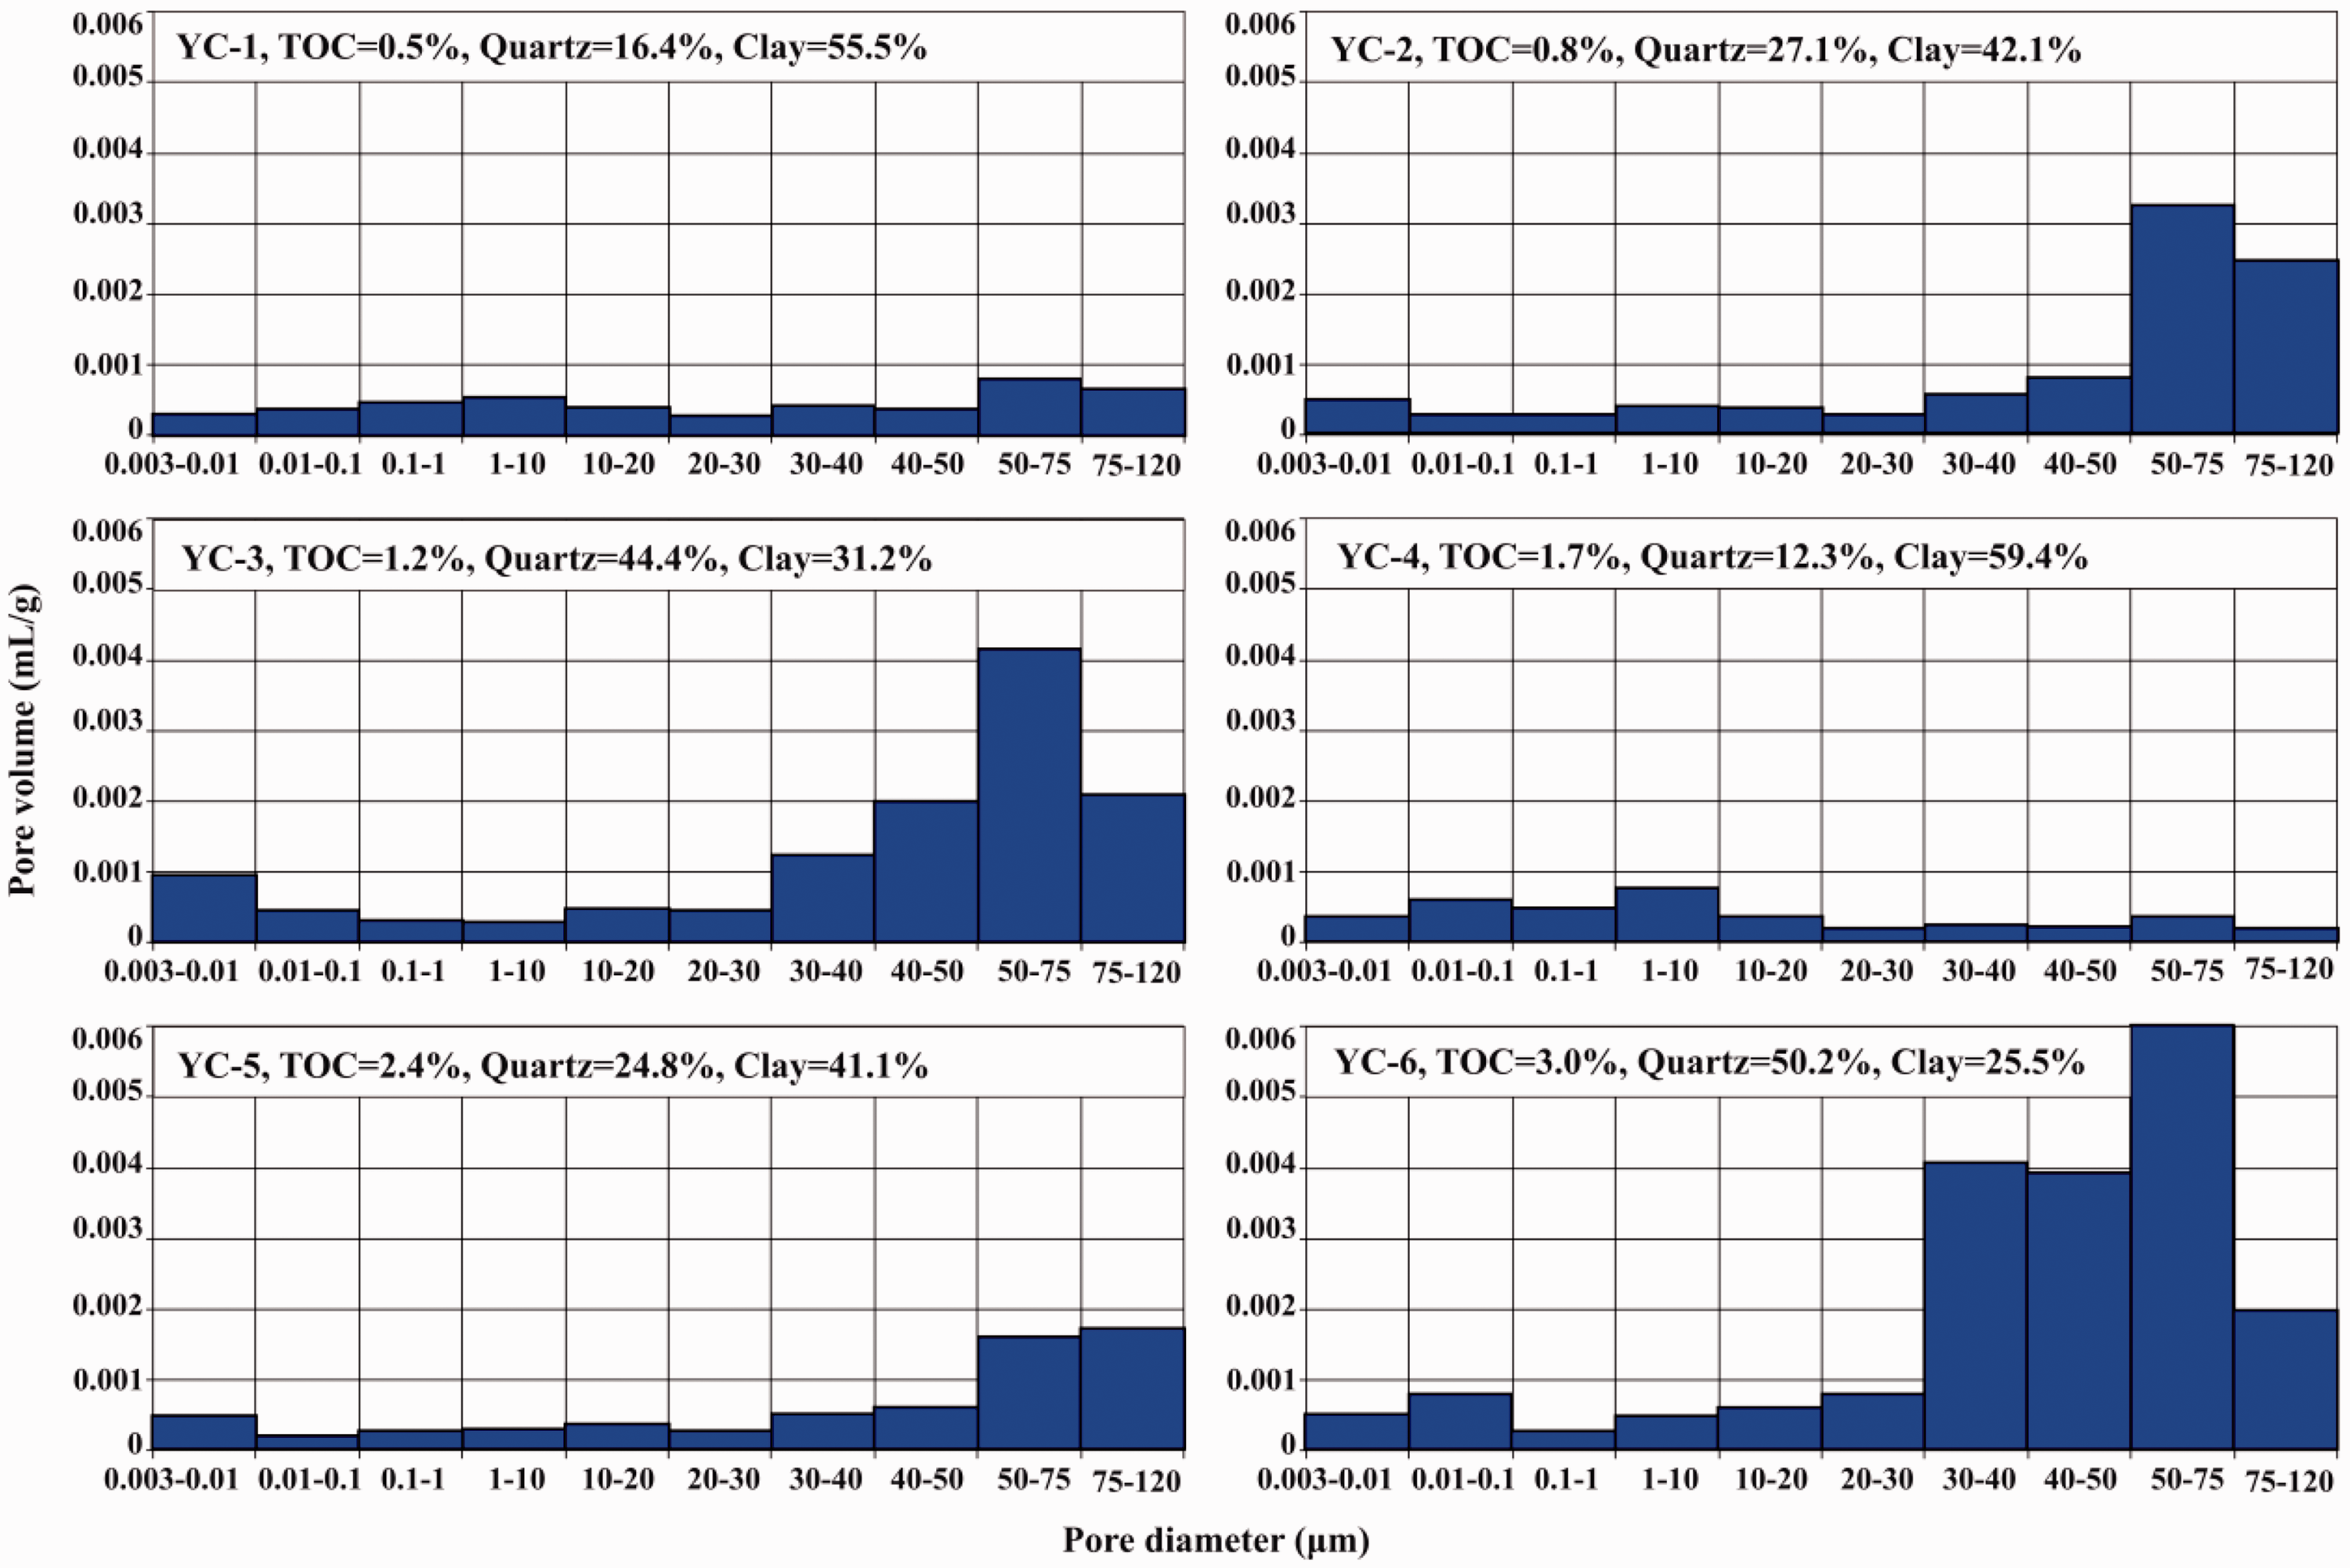
High-mature marine shale
As shown in Figure 7, the mercury curve for high-mature marine shale can be divided into the following three sections: (1) a gradual increasing stage where pressures are less than 30 psi; (2) a slowly increasing stage, where pressures are 30–5000 psi; and (3) a rapidly increasing stage, where pressures are greater than 5000 psi. This indicates that both submicron-scale pores (pore diameter <1 µm) and micro-scale pores (pore diameter >1 µm) are present in high-mature marine shale and both contribute to the pore volume.
MICP of the high-mature marine shale samples analyzed herein, showing the characteristics of three stages and the mercury injection increases rapidly at high pressures. MICP: mercury intrusion capillary porosimetry.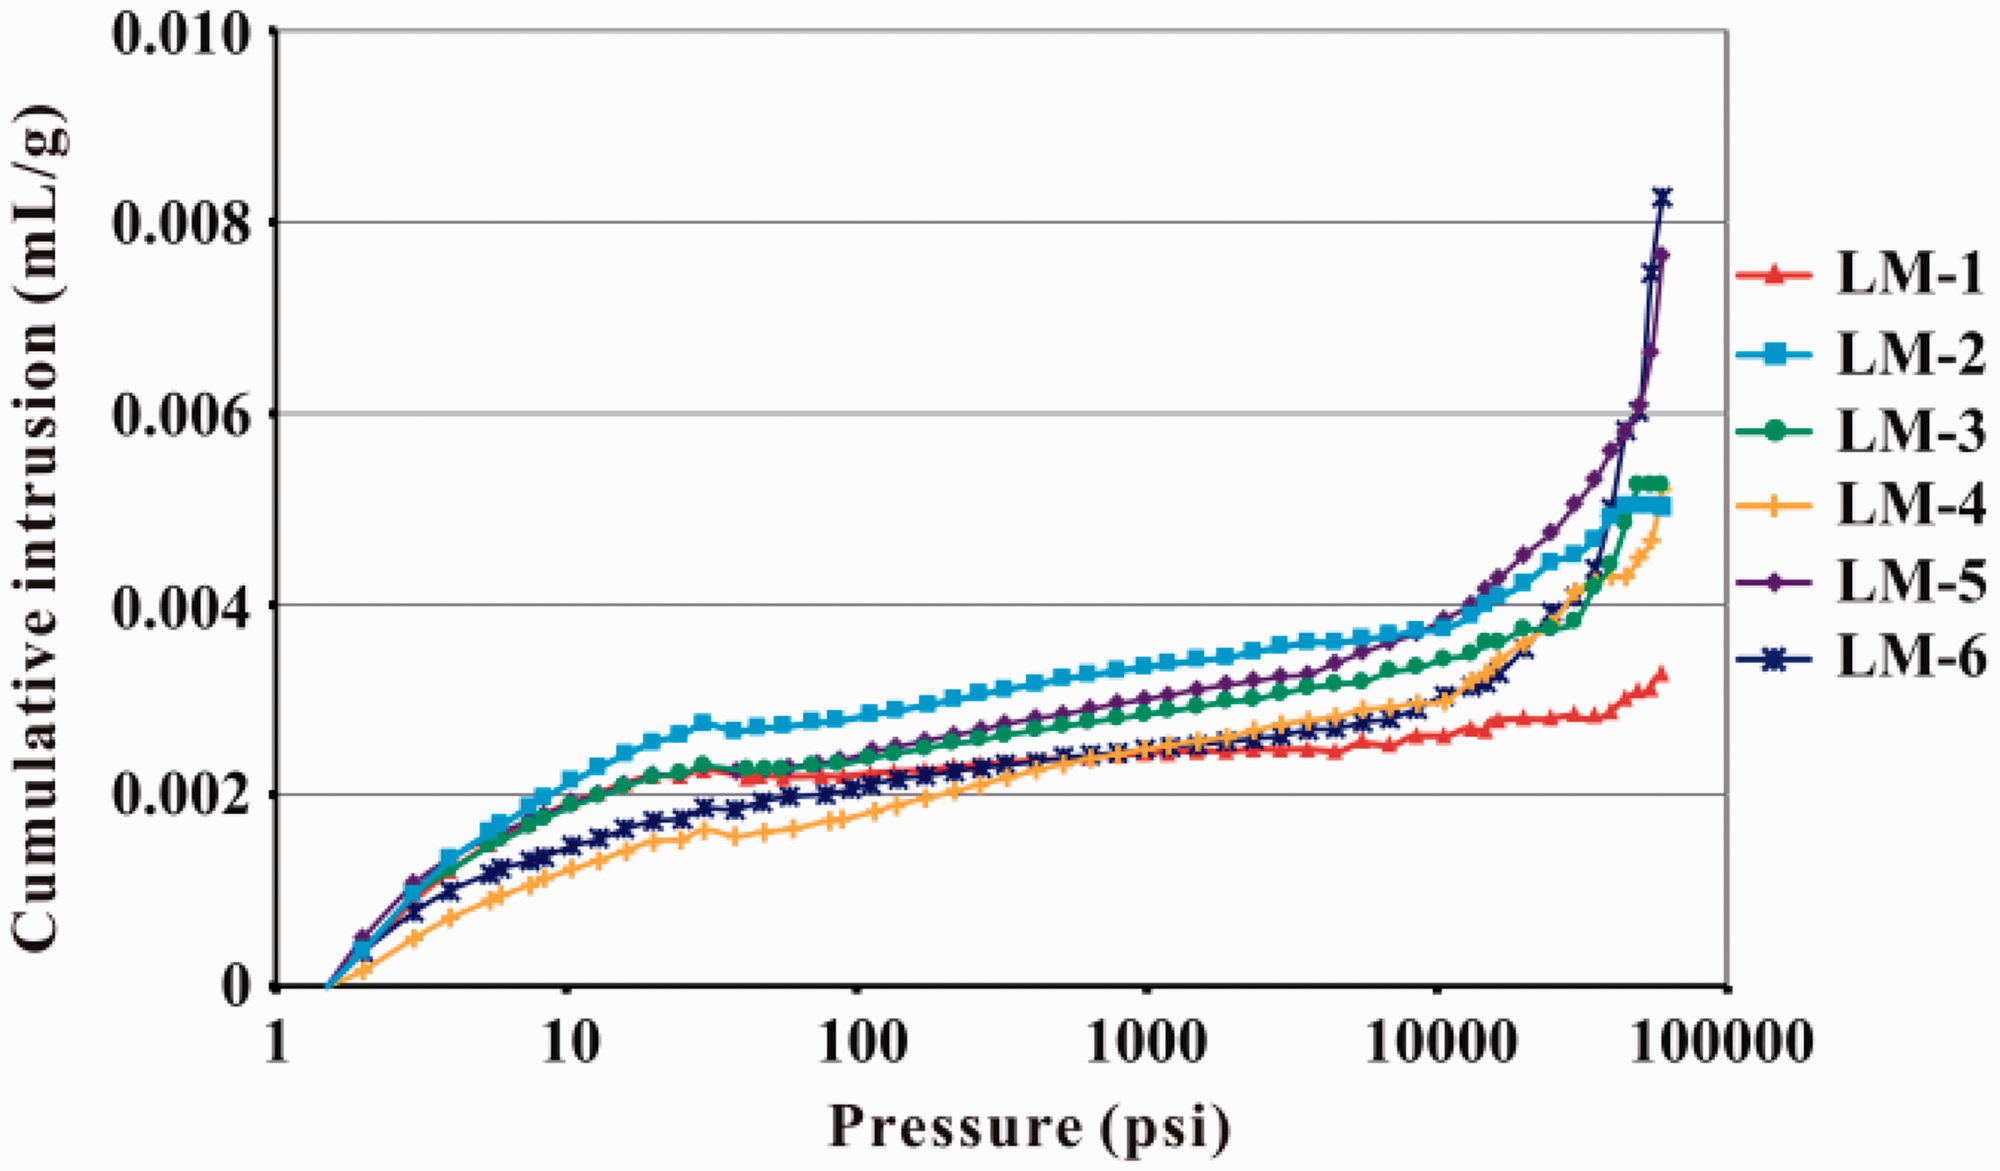
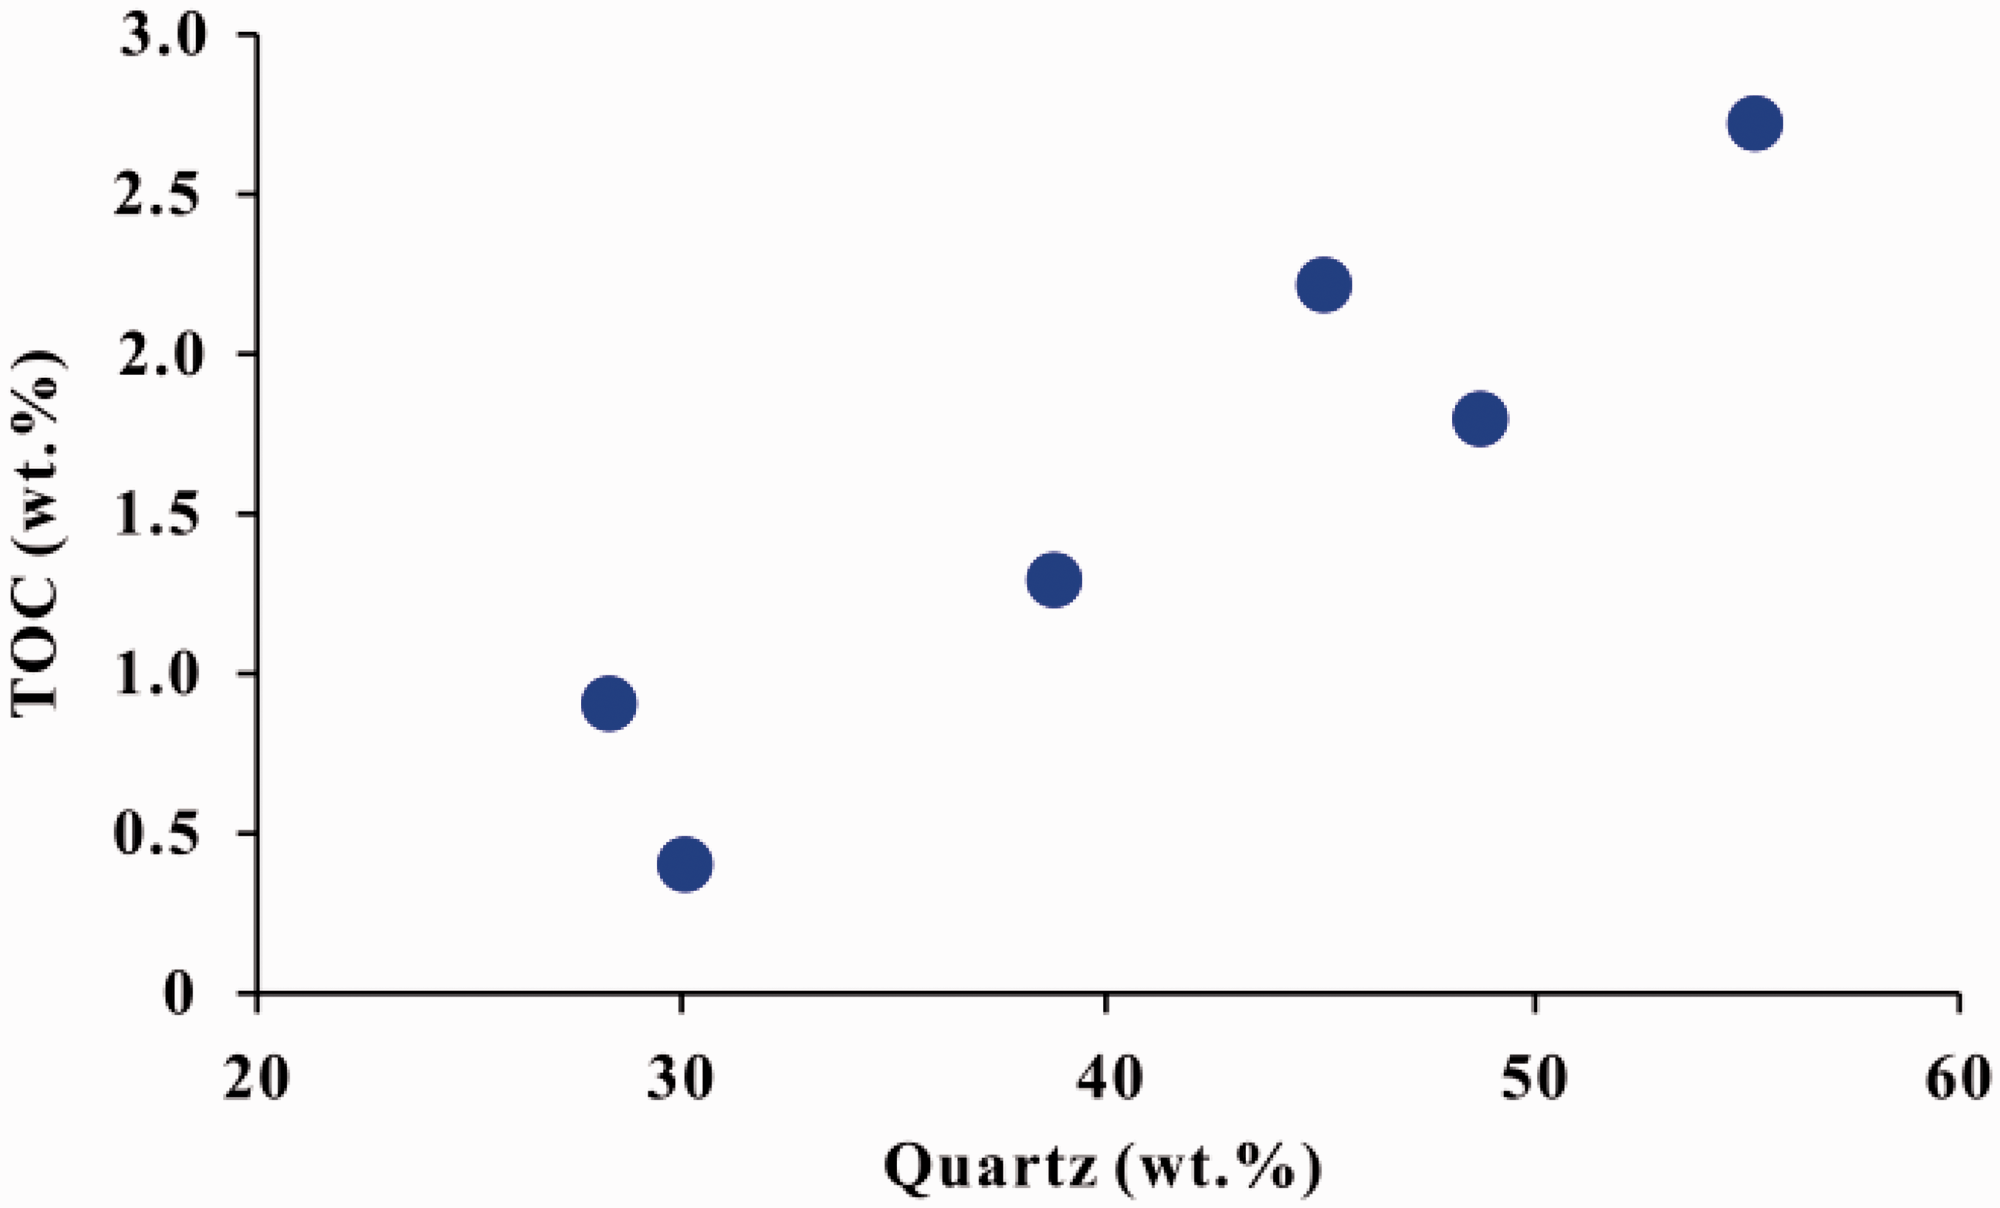
The distribution of pore volumes in high-mature marine shale displays a variety of patterns (Figure 8). The pore volume was concentrated in a range from approximately 3 to 100 nm diameters, which is two times higher than the pore volume with 3–100 nm diameters in the low-mature lacustrine shale (Figure 6). The pore volume contributed by pores with diameter of 3–1000 nm accounts for 56% of the total pore volume, while the pore volume contributed by 30–120 µm pores is lower than that contributed by the 3–100 nm pores, suggesting that submicron-scale pores are the main type of pores found in high-mature marine shale. As the TOC content increases from sample LM-1 to LM-6, the pore volume contributed by 3–100 nm pores and the total pore volume increased significantly, indicating that the pore volume of high-mature marine shale is mainly related to the organic matter. In addition, with the increase of quartz content, the pore volume contributed by 3–100 nm increased, which is primarily attributed to the coupling positive relationship between quartz and organic matter (Figure 9; Table 1; Rowe et al., 2008).
Pore size distribution of high-mature marine shale samples. Pore volume is mainly contributed by organic pores with diameters ranging from 3 to 100 nm. The pore volume increases gradually as the TOC content increases from sample LM-1 to sample LM-6. TOC: total organic carbon. Correlation between the TOC and quartz content of the high-mature marine shale samples, showing a good positive relationship of TOC and quartz. TOC: total organic carbon.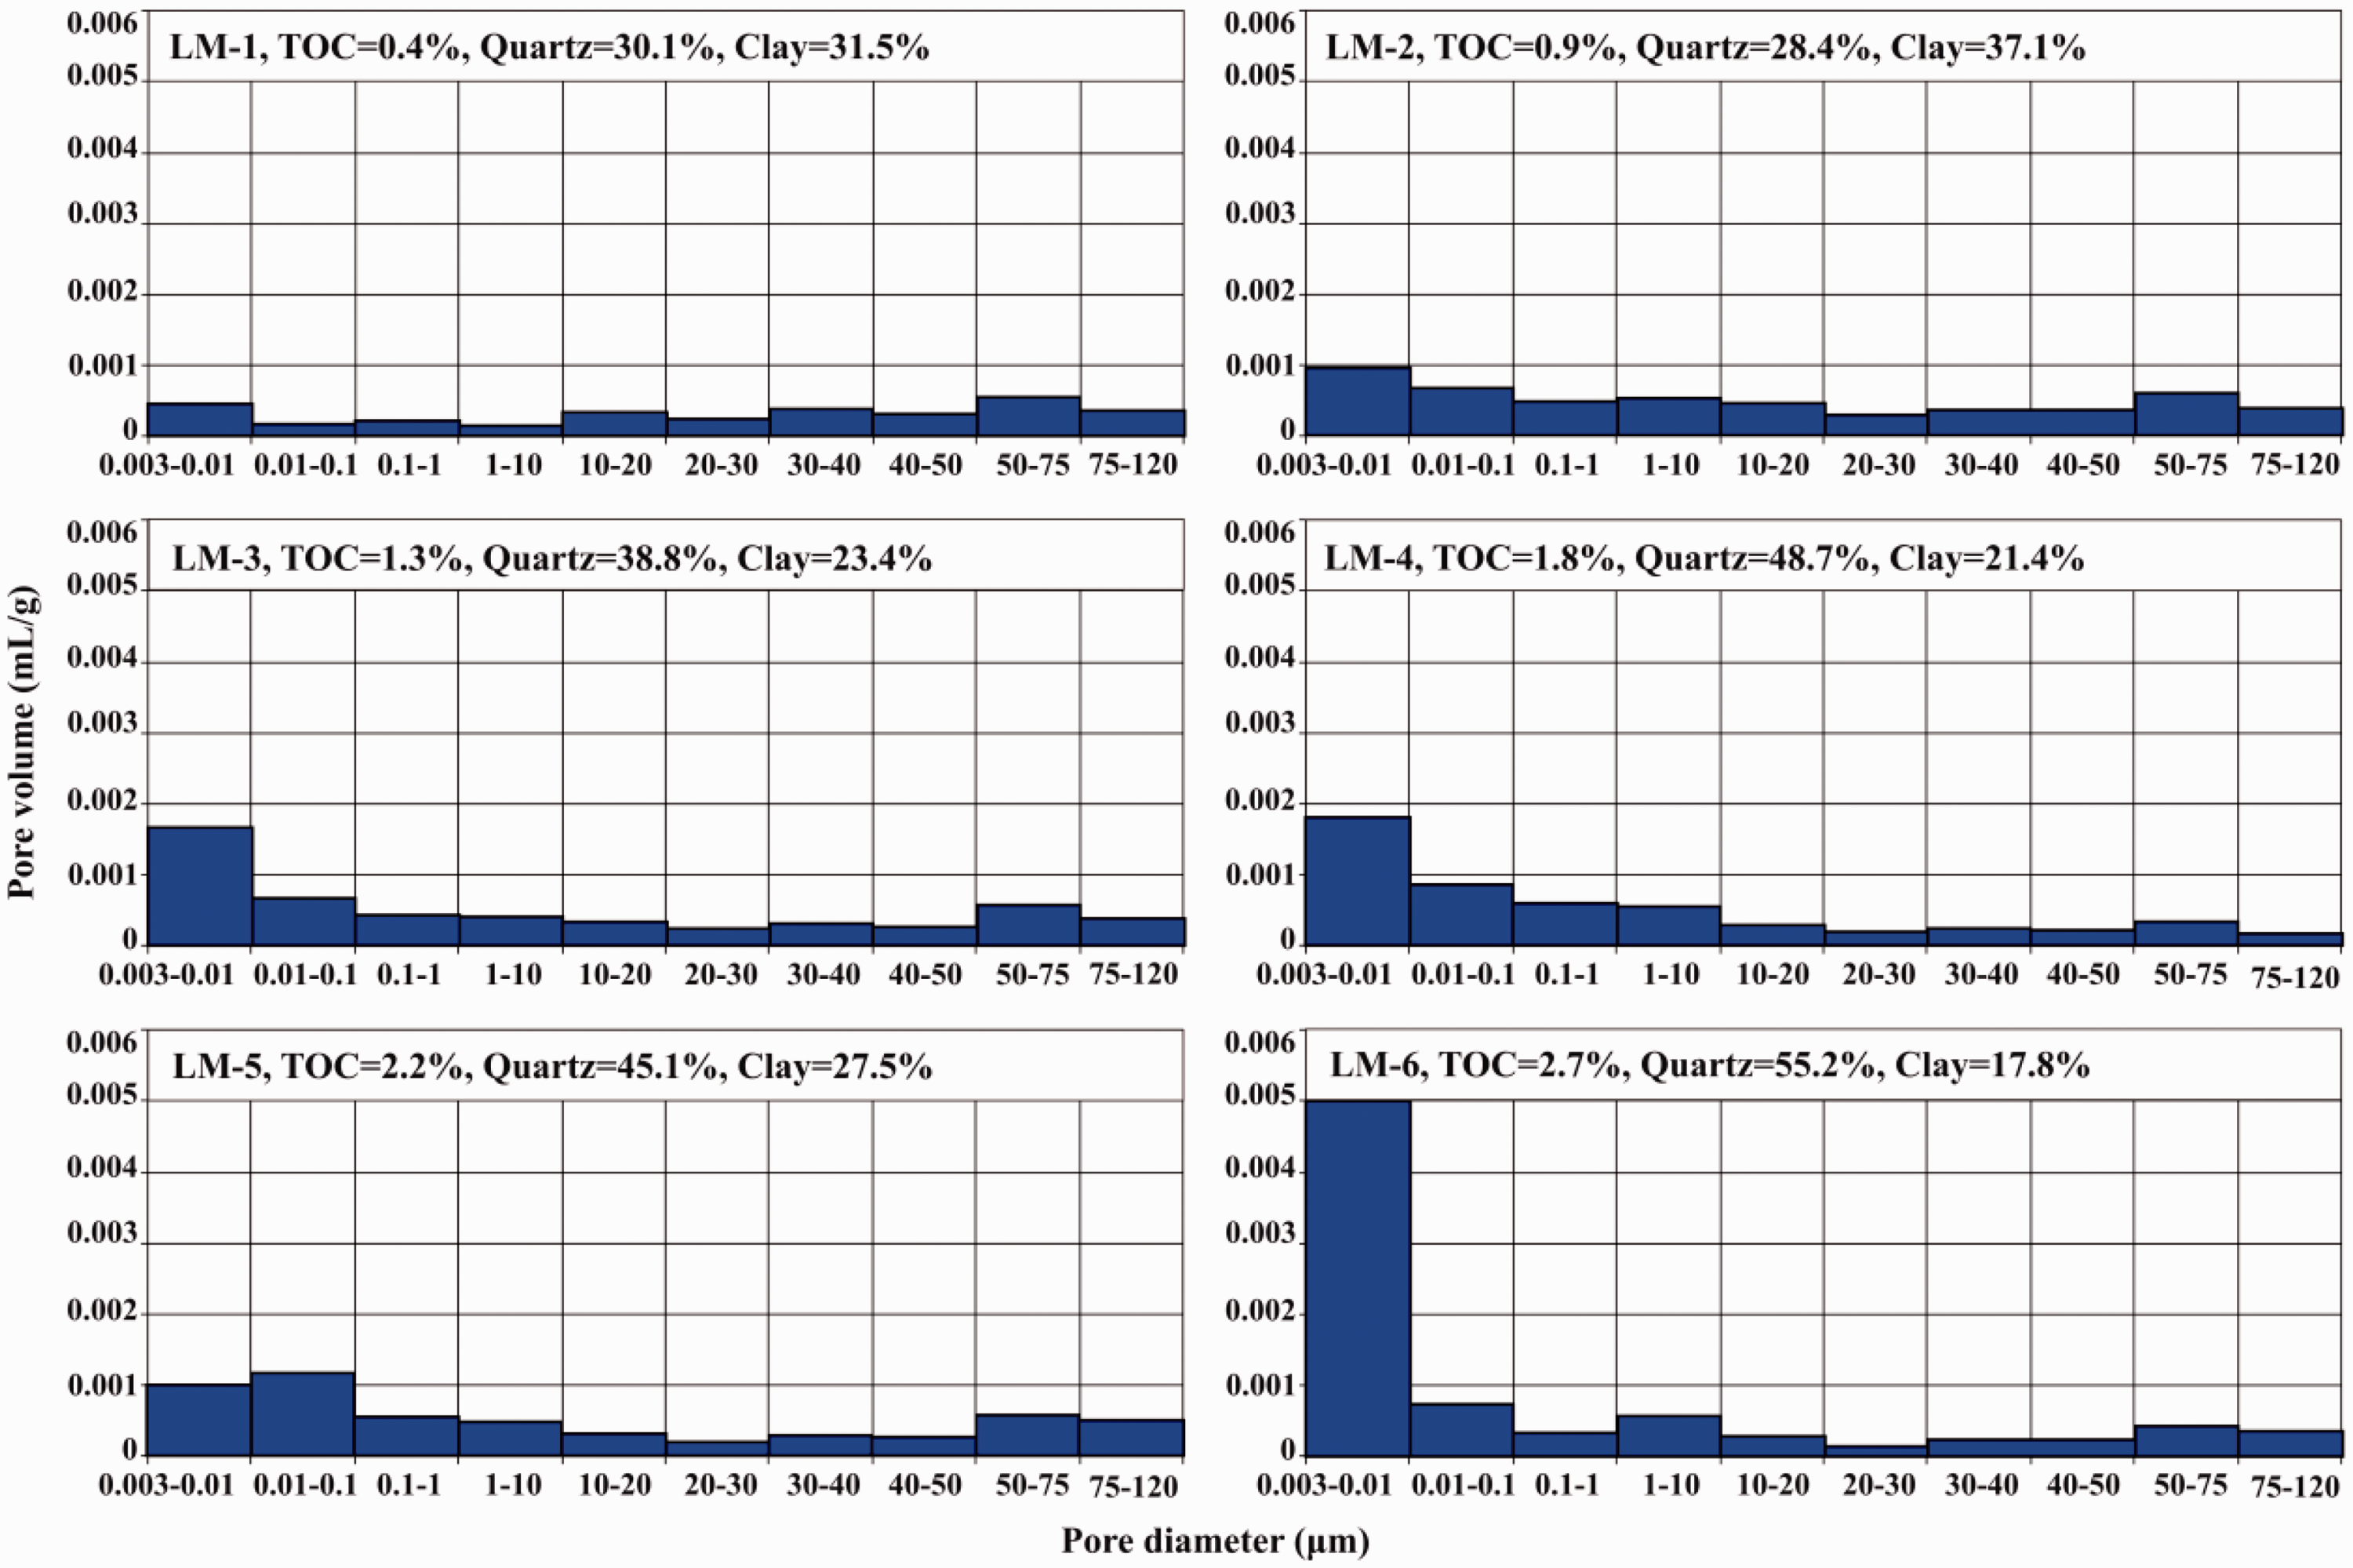
Porosity and controlling factors
From Figure 10 and Table 1, it can be seen that the porosities of lacustrine shale and marine shale are generally low. On average, the porosity of low-mature lacustrine shale is 2.4%, and the porosity of high-mature marine shale is 1.5%. Therefore, the porosity of low-mature lacustrine shale is higher than the porosity of high-mature marine shale. The porosity and the TOC content of low-mature lacustrine shale are not highly correlated, but a good positive correlation exists between the porosity and the TOC content for high-mature marine shale (Figure 10). The reason is maybe that the low-mature lacustrine shale has few organic pores, while the high-mature marine shale has abundant organic pores. Thus, as the TOC content increases, the organic pores increase, leading to the porosity increase. Furthermore, the TOC content of the Yanchang Formation Shale is relative low compared to other shales in the Ordos Basin (such as Shanxi Formation and Taiyuan Formation, Liu et al., 2015). The low TOC content and the low organic pores of the Yanchang Formation Shale both lead to the weak relationship between porosity and organic matter.
Correlations between porosities and TOC contents and mineral compositions for the lacustrine shale and marine shale samples analyzed. (a) showing the relationship between porosity and TOC content for low-mature lacustrine shale is not obvious. (b) showing good relationship between porosity and TOC content for high-mature marine shale. (c) showing good relationship between porosity and brittle mineral content for low-mature lacustrine shale. (d) showing the relationship between porosity and brittle mineral content for high-mature marine shale is not obvious. TOC: total organic carbon.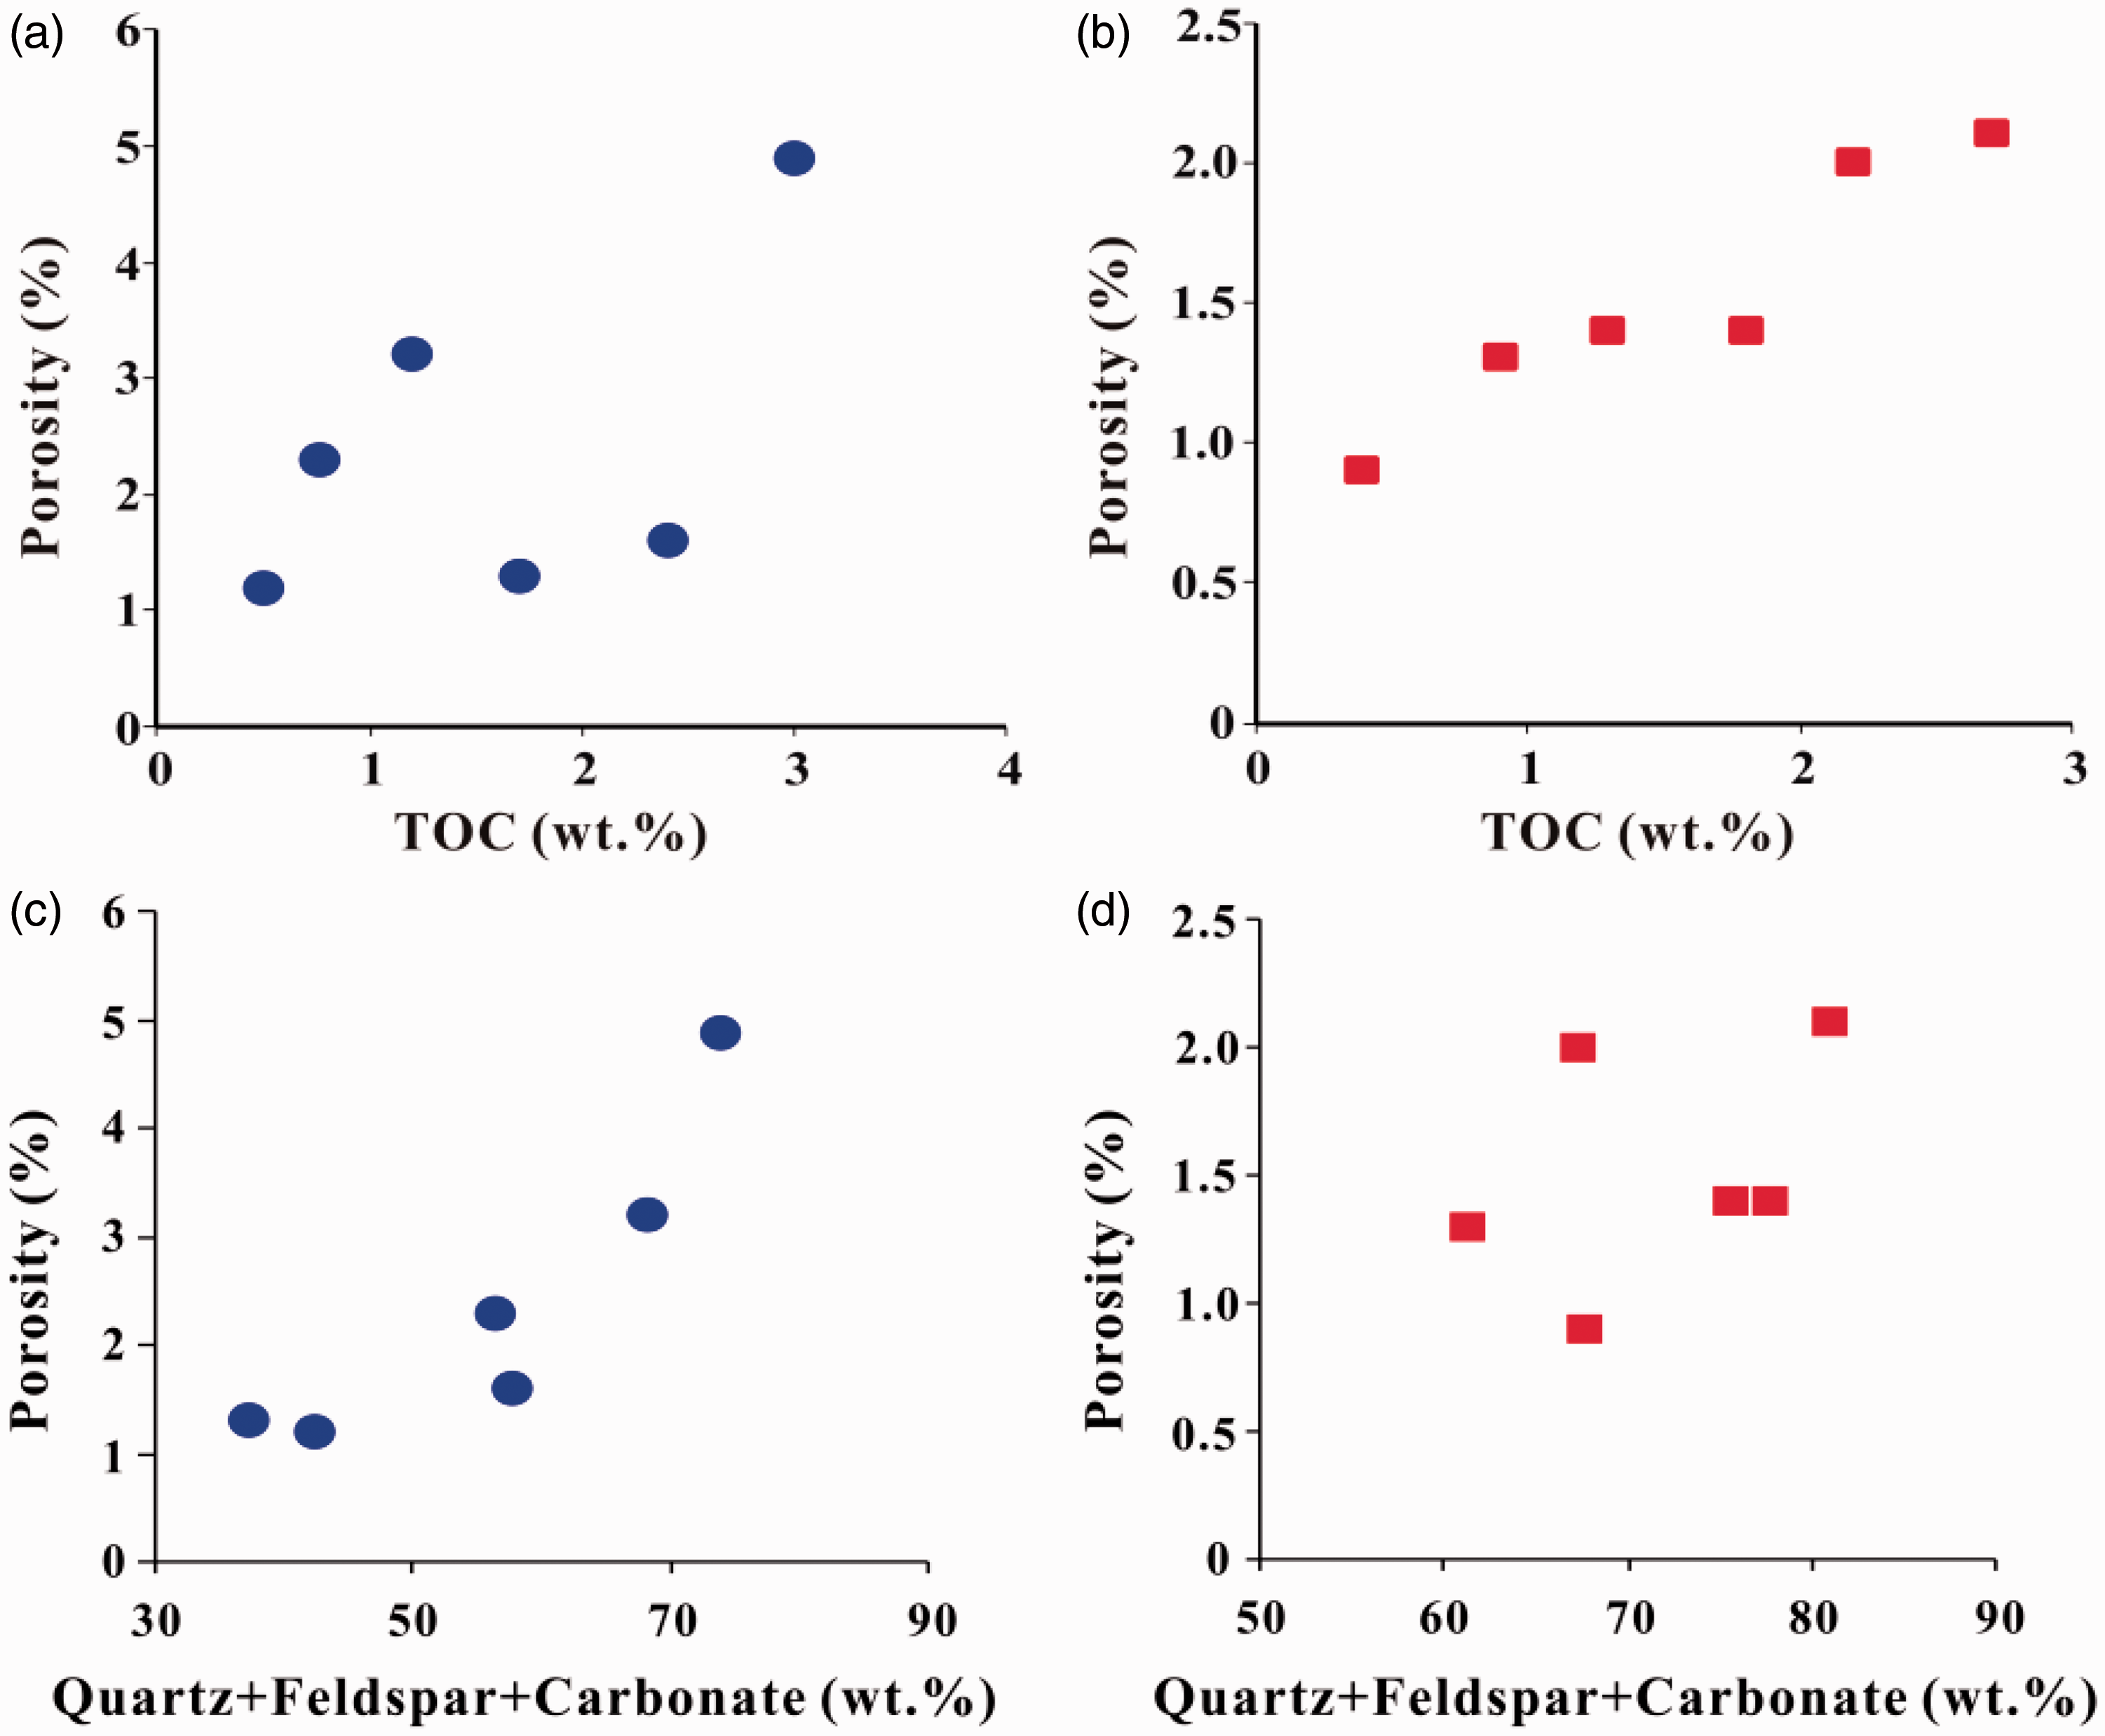
Good positive relationship exists between porosity and brittle mineral content for low-mature lacustrine shale (Figure 10), but the correlation between porosity and brittle mineral content is not good for high-mature marine shale. The reason is maybe that the pores in the low-mature lacustrine shale are mainly macropores, and the macropores are mainly provided by the quartz, feldspar, and carbonate minerals. While few macropores developed in the clay minerals (Ross and Bustin, 2009). Thus, as the brittle mineral increases, the macropores increase, leading to the porosity increase in the low-mature lacustrine shale. As the high-mature marine shales are mainly organic pores, the brittle mineral and clay mineral both have little effect on the porosity in the high-mature marine shale.
Therefore, considering the FIM-SEM and MICP results together, it can be concluded that the brittle mineral content is the main factor controlling the porosity of low-mature lacustrine shale, and the organic matter content is the main factor controlling the porosity of high-mature marine shale.
Conclusions
The effects of the organic matter contents and mineral compositions on pore structures in Chinese lacustrine and marine shales with different maturity levels were analyzed using FIB-SEM and MICP, and the following conclusions are reached:
The low-mature lacustrine shale of the Upper Triassic Yanchang Formation is mainly composed of intergranular inorganic pores, with fewer organic pores and intragranular inorganic pores. The pore volume is mainly contributed by pores with diameter of >30 µm, which account for approximately 73% of the total pore volume. Brittle minerals, such as quartz and feldspar, are the main factors controlling the development of pores in low-mature lacustrine shale.
The high-mature marine shale of the Silurian Longmaxi Formation is mainly composed of organic pores, with minor presence of intergranular and intragranular inorganic pores. The pore volume is primarily contributed by pores ranging from 3 to 100 nm in diameter, which is two times higher than the pore volume with 3–100 nm diameters in low-mature lacustrine shale. Organic matter is the main factor controlling pore development in high-mature marine shale.
Footnotes
Acknowledgments
The authors would like to acknowledge Shaanxi Yanchang Petroleum and the Chongqing Institute of Geology and Mineral Resources for providing the drill cores used in this study. Special thanks are given to the China Scholarship Council (CSC).
Declaration of conflicting interests
The author(s) declared no potential conflicts of interest with respect to the research, authorship, and/or publication of this article.
Funding
The author(s) disclosed receipt of the following financial support for the research, authorship, and/or publication of this article: This research was supported by the National Natural Science Foundation of China (No. 41472112 and 41502123), the National Science and Technology Major Project (2017ZX05035-002), the Science Foundation of China University of Petroleum, Beijing, and the Open Fund (No. G5800-I5-ZS-WX038) from Petroleum Exploration and Production Research Institute of SINOPEC.