
Abstract
The interaction between shale and CO2 is of great significance to CO2 storage and shale gas production; however, there are few reports on chemical changes after CO2 injection into shale reservoirs. We used Fourier transform infrared spectroscopy to study the chemical structure changes of shale samples before and after CO2 injection. In this paper, self-developed high-temperature and high-pressure vessels were used to examine CO2 treatment of shale to simulate the stratigraphic environment and infrared was used to study the influence of changes in pressure and temperature on the chemical interaction between shale and CO2. These results showed that: (1) after shale CO2 treatment, the number of functional groups remained unchanged, though the content and structure of the shale did change; (2) pressure increases reduced hydroxyl and aliphatic group levels in the shale; the branched-chain and aromaticity indexes of the shale were reduced by 81.5% and 53.8%, respectively, relative to untreated samples; (3) below 60°C, free water in the shale increased with temperature increases and dissolution of the shale increased; however, above 60°C, dissolution was inhibited which resulted in precipitation; (4) the dissolution degree of shale carbonate minerals positively correlated with CO2 pressure and temperature, while silicate minerals were unchanged CO2 pressure and temperature. Finally, the change of CO2 pressure had a more significant influence on the chemical structure of shale. These results provide a basis for the continuing study of the influence of chemical structure change of shale caused by CO2 on shale wettability and enhance the theoretical level of CO2 shale mining.
Introduction
China possesses the largest reserve of shale gas and comes with great development potential (Guo et al., 2015). Carbon dioxide-enhanced shale gas recovery (CO2-ESGR) has received increasing attention as one of the most potential anhydrous fracturing technology. CO2-ESGR is a new green mining technology, which not only improves extraction efficiency but also solves air pollution problems. However, the pressure/temperature phase transformation of CO2 complicates the flow of CO2 in formation cracks. Because of formation water, a complex series of physical and chemical reactions occur between CO2 and shale that affect further affect the mechanical properties and seepage characteristics of shale. Therefore, it is of great significance to study the interaction characteristics between CO2 and shale under reservoir conditions to analyze the effects of CO2 storage and fracturing.
Currently, many research groups have conducted myriad studies on the adsorption characteristics of CO2 and CH4 in shale as well as the pore structure characteristics of shale after treatment. Busch et al. (2008) reported the mechanisms of CO2 in shale are clay mineral adsorption, CO2 dissolution and geochemical reactions. Qin et al. (2017) measured the water-wetting angle on the surface which indicated that hydrophobicity of Lungmachi Shale increased after CO2 treatment. Zhou et al. (2018) showed that adsorption of CO2 in shale was five times higher than CH4, while the adsorption amount of CH4 and CO2 on shale decreased after CO2 treatment. Scholars have conducted many studies on the interaction process between CO2 and shale (Wang et al., 2015, 2017). However, there are few studies on the chemical structure characteristics of CO2 after interaction with shale.
Recently, scholars have studied the chemical reactions of CO2 carbon injected into shale reservoirs. Jiang et al. (2016) found that supercritical carbon dioxide (SC-CO2) extracted organic matter from shale and dissolved the original pores and cracks by examining the reaction between shale and CO2 at different times, temperatures, and pressures. Ao et al. (2017) and Zhou et al. (2020) speculated on a potential reaction between shale and CO2 using X-ray diffraction (XRD) analysis of mineral component changes before and after the reaction. Pan et al. (2018) and Yin et al. (2016) used FTIR to identify and discuss the characteristic peaks of the functional groups after shale reacted with CO2; they found that CO2 shale caused some functional group content changes, but did not reduce the functional group types. They also thought that some organic functional groups of CH4 and CO2 competitive adsorption played a vital role.
The study of surface functional group changes after SC-CO2 interaction not only plays an important role in the adsorption and analysis of gas but also has a great impact on the wettability change of shale after SC-CO2 interaction. Wettability is an important reservoir property that affects the distribution and migration of formation fluids in shale reservoirs and plays an important role in shale gas exploration and development (Liang et al., 2015, 2016; Lu et al., 2019). Therefore, this study is of great significance for SC-CO2-enhanced shale gas exploitation.
Experimental section
Samples
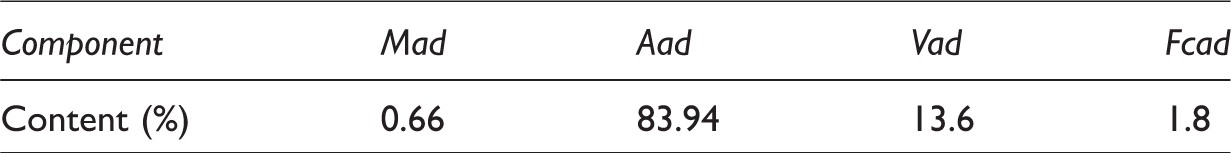
Shale samples were taken from the outcropping shale of the Longmachi formation in Fuling, Sichuan basin, with an average thickness between 100 and 500 m and general burial depth of 2–3 km. The lithology of the Longmachi formation shale is simple; it is primarily a shallow-deep water continental shelf facies deposition. It is composed of dark gray and black silty shale, rich in organic matter (carbonaceous) shale and silty shale with mud siltstone. Its total organic carbon (TOC) is 2.52% and Vitrinite Reflectance (R0) is 1.8–3.6%. Samples were ground to a size of 200 mesh for analysis; those results are shown in Tables 1 and 2. Industrial analysis showed an ash content of up to 84%, indicating the Lungmachi Shale composition is mainly inorganic minerals. XRD tests showed the brittle mineral content shale is rich and accounted for approximately 86.6% of the shale while the clay content clay was low (∼9.8%).
XRD analysis results.

Proximate analysis results.
CO2 soaking experiments
Experiments were carried out in a self-developed, high-temperature/high-pressure shale soaking device, which consisted of a pressure control system, a temperature control system, and a high-pressure vessel. Figure 1 shows the experimental device. The pressure system was equipped with an ISCO 260 D double plunger booster pump (Teledyne, USA), which provides constant pressure (0–7500 psi) and constant current (0–107 mL/min) pressurization modes. The temperature system was maintained with a constant temperature (0–100°C, accuracy of 0.1°C) water bath. The device met the experimental pressure and temperature requirements. Considering the pressure and temperature environment of the mining depth (2–3 km), experiments were conducted in two groups: the first group varied the pressure (4, 6, 8, 10, 12, 14, and 16 MPa) at a constant temperature of 40°C over four days; the second group varied the temperature (40, 50, 60, 70, and 80°C) at a pressure of 8 MPa over four days. The high-pressure vessel was evacuated prior to injection.
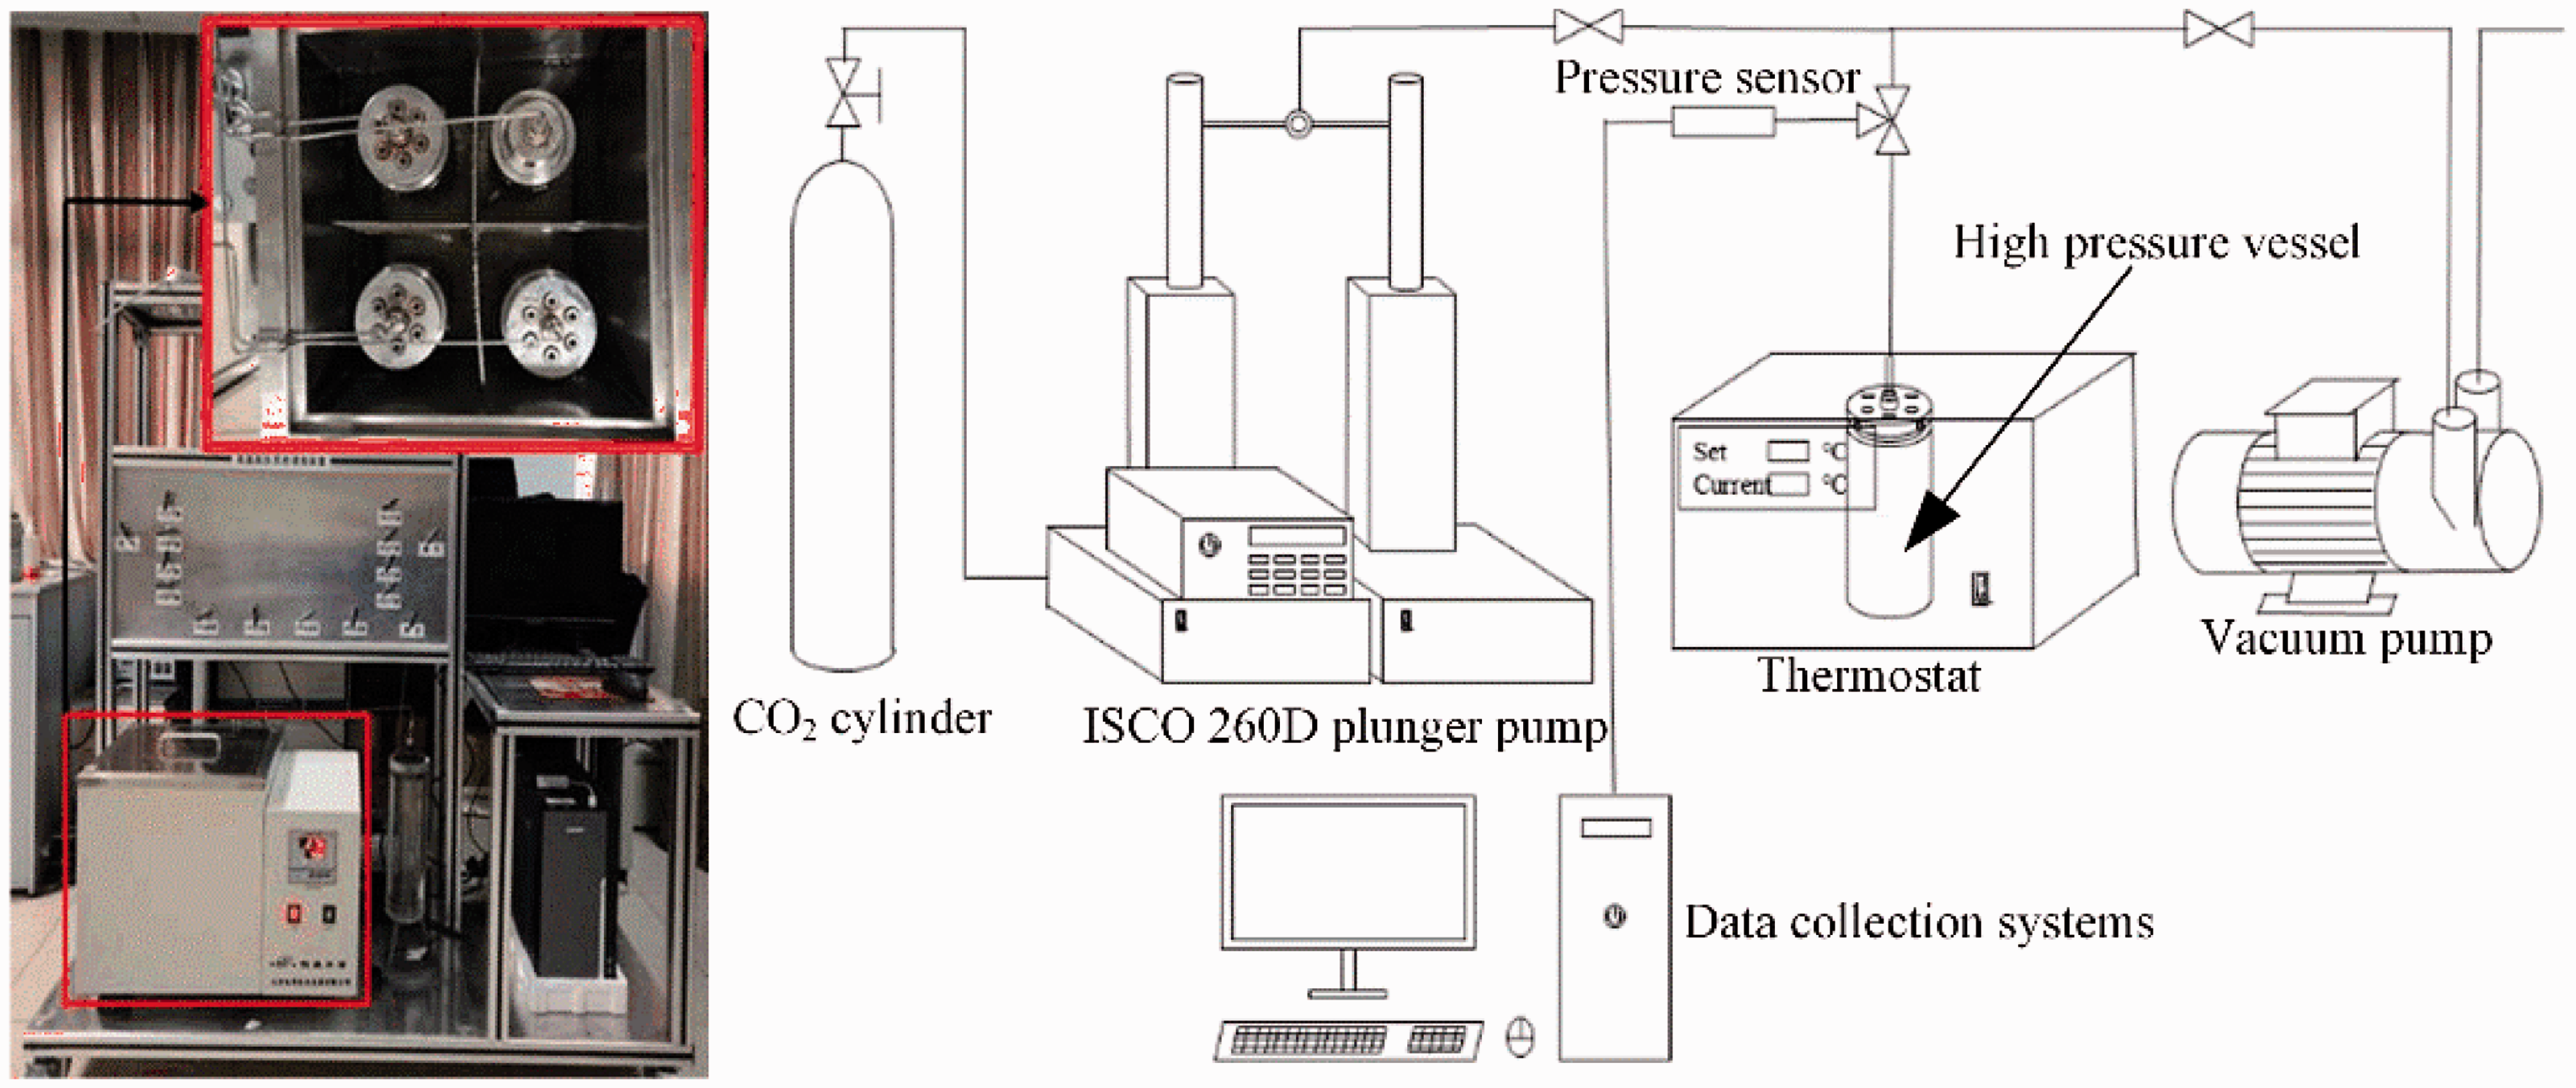
System diagram of high-pressure/high-temperature shale soaking device.
Nicolet iS50 Fourier infrared spectroscopy
A Nicolet iS50 was used for FTIR analysis; samples were dried in a vacuum oven for 10 h before testing and ∼2 mg samples were weighed using an analytical balance. The KBr and shale samples were mixed into a mortar (ratio 150:1) and ground. Finally, the powder was pressed (10 MPa) for 2 min and dried under a red heat lamp. To reduce measurement error and improve the signal/noise ratio, each sample was scanned 32 times, 1 min per scan. Pure KBr peaks IR images were subtracted from test sample spectra with and baseline correction. Each sample was scanned three times and averaged.
Peak-differentiation imitating
Peak fitting of infrared spectra was performed on Peakfit V4.12 to identify overlapping peak regions and quantitatively analyze the content changes of each chemical group. Specific steps of peak segmentation fitting: (1) obtain the spectra after baseline correction; (2) determine the specific number and position of each absorption peak through the second-order derivative function; (3) Gaussian and Lorentz functions are commonly used peak shape functions. The Gaussian function was used for this work to express peak shape (Wang et al., 2015, 2017; Yin et al., 2016).
Result and analysis
Qualitative analysis of shale spectra
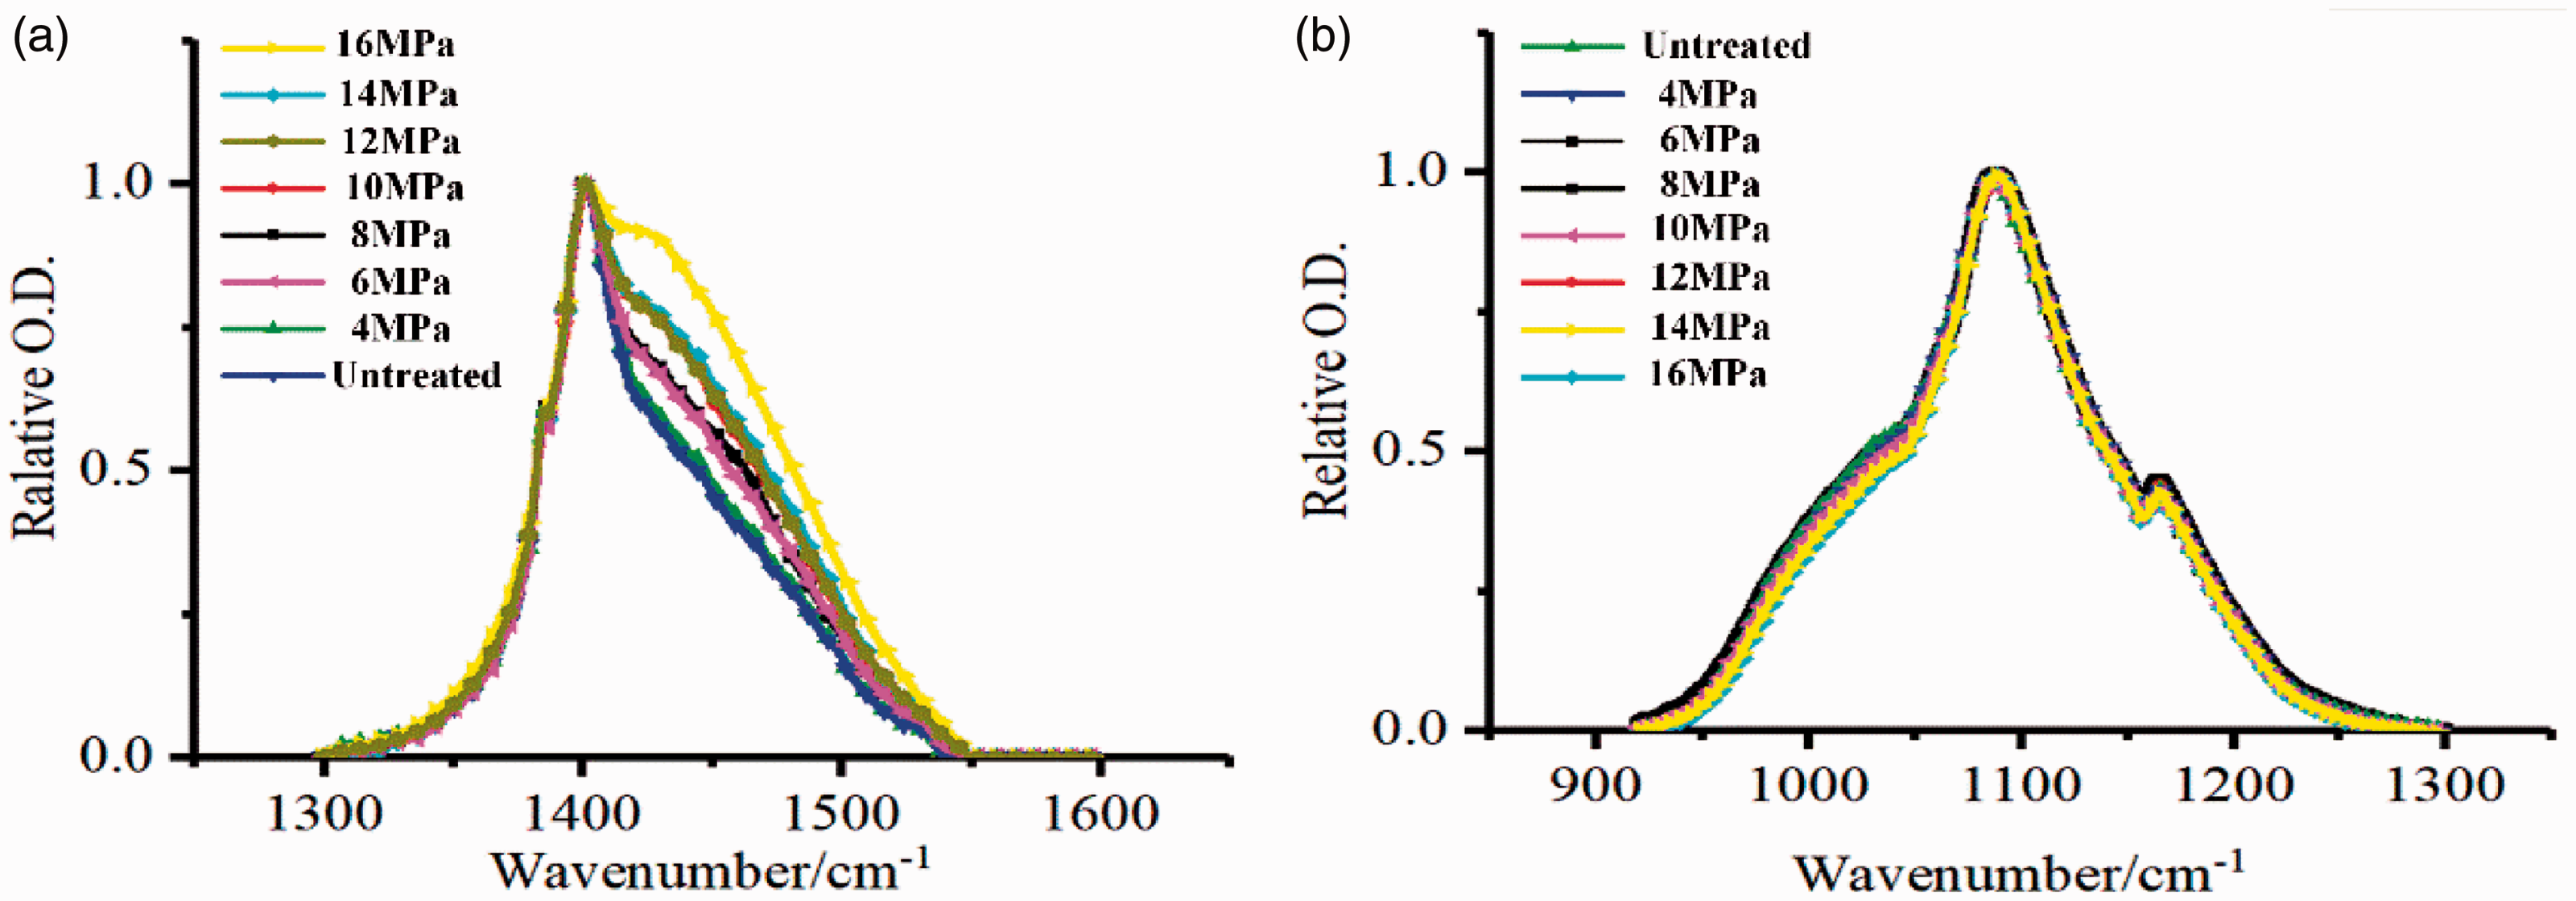
The shale infrared spectra are shown in Figure 2 and show no significant difference in functional group distribution before and after treatment, indicating that no new functional groups appeared after CO2 treatment and no original functional groups were removed. However, the position and strength of each characteristic peak changed, indicating changes in the contents of each group as well as the composition and structure of each shale mineral.
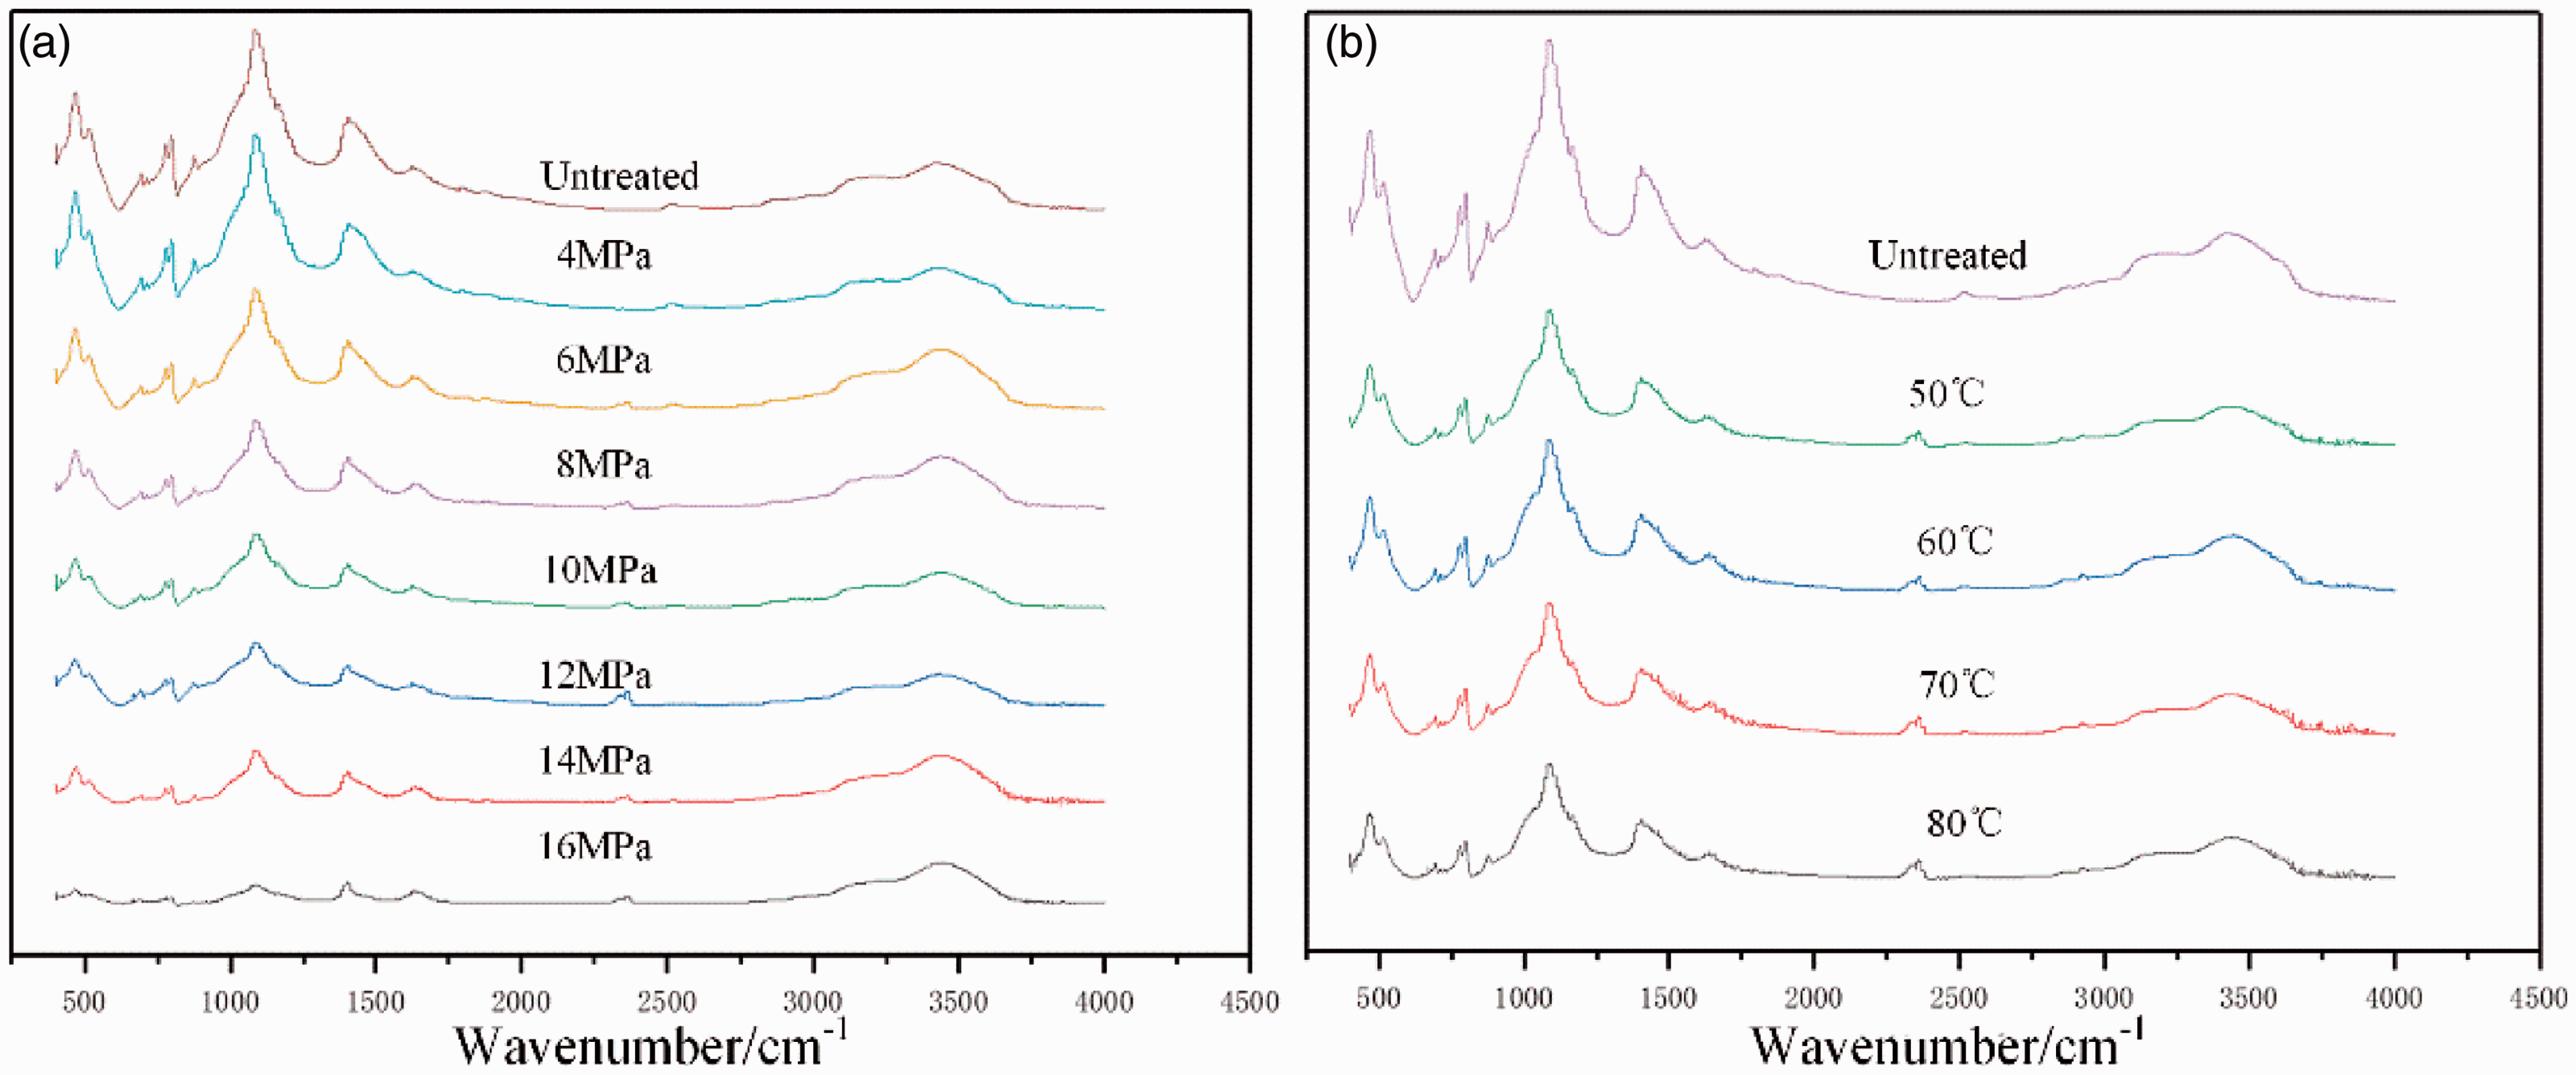
Infrared spectra of shale after treatment at: (a) different pressures and (b) different temperatures.
Shale contains organic matter and inorganic minerals. Absorptions from 400 to 1500 cm−1 were attributed primarily to inorganic materials, specifically Si–O rotational vibrations (400–600 cm−1 and 800–1200 cm−1) due to the abundant silicate minerals in shale, such as quartz and illite (Chen et al., 2016). As well as bands from 780 to 800 cm−1 due to the tetrahedral stretching vibration of Si–O in silicate minerals (Wang et al., 2016). Also, the band from 1400 to 1500 cm−1 was assigned to the asymmetric stretching vibration of CO32− associated with carbonate minerals, such as calcite, quartz, etc. (Wang et al., 2016). Sample spectra indicated the stretching vibration absorption peak of Si–O and the asymmetric CO32− stretching vibration was highest in the fingerprint region and agreed with high quartz and carbonate levels obtained from XRD testing. Bands from 1700–1900 cm−1 to 2800–3000 cm−1 correspond to characteristic organic functional groups in shale (Ashish and Anup, 2020; Jiang et al., 2019); those bands are primarily due to C=O and C=C vibrations as well as aliphatic C–H stretching vibrations. The organic absorption peaks were weak and consistent with low TOC results.
Infrared analysis of shale under different CO2 pressures
For a better understanding of the pressure effect on shale, IR spectra in the hydroxy (3000–3600 cm−1) and the aliphatic C−H (2800–3000 cm−1) regions were curve-fitted. The branched-chain index (CH3/CH2) (Jiang et al., 2019; Meng et al., 2014) and aromaticity index (Iar) (Craddock et al., 2018; Zhu et al., 2019) were introduced to characterize the organic structure change.


where
(1) Effect of pressure on shale hydroxyl groups
From previous literature reports (Li et al., 2014; Meng et al., 2014; Tahmasebi et al., 2012; Zhu et al., 2019), major hydroxyl group peaks (3000–3600 cm−1) of shale are shown in Table 3. Hydroxyl groups are hydrophilic and their distribution on shale surfaces determines surface chemical properties. Peaks at 1630 cm−1 peak and 3450 cm−1 are due to H–O–H bending and asymmetric stretching vibrations from unstructured water. Compared to untreated samples, after 8 MPa CO2 treatment, both peaks shifted to lower wavenumbers (the 3450 cm−1 peak shifts 25 cm−1 and the 1630 cm−1 peak shifts 12 cm−1) and indicated that CO2 injection broke some aspect of hydrogen bonding within the in shale.
Hydroxyl group types and shale peak positions.
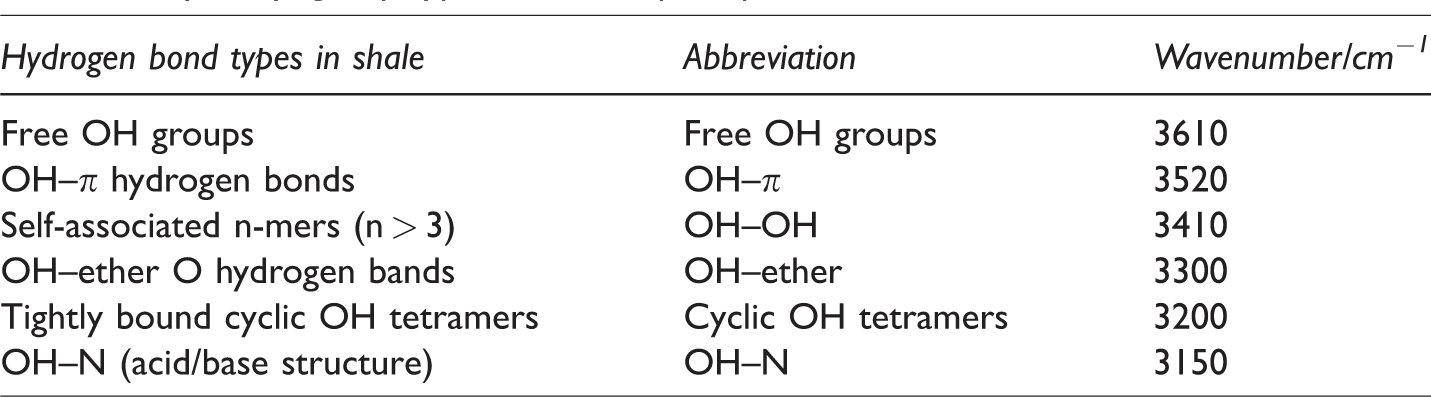
Figure 3(a) shows the curve-fitted IR hydroxyl group spectra. The wide peak of 3000–3600 cm−1 is mainly involved in shale hydrogen bonding and is conducive to the stability of the shale organic macromolecule network. The curve-fitted IR spectra showed seven sub-peaks: peaks at 3111 and 3132 cm−1 belonged to OH–N (acid/base structure), the 3229 cm−1 band belonged to tightly bound cyclic OH tetramers, the 3426 cm−1 band belonged to self-associated n-mers, bands at 3516 and 3567 cm−1 belonged to OH–π hydrogen bonds and the 3620 cm−1 band belonged to free OH groups. OH–OH had the highest content (50.41%), followed by cyclic OH tetramers (24.73%) and free OH groups (1.25%), indicating that organic components in the shale were primarily polymerized.
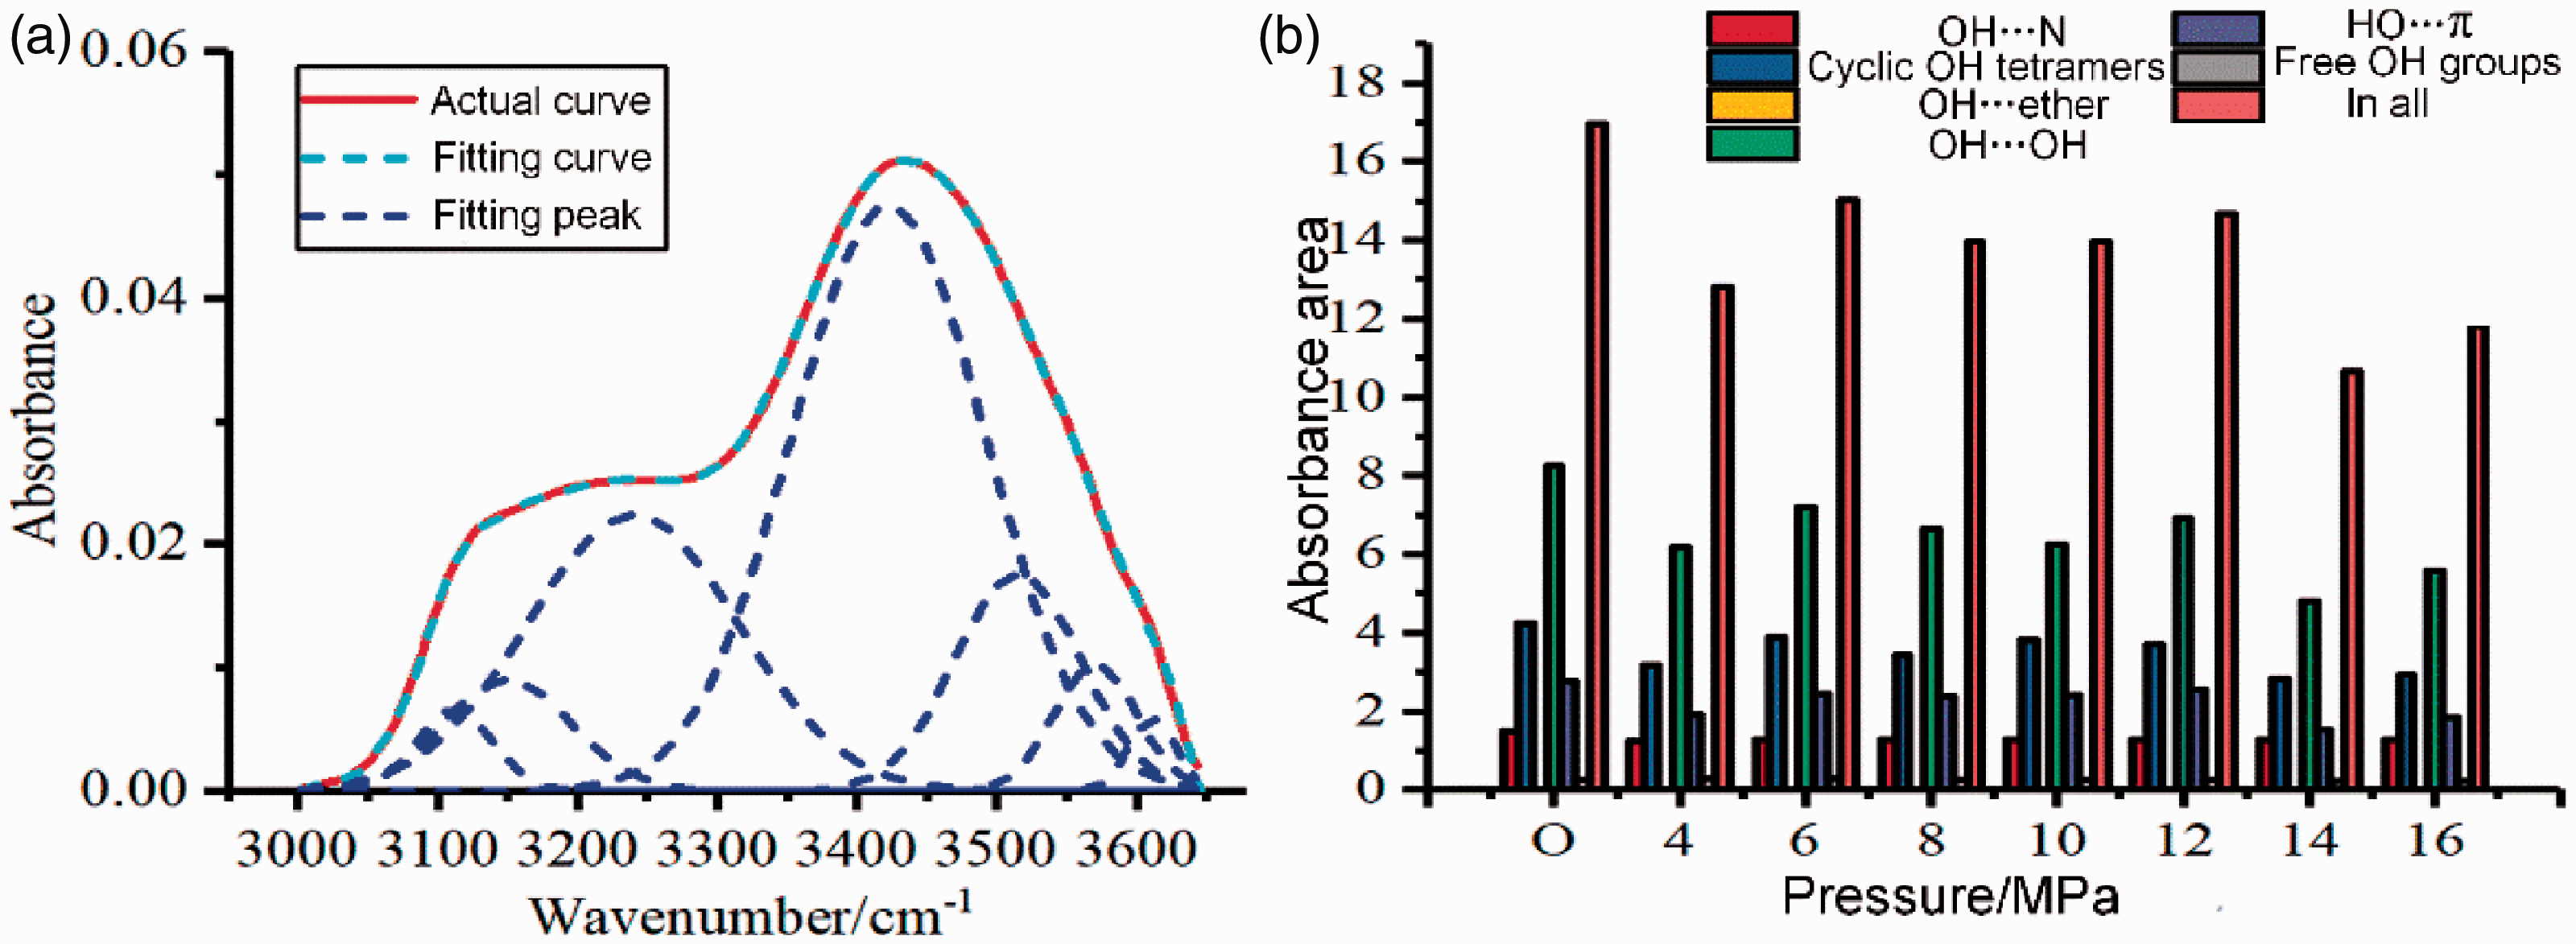
(a) Fitting spectra of shale from 3000–3600 cm−1 and (b) histogram of hydroxyl distribution characteristics of shale samples treated with CO2 under different pressures.
Figure 3(b) shows the histogram of hydroxyl distribution in shale treated with CO2 under different pressures. The total hydroxyl content decreased with increasing CO2 pressure, ranging from 11% to 37% and indicated the hydrogen bond structure was destroyed by CO2 injection. The three types of hydroxyl (OH–OH, cyclic OH tetramers, and OH–π) show decreased with increased CO2 pressure. These observations have two explanations; first, the C atoms of CO2 combined with N, O atoms in water, alcohols, ketones, and amines and formed an electron donor-acceptor, competed with polar molecules for binding sites, destroyed the original shale hydrogen bond system structure. As the CO2 pressure increased, additional CO2 molecules increased the possibility of contact with the receptor which further lowered the hydrogen bond structural network in shale. Second, CO2 and hydroxyl groups acted directly with metal ions to form carbonate complexes on the shale surface. Increased CO2 pressure promoted dissolution of CO2 in water which increased both hydroxyl consumption and surface carbonate complex content.
(2) The effect of stress on fat areas
To understand the influence of CO2 on the organic structure of shale more thoroughly, Figure 4 shows the curve-fitted IR spectra in the 3000–2700 cm−1 region which featured six characteristic aliphatic peaks (2958, 2924, and 2854 cm−1, with shoulder peaks at 2872, 2895, and a weak peak at 2980 cm−1). The CH3/CH2 and Iar values were calculated using peak integration data. Compared with untreated shale, the weak peak at 2980 cm−1 weakened to varying degrees after different pressure treatments; this indicated that CO2 treatment can reduce the hydrocarbon content in shale kerogen and CO2 could extract organic components from shale.
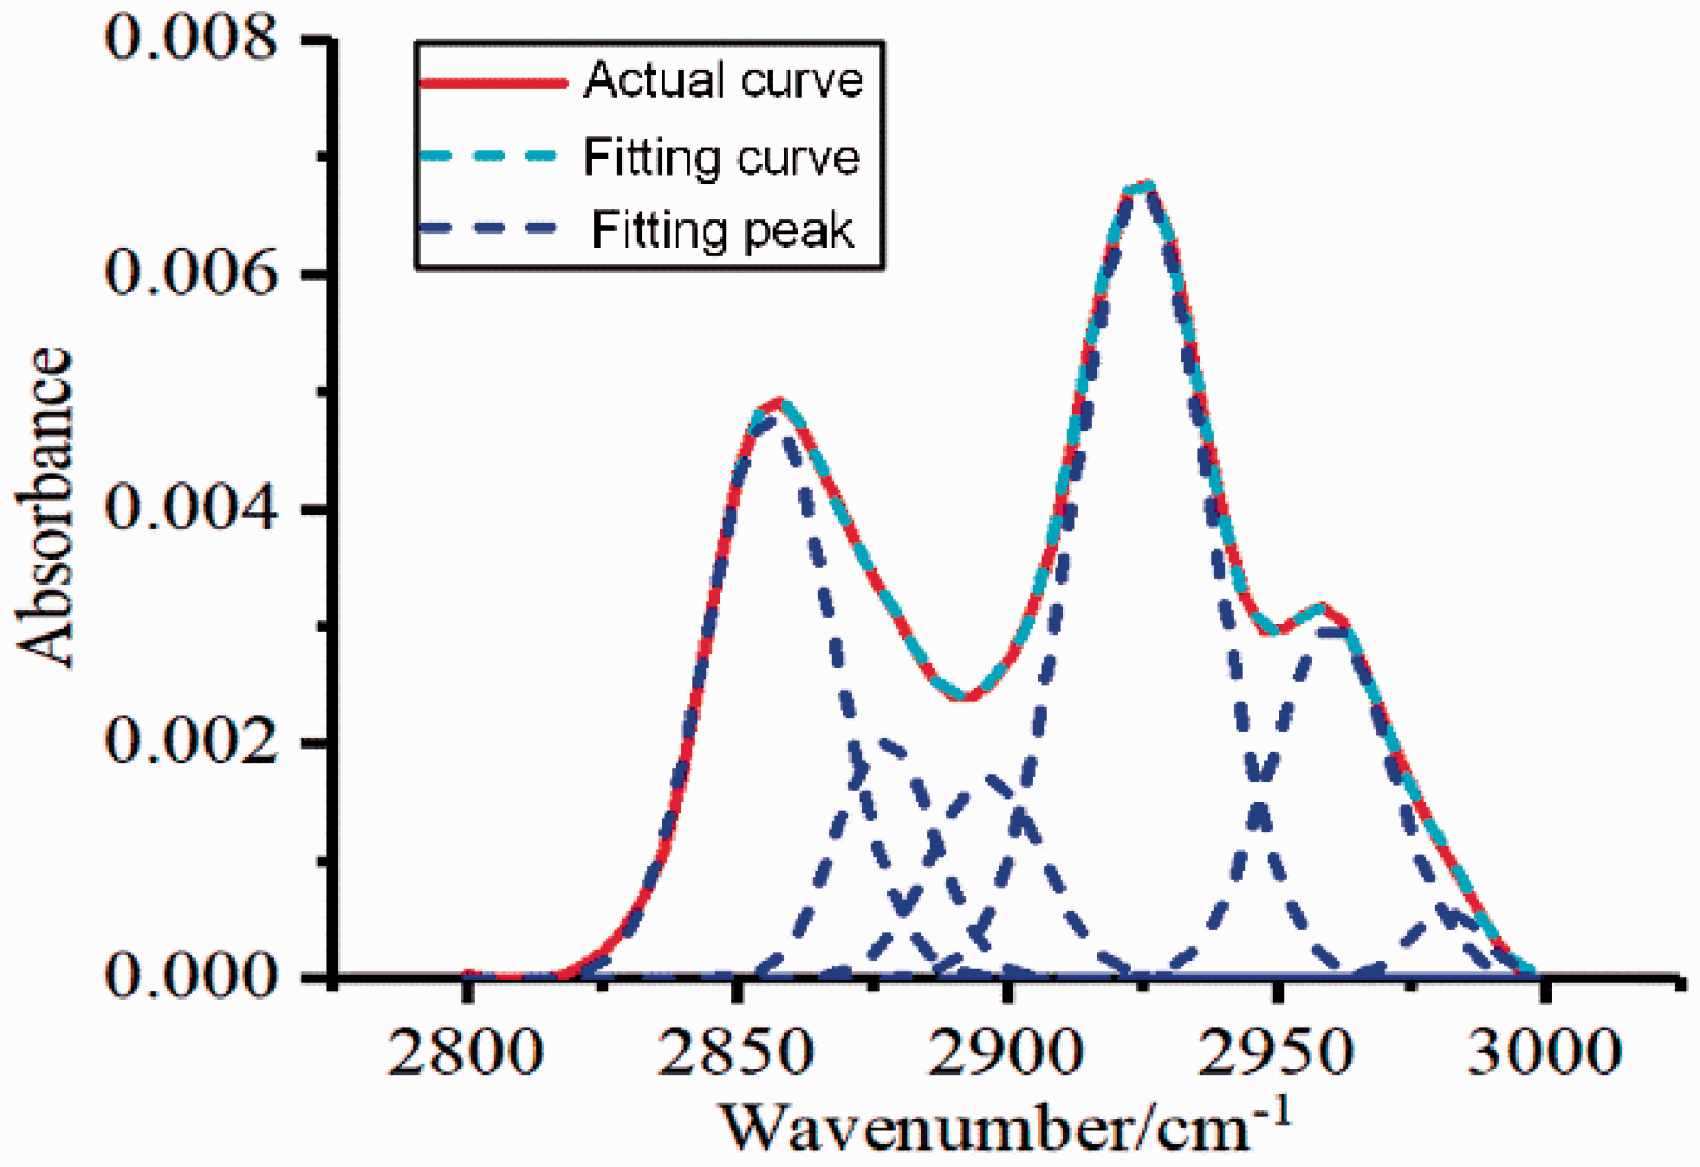
Fitting spectra of shale from 2800 to 3000 cm−1.
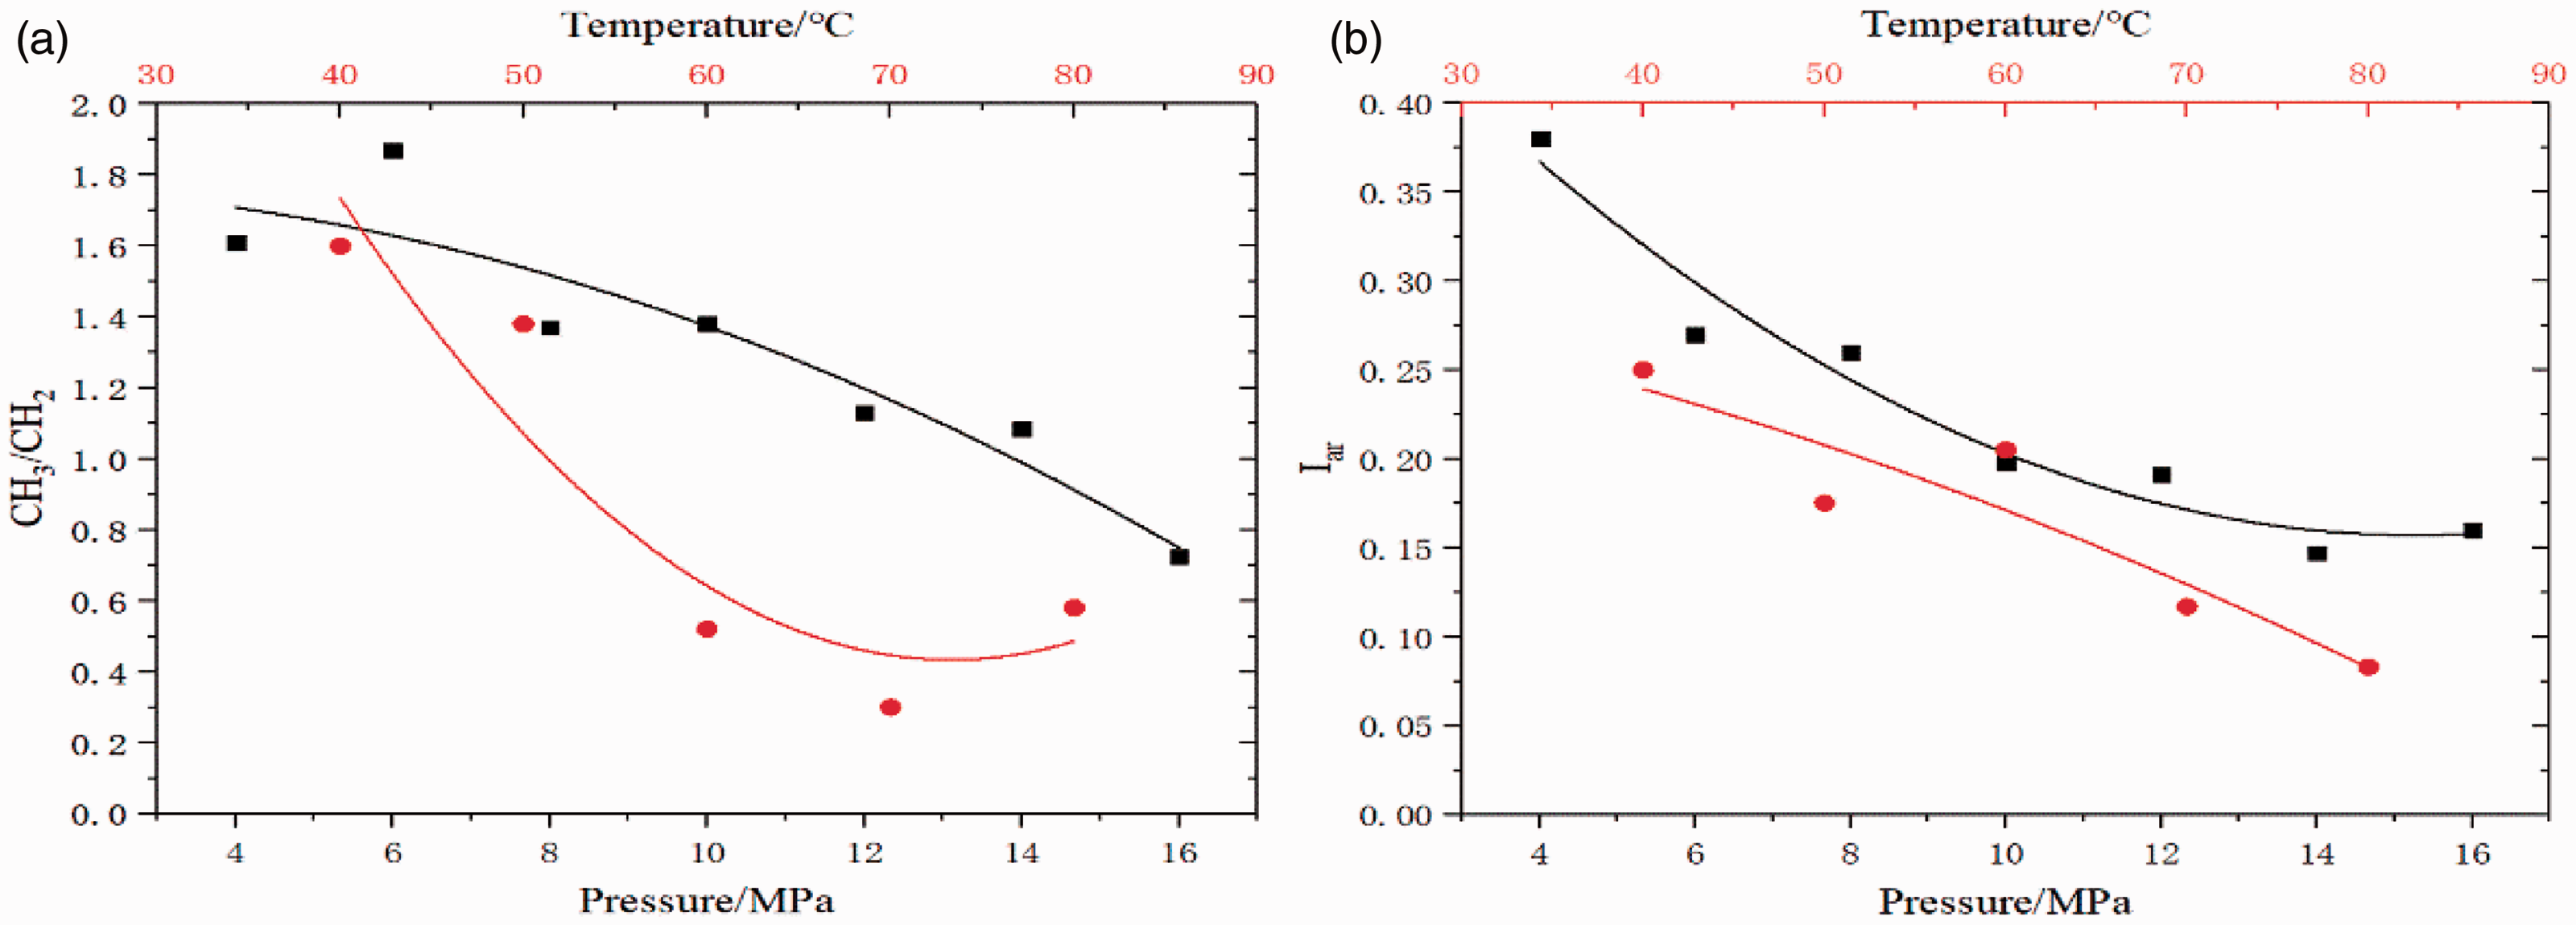
Figure 5 shows the CH3/CH2, Iar distribution of shale samples treated with CO2 at different pressures. CH3/CH2 and Iar decreased with the increase of pressure; when compared to the untreated sample, these values decreased by 81.51% and 53.82%, respectively, at a CO2 pressure of 16 MPa. The primary rationale for the branching index decrease was that increased CO2 pressure caused methyl group C–H fractures on short-chain polymers, active sites were reduced and aliphatic chain cyclizations intensified. Also, hydrogen-containing free radicals were generated during C–H fracture and as the pressure increased, the CO2 diffusion coefficient also increased and reduced the possibility of contact between hydrogen-containing free radicals and free hydrogen groups in aromatic rings as well as the inhibition of cross-linking aromatic rings that eventually led to a decrease in the aromaticity index.
The
Infrared spectrum analysis of CO2 and shale at different temperatures
(1) Effect of temperature on shale hydroxyl groups
Figure 6 shows the histogram of hydroxyl group changes with temperature. The OH–OH bond is the most common in shale; the relative area of OH–OH initially decreased but increased with increasing temperature with a minimum at 60°C. Changes in hydroxyl groups were in contrast to OH–OH (which comes primarily from water); this indicated water in shale initially decreased but increased with both temperature and CO2 increases. Below 60°C, CO2 combines with free water in shale which led to dissolution and adsorption. On one hand, increasing temperatures accelerated CO2 molecule movement and increased the contact probability of CO2 with shale and enhanced chemical reactivity of CO2. On the other hand, when the temperature exceeded 60°C, acid dissolution is exothermic and further increases in temperature inhibited the reaction, which ultimately led to an increase in free water. Jiang et al. (2016) showed at lower temperatures, calcite dissolved; however, at higher temperatures, it precipitated.
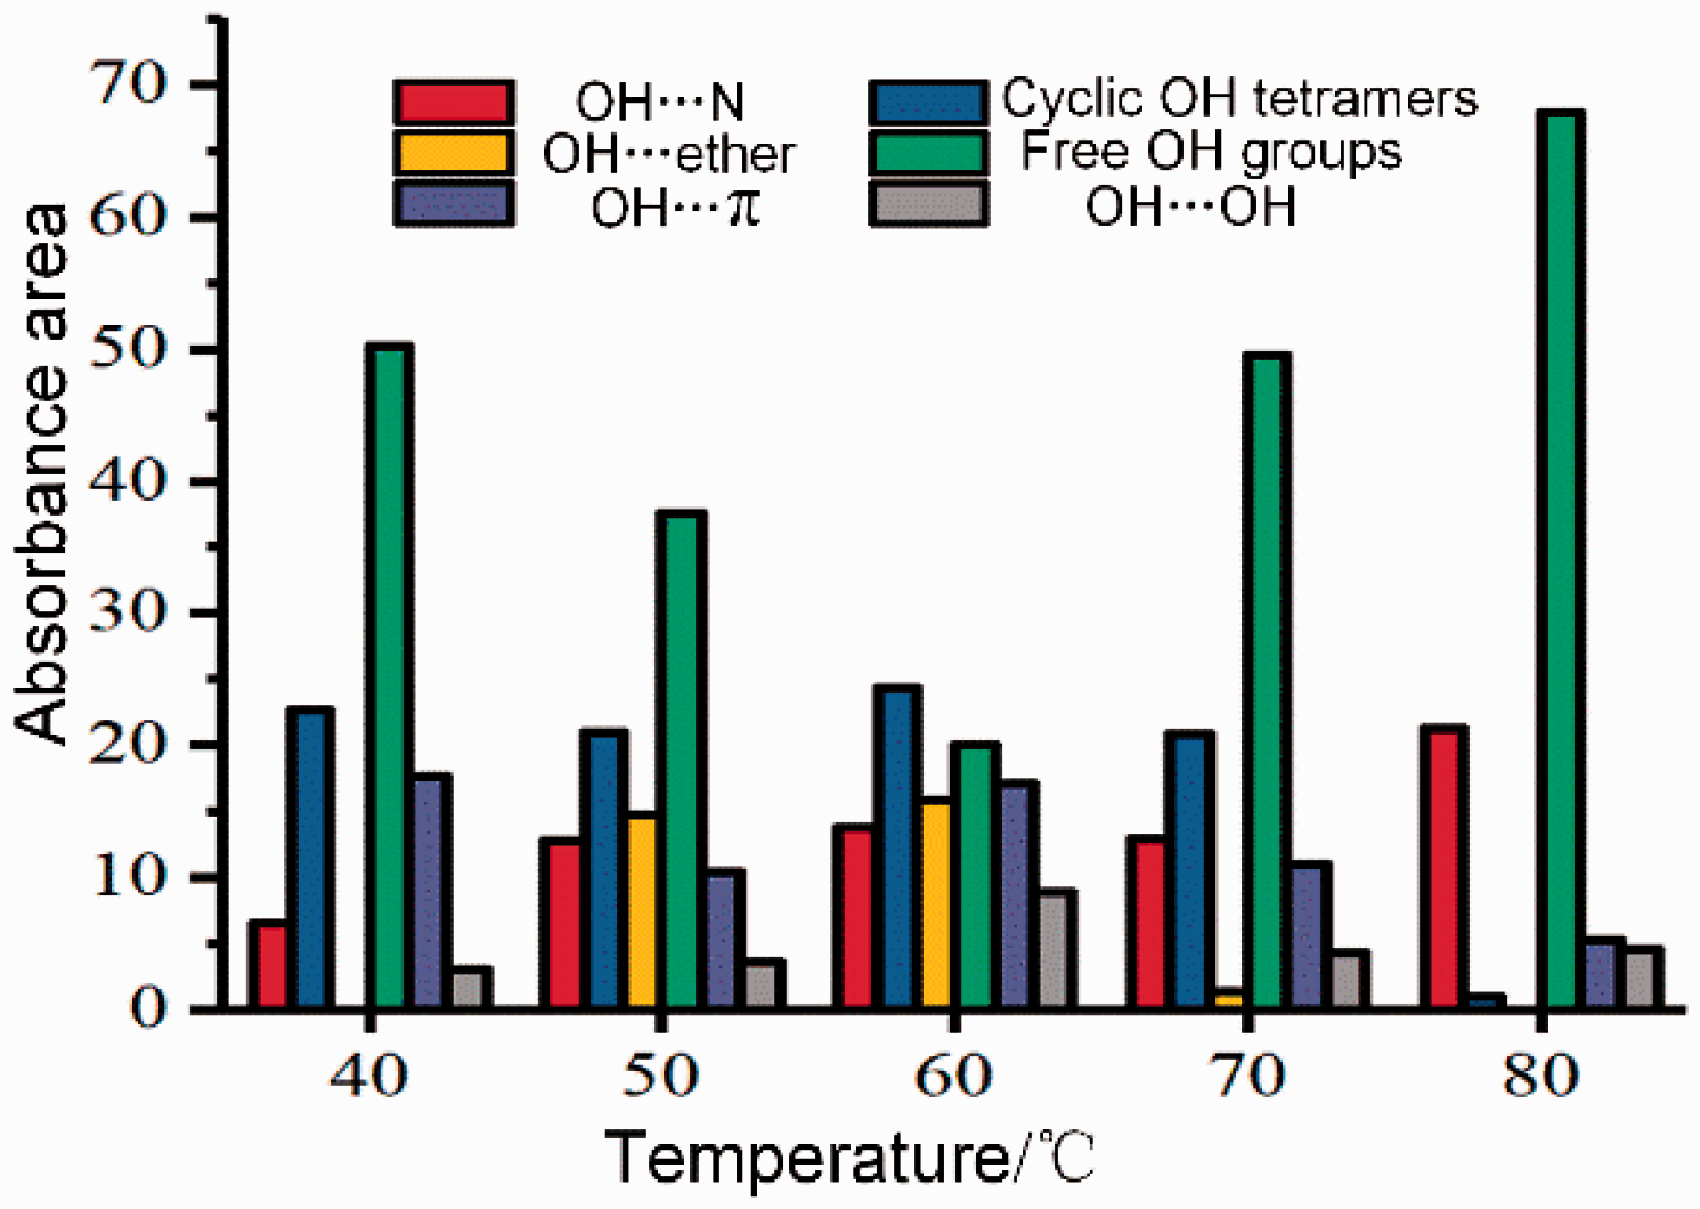
Hydroxyl distribution of shale at different temperatures.
(2) The effect of temperature on fat areas
The aliphatic C−H (2800–3000 cm−1) region was processed by peak separation; the calculated CH3/CH2 and Iar values and their changes with temperature and CO2 pressure are shown in Figure 5. CH3/CH2 and Iar negatively correlated with CO2temperature, indicating that after CO2 treatment, the number of aliphatic branch chains decreased and their lengths increased; the aromatic condensation degree of aromatic groups decreased and the content of aromatic ring bridged bond fracture thickened ring decreased. This was due to the temperature increase, C–H fracture of methyl groups which generated hydrogen-containing free radicals. Meanwhile, hydrocarbon volatilities in the organic matter increased, molecular thermal movement accelerated, the diffusion coefficient increased, the association probabilities of CO2 and hydrocarbons increased, the contact probability of hydrogen-containing free radicals and free hydrogen-containing free radicals in the aromatic ring decreased; all of these led to a decrease in the shale aromatic index. In addition, the aliphatic methyl C–H bond has a lower bond energy than an aromatic C–H bond. Therefore, with temperature increases, the C–H bonds of methane and other light hydrocarbons break first so the CH3/CH2 ratio decreases; however, when the temperature continues to rise enough to support the breakage of methyl groups attached to the aromatic group, CH3/CH2 continues to decrease and the aromatic index decreases.
Effects of temperature and pressure on inorganic minerals
(1) Effect of pressure on inorganic minerals
The shape and position of the characteristic carbonate (1300–1600 cm−1) and silicate (900–1300 cm−1) peaks upon CO2 treatment at different pressures were normalized and are shown in Figure 7. With an increase in CO2 pressure, the asymmetric stretching vibration peak changed little though the width increased; the peak splitting trend was obvious, the splitting position was ∼1440 cm−1. However, the asymmetric peak change of carbonate treated with liquid CO2 was not obvious, indicating that the phase state of CO2 affected the carbonate reaction process. This was probably due to SC-CO2 being more likely to enter into shale pores which increased the possibility of CO2 contact with the shale mineral ions and enhanced the carbonization activity. With an increase of CO2 pressure, the silicate absorption peak remains virtually unchanged, indicating no chemical reaction between CO2 and silicate.
Normalized shale spectra after CO2 treatment at different temperatures: (a) 1300–1600 cm−1 and (b) 900–1300 cm−1.
Using silicate minerals as a reference, the ratio of the carbonate absorption peak area to the silicate absorption peak area (A1300-1560/A930-1300) was calculated as a function of the CO2 treatment pressure. A linear fitting was made between A1300-1560/A930-1300 and the CO2 treatment pressure and is shown in Figure 8. Carbonate gradually dissolved; the carbonate dissolution degree positively correlated with CO2 treatment pressure.
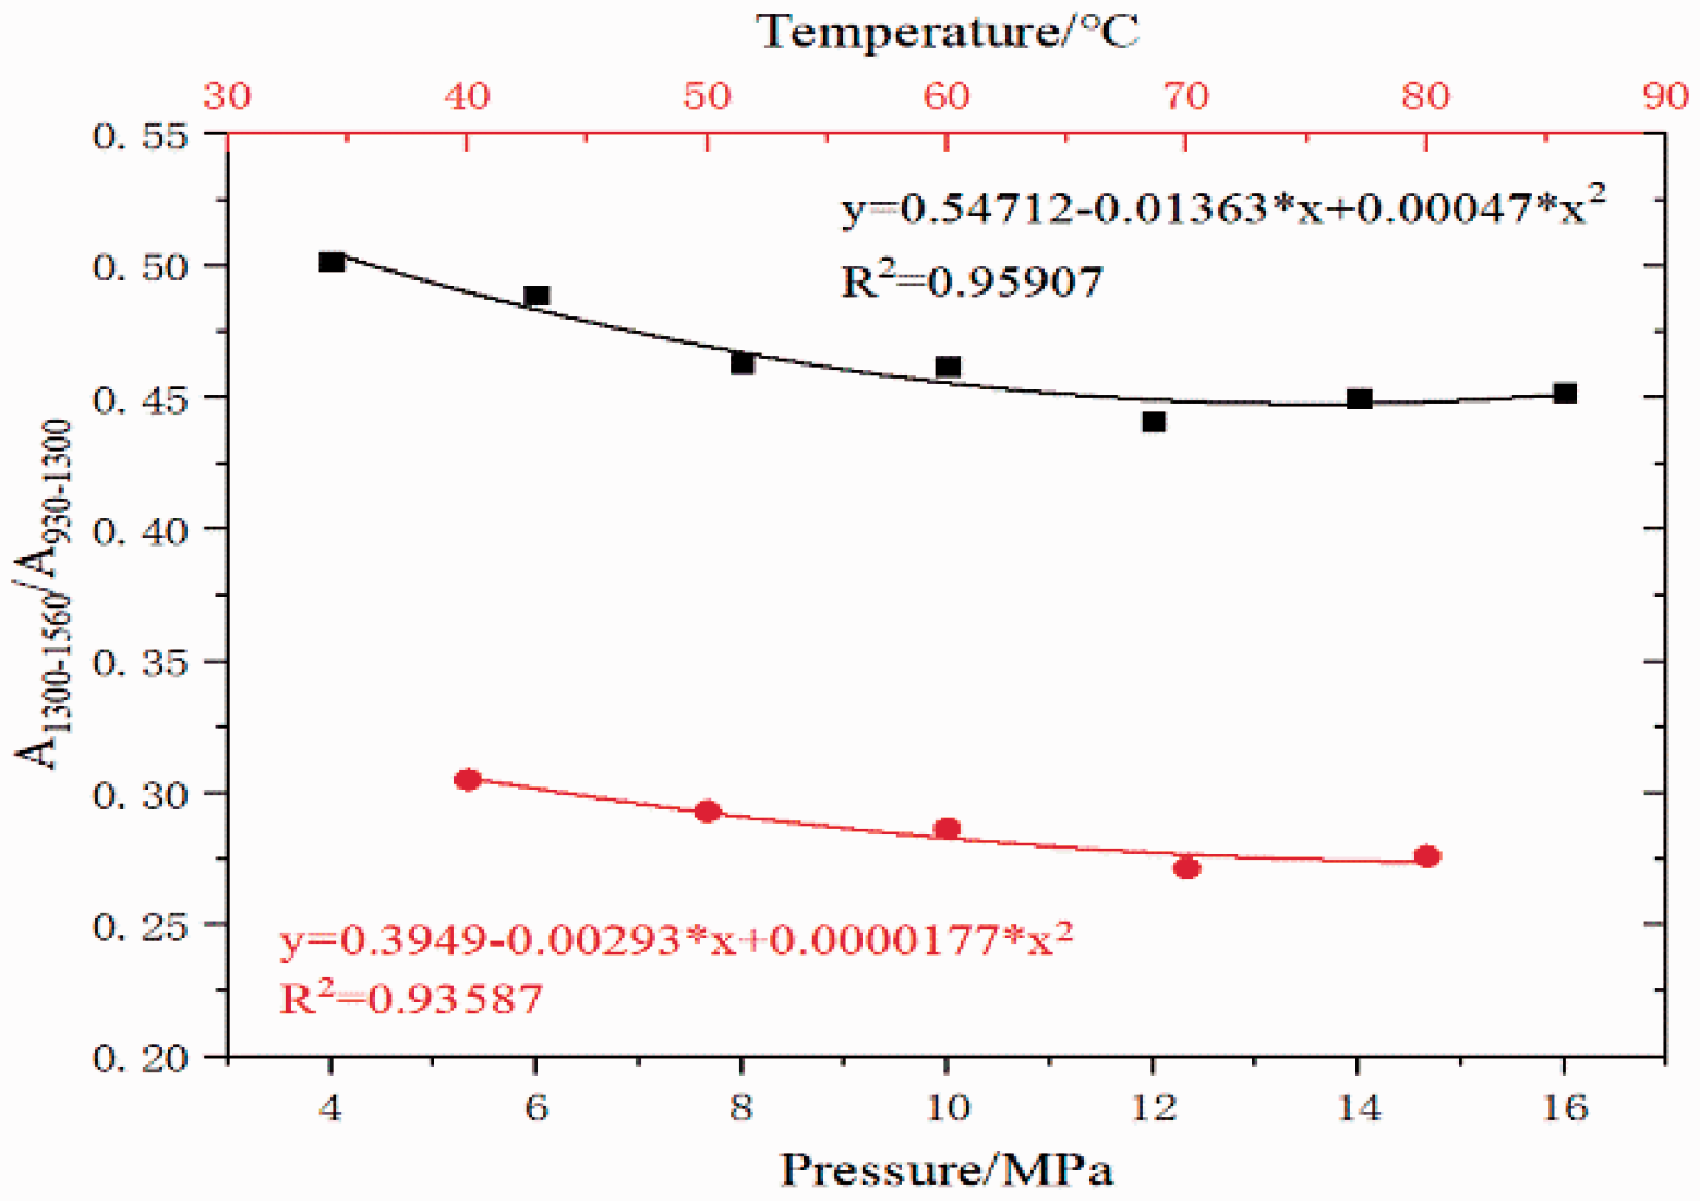
The A1300–1560/A930–1300 shale values at different pressures and temperatures.
(2) The effect of temperature on inorganic minerals
Figure 9 shows the peak shape of shale mineral absorption changes with the CO2 treatment temperature. As the temperature increases, splitting of the absorption peak near 1400 cm−1 was more obvious and the absorption peak at 1426 cm−1 became sharper, which indicated the formation of a new carbonate species in shale. Furthermore, the characteristic peak of coordinated carbonate increased with temperature increases. Injection of CO2 resulted in chemical adsorption on the shale surface and occupied surface adsorption sites to form monodentate, polydentate, and bridging carbonate structures. As the temperature increased, the coordination group activity increased. Due to the limited natural water content in shale, the relative strength of the 1420 cm−1 absorption peak decreased and the carbonate minerals dissolved. The shape of the absorption peaks from 900 to 1300 cm−1 (crystalline SiO2) remained steady with temperature, indicating that silicate minerals were stable in a CO2 environment.
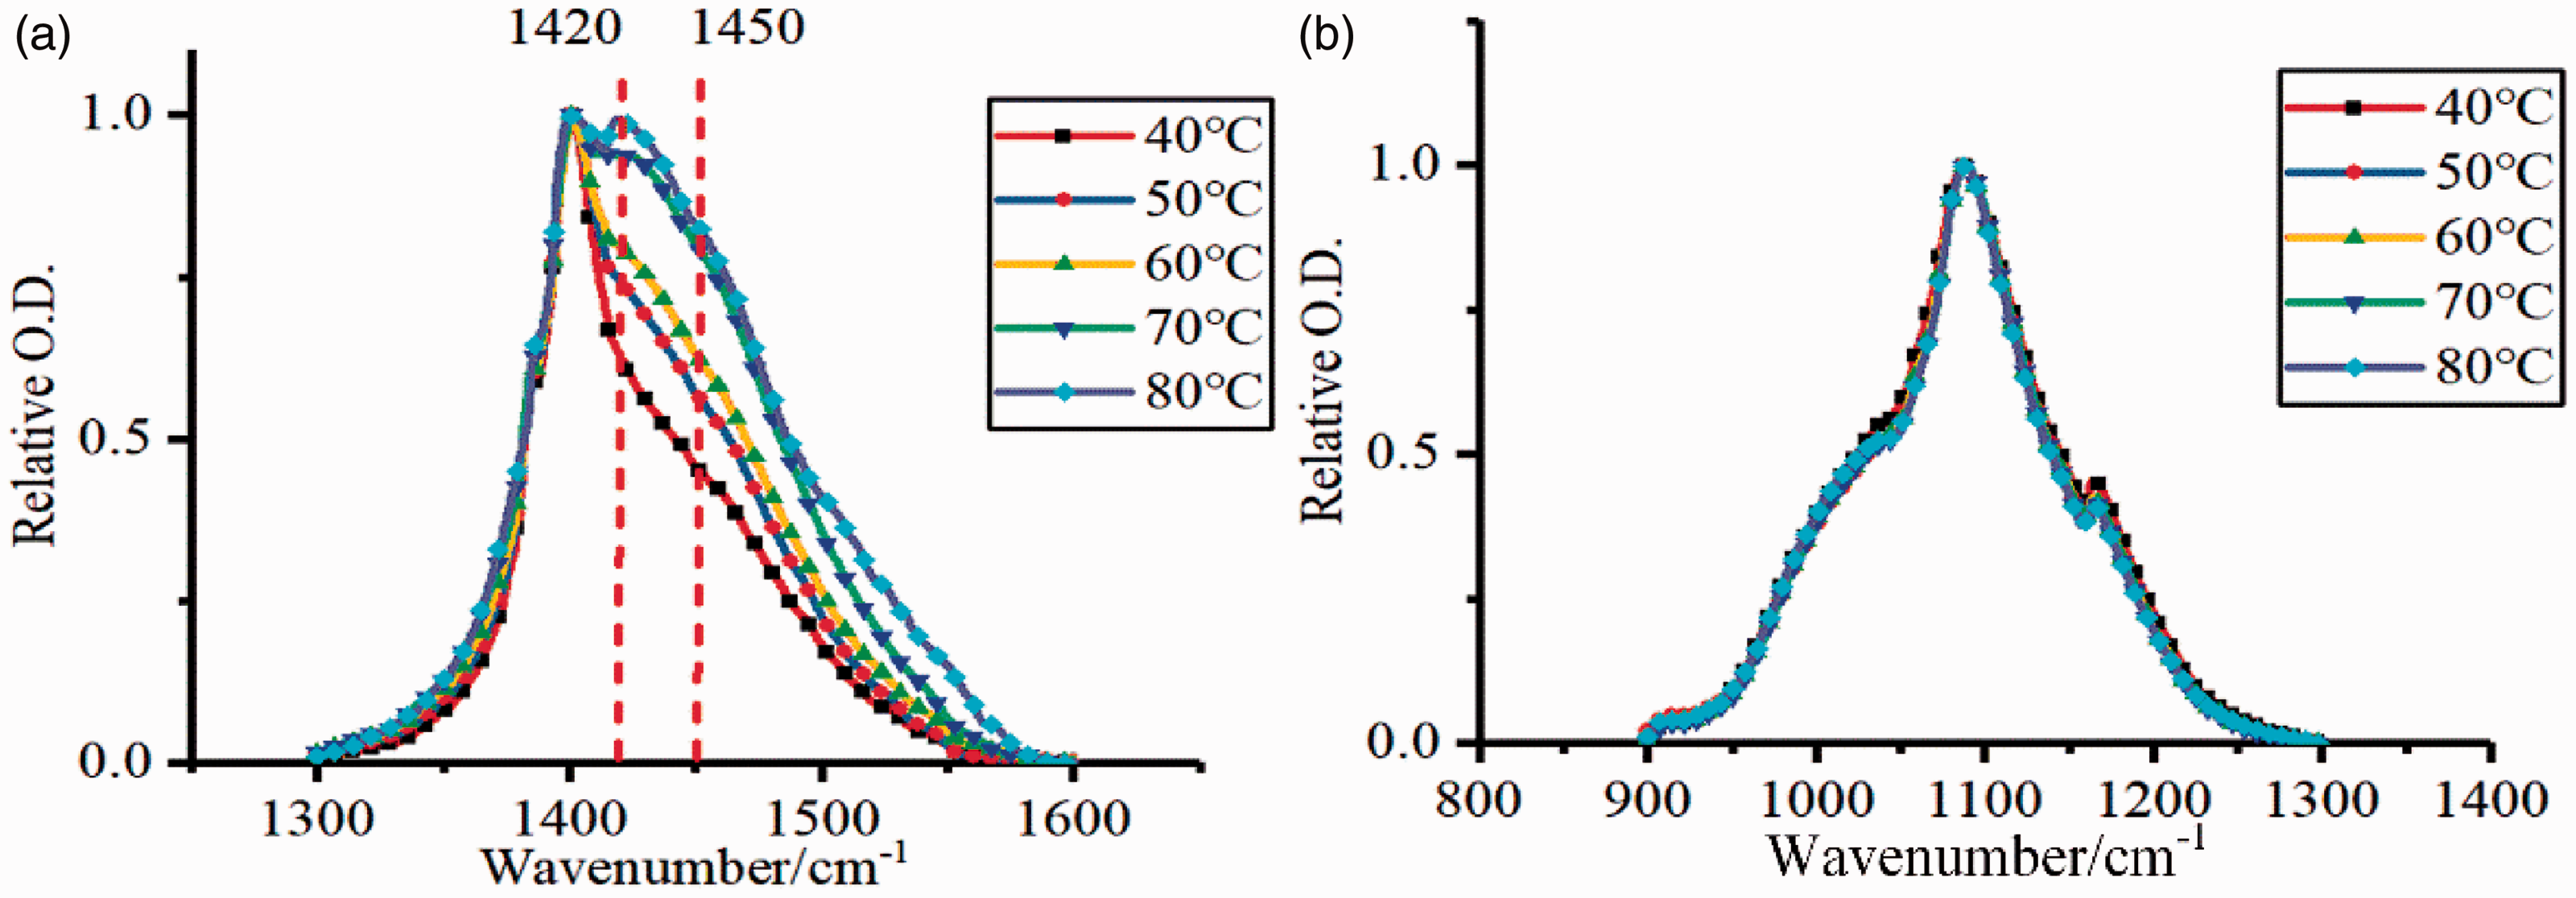
Normalized shale spectra after CO2 treatment at different temperatures: (a) 900–1300 cm−1 and (b) 1300–1600 cm−1.
A comparison of the ratio of carbonate to silicate absorption peak areas (A1300-1560/A930-1300) at different temperatures is shown in Figure 8 and indicated carbonate dissolution gradually occurred and the degree of carbonate dissolution was positively correlated with CO2 treatment temperature.
Discussion on the influence of chemical structure change on the wettability of shale
In the process of CO2-enhanced shale gas exploitation, CO2 injection has an irreversible effect on the shale reservoir. Studying the wettability of SC-CO2 injected into shale will be of great significance to the study of capillary force and relative permeability in shale reservoirs. Therefore, as an important factor affecting shale wettability, shale surface functional groups are of great significance for SC-CO2-enhanced shale gas exploitation.
The presence of organic matter complicates shale wettability. Oxygen-containing functional groups in organic matter and quartz, dolomite, clay minerals, and feldspar in the inorganic matter are hydrophilic, while other organic matter is hydrophobic (Liang et al., 2016). The infrared spectrum shows that CO2 injection into the reservoir has differing effects on the various shale minerals. Different temperatures and pressures of CO2 have different effects on inorganic and organic minerals in shale, which makes the effect of CO2 on shale wettability more complex.
In this study, the increase of SC-CO2 pressure reduced the hydroxyl group content, carbonate minerals reacted which resulted in weakened hydrophilicity, and the organic matter in shale was reduced due to the extraction of SC-CO2. Various processes were simultaneously carried out; ultimately, changing the wettability of shale will require further experimental research.
Conclusions
After CO2 treatment, no peaks disappeared or were new peaks observed in the infrared spectrum of shale; however, peak positions and strengths changed which indicated the mineral composition and structure of shale also changed. Upon CO2 treatment, the branched-chain, as well as aromaticity indexes, was reduced and organic matter can be decomposed or extracted. Moreover, pressure changes have a more significant influence on the chemical structure of shale. The main peaks of the characteristic carbonate peaks split with an overlapping silicate peak; the carbonate dissolved, new carbonate species formed, and the silicate minerals were stable. With CO2 pressure increases, the hydrogen bond structure in the shale was destroyed; the hydroxyl content decreased (by 11–37%) with an increase in CO2 pressure. Both branching and aromaticity indexes decreased with a pressure increase. After treatment of 16 MPa CO2, the branching and aromaticity indexes of shale dropped by 81.51% and 53.82%, respectively, relative to the original rock. At 60°C, self-associated n-mers were minimized which indicated the level of free water in the shale. Below 60°C, free water increased with temperature increases and the dissolution of shale increased; however, temperatures above 60°C inhibited dissolution and resulted in precipitation.
Footnotes
Declaration of conflicting interests
The author(s) declare no potential conflicts of interest for the research, authorship, and/or publication of this article.
Funding
The author(s) disclosed receipt of the following financial support for the research, authorship, and/or publication of this article: Our research work was supported by the Chongqing Natural Science Foundation Project (No. cstc2018jcyjAX0542), National science and technology major special fund of the 13th five-year plan (No. 2017ZX05049-003–11), Cheung Kong Scholars and innovation team development program (No. IRT17R112).