
Abstract
To better understand the structural characteristic of adsorption pores (pore diameter < 100 nm) of coal reservoirs around the coalbed methane production areas of western Yunnan and eastern Guizhou, we analyzed the structural and fractal characteristics of pore size range of 0.40–2.0 nm and 2–100 nm in middle–high rank coals (Ro,max = 0.93–3.20%) by combining low-temperature N2/CO2 adsorption tests and surface/volume fractal theory. The results show that the coal reservoirs can be divided into three categories: type A (Ro,max < 2.15%), type B (2.15% < Ro,max <2.50%), and type C (Ro,max > 2.15%). The structural parameters of pores in the range from 2 to 100 nm are influenced by the degree of coal metamorphism and the compositional parameters (e.g., ash and volatile matter). The dominant diameters of the specific surface areas are 10–50 nm, 2–50 nm, and 2–10 nm, respectively. The pores in the range from <2 nm provide the largest proportion of total specific surface area (97.22%–99.96%) of the coal reservoir, and the CO2-specific surface area and CO2-total pore volume relationships show a positive linear correlation. The metamorphic degree has a much greater control on the pores (pore diameter less than 2 nm) structural parameters than those of the pore diameter ranges from 2 to 100 nm. Dv1 and Dv2 can characterize the structure of 2–100 nm adsorption pores, and Dv1 (volume heterogeneity) has a positive correlation with the pore structural parameters such as N2-specific surface area and N2-total pore volume. This parameter can be used to characterize volume heterogeneity of 2–10 nm pores. Dv2 (surface heterogeneity) showed type A > type B > type C and was mainly affected by the metamorphism degree. Ds2 can be used to characterize the pore surface heterogeneity of micropores in the range of 0.62–1.50 nm. This parameter has a good correlation with the pore parameters (CO2-total pore volume, CO2-specific surface area, and average pore size) and is expressed as type C < type B < type A. In conclusion, the heterogeneity of the micropores is less than that of the meso- and macropores (2–100 nm). Dv1, Dv2, and Ds2 can be used as effective parameters to characterize the pore structure of adsorption pores. This result can provide a theoretical basis for studying the pore structure compatibility of coal reservoirs in the region.
Introduction
As an unconventional reservoir rock, the storage space of a coal reservoir is dominated by the defect space between the surface molecules of the coal matrix (solid solution state) and the nanometer level of micropores. Fracture systems control the characteristics of gas–water seepage. Adsorption pores (a pore diameter < 100 nm) mainly adsorb the methane molecules in the form of physical adsorption to control the adsorption characteristics of reservoirs, thus affecting the gas-bearing characteristics of the reservoirs. Meanwhile, the pore–fracture system is an important factor in determining the productive potential of coalbed methane (CBM) (Bustin and Clark, 1998; Laubach et al., 1988; Moore et al., 2012).
Pore and fracture systems of coals have been comprehensively studied by constantly updated methods in recent years, including experimental techniques such as photoelectric observation, gas adsorption, and fluid intrusion, and reconstruction of three-dimensional structures (Chalmers et al., 2012; Clarkson et al., 2013; Li et al., 2017; Liu and Nie, 2016; Yao et al., 2010). The pores of coal can be classified into those <2 nm (micropores), 2–50 nm (mesopores), and >50 nm (macropores) in size according to the International Union of Pure and Applied Chemistry (IUPAC). Another widely accepted classification of <10 nm, 10–100 nm, 100–1000 nm, and >1000 nm was provided by Hodot (Hodot, 1966; IUPAC, 1994). Typically, <100 nm pores are defined as adsorption pores, and their unique structure has an important influence on the adsorption and diffusion of CBM (Yao et al., 2008) . Meanwhile, Chen et al. (2017), Heister (2016), and Zhao et al. (2016) showed that <2 nm pores provide a large proportion of the specific surface area (SSA) and total pore volume (TPV) of middle–high rank coals, and the degree of SSA determines the adsorption capacity of the coal reservoir.
Among testing methods, the low-temperature nitrogen test (LPN2GA) has become an effective method to characterize adsorption pore structure (Francisco et al., 1996; Liu and Nie, 2016; Mahamud and Novo, 2008; Nie et al., 2015). However, this method has difficulty characterizing the structure of adsorption pores <2 nm in size accurately given the larger molecular kinetic diameter (0.36 nm) and instrument precision constraints ( Li et al., 2012a; Li et al., 2014). Because CO2 molecules are more prone to enter small pores in the range of 0.30–1.50 nm due to a smaller kinetic diameter (0.33 nm) under a higher temperature (273 K) compared to N2, the combination of HPCO2 GA and LPN2GA methods can achieve full-scale comprehensive analysis of the pore structure of adsorption pores (Echeverría et al., 1999; Mastalerz et al., 2008; Zhao et al., 2016). Meanwhile, the storage and migration of CBM are closely related to the porosity/surface of coal reservoirs with self-similarity; thus, the fractal dimension obtained via LPN2GA test data is an effective physical parameter that is used to quantitatively describe the pore structure heterogeneity of adsorption pores (Mahamud and Novo, 2008; Mendhe et al., 2017; Yao et al., 2008). This method provides a theoretical basis for the implementation of a quantitative description of pore heterogeneity in adsorption pores for different coal reservoirs. However, there are relatively few studies on pore fractal characteristics of micropores (pore diameter < 2 nm) that affect the accurate quantitative characterization of adsorption pores (Liu et al., 2009; Yin et al., 2017; Mahamud and García, 2018).
CBM resources are abundant in western Guizhou and eastern Yunnan, South China, and the area has become a hot spot for CBM exploration and development in recent years (Li et al., 2015; Shen et al., 2016). Different from other CBM-producing areas (Qinshui Basin), multilayer joint mining is the main development model in this region. The similarity of pore structure in adsorption pores of coal reservoirs has become the primary research topic in this development model (Qin et al., 2016). Although relevant scholars have conducted some research on the pore structure of coal reservoirs in the region focusing on the study of the middle rank of primary coal in specific mining areas of western Guizhou, research on adsorption pores in this area is relatively insufficient, and there are few research studies on high-rank coal reservoirs in the coalbed gas-producing area of western Yunnan. Thus, systematic comparative research of pore structure under the control of regional structure and metamorphism degree is needed, particularly the heterogeneity of adsorption pores.
Systematic research of coal reservoir adsorption pore structural compatibility of different rank and construction conditions is of great significance in understanding the coalification process and determining the success of CBM production in this region. This study analyzed the structural characteristics of adsorption pores in 18 samples of different layers in two typical production areas using low-temperature N2/CO2 adsorption tests (LPN2/CO2) to compare the adsorption pore structure of middle–high rank coal reservoirs of different rank and in different regions. Meanwhile, we studied fractal characteristics of pores <2 nm and from 2 to 100 nm in size using volume and surface fractal models and analyzed the influential factors of fractal dimension in different range sizes of pores. Based on the results, practical application of fractal parameters in adsorption pores in the development of CBM is discussed, providing a basis for the development of multilayer joint mining in western Guizhou and eastern Yunnan.
Experimental samples and method
Geological setting and sample collection
Western Guizhou and eastern Yunnan are in the Yangtze Block and cover an area of approximately 2.58 × 10⁴ km2. The CBM resource is approximately 2.20–2.75 × 10¹² m3. The main coal-bearing strata in this area are the late Permian Longtan Formation and Changxing Formation, which belong to a delta–tidal–lagoon sedimentary system. After the coal-bearing strata were deposited, the study areas underwent Indosinian–Yanshan–Himalayan tectonic movements. Faults and folds generated by structural movements of different stages control the distribution pattern of CBM resources in this area (Gui and Wang, 2000). The evolution degree of coals in this region fluctuates from bituminous to anthracite coal, and the coal reservoirs have different evolution including deep metamorphism during the early Yanshanian period and structural–thermal metamorphism during the Yanshan period (Chen et al., 2018; Li et al., 2012b, 2014, 2015).
We selected two typical areas in this region for comparative analysis. The Laochang mining area is in northeastern Yunnan, and the Laochang complex anticline is the main structure. The structural complexity is relatively high. Coal reservoirs are mainly based on high-rank coal (Figure 1(a) to (c)). The Tucheng mining area is in southwestern Guizhou, and the main structure is the Panguan syncline though fault structure is not well developed. Coal reservoirs are mainly based on middle-rank coal (Figure 1(b) to (d)). Nineteen fresh coal samples (approximately 15 × 15 × 15 cm3) were collected from 16 active coal mining areas, including 9 coal mines in the Laochang mining area and 7 coal mines in the Tucheng mining area. Sample distribution locations and basic parameters are shown in Figure 1 and Table 1, respectively.
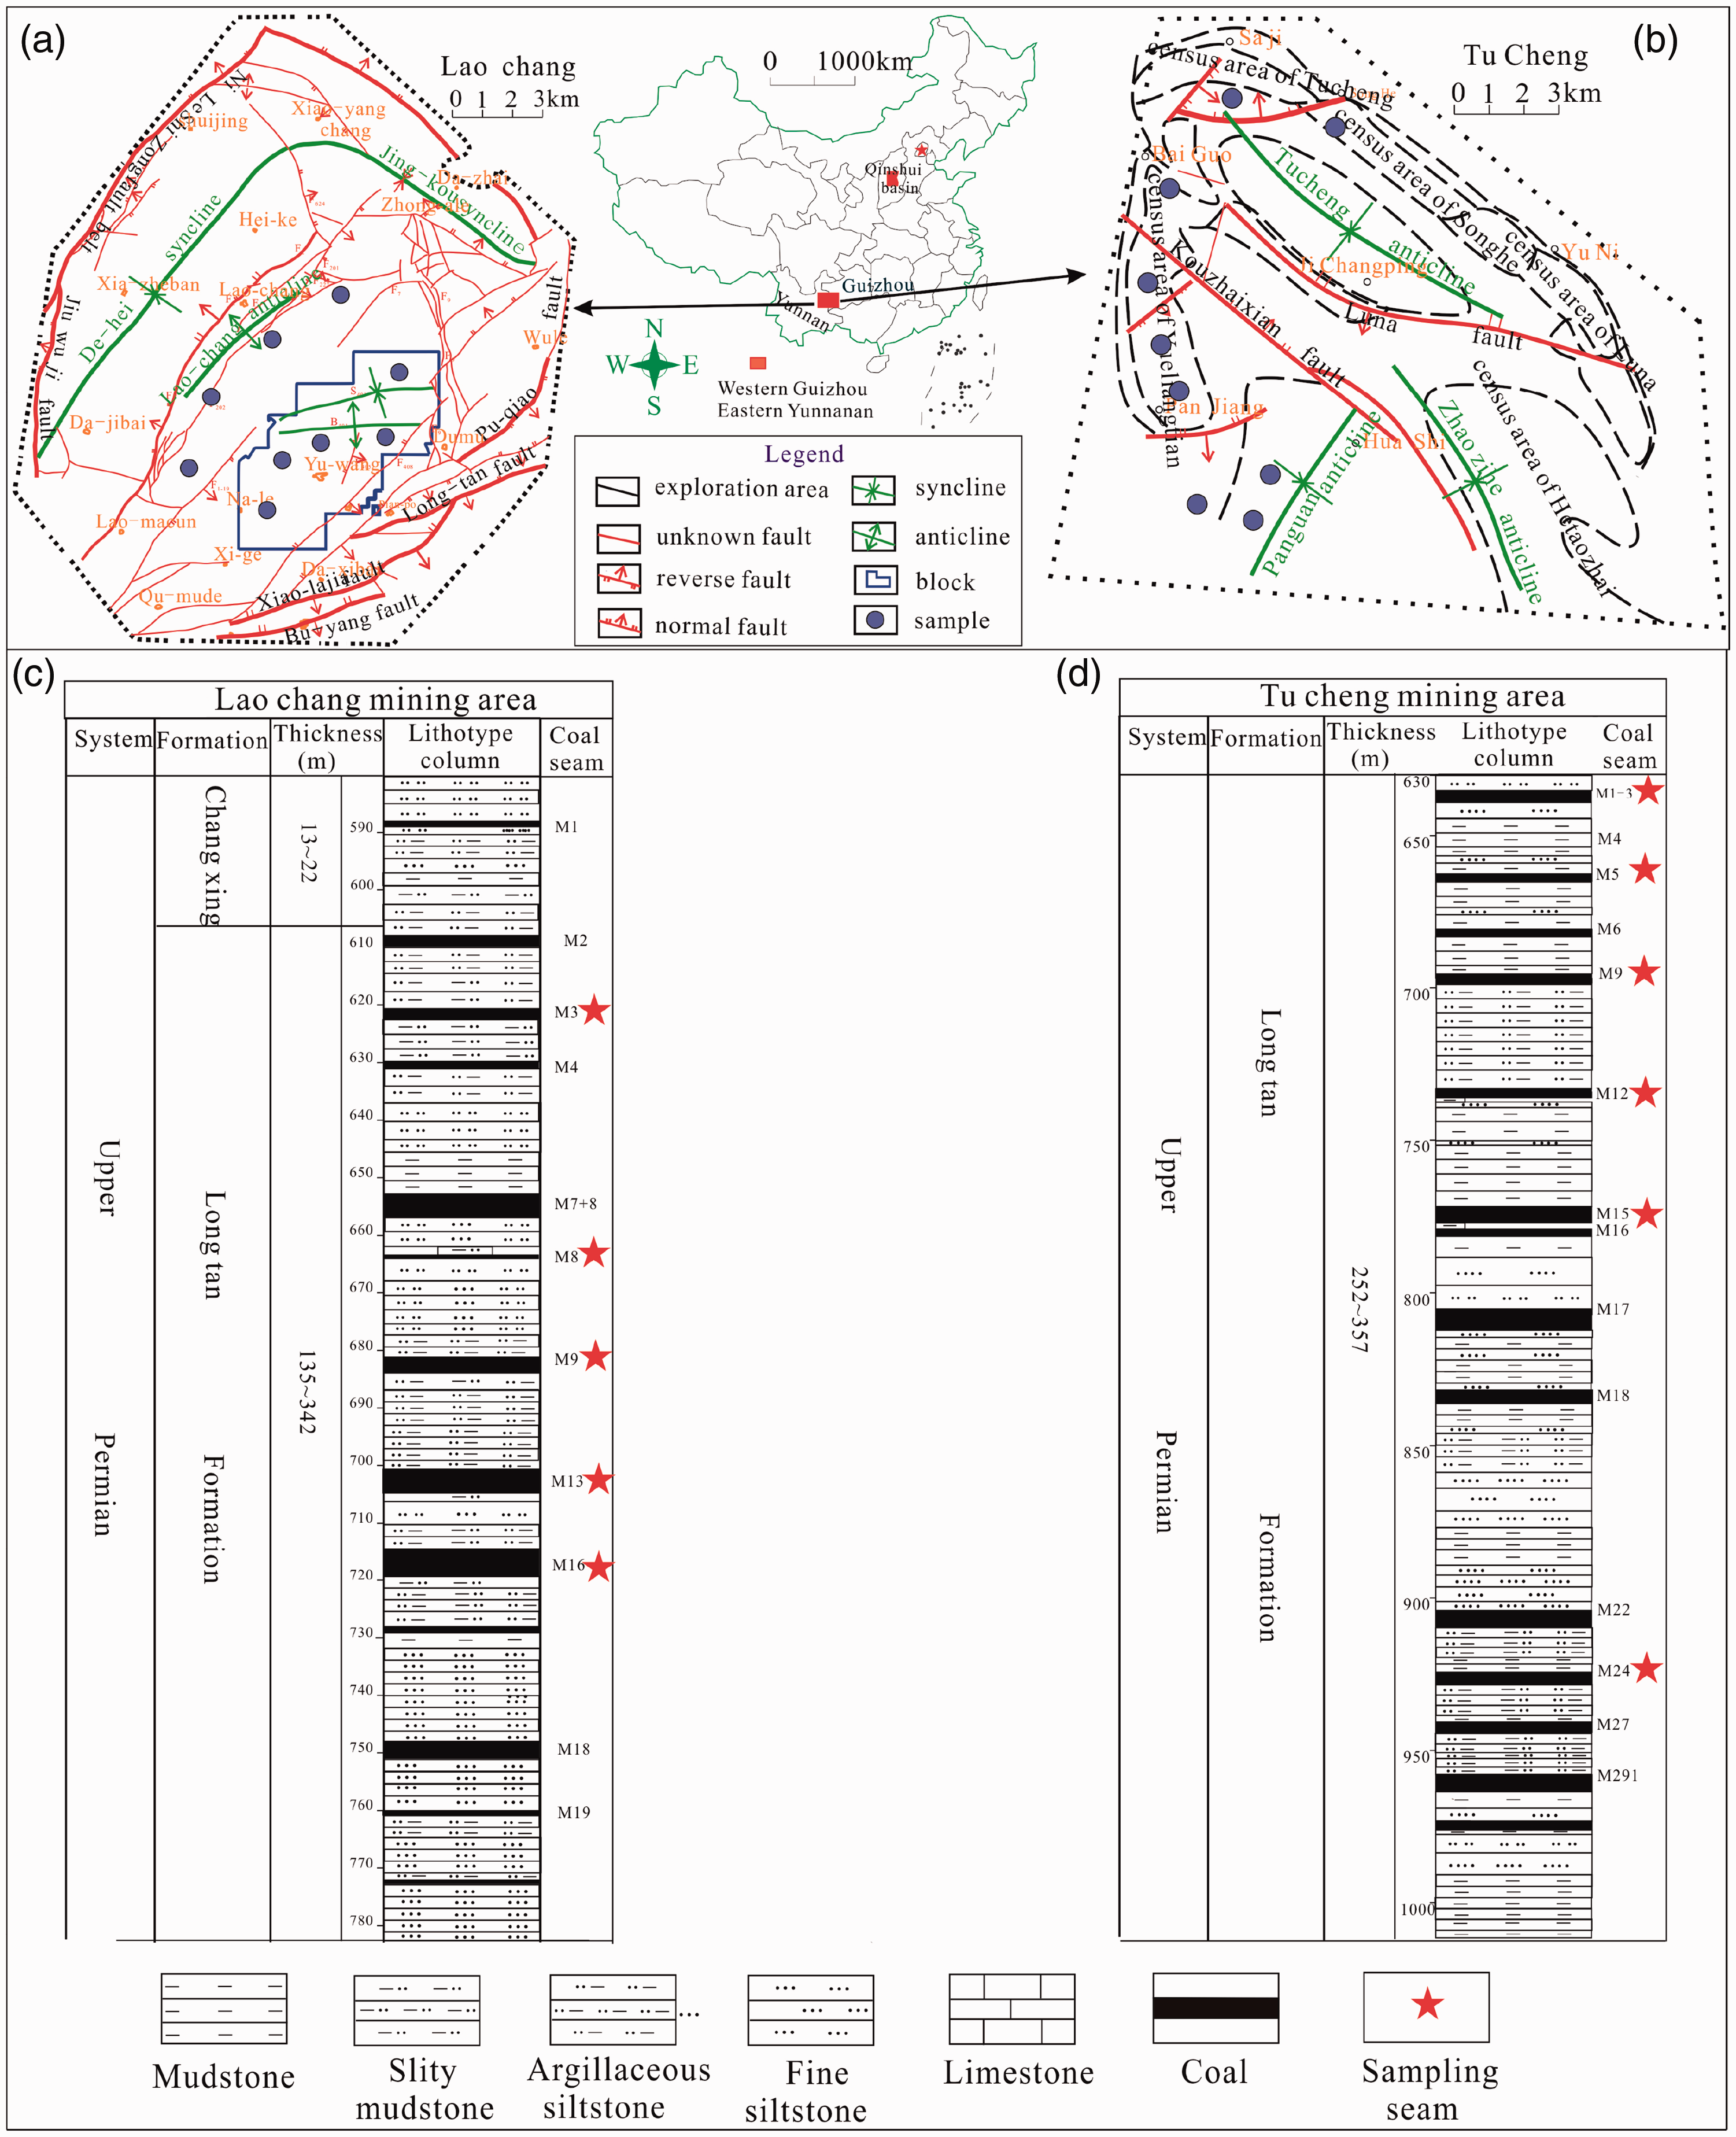
Basic information of the sampling and study area. (a and b) Distribution of the sampling locations and tectonic outline of the study area. (c and d) Stratigraphic columns of coal-bearing strata and distribution of sampling seams.
Basic information for coal samples collected from target area.
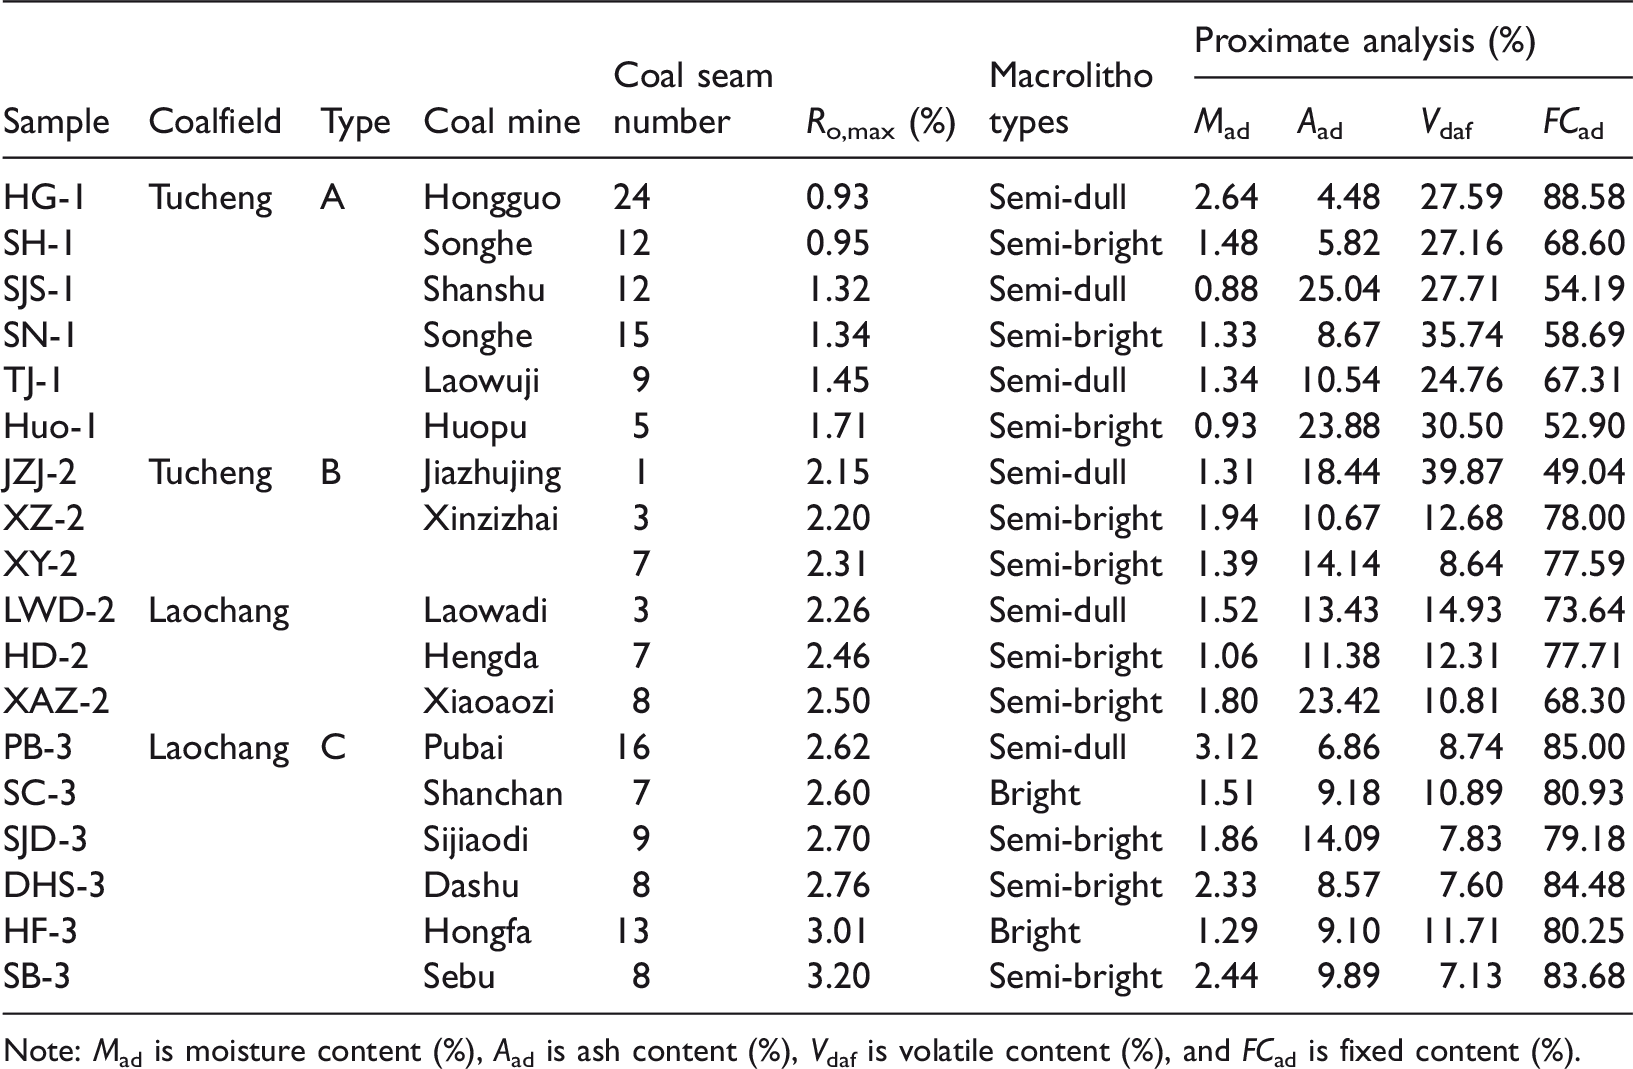
Note: Mad is moisture content (%), Aad is ash content (%), Vdaf is volatile content (%), and FCad is fixed content (%).
Experimental methods and analysis
The samples collected were placed in a sample tank, which was quickly transported to the laboratory for pre-test processing and a series of tests according to the standard GB/T 19222-2003. The macrolithotype of coal was determined according to the Chinese national standard GB/T 18023-2000. The microscopic maceral analysis was prepared on 3 × 3 cm2 polished slabs with a total of 500 observational points (based on GB/T 6948-1998). Proximate analysis was conducted on all 19 samples following GB/T 212-2001.
LPN2GA and LPCO2GA were simultaneously conducted for the 19 solid samples using a Quanta Chrome Autosorb-1 physical adsorption instrument. The difference in the two tests is that the N2 adsorption isotherms are obtained at 77 K and those of CO2 at 273 K. The Brunauer–Emmett–Teller (BET) multilayer adsorption equation was applied for linear analysis under a relative pressure of 0.05–0.35 to obtain the SSAs of the 2–100 nm pores. Pore size distribution (PSD) and the 2–100 nm pore volume were calculated using the density functional theory (DFT) model via the desorption curve at a relative pressure of 0.99 based on the LPN2GA data. The SSA of the micropores and the incremental pore volume (IPV) were calculated using DFT based on the LPCO2GA data (Barrett et al., 1951; Gregg and Singh, 1982; Li et al., 2017) .
To better describe the adsorption pores, the description of adsorption pores in this paper is based on the IUPAC standard and the Yao et al. (2008) classification, which defines the <2 nm pores as micropores, 2–50 nm pores as mesopores, and 50–100 nm pores as macropores. A comprehensive analysis of the fractal characteristics of adsorption pores was evaluated. The Frenkel–Halsey–Hill equation was used to characterize the fractal dimension of 2–100 nm pores as follows

There are different relationships between the volume fractal D and slope A during different adsorption phases (D = 3A + 3/D = A + 3), which has been confirmed by some scholars to be more applicable to D = A + 3 (Friesen and Ogunsola, 1995; Tang et al., 2003).
Equation (2) was used to describe the surface heterogeneity of micropores as follows (Song et al., 2017)

To clarify the fractal characteristics of specific diameters, this study introduced the Kelvin formula to calculate the size of micro- and nanopores based on the cylindrical pore model as follows

Results and discussion
Sample classification and basic parameters
The vitrinite reflectance of all the samples ranged from 0.93% to 3.20% (Table 1). For a better comparative study, the coal reservoirs were divided into two categories: middle-rank coals (0.93%–2.15%) and high-rank coals (2.15%–3.20%). The middle-rank samples are mainly distributed in the Panguan syncline and mainly within the primary structural coal. The high-rank samples are mainly distributed in the Laochang anticline, and part of the sample is structural deformation coal. For all 18 tested samples, vitrinite is the dominant maceral composition. Most of the samples were low–middle ash coal, except for SJS-1/Huo-1/XAZ-2. The overall change in moisture content was relatively consistent, and with the increase in metamorphism, volatile content gradually decreased and fixed carbon content gradually increased.
Structural characteristics of adsorption pores
Types of adsorption pores
Based on pore connectivity, we can divide the pores into connected pores, passing pores, semi-closed pores and closed pores, in which the former three types are also called open pores and have an important influence on adsorption, desorption, and permeability of coal seams (Crosdale et al., 1998; Levy et al., 1997; Rouquerol et al., 1994). Absorption–desorption curves can be used to characterize pore geometry and complexity. All the samples can be divided into types A, B, or C referring to Sing et al. (1985) adsorption curve division.
The middle-rank coals all are type A and have no obvious adsorption loop (except for sample SJS-1). The adsorption curve and desorption curves nearly overlap. This shows that the 2–100 nm adsorption pores all consist of semi-closed pores with one open end and the other closed. Such pores have weak adsorption capacity but contribute to the desorption and diffusion of gases during the development of CBM. Sample SJS-1 has a significant adsorption loop at p/p0>0.8, indicating that the d > 10 nm pore is dominated by open pores, which has better pore connectivity than that of the other samples (formula (3)) (Figure 2(a)). Withdrawal-adsorption curves of high-rank samples are divided into two types with an Ro,max of approximately 2.50%. Samples with an Ro,max greater than 2.50% (for example, PB-3) are type C (Figure 2(c)) in which the adsorption loops have an obvious inflection point near p/p0=0.5 mainly formed by the ink-bottle-shaped pores. In this type of sample, pores with a pore size greater than 4 nm (p/p0>0.5) are mainly open pores such as ink-bottle-shaped and parallel-plate pores, and the pores with a diameter of less than 4 nm (p/p0 < 0.5) are mainly semi-closed pores (the pore connectivity of the samples DHS-3, HF-3, and SJD-3 is relatively good). Samples with an Ro,max between 2.0 and 2.5% (for example, XZ-2) are type B. The difference in the withdrawal-adsorption curves is greater, and the pore type tends to be more complex than that of the A/C samples, which is a transitional type (Figure 2(b)).
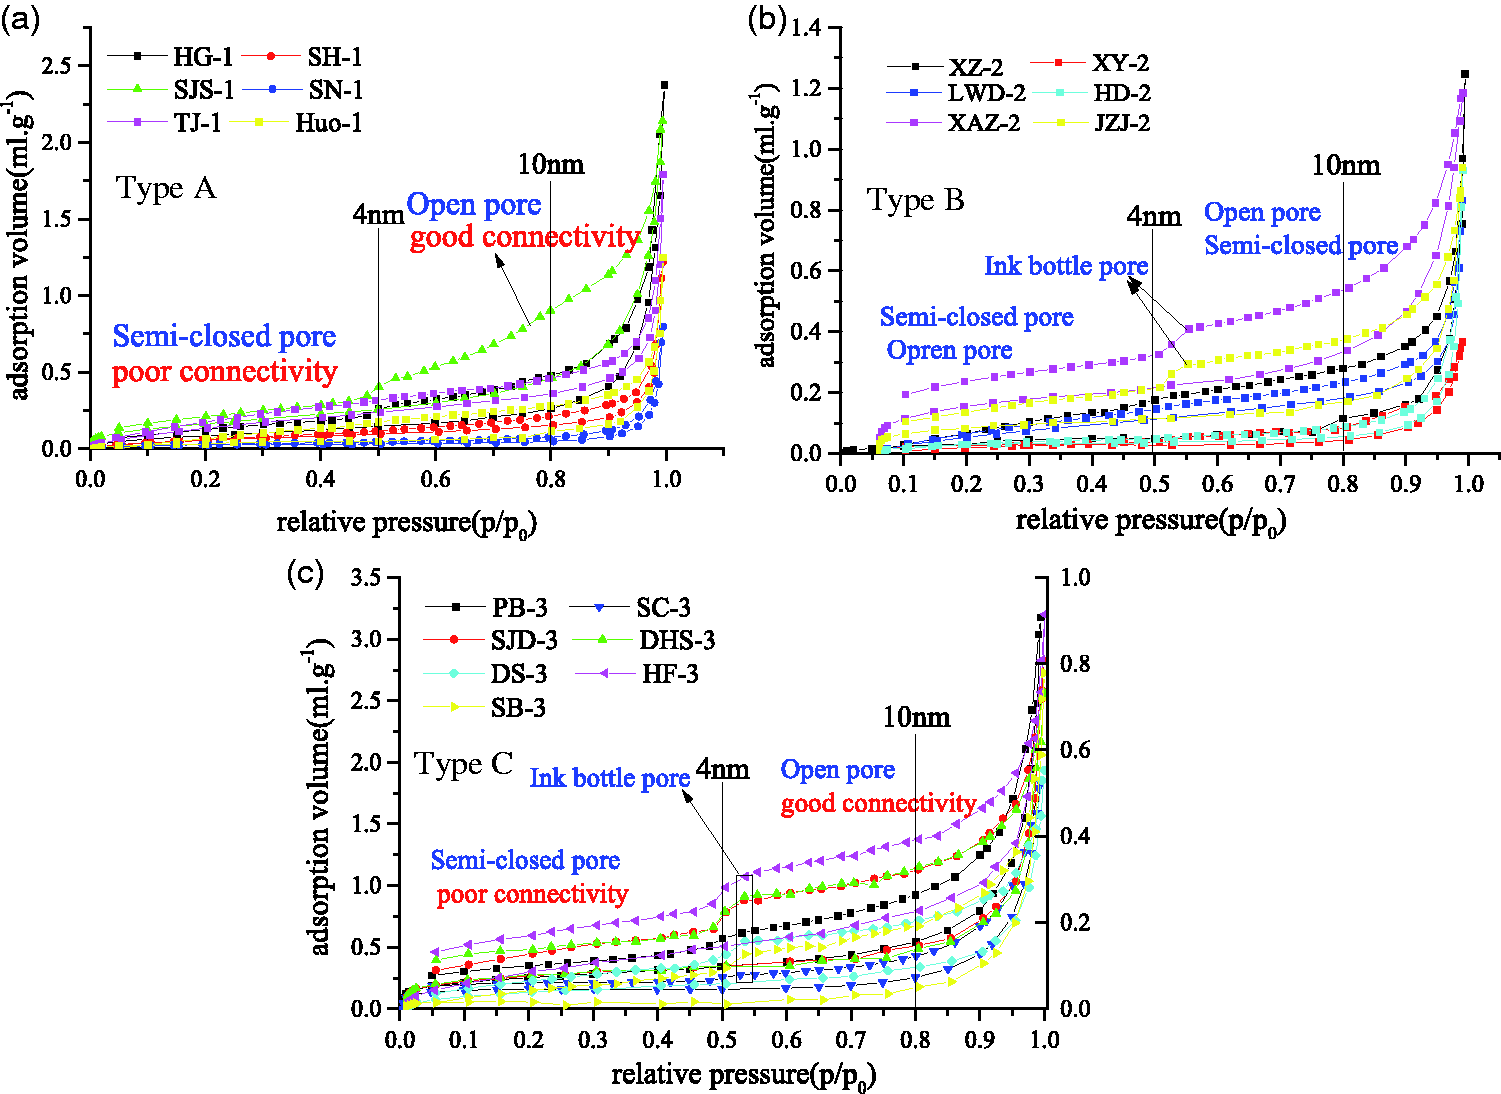
Relationship between adsorption volume and relative pressure in all the samples. (a) Type A, (b) type B, and (c) type C.
Pore distribution characteristics of meso- and macropores (2–100 nm)
The LPN2GA test results are shown in Table 2. The BET SSA (0.092–0.907 m2.g−1) and DFT pore volume (0.001–0.014 cm3.g−1) of all the samples are significantly different. The distribution of pore sizes of the N2-TPV and N2-SSA in a type A/B/C sample is shown in Figure 3. Compared to type A/B, 2–3 nm pores in type C pores are generally developed. The distribution of pore volume shows an obvious multimodality in which the peaks of the overall sample are all between 10 and 50 nm, indicating that the mesopores provide most of the pore volume (the percentage of pore volume for 2–10 nm and 10–50 nm is 7.24–27.3% and 48.0–73.0%, respectively). The peak position of pore volume gradually transformed into a larger size with the increase in coal rank. Compared to the IPV, the peak position of SSA transferred to a small pore with an increase in coal rank, which is specifically expressed as type A > type B > type C (Figure 3). Pores with a diameter of 10–50 nm provide the largest proportion of N2-SSA in type A (62.6%–72.3%), and pores with diameter of 2–10 nm provide the relatively highest quantity of N2-SSA in type C (49.0%–59.3%). The peak position of SSA in type B is relatively dispersed, and it is mainly provided by 2–50 nm pores. This occurs because the compaction of coal gradually increased with an increase in the depth of the coal seam (type C > type B > type A), which led to an increase in the metamorphic degree of coals. The continuous compression of the large pores is accompanied by a loss of oxygen functional groups and side chains and by the orderly arrangement of aromatic rings, which leads to an increase in the smaller pores and a decrease in the larger pores (Li et al., 2017) .
Pore characteristics of all the samples based on the density functional theory theory.
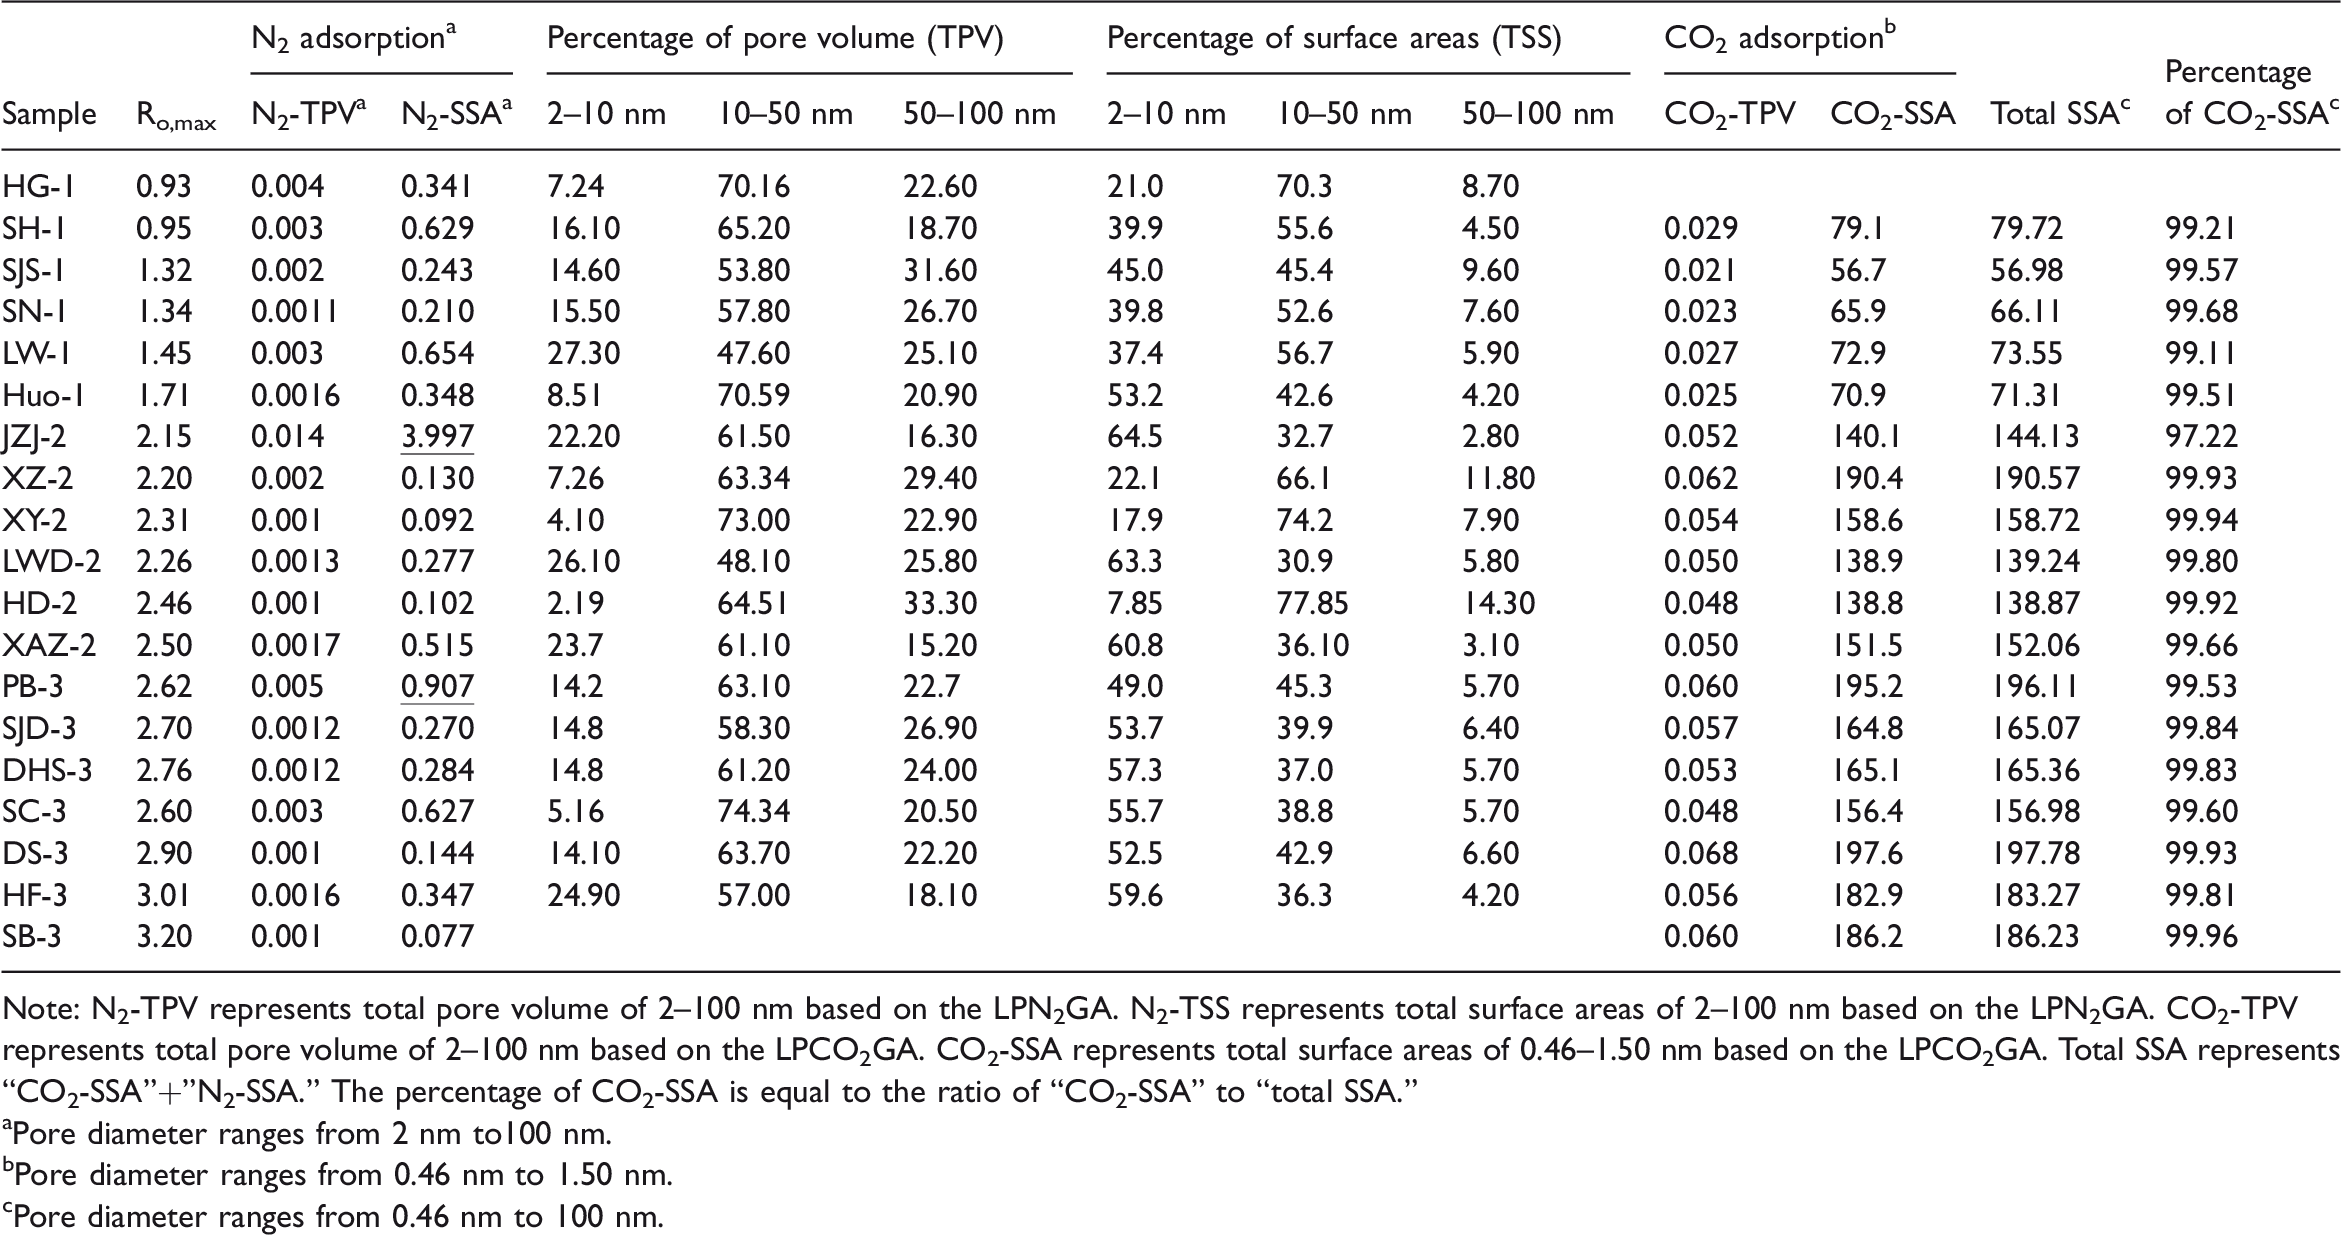
Note: N2-TPV represents total pore volume of 2–100 nm based on the LPN2GA. N2-TSS represents total surface areas of 2–100 nm based on the LPN2GA. CO2-TPV represents total pore volume of 2–100 nm based on the LPCO2GA. CO2-SSA represents total surface areas of 0.46–1.50 nm based on the LPCO2GA. Total SSA represents “CO2-SSA”+”N2-SSA.” The percentage of CO2-SSA is equal to the ratio of “CO2-SSA” to “total SSA.”
aPore diameter ranges from 2 nm to100 nm.
bPore diameter ranges from 0.46 nm to 1.50 nm.
cPore diameter ranges from 0.46 nm to 100 nm.
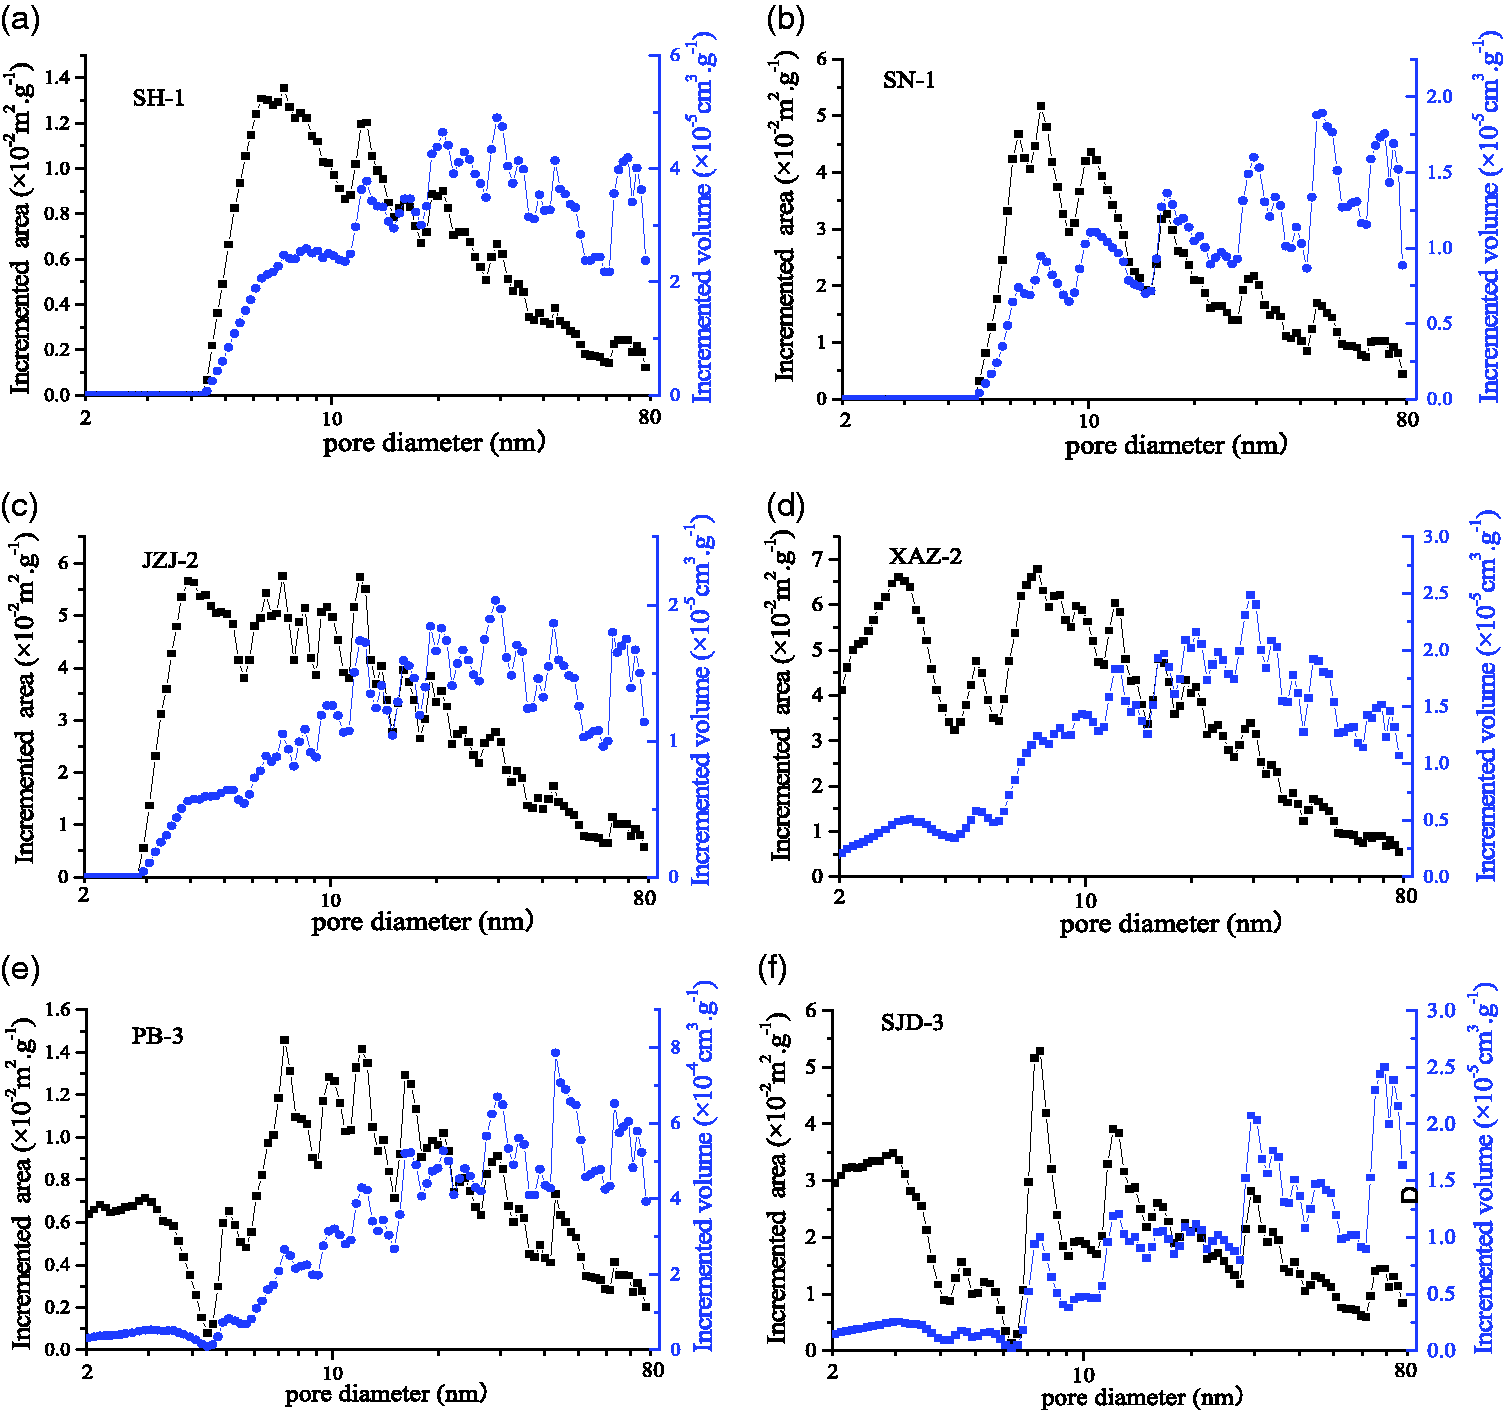
The distribution of incremental pore volume and specific surface area. (a and b) Type A, (c and d) type B, and (e and f) type C.
There is a positive correlation between N2-TPV and N2-SSA (Figure 4(a)). However, compared to that of micropores (Figure 7(b)), the SSA of meso- and macropores has a weak correlation with the increase in Ro,max (Figure 4(b)). An analysis shows that not only is the range in pore structure controlled by the degree of coal metamorphism, but it is also affected by the composition of parameters such as moisture and ash, making its pore structure more complex than micropores. The ash content of type B (average of approximately 13.07%) was generally higher than that of the type A/C samples, resulting in a relationship between total pore surface area and the degree of coal metamorphism that is “U-shaped” (Figure 4(b) and (c)). The correlation between the percentage of SSA of 2–10 nm pores and Ro,max shows that the linear relationship is significantly better than that of N2-SSA (Figure 4(b) to (d)), indicating that the control of coalification on the smaller pore structure is enhanced within the scope of the adsorption pores.
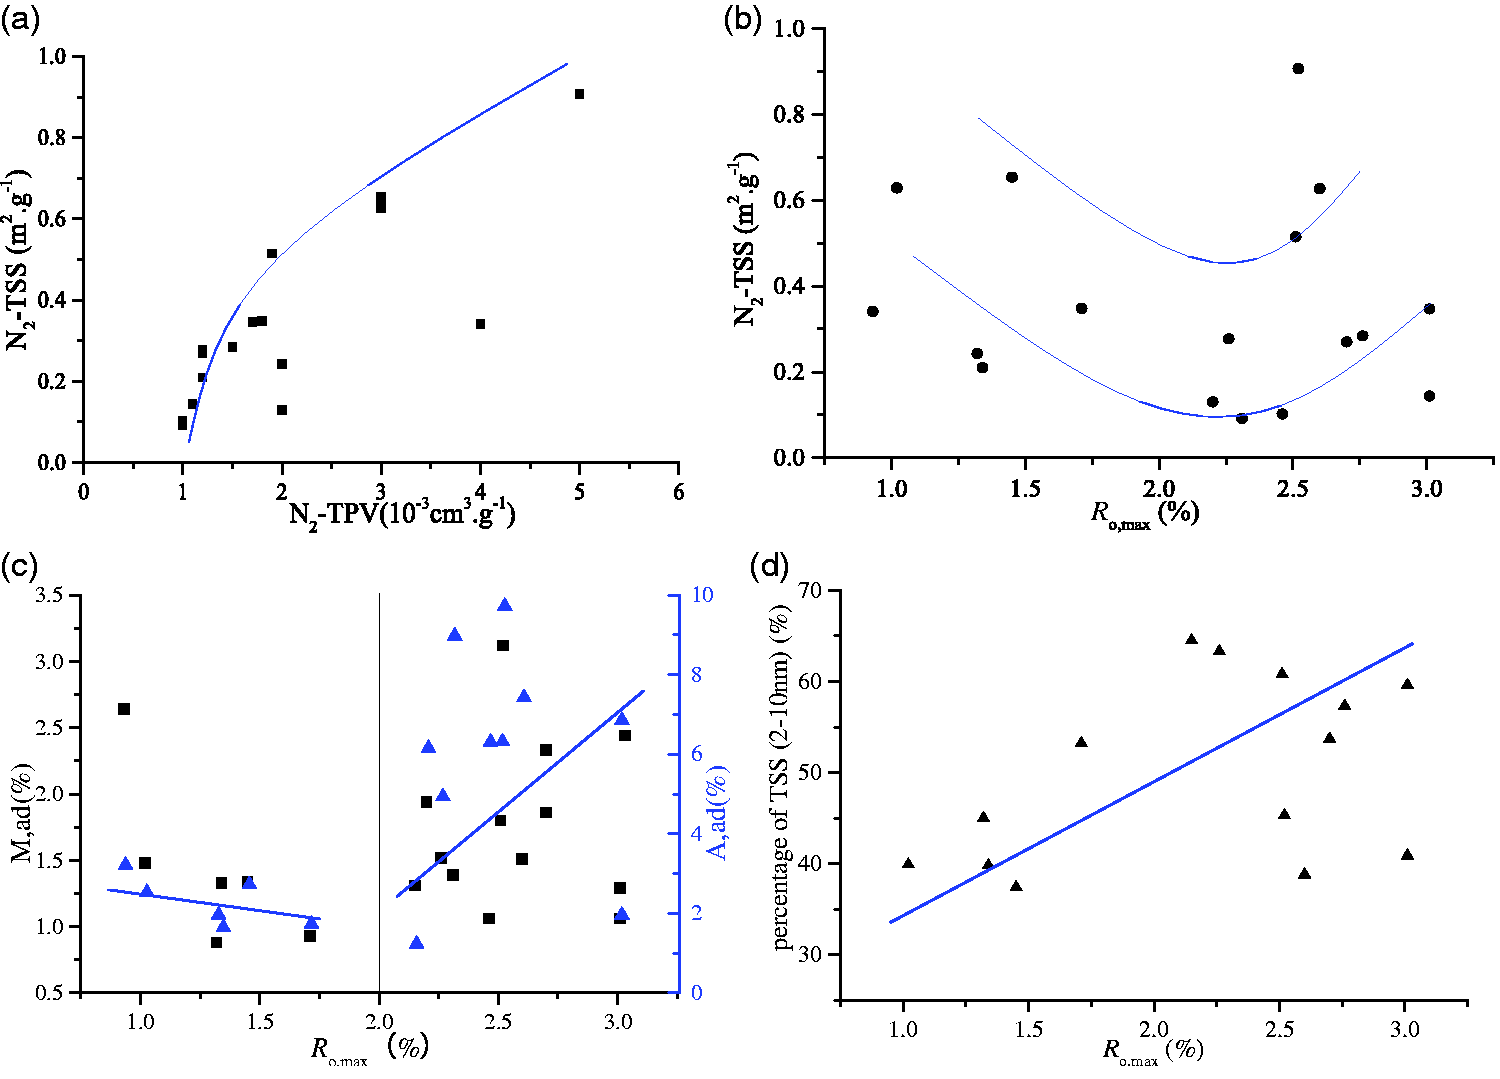
(a) Collection between N2-TPV and N2-SSA, (b) collection between Ro,max and N2-SSA, (c) collection between ash content moisture content and Ro,max, and (d) collection between the percentage of 2–10 nm pores of SSA and Ro,max. TSS: total surface area; TPV: total pore volume.
Pore distribution characteristics of micropores
The adsorption curves of different samples were compared and analyzed based on the LPCO2GA (Figure 5). The adsorption capacity of high-rank coal (12.43–19.54 cm3.g−1, on average 16.74 cm3.g−1) is much larger than that of the middle-rank samples (3.42–6.12 cm3.g−1, on average 4.12 cm3.g−1). The adsorption capacity gradually increases with the increase in coal rank, that is, type C > type B > type A. Table 2 shows that the SSA (CO2-SSA) of each sample is 56.73–195.20 cm3.g−1, and the pore volume (CO2-TPV) of the sample is 0.029–0.068 ml.g−1. The change in the CO2-SSA of micropores among various types of samples is more obvious than that of the CO2-TPV. Among them, the samples XZ-2 and PB-3 SSA were more than 190 cm3.g−1, which was much higher than that of the other coal-grade samples. This result was mainly related to the microstructural development of tectonic coal. Comparing the results of the LPN2GA test, the micropores provide a large proportion of the SSA of the adsorption pores (approximately 97.22% to 99.96%) (Table 2).
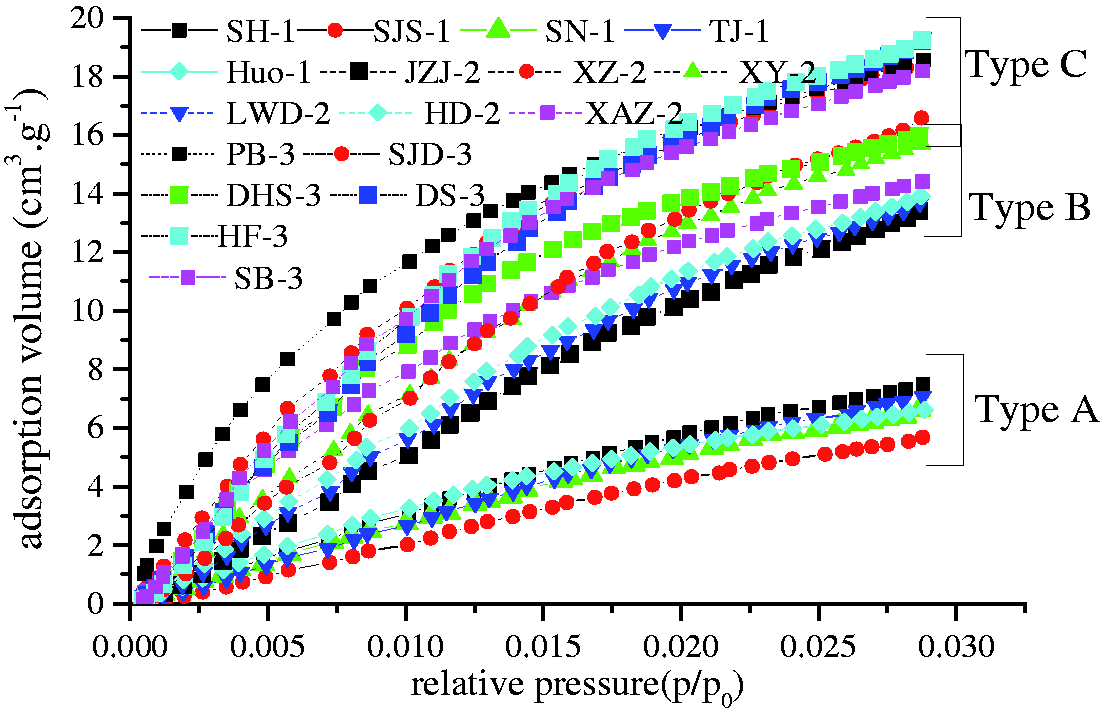
CO2 adsorption curves for different types of samples.
Figure 6 shows that the PSD of micropores (0.48–1.50 nm) is “multimodal.” The pore diameter of micropores gradually changed from “multimodal” (type A) to “trimodal” (type B) and “bimodal” (type C). The PSDs of micropores are represented by three typical peaks, which are defined as peak 1 (0.48–0.53 nm), peak 2 (0.56–0.67 nm), and peak 3 (0.80–0.84 nm). The percentages of the TPV and SSA of the pores corresponding to peaks 1 and 2 increase, and peak 3 is negative (the percentage of SSA of <0.62 nm for type A/B/C is 49.7–66.8%, 51.1–77.7%, and 66.6–82.2%, respectively). This shows that the dominant diameter tends to decrease and heterogeneity gradually increases with increasing coal metamorphism. Compared with Figure 3, there is a significant linear positive correlation between CO2-SSA and CO2-TPV, and the distribution characteristics of SSA of micropores is highly similar to that of TPV, indicating that the surface heterogeneity and volume heterogeneity have a high degree of consistency (Figures 6 and 7).
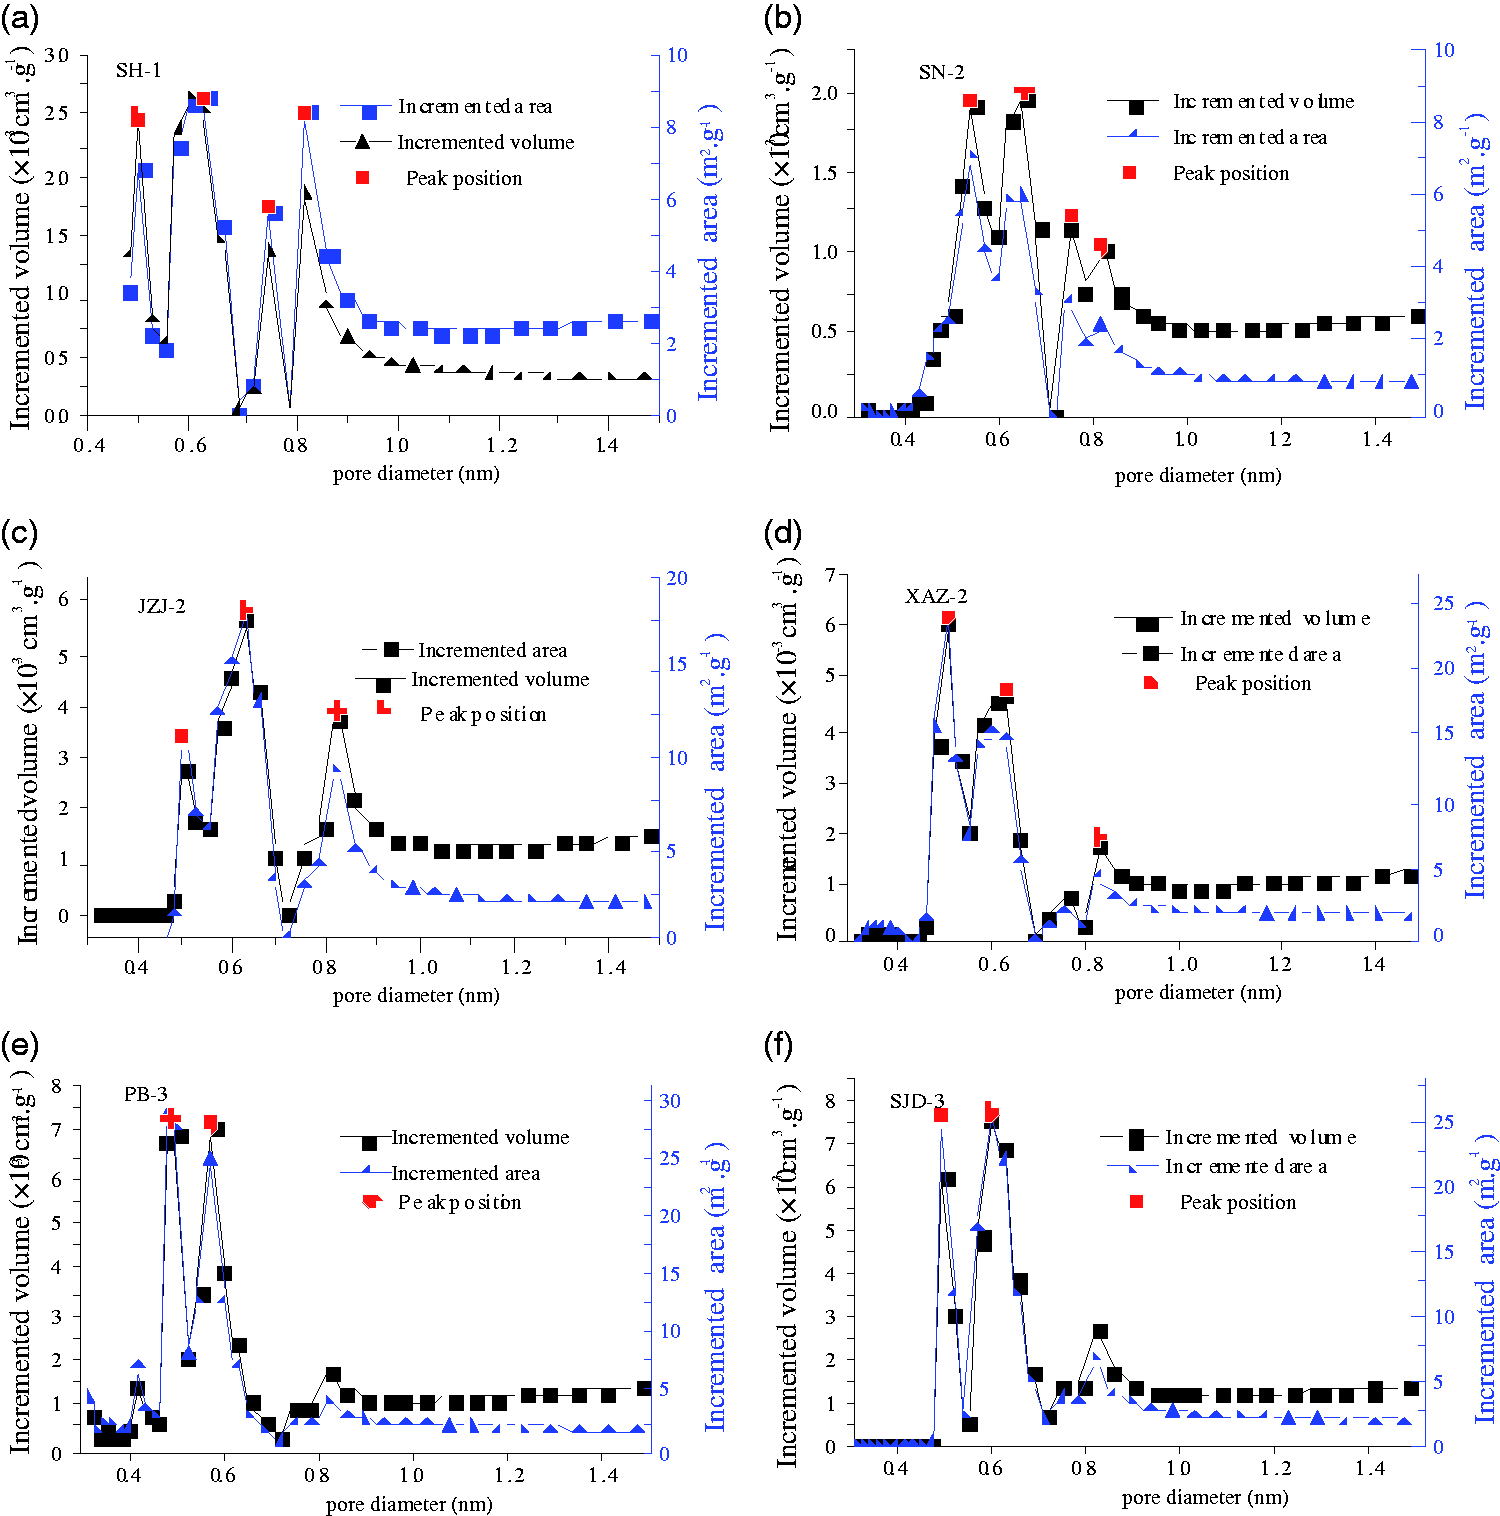
Distribution characteristics of SSA and TPV in typical samples. (a and b) Type A, (c and d) type B, and (e and f) type C.
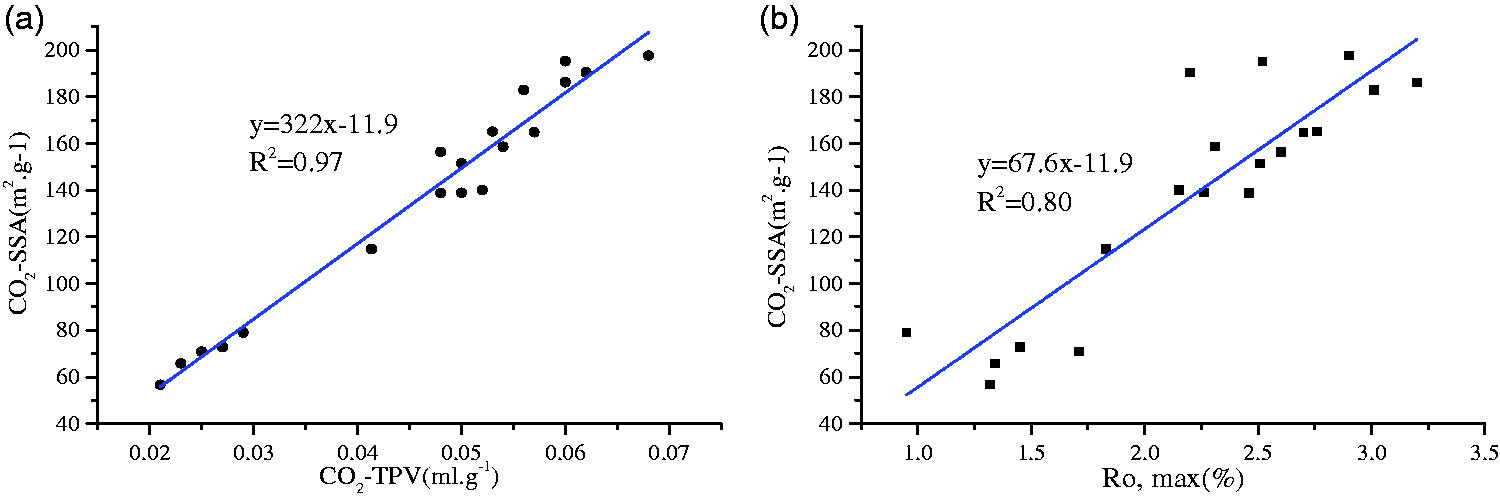
Collection between pore volume and surface area. (a) Collection between CO2-SSA and CO2-TPV and (b) collection between CO2-SSA and Ro,max. SSA: specific surface area; TPV: total pore volume.
Fractal characteristics of meso- and macropores
Fractal results of meso- and macropores
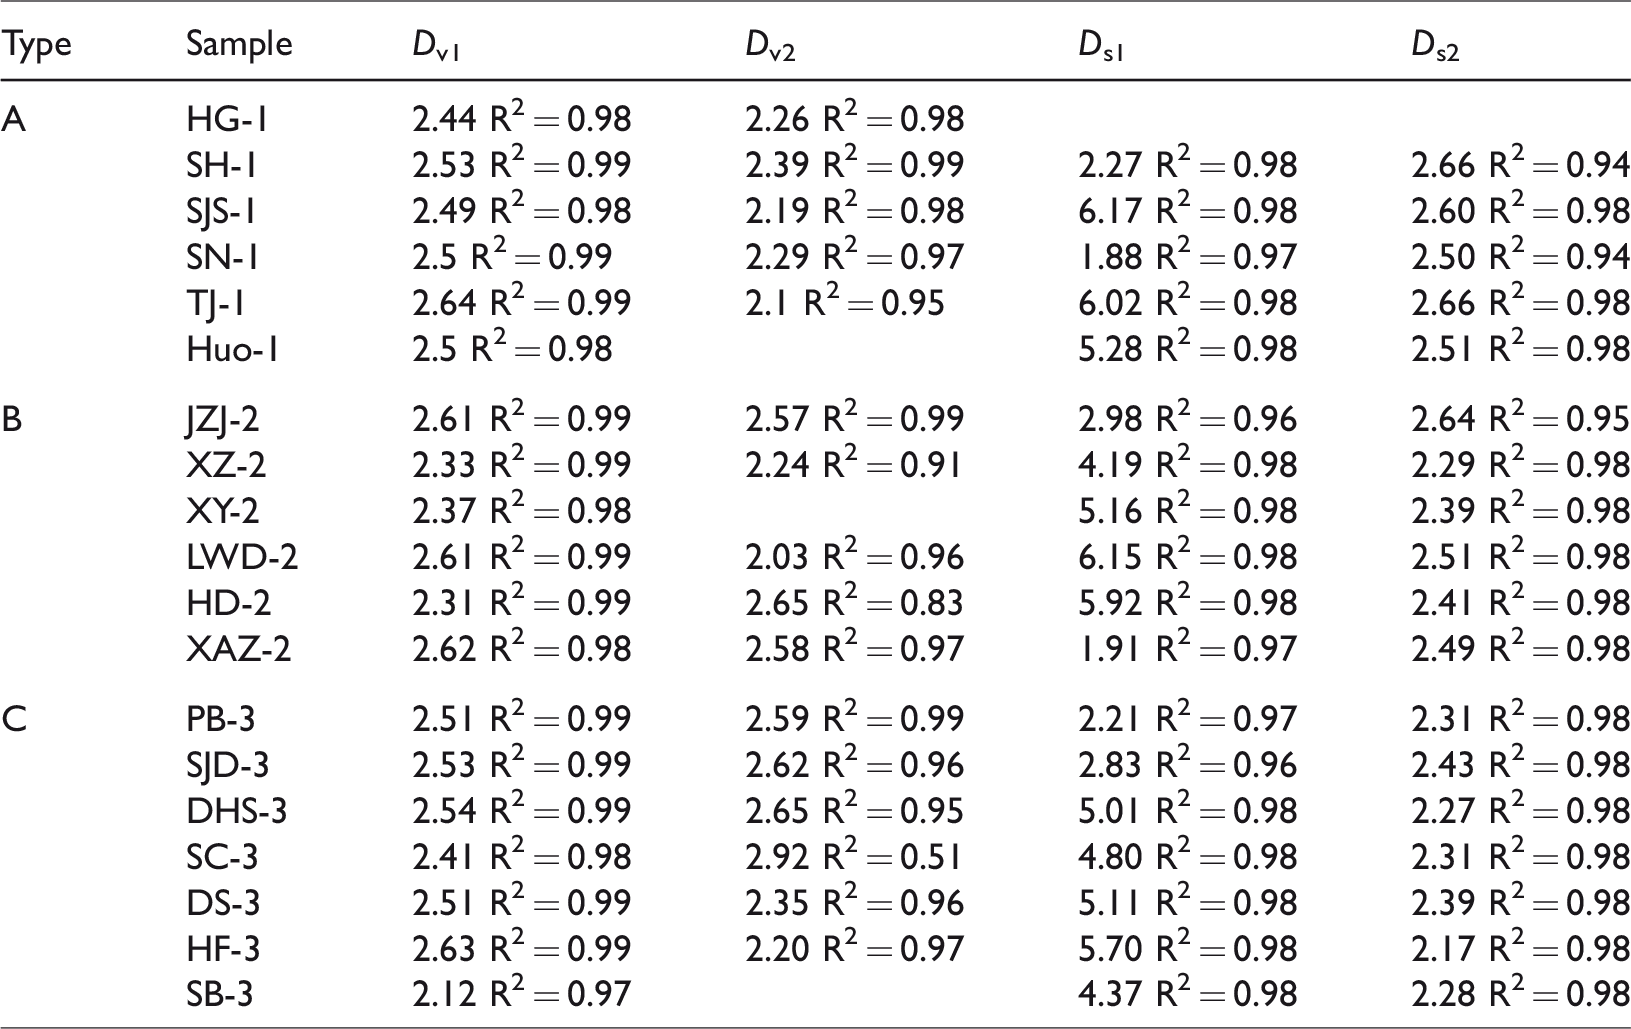
Figure 8 shows that there is a stepwise linear relationship with p/p0 = 0.50 (corresponding to a pore size of approximately 4 nm) and the R2 is greater than 0.96 and 0.98. Each sample has an obvious fractal feature over the entire pressure range. According to Table 3, Dv1 is 2.31 to 2.64 and Dv2 is 2.03 to 2.92. Compared with Dv1, the Dv2 of high-rank coal samples is greater than that of middle-rank coal samples.
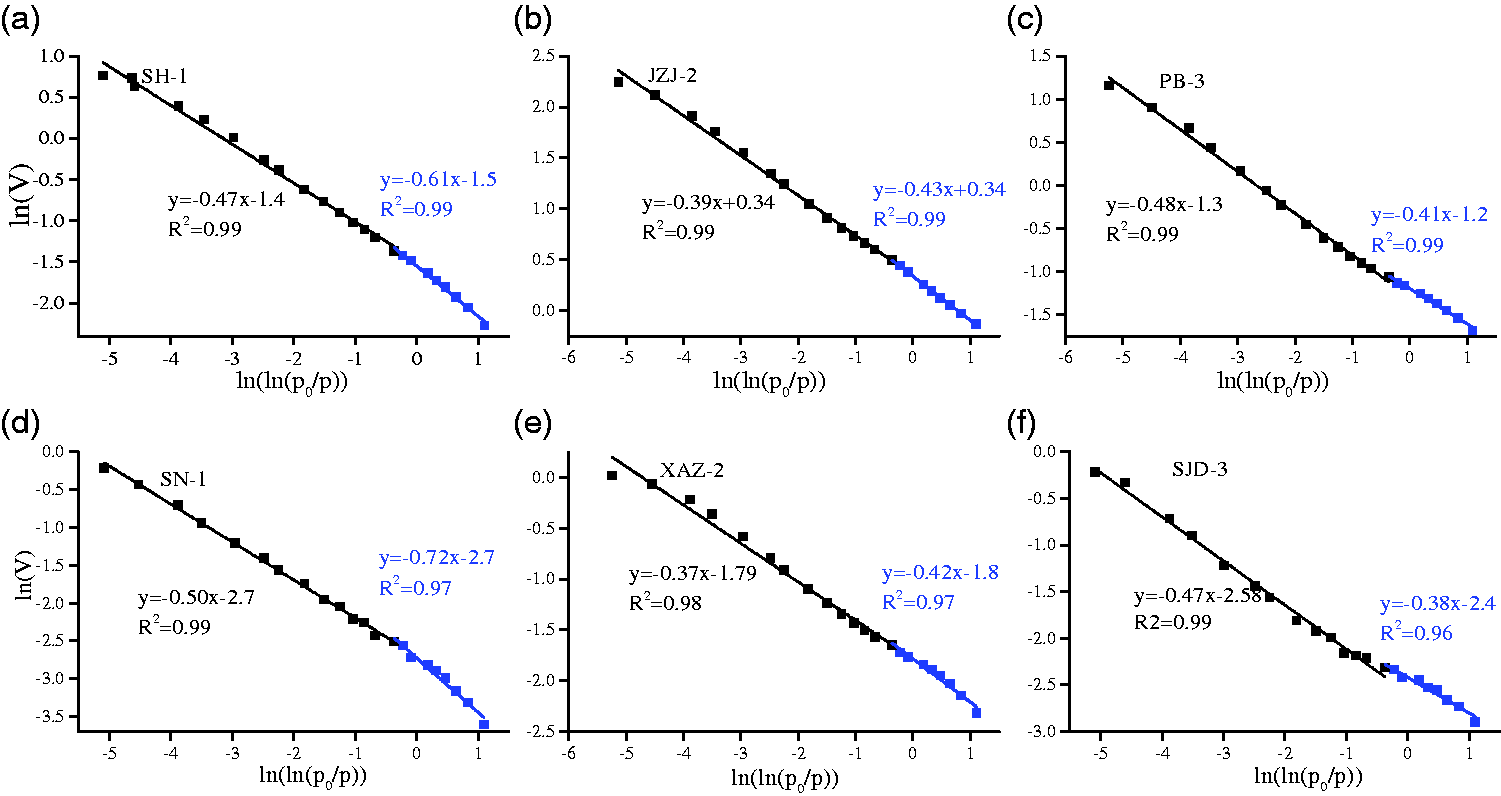
Correlation between ln(V) and ln(ln(p0/p. (a and b) Type A, (c and d) type B, and (e and f) type C.
Fractal dimension of different sample types.
A comparison of coal samples (0.50% < Ro,max < 0.70%) in Fu et al. (2017) with the middle–high rank coal samples in this study shows that Dv1 and Dv2 have a linear positive correlation with low-rank coals and a weak negative correlation with middle–high rank coals. The influential factors of the fractal characteristics of middle–high rank coal reservoirs are more complex than that of low-rank coals (Figure 9(a) and (b)).
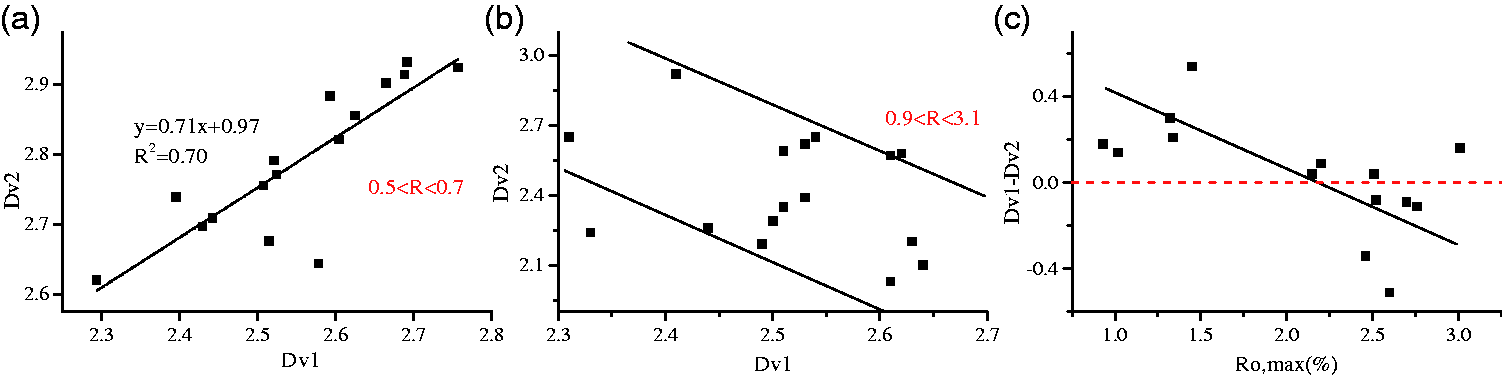
Correlation between Dv1 and Dv2. (a) Correlation between Dv1 and Dv2 of low-rank coals in the eastern Ordos Basin, (b) correlation between Dv1 and Dv2 of middle–high rank coals, and (c) correlation between Dv1–Dv2 and Ro,max.
Related literature has proved that Dv1 can reflect the volumetric roughness of pore structure and can characterize the pore morphology of the sample, and Dv2 reflects the surface roughness of the pore structure and can characterize the pore surface morphology of samples (Xu et al., 2010; Zhu et al., 2016). Samples of type A represented by SN-1/SH-1, Dv1 > Dv2 (Figure 8), and Dv1–Dv2 between 0.18 and 0.54 indicate that the volume heterogeneity is greater than the surface heterogeneity in this sample. Dv1 and Dv2 tend to be consistent for the type B samples with the increase in coal rank, and Dv1–Dv2 is between −0.34 and 0.09. For type C, Dv1 < Dv2 is represented by PB-3/SJD-3; thus, the overall performance of the sample range is that the Dv1/Dv2 difference gradually decreases with increasing coal rank (Figure 9(c)).
Relationship between fractal dimension and pore structural parameters of meso- and macropores
Figure 10 shows that Dv1, Dv2, and pore structure parameters have a distinct correlation. There is no obvious linear relationship between Dv2 and the pore parameters (TPV and SSA) in each sample (Figure 10(a) and (b)). Compared to Dv2, Dv1 has a good correlation with each parameter, and N2-TPV and N2-SSA gradually increase with the increasing Dv1. Meanwhile, Dv1 has a significant positive correlation with the pore structure of pores in the range of 2–10 nm. The correlation with the percentage of TPV in the range of 2–10 nm was significantly greater than the percentage of stage SSA (R2 values were 0.88 and 0.70, respectively), indicating that Dv1 is mainly related to the pore volume of 2–10 nm pores (Figure 10(c) and (d)). Based on the aforementioned analysis, Dv1 can be used to characterize pore volume heterogeneity in the range of 2–10 nm.
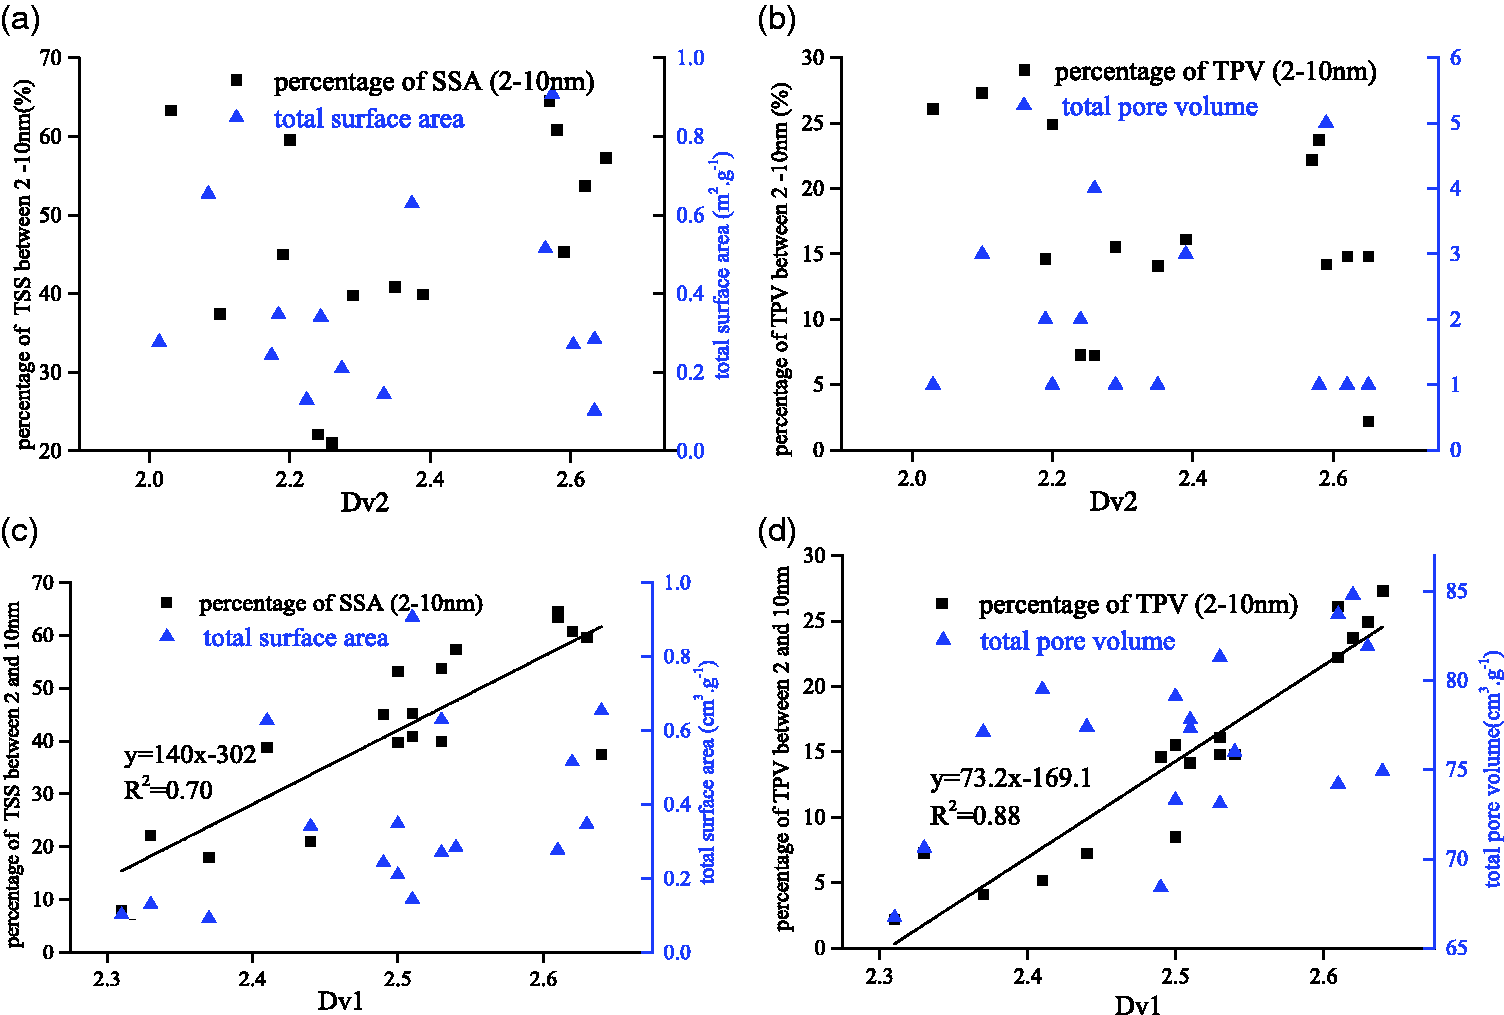
Collection between fractal dimension and pore structure. (a) Relationship between Dv2 and N2-SSA, (b) relationship between Dv2 and N2-TPV, (c) relationship between Dv1 and N2-SSA, and (d) relationship between Dv1 and N2-TPV. SSA: specific surface area; TPV: total pore volume.
The content of fixed carbon gradually increases and volatile content gradually decreases with increasing metamorphic degree, while Fcd/Vdaf continuously increases. Figure 11(a) and (b) shows that Dv2 is positively correlated with it, indicating that low-volatile and high-rank coal reservoirs tend to have high surface complexity. There is no obvious relationship between Dv1 and Fcd/Vdaf, the main reason being that rank-controlled pore structure, ash, moisture, and other factors have different effects on Dv1 (Yao et al., 2008).
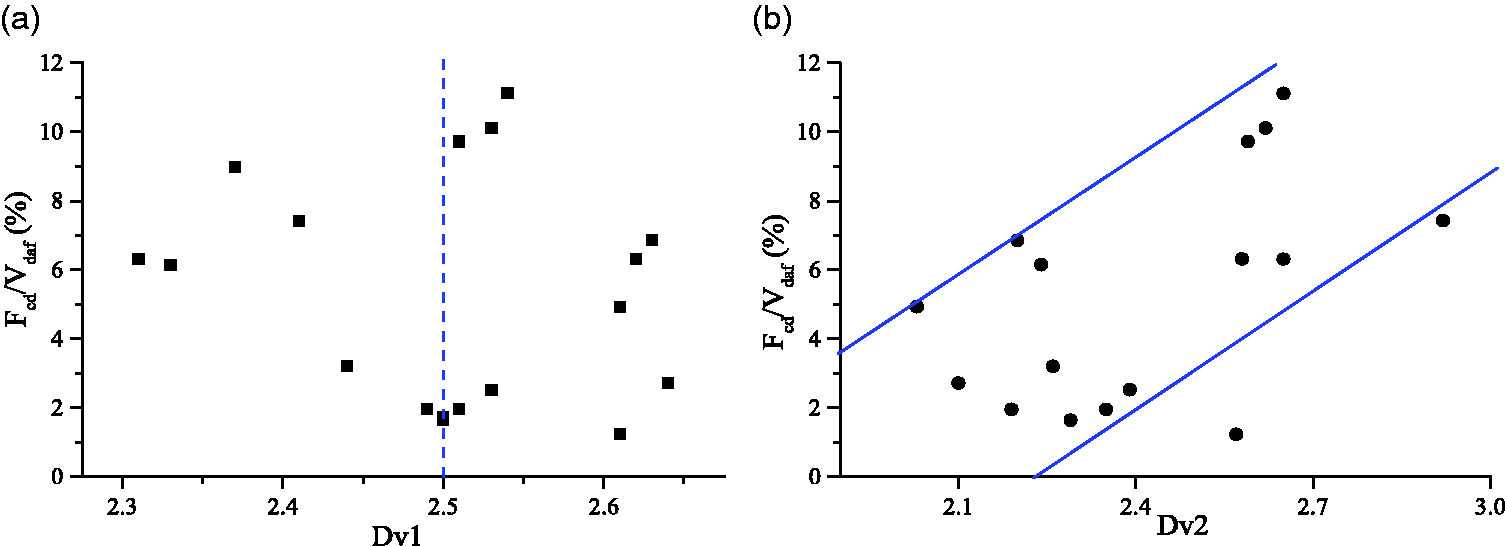
Relationship between fractal dimension and proximate analysis. (a) Relationship between f Dv1 and Fcd/Vdaf and (b) relationship between f Dv2 and Fcd/Vdaf.
Fractal characteristics of micropores
Fractal results of micropores
Table 2 shows that the micropores have the largest proportion of total SSA (percentage of CO2-SSA is 97.2% to 99.9%). Quantitative fractal study of micropores characteristics is of great significance for CBM accumulation. Using formula (2) to calculate the fractal characteristics of micropores, Figure 12 shows that the fractal characteristics are clearly different with ln( r ) = −0.4 (d = 0.67 nm) as the approximate demarcation point, corresponding to peak 2 (0.56–0.67 nm). Thus, the average peak d = 0.62 nm is considered the fractal boundary point. Figure 12 shows that Ds1 is between 1.80 and 3.20, which is inconsistent with the conclusion of 2 < D < 3 (Posnansky et al., 2012). The analysis shows that this phenomenon is mainly due to the testing process. There are few pore data points in the 0.47–0.62 nm range, and the calculation range is only 0.15 nm, resulting in a bias in the calculation process. As a result, the calculation results are inconsistent with the theory. Based on these results, this study only describes the fractal features of micropores in the range of >0.62 nm.
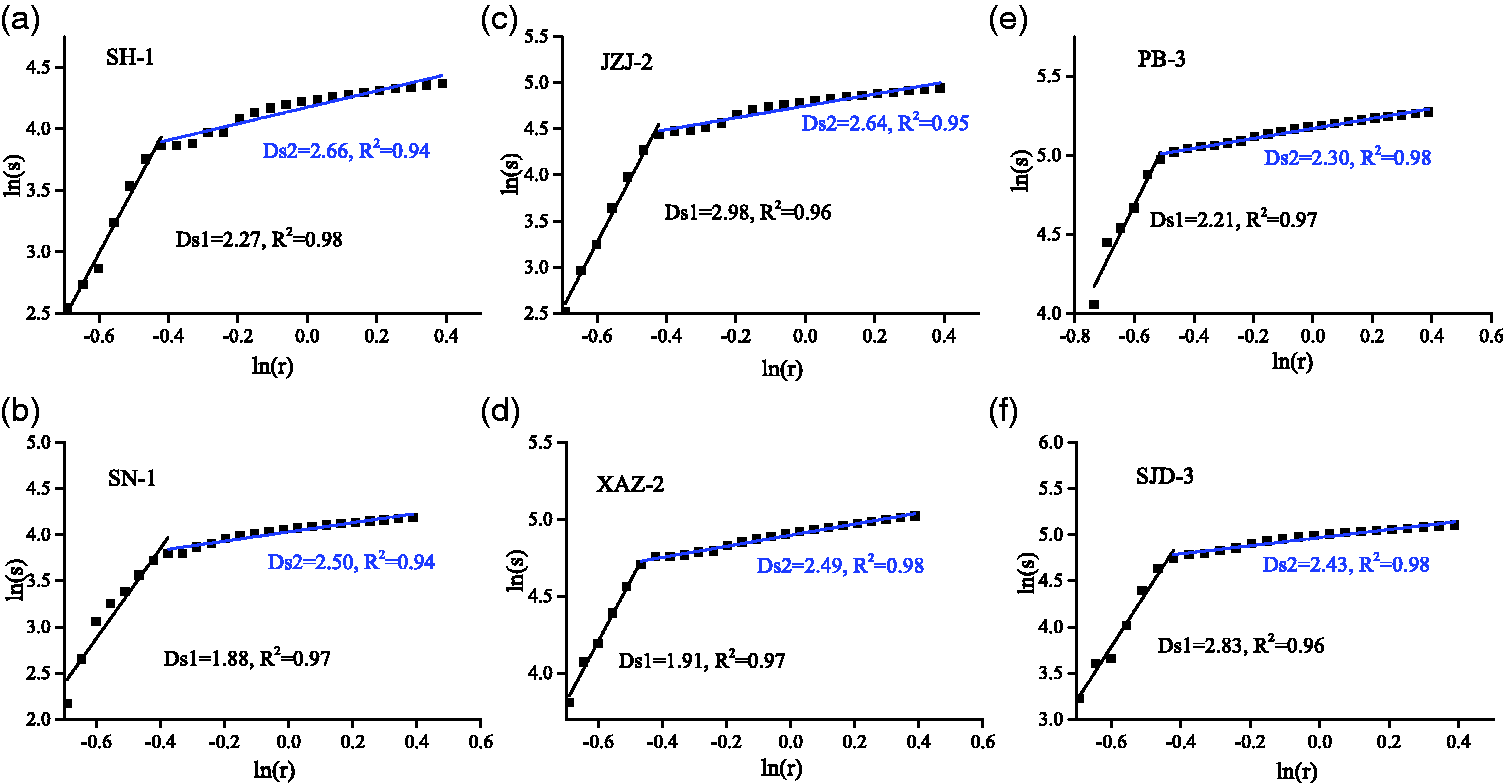
Distribution relationship between ln(s) and ln(r) in different types of typical middle–high rank coal samples. (a and b) Type A, (c and d), type B, and (e and f), type C.
Ds2 is between 2.17 and 2.66, with obvious fractal characteristics. It decreased with increasing coal rank, that is, type A samples (2.50–2.66, average 2.59) > type B samples (2.29–2.64, average 2.43) > type C samples (2.17–2.43, average 2.31) (Table 3).
Relationship between fractal dimension and pore structural parameters of micropores
Figure 13 shows that the surface fractal dimension Ds2 has a significant correlation with the micropore structural parameters, further indicating that Ds2 can be used to characterize the pore structure of micropores. There was a negative correlation between Ds2 and CO2-TPV/SSA, indicating that the middle–high rank coal reservoirs with higher SSAs in the study area have smaller Ds2 values (Figure 13(a) and (b)). Meanwhile, there was a positive correlation between Ds2 and the average pore size of the micropores, indicating that higher average pore size has a higher Ds2 (Figure 13(c)). Statistically, the relationship between the percentage of the CO2-SSA in the range of 0.62–1.50 nm and Ds2 shows that there is a positive correlation (R2 = 0.89). The discussion in the section ‘Pore distribution characteristics of micropores’ also shows that the degree of development of micropores is continuously increasing with the increase in coal metamorphic degree, and the dominant diameter gradually shifts from 0.62–1.50 nm to <0.6 nm. During this process, the decreasing Ds2 indicates that the heterogeneity of the pore surface in the range of 0.62–1.50 nm tends to gradually decrease. Similarly, Figure 13(d) shows that the percentage of the pore SSA in the range of <0.62 nm gradually increases as the Ds2 continuously decreases, and the heterogeneity of the pore surface in this range tends to be complicated.
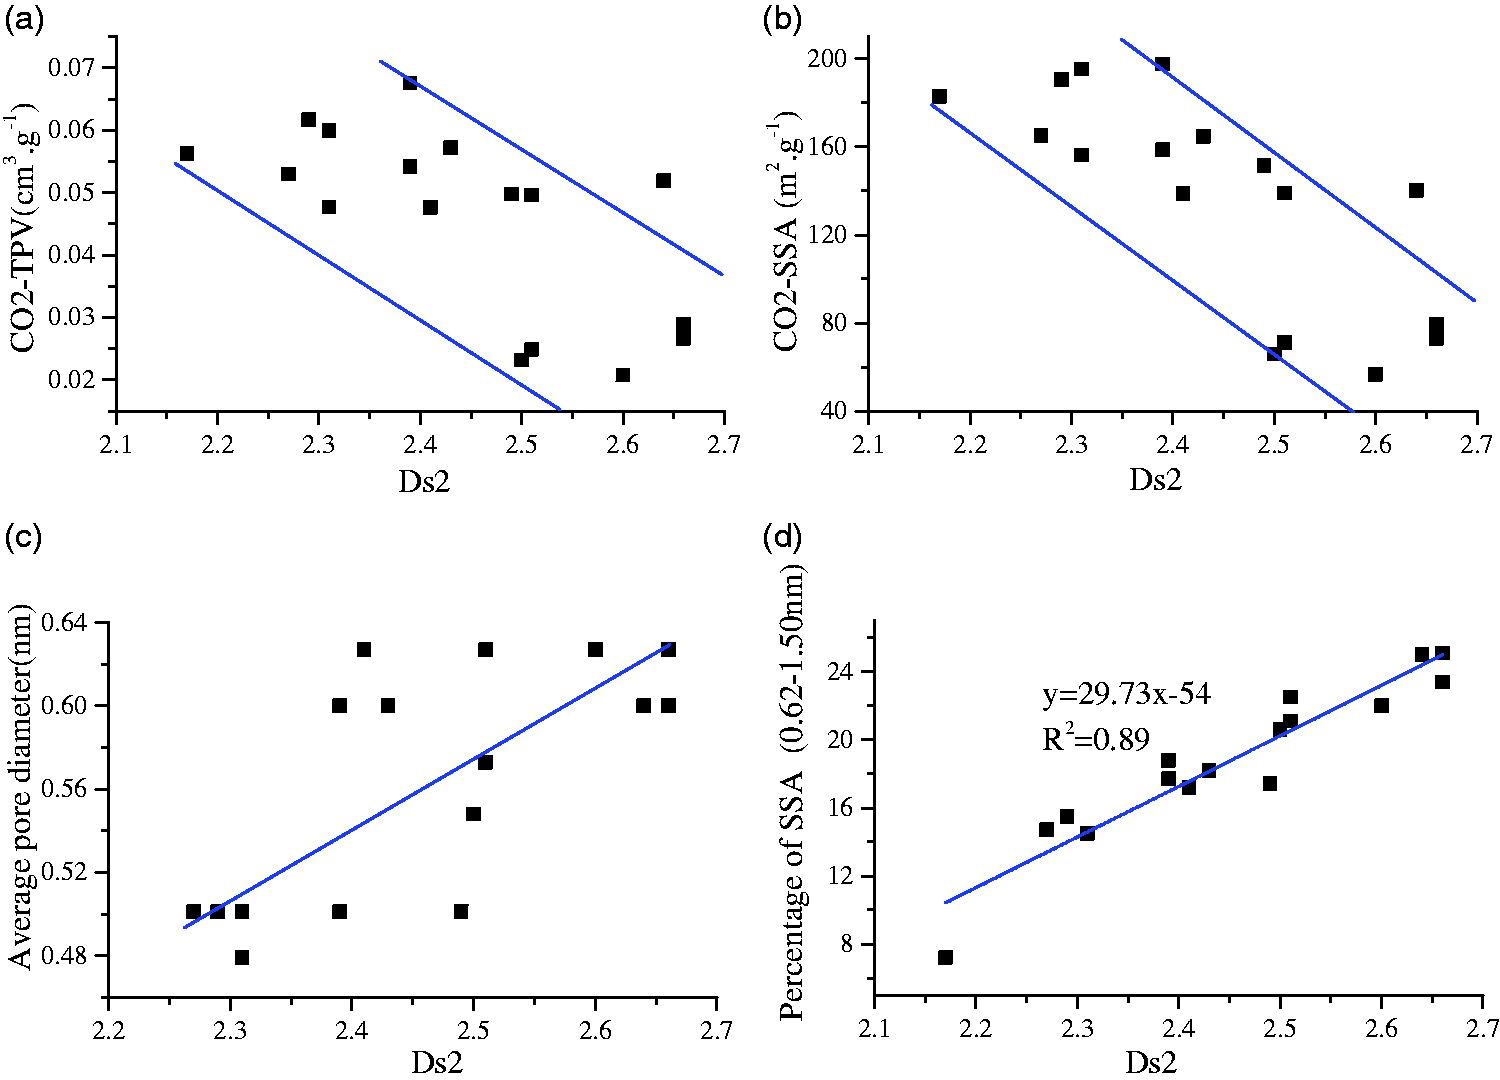
Collection between fractal dimension and pore structure. (a) Relationship between Ds2 and CO2-TPV, (b) relationship between Ds2 and CO2-SSA, (c) relationship between Ds2 and average diameter, and (d) relationship between Ds2 and percentage of CO2-SSA in the range of 0.62-1.50 nm. SSA: specific surface area; TPV: total pore volume.
Relationship between fractal characteristics of micropores and meso–macropores
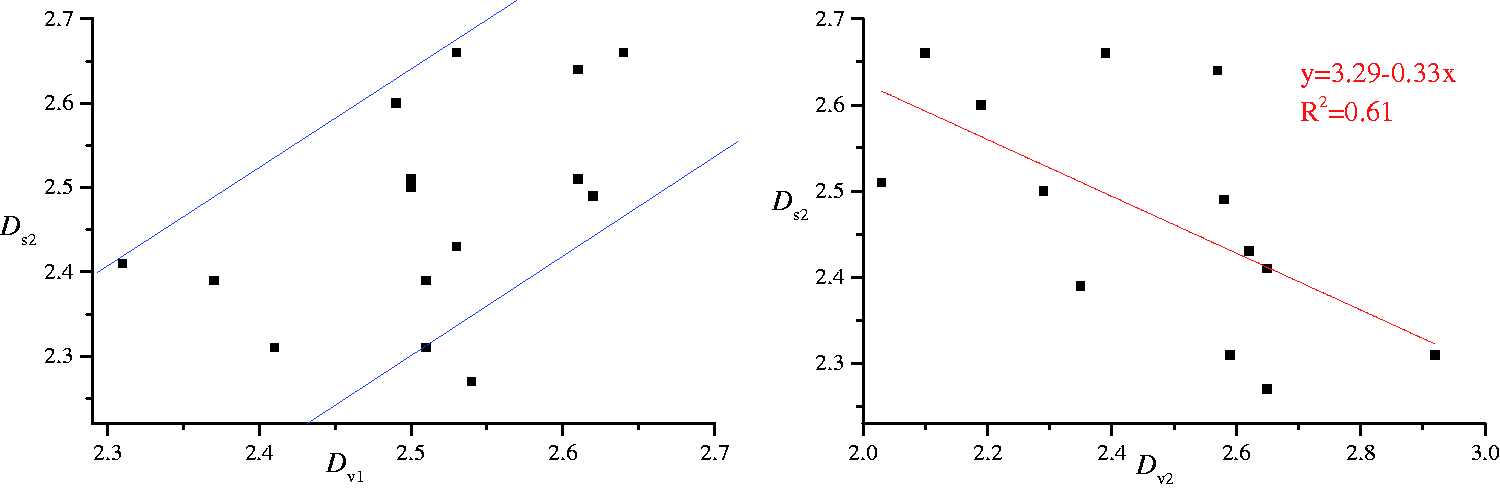
The fractal characteristics of micropores and meso–macropores are systematically compared and analyzed. Dv1 represents the heterogeneity of pore volume between 2 and 10 nm, and it is weakly negatively correlated with Dv2 (Figure 9(b)). It shows that the heterogeneity of pore volume and surface area of medium–high coal reservoirs are not homogeneous. The comprehensive comparison of Figure 14(a) and (b) shows that there is a significant relationship between the pore fractal characteristics of 2–100 nm and those of <2 nm. Specifically, Dv1 and Ds2 have weak positive correlation, while Dv2 and Ds2 have obvious negative linear relationship. The reason for the analysis is that Ds2 can be used to characterize the pore surface heterogeneity in the micropores ranging from 0.62 to 1.50 nm and has a good correlation with the pore parameters (CO2-TPV, CO2-SSA, and average pore size). Figure 11(a) and (b) shows that Dv2 is positively correlated with metamorphic degree, indicating that high-rank coal reservoirs tend to have high surface complexity in 2–100 nm pores. The above analysis shows that Dv2 and Ds2, as parameters that characterize the heterogeneity of pore surface area at different stages, are all affected by the degree of coal metamorphism. Therefore, there is a clear linear relationship between the two parameters. Different from Dv2, the correlation with the percentage of TPV in the range of 2–10 nm, and Dv1 was significantly greater than the percentage of stage SSA (R2 values were 0.88 and 0.70, respectively), so its correlation with Ds2 is significantly weaker than Dv2.
Relationship between fractal characteristics of micropores and meso–macropores. (a) Relationship between Ds2 and Dv1 and (b) the relationship between Ds2 and Dv2.
Conclusion
In the 2–100 nm adsorption pore, as the degree of coal metamorphism increases, pores of smaller pores develop gradually whose the SSA of pores is generally larger, but the pore volume that can be provided is very limited. So the peak position of pore volume gradually transformed into a larger size and peak position of SSA transferred to a smaller pore with an increase in coal rank. N2-SSA was weakly correlated with N2-TPV, where the relationship between the surface area parameters of 2–10 nm pores and Ro,max was significantly better than that of N2-SSA. It was shown that the effect of coalification on small pore size was stronger in the range of 2–100 nm. Micropores (0.48–1.50 nm) provide a large proportion of the total SSA. The PSD of micropores gradually changed from “multimodal” (A-type) to “trimodal” (B-type) and “double-peak” (C-type). CO2-SSA and CO2-TPV showed a significant linear positive correlation, and the distribution of TPV and SSA during this stage is highly consistent, indicating that the pore heterogeneity of the micropores is weaker than that of the macropores. Parameters Dv1/Dv2/Ds2 can be used to characterize the pore structure of the adsorption pores. Dv1 can be used to characterize 2–10 nm pore volume heterogeneity. Dv2 gradually increased with the increase in Fcd/Vdaf and was mainly controlled by metamorphism degree. With the coal rank increase, volume heterogeneity gradually decreased and surface heterogeneity increased during the stage of meso- and macropores. Ds2 can be used to characterize the pore surface heterogeneity in the micropores ranging from 0.62 to 1.50 nm and has a good correlation with the pore parameters (CO2-TPV, CO2-SSA, and average pore size). Compared to the 2–100 nm pores, the micropore structural parameters are mainly controlled by the degree of metamorphism. Dv1/Dv2/Ds2 can provide a theoretical basis for studying the pore structure compatibility of adsorption pores in coal reservoirs. The adsorption capacity of the type C and B reservoirs in the Laochang mining area is much higher than that of the type A reservoirs. However, it is more difficult for the complex structure to undergo CH4 desorption than the latter. Meanwhile, the variability of the pore structure and type is not favorable to the multilayer combination of CBM with respect to the A-type and C-type reservoirs.
Footnotes
Acknowledgements
The authors also sincerely appreciate the editors and the reviewers for helping to improve the manuscript. In addition, Junjian Zhang wants to thanks, in particular, the constant encouragement received from my wife – Mengwei Liu during the writing and submission process of this paper.
Declaration of conflicting interests
The author(s) declared no potential conflicts of interest with respect to the research, authorship, and/or publication of this article.
Funding
The author(s) disclosed receipt of the following financial support for the research, authorship, and/or publication of this article: This research was sponsored by the Scientific Research of the Key Laboratory of Coalbed Methane Resources and Reservoir Formation Process, the Ministry of Education (China University of Mining and Technology) (no. 2017-003), and the Major National Science and Technology Projects (no. 2016ZX05044002-003).