
Abstract
The hysteresis characteristics of gaseous water of concrete materials in the atmosphere environment are closely associated with the properties of its pore structure. Concrete exhibits variations between adsorbing and desorbing behavior of water vapor. This study conducted experiments on the adsorption and desorption of water vapor of concrete materials to investigate the respective processes. The hysteresis curve obtained from these tests provides insights into the characteristics of the pore structure of concrete material. The results indicate that the desorption activation energy of concrete material exceeds that of the first layer's adsorption energy, making water vapor desorption from inner pore walls more challenging than its adsorption. According to the isothermal adsorption and desorption hysteresis curves associated with humidity variations, the volumetric ratio of different size and shape pores can be determined. In concrete materials, capillary pores account for 22%–43% of the total pore volume, and large-volume pores with narrow throats range from 15% to 25%. For concrete with a certain water-binder ratio, an increase in fly ash content leads to a higher proportion of capillary pores. Besides, when the fly ash content remains constant, an increase in the water-binder ratio results in a decrease in the volume ratio of capillary pores and large pores with narrow throat.
Introduction
The BET theory of gas adsorption and desorption, which has been widely utilized in various material fields(Shen et al., 2021) for over 80 years (Sentaro et al., 1976), still faces limitations when applied to cement-based materials. Firstly, cement-based materials possess unique physical structural characteristics that impose significant constraints on the selection of adsorbed gases. Secondly, conducting water vapor adsorption testing under normal temperature conditions requires a substantial time investment, hindering progress in this area research (Xi et al., 1994). Therefore, the investigation into the water vapor adsorption characteristics of cement-based materials has consistently been an area in need of enhancement.
The hysteresis property is a crucial factor reflecting the hygroscopic behavior of cement-based materials (Sentaro et al., 1976). Although the exact cause of this phenomenon remains unclear, two prevailing viewpoints suggest that it is determined by either capillary condensation (Sing, 1985) or pore shape characteristics such as ink bottle-shaped pores (Espinosa and Franke, 2006b) and large-volume pores with narrow throats (Wu et al., 2014). Furthermore, it is generally accepted that hysteresis in the processes of adsorption and desorption arises from numerous factors, such as capillary interactions occurring during condensation and evaporation within pores, chemical moisture adsorption, the application of various drying methods, and chemical aging (Espinosa and Franke, 2006a). In particular, the occupation of pore throats by water in pores smaller than 10 nm in diameter leads to a reduction in pore connectivity (Zhao et al., 2022), subsequently causing a decrease in the desorption capacity of water vapor. This, in turn, results in differences between the amounts of adsorption and desorption.
The hysteresis curve is derived by combining the adsorption and desorption curves, and it can be classified into four main types (Espinosa and Franke, 2006b) with five subcategories. The pore shape characteristics of porous structures can be inferred from the types and shapes of hysteresis curves. Due to limited research on the adsorption and desorption hysteresis properties of cement-based porous materials, investigating the adsorption and desorption hysteresis curves of cement-based materials become a meaningful endeavor to reveal the pore characteristics of concrete materials.
The pore structure of concrete materials serves as the primary site for water vapor adsorption and storage, exerting a significant influence on their durability, including frost resistance and ion erosion resistance. The desorption characteristics of concrete materials are influenced by environmental humidity, while the composition of the material itself and the incorporation of mineral admixtures also impact these characteristics. The volume ratio of pores with narrow throat and capillary pores to total pore volume determines the water vapor adsorption capacity of concrete materials, directly affecting their anti-freezing performance and anti-erosion performance. The phenomenon of capillary condensation in concrete material's pores and the presence of narrow pore throats are evidenced by the non-coincidence between the desorption curve and adsorption curve on the water vapor adsorption/desorption graph, known as the hysteresis phenomenon. The hysteresis curves for desorption and adsorption serve as a basis for analyzing the pore shape of pores with narrow throat and capillary pores. Previous studies have primarily focused on analyzing adsorption isotherm curves, neglecting sufficient attention to examining desorption isotherms. As a result, there exists an oversight when studying pore structure characteristics with regard to quantitatively analyzing pores of large volume with narrow throat and capillary pores that significantly impact durability.
In this study, we will conduct water vapor adsorption tests on dry concrete samples and desorption tests on saturated concrete samples to analyze the thermal dynamic processes of adsorption and desorption. Based on the existing empirical formula for adsorption thermal dynamics parameters derived from concrete water vapor adsorption tests, the water vapor adsorption thermal dynamics parameters of concrete materials will be calculated and their hygroscopic characteristics will be analyzed. Based on the desorption isotherm curve, the desorption rate is calculated, and the impact of the water-binder ratio and fly ash content on the desorption rate is analyzed. By combining desorption isotherm with the results of concrete material's water vapor adsorption isotherm, a hysteresis curve considering environmental humidity was obtained, enabling quantification of capillary pores and content of large pores with narrow throats.
Experiments procedure
Specimen preparation
Material and concrete mix ratio
The materials used in the concrete test block include reference cement, river sand, gravel, tap water, and class II fly ash. Water-binder ratios of 0.3, 0.4, and 0.5 have been selected while the fly ash content ranges from 0% to 30%. The blending proportions for the 12 groups of concrete materials are presented in Table 1.
Composition of concrete mixes used for water vapor adsorption and desorption.

The specimen number in table 1 consists of two parts. The first part represents the water-binder ratio, and the second part indicates the percentage of fly ash incorporation. For instance, 0.3–20 denotes a concrete specimen with a water-binder ratio of 0.3 and a fly ash incorporation rate of 20%.
Samples preparation
Twelve different concrete mixes with varying composite proportions were poured into a cuboid mold measuring 150mm × 150mm × 300 mm and kept at room temperature for 24 h. After demolding, concrete blocks were submerged in water and maintained at room temperature for a curing period of 56 days. Once the concrete test blocks had completed their curing process, the test blocks used for water vapor adsorption/desorption are shaped as a cylinder with dimensions of 30 mm in both diameter and height, obtained by drilling core samples from the center of the cuboid concrete block measuring 300mm × 150mm × 150 mm (refer to Figure 1(a))). The weight range for the concrete samples used in water vapor adsorption and desorption is approximately between 40 and 60 g. Each group of concrete consists of five test blocks, resulting in 60 samples in 12 groups (refer to Figure 1(b))) for the water vapor adsorption and desorption tests.
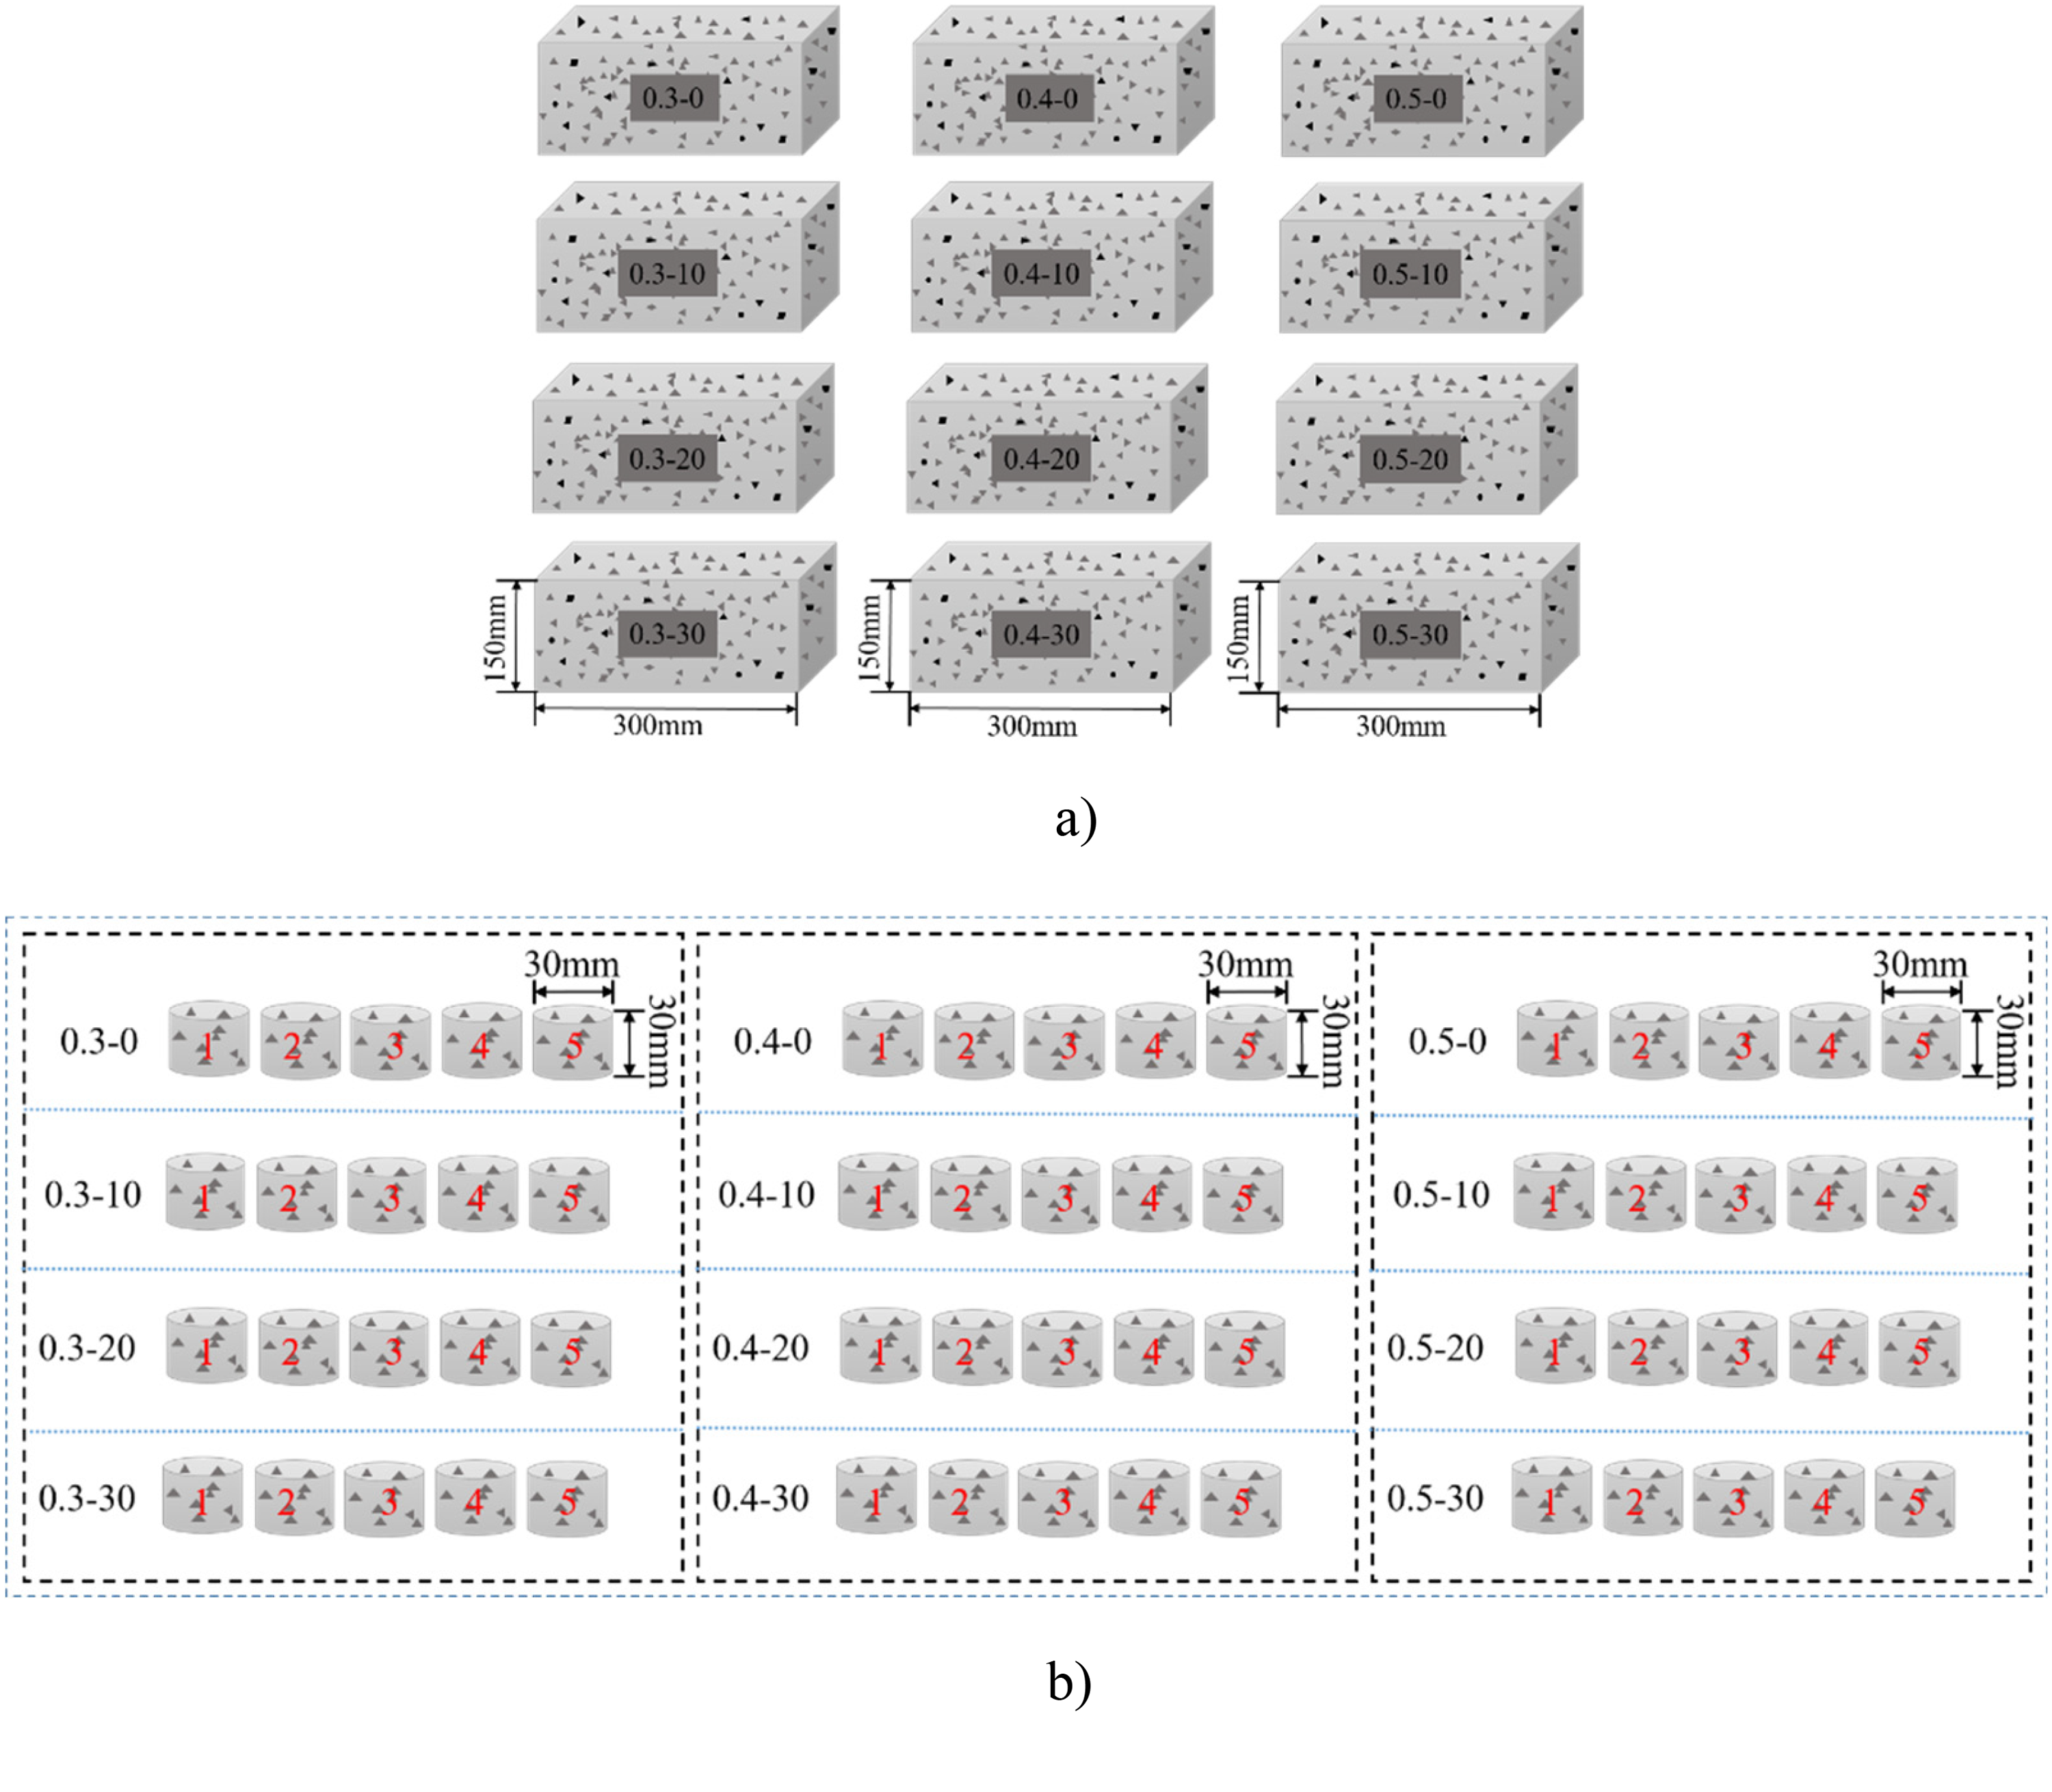
Sketch diagram for sample preparation and 60 cylinder specimens for water vapor adsorption/desorption. (a) 12 different proportions of concrete mixes. (b) Five cylinder specimens drilled from each concrete block used for water vapor adsorption/desorption test (60 samples in total).
Dry status state
The weight method is used to determine the mass change of adsorption and desorption during the water vapor adsorption/desorption process of concrete materials. Before starting the adsorption test on the concrete specimen, it is essential to ensure that it is completely dry and free from water as a reference point for determining the amount of water vapor adsorbed during the adsorption and desorption process. Therefore, ensuring that the concrete test block is thoroughly dried serves as an important prerequisite for conducting this test.
Achieving the ideal drying state within the concrete pores presents a significant challenge. While ensuring pore integrity, it is crucial to approach a nearly completely dry condition without subjecting the material to excessively high drying temperatures. A concrete specimen can be considered stable and in a dry state when the mass difference between weights remains below 0.1% for 7 days at a drying temperature of 60°C. Under this specific drying system, it takes approximately 10 weeks for the concrete samples to transition from their natural state to a fully dried condition. After the specimens reached the dry state, they were wrapped in multiple layers of plastic film and placed into the laboratory glassware dryer to cool down to room temperature.
Experimental procedure
Humidity condition preparation
The relative humidity of the air above the saturated salt solution will remain constant within a specific temperature range. By utilizing the properties of saturated salt solutions, a relatively stable environment for relative humidity can be established. LiCl, MgCl2, Mg(NO3)2, NaCl, and deionized water were selected to create five distinct levels of ambient humidity. The theoretical values of relative humidity above these four saturated solutions and pure water at room temperature are presented in Table 2. The room temperature fluctuates between 20 and 25°C, and the variations within this range have a minimal impact on the relative humidity of the air above the saturated salt solution, as indicated in Table 2. Within this temperature range, it can be assumed that the adsorption equilibrium process occurs under constant temperature and humidity conditions.
The relative humidity above saturated salt solution.

Adsorption equilibrium
To obtain accurate water vapor adsorption/desorption curves, it is essential to ensure that the specimen reaches adsorption equilibrium under each relative humidity (Atlassi, 1996), which necessitates determining the standard for adsorption equilibrium. Works of literature have adopted an acceleration method for rapid adsorption/desorption testing to reduce the time required to achieve adsorption or desorption equilibrium (Johannesson, 2002, Tada and Watanabe, 2005). Generally, a minimal change in mass over an extended period indicates the attainment of adsorption equilibrium. The longer the duration of mass stability, the closer the adsorption stable state approaches true equilibrium. In this study, a constant rate of adsorption/desorption test was employed to restore the authentic adsorption and desorption state of concrete material under atmospheric humidity conditions. It is stipulated that there should be a time interval of more than 15 days between weighing with a mass difference between concrete samples less than 0.1%, ensuring that the concrete samples reach an adsorption and desorption equilibrium state.
Test process
The water vapor adsorption and desorption test require a constant ambient humidity. A laboratory glassware dryer is used to create a sealed environment with a saturated salt solution. To ensure that the specimen remains unaffected by the saturated salt solution and does not interfere with the adsorption results, a perforated ceramic baffle is employed to separate the concrete test block from the saturated salt solution below and isolate it from the atmospheric environment. Once prepared in the laboratory glassware dryer, the saturated salt solution is sealed and left undisturbed for 72 h to stabilize the relative humidity of the air above it. Subsequently, the test blocks were placed inside and securely sealed, remaining undisturbed.
Adsorption test
For weight monitoring of concrete test blocks in a controlled environment with constant temperature and humidity, the initial monitoring frequency should be high and gradually reduced as adsorption stabilizes in later stages. The weighing system for the specimen is as follows: during the initial stage, place the specimen in an environment with specific relative humidity and measure its weight once daily for three days; during the intermediate stage, measure its weight every 3 days for a total of 4–7 times; during the later stage, measure its weight every 15 days until the difference between two consecutive measurements is less than 0.1% of the test blocks’ mass. At this point, it can be considered that adsorption equilibrium has been achieved and recorded. The balance has a weighing accuracy of 0.001 g. After completing the adsorption process, the adsorption-balanced test block is dried back to its initial dry state and then placed in a laboratory glassware dryer within an environment with higher relative humidity. The adsorption test concludes when all specimens reach equilibrium in five different relative humidity environments, and their measurements are recorded. The entire adsorption test lasted for 485 days.
Desorption test
The desorption process is the reverse of the adsorption process. The specimen is removed from an environment with 100% relative humidity above pure water and promptly transferred to the atmosphere above a saturated NaCl solution as the initial step of desorption. During the desorption of water vapor, the time interval for weighing the mass gradually increases throughout the process. In the early stage of desorption, mass measurements are taken once daily for three consecutive days, followed by measurements every 3 days. As desorption approaches equilibrium, mass is measured weekly. In later stages, mass is measured bi-monthly to monthly until reaching a stable state of equilibrium. The total duration for weighing all specimens is approximately 30 min each time. In comparison to the desorption process, the exchange of water with the surrounding environment throughout the procedure during the weight time could be ignored. After reaching a stable state of desorption, concrete specimens were moved to an environment above a saturated solution with lower relative humidity for further drying steps. This procedure continued until the concrete specimens in the environment with the lowest relative humidity reached the desorption stable state, and the desorption test ended. It took 355 days to complete the desorption test of concrete material in all humidity.
Results and discussion
Water vapor adsorption isotherm
Water vapor adsorption capacity
The moisture adsorption of the material is affected by environmental humidity and changes over time. When there is constant ambient humidity and a certain kind of adsorption gas, the duration of adsorption becomes crucial for determining adsorption quantity before adsorption equilibrium is obtained. Once concrete material reaches adsorption equilibrium in a specific humid environment, extended exposure does not increase its ability to adsorb moisture any further. However, any alterations in ambient humidity disturb this balance and create a new one instead. Additionally, reaching adsorption equilibrium also takes different amounts of time depending on surrounding levels of humidity; higher ambient humidity requires more time to achieve balance (Qiong et al., 2013).
During the process of water vapor adsorption, the amount of adsorption increases with time from the initial stage to reach adsorption equilibrium. The measured weight represents the absolute value of adsorption in the test. Figures 2 and 3 illustrate the variation curve of water vapor adsorption mass over time.

Adsorbed water vapor mass of concrete samples changes over time in 75.5% relative humidity. (a) Adsorbed water vapor adsorption mass of all concrete samples without fly ash content. (b) Adsorbed water vapor adsorption mass of all concrete samples with 10% fly ash content. (c) Adsorbed water vapor adsorption mass of all concrete samples with 20% fly ash content. (d) Adsorbed water vapor adsorption mass of all concrete samples with 30% fly ash content.

Adsorbed water vapor mass of concrete samples changes over time in 100% relative humidity. (a) Adsorbed water vapor adsorption mass of all concrete samples without fly ash content. (b) Adsorbed water vapor adsorption mass of all concrete samples with 10% fly ash content. (c) Adsorbed water vapor adsorption mass of all concrete samples with 20% fly ash content. (d) Adsorbed water vapor adsorption mass of all concrete samples with 30% fly ash content.
The mass–time relationship curve of water vapor adsorption at a relative humidity of 75.5% is illustrated in Figure 2. In the first 500 h, the initial stage of adsorption reaches over 60% of its equilibrium capacity. After 2000 h, the growth curve of concrete material's adsorption capacity enters a plateau and gradually reaches equilibrium within an adsorption capacity range of 0.46–2.26 g. The moisture adsorption-time growth characteristics of concrete materials exhibit a distinct power function curve, with most of the water vapor being adsorbed during the initial stage of adsorption. In later stages, the mass of water vapor adsorption tends to stabilize, and the adsorption-time curve reaches a plateau.
The rapid increase in initial adsorption capacity shown in Figure 2 indicates that the sudden changes in environmental humidity are the main driving force for exchanging and transmitting water content between concrete material and its surroundings. At this stage, water vapor concentration differences are greatest, allowing for rapid transmission to deeper layers within the concrete pore; however, as the concentration differences decrease over time, adsorption rates slow down until balance is achieved. The adsorption mass of certain samples exhibits a notable increase after 2000 h as shown in Figure 2. This phenomenon is attributed to the occurrence of cracking in the specimens, leading to a sharp rise in water adsorption. Subsequently, as no new cracks emerge, the adsorption mass stabilizes and enters a higher plateau phase after the initial surge. The data from these cracked specimens will be excluded from subsequent analyses.
When the concrete specimen reaches adsorption equilibrium in an environment with a humidity of 75.5%, it is dried to its dry status state and then placed in a sealed glass container with 100% relative humidity to undergo adsorption. The mass–time relationship curve of water vapor adsorption for concrete materials in the environment with 100% relative humidity is depicted in Figure 3.
Most samples exhibited a significant increase in adsorption capacity during the later stage of adsorption as shown in Figure 3. Even after reaching saturation with an adsorption capacity range of 0.80–1.41 g, there was still an upward trend observed in the adsorption mass within a short period.
This additional water vapor adsorption occurred predominantly on the surface of the specimen rather than inside its pores. Notably, when water molecules were adsorbed to form a film on the surface, a new increment in adsorption capacity was observed. It should be noted that only the process of completely saturating the material's pores with water vapor is considered here, and saturation adsorption capacity is measured after wiping off any surface moisture from specimens that have reached this state.
A notable phenomenon observed during the adsorption process is that when individual concrete samples are subjected to an adsorption test in an environment with 75.5% relative humidity, the occurrence of cracks in the specimens leads to a significant increase in the amount of adsorption. Consequently, the equilibrium adsorption capacity exceeds that of intact specimens. These cracks form under conditions of 75.5% relative humidity. Subsequently, when these cracked specimens are exposed to a subsequent environment with 100% relative humidity after drying, their adsorption capacity even reaches 120%–140% of the saturated adsorption capacity. The data obtained from these cracked specimens lose their significance for pore structure analysis and are therefore excluded from further analysis.
Adsorption isotherm
In this study, five specific humidity levels were employed: 11.7%, 33.1%, 59.5%, 75.5%, and 100%. The measured adsorption capacity at each humidity level after reaching equilibrium represents the corresponding equilibrium adsorbed amount. The adsorption isotherm curve of the concrete material is depicted in Figure 4.

Average volume of water vapor adsorption corresponding to relative humidity. (a) Average volume of water vapor adsorption for concrete without fly ash content. (b) Average volume of water vapor adsorption for concrete with 10% fly ash content. (c) Average volume of water vapor adsorption for concrete with 20% fly ash content. (d) Average volume of water vapor adsorption for concrete with 30% fly ash content.
As shown in Figure 4, each data point represents the average value derived from a set of test measurements. In the low humidity region, every data point corresponds to the mean result obtained from five test specimens. According to Figure 4, as the ambient humidity is below 59.5%, there is a gradual increase in the amount of water vapor adsorbed by the pore structure of the concrete material with increasing humidity, which corresponds to the characteristics of water vapor adsorption in the low relative humidity region of concrete materials (Thomas et al., 1999). However, when the ambient humidity exceeds 59.5%, a sharp increase trend in accumulated adsorption capacity is observed.
The water vapor adsorption characteristics of concrete materials are influenced by the water-binder ratio as shown in Figure 4. The water vapor adsorption capacity of concrete without fly ash content is 0.04741cm3/g for the sample of 0.3–0, the water vapor adsorption capacity of concrete with 10% fly ash content is 0.0544 cm3/g for the sample of 0.3–10, water vapor adsorption capacity of concrete with 20% fly ash content is 0.04848 cm3/g for the sample of 0.4–20, water vapor adsorption capacity of concrete with 30% fly ash content is 0.03967 cm3/g for the sample of 0.3–30.
Within the range of 0.3–0.5, a lower water-binder ratio enhances the moisture adsorption capacity of concrete materials. As the relative humidity in the range of 0–100%, the adsorption capacity at equilibrium between concrete material and ambient humidity decreases with an increase in the water-binder ratio, specifically V0.3 > V0.4 > V0.5. The volume of water vapor adsorption of concrete with a water-to-binder ratio (w/b) of 0.3 is observed to be 5%–10% higher than that of concrete with a w/b ratio of 0.4, while the volume of water vapor adsorption of concrete with a w/b ratio of 0.4 is found to be 17%–28% higher than that of concrete with a w/b ratio of 0.5.
The adsorption of concrete materials in low relative humidity occurs in micro-pores, with the amount of adsorption being controlled by surface energy and transport processes. As ambient humidity exceeds 59.5%, the adsorption layer within larger pores rapidly increases, leading to the formation of a concave surface that aligns with Kelvin's capillary condensation diameter, resulting in capillary condensation phenomena. The critical environmental humidity for the capillary condensation phenomenon in concrete materials is approximately 59.5%. Subsequently, there is a rapid increase in adsorption within the pores, which is governed by surface energy and capillary condensation. In the case of cement-based materials, the critical humidity range for capillary condensation occurrence is around 40% (Julius et al., 1969). The critical relative humidity for water vapor adsorption-induced capillary condensation in concrete materials shifts toward higher humidity regions while expanding the linear range of the isothermal adsorption curve from 0.05–0.3 to 0.05–0.54.
Water vapor desorption isotherm
Water vapor desorption capacity
The desorption process characteristics are depicted in Figure 5, illustrating the mass–time curve of saturated concrete material at a relative humidity of 75.5%. Desorption begins from a fully saturated state in an environment with a relative humidity of 75.5%.

Desorption to equilibrium in a sealed container with relative humidity RH of 75.5%. (a) Desorption process of all concrete samples without fly ash content. (b) Desorption process of all concrete samples with 10%fly ash content. (c) Desorption process of all concrete samples with 20% fly ash content. (d) Desorption process of all concrete samples with 30% fly ash content.
As shown in Figure 5, initially, the rate of desorption is remarkably high within the first 400 h, resulting in a rapid decrease in water content within the concrete test block. After 1200 h of desorption, the curve reaches a distinct plateau where there is only slight variation in pore water, indicating that desorption gradually stabilizes. This behavior aligns with typical time curves for water vapor desorption observed in most porous materials (Trabelsi et al., 2011), which exhibit a power function relationship between desorption amount and time (Caturla et al., 1999).
Water vapor desorption is a complex and sluggish physical process. The specimen contains both liquid and gaseous forms of water. During desorption, water loss initially occurs through the conversion of liquid water into vapor within internal pores due to decreased relative vapor pressure, followed by gas exchange with the surrounding environment.
Desorption essentially involves the phenomenon of water vapor diffusing from higher to lower relative humidity (Ishida et al., 2007). To elucidate the desorption process of concrete samples when they are transferred from an environment with 100% relative humidity to one with 75.5% relative humidity, it's crucial to understand that when the pore humidity within the concrete exceeds the external environmental humidity, a vapor pressure gradient is established. This gradient serves as a driving force, facilitating the diffusion of water vapor from the interior of the pores toward the exterior, ultimately leading to desorption.
The entire process of water vapor desorption in concrete materials is illustrated in Figure 6. The complete desorption curve includes 12 sets of concrete specimens with varying proportions, ranging from 100% ambient relative humidity to 11.7% relative humidity.
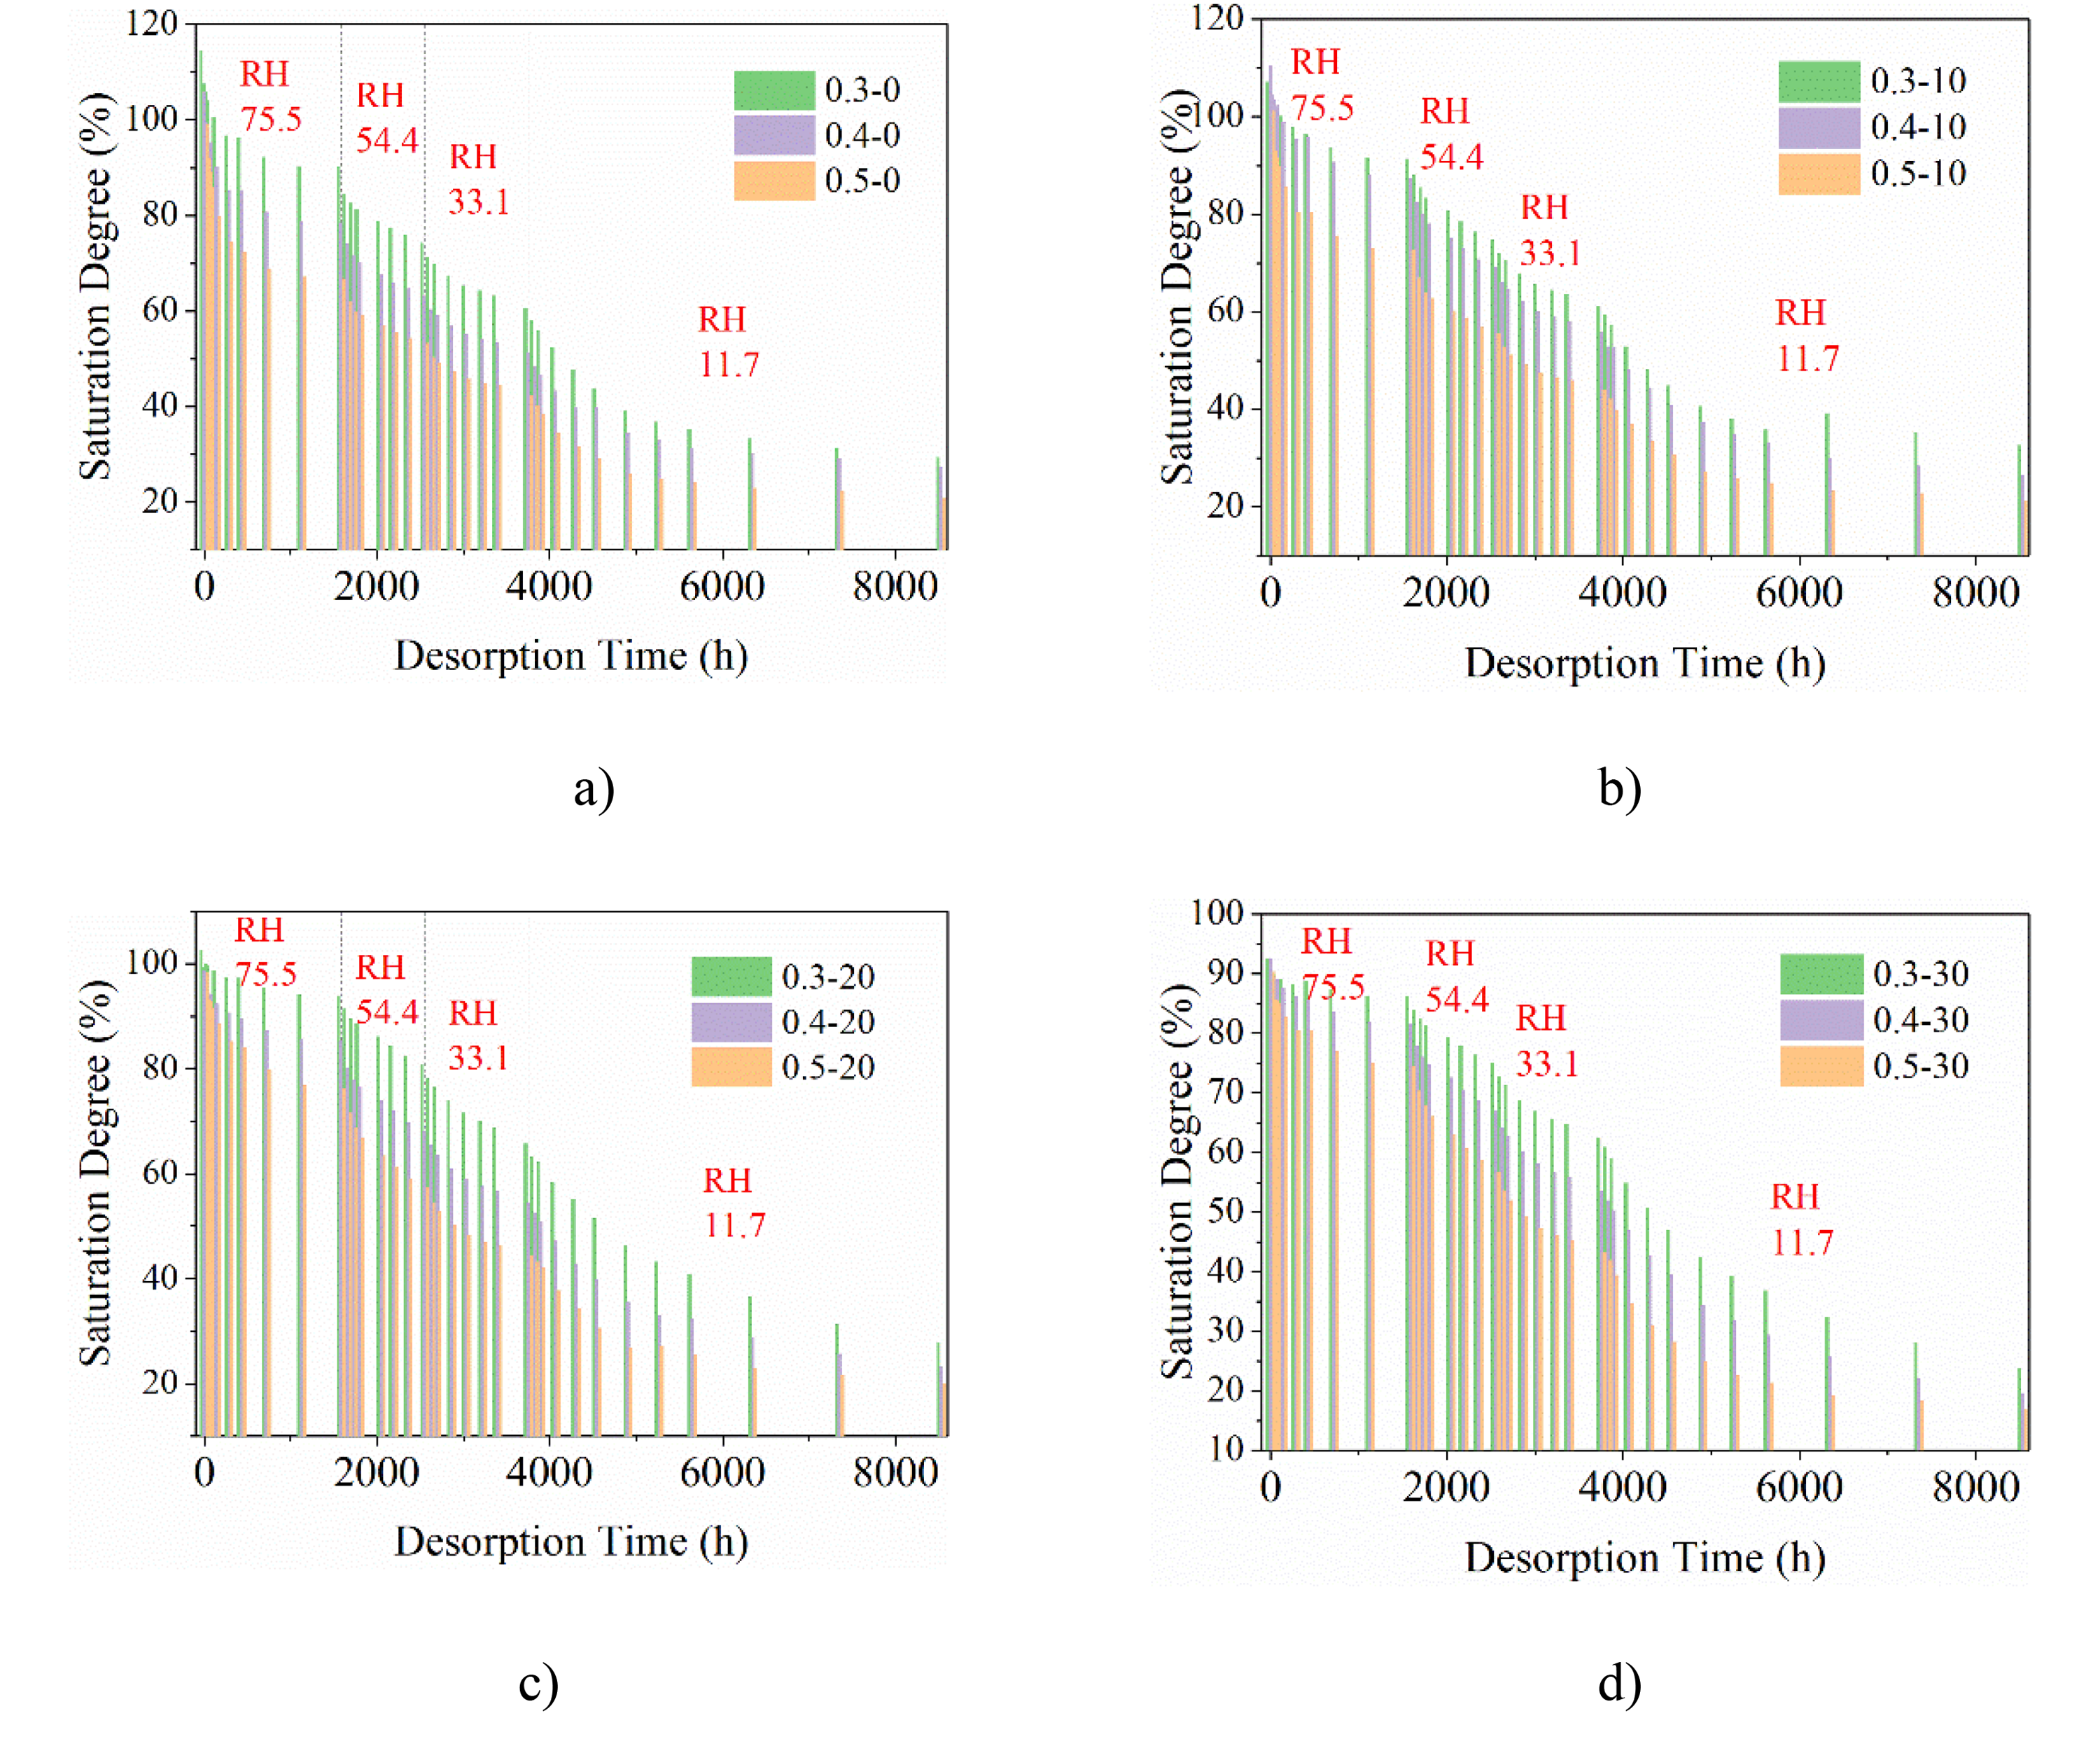
Curve of the whole desorption process curve (from RH100% to RH11.7%). (a) Whole desorption process for concrete without fly ash content. (b) Whole desorption process for concrete with 10% fly ash content. (c) Whole desorption process for concrete with 20% fly ash content. (d) Whole desorption process for concrete with 30% fly ash content.
To facilitate a comparison of the water vapor adsorption mass among different concrete materials, the evaluation index is the relative value of the adsorption amount (saturation). Saturation is defined as the ratio of pore water content to pore saturated water content. The term “saturated water content” refers to the difference between the total mass of the specimen and its dry mass after being soaked in water for 72 h until it reaches a stable state. If the saturated water content is achieved through the adsorption of water vapor, it is referred to as the saturated adsorption amount. Saturation is used to characterize the relative moisture adsorption capacity of concrete materials. The data presented in each curve of Figure 6 are obtained by averaging data from five specimens.
As illustrated in Figure 6, the desorption equilibrium time varies in different relative humidity environments. The desorption equilibrium time is the longest when the ambient humidity is the lowest at 11.7%. There are noticeable differences in the amount of water released during the intermediate process of different water-binder ratio. The duration of stable desorption also differs with varying humidity levels.
The water-binder ratio significantly influences the desorption process as shown in Figure 6, with higher water-binder ratios resulting in greater degrees of water release. By focusing on the intermediate stage of desorption, it becomes possible to analyze the material's microstructure and assess how variations in material ratios and incorporation of fly ash impact its ability to release water. The desorption process of water vapor is influenced by the activation energy for desorption, which is closely associated with pore size (Li et al., 2007).
Desorption isotherm
The isothermal desorption curve exhibits similarities to the isothermal adsorption curve. The three commonly used graphical representations include the saturation-relative humidity curve (S-RH curve), water adsorption mass per unit mass-relative humidity curve (m-RH curve), and water vapor adsorption volume per unit mass-relative humidity curve (V-RH curve). In this study, the water vapor adsorption volume per unit mass-relative humidity curve (V-RH curve) is used as the isothermal desorption curve to represent the relationship between the volume of water adsorption per unit mass of concrete material (cm3/g) and relative humidity. Figure 7 illustrates the isothermal desorption curves obtained from water vapor desorption tests conducted on 12 different concrete mixtures.

Isothermal desorption curve. (a) Isothermal desorption curve for concrete without fly ash content. (b) Isothermal desorption curve for concrete with 10% fly ash content. (c) Isothermal desorption curve for concrete with 20% fly ash content. (d) Isothermal desorption curve for concrete with 30% fly ash content.
In Figure 7 (a)) and (b)), the desorption curves of concrete materials without fly ash exhibit an “S” shape (Akita et al., 1997, Andrade et al., 1999, Ishida et al., 2007). The inflection point occurs at approximately 75.5% relative humidity, indicating the completion of single-layer adsorption and initiation of multi-layer adsorption. For desorption at 75.5% relative humidity, it signifies the completion of multi-layer desorption and the commencement of single-layer desorption. This implies that desorption becomes more challenging in environments with relative humidity below 75.5% compared to those above this threshold.
As depicted in Figure 7, when comparing concrete specimens with the same fly ash content but varying water-binder ratios, a notable separation between the curves becomes evident. Under consistent humidity conditions, specimens with a lower water-binder ratio demonstrate a higher residual amount of desorbed water vapor. This finding indicates that concrete with a lower water-binder ratio possesses an increased adsorption capacity for water vapor and exhibits greater resistance to desorption.
Desorption thermodynamic parameters
The thermal dynamic parameters of the desorption process were calculated using the analytical method described in the literature (Miao et al., 2023). By analyzing the desorption data, we can obtain the adsorption energy parameter C, the first layer's adsorption energy (desorption activation energy) Q1, subsequent layers’ adsorption capacity coefficient k, and the first layer's adsorption capacity Vm. These values are listed in Table 3, and Table 4 presents the parameters of the adsorption process. The comparison of adsorption/desorption process parameters allows for an analysis of their thermodynamic processes.
Thermodynamic parameters of water vapor desorption process (Miao et al., 2024).

Note: Two Vm values appear in the table, one is the total saturated adsorption capacity of the first layer, the unit is cm3; one is the saturated adsorption capacity of the first layer per unit mass, the unit is cm3/g.
Thermodynamic parameters of water vapor adsorption process (Miao et al., 2024).
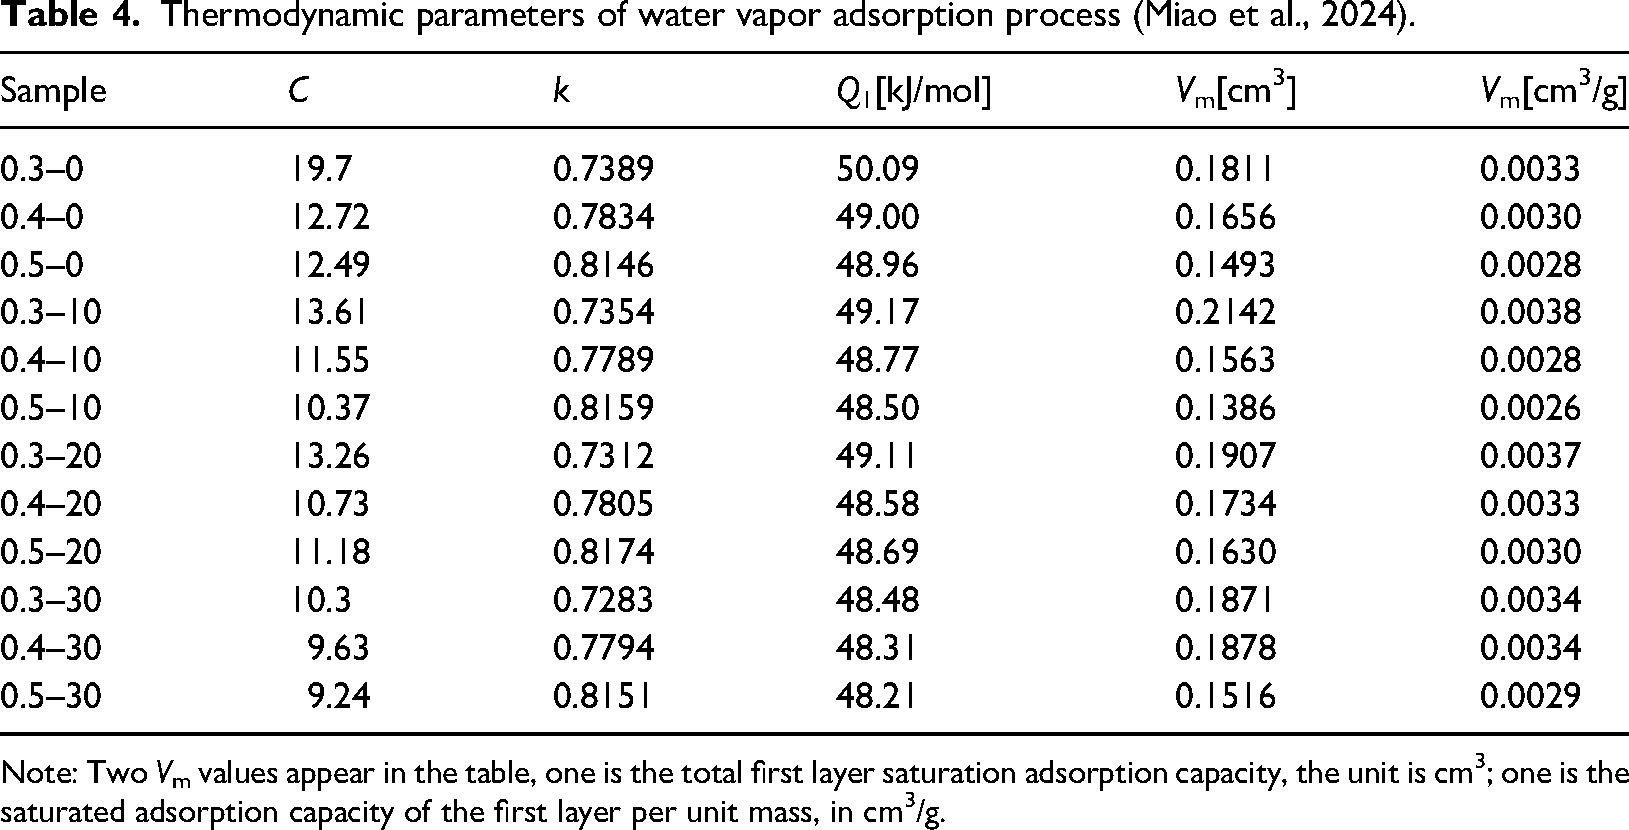
Note: Two Vm values appear in the table, one is the total first layer saturation adsorption capacity, the unit is cm3; one is the saturated adsorption capacity of the first layer per unit mass, in cm3/g.
The adsorption energy coefficient C, calculated by the desorption process model, and the adsorption energy Q1 of the first layer are observed to be higher than those of the adsorption process, as evidenced by Table 3 and Table 4. From a thermodynamic perspective, desorption and adsorption exhibit distinct thermodynamic processes with desorption being influenced by material ratios that lack regularity. Furthermore, the saturation adsorption capacity of the first layer during desorption is greater than that of the adsorptive branch.
It should be noted that this saturated capacity includes not only the actual water adsorption amount when water vapor forms a complete cover on the first layer but also residual water in large pores with narrow throats. The vapor pressure required for water evaporation in this part is higher than that needed at the pore throat. Even if the relative humidity condition for water evaporation in the pore is achieved, the presence of blocked water at the pore throat hinders the smooth discharge of water from inside the pore, resulting in elevated parameter values calculated by the desorption branch. The combination of desorption and adsorption curves can be utilized to analyze characteristics such as pore structure and pore shape, and proportion of large pores with narrow throats.
Adsorption and desorption hysteresis curve
The hysteresis curve can be obtained by the combination of adsorption isotherm and desorption isotherm. The pore shape characteristics of concrete materials can be analyzed by the shape and hysteresis amount of the hysteresis loop. Figure 8 illustrates the isotherm curve for water vapor adsorption/desorption. Based on the shape of water vapor adsorption/desorption curves in concrete materials, these curves remain essentially consistent across different fly ash contents and water-binder ratios. The only difference lies in their position along the axis, indicating varying levels of adsorption/desorption.

Water vapor adsorption/desorption isothermal curves. (a) Water vapor adsorption/desorption isotherm of concrete with no fly ash content. (b) Water vapor adsorption/desorption isotherm of concrete with 10% fly ash content. (c) Water vapor adsorption/desorption isotherm of concrete with 20% fly ash content. (d) Water vapor adsorption/desorption isotherm of concrete with 30% fly ash content.
The water vapor adsorption isotherm reveals that the adsorption curve is influenced by the water-binder ratio. A higher water-binder ratio leads to a lower amount of water vapor being adsorbed, particularly at relative humidity levels below 59.5%. In terms of desorption, the impact of the water-binder ratio becomes more pronounced, resulting in larger deviations and disparities between the curves. Similarly, an increased water-binder ratio corresponds to a reduced residual moisture content in concrete pores, as depicted in Figure 8. The adsorption/desorption characteristics collectively indicate that a higher water-binder ratio results in lesser adsorption of water vapor by concrete material.
Hysteresis quantity of water vapor adsorption and desorption
The adsorption and desorption hysteresis quantity curves of concrete materials with 12 ratios under different ambient humidity are presented in Figure 9. The peak value of the adsorption and desorption hysteresis quantity curves is consistently observed at approximately 59.5% relative humidity, followed by a rapid decrease in hysteresis with increasing relative humidity. This suggests that water hysteresis quantity in large-aperture pores is generally minimal, facilitating water vapor material transport between the concrete and its surroundings. In the range of 59.5% relative humidity, the amount of hysteresis amount exceeds that observed above 60%. Water vapor adsorption primarily occurs in small-sized pores within this lower humidity range, which allows for easy adsorption but poses challenges for desorption.

Hysteresis quantity of water vapor adsorption and desorption under different relative humidity.
Figure 9 illustrates the presence of numerous capillary pores, as well as large pores with narrow throats within the concrete material. Additionally, it is evident from Figure 9 that hysteresis quantity curves vary depending on the proportions of concrete. The proportion of hysteresis quantity in the total water adsorption of concrete is compared by illustrating the ratio of hysteresis quantity in saturated water adsorption, calculated based on the absolute value of water retention depicted in Figure 9 (refer to Figure 10).

The proportion of hysteresis quantity to total water vapor adsorption.
The ratio of hysteresis quantity to total water vapor adsorption of concrete materials varies significantly with different proportions, as illustrated in Figure 10. For 0.5–0 concrete materials, the minimum value of hysteresis quantity to total adsorption is 39.3%, while for 0.3–30 concrete materials, the maximum value reaches 63.8%. Pore morphology plays a crucial role in determining the amount of hysteresis, where an abundance of large pores with narrow throats contributes to increased hysteresis quantity. Additionally, capillary condensation acts as another influential factor in the quantity of hysteresis by causing a sharp increase in adsorption during the process and making desorption challenging, ultimately resulting in the presence of a peak value.
The adsorption and desorption hysteresis of water vapor of concrete material is attributed to the presence of capillary pores and large pores with narrow throats. When the ambient humidity is very low, the pore shape of the pore where water can still be retained is characterized by large pores with narrow throats. In the peak region of hysteresis, both capillary condensation and moisture retention in the pores throat contribute to this comprehensively. By analyzing the adsorption and desorption hysteresis loop as well as the quantity curve, we can identify large pores with narrow throats and quantitatively assess the proportion of large pores with narrow throats and capillary pores in total volume.
Effect of water-binder ratio on hysteresis quantity
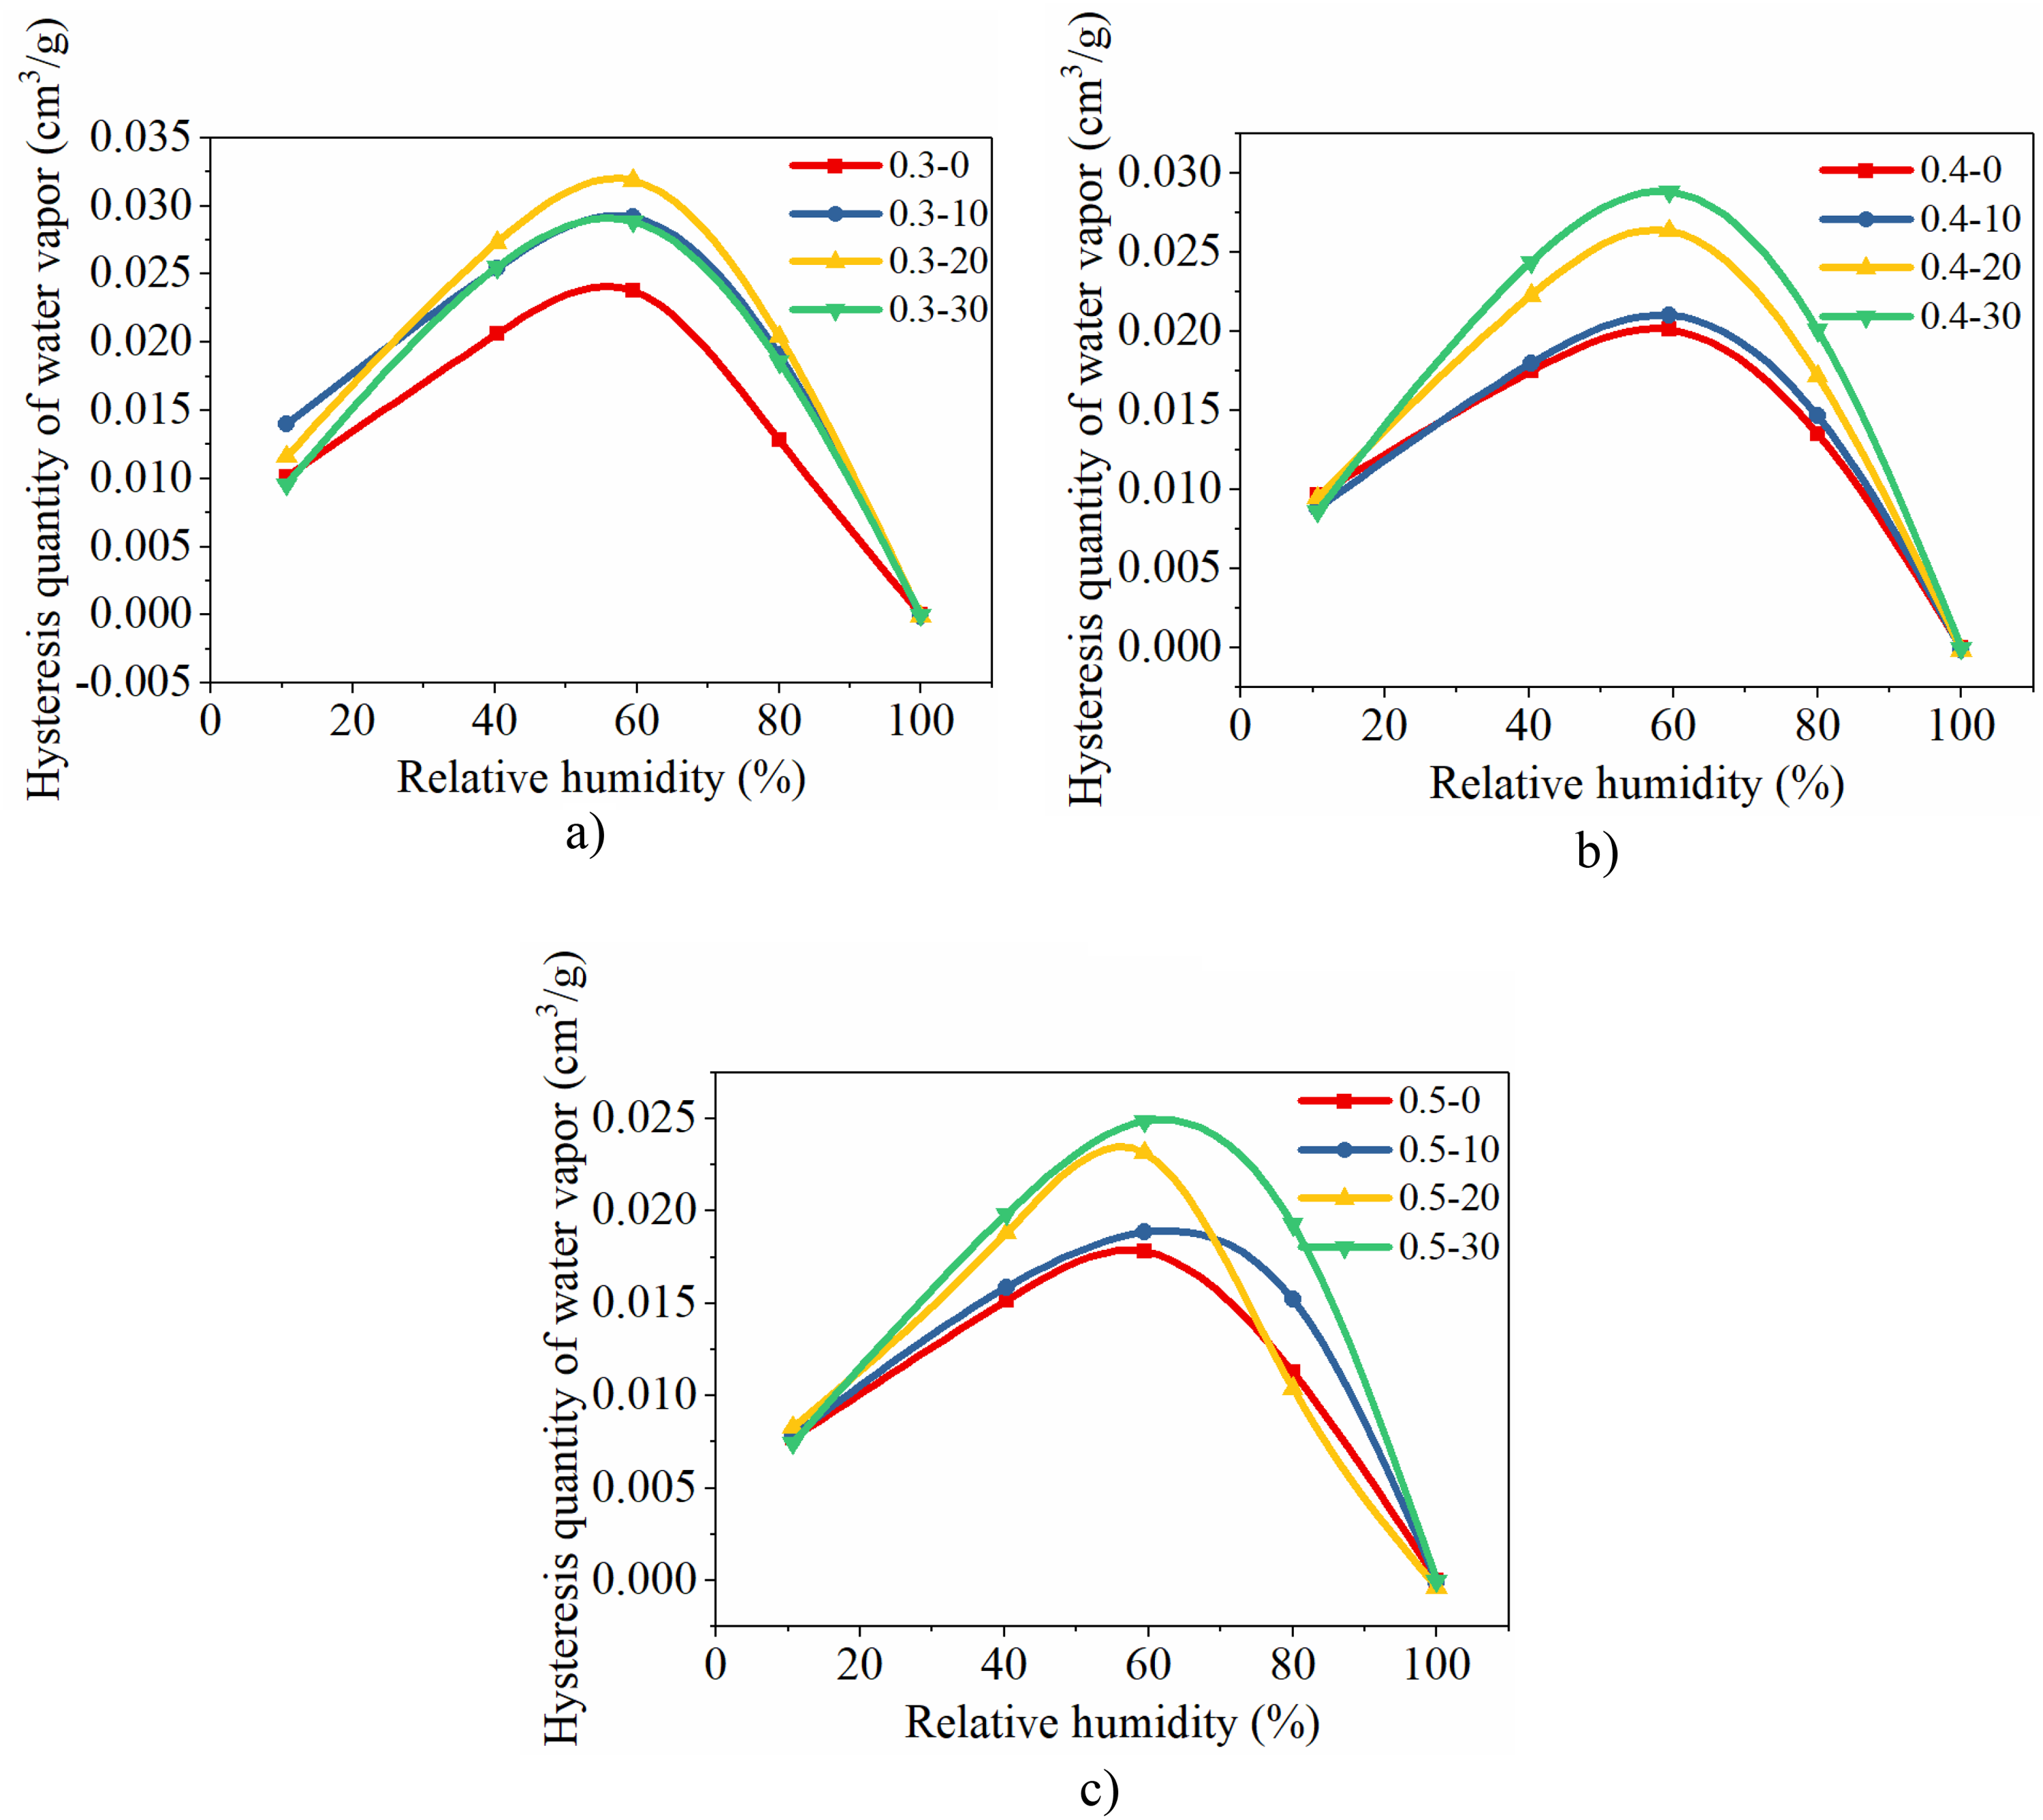
The hysteresis quantity curves are categorized based on varying water-binder ratios, and the changes in these curves are illustrated in Figure 11.

Hysteresis quantity of water vapor adsorption and desorption of concrete with different water-binder ratios. (a) Hysteresis quantity of concrete with no fly ash content. (b) Hysteresis quantity of concrete with 10% fly ash content. (c) Hysteresis quantity of concrete with 20% fly ash content. (d) Hysteresis quantity of concrete with 30% fly ash content.
Overall, a lower water-binder ratio results in a larger hysteresis quantity and higher peak values for the concrete material. Concrete materials with different water-binder ratios also exhibit some differences near a low relative humidity of 11.7%, although it is not as pronounced as at a relative humidity of 59.5%. The hysteresis quantity of around 11.7% relative humidity indicates water retention within the large pores with narrow throats. And the hysteresis quantity at 11.7%RH for concrete of 0.3–0, 0.4–0, and 0.5–0 are 0.01013 cm3/g, 0.00967 cm3/g, and 0.0077 cm3/g, for concrete of 0.3–10, 0.4–10, and 0.5–10 are 0.01399 cm3/g, 0.00882 cm3/g, and 0.00783 cm3/g, for concrete of 0.3–20, 0.4–20, and 0.5–20 are 0.01163 cm3/g, 0.00949 cm3/g, and 0.00828 cm3/g, for concrete of 0.3–30, 0.4–30, and 0.5–30 are 0.00959 cm3/g, 0.00863 cm3/g, and 0.00745cm3/g. Furthermore, the reason behind the peak value of hysteresis quantity at approximately 59.5% relative humidity is that capillary condensation leads to greater water retention within pores near this level. And the hysteresis quantity at 59.5%RH for concrete of 0.3–0, 0.4–0, and 0.5–0 are 0.02379 cm3/g, 0.02012 cm3/g, and 0.01782 cm3/g, for concrete of 0.3–10, 0.4–10, and 0.5–10 are 0.02917 cm3/g, 0.02102 cm3/g, and 0.01885 cm3/g, for concrete of 0.3–20, 0.4–20, and 0.5–20 are 0.03187 cm3/g, 0.02636 cm3/g, and 0.02316 cm3/g, for concrete of 0.3–30, 0.4–30, and 0.5–30 are 0.02886 cm3/g, 0.02882 cm3/g, and 0.02486 cm3/g. Based on these data, the proportions of volume of capillary pores and large pores with narrow throat to the total pore volume can be calculated.
Effect of fly ash content on hysteresis quantity
The hysteresis quantity curves are categorized based on the fly ash content, and the variations in water vapor adsorption and desorption hysteresis quantity curves are illustrated in Figure 12.
Hysteresis quantity of water vapor adsorption and desorption of concrete with different fly ash content. (a)Hysteresis quantity of concrete with 0.3 w/b. (b)Hysteresis quantity of concrete with 0.4 w/b. (c) Hysteresis quantity of concrete with 0.5 w/b.
As depicted in Figure 12, for a given water-binder ratio, the peak hysteresis quantity of concrete with fly ash contents of 20% and 30% generally exceeds that of concrete without fly ash or with a fly ash content of 10%. The initiation and termination points of hysteresis quantity curves for different proportions of concrete almost coincide. And the hysteresis quantity at 11.7%RH for concrete of 0.3–0, 0.3–10, 0.3–20, and 0.3–30 are 0.01013 cm3/g, 0.01399 cm3/g, 0.01163 cm3/g, and 0.00959 cm3/g, for concrete of 0.4–0, 0.4–10, 0.4–20, and 0.4–30 are 0.00967 cm3/g, 0.00882cm3/g, 0.00949cm3/g, and 0.00863cm3/g, for concrete of 0.5–0, 0.5–10, 0.5–20, and 0.5–30 are 0.0077 cm3/g, 0.00783 cm3/g, 0.00828 cm3/g, and 0.00745 cm3/g.
The peak value at 59.5%RH primarily reflects the proportion of capillary pores within the concrete material's pores. And the hysteresis quantity at 59.5%RH for concrete of 0.3–0, 0.3–10, 0.3–20, and 0.3–30 are 0.02379 cm3/g, 0.02917 cm3/g, 0.03187 cm3/g, and 0.02886 cm3/g, for concrete of 0.4–0, 0.4–10, 0.4–20, and 0.4–30 are 0.02012 cm3/g, 0.02102 cm3/g, 0.02636 cm3/g, and 0.02882cm3/g, for concrete of 0.5–0, 0.5–10, 0.5–20, and 0.5–30 are 0.01782 cm3/g, 0.01885 cm3/g, 0.02316 cm3/g, and 0.02486 cm3/g.
In Figure 12, the initiation point represents the proportion of large pores with narrow throats, and since its initiation point closely aligns, it indicates that adding fly ash has minimal impact on these large pores with narrow throats.
In Figure 12, the peak value of the hysteresis quantity curve exhibited a significant difference, indicating that the addition of fly ash increased the proportion of capillary pores. The refining effect on pores due to fly ash incorporation has been confirmed by numerous studies. When total porosity remains unchanged, this refining effect increases the number of pores while reducing the number of large-sized pores.
Proportion analysis of different pore morphology
Relationship between hysteresis loop and pore shape
The filling sequence of pores by water vapor follows a pattern where micro-pores are filled first, followed by mesopores, and large ones last. Figure 13 illustrates a schematic diagram of this filling process.

Schematic diagram of water vapor adsorption process of dry concrete materials.
The water vapor adsorption process in porous media exhibits a strong adsorption capacity in tiny pores, ensuring high stability of water vapor adsorption. After the micro-pores are filled, the capillary pores begin to adsorb water vapor. As the adsorption amount increases, capillary condensation occurs in pores that meet the Kelvin pore size, thereby accelerating the overall adsorption process. Eventually, macropores become filled with water vapor.
The desorption process of water vapor is the reverse of the adsorption process. Figure 14 illustrates a schematic diagram depicting the variation of water content during the desorption process.

Schematic diagram of water vapor desorption process in pores of saturated concrete.
As shown in Figure 14, initially, water in the pores undergoes desorption from larger pores. As environmental humidity decreases, desorption of water in the capillary pores begins. The presence of a capillary condensation mechanism significantly slows down the desorption process. When ambient humidity reaches very low levels, liquid water within both large and capillary pores has been completely desorbed, leaving only retained water in interlayer pores and large pores with narrow throats.
After undergoing a complete cycle of adsorption and desorption, the phenomenon of water retention within the pore is manifested as a hysteresis loop in the isothermal diagram of adsorption and desorption. The process of adsorption and desorption for different pore shapes gives rise to distinct forms of hysteresis loops (as depicted in Figure 15). By examining the shape of the hysteresis loop, one can infer characteristics regarding pore shape within the concrete material's pore structure.

Four common hysteresis loops (Li et al., 2007).
The H1 hysteresis loops in Figure 15 indicate straight cylindrical pores arranged in an orderly manner. The H2 hysteresis loops are characterized by large pores with narrow throats, while the H3 hysteresis loops exhibit high adsorption capacity at high pressure and are characterized by slit-shaped pores. Similarly, the H4 type also represents slit-shaped pores; however, unlike those of the H3 type that result from the accumulation of sheet particles, those of the H4 type result from layered structures.
According to the shape characteristics of the hysteresis loops obtained from the adsorption and desorption curve, it is utilized to assess pore morphology. The hysteresis loops can be categorized into five types, corresponding to four types of pore shape characteristics (Ravikovitch and Neimark, 2002), as illustrated in Figure 16.

Different pore shapes corresponding to hysteresis loops (Ravikovitch and Neimark, 2002).
The characteristics of type A hysteresis loops include steep adsorption and desorption branches during capillary condensation, a relatively narrow range of relative humidity for capillary condensation, cylindrical pores with openings at both ends, as well as a narrow pore size distribution. In contrast to type A, there is a significant difference in type B hysteresis loops: they have a wider range of relative humidity for capillary condensation and exhibit flatter curves. Pores exhibiting type B hysteresis loops are long and narrow parallel plate-shaped pores where capillary condensation occurs near saturated vapor pressure. Type C and D hysteresis loops are characterized by conical-shaped pores where capillary condensation begins when the relative pressure reaches the adsorption pressure corresponding to the pore throat. When a concave liquid surface forms at the bottom of the inner pore, the adsorption amount dramatically increases, creating a steep adsorption section. The difference between type D hysteresis curve and type C hysteresis curve lies in the fact that capillary condensation occurs within a relative humidity range close to saturated vapor pressure, and the specific pore shape features slit pores with varying widths at both ends, exhibiting characteristics of both slit pores and conical cylinder holes. Type E hysteresis curve represents a typical large pore with a narrow throat resembling an ink bottle pore. This type of pore has a narrow neck but a large cavity, resulting in higher relative humidity required for capillary condensation while lower relative humidity is needed for evaporation and desorption.
The shape of the adsorption and desorption hysteresis loops of concrete materials, as well as the corresponding amount of hysteresis at different humidity levels, can be defined based on the distinctive pore shape characteristics exhibited by each hysteresis loop. The shape characteristics of hysteresis loops shown in Figure 8 indicate that the curve observed in the high humidity area aligns with type C hysteresis loops. However, in the middle and high humidity areas, it resembles the characteristics exhibited by type B hysteresis loops.
Based on the analysis of the hysteresis loop shapes presented in Figure 8 and the corresponding pore shapes, it can be deduced that the internal pores of the concrete are predominantly slit-like and conical. Conical pores are distinguished by their one narrow end and one wide end, mimicking the ink bottle-shaped pores frequently discussed in concrete pore structures—here represented as large pores with narrow throats. However, ink bottle-shaped pores are not reflected in the concrete's adsorption and desorption hysteresis curve. One plausible explanation is that the distinctive features of ink bottle-shaped pores in concrete may not be readily observable. Another possibility is that the concrete material's hysteresis curve is a composite of various overlapping hysteresis loops, thereby masking the manifestation of ink bottle-shaped pores on the curve. The capillary pores and large pores with narrow throats observed through SEM are depicted in Figure 17.

Capillary pores and large pores with narrow throat in concrete pore structure by SEM.
From the SEM images of the concrete's microstructure depicted in Figure 17, capillary pores and large pores with narrow throats can be observed, but ink bottle-shaped pores are not visible. In other words, this aligns with the first possibility analyzed earlier, namely, that ink bottle pores are not observed in the pore structure of the concrete.
When the relative humidity of the environment exceeds 59.5%, there is a rapid increase in the adsorption amount, suggesting a prevalent occurrence of capillary condensation within slit pores distributed throughout the concrete material. Condensation within these slit pores occurs when their diameters meet the criteria for capillary condensation. As long as the width of the slit pore satisfies the critical conditions for capillary condensation, capillary condensation can take place, thereby significantly increasing the amount of water vapor adsorbed through capillary condensation.
Large pores with narrow throats enhance water retention capabilities, whereas capillary pores demonstrate significant water storage capacity at specific relative humidity levels due to capillary condensation mechanisms. In contrast to large pores with narrow throats, capillary pores exhibit transient moisture retention characteristics, which are influenced by changes in environmental humidity.
The hysteresis loop characteristic curve of concrete material, as depicted in Figure 8, indicates the presence of narrow slits and conical pores with varying aperture sizes at both ends. These pores exhibit desorption residue, contributing to the formation of a larger hysteresis loop. Although the water retention effect may not be as pronounced as in ink bottle pores, the abundance of these two pore types still provides concrete materials with significant water storage capacity. The two main types of pores that contribute substantially to the water storage capacity in concrete are characterized by large pores with narrow throats and capillary pores.
The hydration hardening mechanism of concrete involves the formation of a laminar structure within the material, where particles accumulate in a specific arrangement. In this structure, narrow slit pores and conical pores constitute a significant portion. By integrating the analyzed pore shape characteristics depicted in Figures 15 and 16 with the corresponding hysteresis quantities illustrated in Figures 8 and 9, it is possible to analyze the proportion of large pores with narrow throats and capillary pores within the concrete.
Proportion quantitative analysis of capillary pores and large pores with narrow throats
The change curve of adsorption and desorption hysteresis quantity with environmental humidity, as well as the impact on the hysteresis curve of pore size and pore throat volume, indicates that the hysteresis near low relative humidity is solely attributed to the large pores with narrow throats, while the peak hysteresis quantity at 59.5% relative humidity is a combination of amount of capillary pores and large pores with narrow throats. The difference between the hysteresis quantity at 59.5% ambient humidity and that at 11.7% ambient humidity represents the ratio of capillary pores to total porosity. Figure 18 illustrates the calculated ratios for capillary pores and large pores with narrow throats to overall porosity.

The percentage of capillary pores and large pores with narrow throats in the total pore volume of concrete materials.
The pore volume ratio of capillary pores in various proportions of fly ash concrete materials ranges from 22% to 43%, as illustrated in Figure 18. Incorporating fly ash into concrete with a specific water-binder ratio boosts the proportion of capillary pores, with the effect becoming more pronounced as the fly ash content increases. Specifically:
Adding 30% fly ash increases the pore volume ratio by 12% to 16.8% compared to concrete without fly ash. With 20% fly ash, the increase is 5.7% to 11.1% compared to concrete without fly ash. For a 10% fly ash content, there is a minor increase ranging from 0% to 4.8% compared to concrete without fly ash.
Furthermore, the ratio of large pores with narrow throats falls between 15% and 25%. However, under the same water-binder ratio conditions, the proportion of large pores with narrow throats remains largely unaffected by the addition of fly ash, as shown in Figure 18.
When the fly ash content is held constant, reducing the water-binder ratio leads to an increase in the proportion of capillary pores. In detail:
Concrete with a water-binder ratio of 0.3 has a capillary pore proportion that is 0% to 23.5% higher than that of concrete with a water-binder ratio of 0.4. Concrete with a water-binder ratio of 0.3 has a capillary pore proportion that is 14.2% to 40.1% higher compared to concrete with a water-binder ratio of 0.5.
Figure 18 further reveals that, with a constant fly ash content, an increase in the water-binder ratio results in a decrease in the volume proportion of large pores with narrow throats. Specifically:
The volume percentage of large pores with narrow throats in concrete material with a water-binder ratio of 0.3 is 0% to 26.9% higher than in concrete with a water-binder ratio of 0.4. The volume percentage of large pores with narrow throats in concrete material with a water-binder ratio of 0.3 is 24.2% to 48.1% higher than that in concrete with a water-binder ratio of 0.5.
These findings suggest that adjusting the water-binder ratio can significantly impact the pore structure of concrete materials.
The relationship between the volume proportion of large pores with narrow throats affected by the water-binder ratio is illustrated in Figure 19, showing a linear decrease as the water-binder ratio increases.

Linear relationship between w/b and proportion of large pores with narrow throats in total porosity.
The data for the three points represent the averages of 20 concrete specimens measured at each point, excluding the data values from specimens that exhibited cracking. Each water-binder ratio has 16 or more data points used to calculate this mean value. While the data basis for individual points is sufficient, to analyze the impact of water-binder ratio on pore shape proportion, it is necessary to expand the range of water-binder ratios.
Conclusions
In this paper, an experimental study was conducted to investigate the water vapor adsorption and desorption characteristics of concrete materials. Based on the adsorption and desorption data collected under varying humidity conditions, hysteresis curves were derived. A comprehensive analysis of the pore shape characteristics of the concrete materials was carried out, utilizing the relationship between the hysteresis curve and pore morphology. The key conclusions drawn from the study are as follows:
The water adsorption capacity of concrete is affected by the water-binder ratio. Within 0.3–0.5, a lower ratio boosts adsorption. At the whole range of relative humidity, adsorption decreases with higher ratios: V0.3 > V0.4 > V0.5. Concrete at 0.3 ratio adsorbs 5%–10% more moisture than at 0.4, and 17%–28% more than at 0.5. Water desorption from concrete mainly occurs within 400 h after humidity drops and stabilizes after 1200 h. Desorption requires more energy for first layer’s desorption than first layer’s adsorption, suggesting it's harder for water to leave pore walls than adsorbed on pore walls. Water retained in capillary pores and large pores with narrow throats in concrete causes hysteresis. Capillary condensation leads to a temporary peak in the hysteresis curve, while these large pores with narrow throats cause relatively permanent hysteresis at low humidity levels. The hysteresis curves help determine capillary and narrow-throat large pore ratios in concrete. Capillary pores account for 22%–43%, and narrow-throat large pores for 15%–25%. Higher fly ash content boosts capillary pore ratio at fixed water-binder ratio, while higher water-binder ratio reduces both types of pores at constant fly ash content.
Future directions and limitations
Contribution list
Lianjuan Miao was responsible for writing—original draft & editing, methodology, investigation, and data curation. Ming Wen was responsible for methodology, writing—review & editing, and project administration. Songsong He was responsible for writing—original draft & editing, investigation. Chujie Jiao was responsible for funding acquisition and supervision. Xinchun Guan was responsible for writing-review & editing and supervision.
Footnotes
Acknowledgments
The work described in this paper was supported by the grant from the National Natural Science Foundation of China (Project No. 52078148 and 52108125).
Declaration of conflicting interests
The authors declared no potential conflicts of interest with respect to the research, authorship, and/or publication of this article.
Funding
The authors disclosed receipt of the following financial support for the research, authorship, and/or publication of this article: This work was supported by the National Natural Science Foundation of China (grant number 52078148, 52108125).