
Abstract
Determination of the velocity sensitivity in coal reservoirs during the different production stages of coalbed methane wells is fundamentally crucial to adopt appropriate drainage technologies. To address this need, simulation experiments of coal samples from southern Qinshui Basin in China were conducted to test the variation of coal permeability with fluid flow. The pore structures were tested before and after the simulation experiment by using mercury injections, and the pore shape was observed using scanning electron microscope (SEM). The results show that formation water with fast flow may remove solid particles and that there is no velocity sensitivity under the experimental conditions of different coal samples and formation waters during the water production and depressurization stages of the coalbed methane well. There is a trend of the velocity sensitivity in the coalbed methane reservoir showing high concentration of solid particles during the stages of water production and depressurization. Coal permeability decreases with the increase of the fluid flow, there are different levels of velocity sensitivity in the coalbed methane reservoir during gas production of the coalbed methane well. The critical drainage flow should be within 11.26 m3/d during gas production of the coalbed methane well. The generation of the velocity sensitivity will make the pore structure of the coalbed methane reservoir poorly. During the stage of gas production, the formation water produces poorly, and the solid particles adhered to the surface of coal easily fall off and are deposited in the transition pore and micropore, which further results in the decrease of coal permeability.
Keywords
Introduction
Coalbed methane (CBM) exploration and exploitation has rapidly developed in a number of countries such as the USA, Australia, Canada, and China (Moore, 2012; Pan and Wood, 2015). CBM recovery has stimulated the fundamental studies of gas production affected by the variation of coal permeability during the CBM development process (Pan and Connell, 2012; Tao et al., 2012), simulation of the fluid flow in coal (Chen et al., 2016; Zhang and Wang, 2016), simulation of CBM production history (Salmachi and Yarmohammadtooski, 2015), damage mechanism and protection measures of coal methane reservoir (Huang et al., 2015; Liu et al., 2015), and drainage control on CBM recovery (Liu et al., 2013). In these studies, the problems resulting from the decrease of coal permeability due to the velocity sensitivity caused by unreasonable drainage of CBM were researched.
What is the velocity sensitivity? The velocity sensitivity is defined as a phenomenon of reservoir rock permeability caused by solid particles blocking the pore throat due to the variation of the fluid velocity during the migration of solid particles within the fluid (SDPC, 2010). During CBM recovery, coal particles (or coal cuttings) produced by drilling or coal mass deformation under horizontal stress (Wei et al., 2013), as well as clay minerals mingling in the coal seam (Huang et al., 2012), easily block pores and fractures within coal seams (Gentzis, 2009; Park et al., 2014). Many researchers have explored the damage mechanism of the velocity sensitivity from coal particles and clay minerals during CBM drainage, summarized the source of coal particles and the occurrence of clay minerals, and proposed some protection suggestions for CBM recovery (Blauch and Morrison, 1998; Huang et al., 2015; Lehman, 1998; Macabe and Robert, 1999; Wei et al., 2013). However, most of the previous studies note the velocity sensitivity during the stages of the dewatering and the depressurization of CBM reservoirs, but do not verify and quantify the various effects of the velocity sensitivity on coal permeability, pores, and fractures in their experiments. To date, most studies provide only qualitative assessments regarding how the velocity sensitivity was generated and the damage results it produced (Huang et al., 2015). Increasingly more gas production wells have been drilled to increase the output of CBM in southern Qinshui Basin (Huang et al., 2015; Liu et al., 2013), but the well production rates of many CBM wells have not provided the expected yield (Huang et al., 2015; Liu et al., 2013; Qu et al., 2011; Tao et al., 2012); some researchers also noted that the velocity sensitivity was one important factor affecting CBM production (Huang et al., 2015; Liu et al., 2013; Tao et al., 2017; Wei et al., 2013). Therefore, it is necessary to conduct research to evaluate the damage caused on coal reservoirs by conducting a series of simulated experiments on velocity sensitivity and to determine the optimal drainage rate. This paper focuses on evaluating the potential damage from CBM reservoirs during different production stages of a CBM well caused by velocity sensitivity based on analyses of coal permeability, pore structure, and fracture structure, and gives an estimate of CBM drainage.
Qinshui Basin is the largest basin for CBM-bearing resources and is also the most active area for exploration and development of CBM in China (Liu et al., 2014). The study area is located toward the south of Qinshui Basin, in Shanxi province, China. Main CBM production blocks include Chengzhuang block, Panzhuang block, Fanzhuang block, and Zhengzhuang block (Figure 1). Coal seams in the study area are parts of the Taiyuan Formation of the Upper Carboniferous and the Shanxi Formation of the Lower Permian. The primary coal seams containing CBM are coal seam No. 3 of the Shanxi Formation and coal seam No. 15 of the Taiyuan Formation (Liu et al., 2013, 2014; Tao et al., 2012). The No. 3 coal seam is the main production layer for CBM because of its high adsorption saturation, a relatively high desorption pressure, stable thickness (6.0 m on average), high gas content (over 20 m3/t) and low embedded depth and formation pressure (Huang et al., 2015; Liu et al., 2013, 2014; Zhou and Yao, 2014).
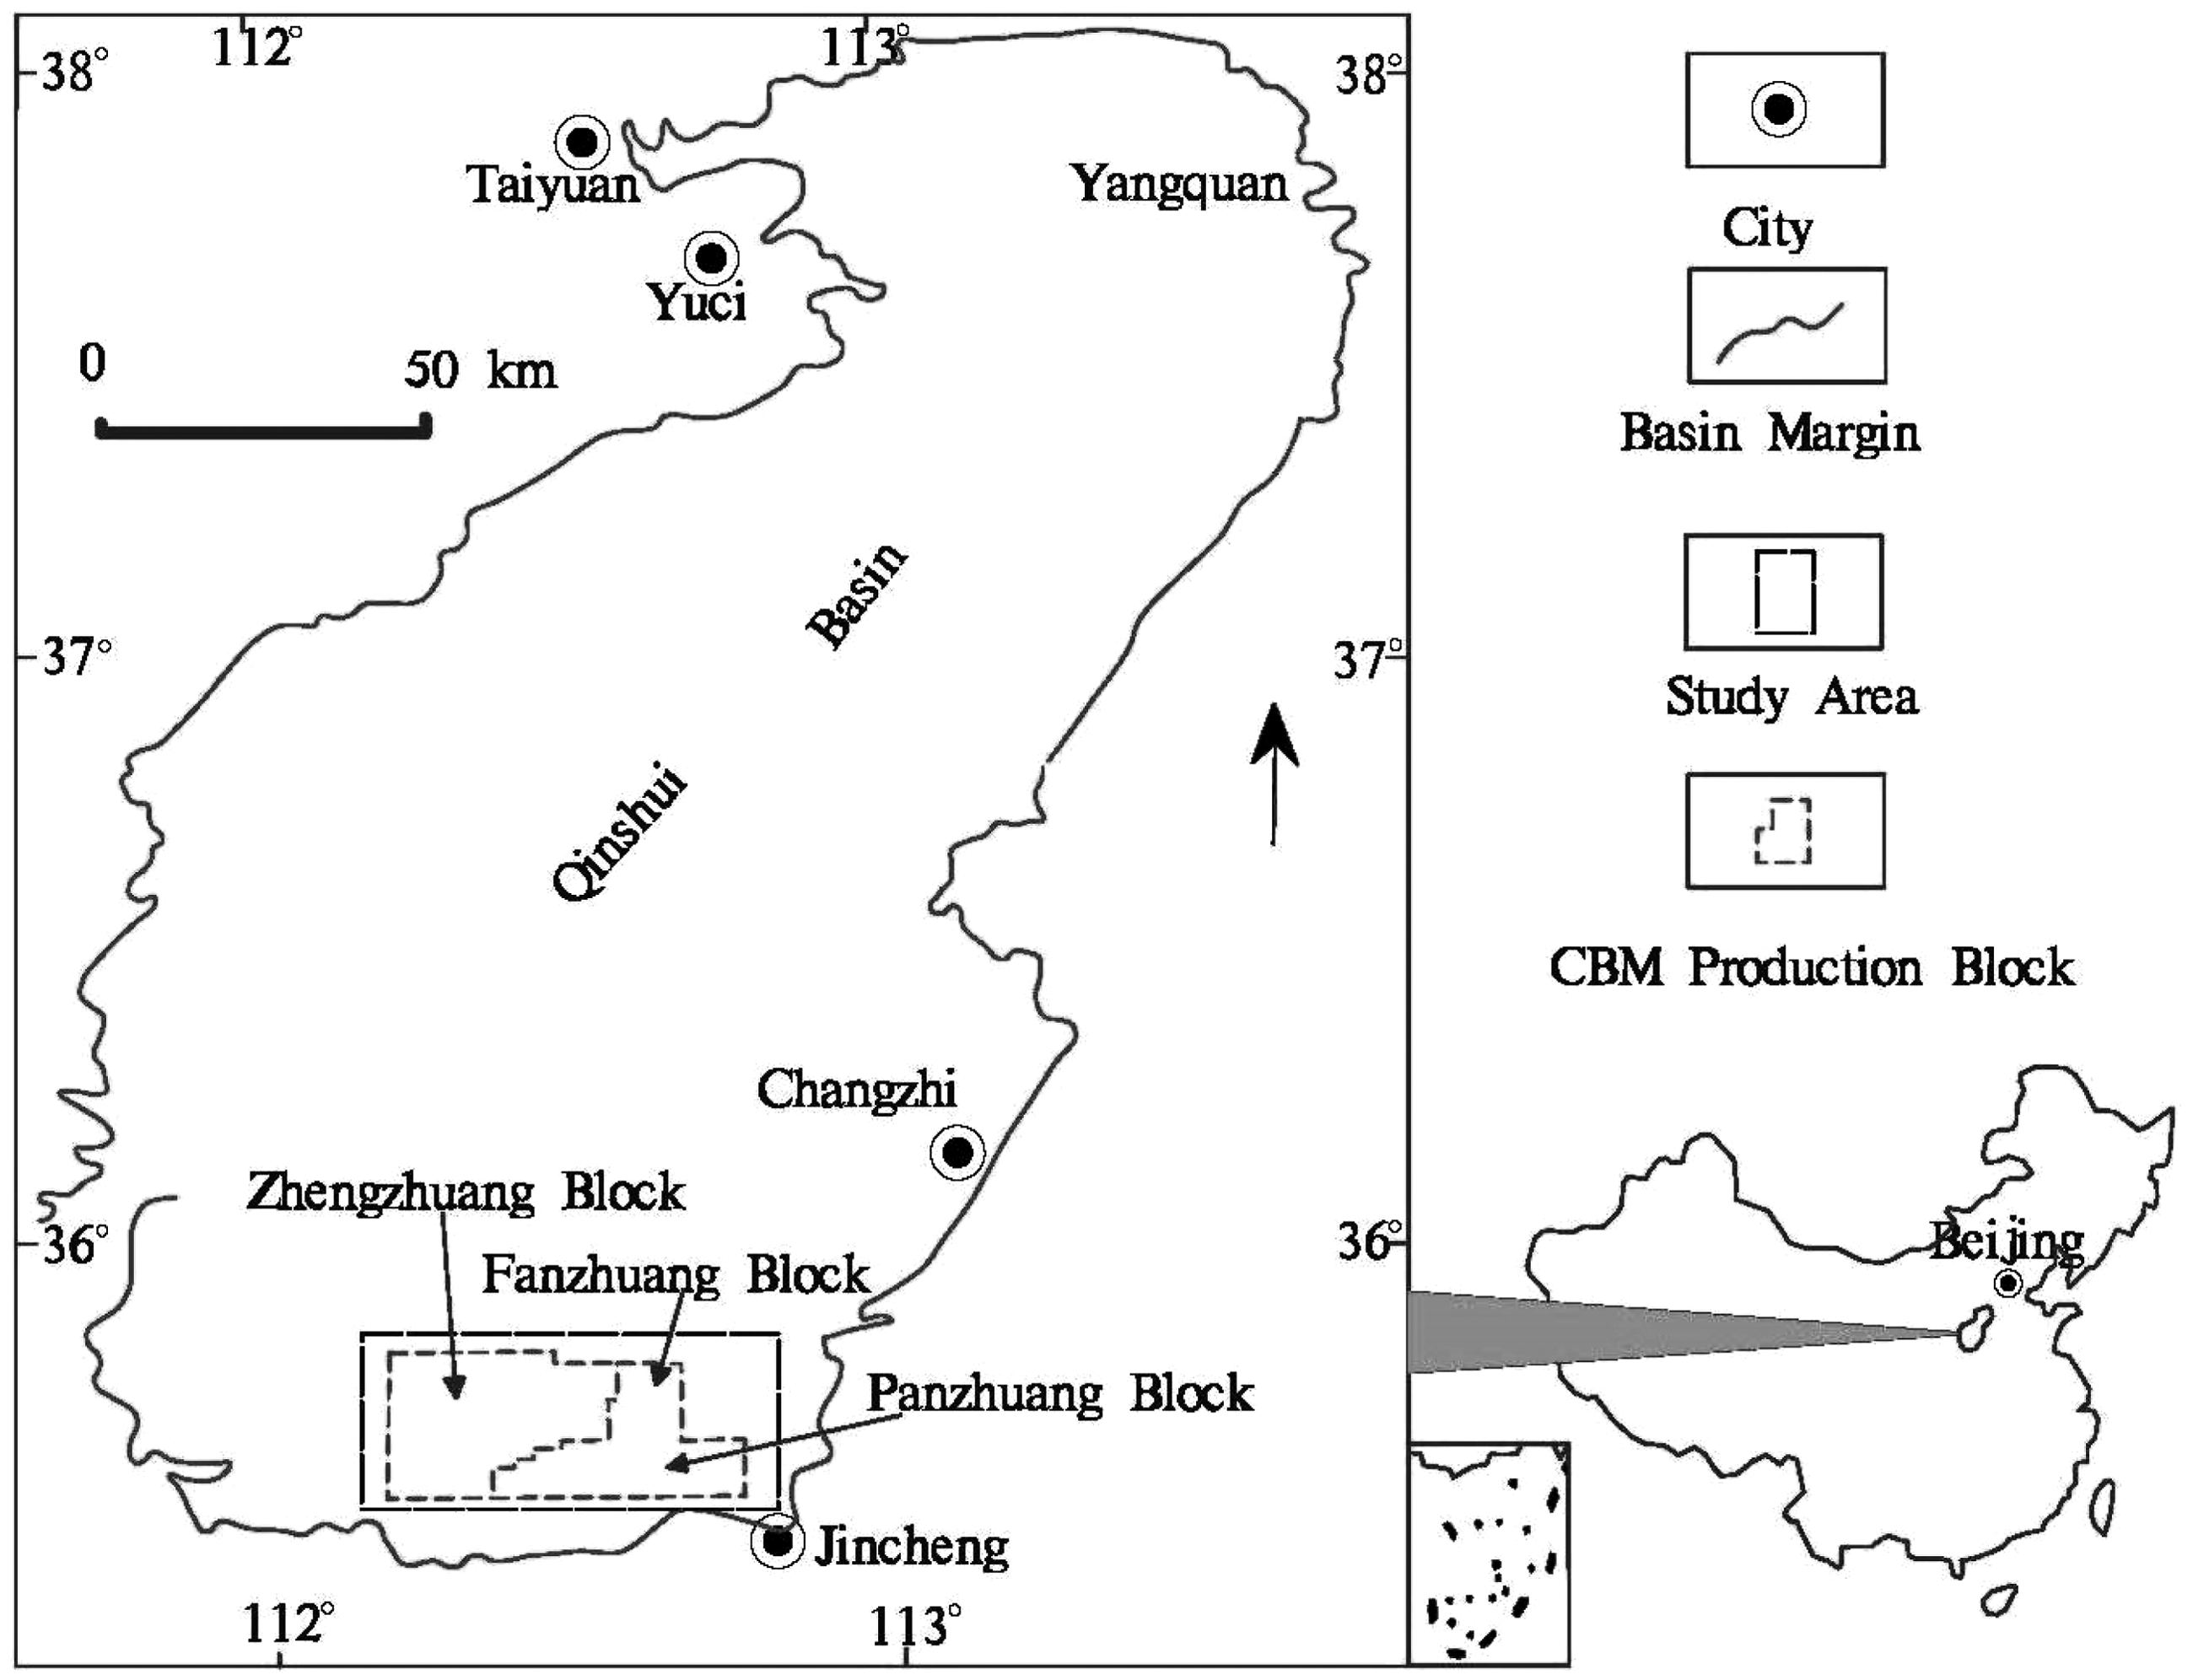
Geographic locations of the southern Qinshui basin (modified from Lv et al., 2012).
Methodology
Materials and samples
Coal sample CP-1 was collected from the Changping coal mine, and coal samples such as TALY-1 to TALY-14 of the No. 3 coal seam were collected from the Tiananluye coal mine. All samples were cut into cylinders of approximately 5 cm in length and 2.5 cm in diameter. The formation water samples include Nos. 1, 2, 3, and 4 from CBM well Nos. CQ-022, CQ-030, CQ-0232, and CQ-0244. The water sample No. 5 was from ultra-pure water. The turbid water samples Nos. 6, 7, 8, and 9 were mixed with super purified water and different amounts of coal power in 200 meshes, and water sample No. 10 was from ultra-pure water. The driven gas used in this experiment was nitrogen. The basic data of coal samples and water samples used in the experiment are shown in Table 1.
Basic information for coal samples and experimental fluid.
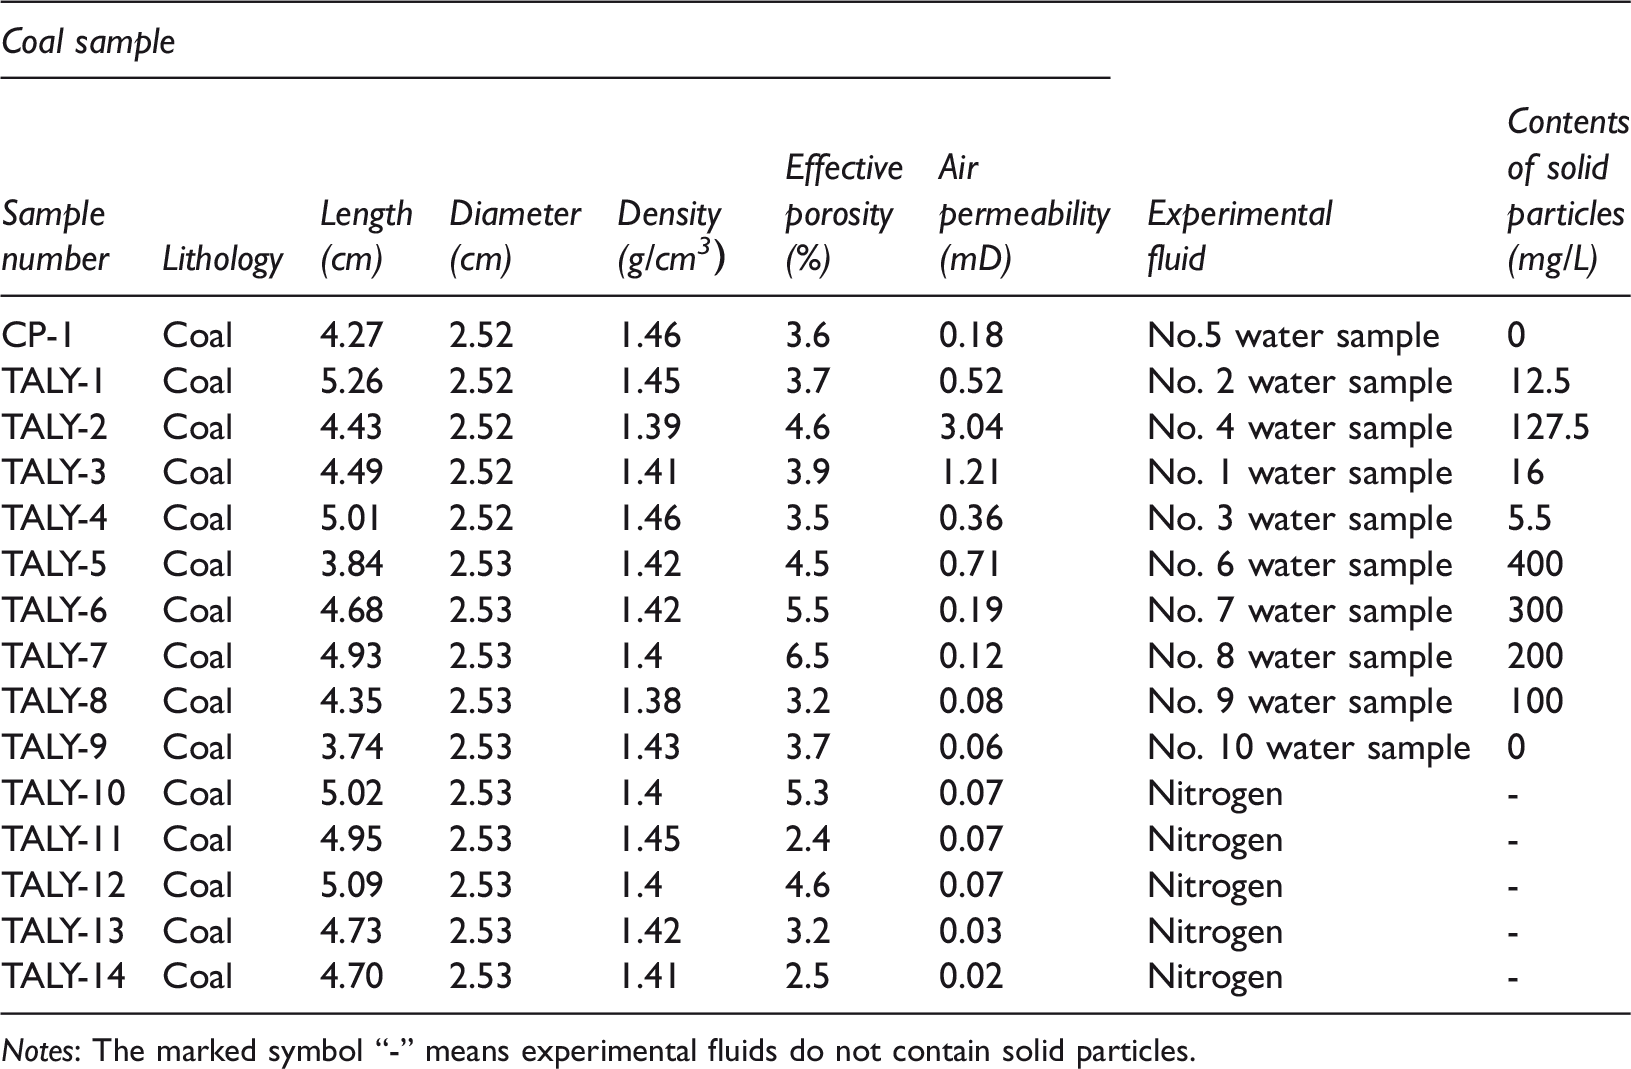
Notes: The marked symbol “-” means experimental fluids do not contain solid particles.
In Table 1, the concentrations of solid particles in water samples Nos. 1 through 10 are 16 mg/L, 12.5 mg/L, 5.5 mg/L, 127.5 mg/L, 0 mg/L, 400 mg/L, 300 mg/L, 200 mg/L, 100 mg/L, and 0 mg/L, respectively. The salinity of all water samples is between 1700 mg/kg and 2800 mg/kg. The test of velocity sensitivity for coal samples TALY-10, TALY-11, TALY-12, TALY-13, and TALY-14 included a displacement with nitrogen.
Experimental method
In this study, the main principle for the simulation experiments was to test the dynamic permeability of coal samples under the pre-designed experimental conditions with collected formation water samples, using the prepared water samples as driving media according to Darcy's law. The entire simulation experiments were divided into three types: the simulation experiment No. 1 used the sampled water samples Nos. 1, 2, 3, and 4 and the ultra-pure water sample No. 5, and this experiment was conducted using a unidirectional fluid test under a constant effective stress while gradually increasing driving pressure differential; the simulation experiment No. 2 used the prepared water samples Nos. 6, 7, 8, 9, and 10, and this experiment included a fluid test in forward and reverse directions; the simulation experiment No. 3 used nitrogen as the driving media, and this experiment was conducted using a unidirectional fluid test. All simulation experiments were performed using the core flooding test device, and the experimental device is shown in Figure 2. The core flooding test was conducted according to Chinese petroleum and natural gas industry standard SY/T 5336-2006 in unconventional oil and gas lab from Langfang Branch of PetroChina Exploration & Development Research Institute.
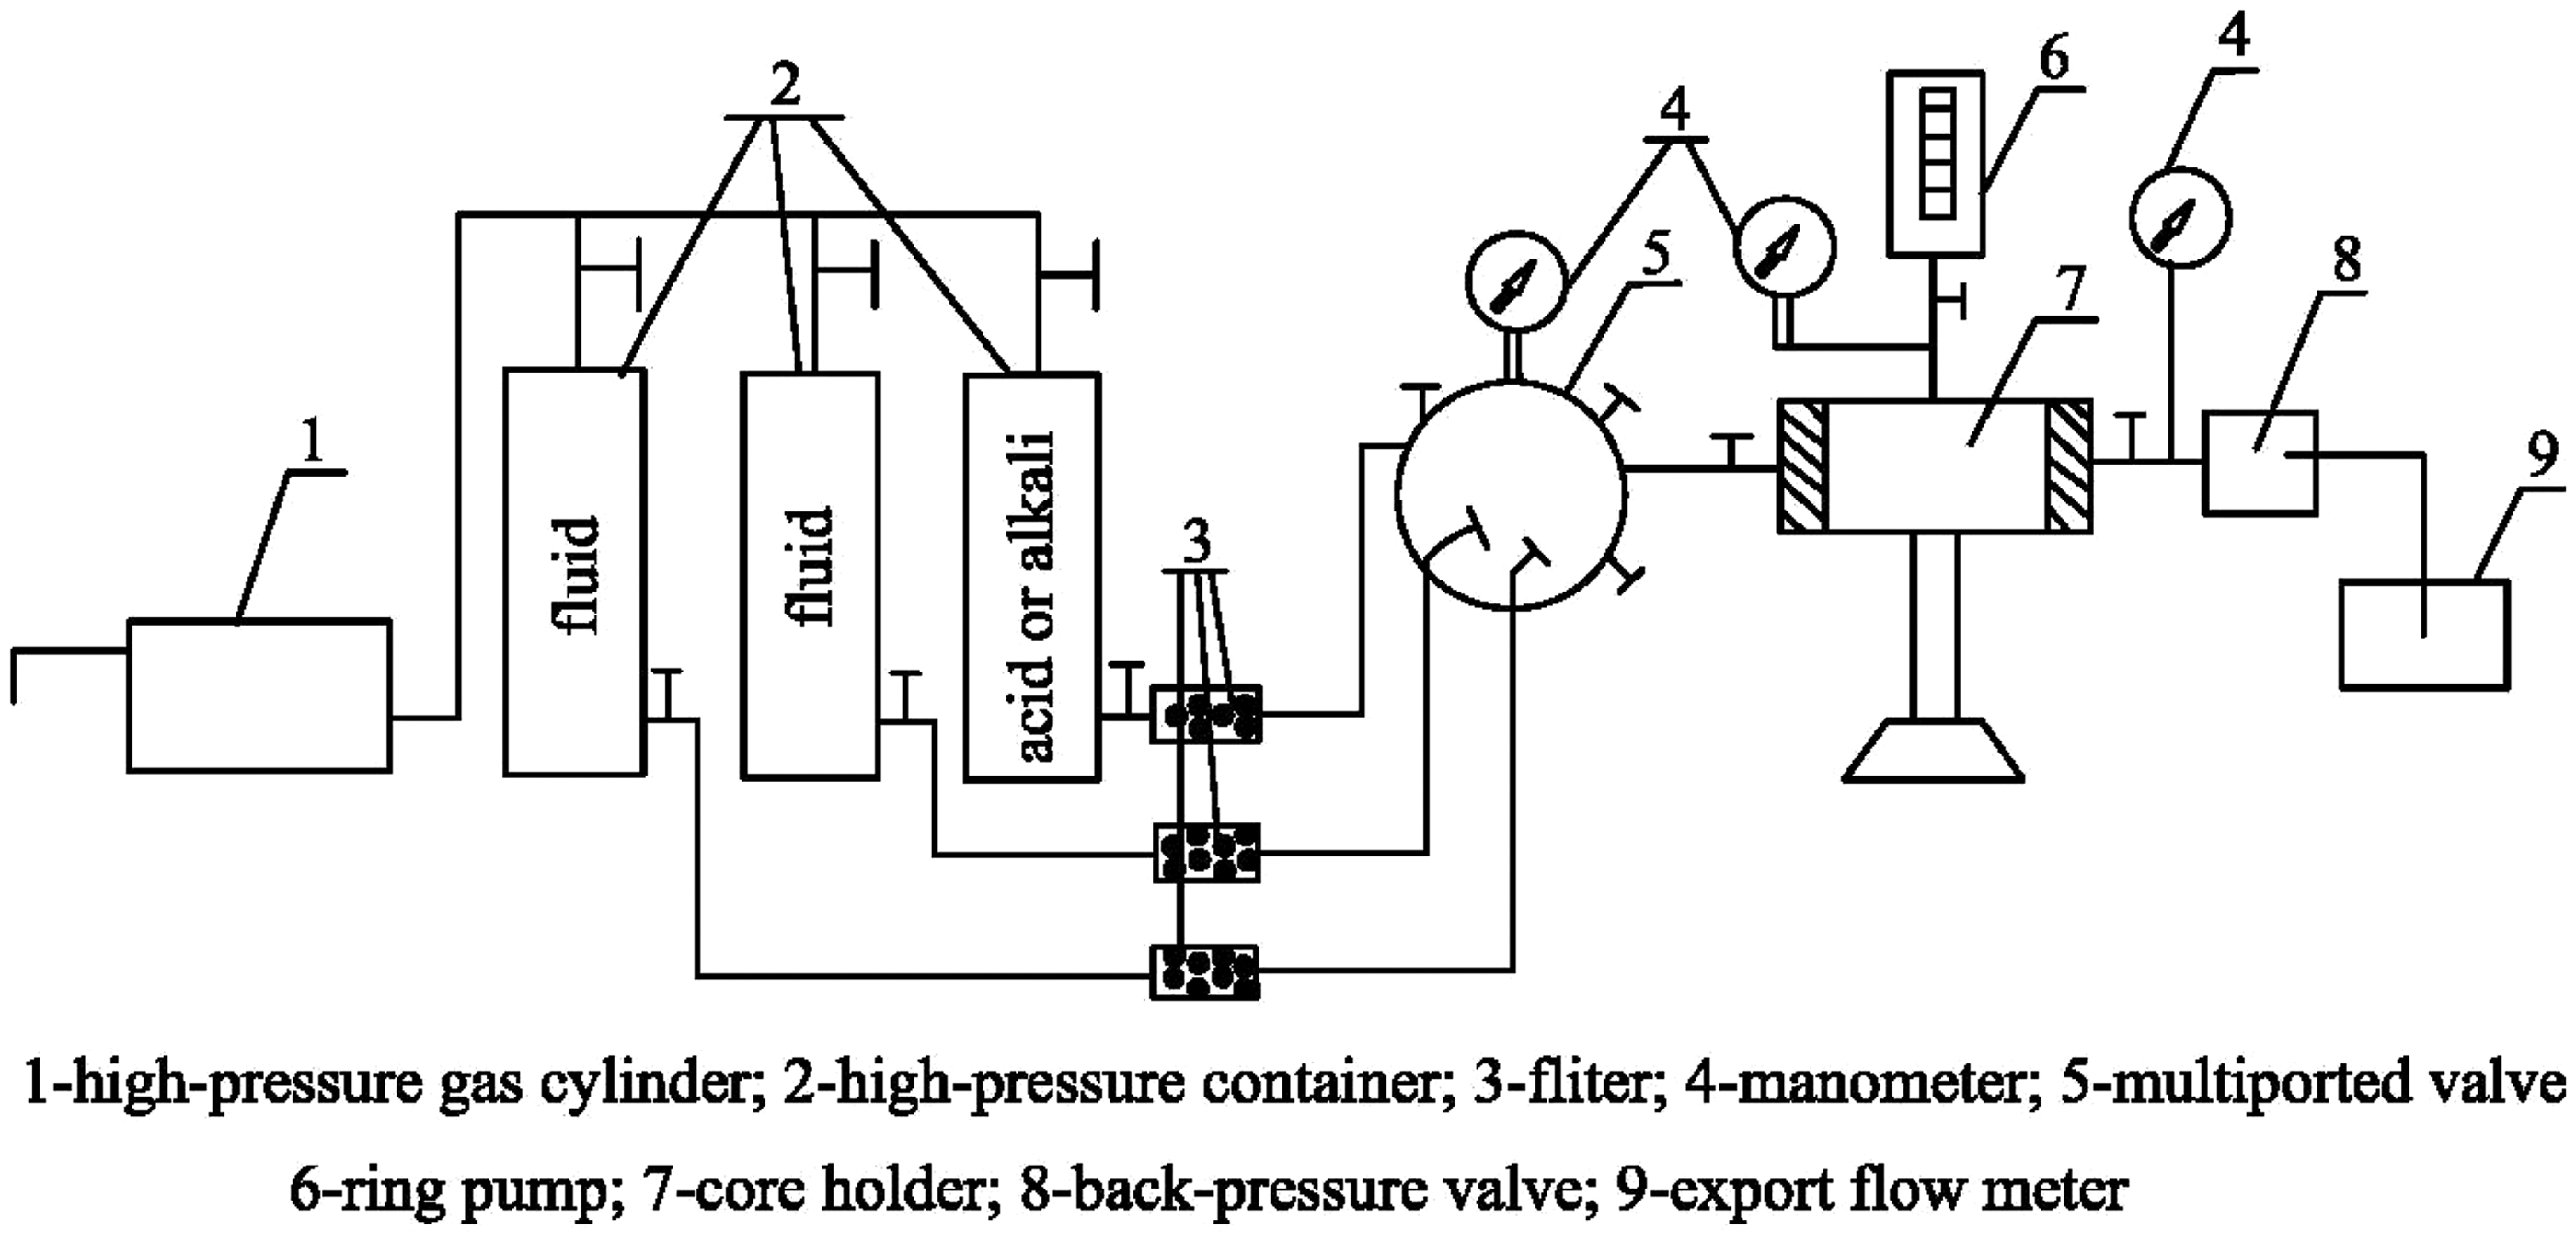
Flow chart for core flooding test.
The course for simulation experiments No. 1 and No. 2 was as follows: First, the fully saturated coal sample was loaded into the core holder, which ensured the flow direction of the fluid was in accordance with the flow direction of gas during the coal permeability test, and ensured that there was no air in the system; then the confining pressure was slowly increased up to 2.0 MPa, and the value of the confining pressure was ensured to exceed 1.5–2.0 MPa above the pressure value of the inlet pressure of coal sample. Second, the exhaust valve of the pressure inlet from the core holder was opened, and the driving pump was opened to discharge air from the high-pressure gas cylinder to the core. When the air was completely emptied from the high-pressure gas cylinder, the experimental fluid fully filled into the pipeline, and the experimental fluid flowed from the valve of the outlet, and the driving pump was closed. Since the valve of the outlet was then opened, the exhaust hole was closed. In simulation No. 1, the effective stress was kept at constant 5.0 MPa, the confining pressure was increased gradually at 0.5 MPa increments from 5.5 MPa, and was stopped when it reached 8.5 MPa. In simulation No. 2, the driving pressure differential was increased gradually during the experimental course. Since the coal permeability always increased, the flow direction of the fluid was switched, which started the reverse experiment, and the fluid velocity continued to increase from beginning to end of simulation experiment No. 2. In simulation experiments No. 1 and No. 2, if the fluid flow could not reach 6.0 cm3/min, and the pressure gradient was beyond 2 MPa/cm, the driving pump was closed, and the experiment was stopped.
In simulation experiment No. 3, all coal samples were saturated in advance, and the experiment was then started using procedures identical to simulation experiment No. 1, but the driving fluid was replaced with nitrogen.
To reveal the damage mechanism of the velocity sensitivity, the pore structure was tested before and after the simulation experiment by using mercury injection, and the pore shape was observed by SEM used to analyze the variation of pore shape in the experiment.
Analytical method
Based on the simulation experiment, statistical charts were plotted to analyze the formation of the velocity sensitivity, and Dvn is defined as the variation rate of coal permeability in accordance with different fluid velocity. The calculation formula is expressed in vector form as

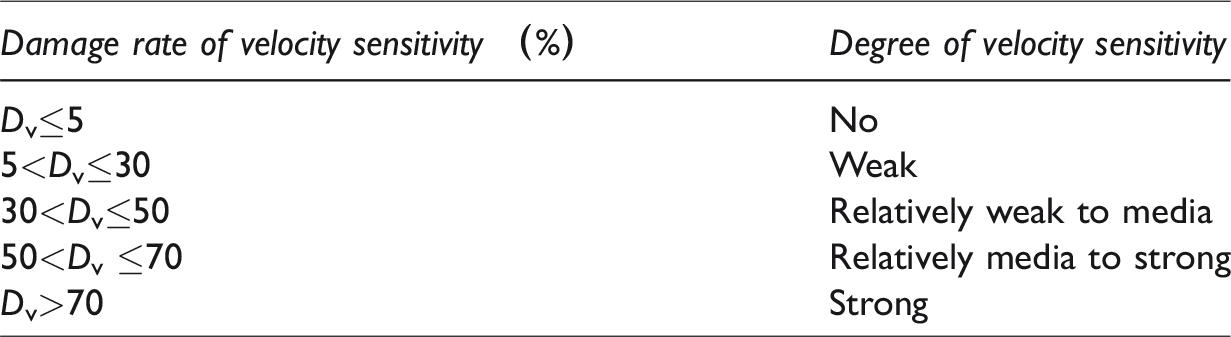
Vc is defined as the critical flow velocity, which is equal to the prior flow velocity of the fluid when Dvn is first above 20%. Dv is defined as the damage rate of the velocity sensitivity on coal samples during evaluation of the effect on coal permeability from the velocity sensitivity, Dv is expressed in vector form as

Evaluation index of damage degree of velocity sensitivity.
Results and discussion
As shown in Table 1, the concentrations of solid particles in water samples Nos. 1 through 5 are 16 mg/L, 12.5 mg/L, 5.5 mg/L, 127.5 mg/L, and 0 mg/L, respectively, and the initial coal permeability values of coal samples CP-1, TALY-1, TALY-2, TALY-3, and TALY-4, are 0.18 mD, 0.52 mD, 3.04 mD, 1.21 mD, and 0.36 mD, respectively The concentrations of solid particles in water samples are consistent with coal permeability regarding the value according to the experimental design. The experimental results of the simulation experiment No. 1 are shown in Figure 3. In these results, it is observed that the dynamic coal permeability increases with increase of the fluid flow, the total increment of coal permeability is correlated to the value of fluid flow, and there is no velocity sensitivity no matter which coal samples were used and which adopted water samples were used. The dynamic coal permeability appears to have influenced the gradual increase of the driving pressure differentially, and the pore throat may have been distorted and the cleat may have been closed, which resulted in a decrease of coal permeability in the initial stage of the experiment according to air permeability of coal samples and initial coal permeability of the simulation experiment. However, coal permeability occurs due to an increase of the fluid pressure under a relatively low effective pressure with a value of 5.0 MPa. When the CBM well is at the stage of water production, the fluid which flows in the CBM reservoir is mainly formation water, and formation water with a fast flow can take the solid particles away. Therefore, the damage from the velocity sensitivity is not easily generated.
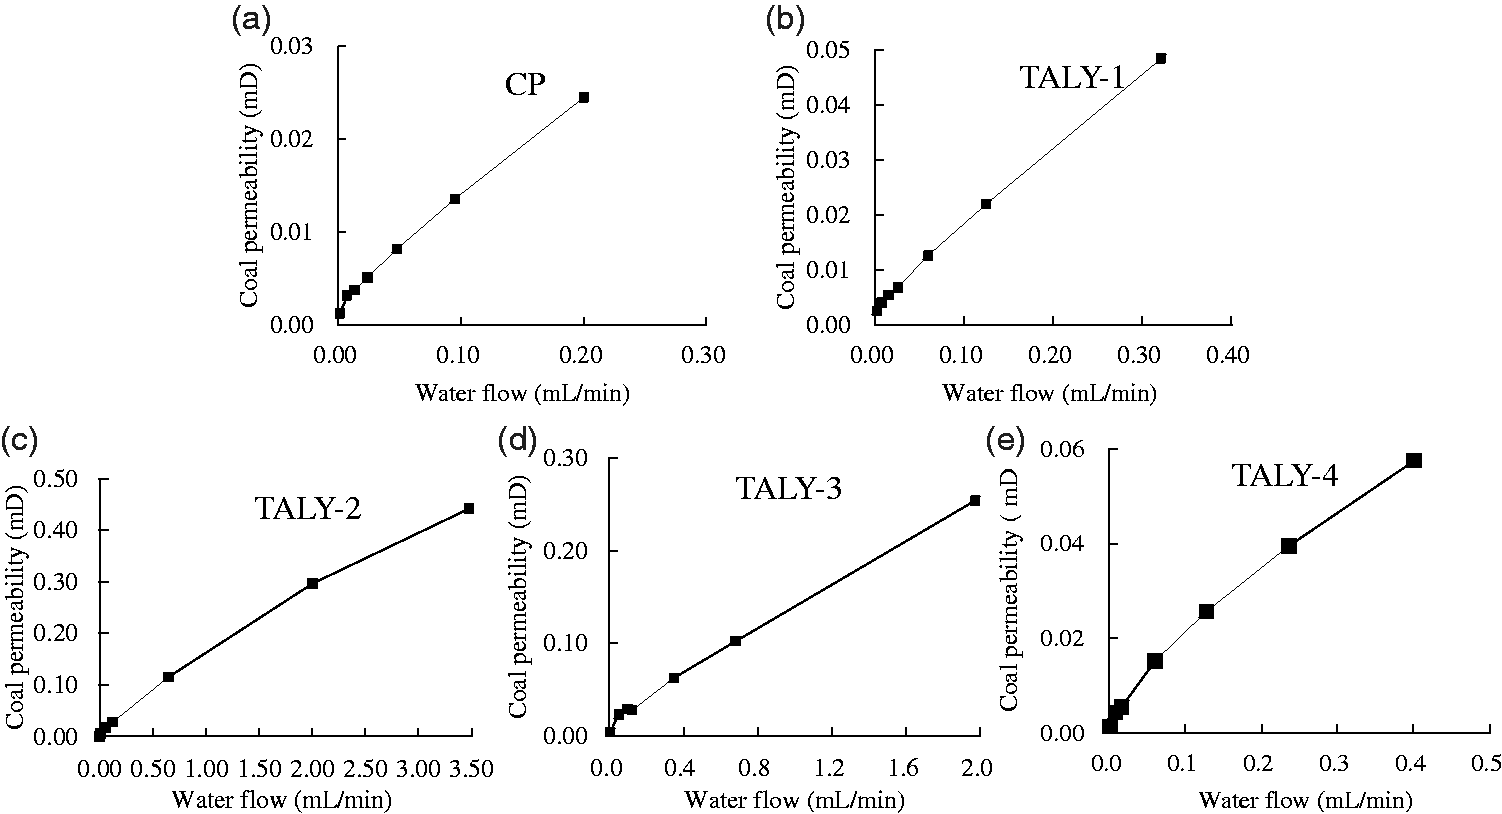
Variation of coal permeability with water flow in simulation experiment No. 1. In (a–e), the contents of solid particles are 0 mg/L, 12.5 mg/L, 127.5 mg/L, 16 mg/L, and 5.5 mg/L, respectively.
To analyze whether there is a trend of the velocity sensitivity in the simulation experiment, the plots of the amount of coal permeability and water flow were drawn in Figure 4.
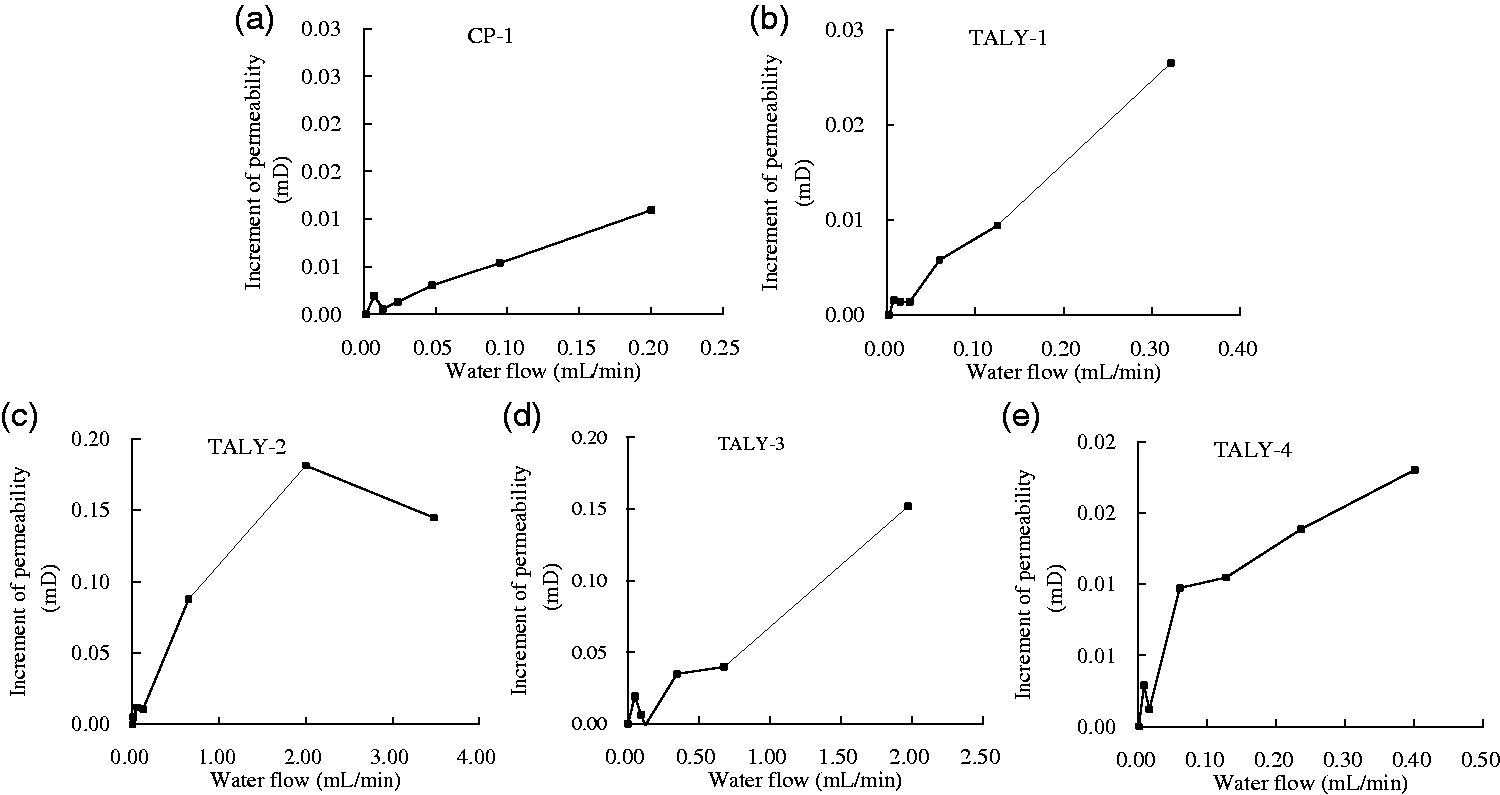
Variation on increment of coal permeability with water flow in simulation experiment No. 1. In (a–e), the contents of solid particles are 0 mg/L, 12.5 mg/L, 127.5 mg/L, 16 mg/L, and 5.5 mg/L respectively.
According to Figure 4, when the fluid flow is below 0.05 mL/min, there is a decreasing course of the amount of coal permeability to all samples, which demonstrates that there is an inhibitory effect from the solid particles on the amount of coal permeability under a relatively low fluid flow. Moreover, an inhibitory effect from solid particles is more obvious with the fluid flow is under the conditions of formation water with a high concentration of solid particles (as shown in Figure 4(c) and (d)).
In simulation No. 2, the air permeability values of coal samples TALY-5, TALY-6, TALY-7, TALY-8, and TALY-9 are 0.71 mD, 0.19 mD, 0.12 mD, 0.08 mD, and 0.06 mD, respectively. These results are shown in Figure 5. As shown in Figure 5, coal permeability increases with increase of fluid flow, there is no velocity sensitivity though the majority of coal samples have very low permeability, and the adopted water samples have a high concentration of solid particles.
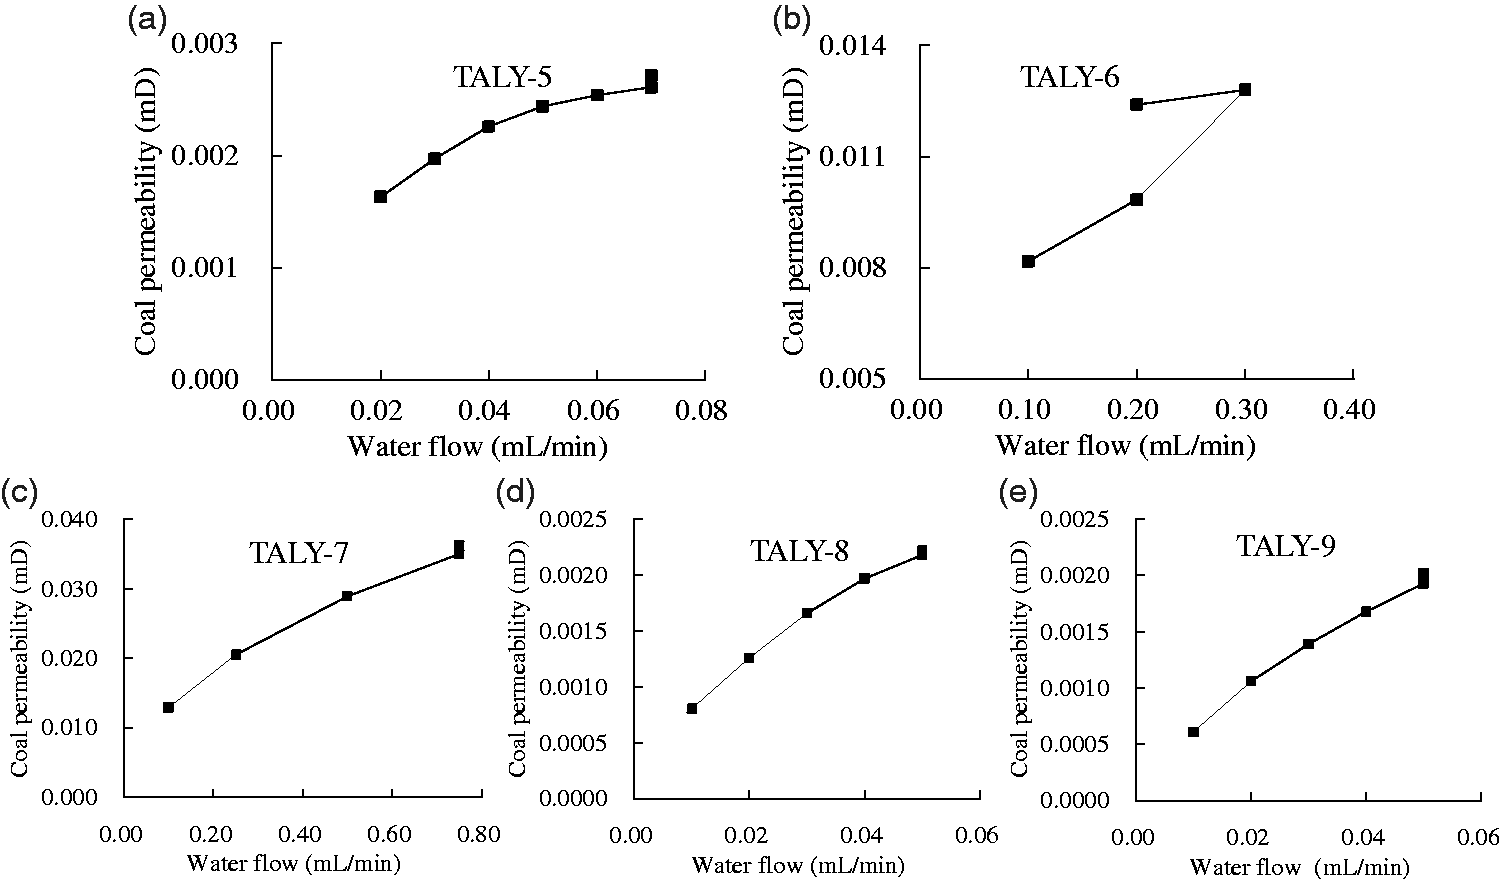
Variation of coal permeability with water flow in simulation experiment No. 2. In (a–e), the contents of solid particles are 400 mg/L, 300 mg/L, 200 mg/L, 100 mg/L, and 0 mg/L, respectively.
To analyze whether there is the trend of the velocity sensitivity in this simulation experiment, the plots of the amount of coal permeability and water flow were drawn in Figure 6.
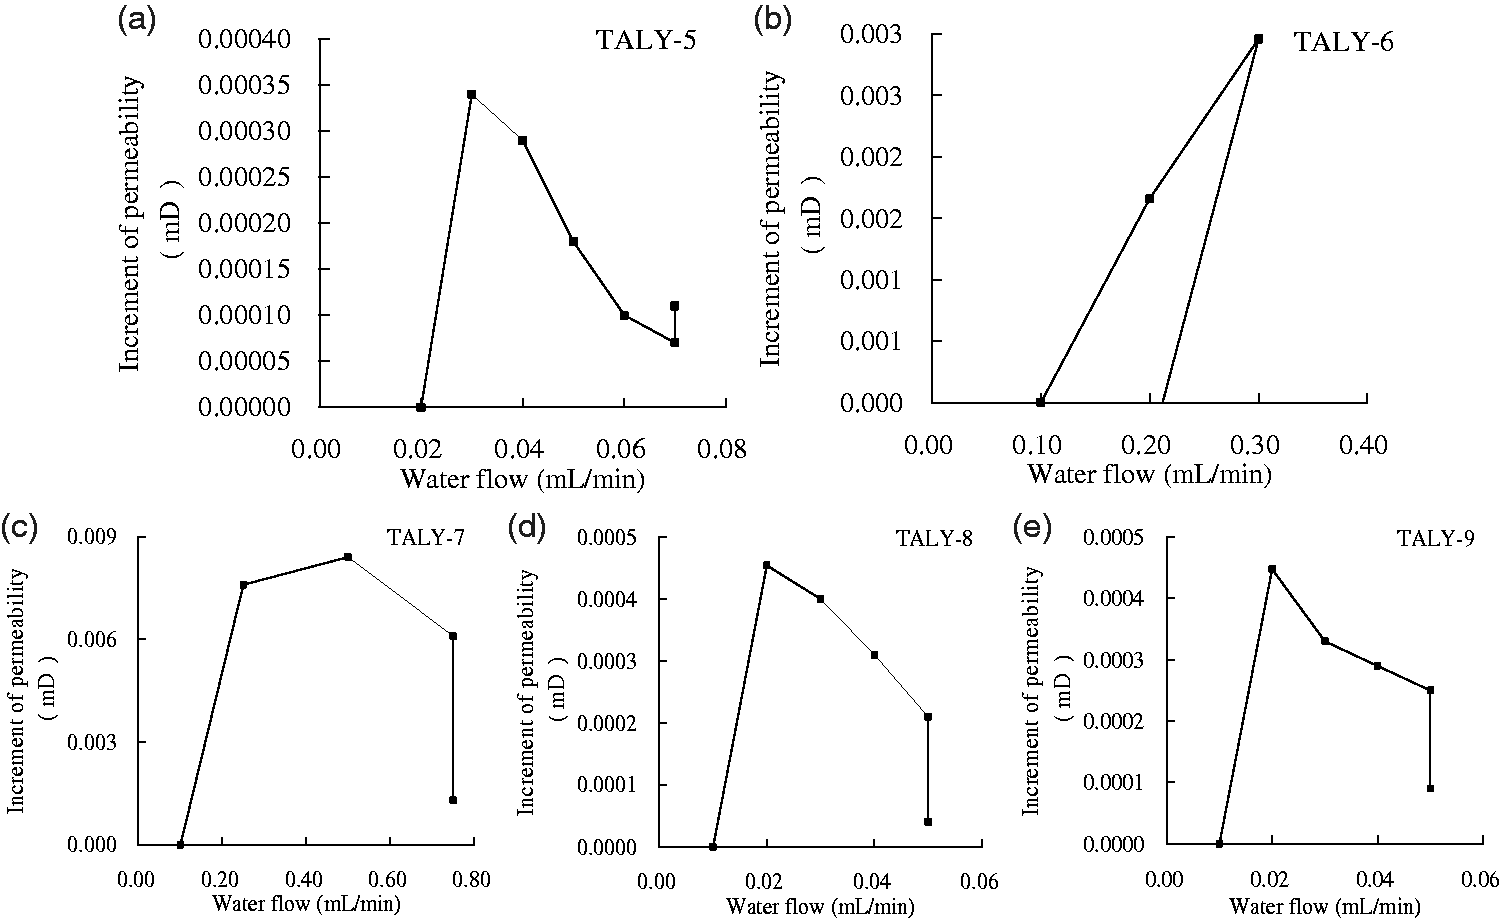
Variation on increment of coal permeability with water flow in simulation experiment No. 2. In (a–e), the contents of solid particles are 400 mg/L, 300 mg/L, 200 mg/L, 100 mg/L, and 0 mg/L respectively.
According to Figure 6, there is an obviously decreasing course of the amount of coal permeability in all samples, which demonstrates that there is an obvious inhibitory effect from the solid particles on the amount of coal permeability. Moreover, the inhibitory effects from the solid particles still exist when the reverse experiment is conducted. Figure 6 indicates that the sediments occur in the pore and cleat when the fluid flows in the pore-fracture system of coal samples when coal samples have a low permeability.
When comparing the results of simulation No. 1 and the results of simulation No. 2, the trend of the velocity sensitivity becomes more obvious, the concentration of the solid particles in the formation water appears higher, and the variation of coal permeability correlates to the scale of solid particles in the coal reservoir. Meanwhile the results from simulation experiments Nos. 1 and 2 demonstrate that the velocity sensitivity is difficult to generate during the stages of water production and depressurization, but there is a trend of velocity sensitivity when the concentration of solid particles the coal reservoir is high.
The simulation experiments No. 1 and No. 2 simulated the course of the velocity sensitivity during the stages of water production and depressurization. However, when the production of the CBM well entered the stage of CBM production, the fluid in the coal reservoir was mainly gas. As shown in Table 1, the simulation experiment No. 3 adopts nitrogen as the driving media, and the experimental results are shown in Figure 7.
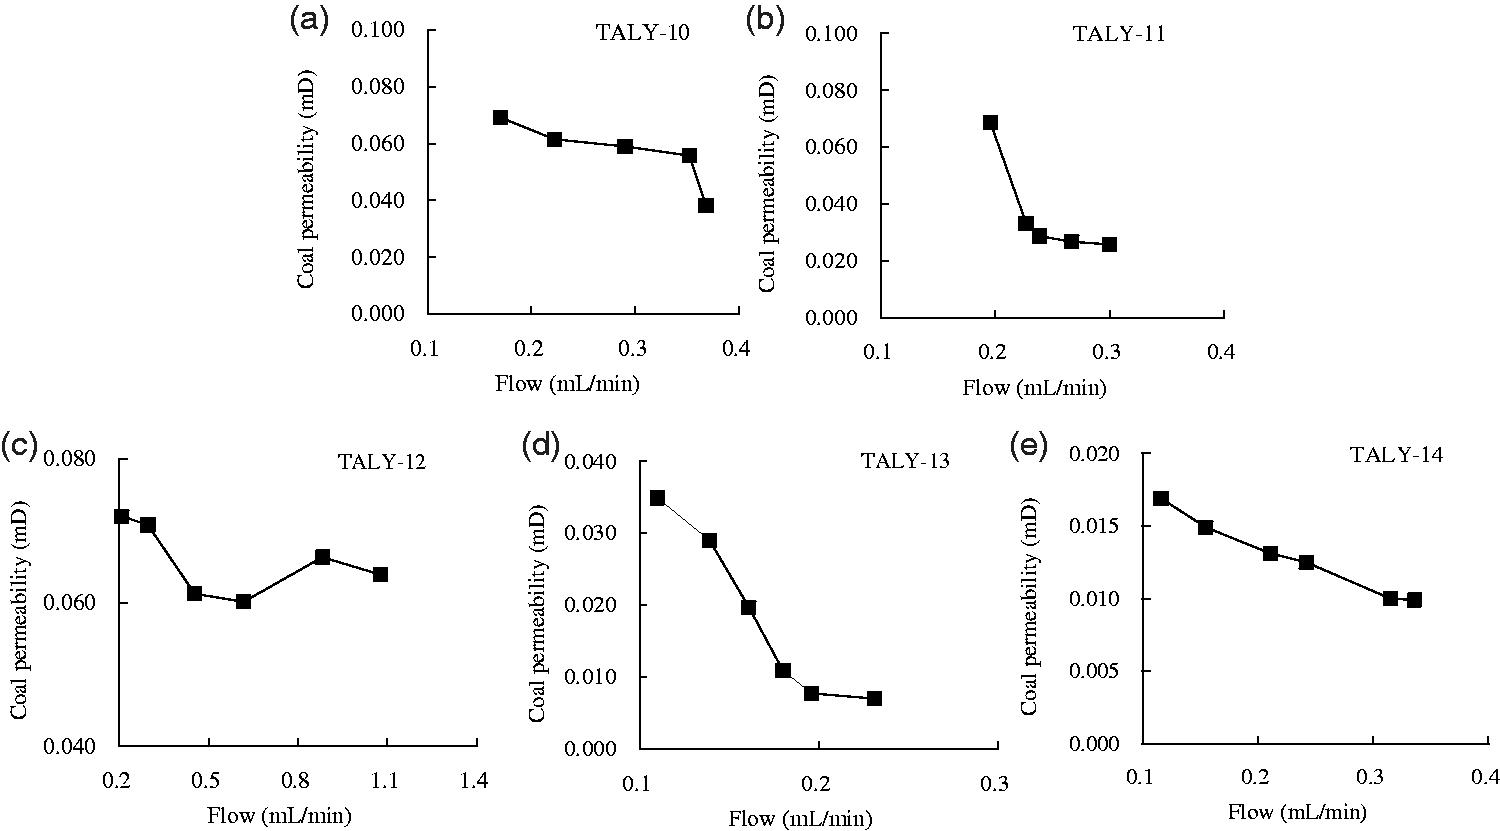
Variation of coal permeability with flow in simulation experiment No. 3.
The initial permeability values of coal sample TALY-10, TALY-11, TALY-12, TALY-13, and TALY-14 are 0.0692 mD, 0.0686 mD, 0.0720 mD, 0.0349 mD, and 0.0169 mD, respectively. The results of simulation experiment No. 3 show that coal permeability decreases with increase of flow, which suggests that there is an obvious velocity sensitivity in different coal samples.
As shown in Figure 7, the permeability of coal sample TALY-10 decreases from 0.0692 mD to 0.0382 mD, the permeability of coal sample TALY-11 decreases from 0.0686 mD to 0.0332 mD, the permeability of coal sample TALY-12 decreases from 0.0720 mD to 0.0601 mD, the permeability of coal sample TALY-13 decreases from 0.0349 mD to 0.00702 mD, and the permeability of coal sample TALY-14 decreases from 0.0169 mD to 0.00989 mD. This variation of coal permeability further indicates that solid particles adhered to the surface of the pores were washed off and deposited at the pore throat, resulting in the decrease of coal permeability.
Using equations (1) and (2) and Table 2, the variation rate of coal permeability and the damage degree of the velocity sensitivity were calculated. These results are illustrated in Table 3.
Evaluation result on damage degree of velocity sensitivity from simulation experiment No. 3.
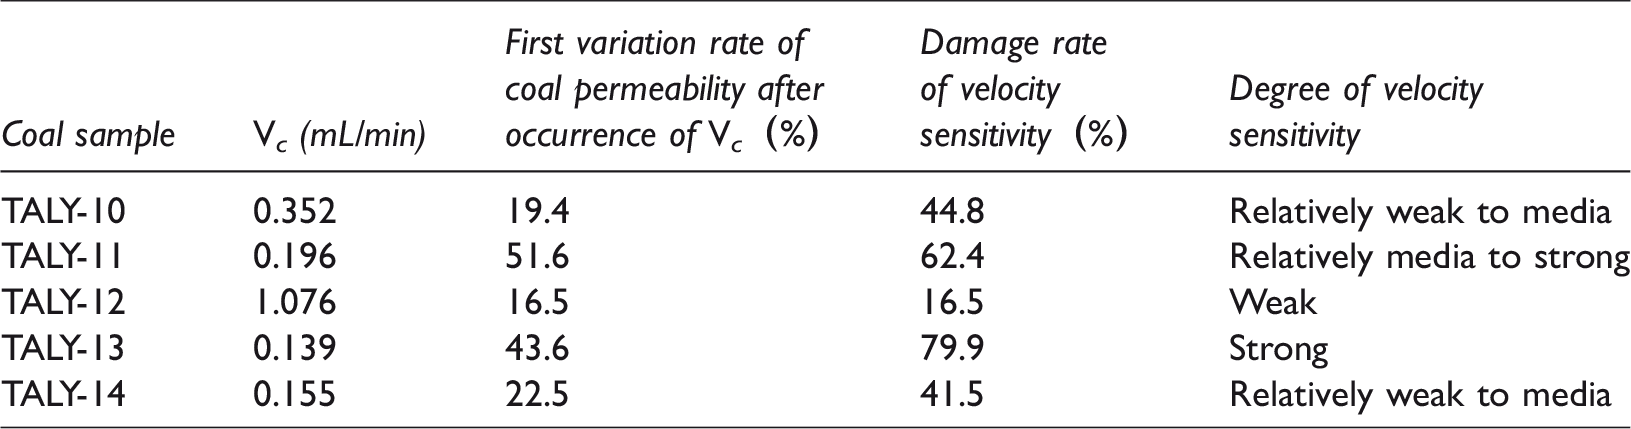
As shown in Table 3, five coal samples in simulation experiment No. 3 present different levels of the velocity sensitivity, which indicates that the pulverized coal and clay fell off the surface of the coal, and were deposited in the pore space and cleat within the CBM reservoir, resulting in decreased coal permeability. These results also suggest that velocity sensitivity may be generated when there is enough pulverized coal and clay during the production of the CBM well in gas production.
When the variation rate of coal permeability is beyond 20% for the first time, the Vc was calculated from the experimental results. The Vc values of coal sample TALY-10, TALY-11, TALY-12, TALY-13, and TALY-14 are 0.352 mL/min, 0.196 mL/min, 1.076 mL/min, 0.139 mL/min, and 0.155 mL/min (as shown in Table 3), respectively. In all these calculated critical flow velocity Vc values, the minimum value is 0.139 mL/min.
In the simulation, Q is defined as the flow (mL/min), v is defined as the flow velocity (m/min), A is defined as cross-section area of the coal sample (m2), and ϕ is defined as the porosity of coal sample. The flow Q can be calculated by equation (3)

If Q1 is defined as the experimental flow, then D1 is defined as the diameter of the coal sample, Q2 is defined as the drainage flow, and D2 is defined as the actual coal thickness. The relationship between Q2 and Q1 is described as equation 4

Equation (4) is simplified to equation (5)

The coal thickness in southern Qinshui Basin is 6 m on average (Liu et al., 2014), and the diameter of the coal sample is 2.52 cm in the simulation experiment. Therefore, the calculated value of Q2 is 11.26 m3/d, indicating that the critical drainage flow should be within 11.26 m3/d during gas production of the CBM well.
Damage mechanisms on velocity sensitivity of the CBM reservoir
To analyze damage mechanisms of coal samples from the velocity sensitivity, tests for the effects on pores by mercury injection were conducted on coal samples before and after the simulation experiment. The mercury injection and ejection curves and the growth characteristics of coal samples TALY are shown in Figure 8. The proportion of different pore diameters in the surface area and the pore volumes are shown in Table 4.
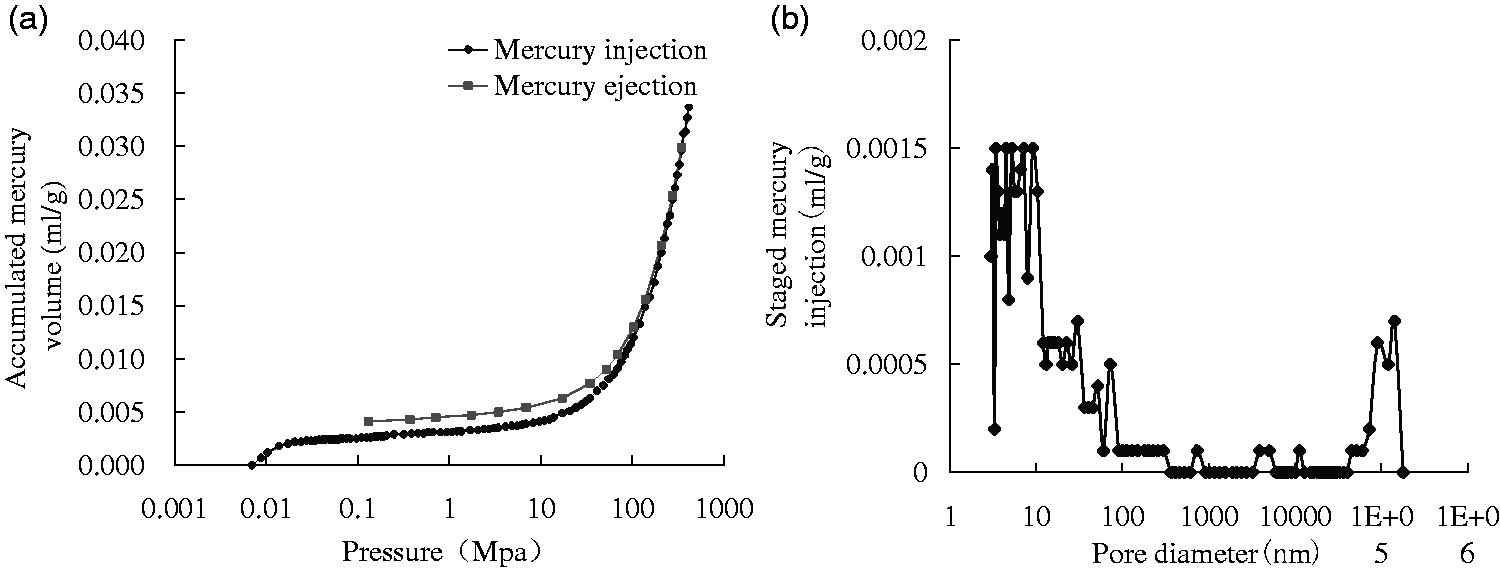
Relationships between accumulated adsorption and pressure (a), staged mercury injection and pore diameter (b).
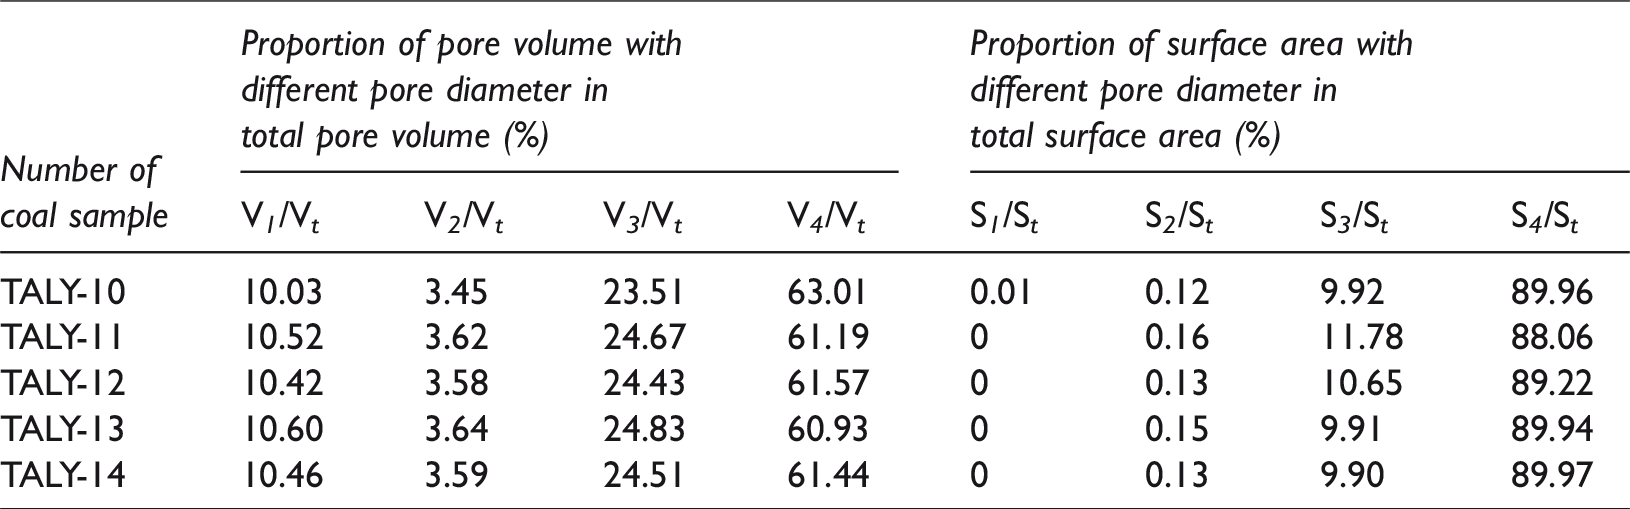
Proportion on different types of pore with different pore-diameter scale at pore volume, surface area; porosity of coal sample.
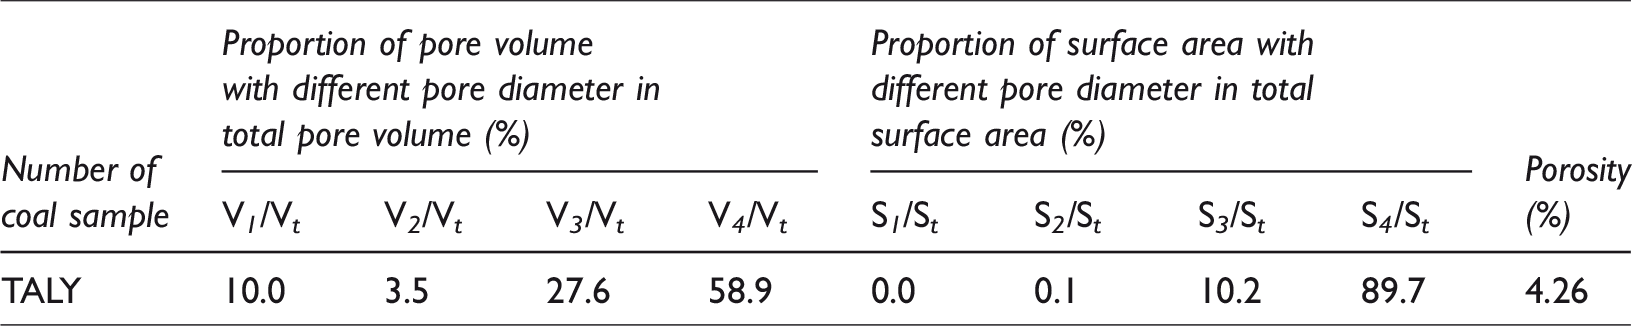
In Table 4, v1 through v4 and S1 through S4 represent the pore volumes and surface areas of macro-pore (D > 1000 nm), mesopore (1000 nm > D > 100 nm), transition pore (100 nm > D >10 nm), and micropore (D<10 nm), respectively, and Vt and St represent the total pore volume and the total surface area, respectively.
It is not difficult to see that the curve of ejection mercury does not overlap with the curve of injection mercury and that the curve of ejection mercury is located above the curve of injection mercury. The hysteretic loop between the curves of injection mercury and ejection mercury is relatively obvious, which indicates that some mercury cannot return from the transition pores normally, and further suggests that the pores are mainly semi-closed and that the connectivity of pores is weak (Figure 8(a)). As shown in Figure 8(b) and Table 4, the pore volume and surface area of the transition pore and micropore are dominant in all pores, and the mesopore develops poorly. The experimental results demonstrate that the pore structure, which is dominantly characterized as transition pore and micropore, is not favorable for the seepage of CBM, and results in deposition of pulverized coal and clay.
The types of pore in the coal sample TALY are transformative plant tissue pore (Figure 9(a)), protogenous gas pore partially filled with minerals (Figure 9(b)), plant tissue pore filled with clay (Figure 9(c)), transformation gas pore cluster (Figure 9(d)), and more (as shown in Figure 9). It is not difficult to see that the growth scale of the pores is small and that the majority of the pores are squeezed, transformative, and filled with clay. The results from SEM indicate that the growth of pores in the CBM reservoir from southern Qinshui Basin is poor, which suggests that the solid particles may be deposited in the pores during gas production in CBM development.
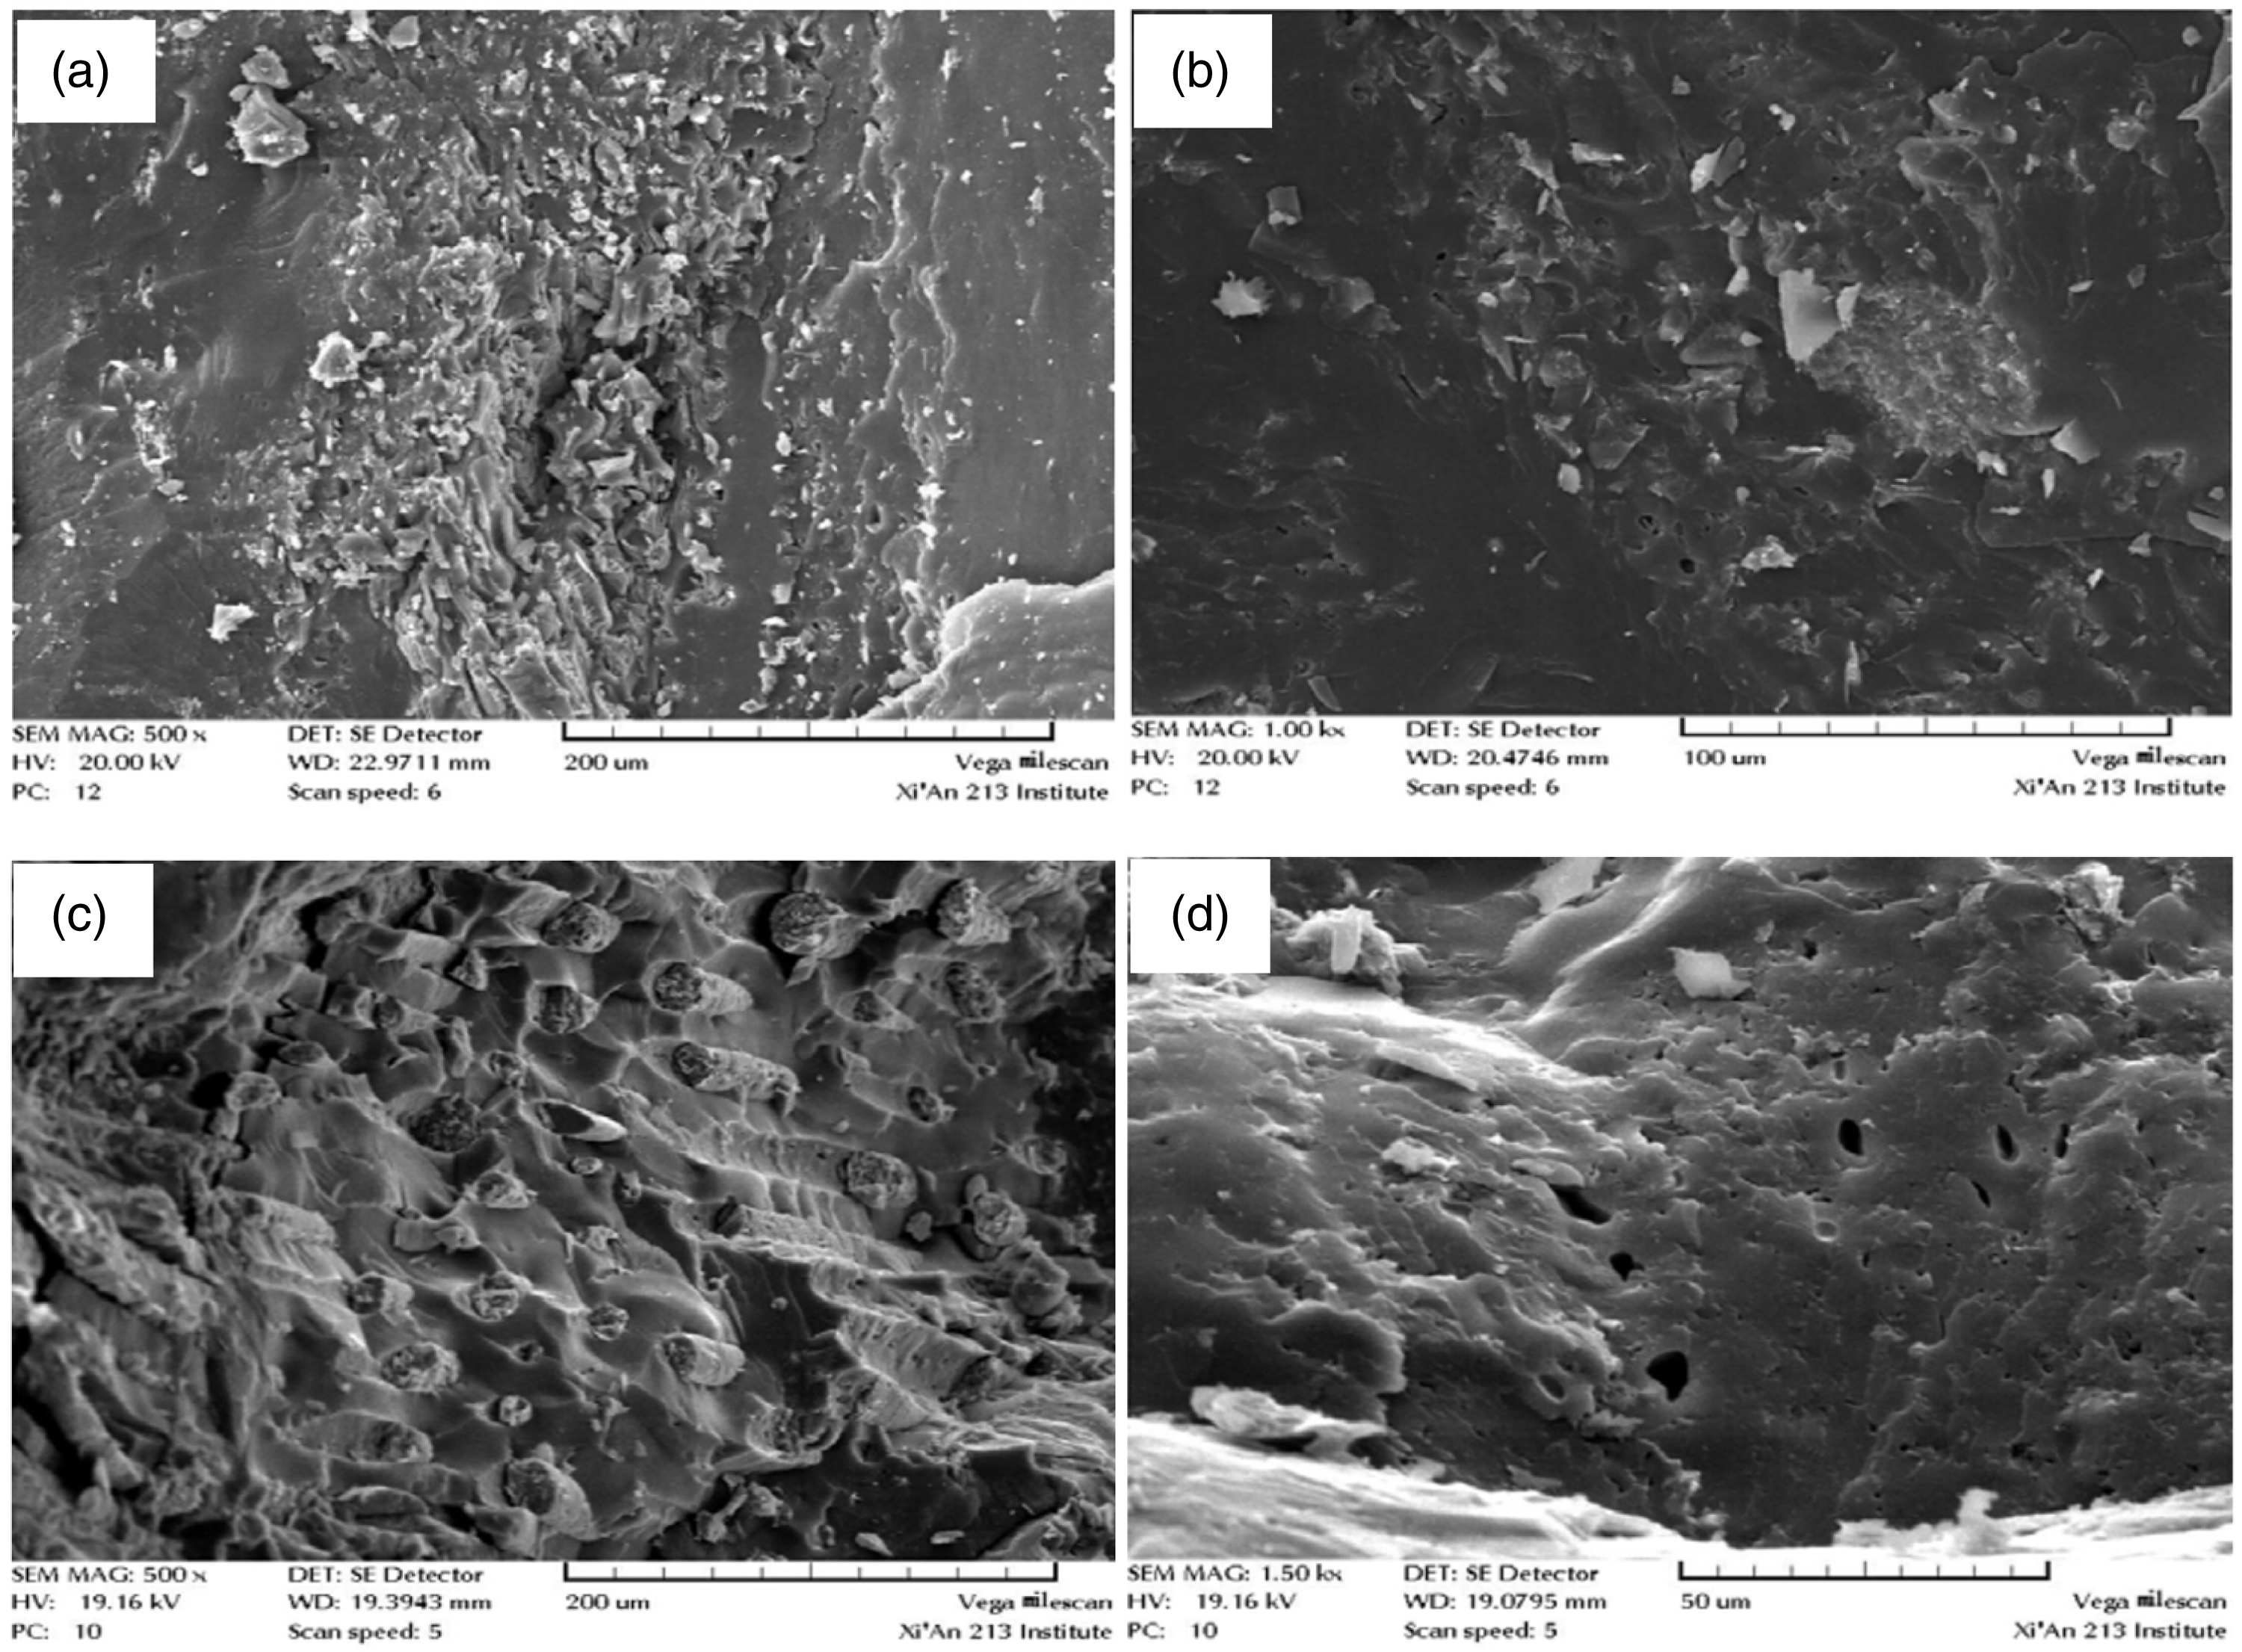
Transformative plant tissue pore (a), protogenous gas pore filled with minerals (b), plant tissue pore filled with clay (c), transformation gas pore cluster (d) in coal sample TALY from studied area.
For the purpose of analyzing the effect of the velocity sensitivity on the CBM reservoir during gas production, coal samples were tested by using mercury injection after the completion of simulation experiment No. 3. Figure 10 shows the curves of the mercury injection and ejection, Figure 11 demonstrates pore distribution, and Table 5 shows the proportion of different pore diameters and pore volumes in the surface area.
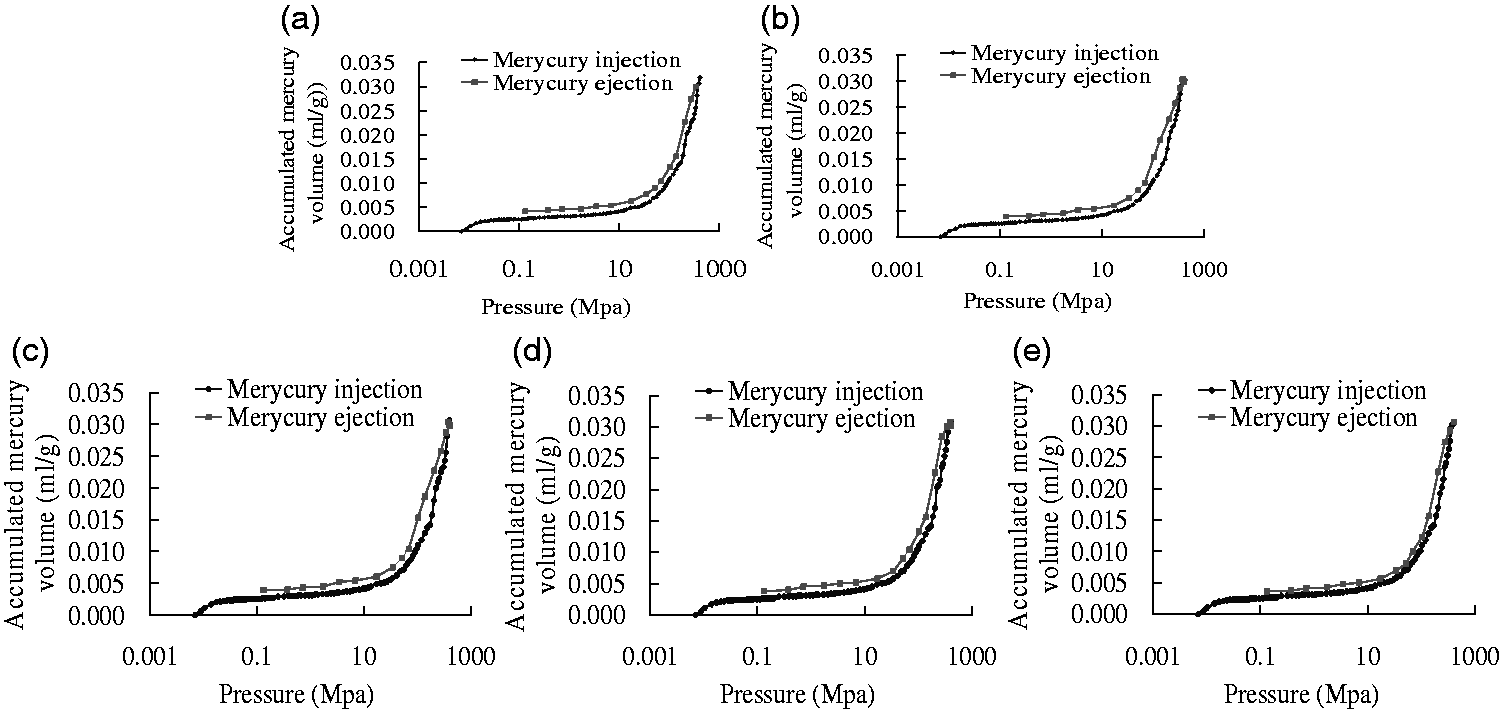
Curve of injection and ejection of coal sample TALY-10 (a), TALY-11 (b), TALY-12 (c), TALY-13 (d), and TALY-14 (e) after simulation experiment.
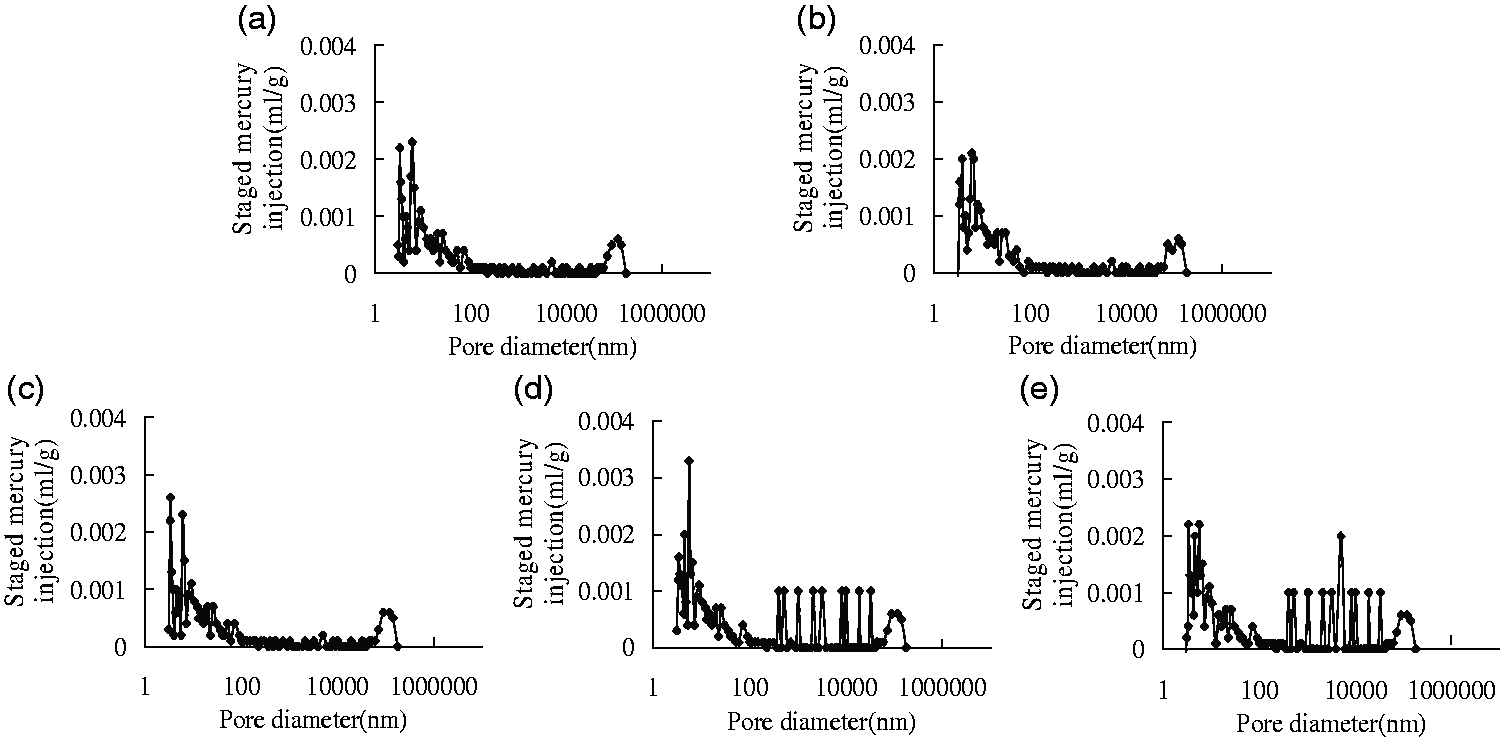
Pore distribution in coal sample TALY-10 (a), TALY-11(b), TALY-12 (c), TALY-13 (d), and TALY-14 (e) after simulation experiment.
Proportion on different types of pore with different pore-diameter scale at pore volume, surface area from coal samples after simulation experiment.
As shown in Figure 10, the curves of mercury injection and ejection of coal samples TALY-10, TALY-11, TALY-12, TALY-13, and TALY-14 after the simulation experiment change in different amounts. The hysteretic loop between the curves of injection mercury and ejection mercury becomes wider in the range of the macro-pore and becomes narrower in the range of the transition pore and the micropore, which indicates that the pore structure of the CBM reservoir is dominantly characterized as the transition pore, the micropore decreases, and the connectivity of the pore decreases. The pore distribution in coal samples TALY-10, TALY-11, TALY-12, TALY-13, and TALY-14 after the simulation experiment indicates that the staged mercury injection of partial coal samples such as TALY-13 and TALY-14 in the range of the macro-pore rise slightly, but the staged mercury injection of most pores decreases after the simulation experiment (Figure 11), which demonstrates that different types of pores all suffer damage from the velocity sensitivity, resulting in decreased pore volume in different types of pores.
Comparing Table 4 with Table 5, the proportion of the pore volume from the macro-pore in total pore volume increased slightly, the proportion of the pore volume from the micropore in the total pore volume increased significantly, and the proportion of the transition pore in the total pore volume decreased to an obvious extent. The transition pore easily transformed the micropore during the formation of the velocity sensitivity. When the CBM well entered the stage of gas production, the main fluid flowing into the CBM reservoir was CBM, the formation water produce poorly, and the solid particles adhered to the surface of coal easily fell off and were deposited in the transition pore and micropore, further resulting in decrease of coal permeability.
In Table 5, the definition for v1–v4, S1–S4 are identical to Table 4.
Conclusions
In this study, the velocity sensitivity of the CBM reservoir during different stages of the CBM well were based on the simulation experiments of coal samples from southern Qinshui Basin, China. This paper provides the following conclusions:
The dynamic coal permeability increases with increase of fluid flow; the formation water with a fast flow may take solid particles away, and there is no velocity sensitivity no matter what coal samples are used and how much of the formation water contains solid particles during water production and depressurization of the CBM well. The total amount of coal permeability is correlated to the value of fluid flow. The inhibitory effect from the solid particles on the amount of coal permeability under a relatively low fluid flow is obvious, and it is correlated to the scale of the solid particles in the coal reservoir. There is a trend of the velocity sensitivity in the CBM reservoir that indicates high concentration of solid particles during the stages of water production and depressurization. Coal permeability decreases with increase of fluid flow, and there are different levels of velocity sensitivity in the CBM reservoir during the gas production stage of the CBM well. The minimum value of the critical flow velocity is 0.139 mL/min when the velocity sensitivity is generated, and the critical drainage flow should be within 11.26 m3/d during the gas production stage of the CBM well. The pores of the CBM reservoir from southern Qinshui Basin are mainly characterized as transition pore and micropore. When the CBM well enters the stage of gas production, the generation of the velocity sensitivity will make the pore structure of the CBM reservoir poorly, causing the proportion of the pore volume from the micropore in the total pore volume to increase significantly and causing the transition pore to easily transform the micropore during the formation of the velocity sensitivity. During the stage of gas production, the formation water produces poorly, and the solid particles that adhered to the surface of coal easily fall off and are deposited in the transition pore and micropore, which further results in decrease of coal permeability.
Footnotes
Declaration of conflicting interests
The author(s) declared no potential conflicts of interest with respect to the research, authorship, and/or publication of this article.
Funding
The author(s) disclosed receipt of the following financial support for the research, authorship, and/or publication of this article: the National Natural Science Fund of China (Grant nos. 41330638, 41727801), China Postdoctoral Science Foundation (Grant no. 2016M601992).