
Abstract
Organic-rich marine shale in South China has great potential for gas generation, and the pore structure has a considerable influence on the enrichment of shale gas. The nanoscale pore characteristics and fractal characteristics of the Niutitang shales in the Fenggang block were studied by means of methane adsorption and low-pressure nitrogen adsorption experiments, porosity and permeability tests, X-ray diffraction analyses, organic geochemical analyses, and field emission scanning electron microscopy. The fractal geometry of the pore structure was assessed, and the factors influencing the pore structure were determined. We used a fractal Frenkel–Halsey–Hill-based method to obtain the fractal dimensions D1 and D2 by nitrogen adsorption at relative pressures of 0–0.5 and 0.5–1, respectively. The relationships between the shale pore structure parameters and the fractal dimensions, the mineral composition, the total organic carbon content, and the pore structure parameters of shale are discussed. In addition, the significance of D1 and D2 and the implications of the fractal dimension for the adsorption capacity of shale are investigated. The results show that the two fractal dimensions are positively correlated with total organic carbon content and specific surface area, negatively correlated with quartz content and average pore diameter, but have a weak relationship with clay mineral content and total pore volume. The Niutitang shale samples are dominated by mesopores, and the pore structure is complicated. The results presented here indicate that fractal analyses represent an effective method of characterizing the complexity of pore structure.
Introduction
Global energy shortages have led to an increased interest in shale gas (Gasparik et al., 2012). Shale gas, a new type of unconventional energy, has effectively alleviated the pressure of global supply and demand of oil and gas resources, especially in North America, where exploration and development of shale gas has made outstanding advances. Consequently, exploration efforts related to this new form of energy have increased around the world. Recently, the successful commercial development of the lower Silurian Longmaxi shale gas field in Chongqing has shown that the South China region represents an important area of shale gas production in China (Chen et al., 2011, 2013). The Fenggang block study area is located in northern Guizhou Province (Figure 1). The structural location of the study area is in the trough fold zone of the southeastern margin of the upper Yangtze plate in Western Hubei–Hunan Province, where the stress fields and structural conditions are complicated because of multistage tectonic activity and deformation. The study area experienced tectonic activity related to the Xuefeng (Neoproterozoic), Caledonian, Yanshanian (Jurassic-Cretaceous), and Himalayan orogenies, and the Yanshanian activity laid the foundation for the current geological structures and landforms (Ma et al., 2004). The study area was a deepwater shelf sedimentary environment in the early Cambrian, and the water depth gradually decreased from south to north. The Niutitang black shale in the Fenggang block has a thickness of 40–70 m and good continuity, which are beneficial to the accumulation of shale gas.
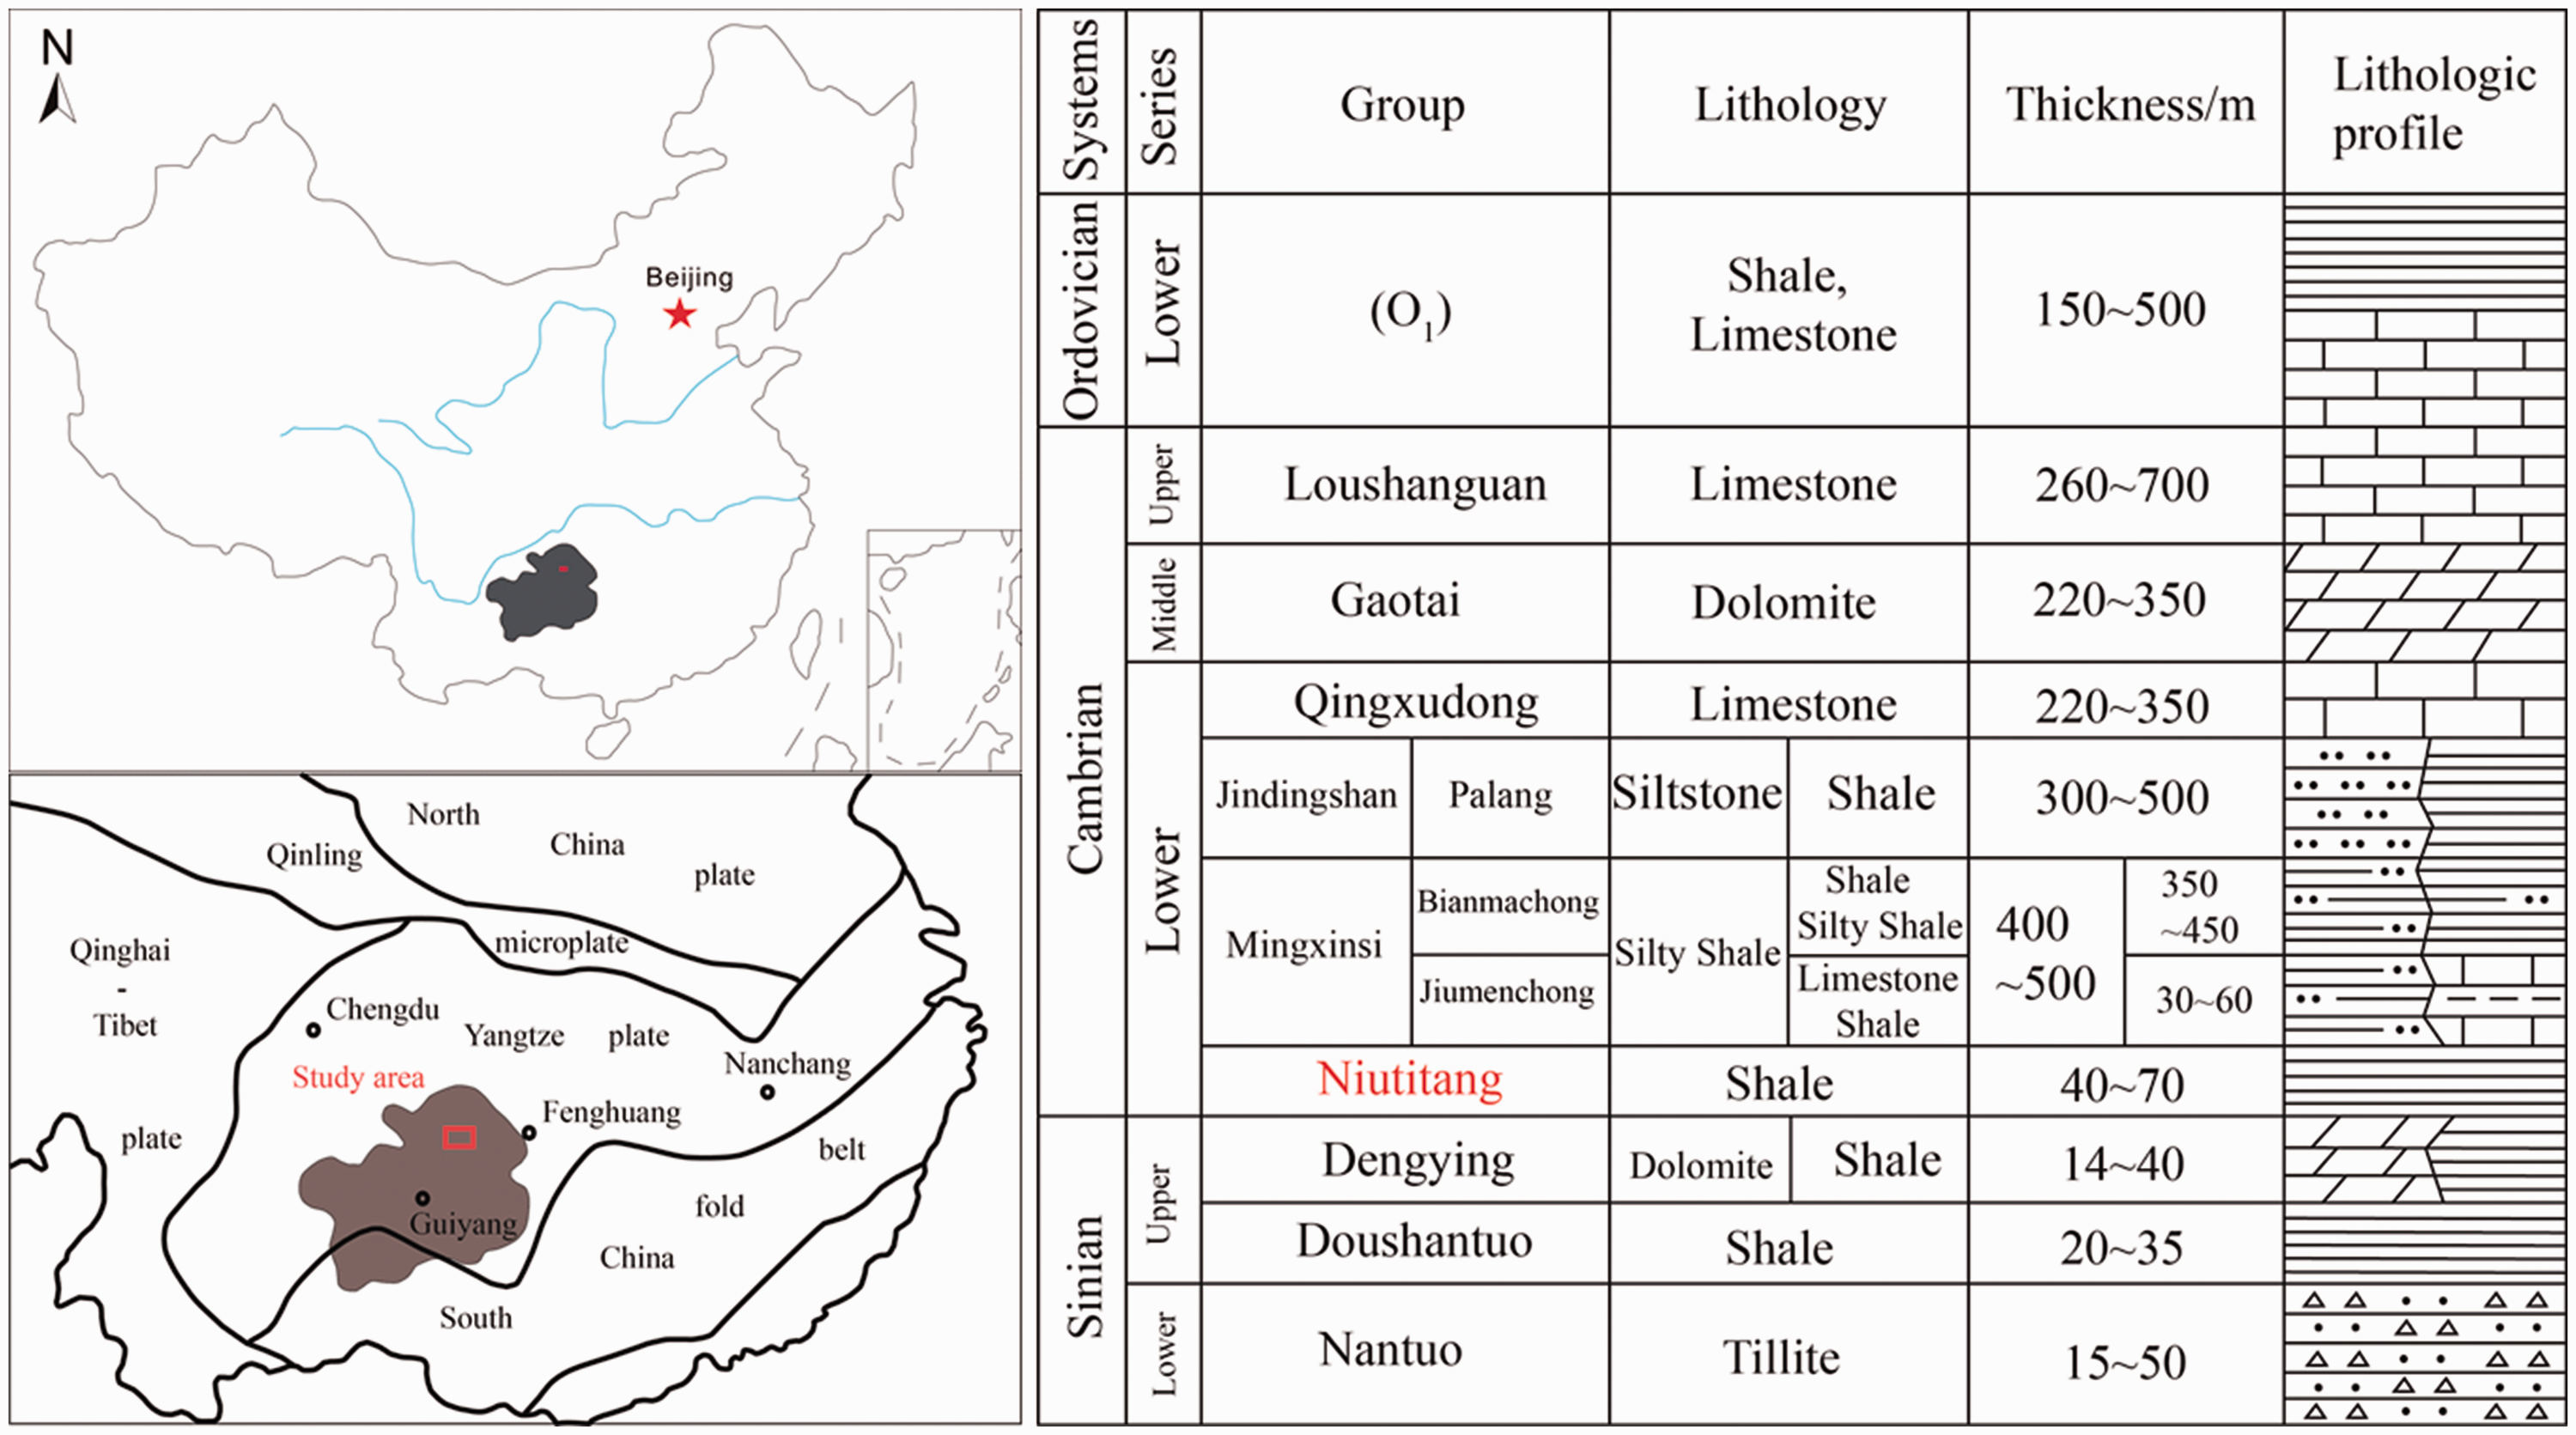
The location and the lithological and stratigraphic system of the study area.
Shale gas is mainly distributed in three states in black shale: free gas, adsorbed gas, and dissolved gas. The pore size determines the shale gas state, with adsorbed gas primarily stored in small pores and free gas mainly stored in large pores or fractures (Curtis, 2002; Zhong, 2012). According to the literature, large amounts of nanoscale and microscopic pores and microcracks are present in shale and are dominated by pore sizes between 2 and 50 nm (Labani et al., 2013; Wu et al., 2013). Pores in organic matter are widely considered to be important factors in the storage and transport of shale gas (Passey et al., 2010; Sondergeld et al., 2010). Although clay minerals can provide higher specific surface areas in shale, different clay minerals have different contributions to the surface area of organic-rich shales (Cao et al., 2015; Ji et al., 2012). Pore structure characteristics represent an important factor for determining shale reservoir performance and are key parameters for shale reservoir and shale gas resource evaluation. Shale reservoirs with higher surface areas and higher porosities have higher CH4 adsorption capacities.
A number of instruments and methods are currently available to study shale pore structure, such as nano-computed tomography (nano-CT), high-resolution field emission scanning electron microscopy (FE-SEM), mercury intrusion, double particle beam systems, and nitrogen adsorption. Nano-CT is affected by the three-dimensional image algorithm, and the results of the analysis are limited. FE-SEM has a poor statistical and limited scope and cannot effectively reflect the pore structure of shale reservoirs. Although a double particle beam system can characterize the nanoscale reservoir space, this method disrupts the structure of the samples. Although the mercury intrusion method is widely used to analyze the connected macropores, artificial cracks form when the high-pressure mercury is injected into shale samples, thereby affecting the measurement results. The nitrogen adsorption method has been used to obtain the quantitative surface area, pore volume, and pore size distribution (Chalmers and Bustin, 2007; Clarkson et al., 2013; Jiao et al., 2014).
Fractal theory is a mathematical theory first proposed by the French mathematician Mandelbrot in the 1970s (Mandelbrot, 1975). Its core idea is self-similarity, i.e. scale invariance in physics. Pfeifer and Avnir (1983) used the adsorption method to show that reservoir rock porosity has fractal properties. Shale is a porous material with complex microstructures and self-similarity, thus meeting the requirements of fractal theory (Yang et al., 2014). In this paper, the Frenkel–Halsey–Hill (FHH) method and low-pressure nitrogen adsorption experiment data are used to study the fractal characteristics of the pore structure (i.e. micropores, mesopores, and macropores) of the lower Cambrian Niutitang Formation. The fractal dimensions are used to reflect the degree of irregularity in the shale pore network, where higher fractal dimensions are associated with more complex pore characteristics.
The main purpose of this paper is to study the fractal characteristics of shale using the shale gas reservoirs in Guizhou Province, China. The fractal dimensions calculated in the range of two different relative pressures (P/Po) are based on the N2 adsorption data, and the FHH method is used to characterize the degrees of irregularity in the pore structure and pore surface. Then, relationships between the fractal dimension and the clay mineral content, TOC, permeability and porosity, and pore structure parameters of the shale are characterized. We also discuss the physical implications of the fractal dimension for the shale adsorption capacity.
Materials and methods
We collected 10 shale samples from the lower Cambrian Niutitang Formation in the Fenggang block, which is located in South China. In a previous study, we found that the Niutitang Formation was formed in an anaerobic and stagnant marine sedimentary environment. The upper strata of the Niutitang Formation consist of gray silty mudstone, limestone, and siltstone, whereas the lower strata are mainly black shales. Table 1 presents a list of the tested shale samples and their characteristics, including the TOC content, S content, thermal maturity, type index, and type. The TOC content of the shale samples ranges from 3.61 to 6.01%, with an average of 5.06%, and the samples have a high thermal maturity, with Ro values of 2.05–3.25%. The black shale kerogen type in the Fenggang block is mainly II1.
Geochemical characteristics of the shale samples from Niutitang Formation.
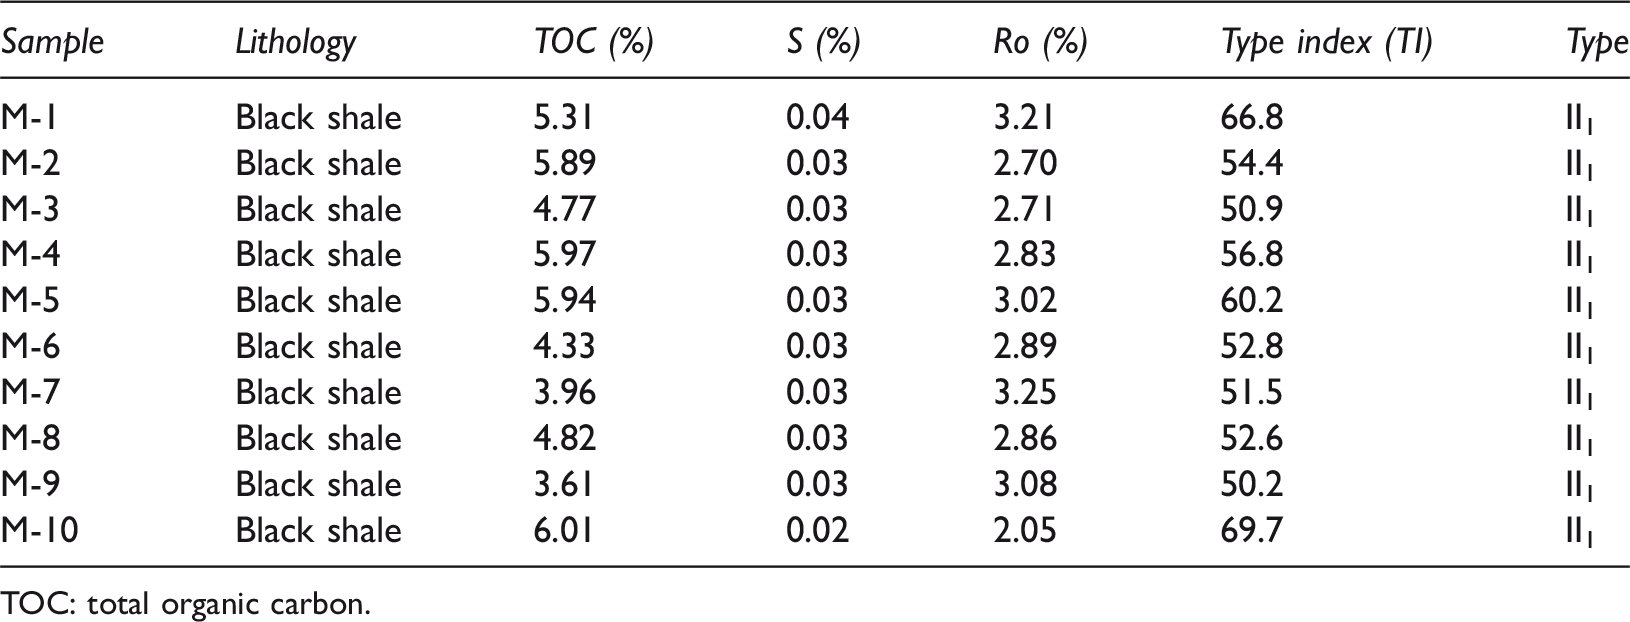
TOC: total organic carbon.
In this study, 10 black shale samples were tested and analyzed using the following methods: organic carbon content analysis, asphaltene reflectance, X-ray diffraction (XRD), clay mineral composition analysis, FE-SEM, nano-CT scanning technology, conventional porosity and permeability testing, cryogenic liquid nitrogen adsorption experiments, and isothermal adsorption experiments.
The permeability and porosity experiments on the shale samples were performed according to the China Petroleum and Natural Gas Industry standard SY/T5336-1996. The porosity measurements were conducted using a helium expansion method and a KXD-II porometer. The permeability measurements were performed using dry nitrogen as a medium and were carried out at a pressure of 96.8 kPa and a temperature of 25°C.
Organic geochemical data (thermal maturity and TOC) were provided by the Geochemical Laboratory of the Yangtze University. The TOC contents of the samples were tested using a CS-200 carbon and sulfur analyzer, and the experiment was conducted at a relative humidity (RH) of 60% and a temperature of 25°C according to the Chinese Oil and Gas Industry standard GB/T19145-2003 (Xu et al., 2003). Asphalt reflectance was measured at a relative humidity of 55% and a temperature of 20°C using a microscope photometer according to the Chinese standard SY/T5118-2005. The asphalt reflectivity was converted to the equivalent vitrinite reflectance with the formula “VRo = 0.618BRo + 0.4,” where BRo is the asphalt reflectance and VRo is the equivalent vitrinite reflectance.
The shale mineral compositions were analyzed by the XRD method at the CNNC Beijing Research Institute of Uranium Geology. All of the samples were crushed to a fine powder (less than < 80 µm) and then analyzed by a “Panalytical X’PertPRO MPD” XRD instrument to obtain the content of each component in the rock. The test standards and test methods were in accordance with the Chinese Petroleum and Natural Gas Industry standard SY/T6210-1996 (Wang et al., 1996).
The samples were subjected to high-pressure methane adsorption measurements using an HPVA isotherm measurement system, a type of high-pressure gas adsorption and desorption instrument. The experimental standards and test methods were in accordance with the Chinese national standard GB/T 19560-2008 (Zhang and Zhang, 2008). A moisture-balanced sample (120–150 g), sieved to a particle size of less than 60 mesh, was held at a temperature of 35°C and a constant pressure of up to 22 MPa during measurement of the high-pressure isothermal adsorption. The analysis results included the Langmuir pressure and Langmuir volume.
The experimental instrument used to measure the N2 isothermal adsorption was an ASAP 2020 specific surface area and porosity adsorption apparatus. The test aperture range was 0.35–500 nm. The shale samples were crushed to 100 mesh before the test and dried at a temperature of 110°C for 12 h. After removing the moisture and volatile gases from the shale, the samples were placed in liquid nitrogen, the different test pressures of the instrument were adjusted, the amount of adsorbent for the shale was measured, and the adsorption and desorption isotherms were drawn. For all samples, the P/Po ratio of the N2 adsorption isotherm at 77 K was within the range of 0.005–0.998. In addition, we also determined the pore structure according to the shape of the hysteresis loop and calculated the pore size distribution, pore volume, and specific surface area according to the Brunauer–Emmett–Teller (BET) model, Barrett–Joyner–Halenda (BJH) model, and other models.
The microstructure of the shale samples was analyzed and observed by a Quanta 200F FE-SEM. The experiments were carried out at a humidity of 35% and a temperatures of 24°C.
Fractal geometry has been widely applied to describe fragmented and irregular systems without a characteristic length scale (Chalmers et al., 2012), and fractal dimensions can be used to study the nature of extremely fragmented complex systems that exhibit self-similarity and self-inversion. A number of methods have been used to determine the fractal dimension, such as the mercury intrusion method, gas adsorption method, small-angle XRD method, and scanning electron microscopy method. The fractal Langmuir model, fractal BET model, and fractal FHH model have been widely used to analyze gas adsorption. In addition, the fractal FHH model has been widely used to calculate the fractal dimensions of pore structure characteristics in porous media, and the formula is as follows


Equation (2) is applied to capillary condensation, where the hysteresis loops begin to develop, whereas equation (3) applies to the van der Waals force (Pfeifer and Avnir, 1983). The value of D usually changes from 2 to 3 and is strongly affected by the geometrical roughness and irregularities of the surface: as D values approach a value of 3, the surface becomes more complex and irregular.
Results and discussion
Fractal theory
The FHH plots of 10 samples are shown in Figure 2, lnV and ln(ln(Po/P)) have a good linear relationship in two P/Po ranges from 0 to 0.5 and from 0.5 to 1.0, showing that shale pores in these two ranges have fractal characteristics. Previous studies on the fractal characteristics of coal show that the fractal dimension D1 reflects the fractal dimension of the surface and that the fractal dimension D2 represents the fractal dimension of the pore structure (Yao et al., 2008). The D2 values calculated by equation (3) are in the range of 2.2179–2.4987, whereas the D1 values obtained from equation (3) are 1.5762–1.8792 (i.e. less than 2). These results deviate from the definition of the fractal dimension of the pore structure and the pore surface. In general, D can vary from 2 to 3, representing a change from a fully regular smooth pore system to a highly complex porous system. On the contrary, when the fractal dimension is calculated by equation (2), the values of D1 and D2 are distributed between 2 and 3, which is closer to the actual situation. Therefore, we use equation (2) to calculate the fractal dimension of the shale pore structure. The fractal dimension results for the P/Po ranges of 0–0.5 and 0.5–1 and the fitting of straight lines are shown in Table 2. The D1 values range from 2.527 to 2.6264, with an average value of 2.5747, and the D2 values range from 2.7653 to 2.8329, with a mean of 2.8091. The results show that the values of the fractal dimension vary between 2 and 3 for the P/Po ranges of 0–0.5 and 0.5–1, indicating that the shale pore surfaces and pore structures are highly heterogeneous.
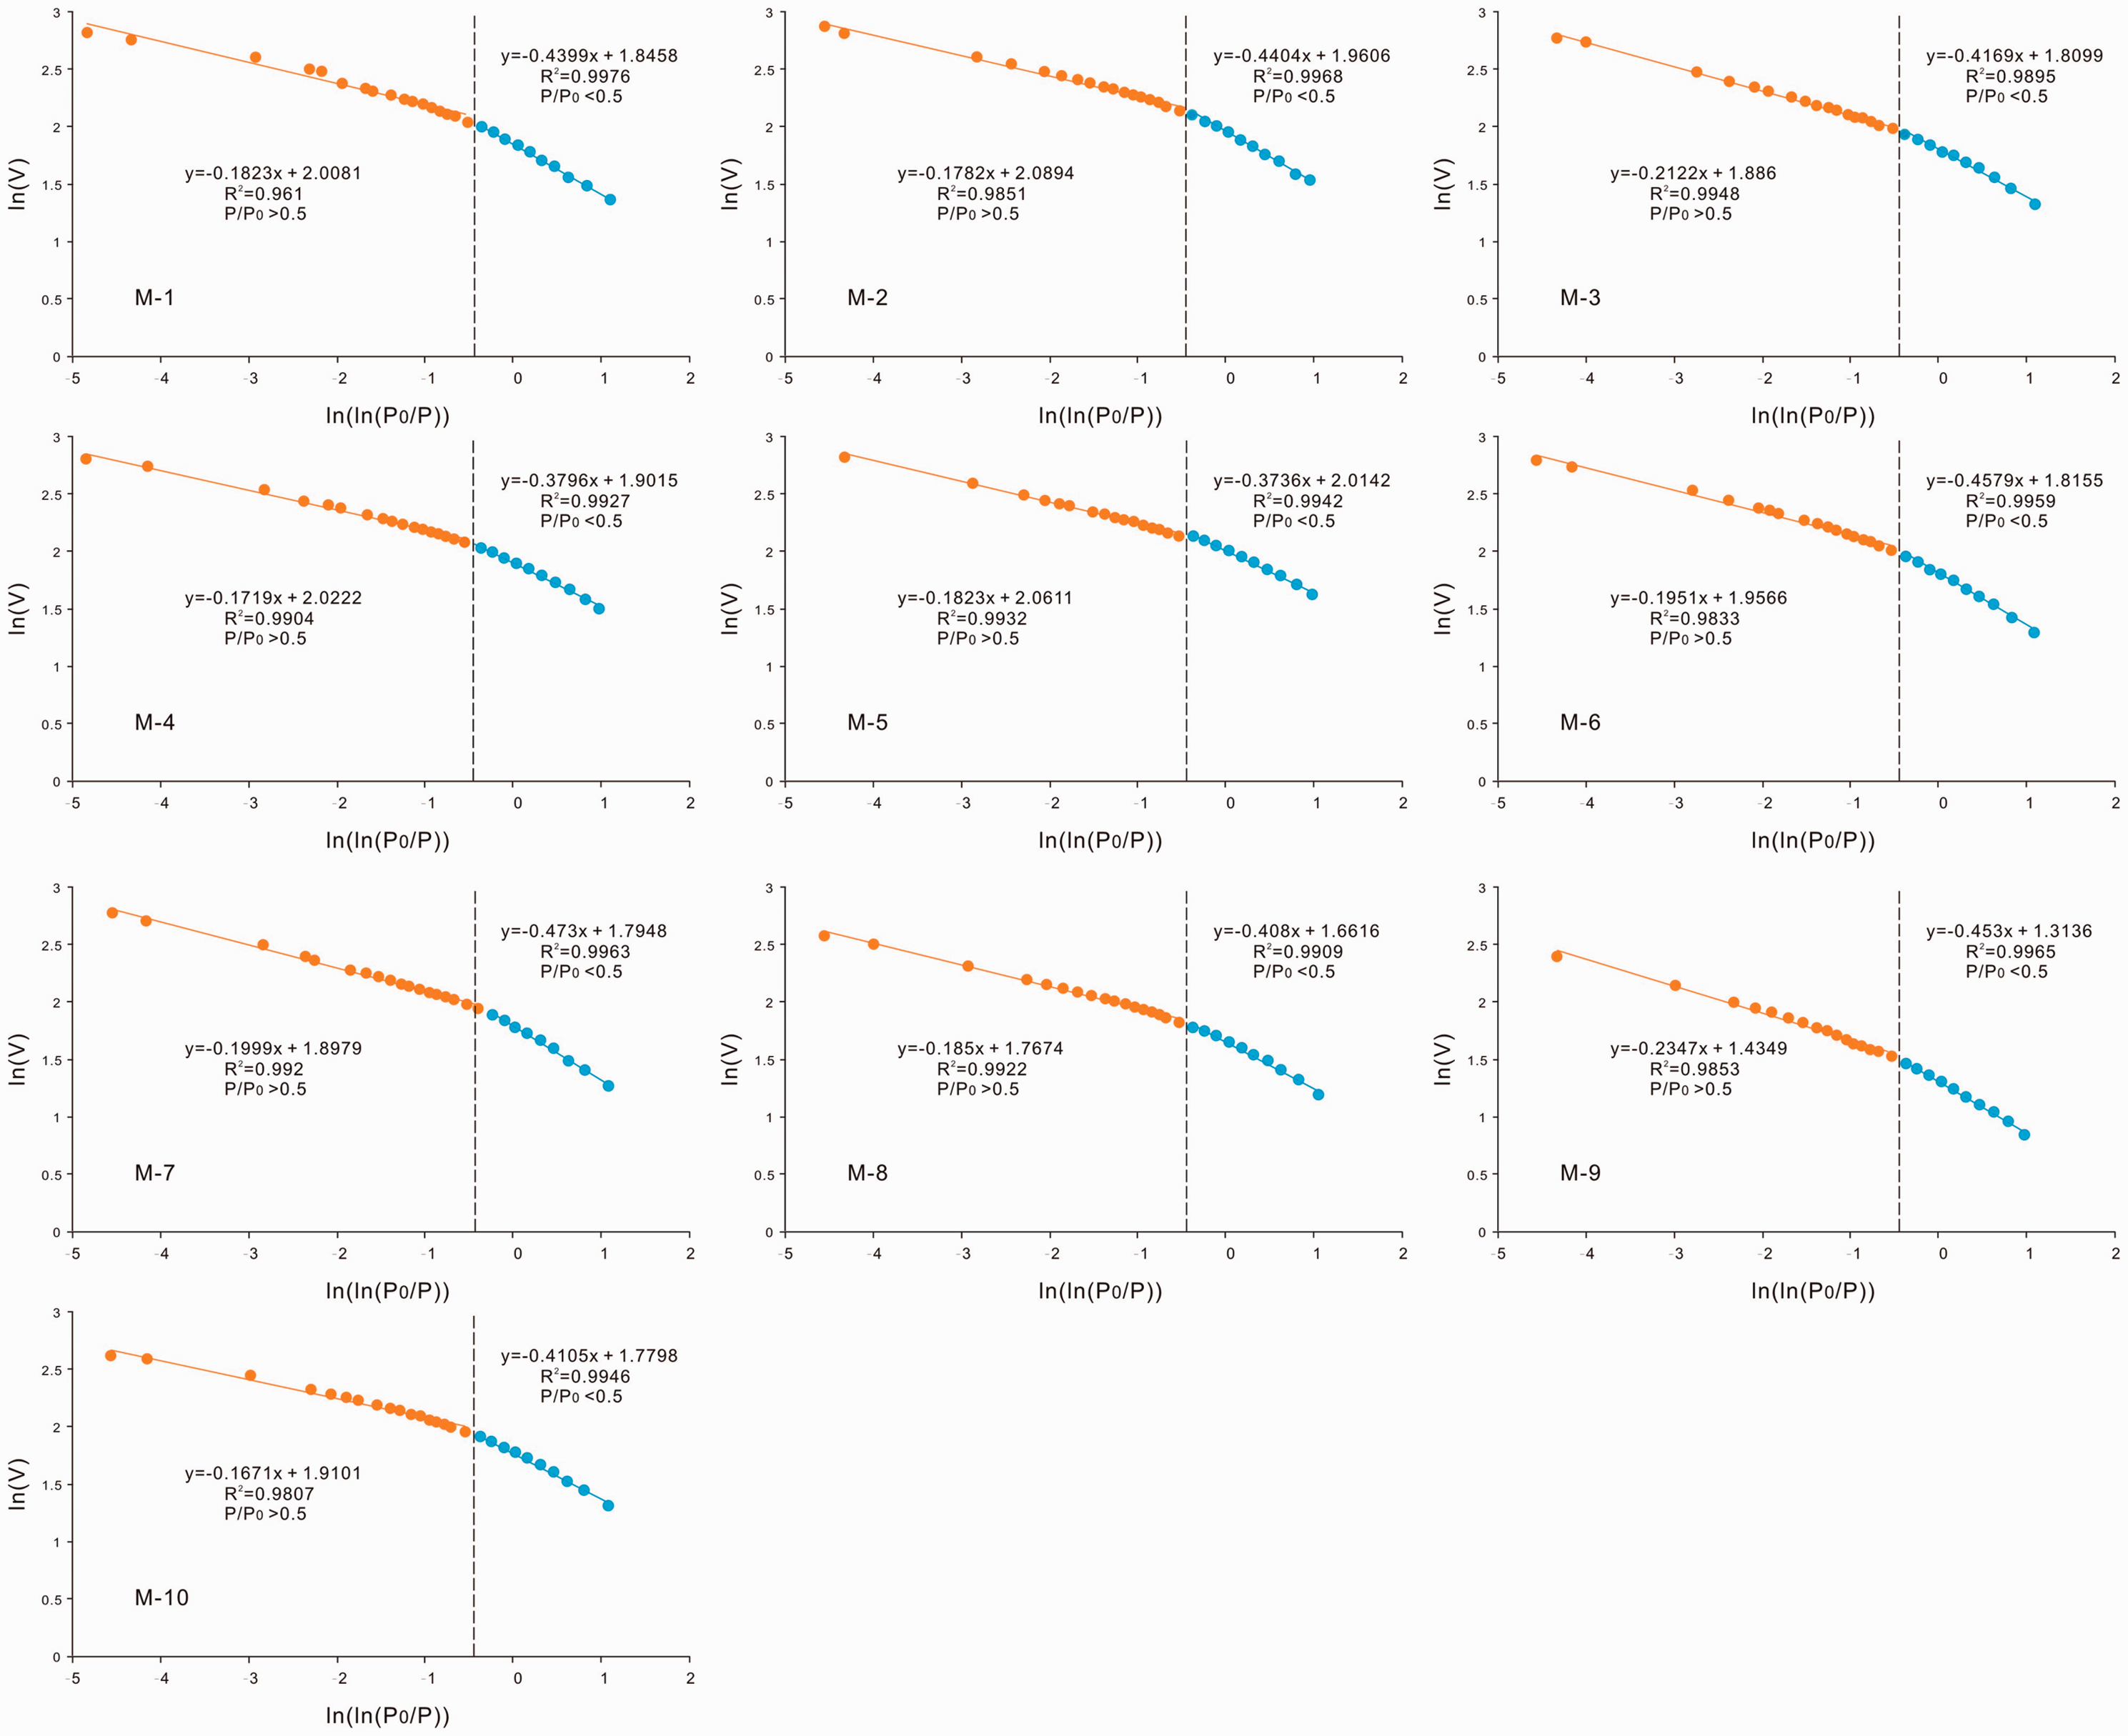
Fractal calculation results from ln(V) versus ln(ln(Po/P)) of N2 adsorption for 10 samples.
Fractal dimensions derived from the FHH model.
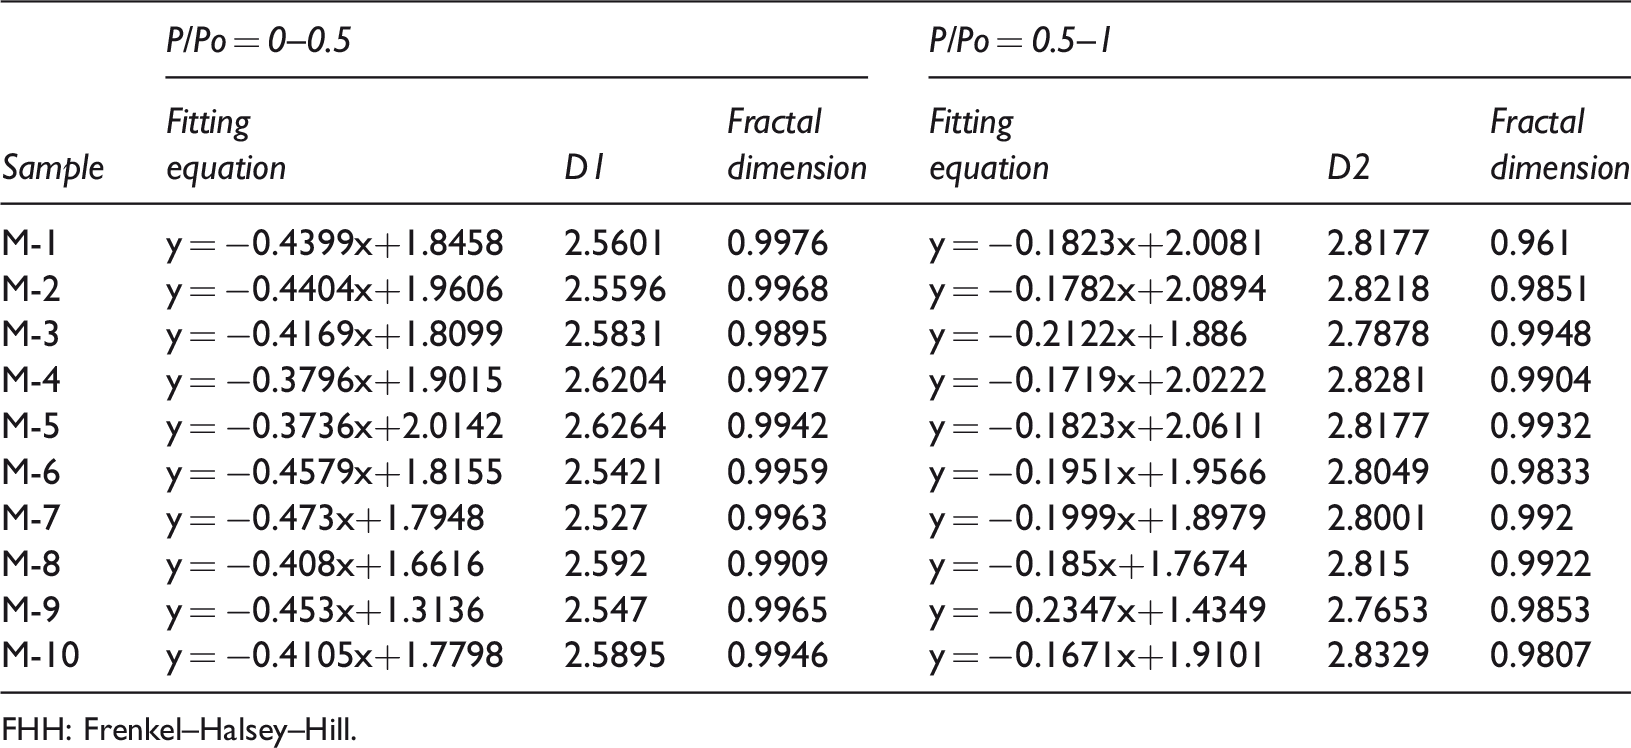
FHH: Frenkel–Halsey–Hill.
Relationships between the composition and TOC content and the fractal dimensions
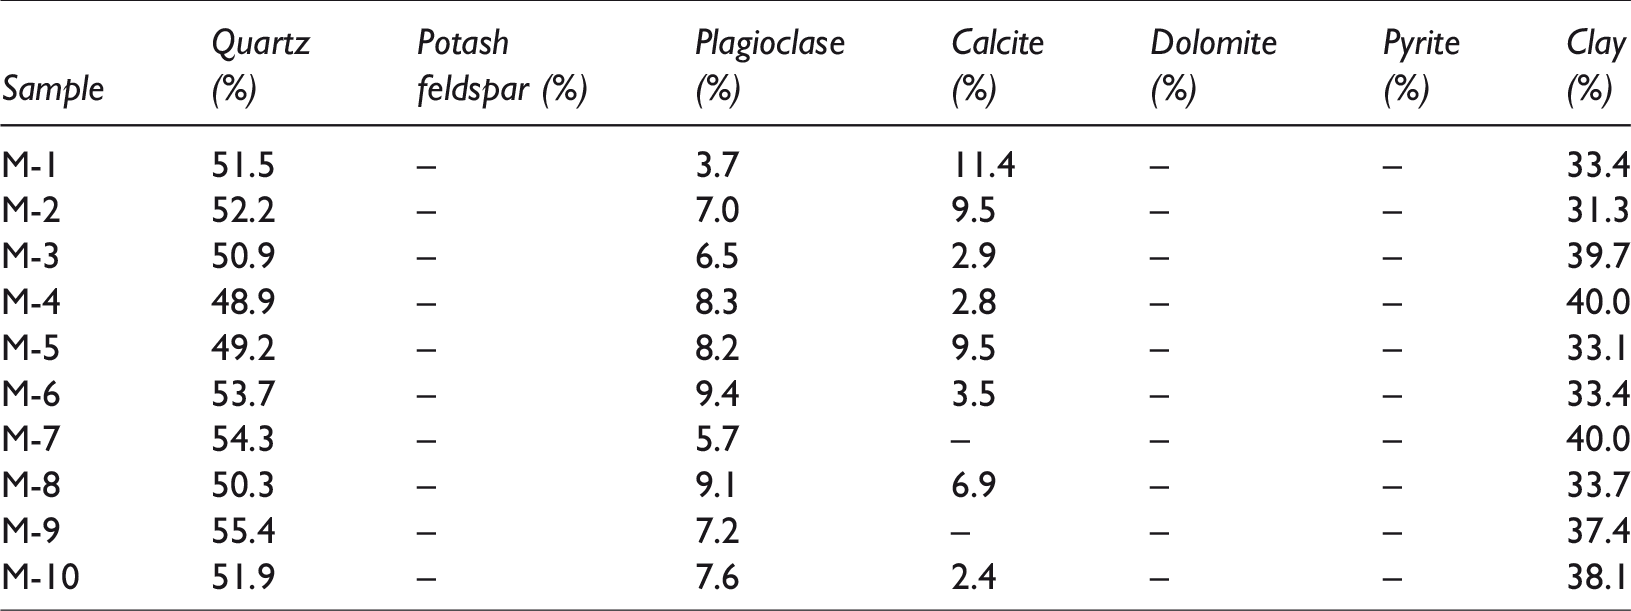
Table 3 shows the XRD analysis results. The shale samples from the study area contained abundant clay minerals and quartz. The average quartz content was 51.83%, with a range of 48.9–55.4%. The calcite content averaged 6.11%, ranging from 0 to 11.4%, and no dolomite was observed. The clay mineral content averaged 36.01% and ranged from 31.3 to 40%. The TOC content of the shale samples averaged 5.06% and ranged from 3.61 to 6.01%.
XRD results for shale samples.
To understand how the shale mineral composition and TOC affect the fractal characteristics, the correlations between the TOC content and mineral composition and the fractal dimension are shown in Figure 3. The fractal dimensions are negatively correlated with the quartz content and positively correlated with the TOC content; however, they do not have an apparent relationship with the clay mineral content. In general, the TOC content is an important factor that affects the development of porosity in organic-rich shale. Higher TOC contents result in more organic matter pores, whereas strong heterogeneity in the shale results in more complex pore structures and larger fractal dimensions. The fractal dimension can be regarded as a parameter that describes the irregularity of pore surfaces in shale.
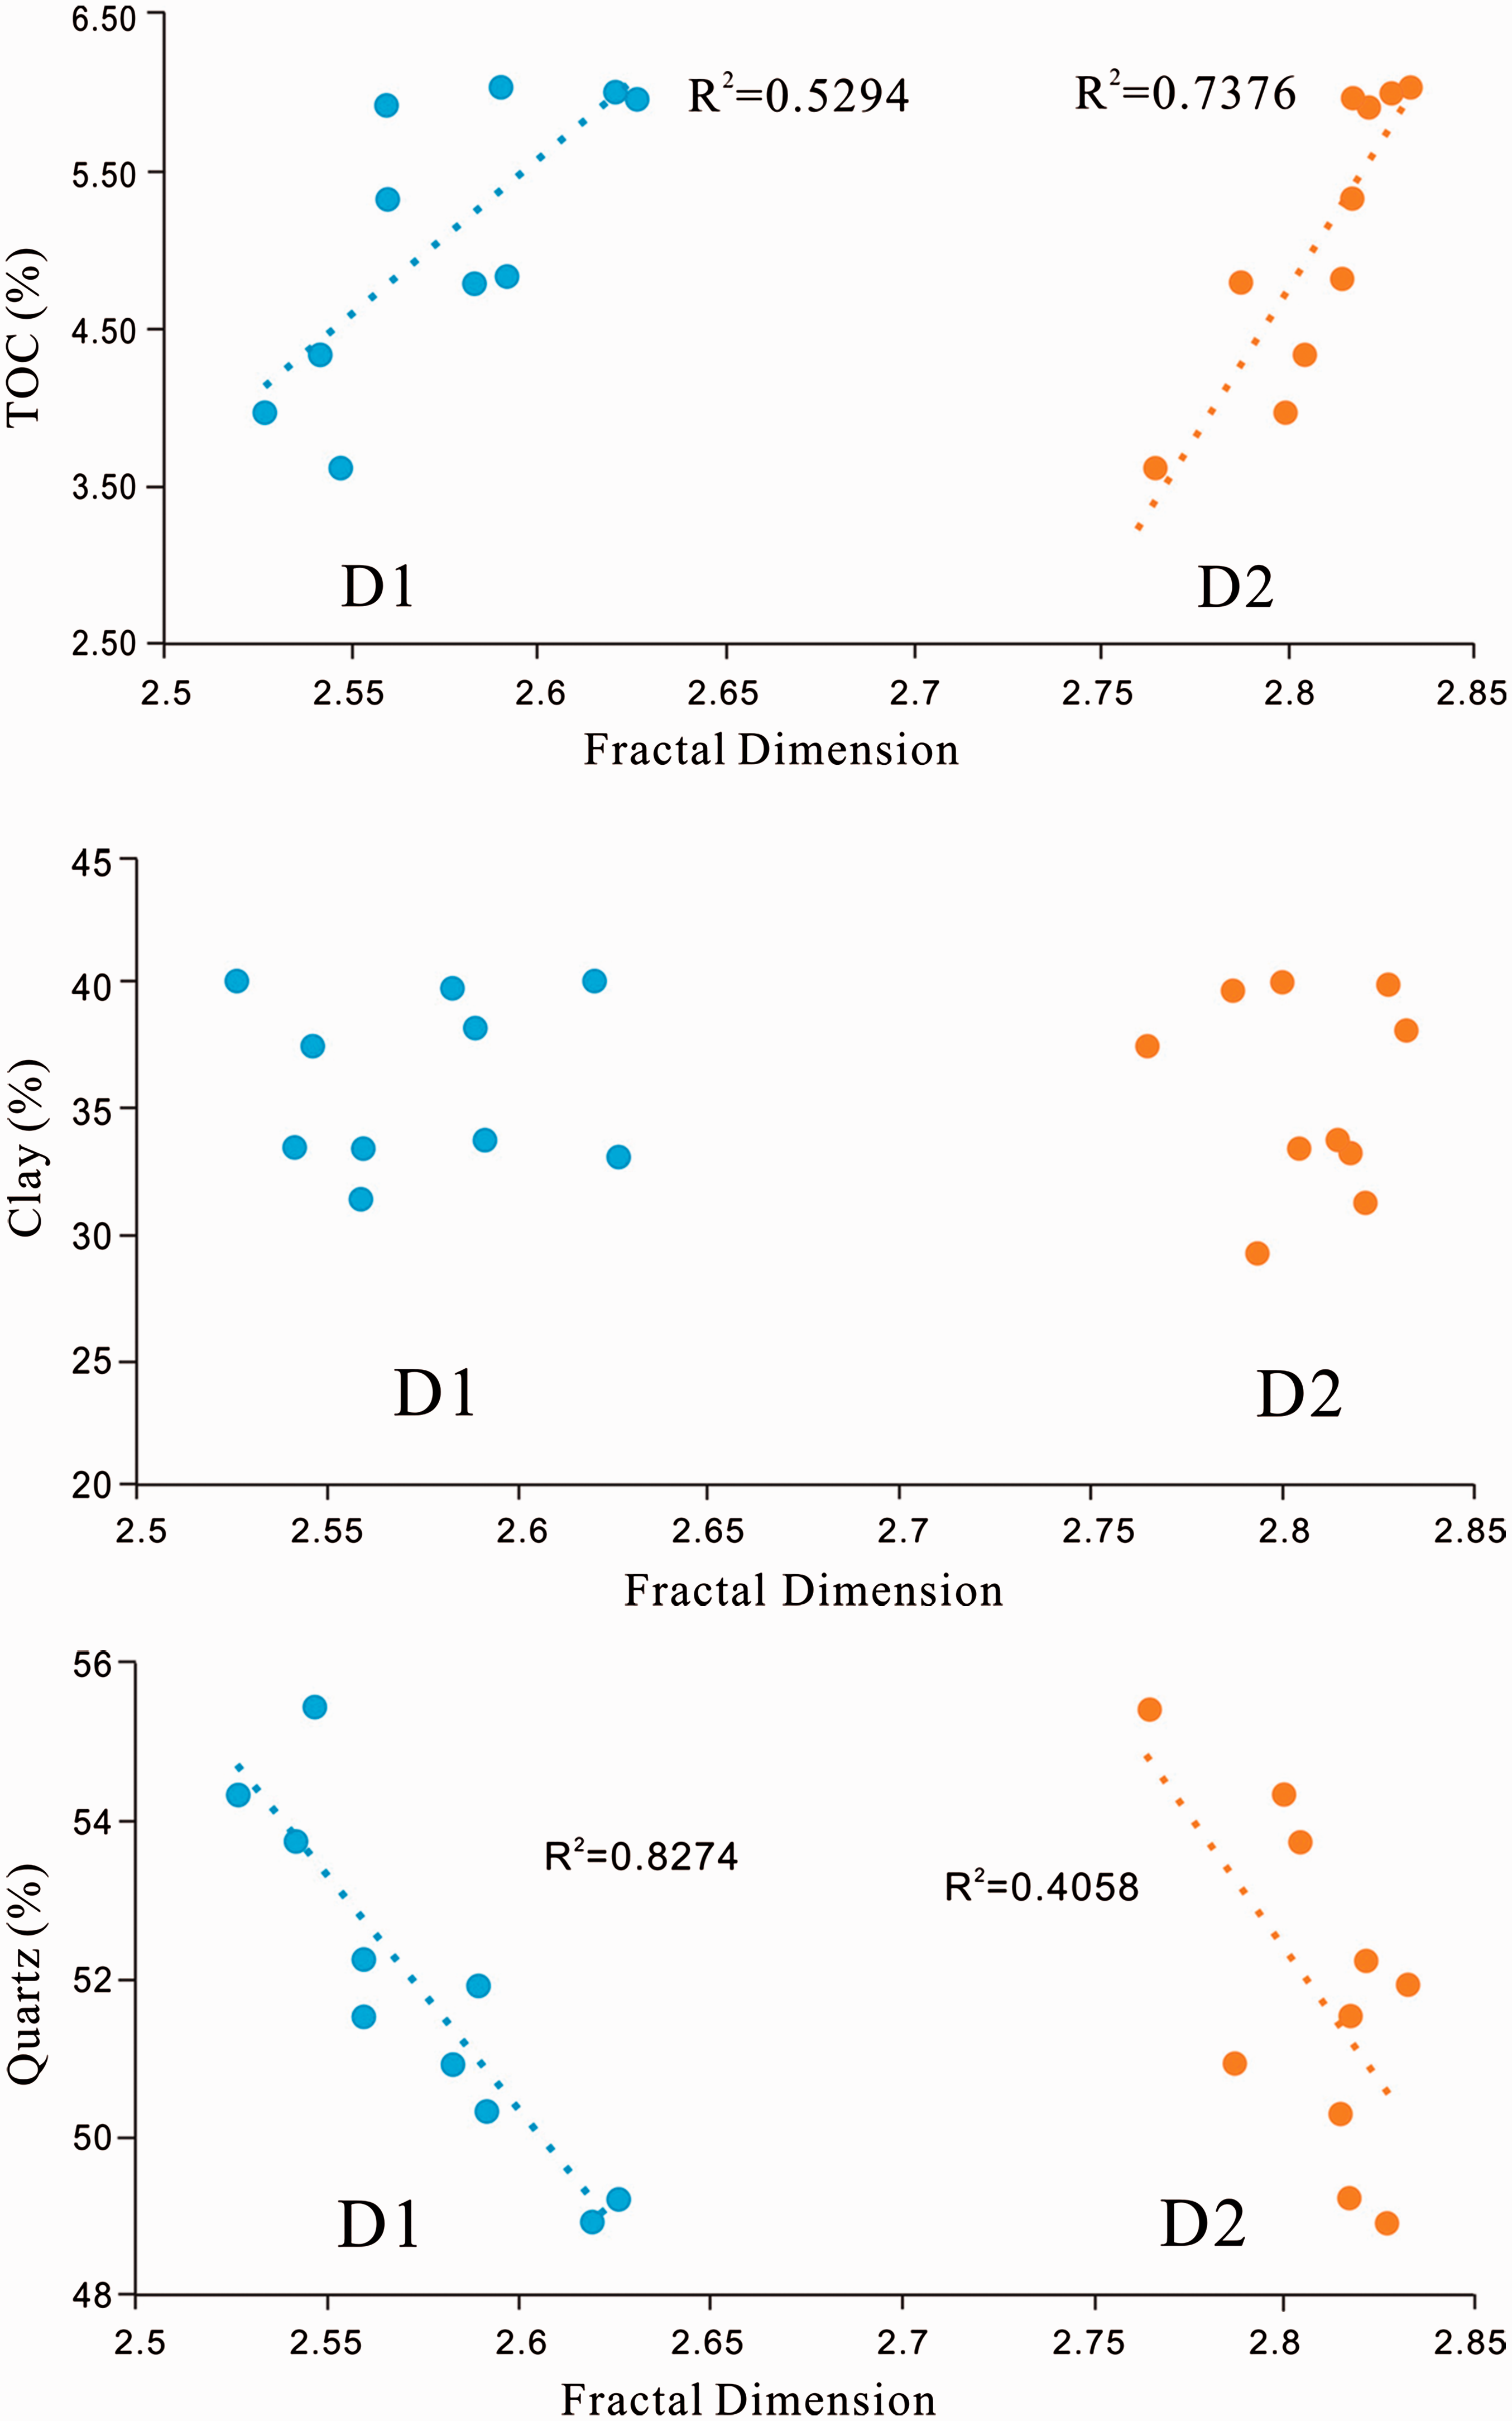
Relationships between TOC, shale composition, and fractal dimension.TOC: total organic carbon.
The surface of quartz grains is smooth, which reduces the heterogeneity of the shale pore structure. In the deposition process, brittle deposits with a high content of quartz may retain a certain number of larger intergranular pores preserved around the quartz, and these spaces are often regarded as macropores (Figure 4(a) and (b)). Although fractal dimensions are related to micropores, the development of macropores reduces the fractal dimension of the shale. The combination of micropores and macropores in a sample leads to a complex relationship between the quartz content and the fractal dimension. In addition, the development of intergranular pores around brittle minerals tends to be more regular than that between clay minerals and organic particles; therefore, the development of such pores will also reduce the fractal dimension.
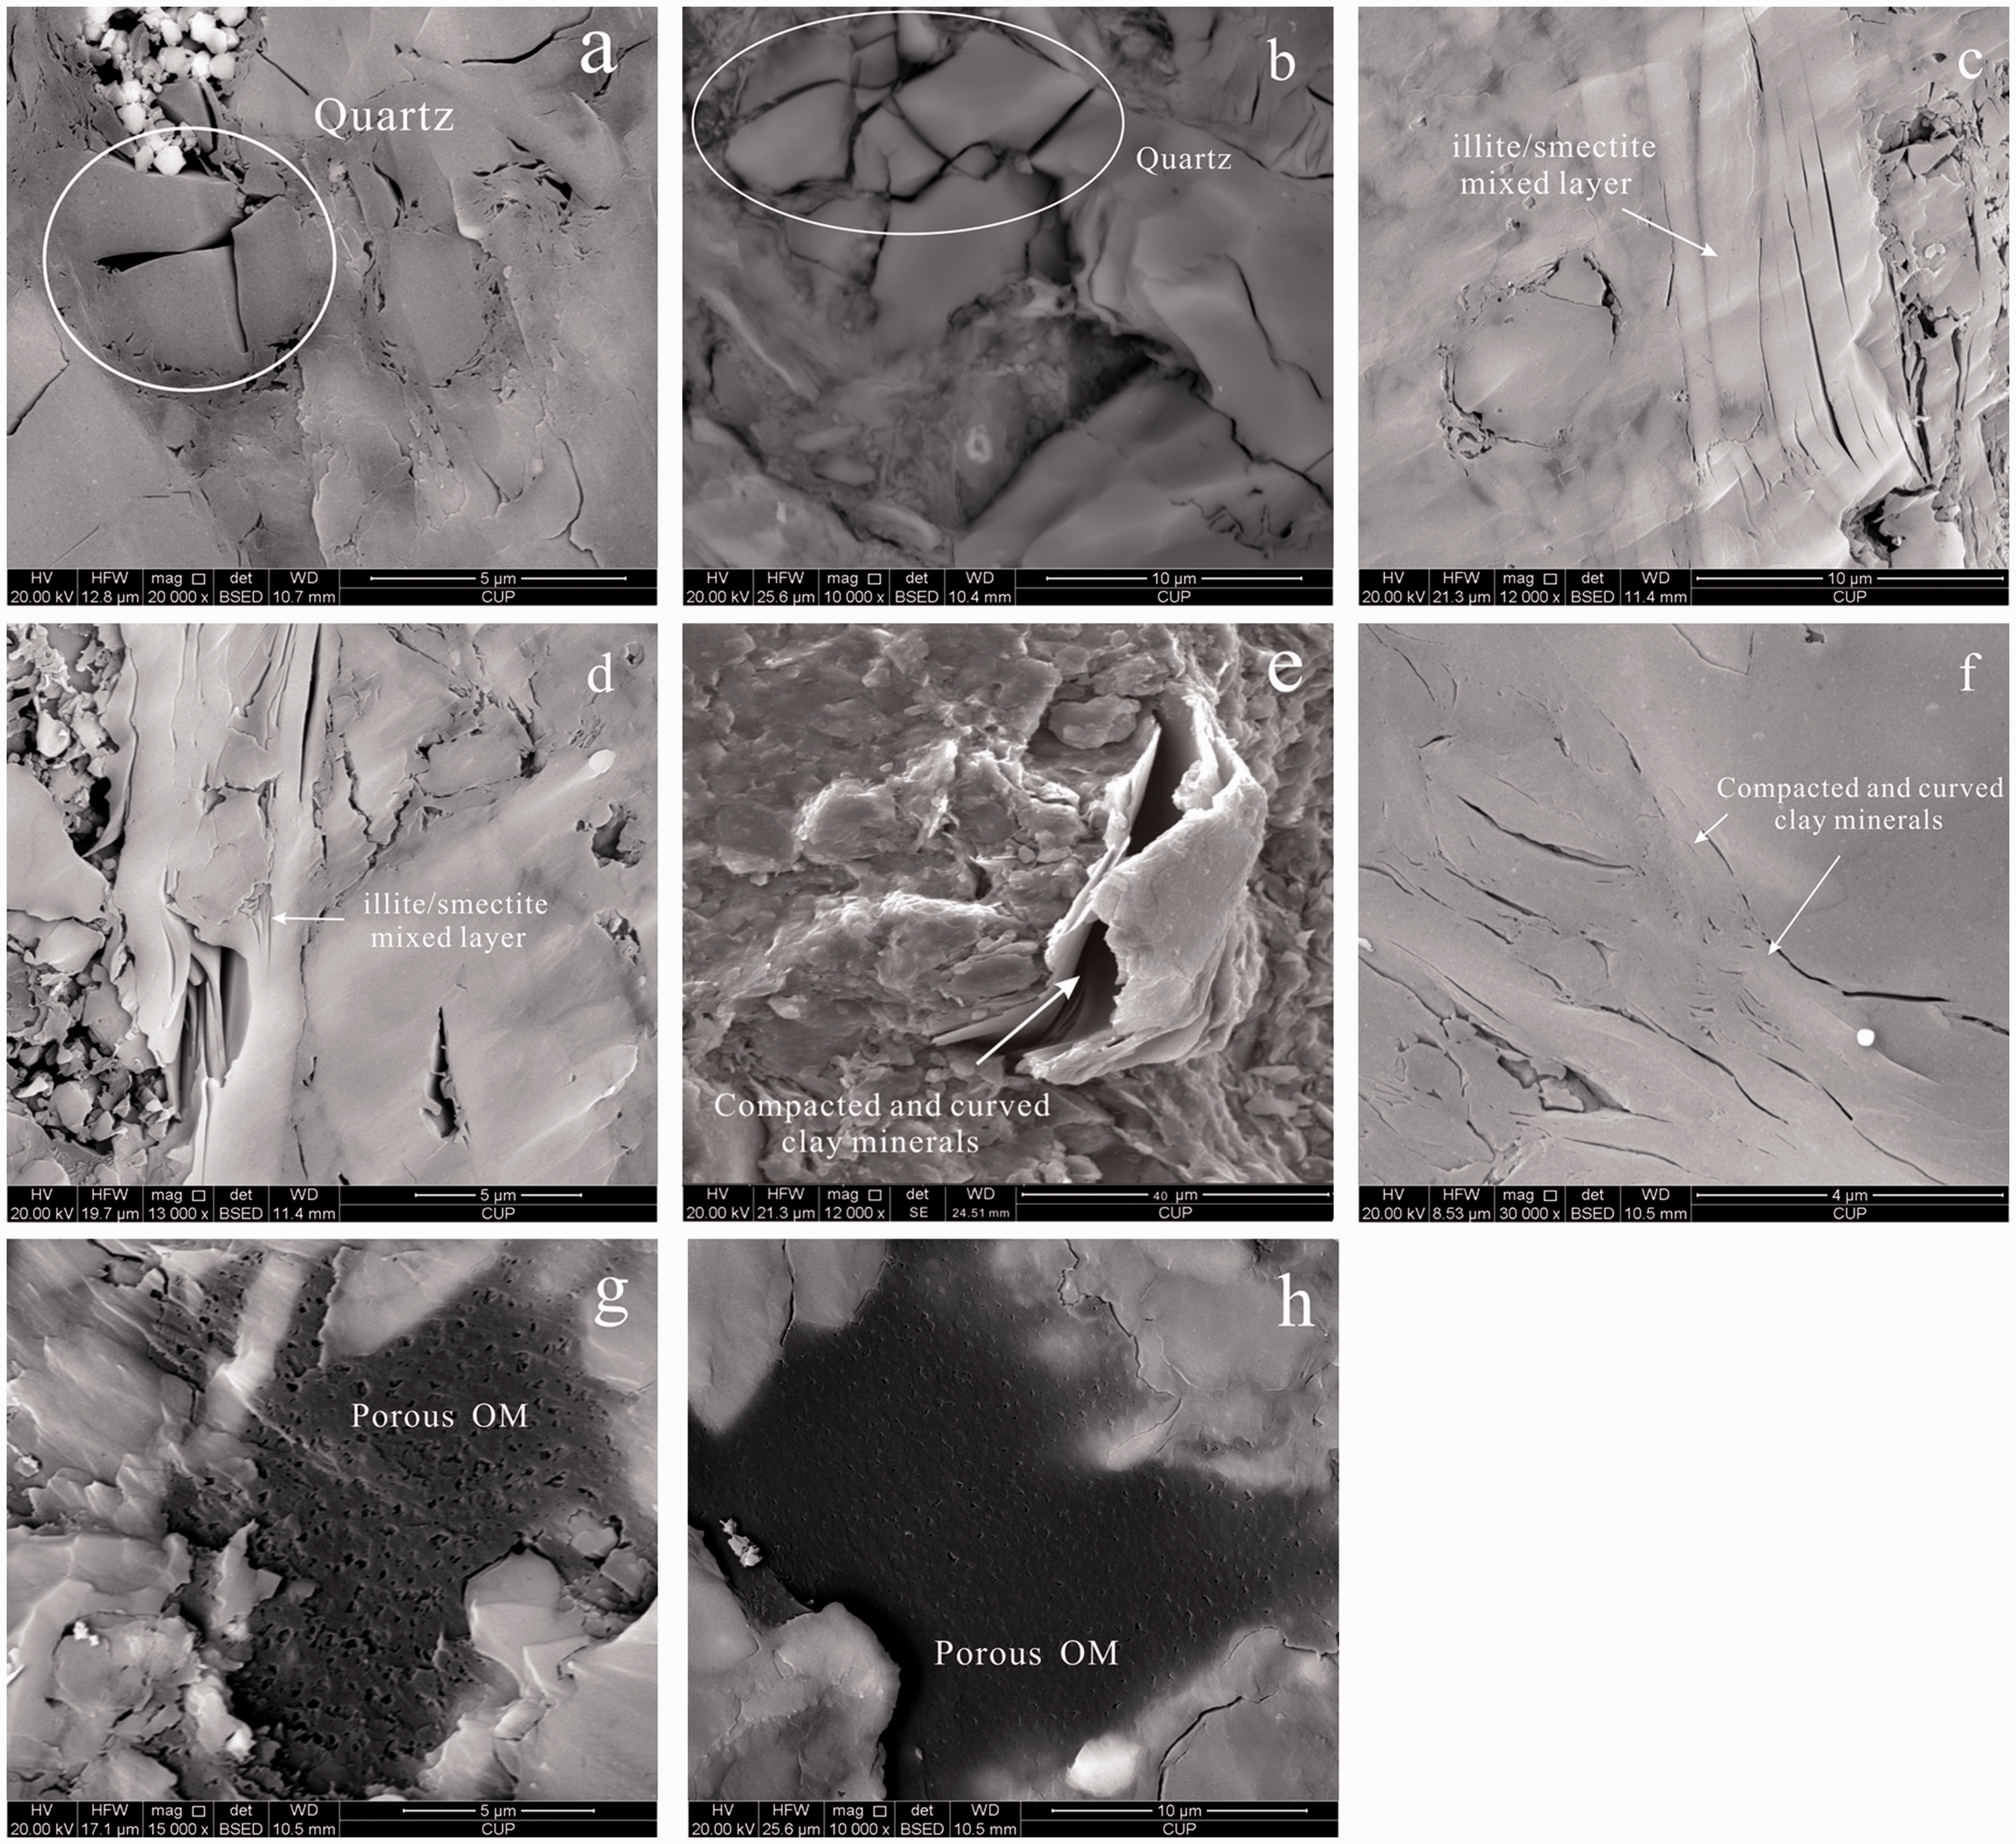
FE-SEM images of Niutitang shale in the study area. (a) and (b): Quartz preserved a certain number of larger intergranular pores, (c) and (d): illite/smectite mixed layer developed in the shales, (e) and (f): compacted and closed clay minerals reduce the surface area and pore volume of the shale samples, and (g) and (h): heterogeneously distributed OM pores with irregular and faveolated shapes. OM: organic matter.
Previous studies suggested that the clay mineral content is an important factor influencing the pore structure of shale (Nie and Zhang, 2011; Ross and Bustin, 2007; Yang et al., 2014). Therefore, the fractal dimension is closely related to the clay mineral content in shale. As shown in Figure 3, the fractal dimension of shale samples from the Niutitang Formation in the Fenggang area has no obvious relationship with the clay mineral content, and the main causes are as follows: (1) the clay mineral porosity in the Niutitang Formation is dominated by mesopores and macropores, the pore volume increases with increasing clay mineral content, and the clay mineral content is weakly correlated with the presence of micropores and transitional pores; and (2) different types of clay minerals have different effects on the fractal dimension, with illite and chlorite presenting a good correlation with the fractal dimension and illite/smectite mixed layer clays presenting a poor correlation with the fractal dimension (Figure 4(c) and (d)). As shown in Figure 5 the illite/smectite mixed layer content in the Niutitang Formation is relatively high and has an average value of 32.375%. Furthermore, a proportion of the interparticle pores and plate-like pores of the clay minerals are closed or filled at the microscale because of compaction (Figure 4(e) and (f)). Therefore, the total pore volume and specific surface area of the 10 shale samples vary irregularly as the clay mineral content increases (Huang et al., 2016).
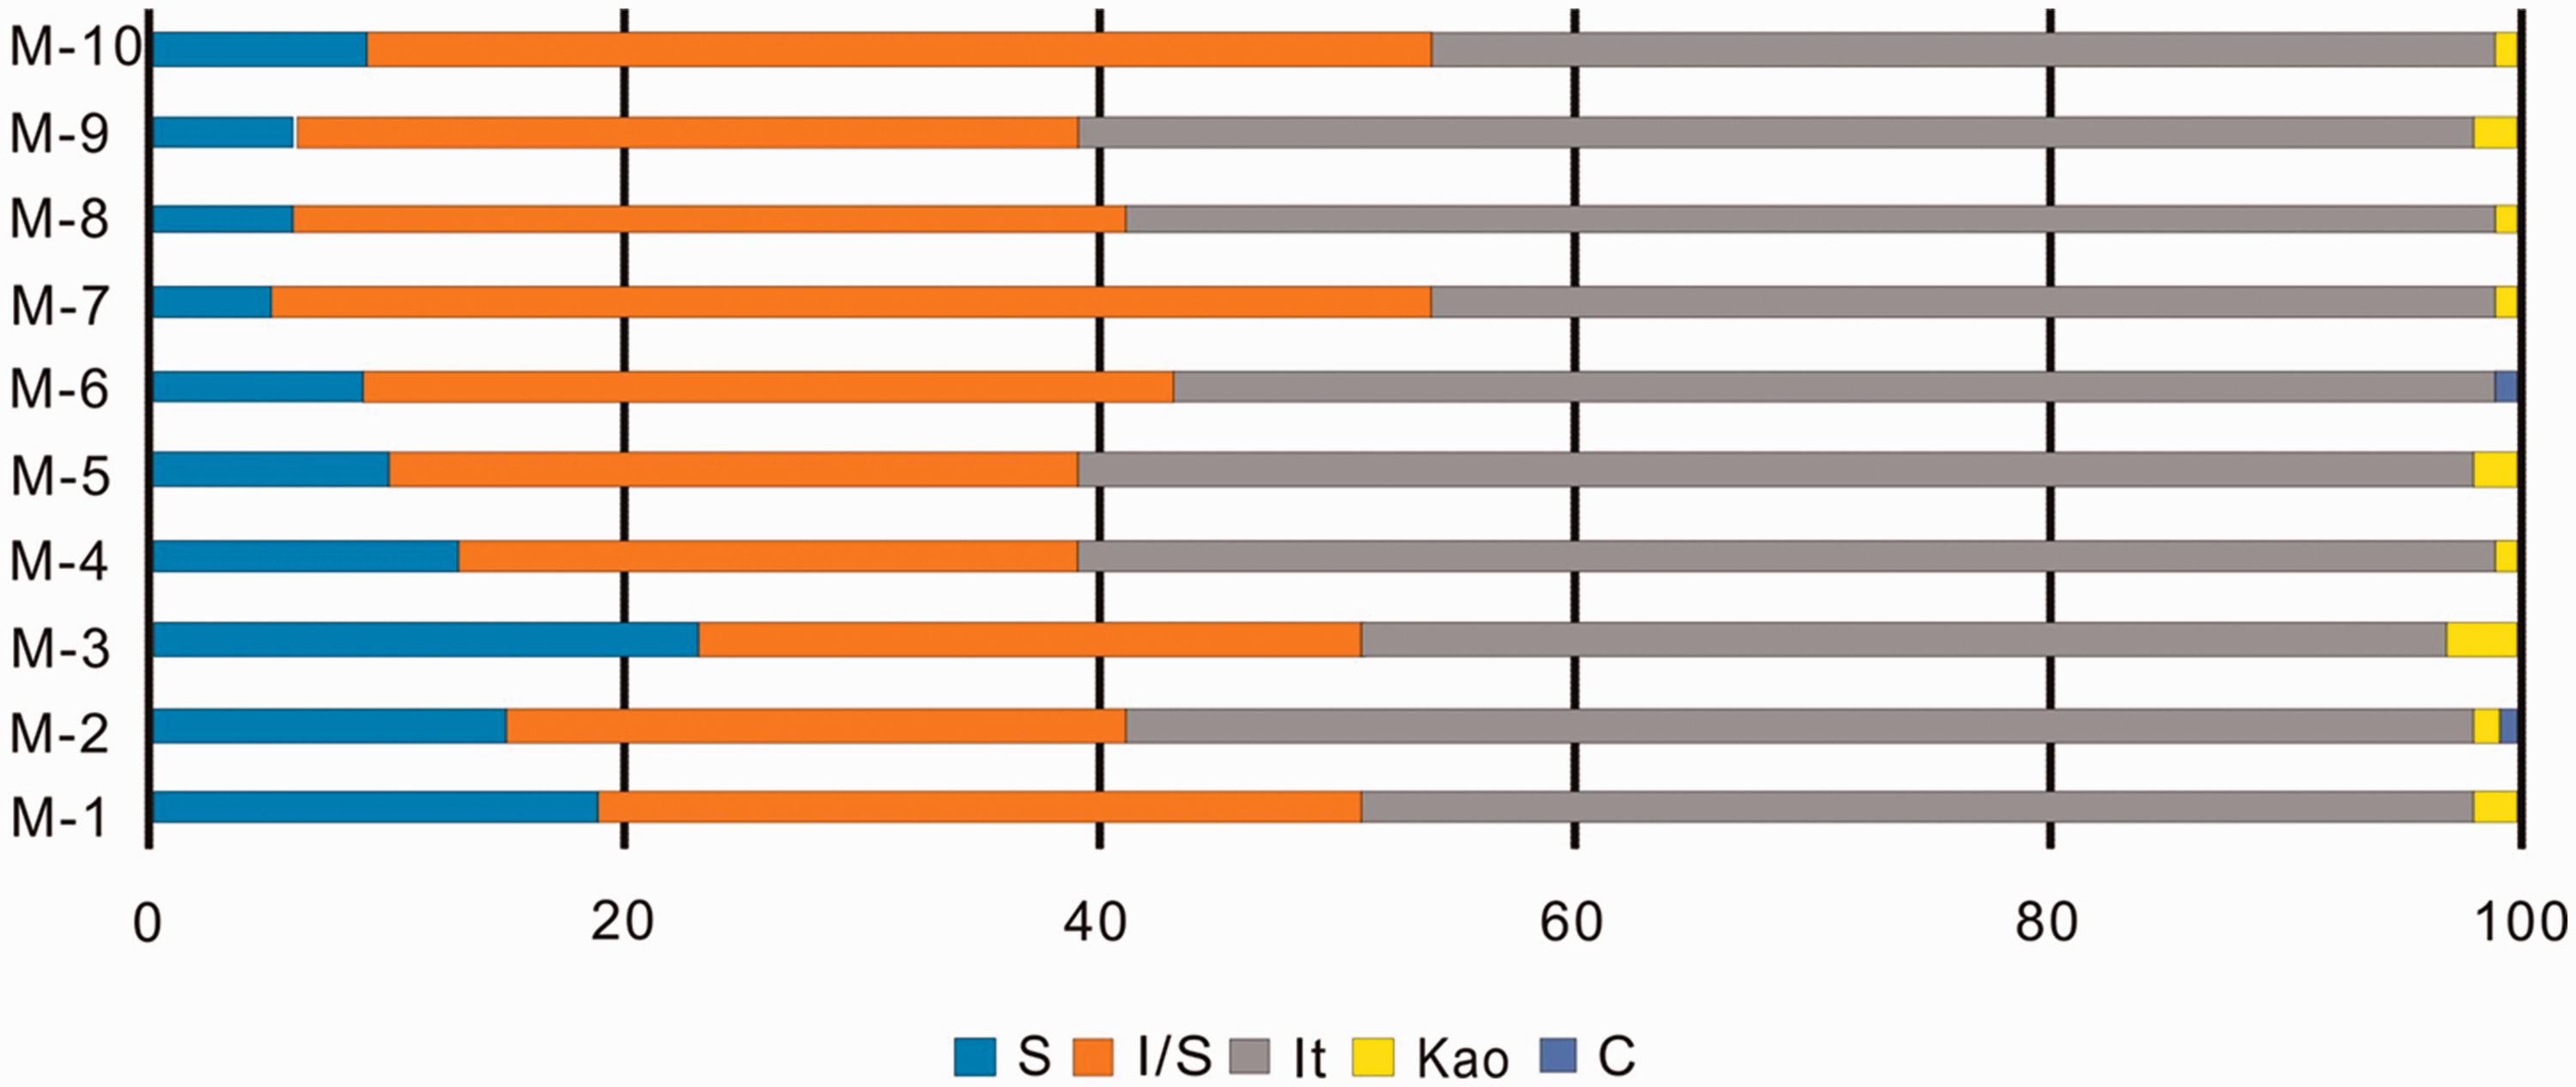
The clay mineral content of the Niutitang shale.
As shown in Figure 6, a significant positive correlation is observed between the TOC and the specific surface area and pore volume of the shale, which present correlation coefficients of 0.5134 and 0.806, respectively. With increasing TOC content, the porosity of the organic matter and the number of pores in the organic matter increased; therefore, the pore volume and specific surface area increased (Figure 4(g)). These changes promoted increased contributions to the pore volume and specific surface area of the shale. The OM pores are not developed in the shale sample M-7 (Figure 4(h)), is mainly due to the enrichment difference of organic matter caused by hydrothermal activities and the high maturity of organic matter (Marchig et al., 1982).
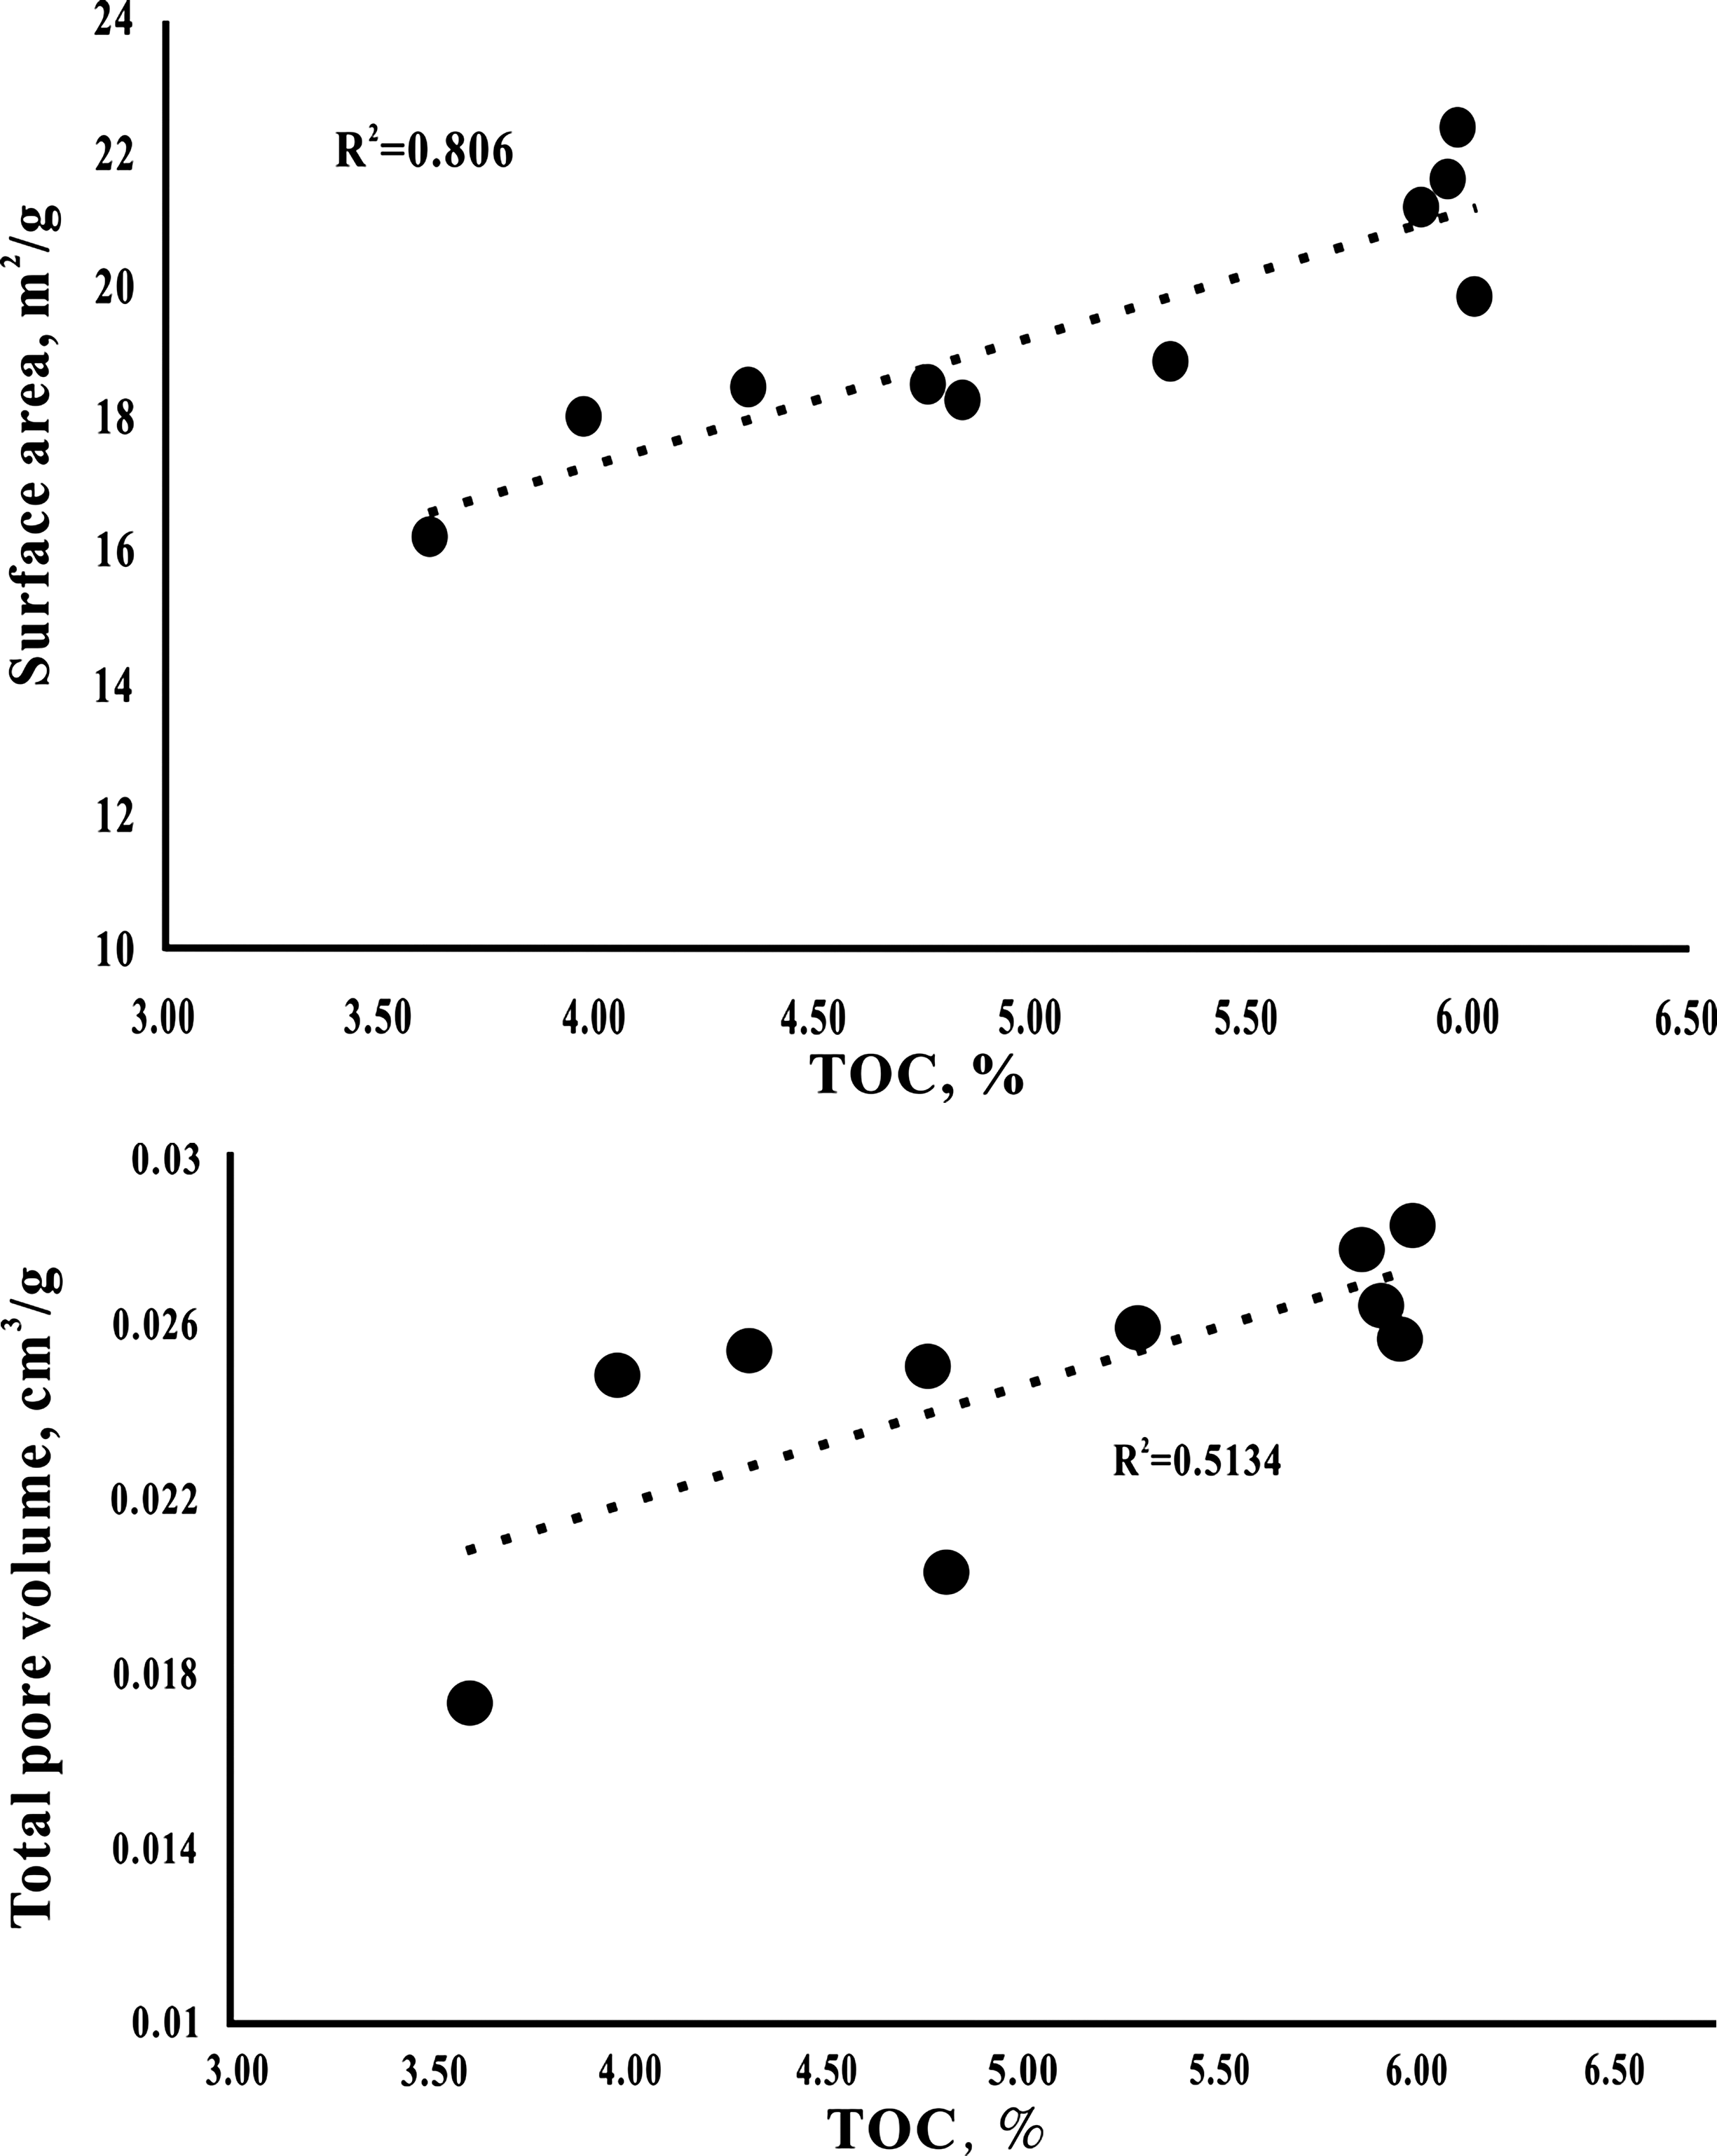
Relationships between TOC content and pore structure parameters.TOC: total organic carbon.
Relationships between the pore structure parameters and fractal dimensions of shale
The isotherm data for the low-pressure N2 adsorption/desorption analysis of all shale samples are illustrated in Figure 7. According to the International Union of Pure and Applied Chemistry, the adsorption–desorption isotherms of shale samples belong to type IV isotherms (isotherms with hysteresis loops) (Gregg and Sing, 1982). This isotherm type suggests that the porosity in the shale is related to a continuous intact pore system down to the scale of nanopores. At low relative pressure (P/Po = 0–0.5), the N2 adsorption of shale samples is relatively low due to the strong interaction of the shale surface. For P/Po = 0.5–0.8, the adsorption curve shows a gentle upward convex shape, the adsorption capacity of N2 increases rapidly, and there is a lagging line, which is a multimolecule adsorption point at the inflection point. The adsorptive capacity of nitrogen increases sharply when the relative pressure P/Po is between 0.8 and 1.0 and does not appear when the saturated vapor pressure reaches the saturation vapor pressure. Therefore, the pores in the shale sample agglomerate during nitrogen adsorption. The pore size increases with increasing pore volume, which reflects the complexity and heterogeneity in pore size in this type of shale.
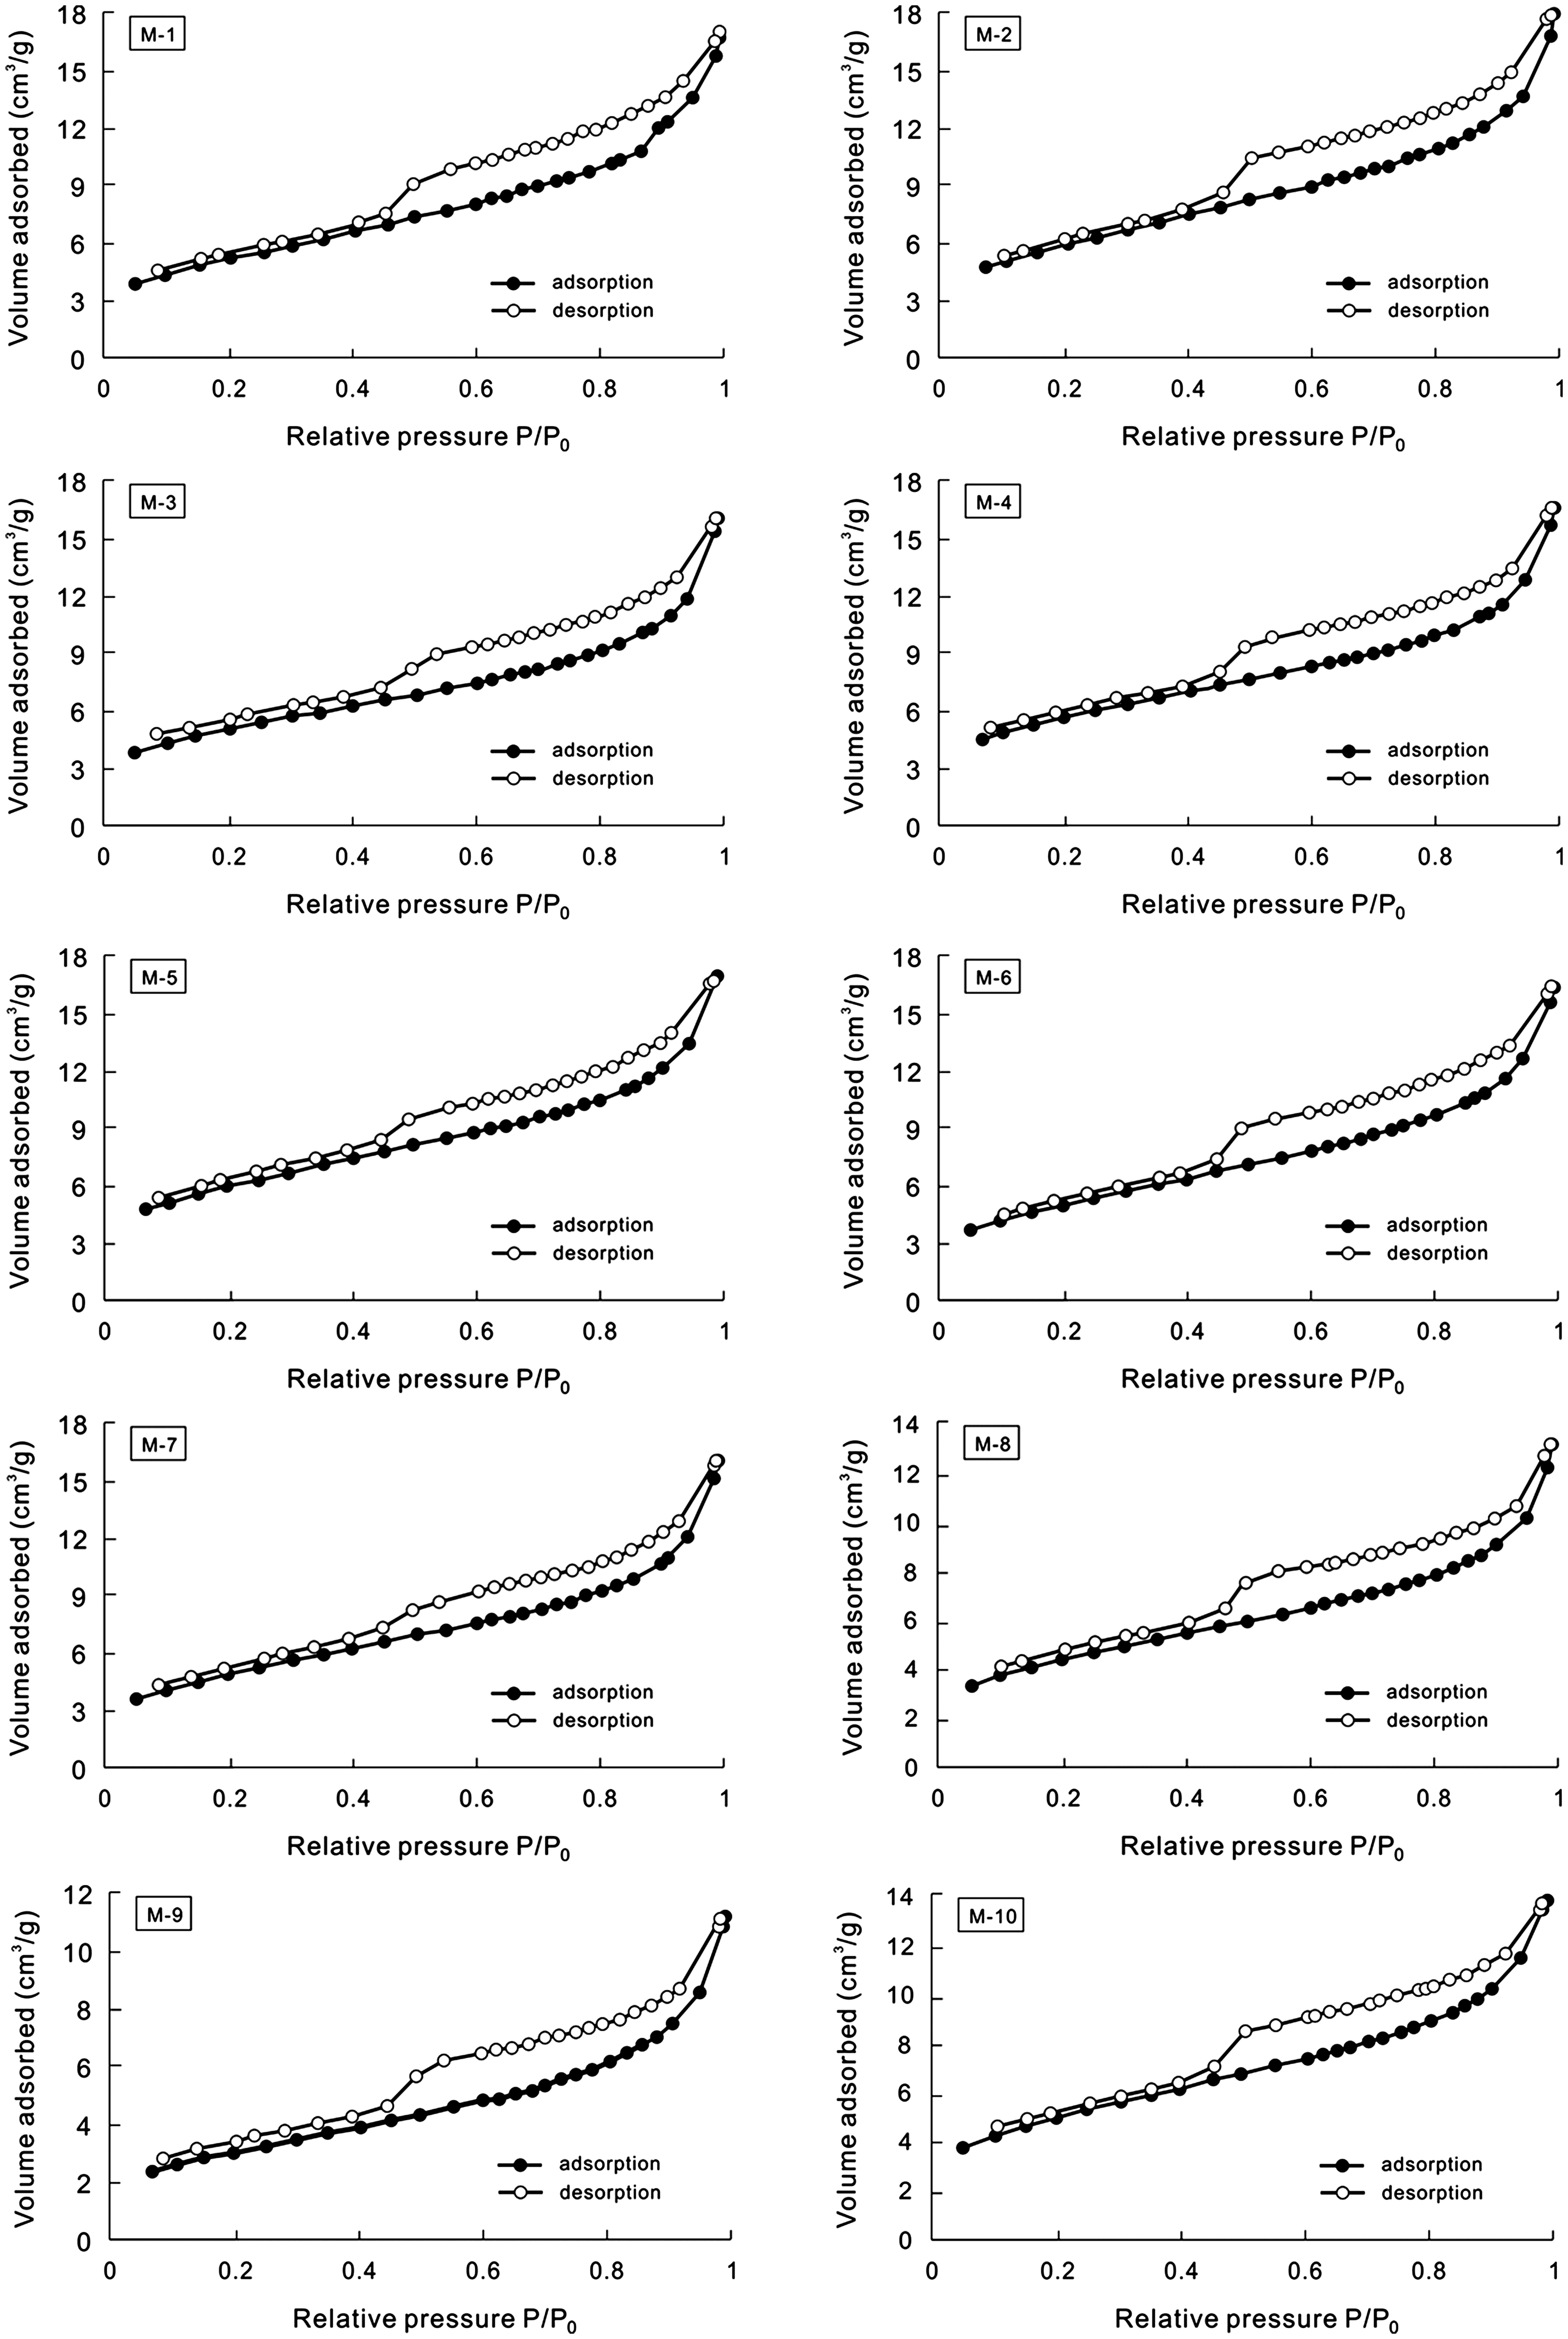
Nitrogen adsorption–desorption isotherms of shale samples.
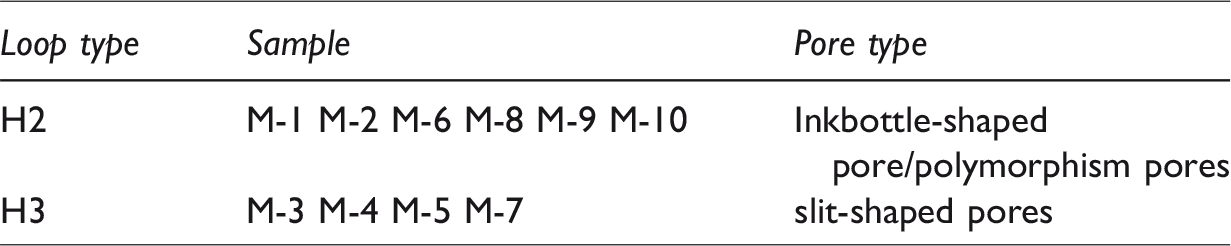
According to the N2 adsorption–desorption isotherm hysteresis loop shapes, the adsorption loops of the shale samples in the study area can be classified into two types, type H2 and type H3 (Table 4). The H2 adsorption loop is characterized by a sharp decline in the desorption branch at moderate relative pressure, indicating that the pore type features a narrow neck and a wide body, akin to the shape of an ink bottle, and other amorphous pores and that these pores are relatively well developed in the shale. Due to the “bottleneck” shape, these pores are conducive to acting as gas reservoirs but are not conducive to seepage. The H3 adsorption loop increases sharply when the relative pressure is close to 1.0, and the hysteresis loop is smaller than that of the H2 type, indicating that the pores featured a parallel plate shape. The scale of the pores varied from micropores to large pores. This pore structure is favorable for gas migration. Shale samples (sample M-1) showing type H2 hysteresis feature polymorphic pores or ink bottle-shaped pores, whereas samples exhibiting H3 hysteresis (sample M-3) usually present slit-shaped pores. Most of the organic-rich shale samples show wide hysteresis loops, which may be characterized as the H2 type. This phenomenon may be related to the development of fine micropores in organic matter, which bind to macropores, resulting in polymorphic or ink bottle-shaped pores.
Pore types obtained from adsorption isotherms.
The pore size distribution calculated from the N2 adsorption data shows that all samples have similar pore size distributions, and the largest peak occurs at a diameter of approximately 5.9 nm (Figure 8), indicating that the Niutitang shales is dominated by mesopores. More than 80% of the total mesopore volume is associated with pores less than 10 nm in width. The relative pore structure parameters measured in the cryogenic liquid nitrogen adsorption experiment are shown in Table 5, and the specific surface area (calculated by the BET model) is 16.16–21.53 m2/g, with an average value of 19.317 m2/g. The pore volume (calculated by the BJH model) has a range of 0.0173–0.02827 cm3/g, with an average of 0.02469 cm3/g. The average pore size distributions ranged from 4.771 to 6.201 nm, with an average of 5.3187 nm, which is regarded as mesopore sized. The specific surface area of shale is higher than that of conventional reservoir rock and favorable for the adsorption and storage of gas on the shale surface. Mesopores with pore diameters of approximately 5.9 nm account for the majority of the pore volume and constitute the primary space for gas storage in this shale.
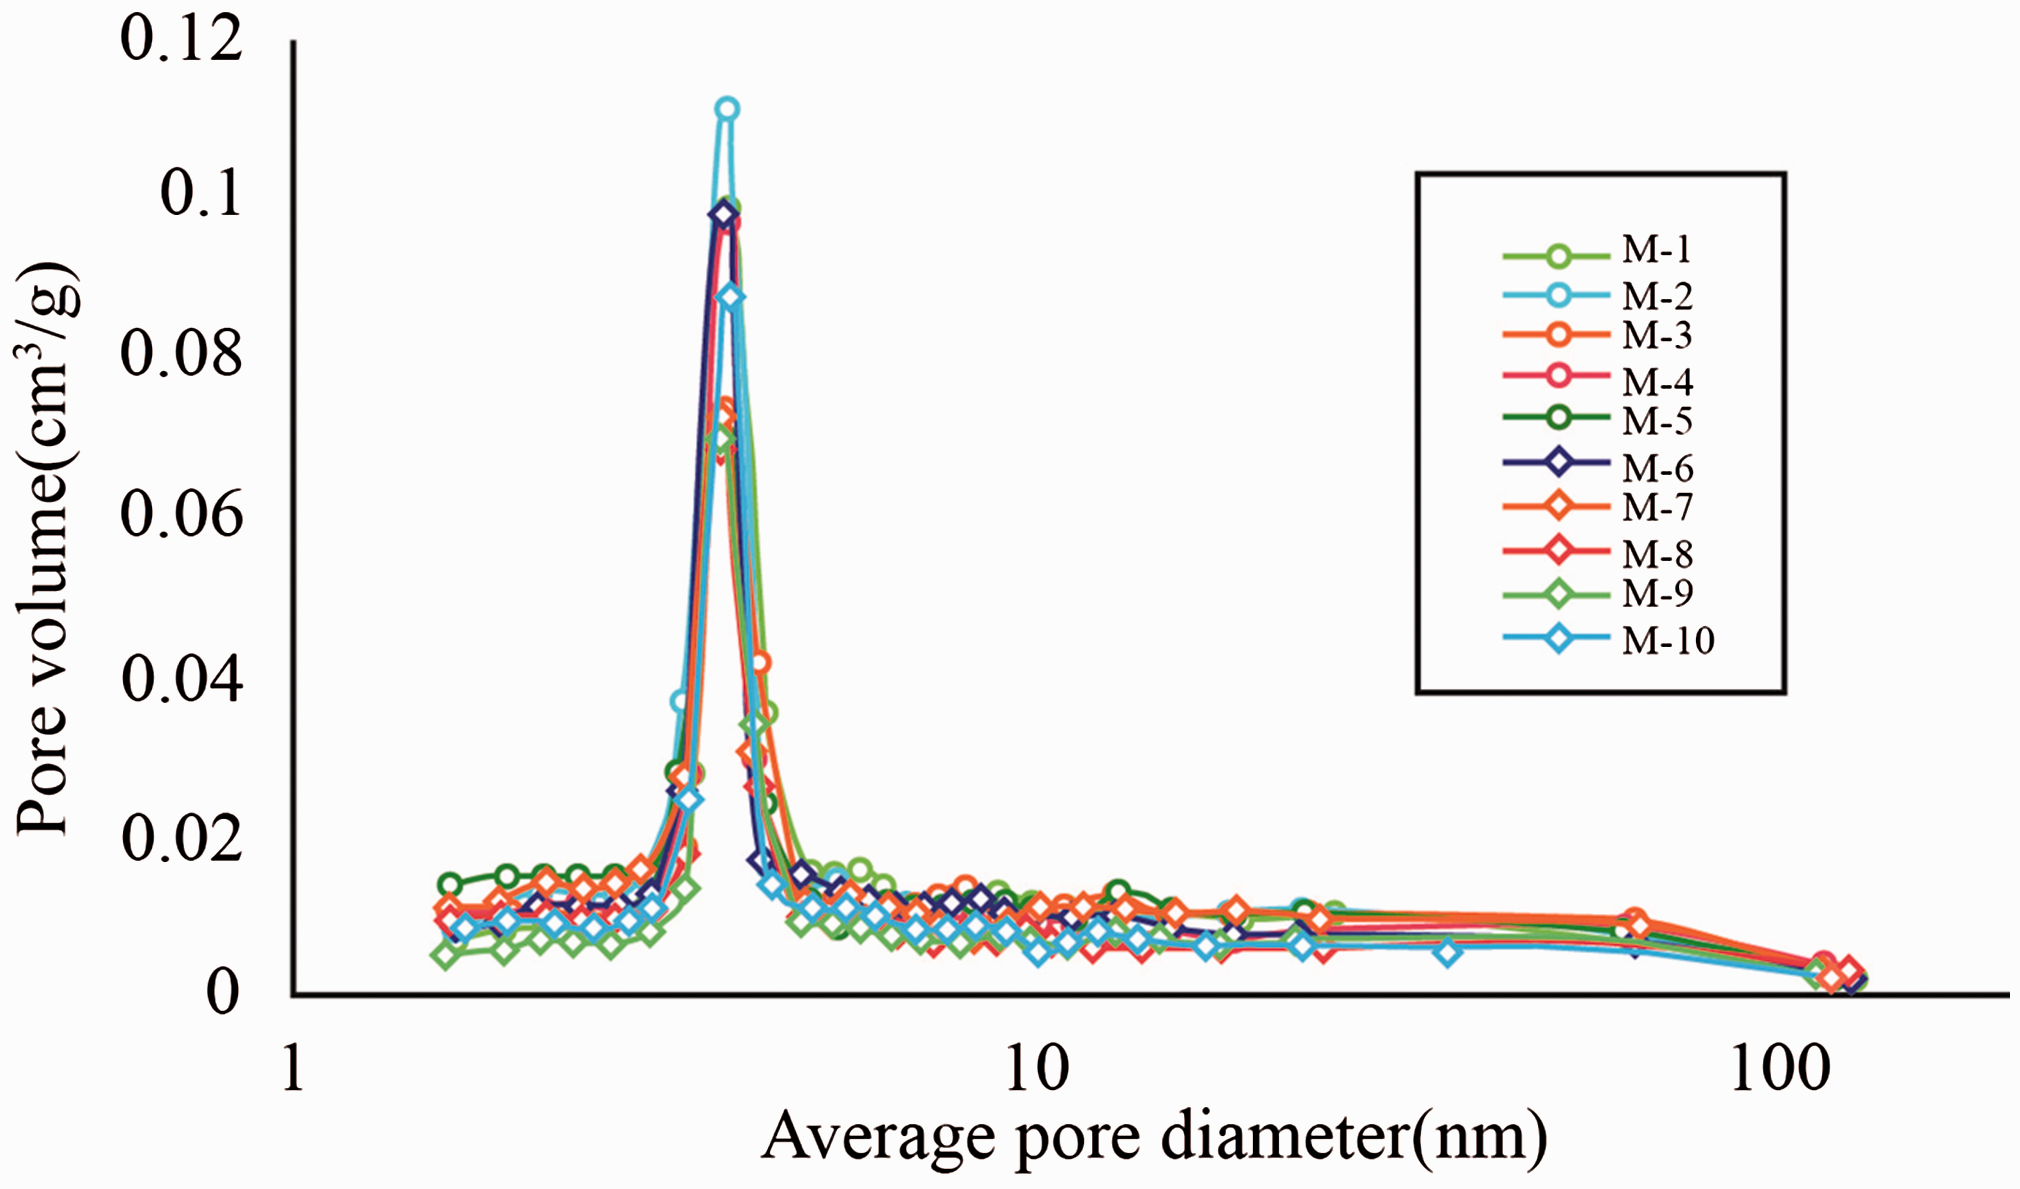
Pore volume distribution versus pore width.
Pore parameters of shale samples from nitrogen adsorption.
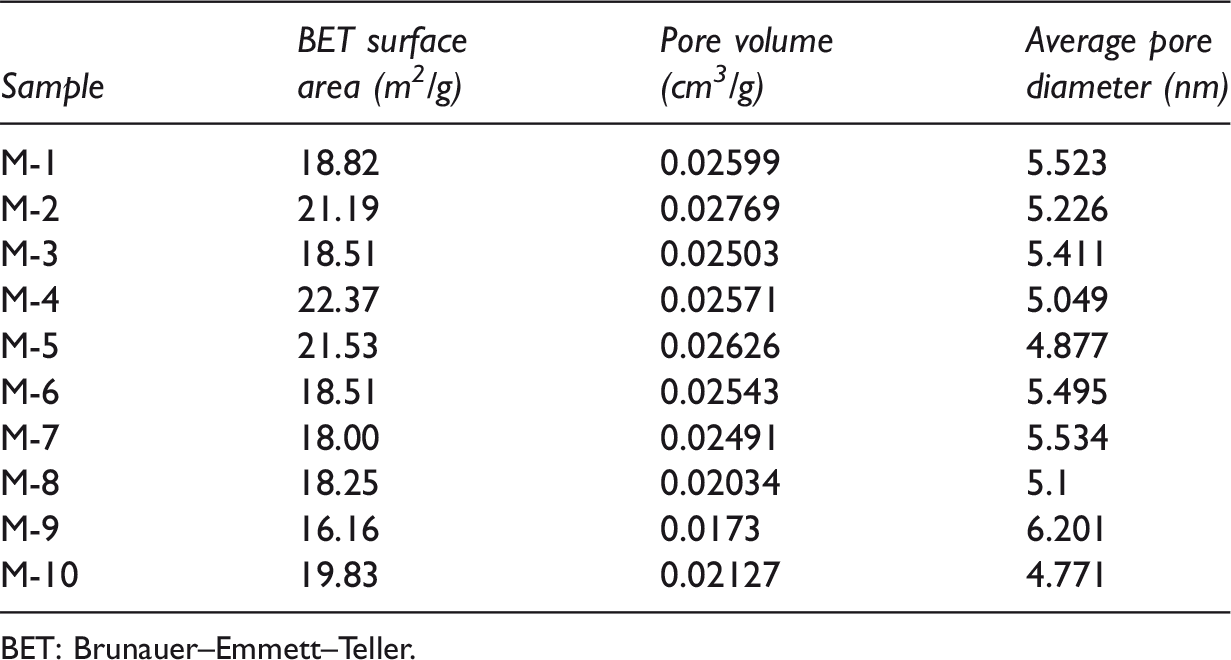
BET: Brunauer–Emmett–Teller.
We selected the high-resolution SEM images from the shale samples and binarized the SEM images with Image-Pro Plus 6.0 software to obtain the microscopic pore morphology, pore parameters, and mineral morphology at different sections of each shale sample. Pores and mineral particles are distinguished by selecting the appropriate grayscale threshold for each image. Subsequently, we mainly extracted two main types of pores: OM pores and intergranular pores (Figure 9). A large number of organic matter pores are developed in the Niutitang shale, which are mainly irregular shapes such as bubbles, ovals, crescent, and slit shapes, with pore sizes of 10–400 nm (Figure 9(a) to (c)). OM pores are more concentrated in organic-rich shales, dominated by mesopores, and have better connectivity. These OM pores are interconnected and form an effective pore network in three-dimensional space. Therefore, a large number of OM pores not only provide more storage space for shale gas, but also promote the seepage path of shale gas through the formation of seepage (Sun et al., 2016; Tang et al., 2016).
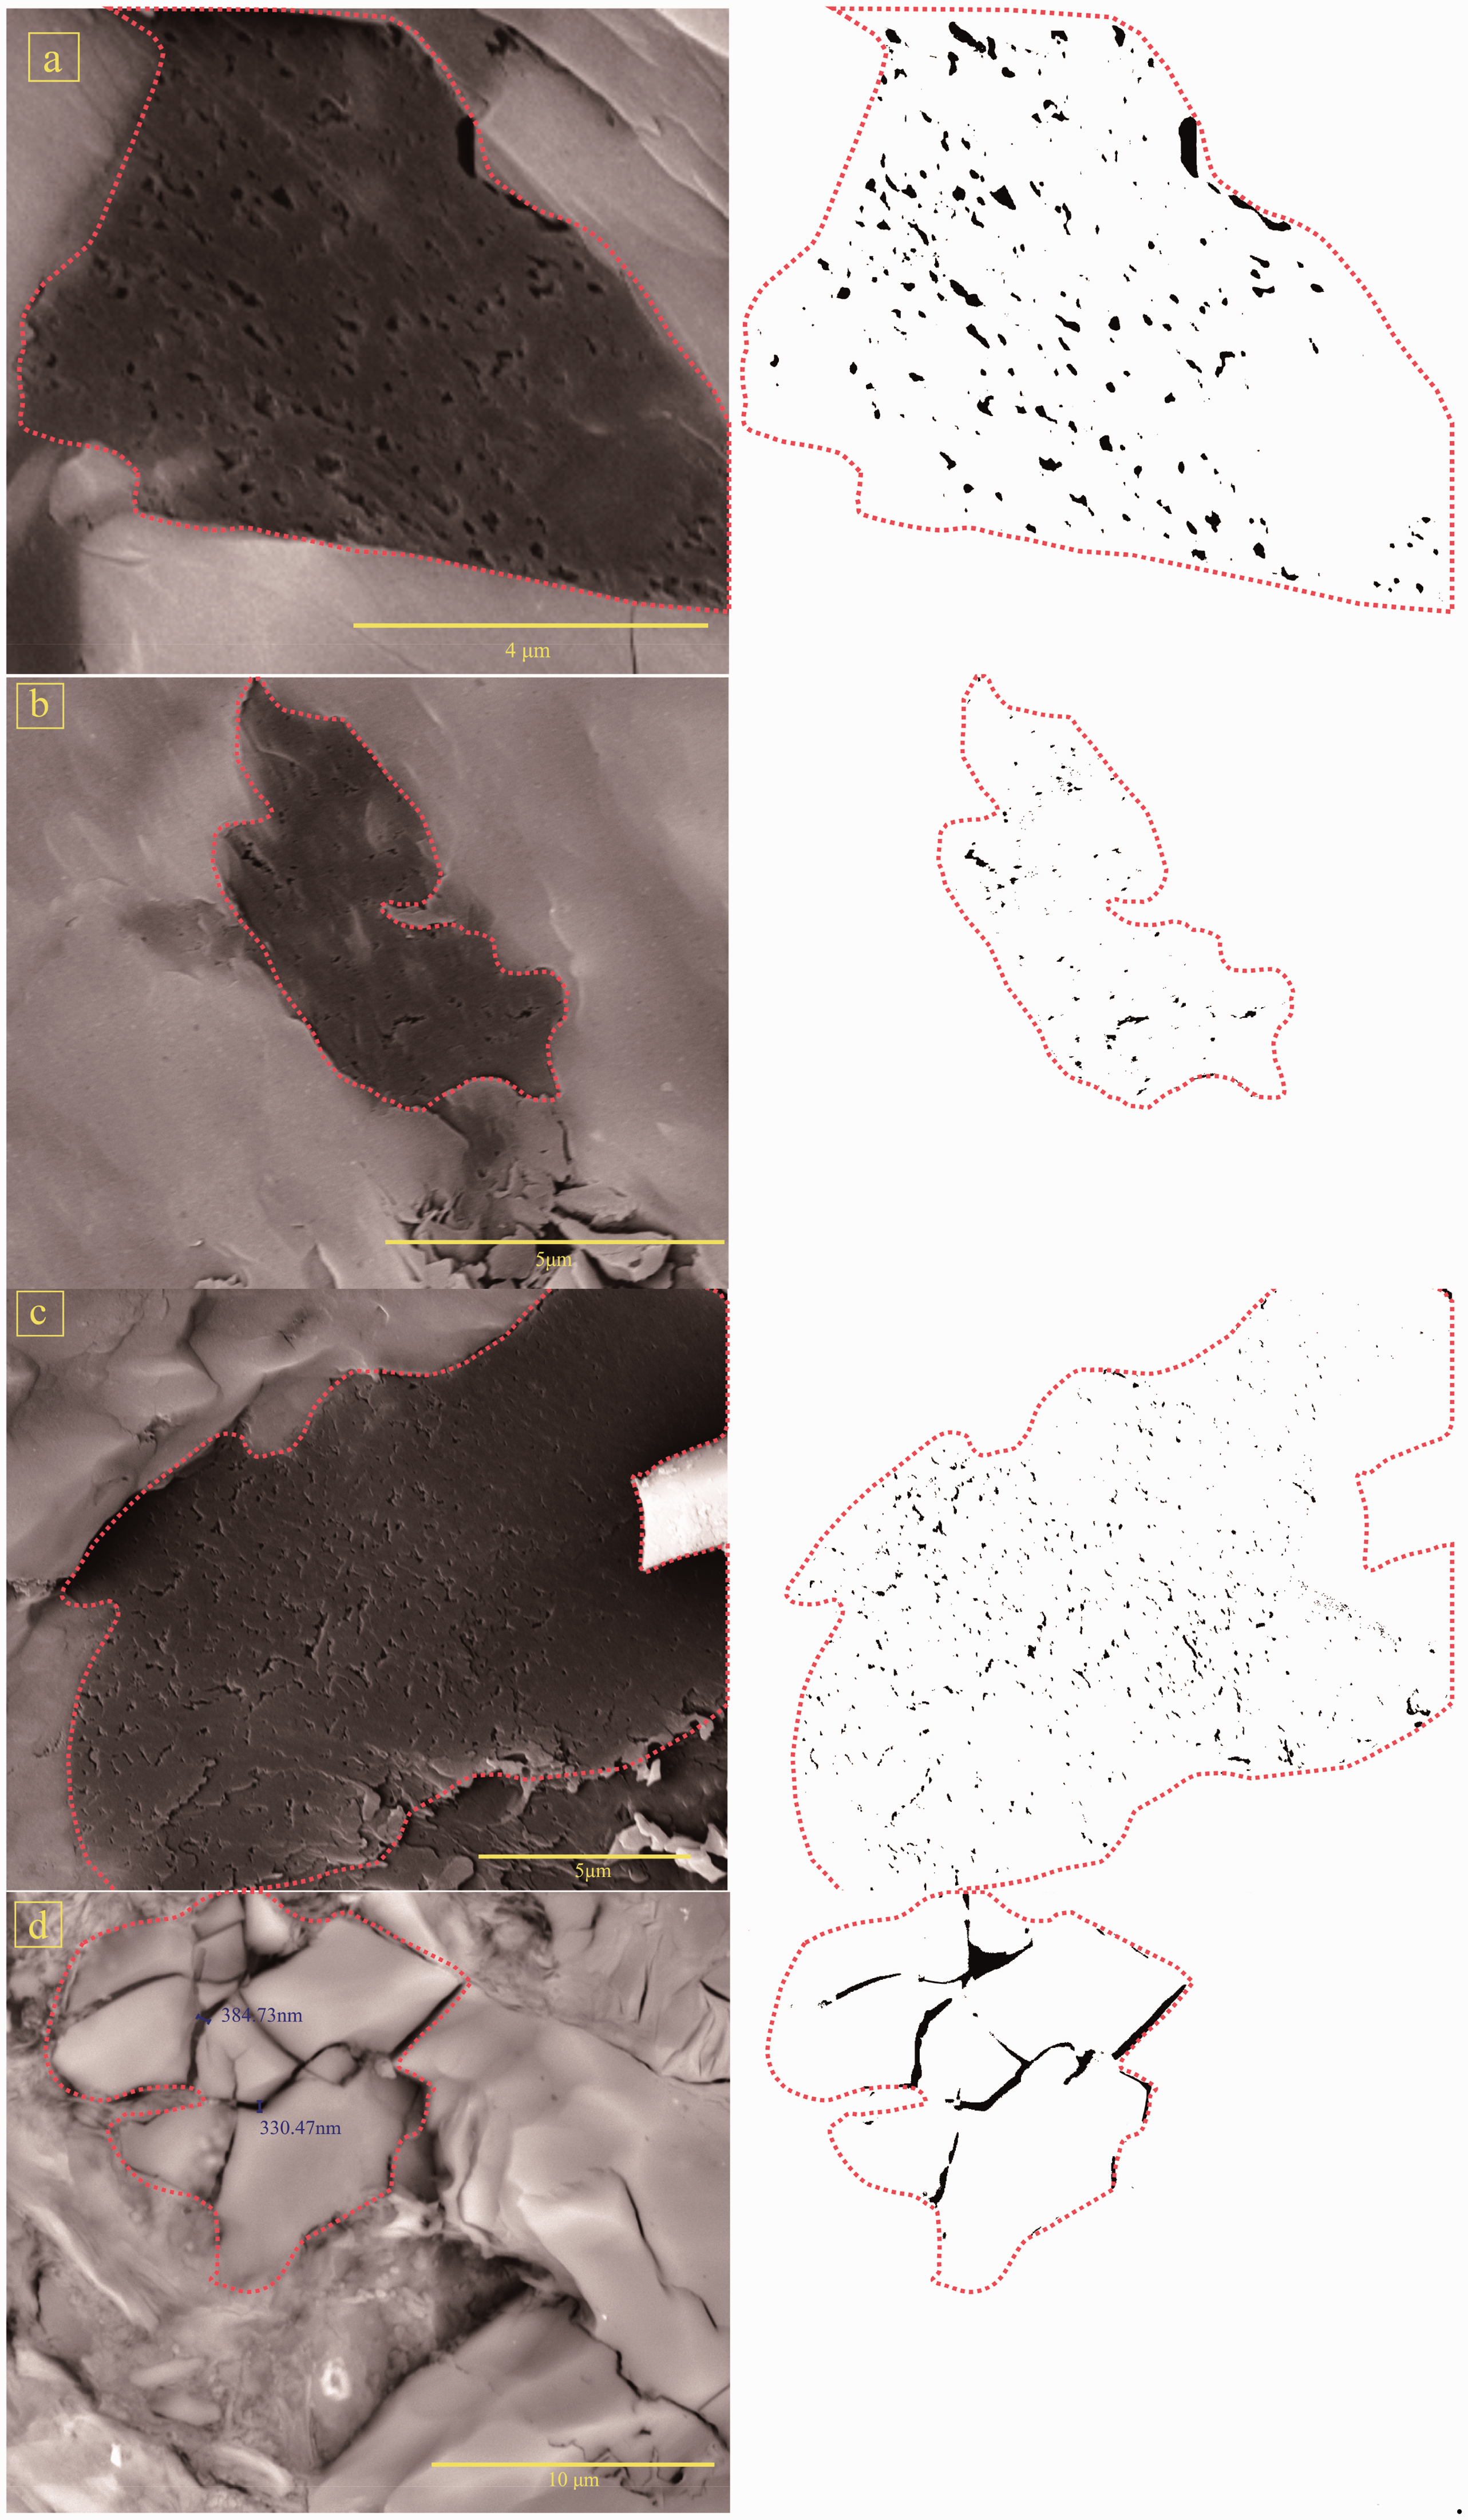
Pore extractions from different SEM images ((a) OM pores, M-1; (b) OM pores, M-4; (c) OM pores, M-10; and (d) intergranular pores, M-9).
Intergranular pores are usually developed at the contact point of mineral particles, the distribution is not concentrated, the shape of the pores is generally polygonal or linear, and the arrangement is disordered. The pore size is larger than the pores of organic matter and can reach micron level. The residual space of different hardness particles after compaction cementing is mostly polygonal, while the layered clay minerals, especially illite, illite/smectite mixed layer of interlayer pores are mostly linear (Mendhe et al., 2016; Wang et al., 2016). The intergranular pore size in Figure 9(d) is about 300–400 nm, larger than the previous organic pores. Although the size of intergranular pores is larger, the number of intergranular pores is significantly smaller than the number of OM pores. Therefore, the effect of intergranular pores on shale gas accumulation and seepage is limited.
The fractal dimensions of all samples were calculated based on the FHH model. Figure 10 shows the fractal fitting for the marine shale from the Fenggang area. The fractal dimension can be divided into D1 (P/Po = 0–0.5) and D2 (P/Po = 0.5–1), which represent micropore (< 2 nm) and mesopore–macropore ranges (2–50 nm), respectively.
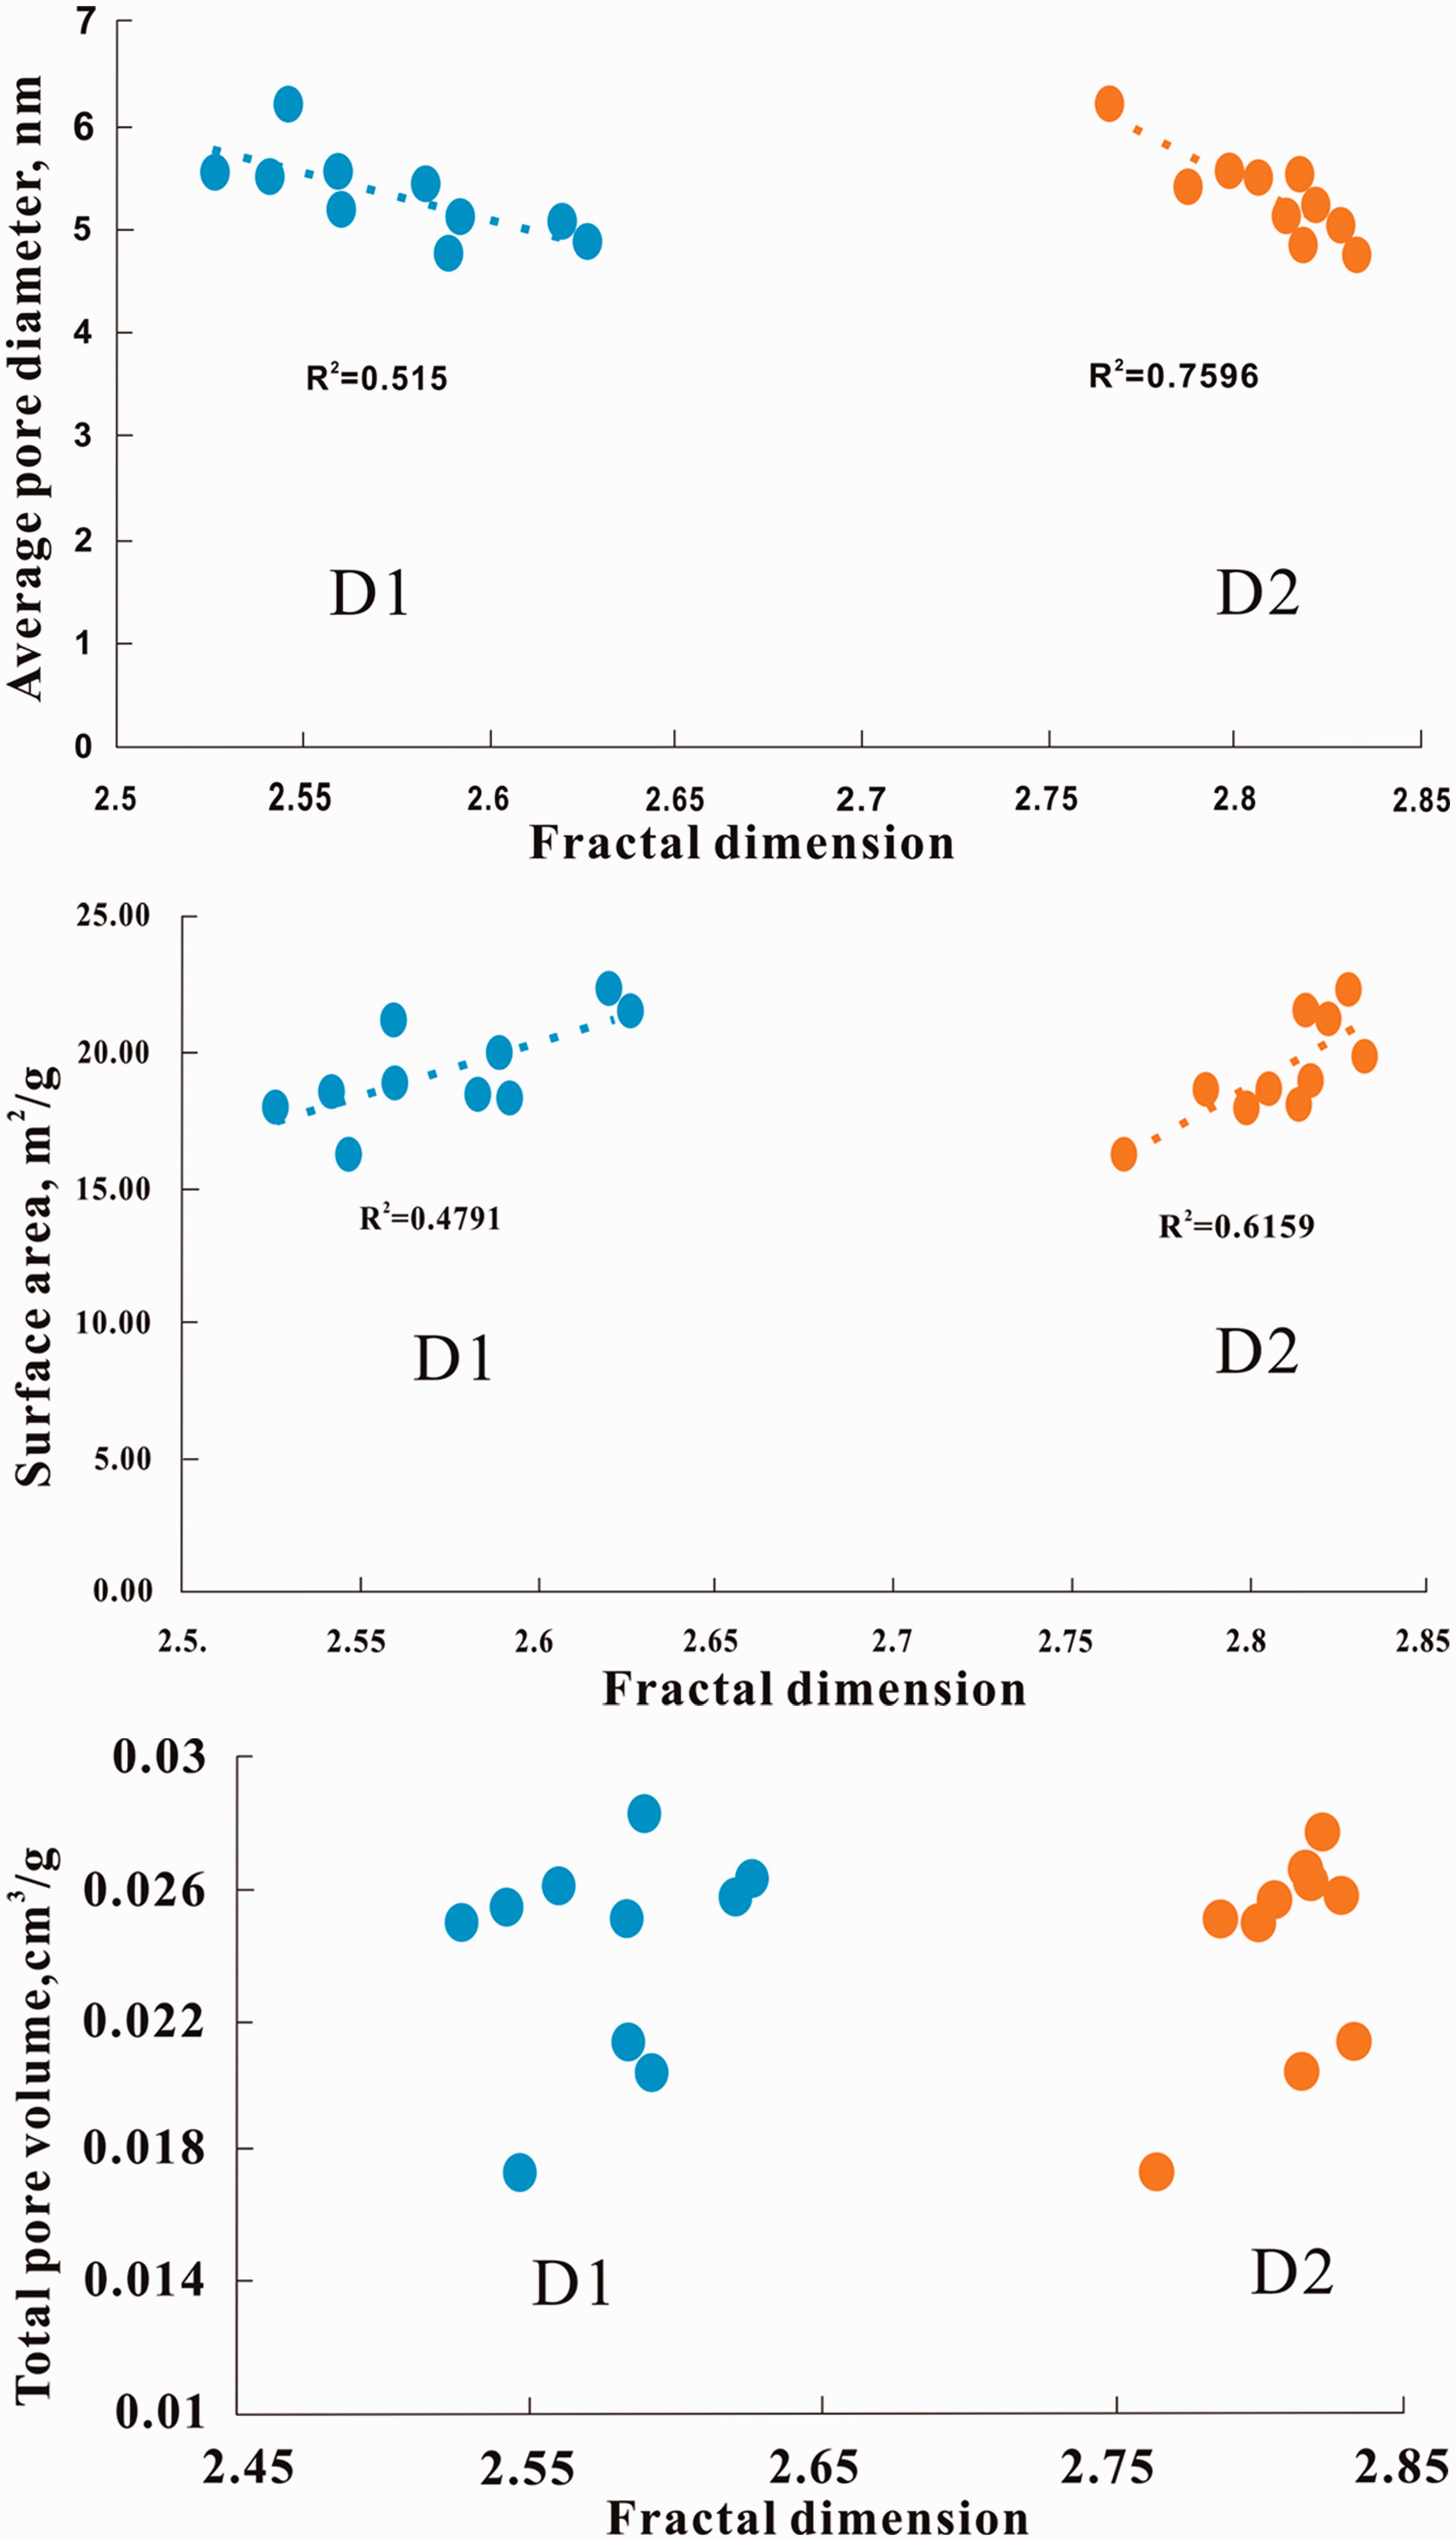
Correlations between fractal dimensions and pore structure parameters.
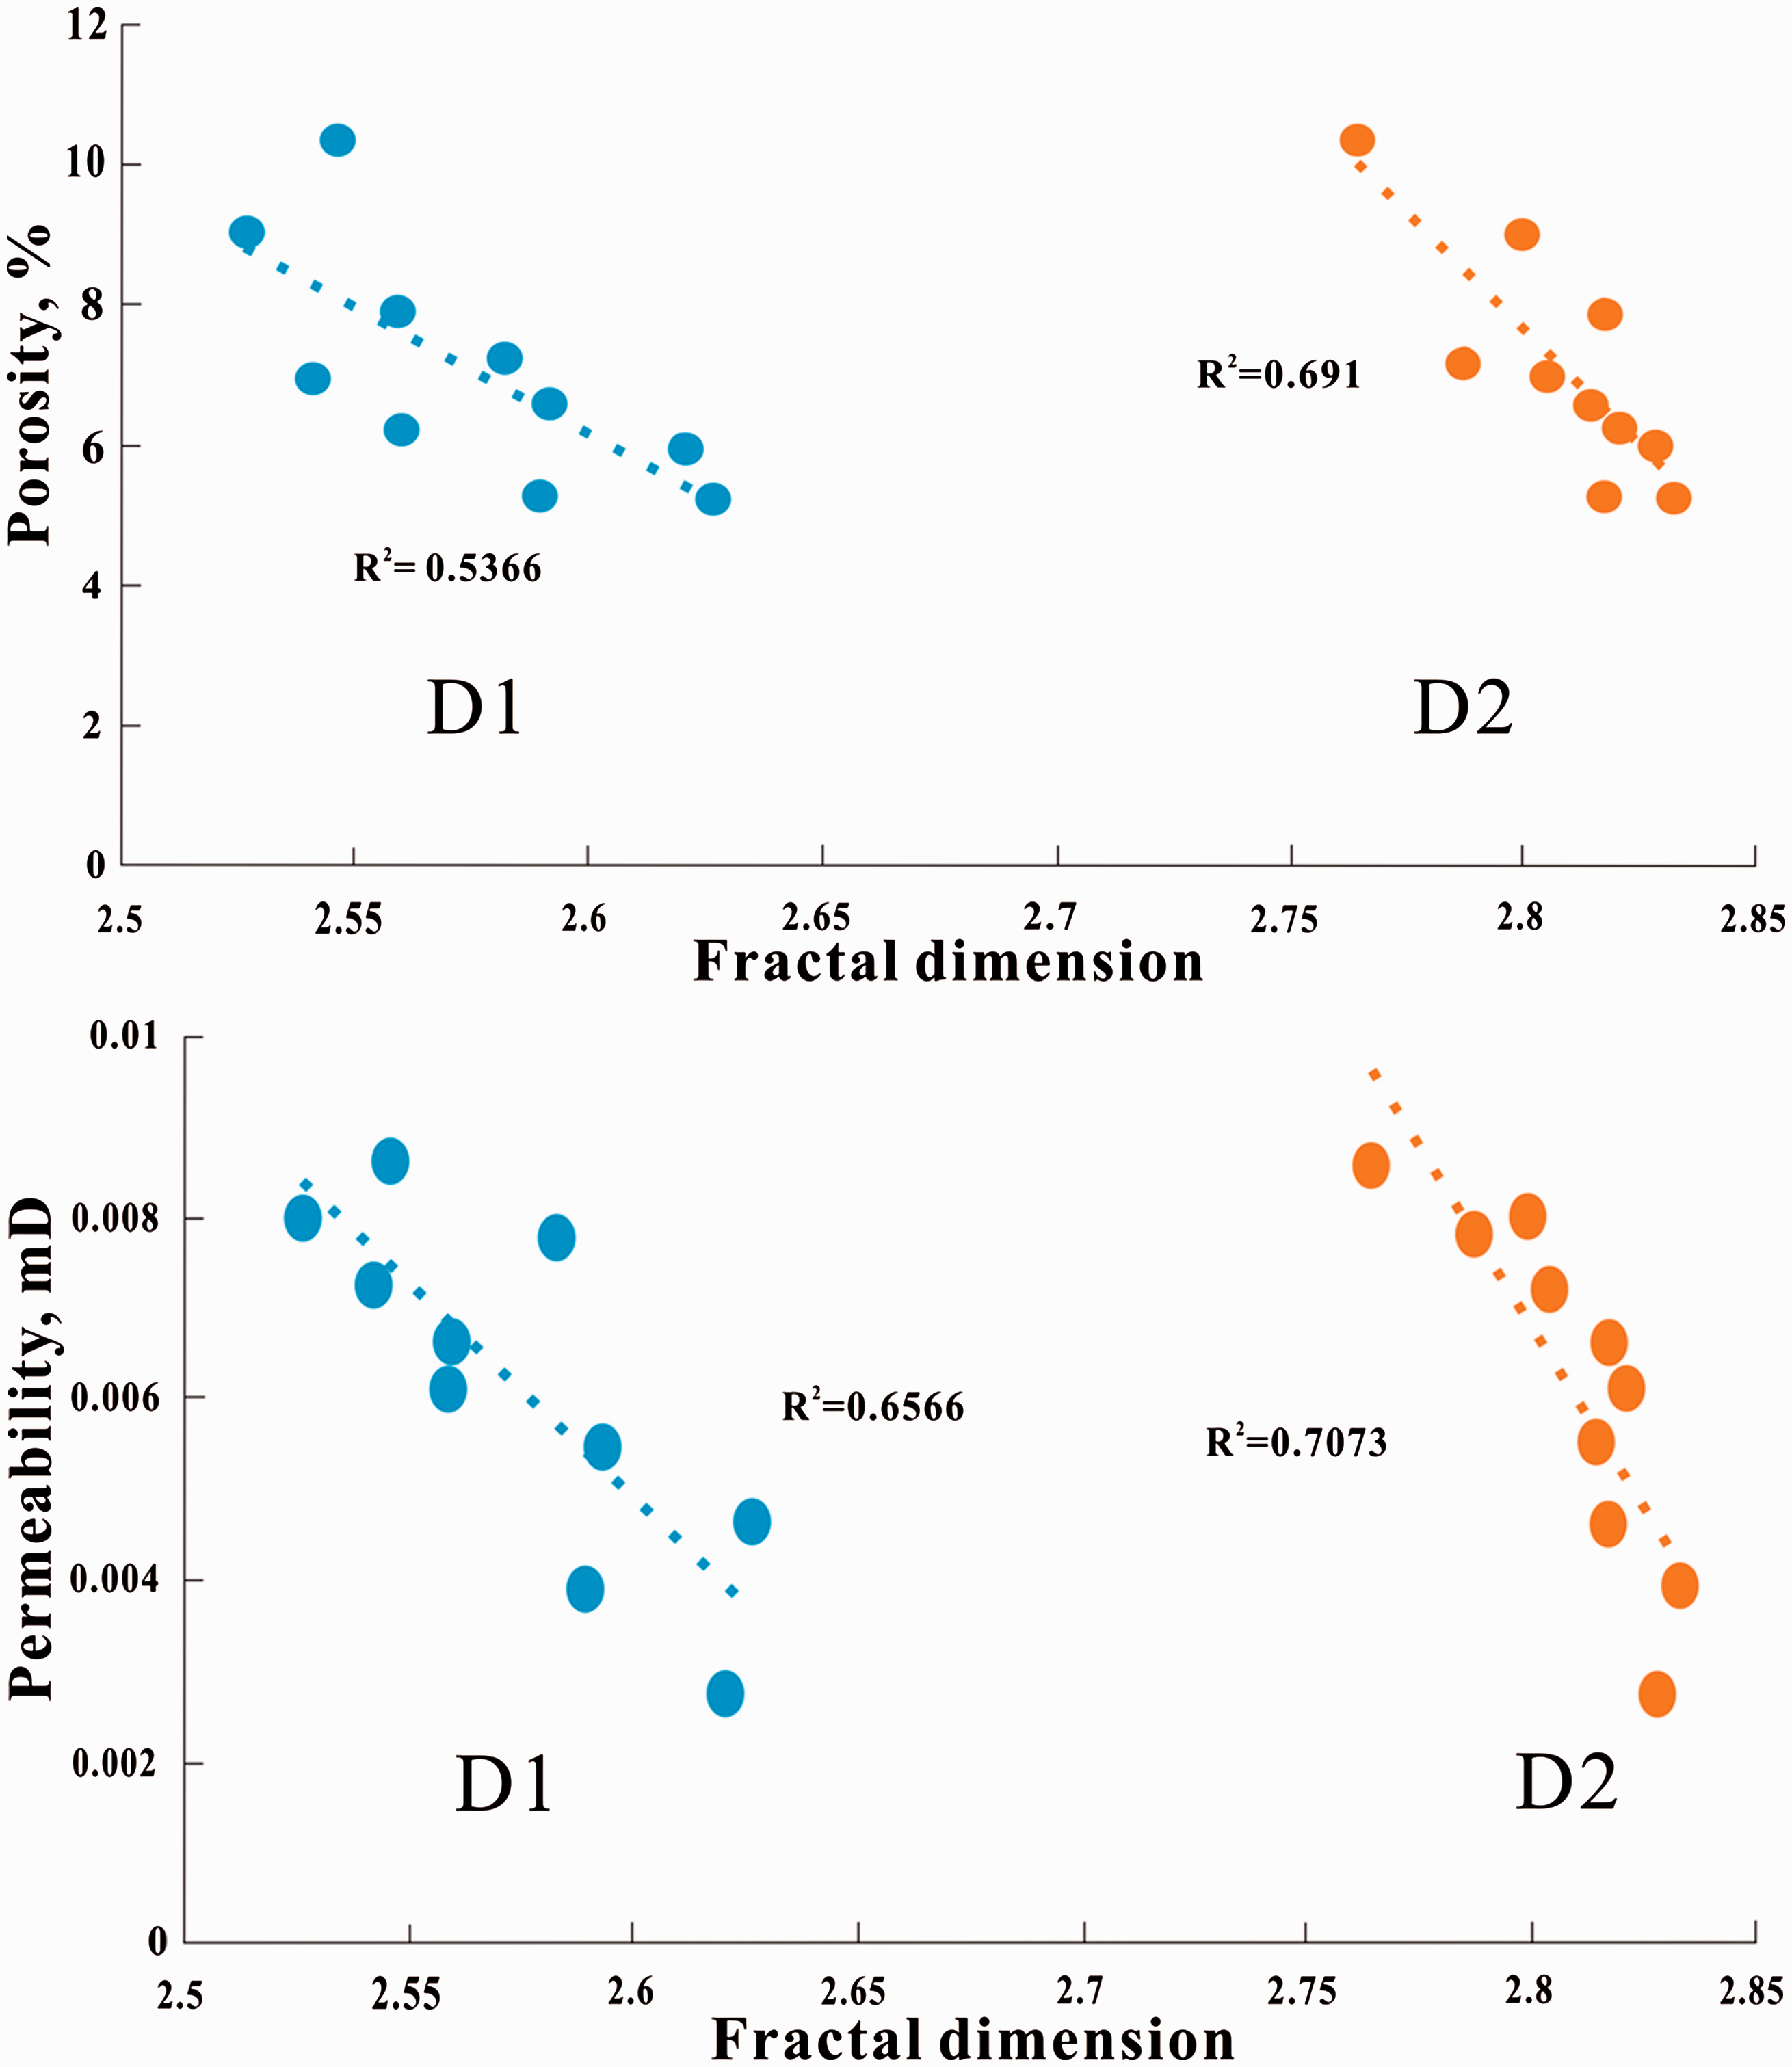
A negative correlation exists between the average pore size and the fractal dimension, as shown in Figure 10. The fractal dimension increases as the average pore size decreases. In other words, the shale samples with smaller pore sizes and larger specific surface areas have higher fractal dimensions, and the more irregularity in the shale, the more complex of the pore structure. A good correlation exists between the specific surface area and the fractal dimension. For example, shale samples with large fractal dimensions have larger total specific surface areas. Since the shale samples with smaller average pore diameters also exhibit more micropores, resulting in more complex pore structures and coarser pore surfaces, the fractal dimension and shale surface area also increase. However, the relationship between the total pore volume and the fractal dimension is weak and may be related to the composition of the shale, which consists of fine-grained particles. The accumulation state and particle size tend to affect the specific surface area and pore volume, particularly the latter. The upper limit of the fractal dimension is much smaller than the diameter of the particles, and the pattern of particle accumulation should not influence the fractal dimension.
Based on the pore structure parameters and the fitting curves of D1 and D2, the fitting coefficients between D2 and the average pore diameter and the specific surface area are larger than those for D1. This observation suggests that D2 may have a mechanistic relationship with the pore structure and may be more suitable for representing the fractal dimension of the pore structure.
Relationships between the permeability and porosity and the fractal dimensions of shale
The helium porosity of the shale samples was between 5.2 and 10.33% and averaged 7.06% (Table 6). The permeability ranged from 0.0027 to 0.0086 mD, with an average value of 0.0061 mD. Figure 11 shows that the porosity and permeability were positively correlated, indicating that the pores were connected and that open pores accounted for a high proportion of the total number of pores in the shale.
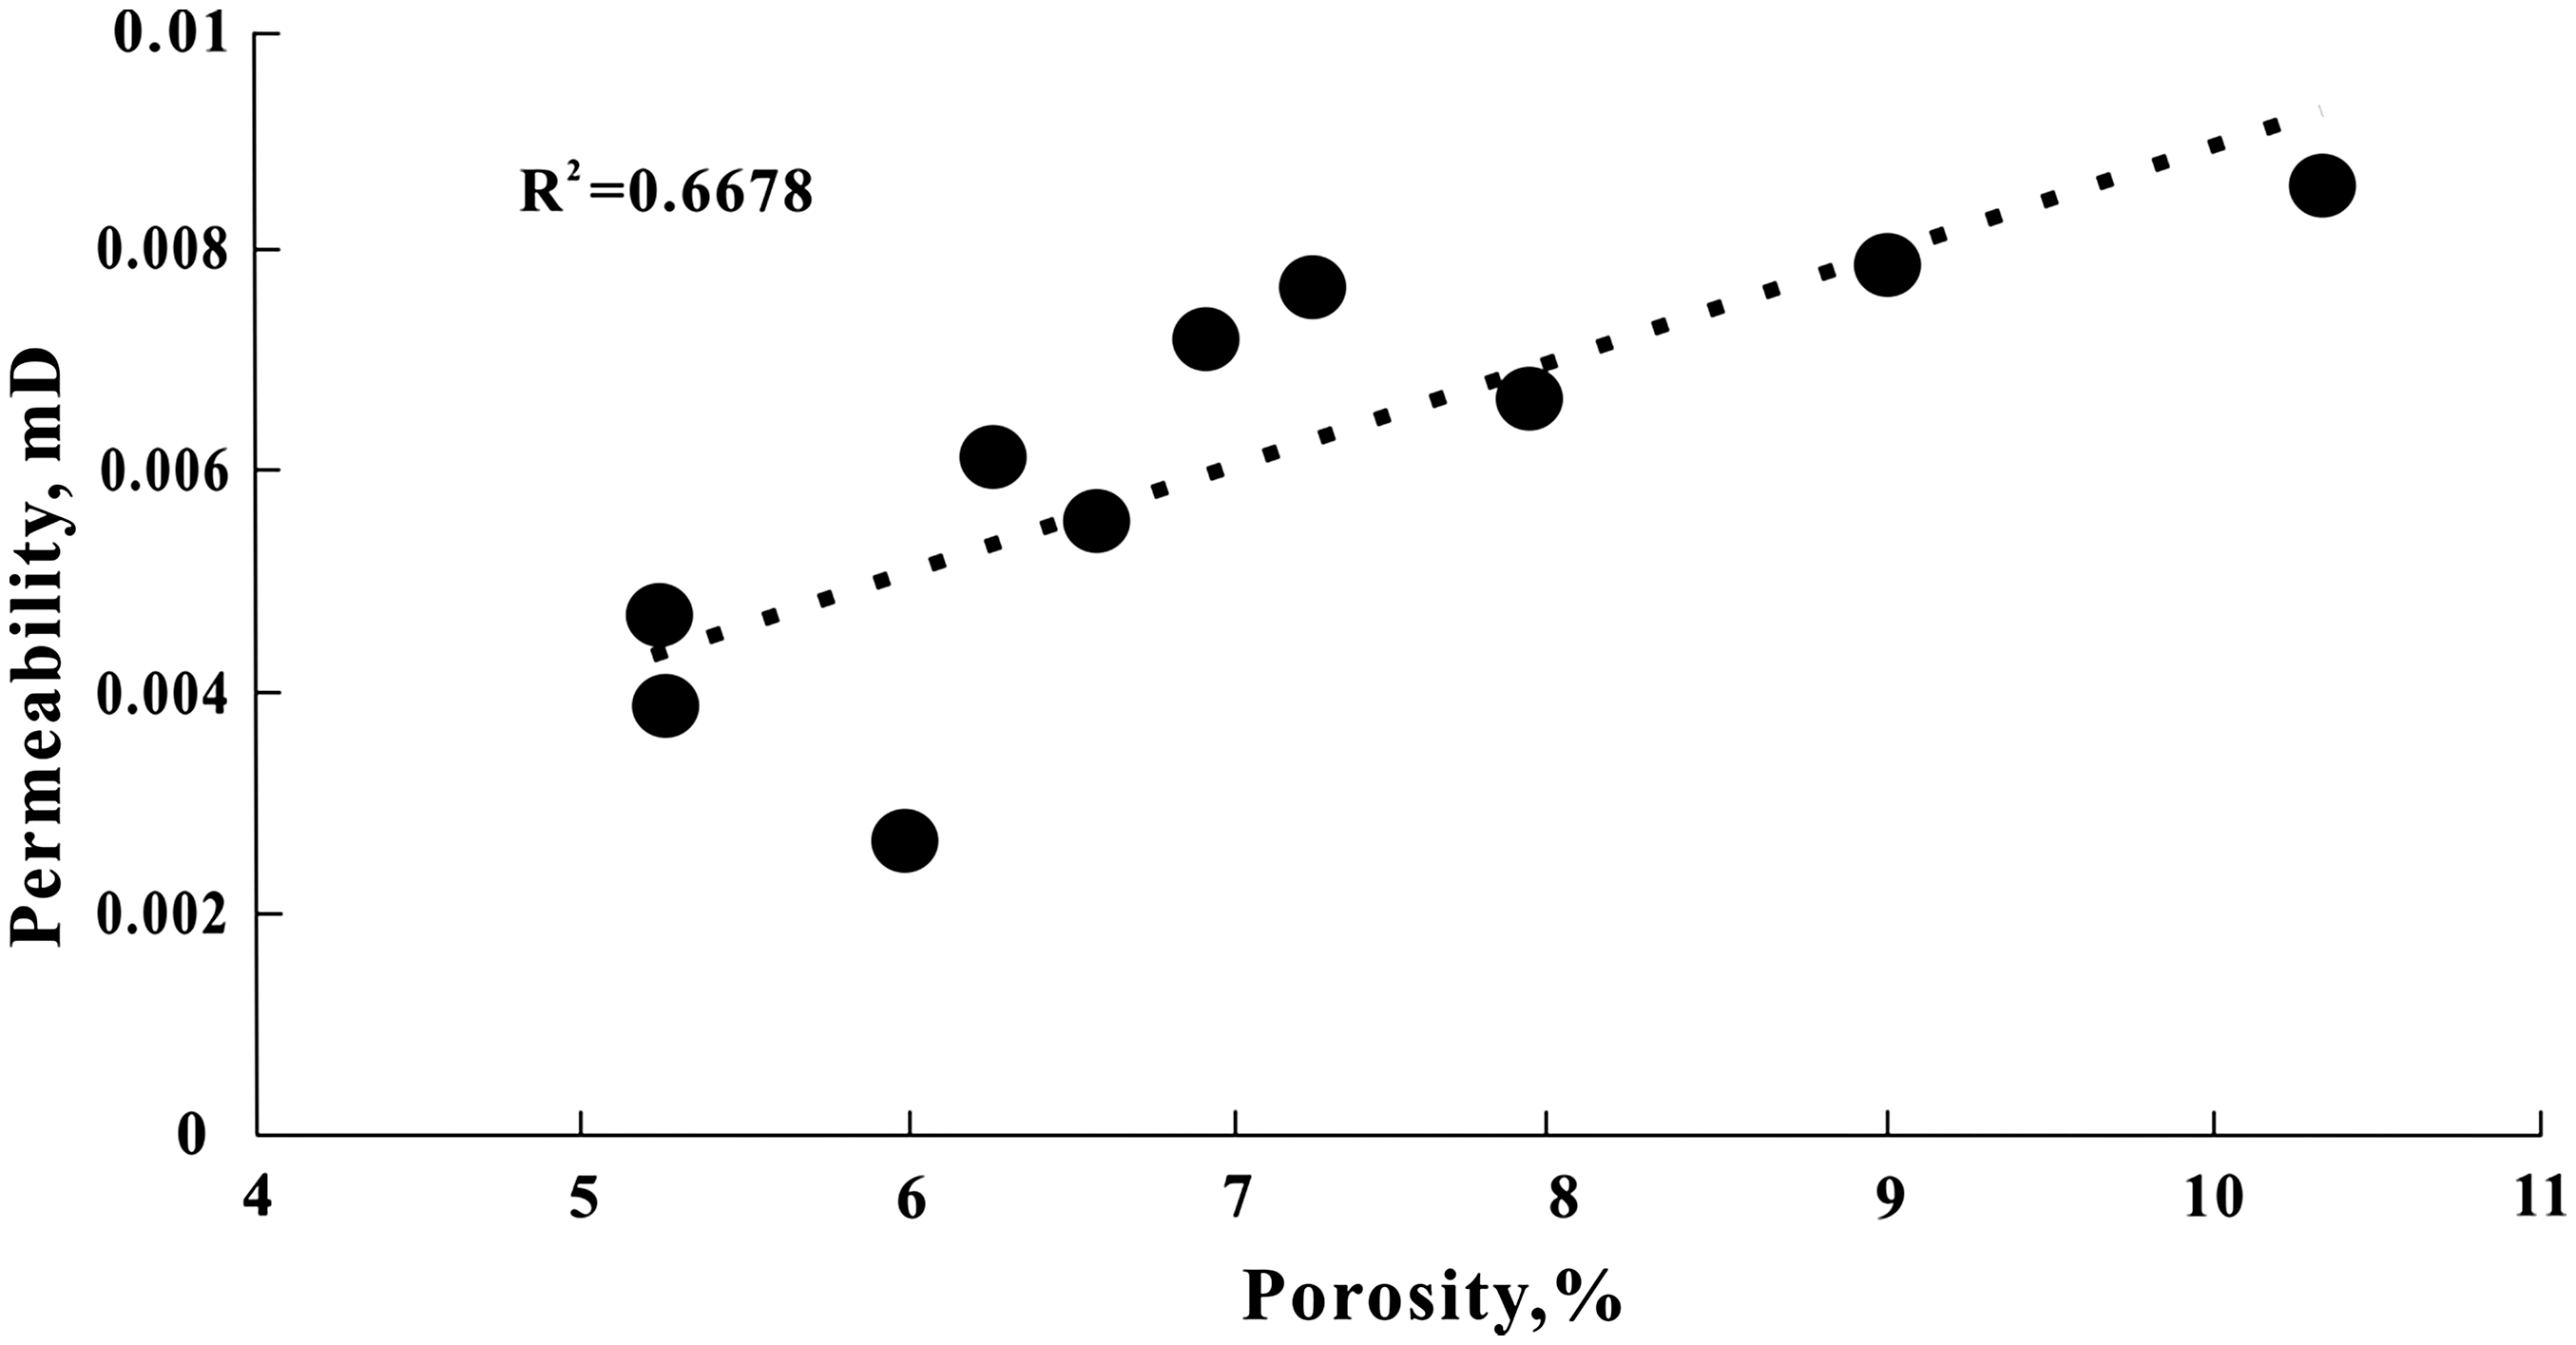
Relationship between porosity and permeability of shale samples.
As shown in Figure 12, a negative correlation is observed between the fractal dimension and the porosity and permeability of the shale. The moderate correlation between the fractal dimension and the porosity indicates that other factors affect the relationship. The porosity increases in conjunction with the increasing abundance of macropores, whereas the fractal dimension is related to micropores. Thus, the combination of micropores and macropores in the sample leads to a complex relationship between fractal dimension and porosity. However, the permeability decreases as the fractal dimension increases. Interconnections among macropores, mesopores, micropores, and fractures play a significant role in controlling the matrix permeability of shale (Yang et al., 2014). Moreover, the studied shale is dominated by mesopores, and the pore structure is complicated and not conducive to the seepage and output of shale gas.
Relationships between fractal dimensions and porosity and permeability of shales.
Discrepancies in D1 and D2 and their contributions to CH4 adsorption capacity
The Langmuir pressure derived from the methane adsorption data ranged from 2.4 to 3.59 MPa, and the Langmuir volume ranged from 3.45 to 5.79 m3/t, with an average of 4.67 m3/t. In general, the fractal dimensions of porous structures and fractal dimensions of the surface are used to represent the fractal characteristics of porous materials. In this study, the fractal dimensions D1 and D2 are used to characterize the different surface behaviors that occur at the liquid/gas interface. In the initial stage of adsorption, micropores have a larger specific surface area than the mesopores, provide more adsorption sites for methane molecules, and have a larger adsorption capacity; therefore, methane is preferentially adsorbed in the micropores. At this time, the solid–gas interface is controlled by the van der Waals force generated by the solid–gas interaction. D1 indirectly reflects the pore surface conditions via the van der Waals force; therefore, the value of D1 represents the fractal dimension of the micropore surface. However, when the amount of adsorbed gas increases, the adsorption interface of the shale is covered by a single molecular layer and becomes a multimolecular layer; thus, the surface becomes smooth and the controlling effect of the solid–gas van der Waals forces is weakened. Consequently, D1 does not express the characteristics of the solid–gas interface. However, D2 reflects the agglomeration of gas clusters in the pore throat of the shale; therefore, the D2 value expresses the fractal dimension of mesopores and macropores. Based on the above discussion, we suggest that the value of the fractal dimension of the mesopores and macropores (i.e. D2) is larger than the value of the fractal dimension of the micropores (i.e. D1), which demonstrates that the pore throat structure of the macropores and mesopores is more complex than that of the micropores in the shale.
The relationships between the fractal dimension of the shale samples and the CH4 adsorption capacity are shown in Figure 13. A positive correlation is observed between the CH4 adsorption capacity and the fractal dimensions D1 and D2, which indicates that shale samples with larger fractal dimensions have a higher adsorption capacity. Higher D1 values indicate that shale samples with more irregular surfaces can provide more adsorption sites for CH4 and lead to higher adsorption capacity. Based on the prior discussion, larger D2 values for the pore structure indicate larger pore volumes and smaller pore diameters. A larger pore volume can increase the adsorption capacity and provide more space for CH4 storage. The adsorption potential is related to the interaction force between the solid surface and the gas molecules (Gregg and Sing, 1982). The smaller the pore size is, the larger the adsorption potential is, and the stronger the adsorption force is, the stronger the adsorption capacity is. The fractal dimension reflects the microscopic features and pore size distribution of the pores, which affect the adsorption of CH4 gas. Therefore, the fractal dimensions D1 and D2 reflect the adsorption capacity of shale and can be used to determine the quality of shale gas reservoirs.
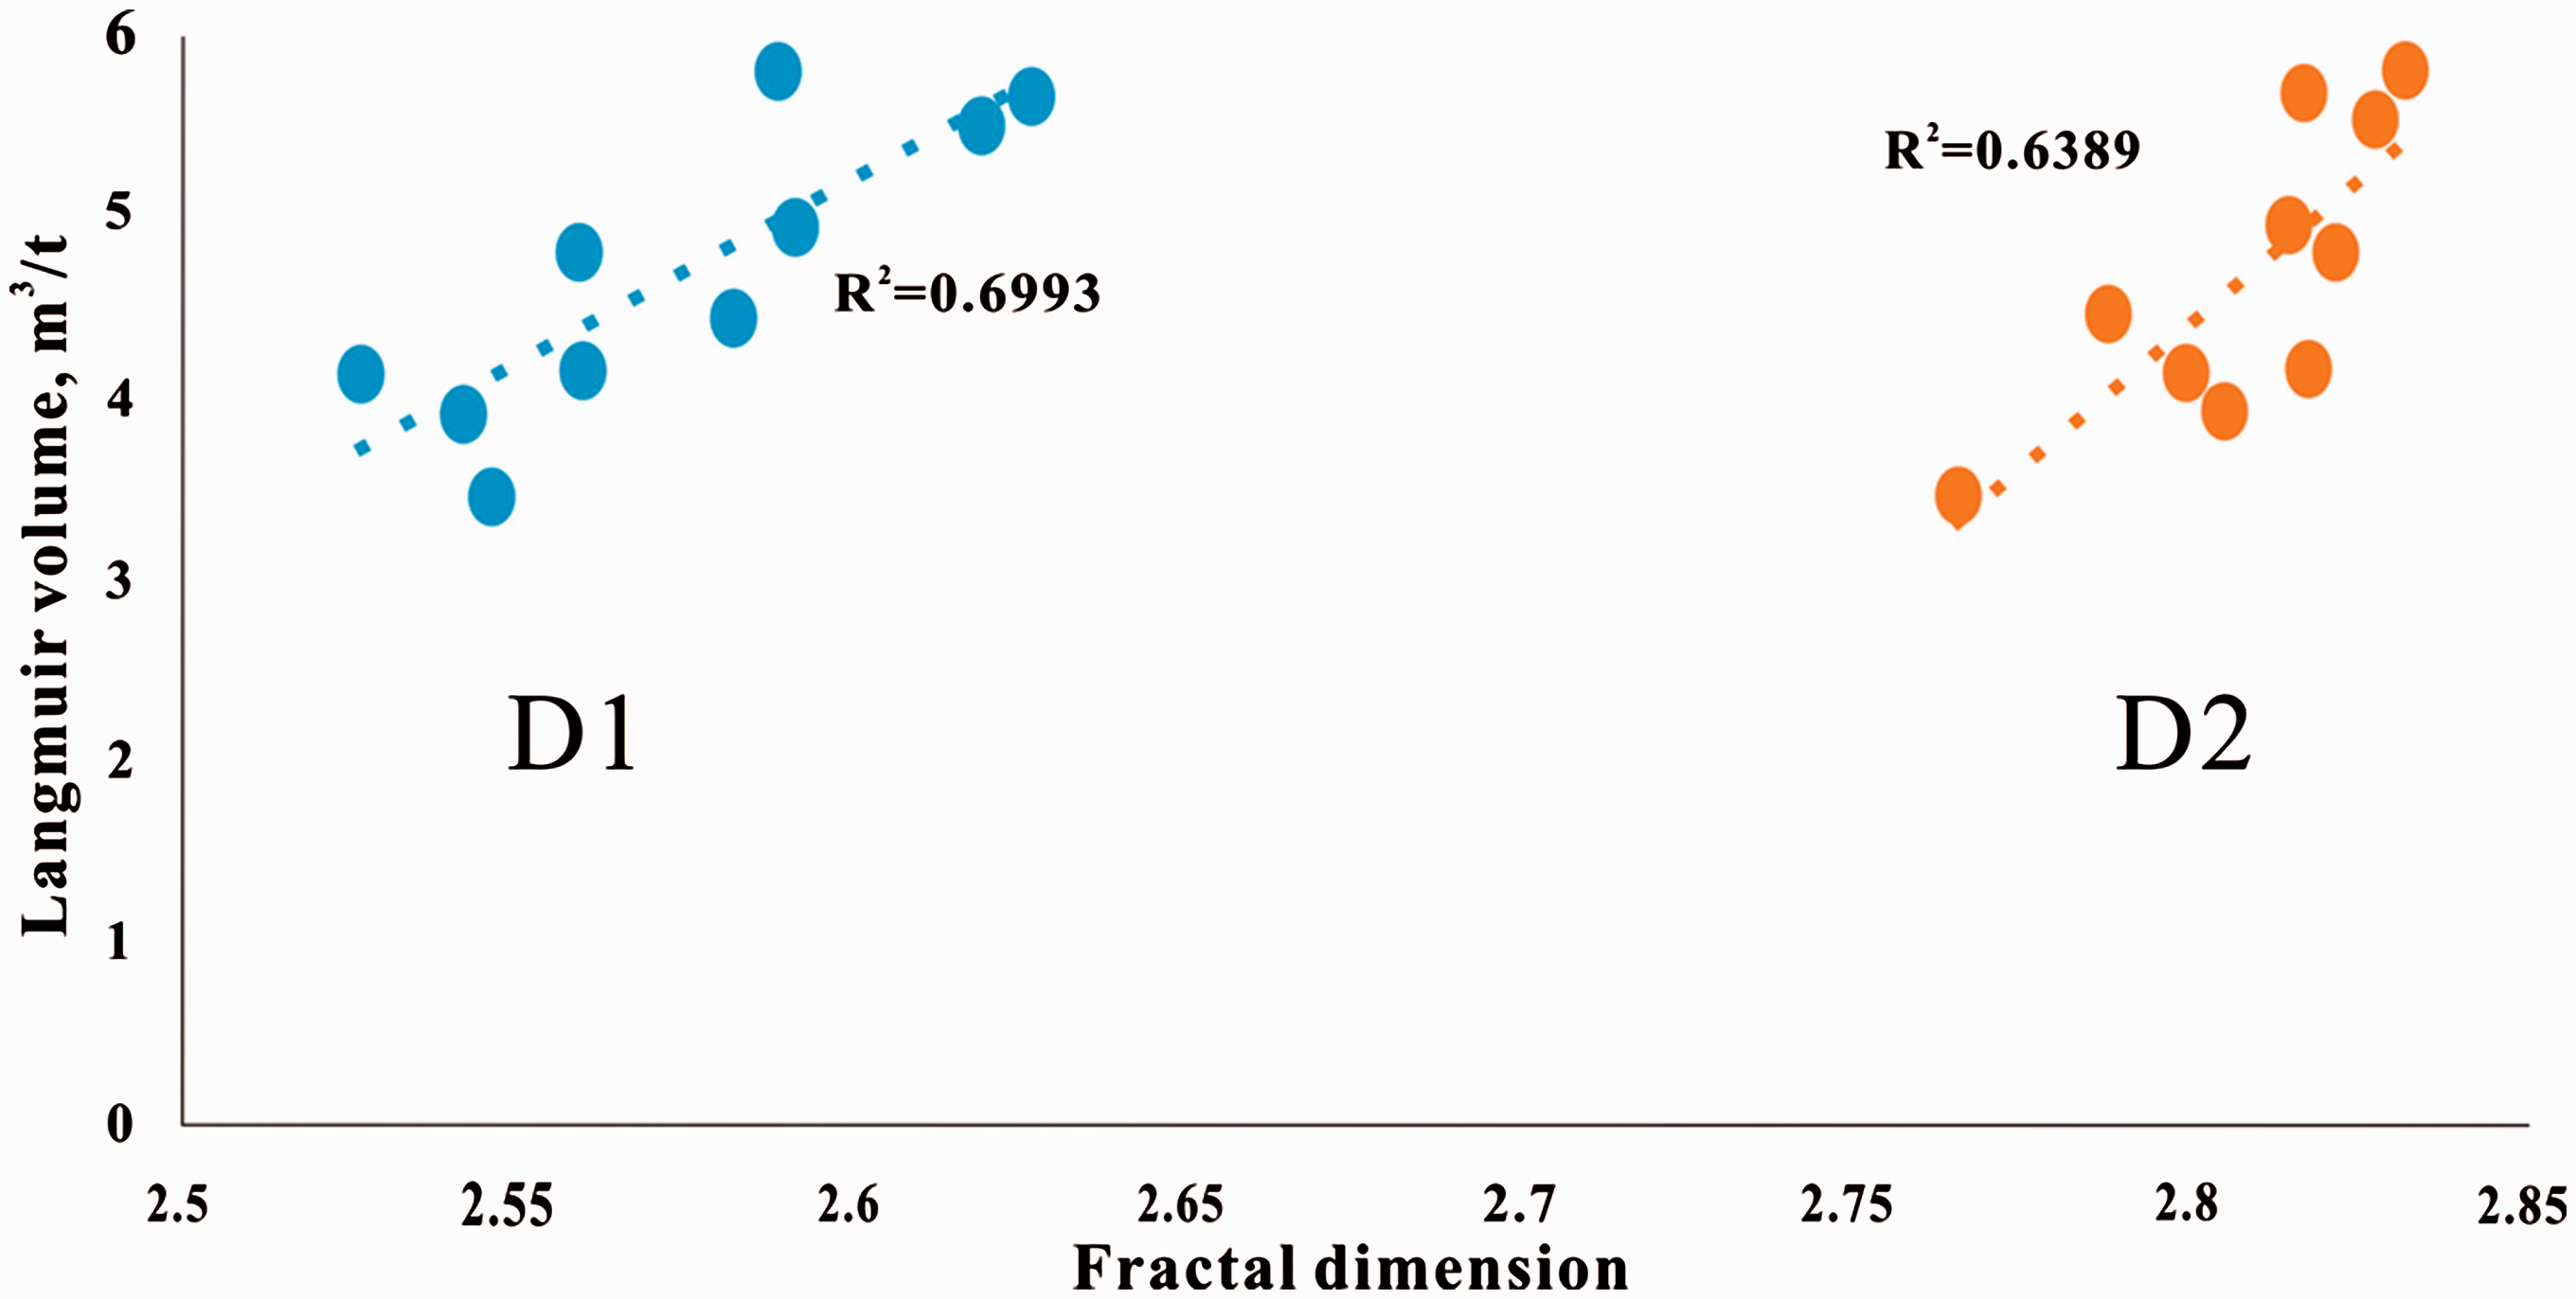
Relationships between Langmuir volume and fractal dimension.
Conclusions
In this paper, the fractal characteristics and pore structure of 10 shale samples from the lower Cambrian Niutitang Formation of the Fenggang block in northern Guizhou Province were studied using FHH theory and various experiments. The relationships between the fractal dimensions and the clay mineral content, TOC, pore structure parameters, permeability and porosity of the shale were studied. In addition, we also discuss the fractal dimensions based on the physical meaning of the fractal dimension for the adsorption capacity of the shale. This study has reached the following conclusions.
Shale samples in the study area have different fractal geometries and adsorption characteristics at P/Po values ranging from 0 to 0.5 and from 0.5 to 1. The fractal FHH method was used to identify the fractal dimensions D1 and D2, with D1 ranging from 2.5421 to 2.6264 and D2 ranging from 2.7653 to 2.8329, indicating that the pore surfaces in the shale samples are heterogeneous. The positive correlation between the fractal dimension and the TOC content indicates that organic matter is the factor controlling the fractal dimension. Thus, shale samples with higher TOC values have a larger fractal dimension. Negative correlations were observed between the quartz content and the fractal dimension, but no apparent relationship was observed between the clay mineral content and the fractal dimension, which may have been related to the high illite/smectite mixed layer content in the Niutitang Formation. Negative correlations were observed between the fractal dimension and the permeability and porosity parameters, which may have been related to the dominance of mesopores in the Niutitang shales. Furthermore, the complex pore structure in the shale is not conducive to shale gas seepage and output. The pore types in the shale samples mainly consisted of ink bottle-shaped pores and polymorphic pores. The fractal dimension increased as the specific surface area increased and the pore diameter decreased because of the increasingly complex pore texture. An apparent relationship was not observed between the pore volume and the fractal dimension. The specific surface area of shale was higher than that of conventional reservoir rock; thus, gas will be preferably adsorbed and stored on the pore surfaces. Mesopores with a pore diameter of approximately 5.9 nm account for the majority of the pore volume and constitute the main space for shale gas storage.
Footnotes
Declaration of conflicting interests
The author(s) declared no potential conflicts of interest with respect to the research, authorship, and/or publication of this article.
Funding
The author(s) disclosed receipt of the following financial support for the research, authorship, and/or publication of this article: This research was supported by the National Natural Science Foundation of China (Project Nos. 41072098 and 41372139) and the Important National Science and Technology Specific Projects of China (2016ZX05046-003-001, 2016ZX05034-004-003).