
Abstract
There are vast resources of oil shale in the Chang-7 section of the Upper Triasic Yanchang Formation, Ordos Basin, China. They would provide secure access to transportation fuels, if utilized in an effective, economic and environmental manner. A Chang-7 oil shale sample containing pyrite has been pyrolysed in a thermogravimetric analyzer at constant heating rates of 5, 10, 20℃/min up to 1150℃ with nitrogen as purge gas. Meanwhile, the pyrolysis-gas chromatograph-mass spectrometry experiments were performed on parallel samples of Chang-7 oil shale sample at 20℃/min in the four temperature sections, ranging from 100 to 700℃ to understand the decomposition mechanism. The initial decomposition temperature and the final decomposition temperature of hydrocarbonaceous material were about 367℃ and 521℃ (average values), respectively, which raised with the increase of heating rate. The decomposition of pyrite began to take place over 500℃, and the pyrolysates involving sulfur compounds are harmful to the environment and corrode the equipment. Thus, we recommended that the final temperature of Chang-7 oil shale pyrolysis was best not to exceed 550℃ considering the heating rate to avoid environmental pollution and damage of the instruments. Chang-7 oil shale exhibited a single stage decomposition in the range of about 367–521℃, representing the rearrangement of kerogen molecules in the temperature range of 100–350℃. The activation energies of kerogen decomposition were calculated using Coats–Redfern method at different heating rate. We found that both activation energy and pre-exponential factor increased with an increasing heating rate. Finally, the DTA curves of Chang-7 oil shale verified the reliability of the calculated activation energies.
Introduction
With the decline in new discoveries of conventional reservoirs and the shortage of conventional energy resources, searching potential petroleum alternative energy has been the focus of many countries. After decades of efforts, people have made great progress in exploitation of unconventional fossil fuels related to the energetic potential of hydrocarbons.
Oil shale as an important member of these unconventional fossil fuels is the most common accounting for a significant portion of the world's petroleum resources about 400 billion tons of oil, which is higher than the total for traditional crude oil (about 300 billion tons) (Han et al., 2014). In China, oil shale is mainly distributed in 20 provinces (district) and the predicted resources are estimated at 720 billion tons equivalent to 47.6 billion tons shale oil, which is only behind America, Brazil and Estonia (Liu and Liu, 2005). The Chang-7 section in Ordos Basin is abundant in oil shale resources with favorable conditions for development and the predicted resources are 145.4 billion tons which can be converted into 7.3 billion tons shale oil. However, the basic knowledge of the kinetics, products and characteristic of pyrolysis of Chang-7 oil shale has not been fully investigated. As we all know, oil shale is a sedimentary rock that contains organic matter which takes two forms in accordance with their extractability with organic solvents. One form, kerogen, is a geopolymer which would produce oil and gas (Yen and Chilingarian, 1976) by pyrolysis. The amount and quality of the oil and gases produced is influenced by the pyrolysis processing conditions such as the heating rate, pyrolysis temperature and reaction time (Dogan and Uysal, 1996; Tiwari and Deo, 2012a, 2012b; Yan et al., 2013). Bitumen is the other form of organic matter present in shale and its amount in the organic matter of oil shale is small. Unlike kerogen, bitumen is soluble in many organic solvents.
Thermogravimetric analysis (TGA) has been extensively used to accurately measure weight loss of oil shale subjected to a temperature raised at a uniform rate (Al-Harahsheh et al., 2011; Pan et al., 2015; Tiwari and Deo, 2012a, 2012b; Williams and Ahmad, 1999, 2000) because of its short experimental time, small error and consistency of conditions with large-scale oil shale retorting processes. The weight loss information can be used to construct kinetics of the evolving products. Tiwari and Deo (2012a, 2012b) have published the detailed kinetic analysis of Green River oil shale. The weight change information is usually controlled by the pyrolysis process conditions. Various researchers have reported that the increasing heating rate will shift the decomposition to higher temperatures for the analysis of oil shale using TGA (Williams and Ahmad, 1999, 2000). Al-Harahsheh et al. (2011) and Dogan and Uysal (1996) studied the influence of pyrolysis temperature and found that higher weight losses occurred for the higher pyrolysis temperatures.
The compositional information of the oil shale pyrolysates is crucial to hypothesize the decomposition mechanism. Hubbard and Robinson (1954) first proposed a simple two-step mechanism for decomposition of kerogen to bitumen and subsequently bitumen to oil. Campbell et al. (1978) deduced mechanisms of the different products formation such as oil and gas. The measurements of compounds derived from pyrolysis of oil shale have been performed using mass spectrometry (MS) and online gas chromatography combined with mass spectrometry (GC–MS). Tiwari and Deo (2012a, 2012b) summarized detailed compositional analyses of products of Green River Formation oil shales by online MS and identified 57 compounds ranging from a carbon number of 1 (methane) to 21 (heneicosane), which included alkanes, alkenes, cyclic saturated compounds and aromatics. Pan et al. (2015) have published work on Jimsar oil shale pyrolysates using combined TGA-MS. Approximately 42 compounds were identified, and the component proportion of products varied under different heating rates and pyrolysis temperatures. The use of online GC–MS to identify compounds from the pyrolysis of oil shale is not new, which was reported by Burnham et al. (1983).
The pyrolysis kinetics of oil shale has been extensively researched (Al-Ayed et al., 2010; Li and Yue, 2003a, 2003b; Nuttall et al., 1983; Wang et al., 2007). Although some researchers (Braun and Burnham, 1986; Koseoglu and Phillips, 1988) have tried to explain the complex features of the pyrolysis of oil shale, others have thought that it would be enough to consider a global first-order kinetic expression to represent the overall decomposition rate with small shale particles (Burnham et al., 1983; Campbell et al., 1978). Later, much further work on reaction kinetic models of oil shale has been done. The overall first-order reaction model (Coats and Redfern, 1964; Nuttall and Thakur, 1987; Shih and Sohn, 1980; Wang and Noble, 1983) was widely used to calculate the kinetic parameters including integral and differential methods. Following a deepening recognition of structural characteristics of oil shale kerogen, some other kinetic models have been developed to calculate the kinetic parameters for the thermal degradation from thermogravimetric data such as Friedman procedure, maximum rate method, parallel first order reaction model (Qian et al., 1991; Tissot, 1969; Tissot and Pelet, 1987; Wu and Wang, 1990), all of that can reveal the pyrolysis kinetics of oil shale kerogen.
In this paper, Chang-7 section oil shale sample of Ordos Basin, was pyrolysed in a TGA in relation to heating rate and temperature. Based on the pyrolysis experiment, we analyzed the influence of heating rate and pyrolysis temperature on the Chang-7 section oil shale and investigated the composition of pyrolysates using pyrolysis-gas chromatograph-mass spectrometry (Py-GC-MS) apparatus in four temperature sections (100–387℃, 387–472℃, 472–536℃ and 536–700℃) at constant heating rate (20℃/min). Based on the TGA data, the kinetic parameters – activation energy and frequency factor were calculated by Coats–Redfern integral method. Finally, the mechanism of Chang-7 section oil shale pyrolysis was tentatively investigated to help guide pyrolysis process of Chang-7 section oil shale.
Sample and methods
Sample
In this research, the oil shale sample was collected from the Chang-7 section (designated C7) of the Upper Triasic Yanchang Formation as drill cores in YK-1 exploration are well (Li et al., 2016) ( sampling depth was about 237.6 m) located in the south of the Ordos Basin, China. Sample was divided into three parts. The first part was crushed to 200 mesh (<0.075 mm) and then measured by X-ray diffraction analysis for mineralogical compositions. The second part of oil shale was crushed and sieved to 60 mesh (<0.25 mm) and then subjected to Rock-Eval pyrolysis for organic characteristic. The last part was crushed to 100 mesh (<0.15 mm) and then used for investigating the pyrolysis characteristic and composition of pyrolysates at each pyrolysis stage using TGA and Py-GC-MS.
Mineralogical compositions (wt.%) of C7 oil shale.
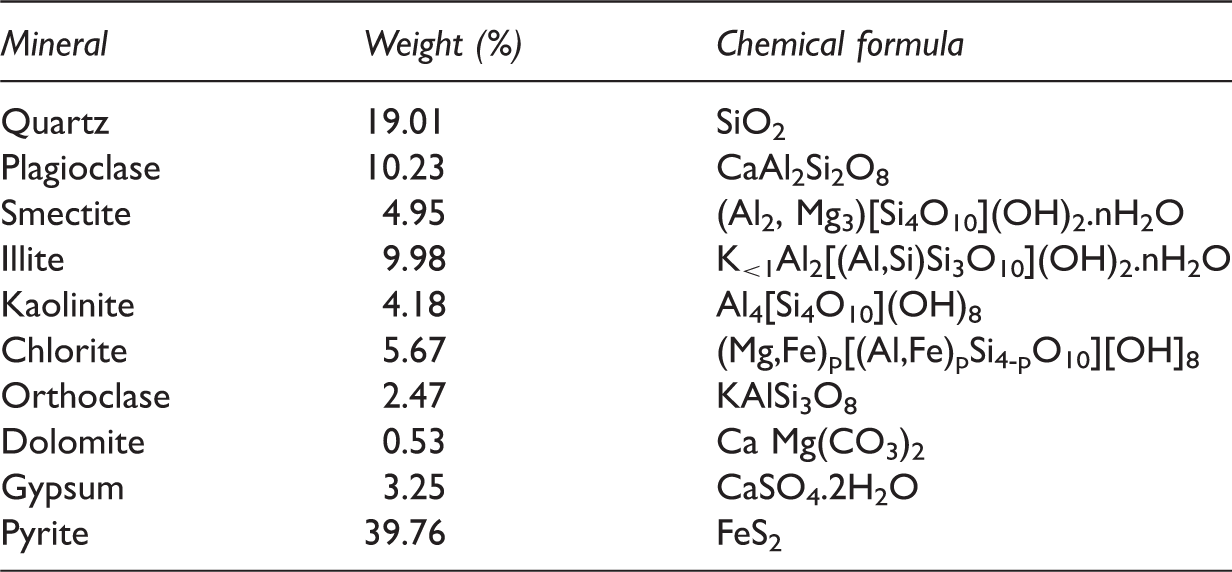
The C7 oil shale sample was organic-rich, with a TOC value of 23.9%. The Rock-Eval pyrolysis presented a Tmax of 442℃ and the productivity index (PI) of 0.09, which indicated that the oil shale sample was in immature to early mature stage according to Peters (1986). S1 values (free hydrocarbons), S2 values (pyrolysed hydrocarbons) and S3 values (CO2) were 6.52 mg/g, 104.64 mg/g and 0.48 mg/g, respectively. According to the above parameters of Rock-Eval pyrolysis, the hydrocarbon index (HI) and oxygen index (OI) can be obtained which were 437.82 mg/g TOC and 2.09 mg/g TOC, respectively. Based on the values of HI and OI and the ratio of S2/S3 (218), the kerogen of the C7 oil shale was type I.
The mineralogical data of the oil shale sample were analyzed by X-ray diffraction Spectrometer (Rigaku D/Max-ш B X-ray diffractometer) using Cu Kα radiation at the voltage of 35 kV and current of 25 mA. Scan angle was from 2° to 60° at a rate of 2°/min with a step interval of 0.02°. A Vinci Rock-Eval 6 Turbo device was used to obtain the organic geochemistry parameters. The analysis procedures were described by Behar et al. (2001).
TGA and Py-GC-MS
Thermogravimetric analysis experiments were performed by Diamond TG/DTA analyzer whose temperature precision was ± 0.5℃ and microbalance sensitivity was less than ± 0.1 µg. In order to calibrate the sample results, blank experiments need to be conducted to obtain the baselines without samples. During the detection, approximately 10–20 mg of each crushed oil shale sample was heated in TG/DTA equipment from 30℃ to 1150℃ under an inert atmosphere of high purity nitrogen with a flow rate of 100 ml/min, at different heating rate (5℃/min, 10℃/min and 20℃/min, respectively). Upon analysis, the differential thermogravimetric (DTG) curves were taken by numerical derivation of the TG curves.
Pyrolysis-Gas chromatograph-Mass spectrometer, composed of a micro-furnace based double-shot pyrolyzer (EGA/PY3030D, Frontier laboratories Ltd.) and an Agilent 7890B-7000B GC/MS apparatus, was used to determine the chemical composition of the oil shale during the pyrolysis. The pyrolyzer was linked to the GC injector with an ITF needle (deactivated) at 250℃. The pyrolyzer was made up of three parts: a sampler, a ceramic heater tube that can be preheated to the pyrolysis temperature and then transfer heat to the sample and an interface connecting ITF needle and ceramic heater tube. The GC–MS conditions were the same for all the samples. The GC injector temperature was set at 250℃ with a split ratio of 10:1. The GC oven temperature was initially increased from 40℃ to 100℃ at 2℃/min, then ramped 3℃/min to 290℃ and held isothermally for 30 min. After each pyrolysis step analysis, a quick blank program was conducted to ensure that there was no carryover of components within the capillary separation column, a fused silica capillary column HP 5MS (30 m×0.25 mm i.d., 0.25 µm film thickness). The MS instrument was on electron impact (EI) mode (ionizing energy at 70 eV) in full scan mode (m/z 10–650). All mass spectra were compared to the NIST spectral library.
The samples (2–3 mg) were placed into a deactivated stainless steel sample cup suspended in the top of the ceramic heater tube. The sample cup was not manually pushed into the pyrolysis tube, until the interface and initial pyrolysis temperature reached a desired point and held steady. After the pyrolysates were swept into the GC injector with He as carrier gas (1.2 ml/min) for GC–MS system analyzing, the sample cup was pulled out of the quartz tube to await pyrolysis at the next step to avoid further degradation of samples while the GC–MS analysis is underway. The oil shale sample was subjected to four consecutive pyrolysis steps. The first step was heated at temperature in the range 100–387℃ at a rate of 20℃/min and hold at 387℃ for 10 minutes followed by analysis of composition of pyrolysates. For other steps, the measurement methods and conditions were similar to the first step but the heating temperature ranges were 387–472℃, 472–536℃, 536–700℃, respectively.
Results and discussion
Pyrolysis characteristic
Figure 1 shows the weight loss (TG) curves and differential weight loss (DTG) curves of C7 oil shale particle sample at various heating rates to a final pyrolysis temperature of 1150℃. According to the TG and DTG data, the decomposition temperature scale of C7 oil shale was divided into four sections, A1 (100–387℃) , A2 (387–472℃), A3 (472–536℃) and A4 (536–700℃). Based on the Py-GC-MS experiments, the compositional information of the pyrolysates of each temperature section can be discerned, which could be helpful to confirm the decomposition mechanism of oil shale sample.
TG/ DTG curves at different heating rates of C7 oil shale. (1) 5℃/min, (2) 10℃/min and (3) 20℃/min.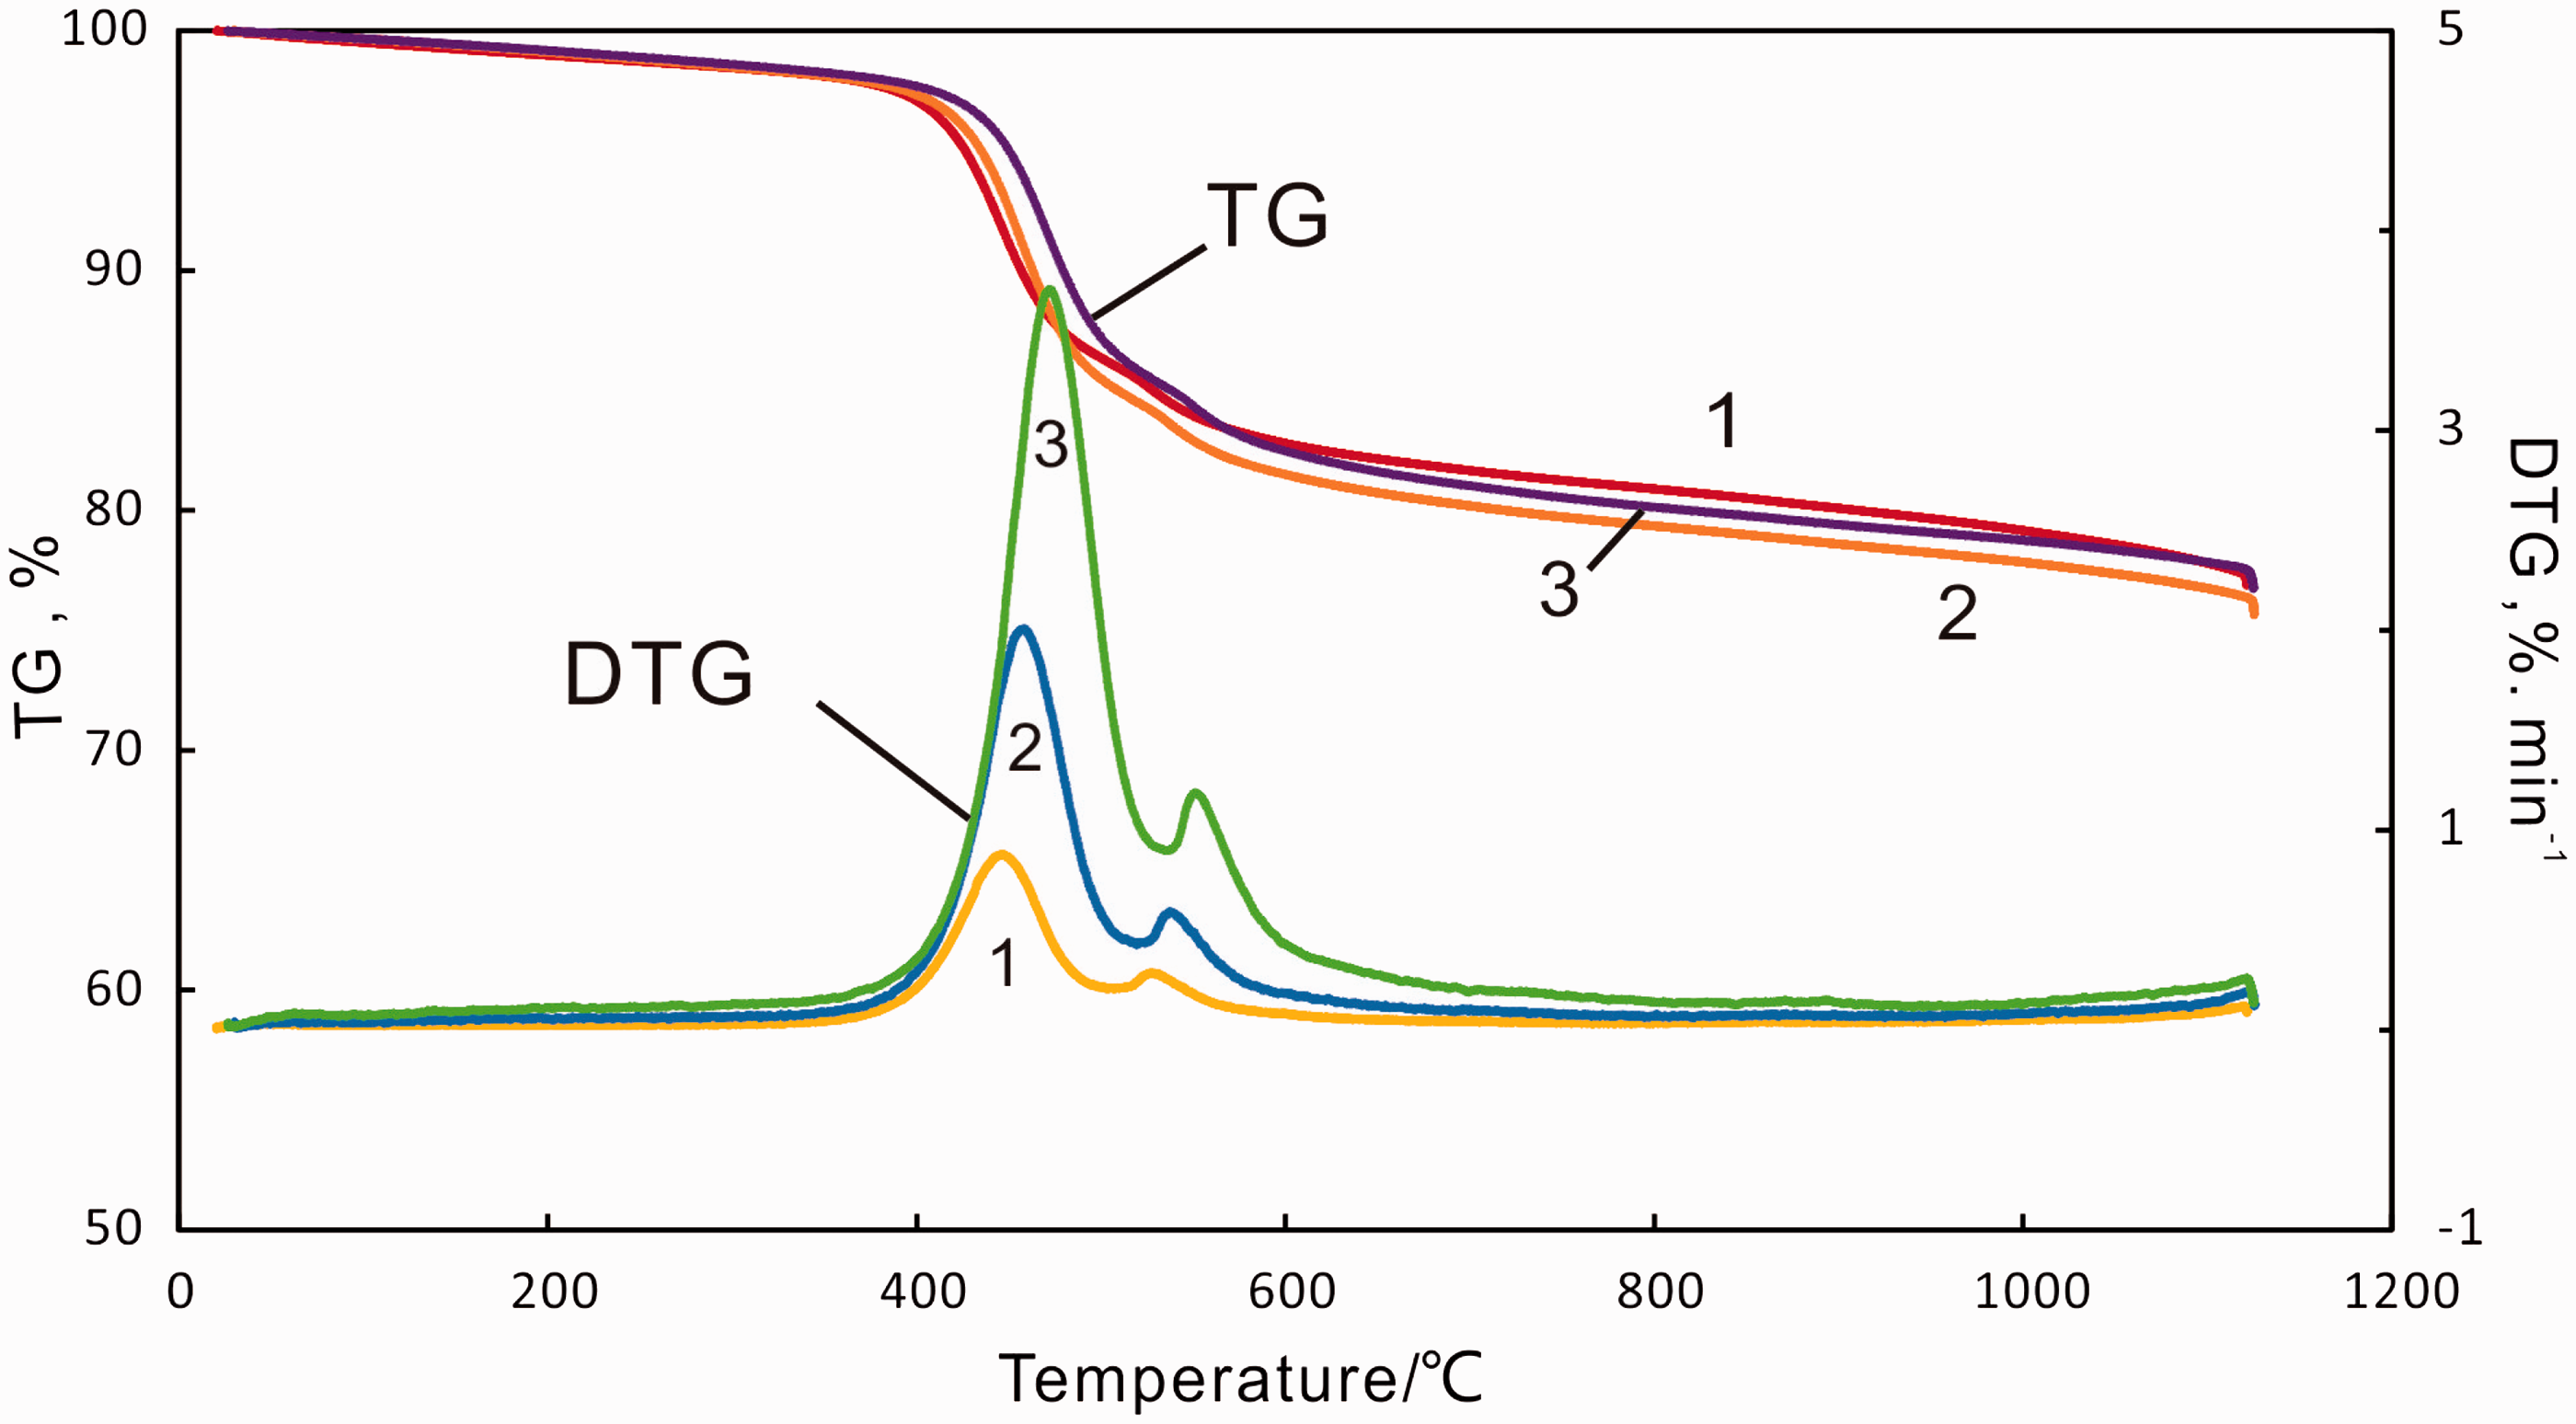
There was a small weight loss in section A1, indicating that moisture existed in C7 oil shale sample which can evaporate at temperatures below 160–170℃. Some clay minerals may lose their interlayer water from 200℃ to 500℃ depending on the crystal structure. For example, kaolinite and illite start to release its bound water at about 430℃ and 250℃ (Al-Harahsheh et al., 2009; Grim and Bradley, 1940). Some clay minerals in C7 oil shale sample such as illite may remove its interlayer water in section A1. The slight weight loss may also be attributed to the release of free hydrocarbon as shown in Figure 2 and volatiles which were due to softening and molecular rearrangement in the kerogen prior to its decomposition to pyrolytic bitumen (Burnham et al., 1983) in the temperature range of 100–350℃.
TICs of pyrolysates of section A1 (100–387℃); Cn stands for alkane.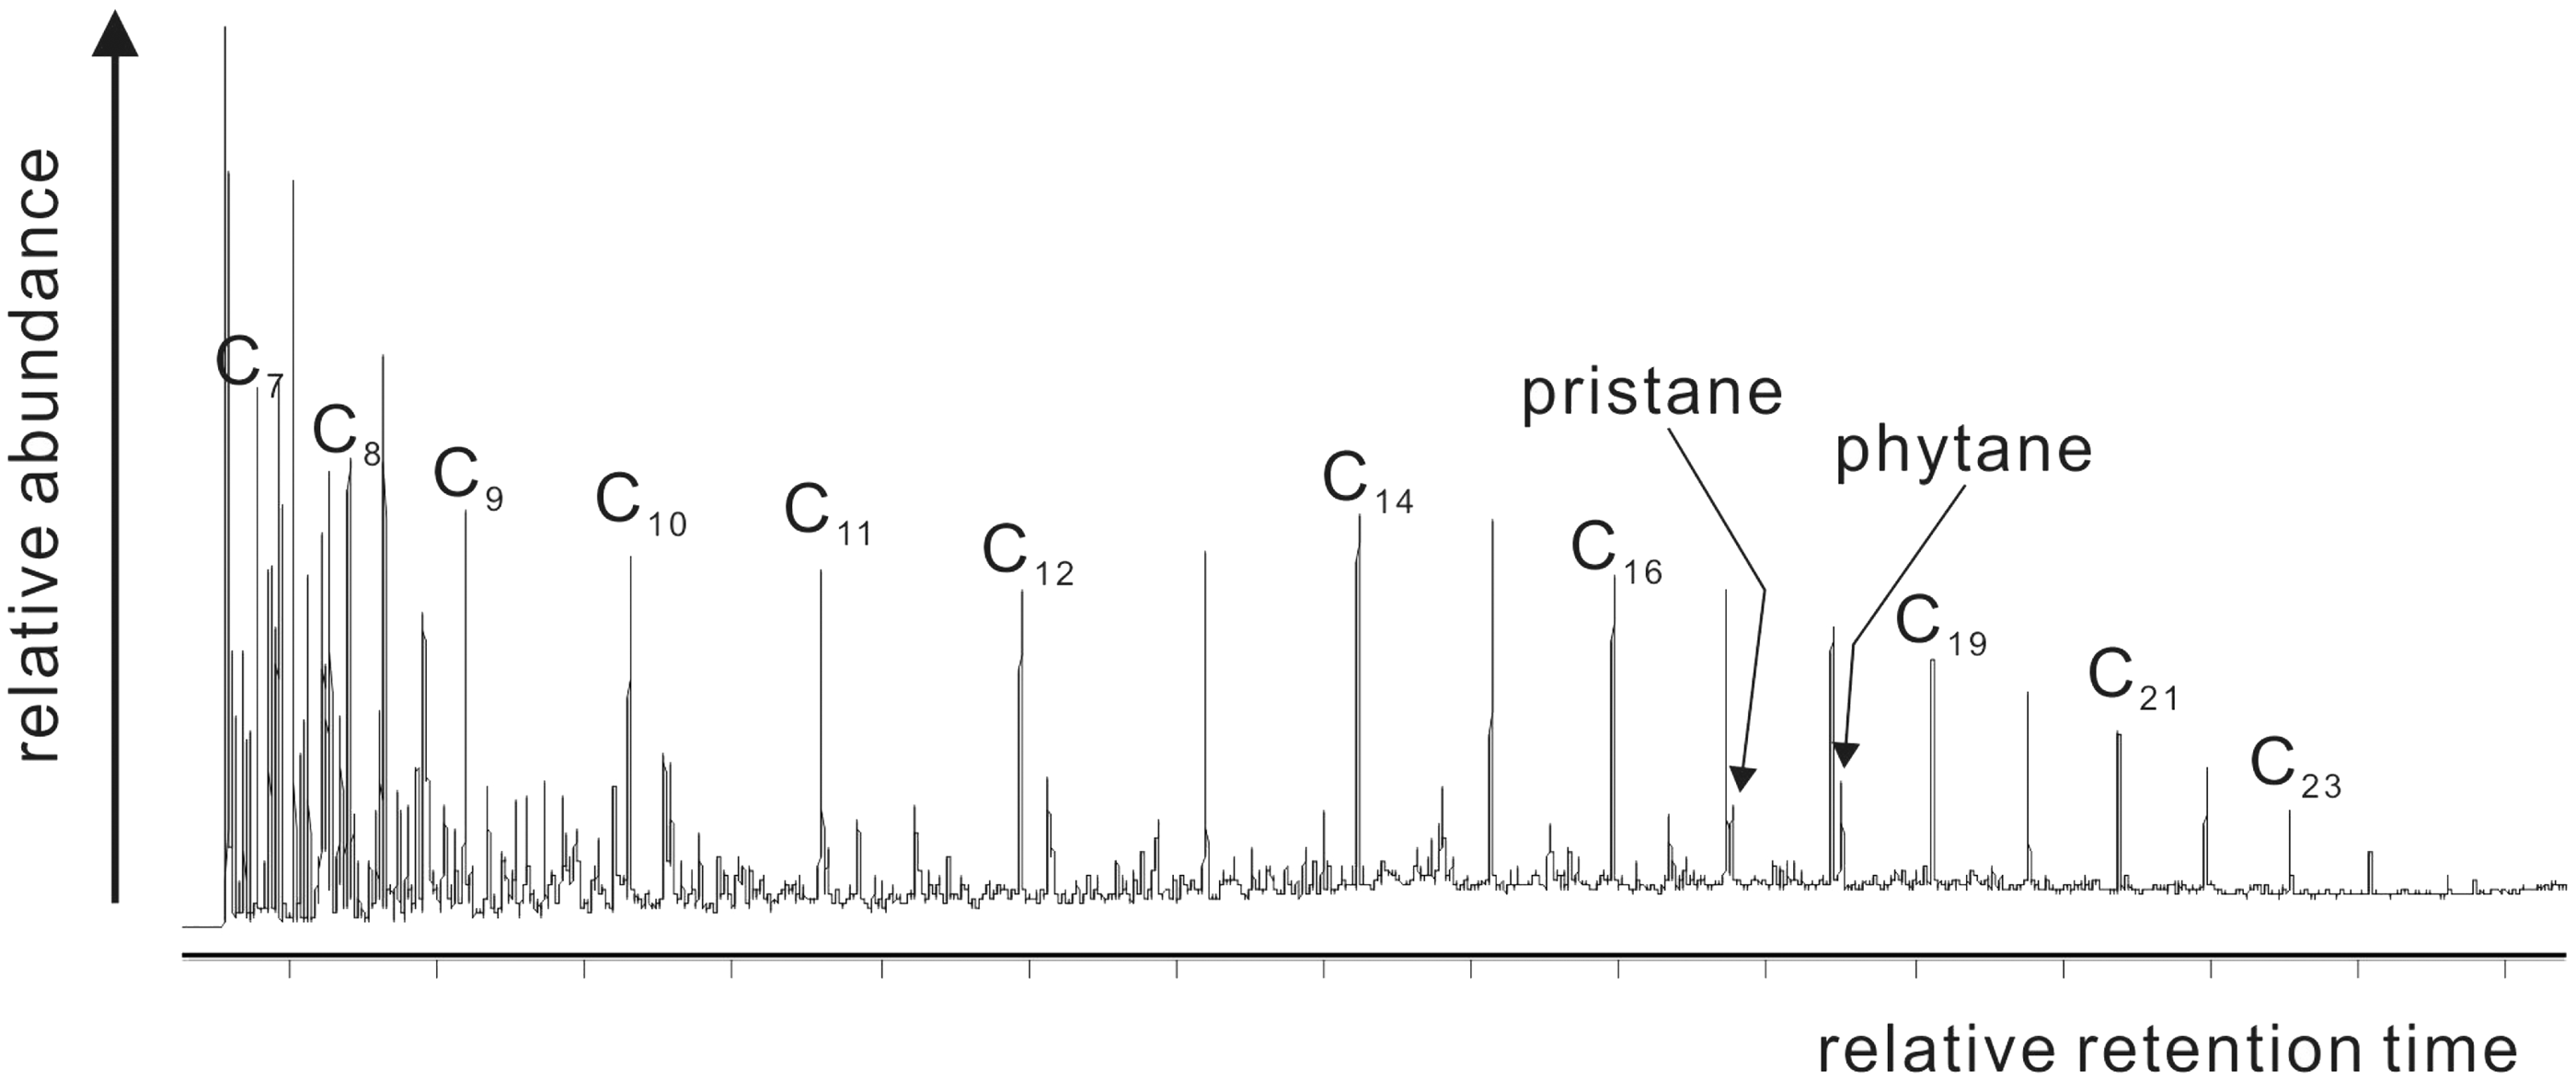
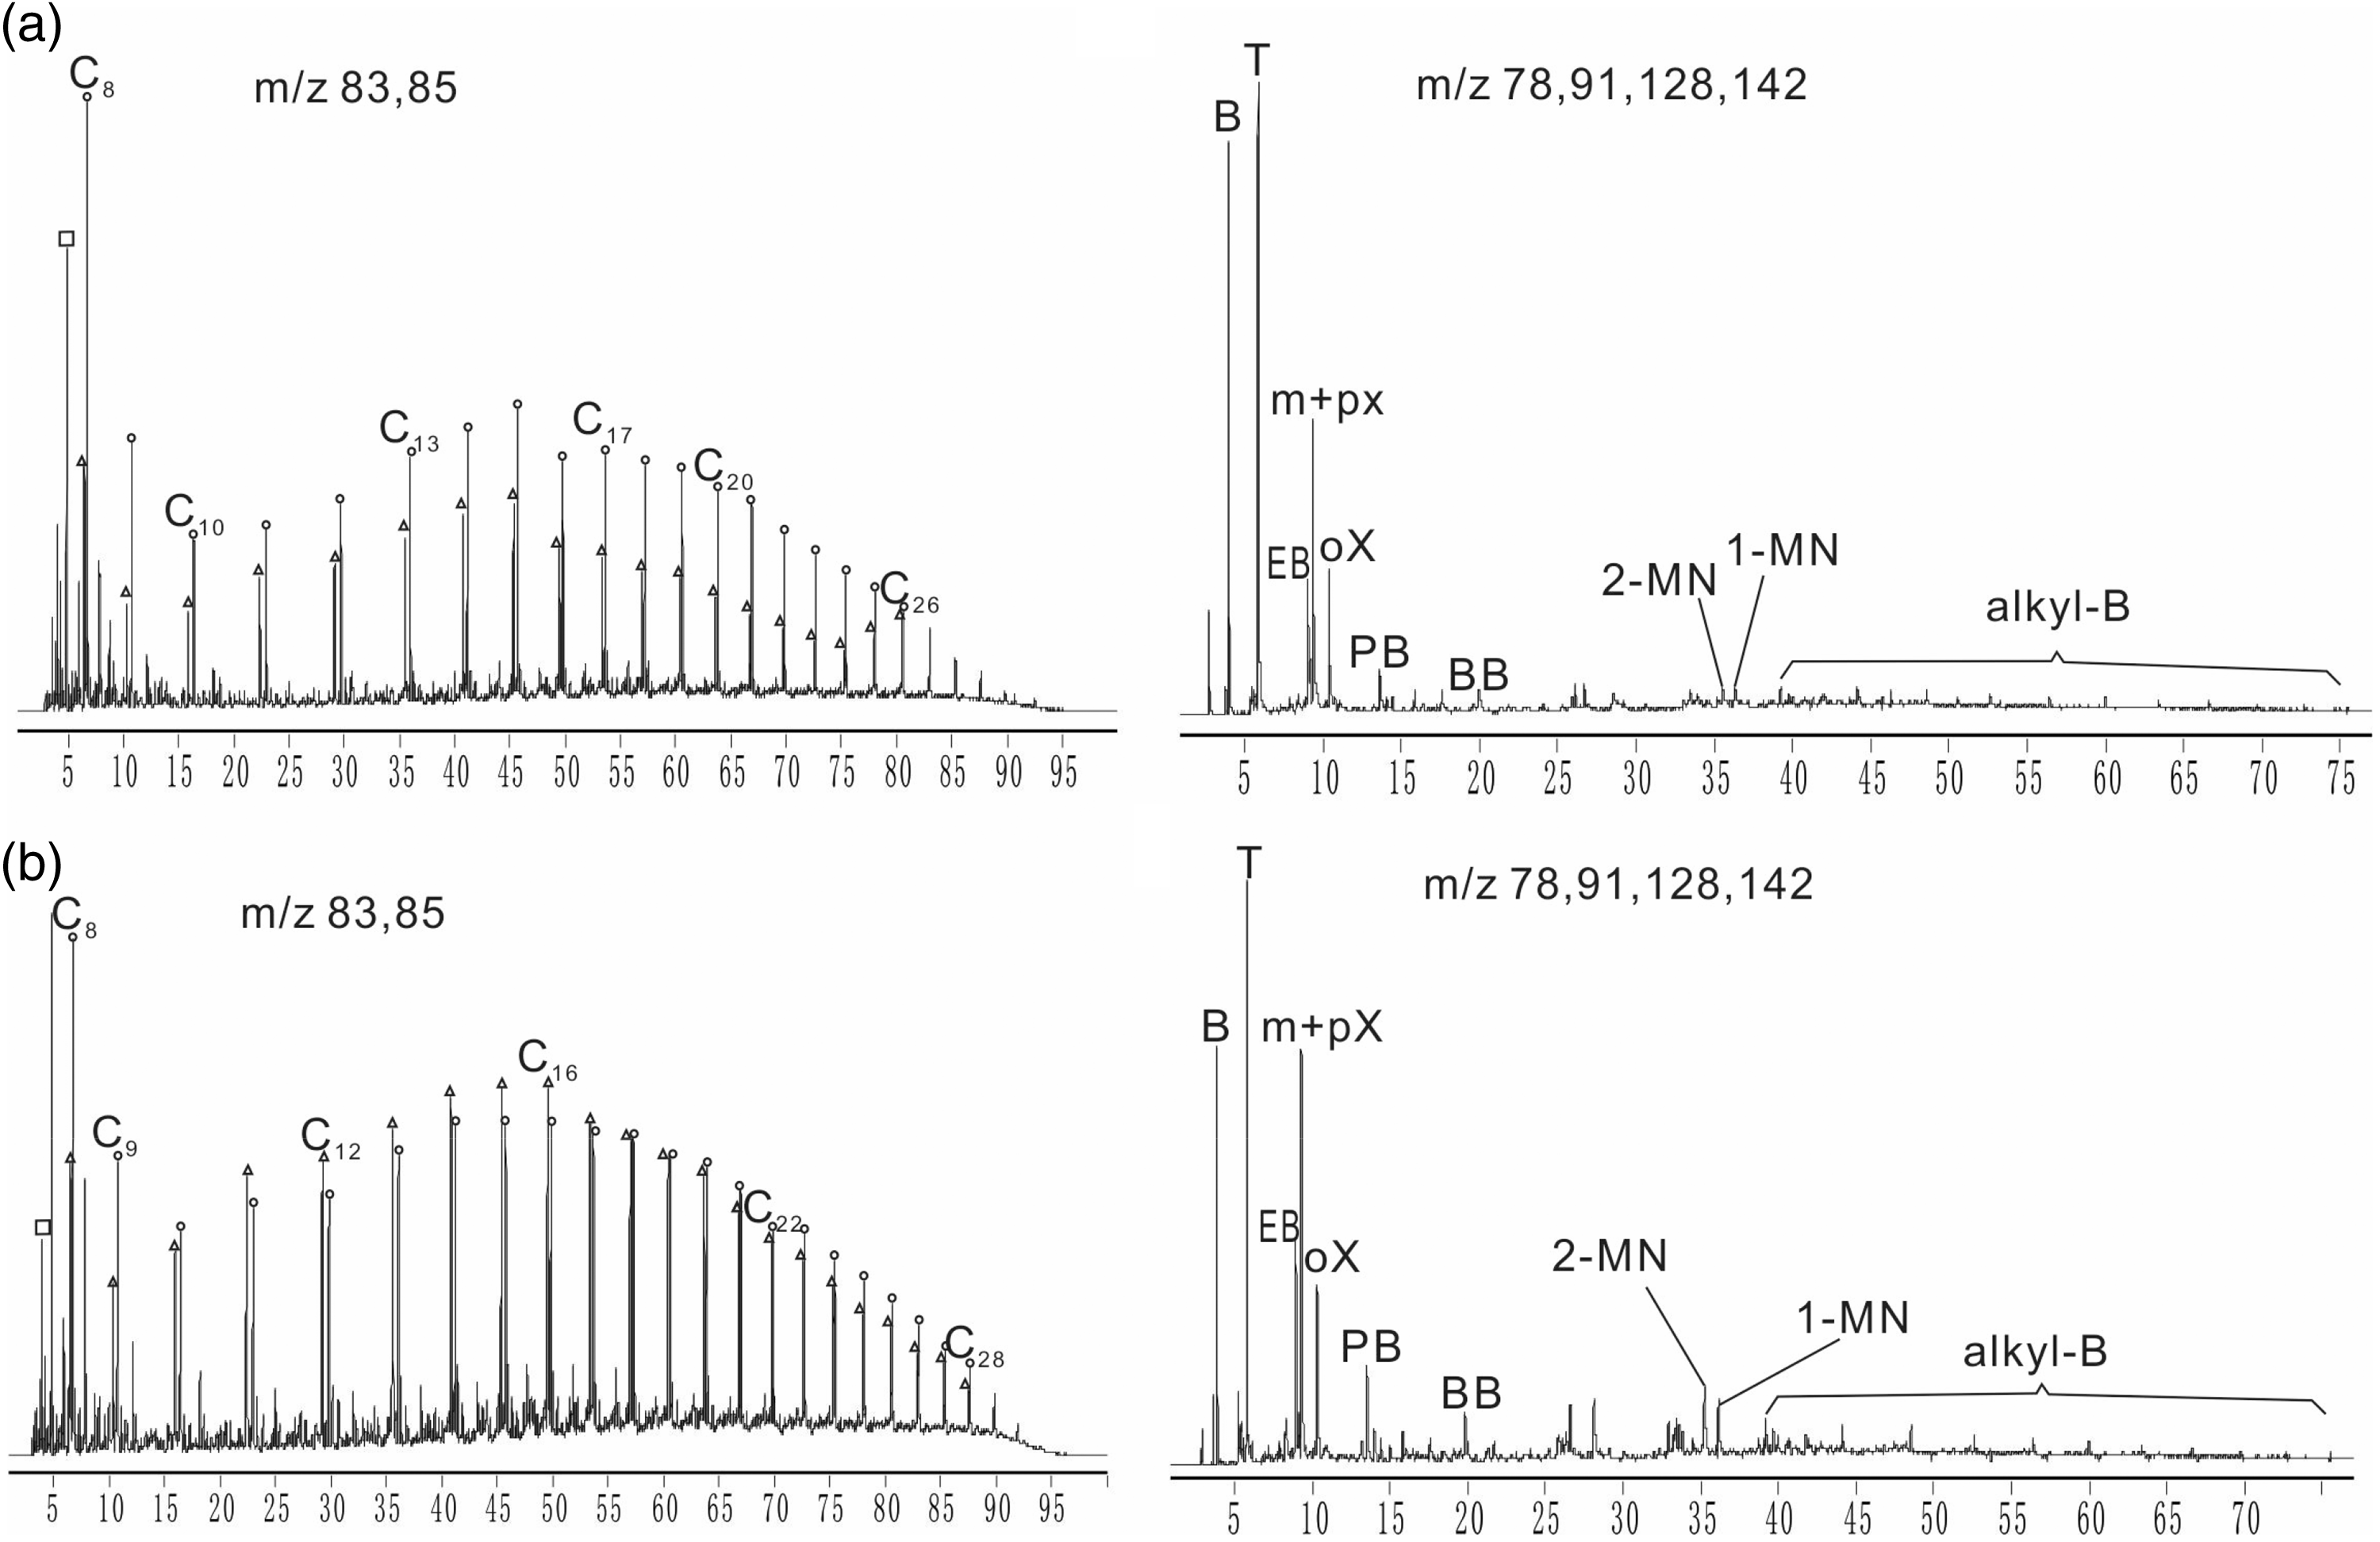
The main mass loss occurring in the temperature range of about 367–521℃ (average temperature) was due to pyrolysis of bitumen and kerogen present in C7 oil shale. The compositional information of products in section A2 and section A3 is shown in Figure 3. Hydrocarbon pyrolysates of both sections showed a dominant homologous distribution. N-alkane/n-alkene doublets were from C8 extending to beyond C30 and the relative abundance of aliphatic hydrocarbons had the similar trend with carbon number increased in the pyrolysates of both sections. Relatively low content of aromatic hydrocarbons was identified and it showed the similar distributions in pyrolysates of section A2 and A3, and the dominant components were benzene, toluene and ethylbenzene. Methyl naphthalenes were minor compounds and higher polycyclic aromatic hydrocarbons were negligible. The compositional information indicated that there was no difference between section A2 and A3 which meant that temperature ranges of section A2 and A3 were the main stage of shale oil produced. A single major peak of DTG curves in the temperature range of 367–521℃ indicated that C7 oil shale exhibited an one-step thermal process. The similar decomposition behavior has been reported by other researchers for Huadian oil shales, Jimsar oil shale and Maoming oil shales (Li and Yue, 2003a, 2003b; Pan et al., 2015). However, a two-step thermal decomposition has also been observed for Turkish oil shale (Dogan and Uysal, 1996) and UK oil shale (Williams, 1985). Therefore, whether the decomposition was an one-step or two-step process, depended on the type of oil shale (Dogan and Uysal, 1996; Williams, 1985). Usually, decomposition of kerogen to oil, gas, and char products was a two-stage process. First, decomposition of kerogen to pyrolytic bitumen occurred and, second, decomposition of bitumen to final products took place (Braun and Burnham, 1986; Koseoglu and Phillips, 1988):
(1) kerogen → bitumen + oil + gas + residue (2) bitumen → oil+gas+residue
Combined m/z 83 + 85 and m/z 78 + 91 + 128 + 142 mass fragmentograms of pyrolysates in section A2 (a) and section A3 (b); squares: unresolved compounds, circles: n-alkanes, triangles: n-alkenes, Cn = alkane/ alkene doublets, B = benzene, T = toluene, EB = ethylbenzene, m + p + oX = m + para + ortho – xylene, PB = propyl benzene, BB = butylbenzene, MN = methyl naphthalene, alkyl- B = long chain alkyl benzenes.
In this work, an one-step decomposition for C7 oil shale sample was due to kerogen molecules rearrangement in the temperature range 100–350℃ where a large heat adsorption peak appeared (Figure 8), and then followed by decomposition of rearranged molecular of kerogen between 367℃ and 521℃. Although an one-step or two-step thermal decomposition process of oil shale could be shown by TG curves and DTG curves, the actual mechanism of oil shale decomposition is a much more complex reaction involving a series of parallel reactions (Williams, 1985).
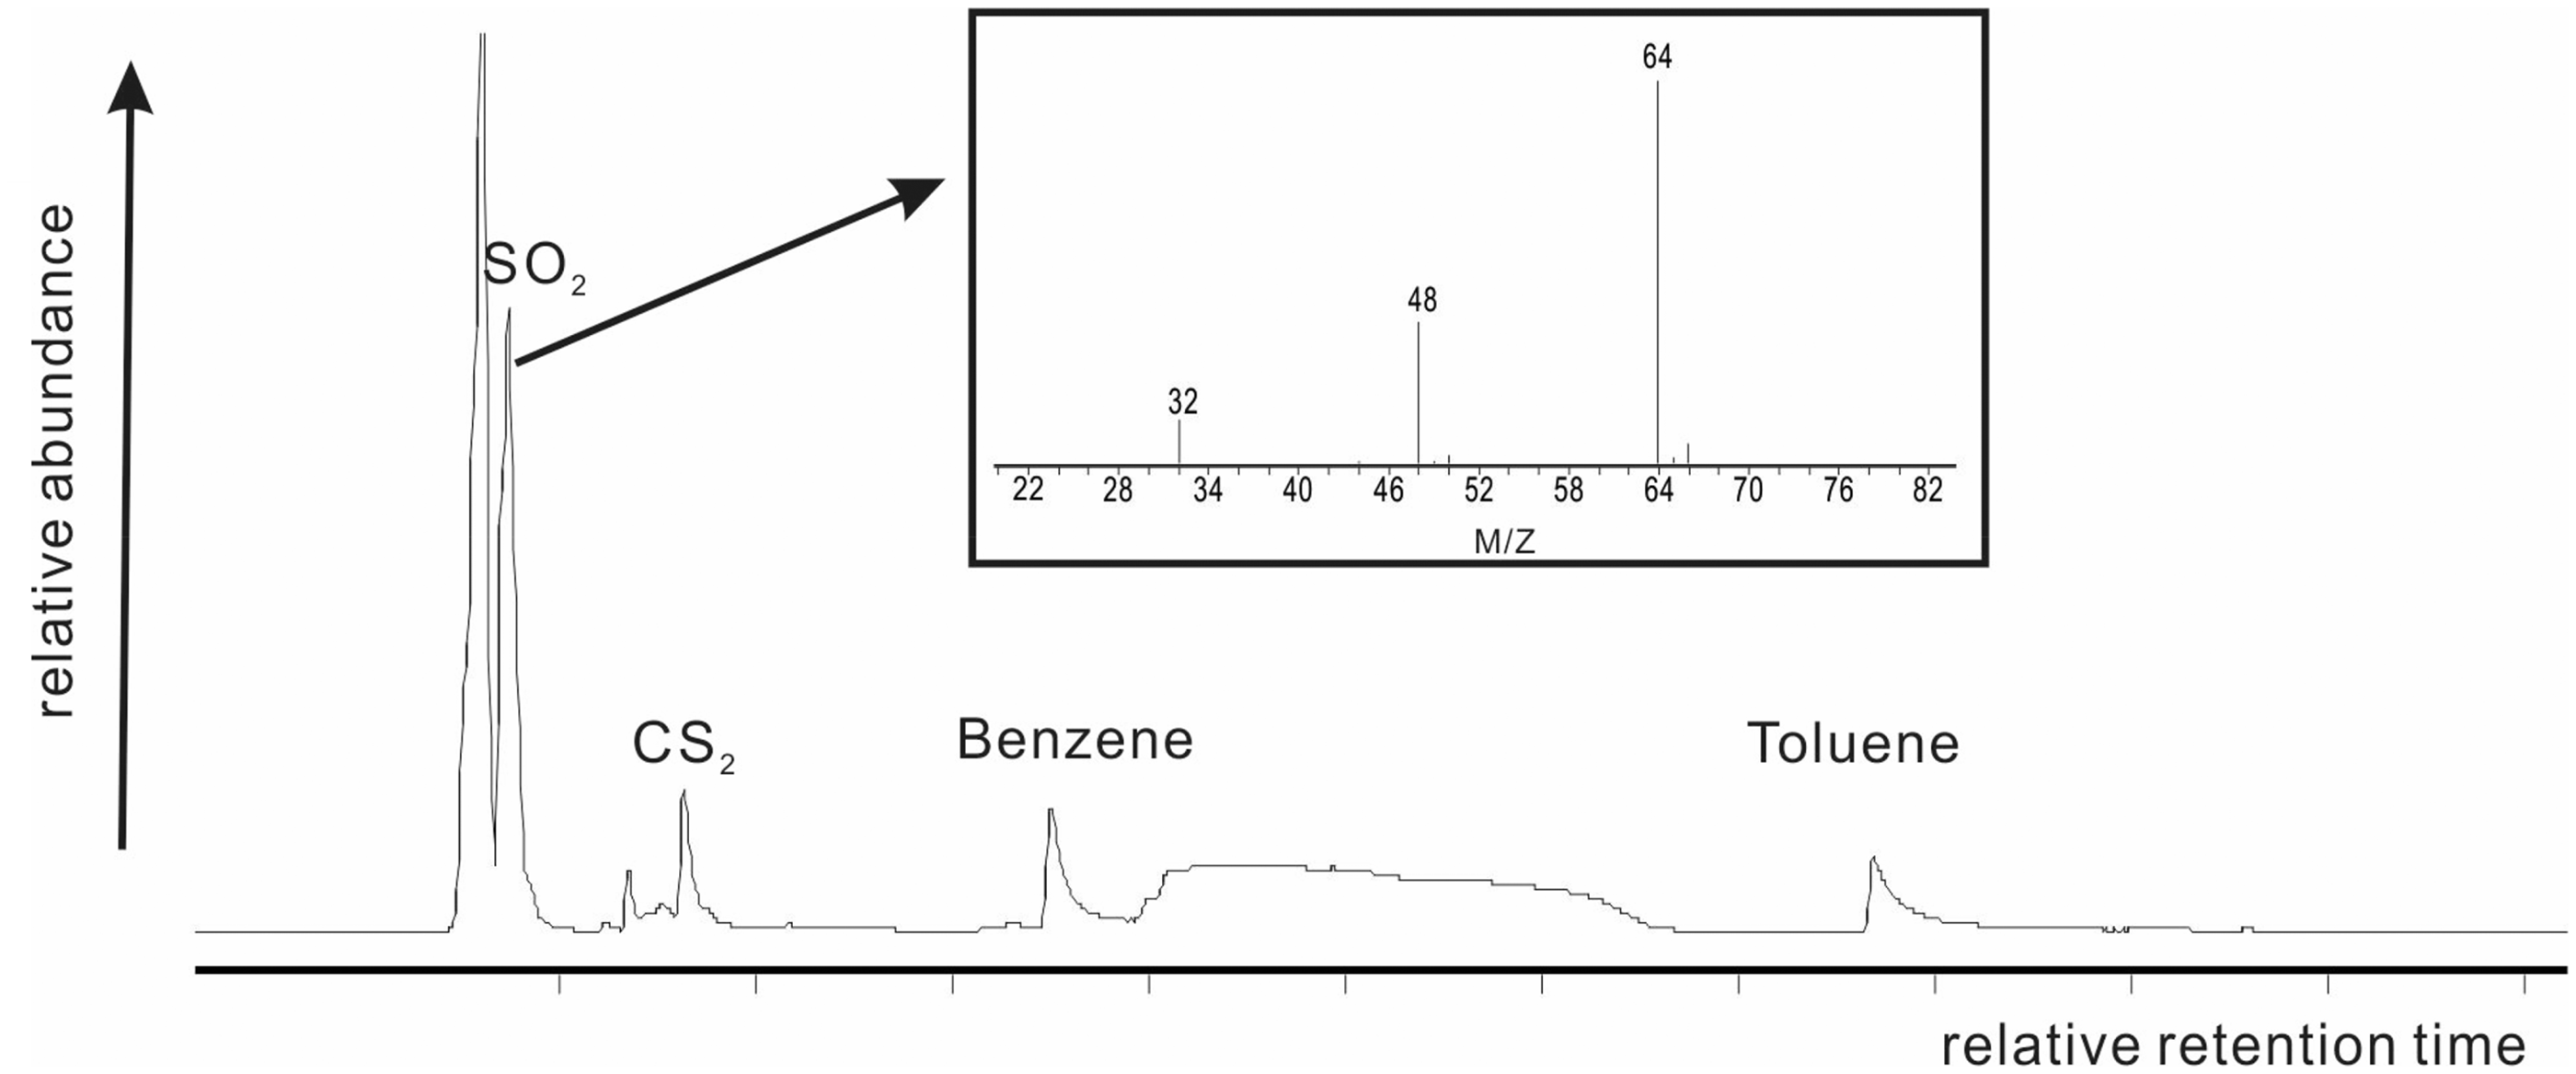
The weight loss occurred in temperature range of approximately 521–700℃ was about 7.0% accounting for a significant proportion in total value of thermal weight loss. In this temperature range (section A4), the pyrolysate compositions are shown in Figure 4. The sulfur compounds were identified and they showed a high proportion of sulfur dioxide and carbon disulfide presumably from decomposition of the pyrite. Zhou and Luo (1983) thought that pyrite can be decomposed into sulfur compounds around 500℃ under a nitrogen atmosphere. Pyrite in studied sample had the high content which was 39.76%. In combination with the above analysis, in the second DTG peak, section A4, the weight loss was attributed to decomposition of pyrite, and the rate of weight loss was distinctly lower than that in temperature range of section A2 and section A3. Also relatively low amounts of aromatic hydrocarbon compositions such as benzene and methylbenzene were detected in the pyrolysates of section A4 (Figure 4). The mechanism of aromatic formation in section A4 was similar that in section A4 and dominated by the following reactions (Nazzal, 2000):
(1) Primary reaction of kerogen: kerogen → alkanes (C1-C4)gas + alkenes (C5-C18) ; (2) Alkenes (C5-C18) liquid → alkanes + alkenes (C4-C6); (3) Alkenes (C4-C6) + dialkenes → cyclic alkenes; Cyclic alkenes → simple aromatics. TICs of pyrolysates in section A4 (536–700℃) and mass spectrum of sulfur dioxide.
In higher temperature range about 700–1150℃, there were no remarkable changes in the TG and DTG curves, which was due to the absence of calcite and the lower content of dolomite in C7 oil shale sample, as the decomposition of carbonate minerals including calcite and dolomite mainly occurred above 700℃.
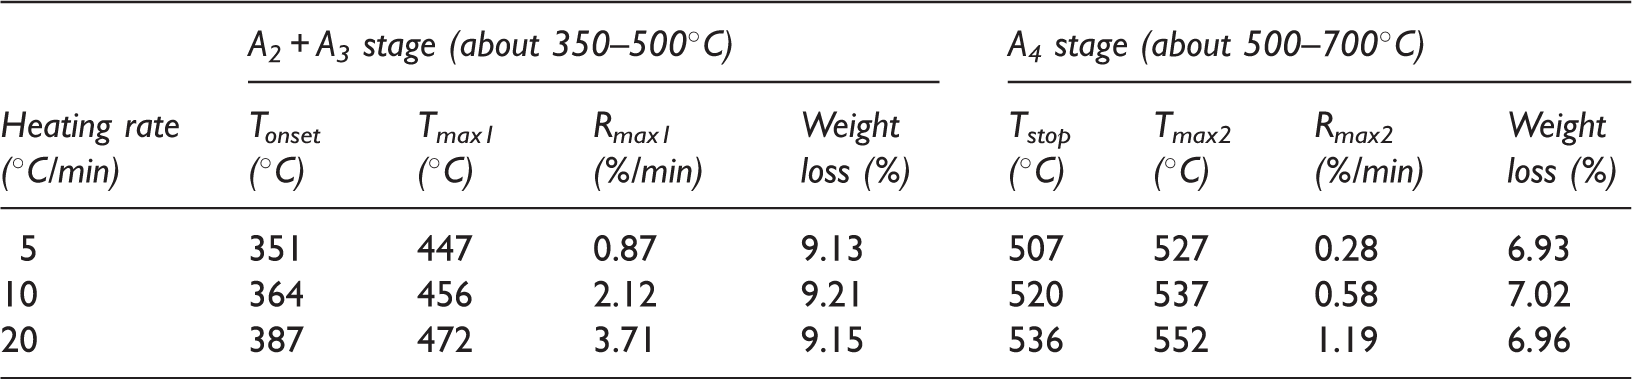
Table 2 shows the data of weight loss and DTG at the two stages in relation to heating rate. According to the pyrolysis behavior of C7 oil shale sample, we defined four temperature characteristics of decomposition: the onset temperature of decomposition (Tonset), the temperature where maximum rate of weight loss occurred (Tmax1), temperature of the end of decomposition of hydrocarbons (Tstop) and temperature of maximum decomposition of pyrite (Tmax2). Rmax1 and Rmax2 were defined as the maximum rates of decomposition of hydrocarbons and pyrite, respectively. Figure 5 defines the symbols used in Table 2, which showed that the weight loss at the two stages was almost kept constant with the increasing heating rate from 5 to 20℃/min. And the difference value between the highest weight loss and the lowest one was less than 0.1%. However, with an increase in the heating rate, Tonset, Tmax1, Tstop and Tmax2 were increased as well, demonstrating that the increasing heating rate produced a shift to higher temperatures for the pyrolysis of oil shale sample. The rate of decomposition also showed a lateral shift to higher temperatures with the heating rate increasing. The shift to higher temperatures of decomposition was caused by the difference in the rate of heat-transfer with the change in the heating rate and the kinetics of decomposition. Williams and Ahmad (1999) suggested that the presence of temperature gradients between the outside surface and the inside of the oil shale particle would result in oil and gas produced from the inside of the oil shale particle at lower temperatures taking place in the secondary reactions at a higher temperature regime. The temperature gradients would be more pronounced with the heating rate increasing, therefore resulting in the change of the pyrolysis parameters.
Symbols for Table 2. Comparison of thermogravimetric data in relation to heating rate.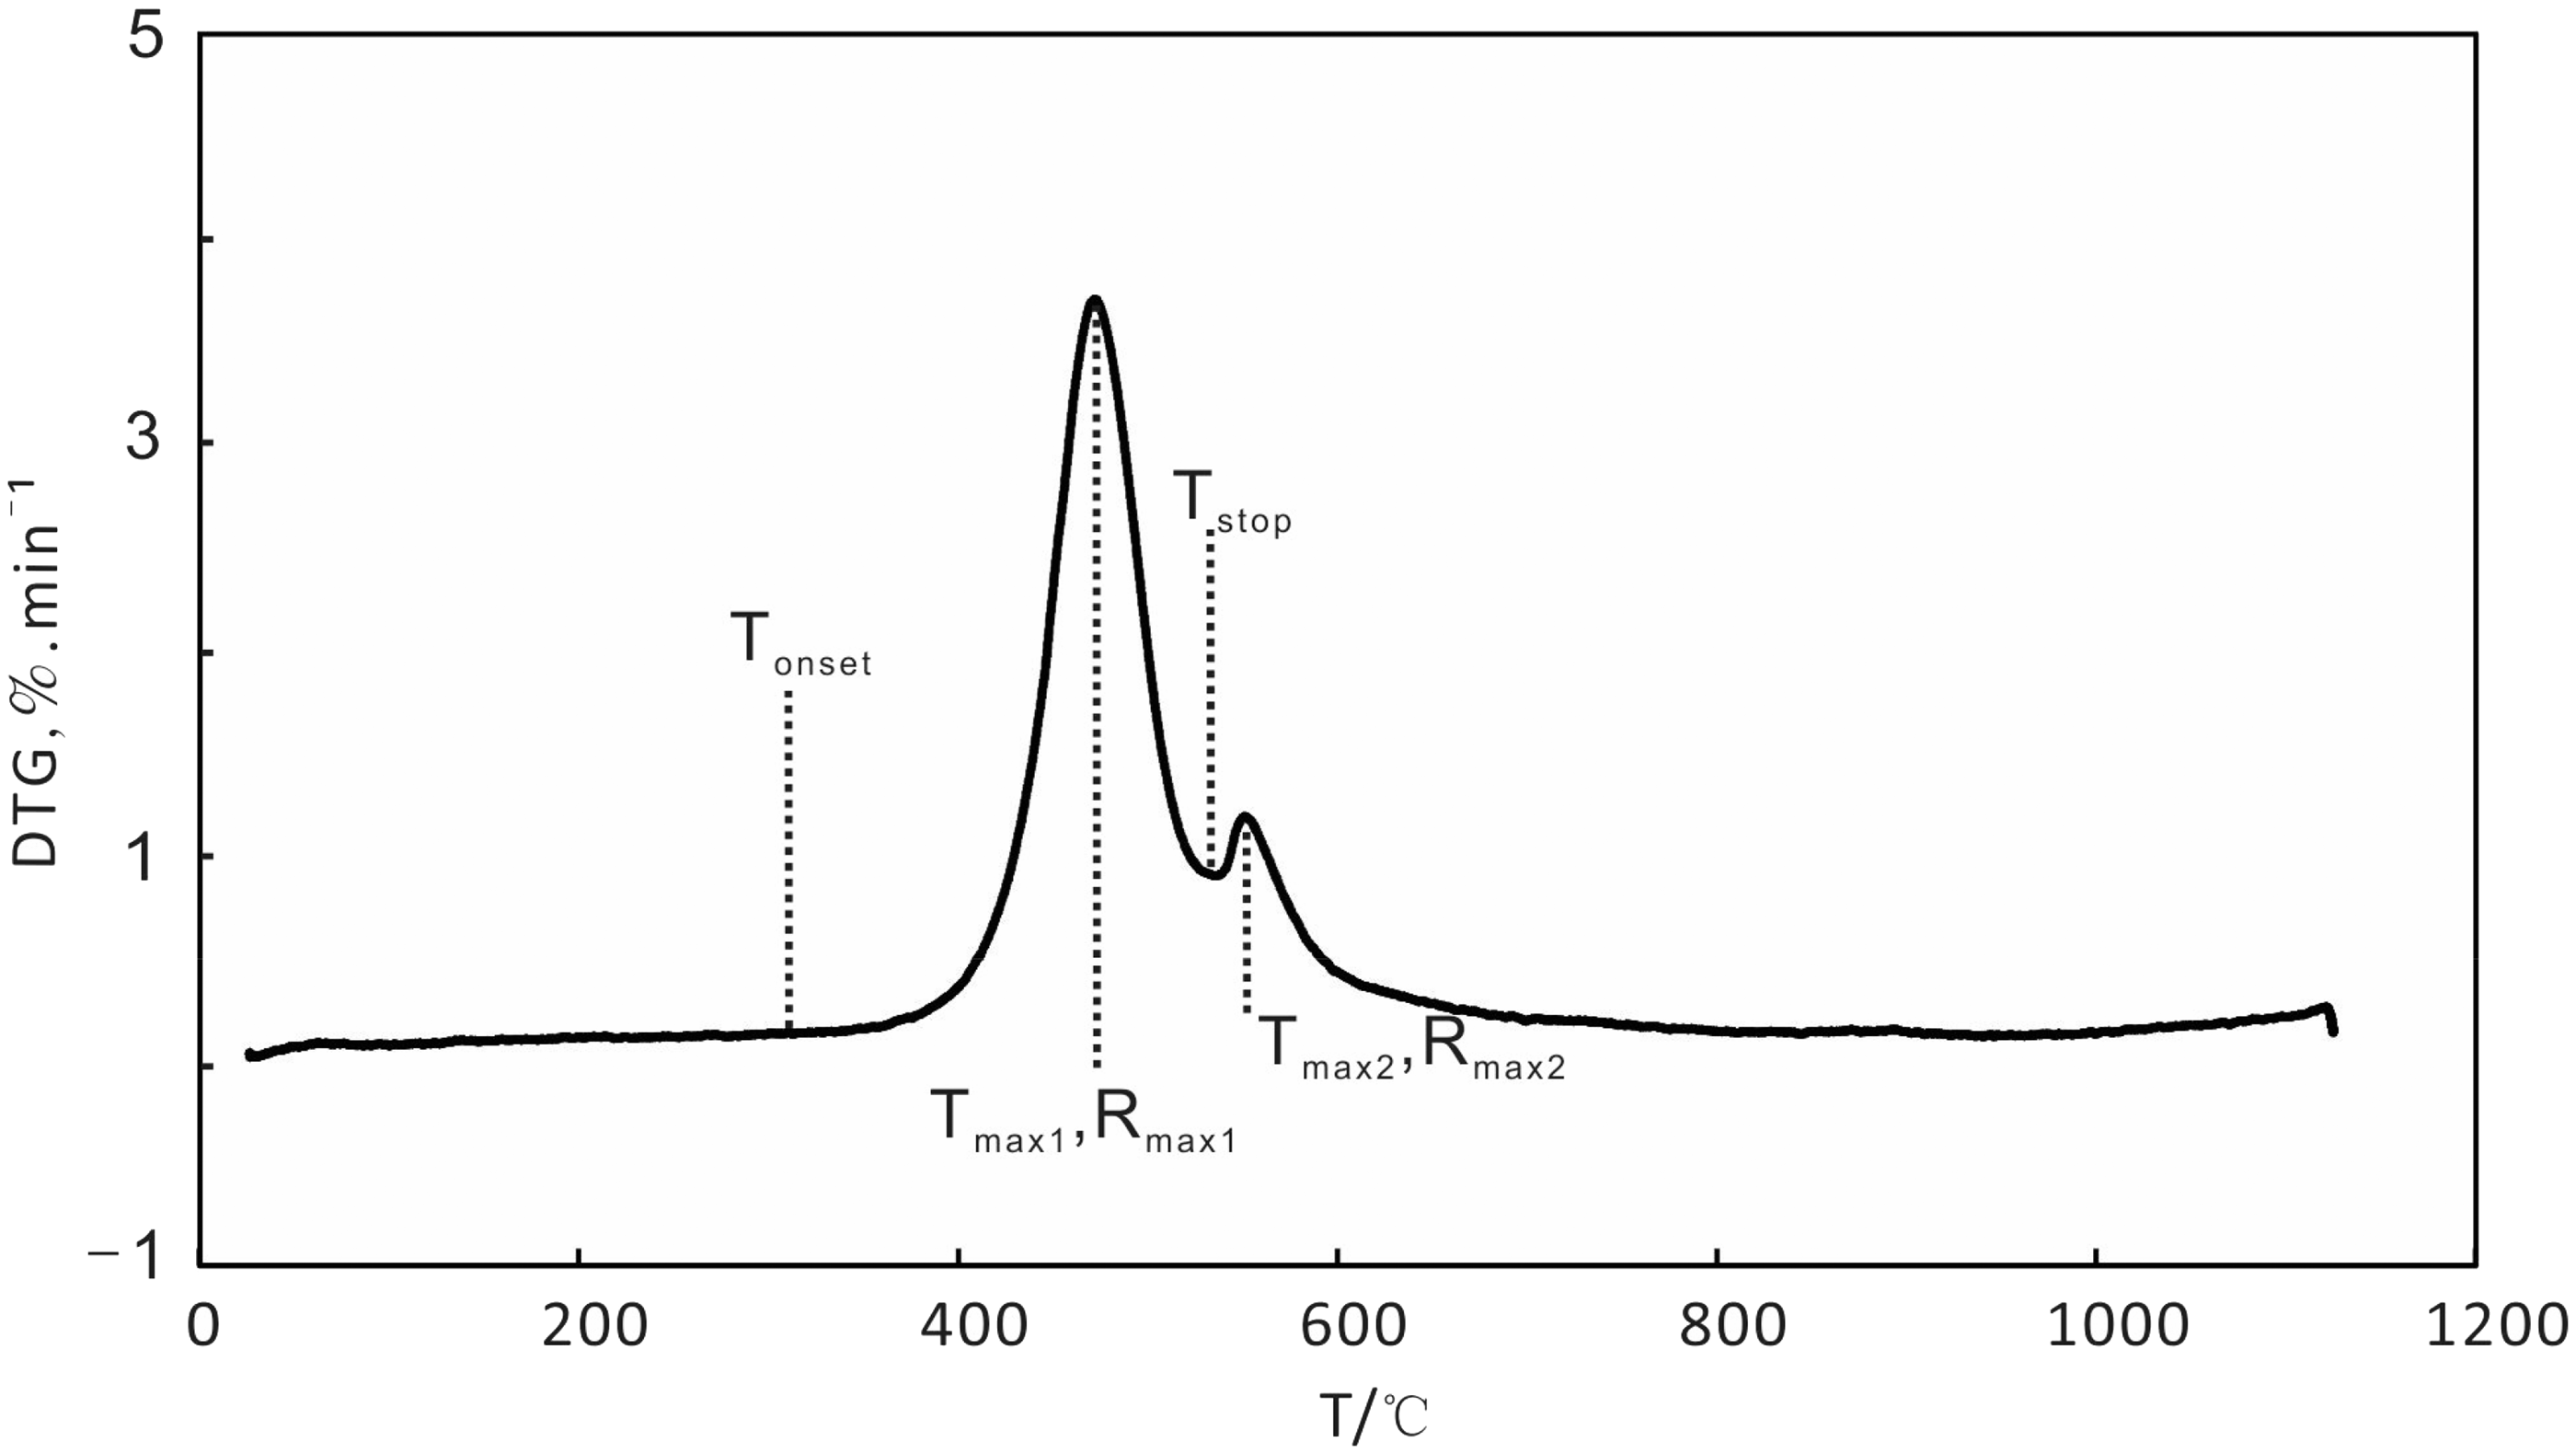
Kinetic analysis
The kinetic analysis of oil shale pyrolysis is an exceedingly complex task but a necessary process to understand the decomposition of oil shale to shale oil. In the present work, the Coats–Redfern integral method (Coats and Redfern, 1964) was adopted to calculate the activation energy (E) and pre-exponential factor (A).
In general, the rate of oil shale decomposition can be expressed as the following non-parametric kinetic equation:


By the approximate expression of Coats–Redfern integral method, equation (5) can be integrated as follows:

For most pyrolysis process, the term of
Figure 6 shows the curves of conversion–temperature and dx/dt (rate of decomposition)–temperature at different heating rates in the stage of hydrocarbon material decomposition. The conversion curves of C7 oil shale showed similar shape at different heating rates. The conversion increased with the increase of the temperature and a rapid increase occurred in the middle temperature range compared to a slow increase in the initial and final temperature range. We took heating rate of 10℃/min as an example, the conversion increased slowly at lower temperature (below 420℃), after that the conversion increased rapidly in the temperature range 420–500℃, at last conversion became flat beyond about 500℃. The conversion also decreased at the same temperature along with the increase of heating rate. The dx/dt curves also had similar shapes at different heating rate, but shifted to higher temperature with increasing heating rate.
Conversion–temperature curves and dx/dt-temperature curves for the decomposition of C7 oil shale at different heating rates (5, 10, 20℃/min).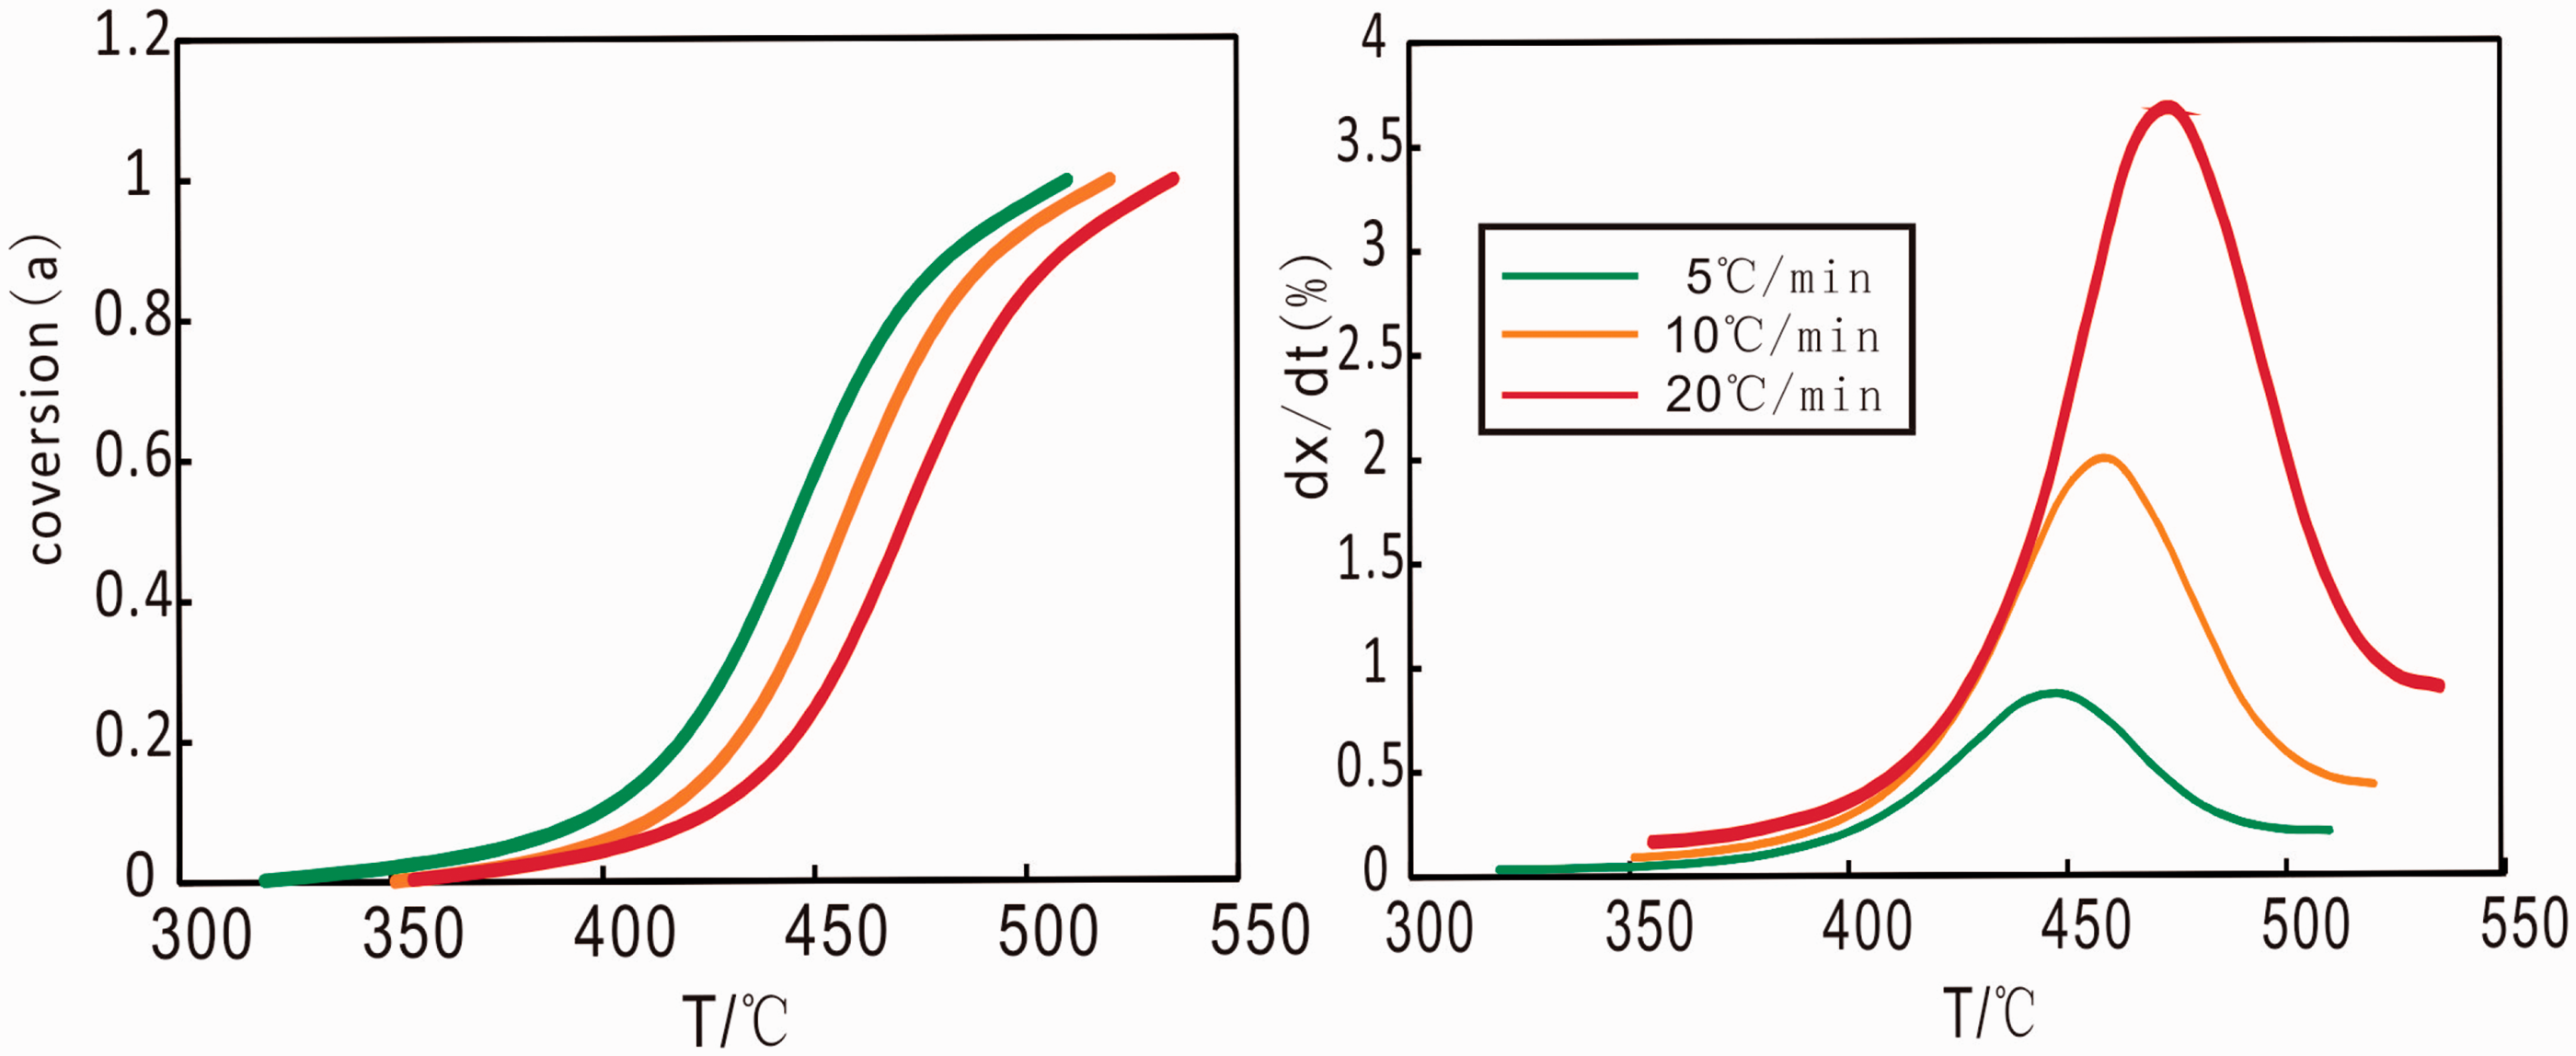
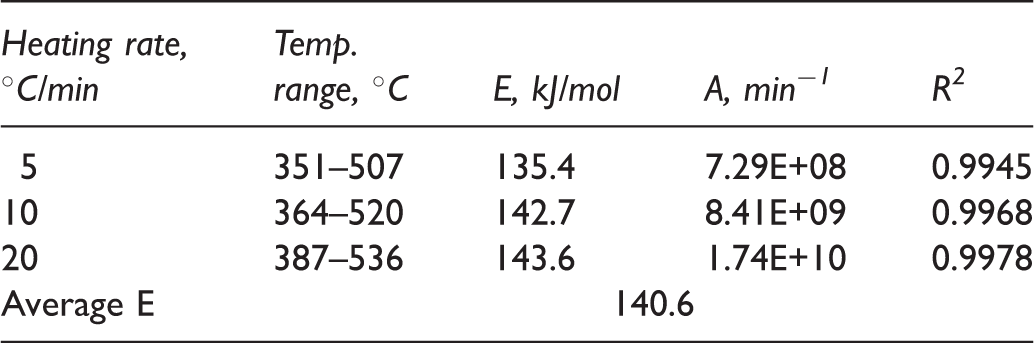
The plot of ln (−ln (1−α)/T2) vs. 1/T in relation to the heating rate is shown in Figure 7. It showed excellent correlation with R2 coefficient ranging from 0.9945 to 0.9978 over the temperature range used, which supported the assumption of first-order kinetics mentioned above. The kinetic parameters obtained from the plot of the main pyrolysis of C7 oil shale are summarized in Table 3. The activation energy increased from 135.4 kJ/mol to 143.6 kJ/mol as the heating rate increased from 5 to 20℃/min, which indicated that the activation energy of C7 oil shale depended on the heating rate. The characteristic of increasing activation energy with the increase of heating rate was in agreement with those reported by Skala et al. (1987) and Kok (2007). The mechanism was not yet well understood, but Vamvuka et al. (2003) thought this could be in relation to the combined effects of the heat transfer at the different heating rate and kinetics of kerogen reactions, resulting in cracking of heavy molecular weight hydrocarbons to smaller fractions characterized by high activation energy. The values of the pre-exponential factors also depended on the heating rate which increased from 7.29 × 10⁸/min at 5℃/min to 1.74 × 10¹⁰/min at 20℃/min (Table 3).
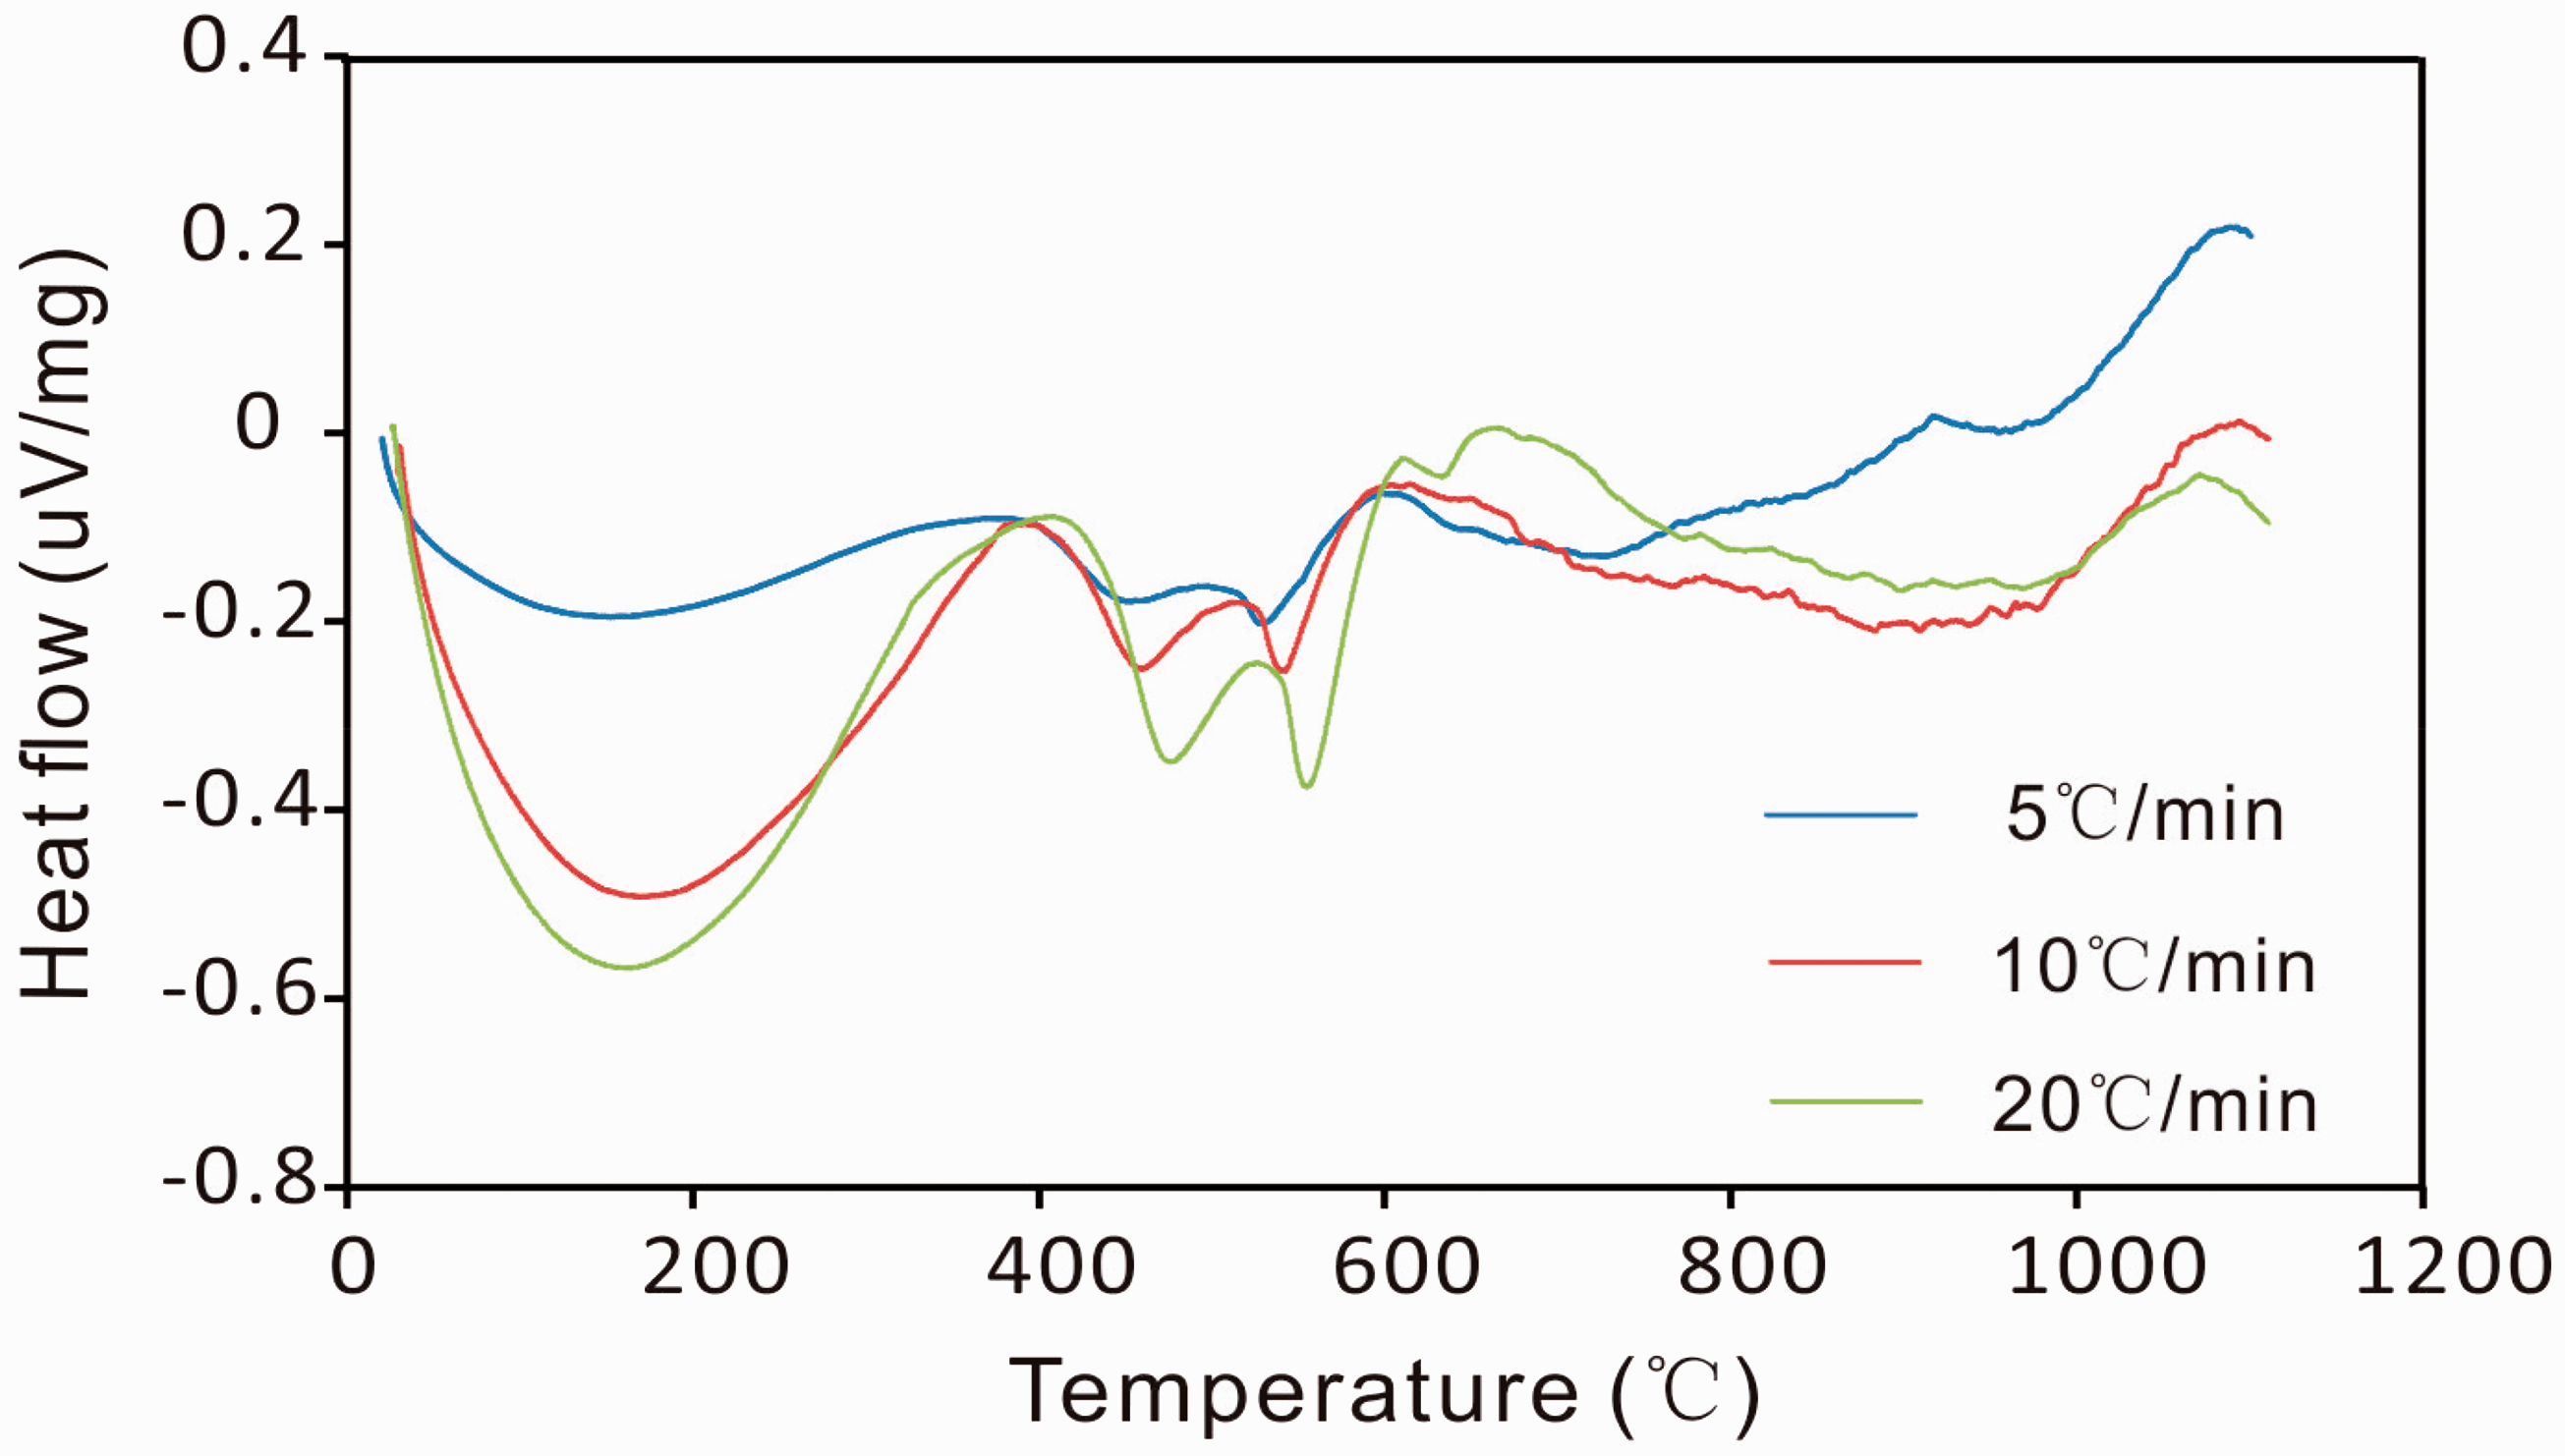
The plot for the main pyrolysis region of the C7 oil shale pyrolysis. Kinetic parameters of C7 oil shale at different heating rates. DTA curves of pyrolysis process of C7 oil shale for different heating rates.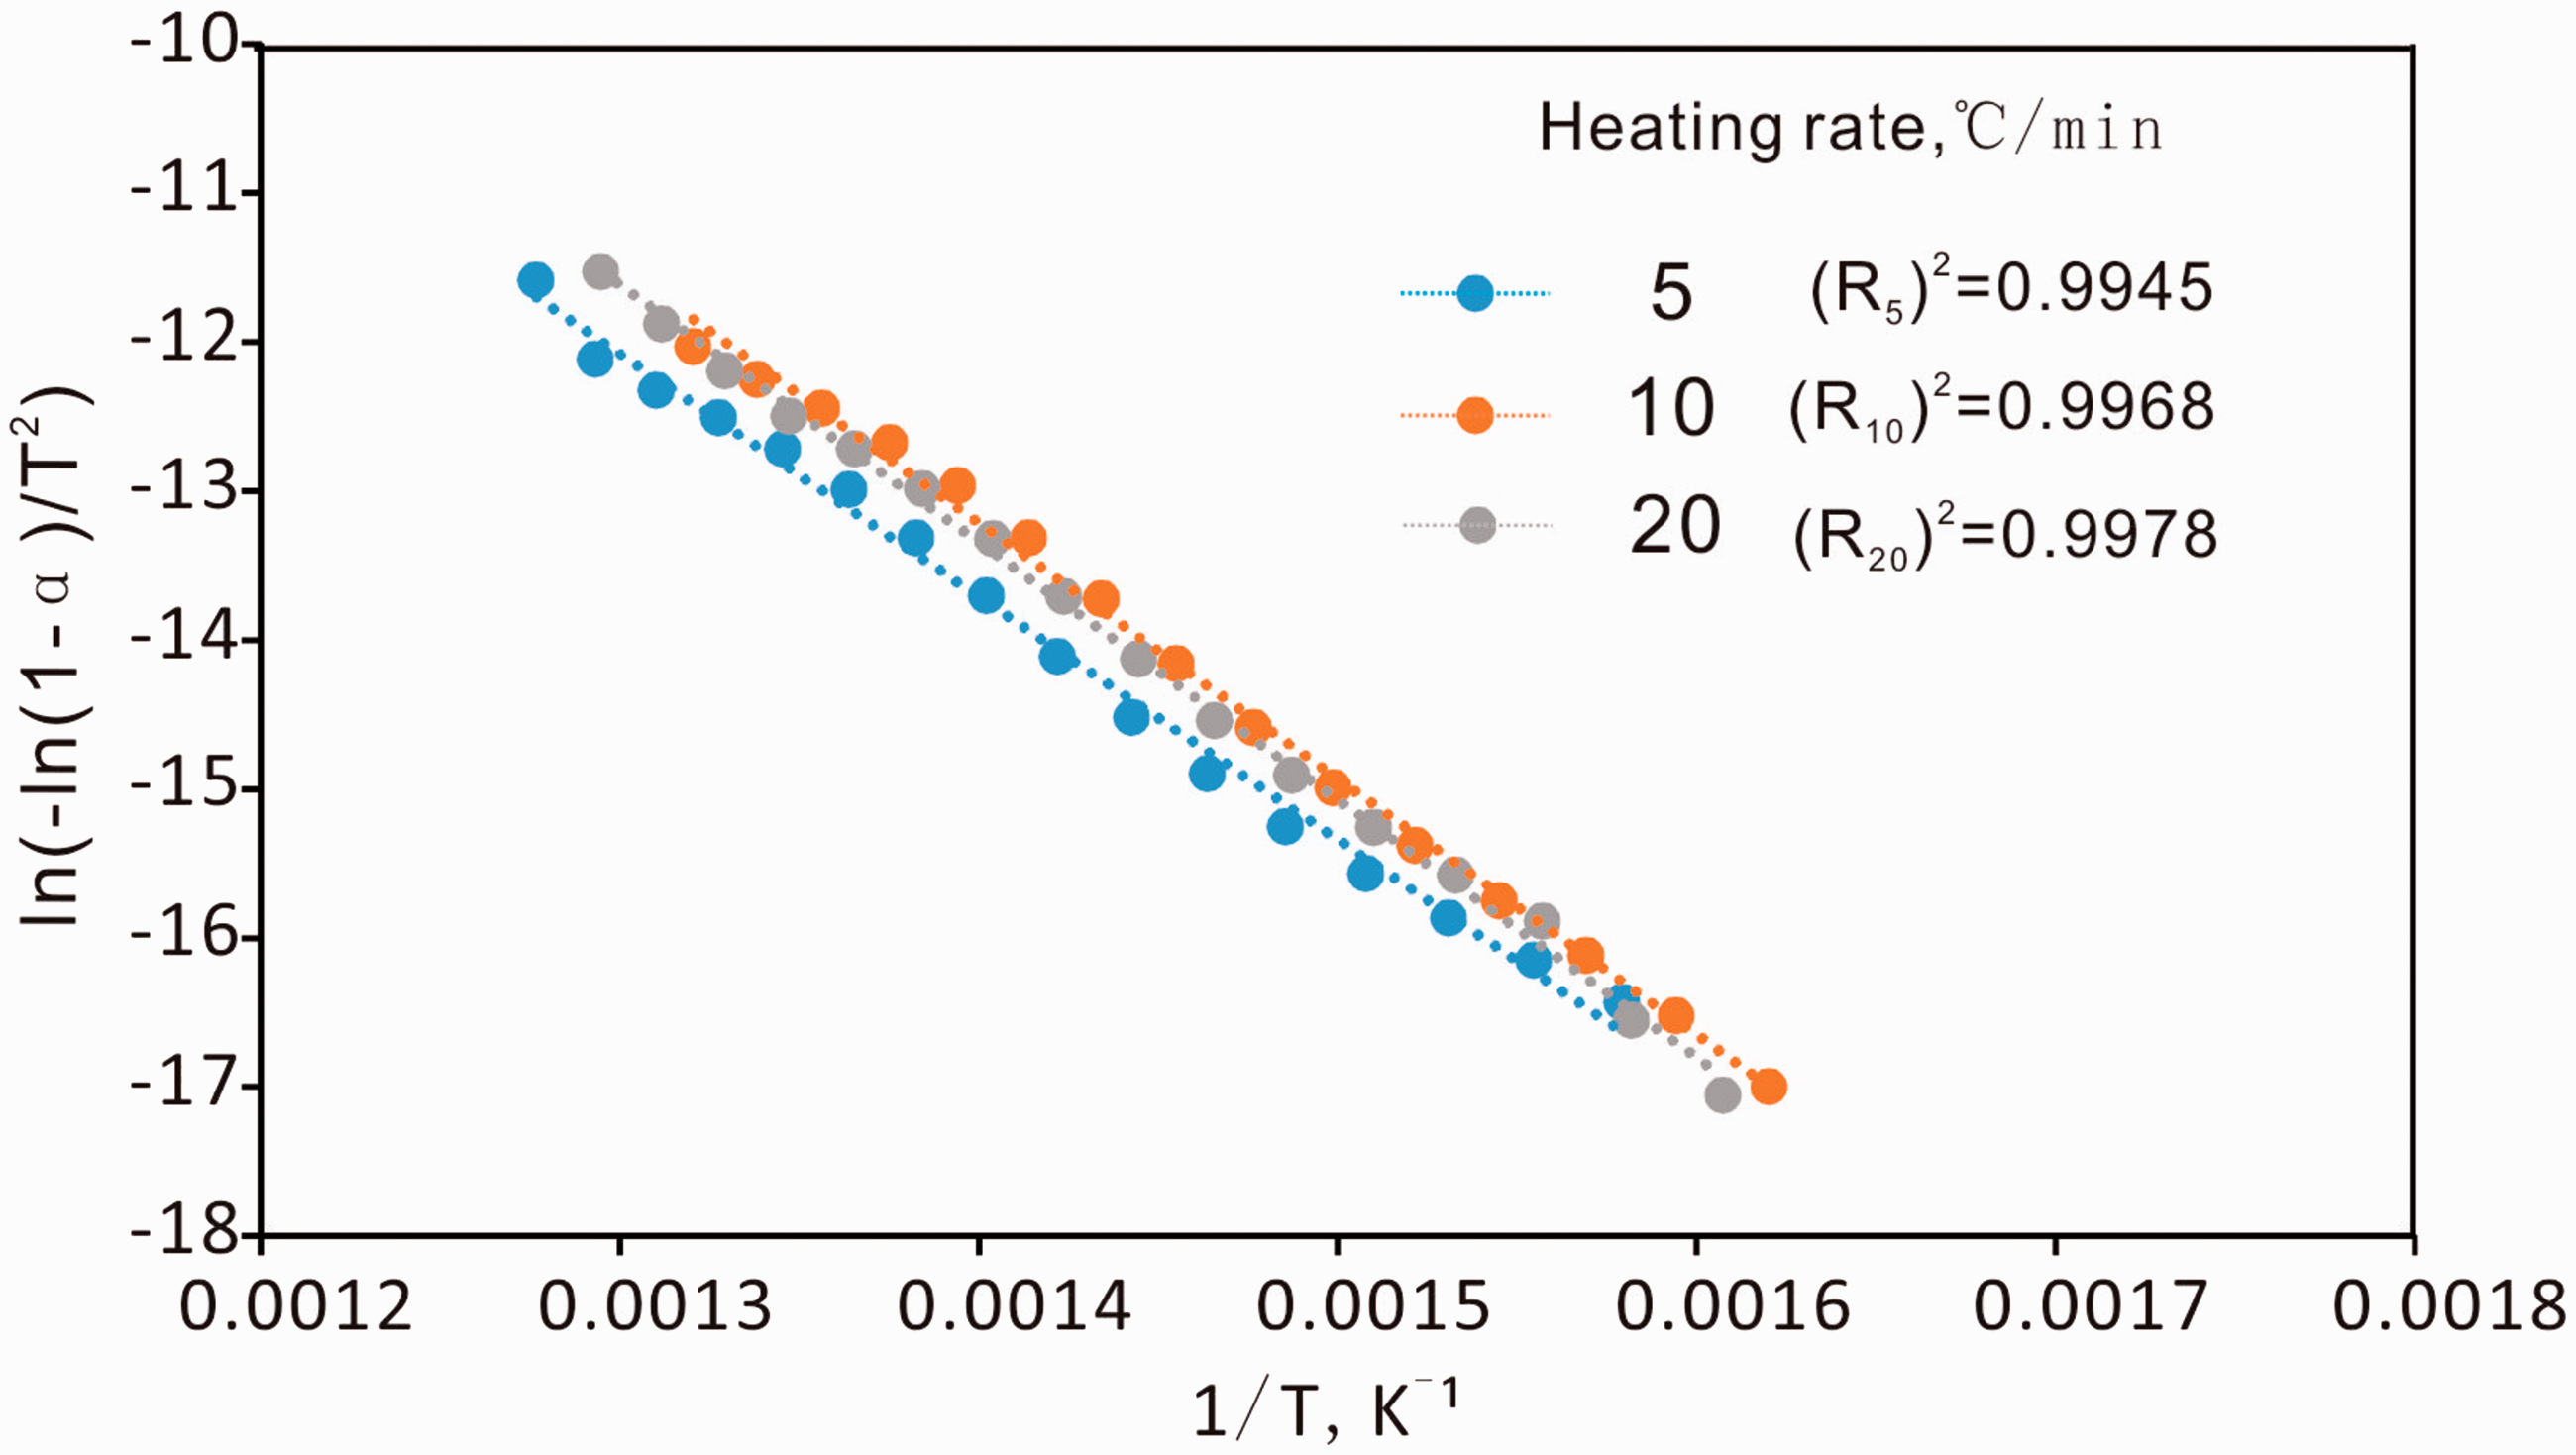
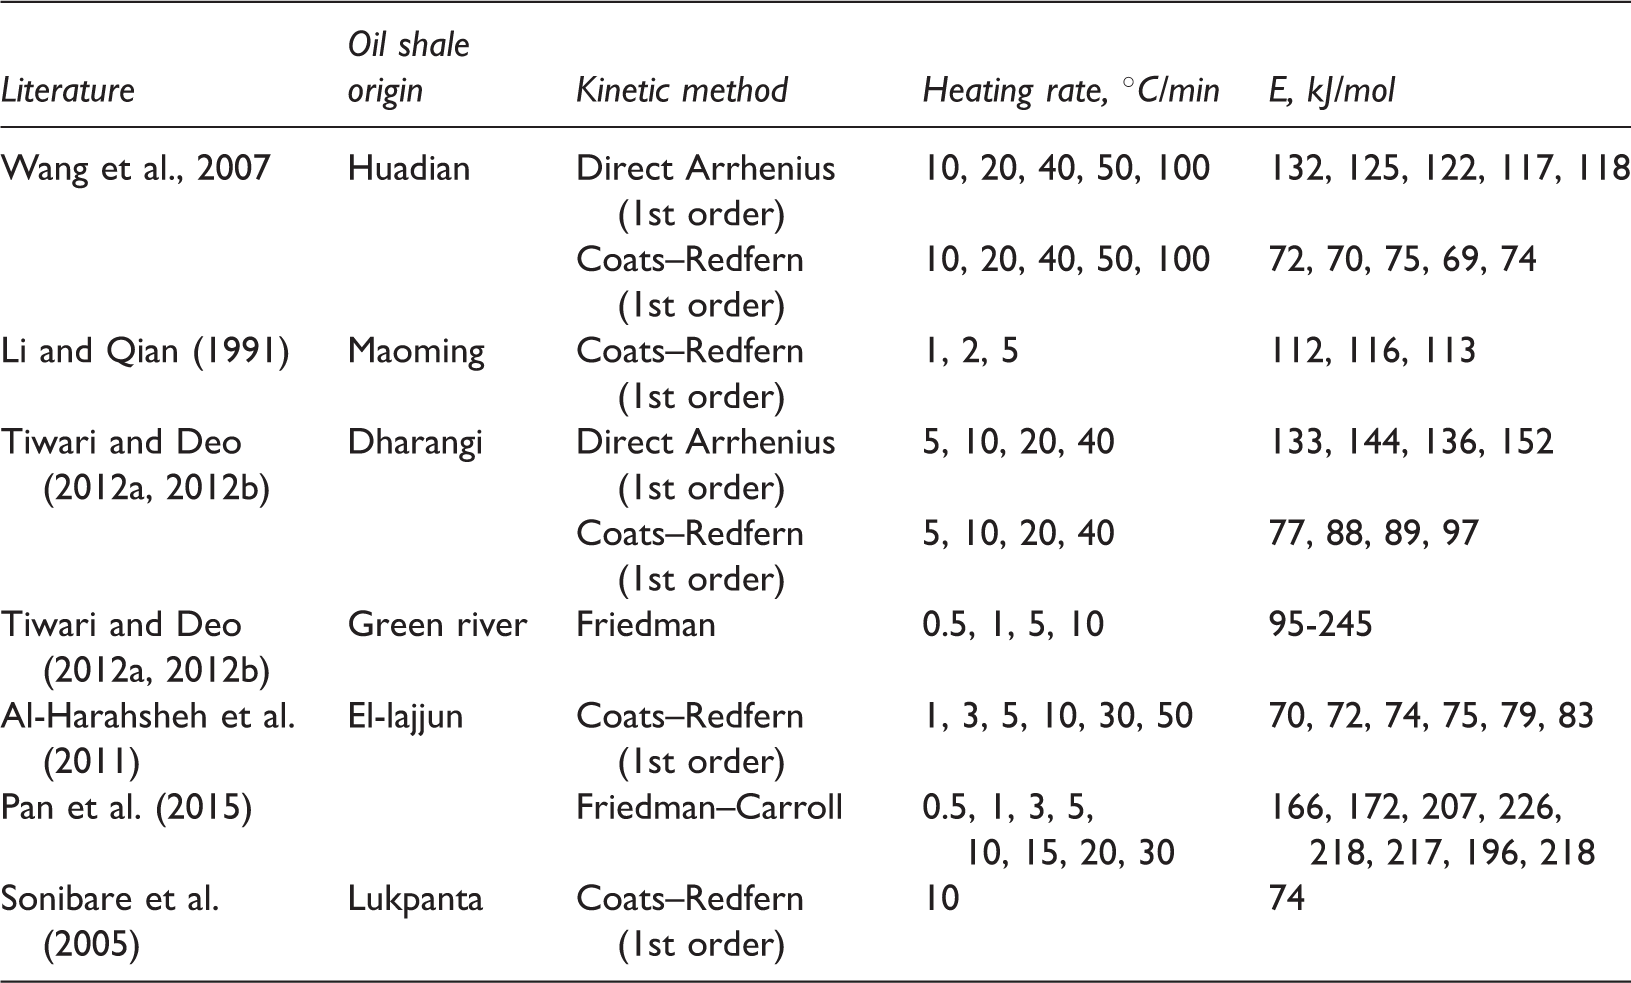
Comparison between activation energy Values reported in literature (limited to nonisothermal TGA pyrolysis technique).
In chemistry, activation energy was defined as the minimum energy required to start a chemical reaction, and the energy consumption of the reaction can be described by the heat absorption. Therefore, both the activation energy and the heat absorption could show the ease or complexity of the reactions and the value of activation energy was proportional to the amount of heat absorption. Figure 8 shows the heat flow curves (DTA curves) of C7 oil shale pyrolysis measured through the DTA function of the thermogravimetric analyzer. During the oil shale pyrolysis process, there were three heat-absorption valleys corresponding to the temperature range of physical heat adsorption, pyrolysis of hydrocarbonaceous material and decomposition of pyrite. The physical heat adsorption involved release of bound water from clay minerals, release of free hydrocarbon and rearrangement of kerogen molecules. The amount of the second heat-adsorption valley was obviously inferior to the amount of the first one, which may be due to the common function of exothermic and endothermic reactions in hydrocarbonaceous material. The amount of heat absorption increased apparently with the increase of heating rate. It can be observed from Figure 8 and Table 3 that the calculated activation energies of the decomposition of hydrocarbonaceous material at different heating rates were in agreement with the amounts of heat absorption. Hence the heat flow curves of oil shale pyrolysis can be used to verify the credibility of the calculated activation energy values of oil shale in a certain extent.
Conclusion
In this article, the pyrolysis mechanism of C7 oil shale was identified through TGA and Py-GC-MS experiments. We presented a TGA data of oil shale pyrolysis at three different heating rates. DTG curves showed the decomposition process of C7 oil shale involved two stages which were the decomposition of hydrocarbonaceous material and pyrite, respectively.
In the organic weight loss region (367–521℃), the pyrolysates were alkanes, alkenes, alkyl benzenes and polyaromatic compounds and the DTG curves showed a single major peak indicating the decomposition was governed by single mechanism. The conversion at the same temperature decreased along with the increase of heating rate. The second stage (521–700℃) was attributed to decomposition of pyrite and the pyrolysates were sulfur dioxide, carbon disulfide and minor hydrocarbon compounds. Thus, the optimal final temperature of C7 oil shale would be better to be about 550℃. Also, as the heating rate was increased, the decomposition of hydrocarbonaceous material and pyrite both shifts to higher temperature.
The excellent correlation with R2 exceeding 0.9945 supported the assumption of first-order kinetics using Coats–Redfern integral method to calculate kinetic parameters.
Both activation energy and pre-exponential factor for C7 oil shale depended significantly on the heating rate and increased with the increase of heating rate due to heat and mass transfer effects. The activation energies of kerogen decomposition were in the range of 135.4–143.6 kJ/mol with an average of 140.6 kJ/mol while the corresponding frequency factor changed from 7.29 × 10⁸ to 1.74 × 10¹⁰ with the heating rate increasing from 5℃/min to 20℃/min.
Thermogravimetric analysis and Py-GC-MS experiments allow us to gain insight into mechanism as well as the kinetic parameters of C7 oil shale pyrolysis. But the influence of heating rate and final pyrolysis temperature on the yield and composition of the products of C7 oil shale is still unknown. Next, we intend to perform TGA-MS on C7 oil shale samples to analyze the pyrolysis conditions of the maximum oil yield.
Footnotes
Declaration of conflicting interests
The author(s) declared no potential conflicts of interest with respect to the research, authorship, and/or publication of this article.
Funding
The author(s) disclosed receipt of the following financial support for the research, authorship, and/or publication of this article: National Science and Technology Major Project of China (Grant No. 2016ZX05003002-004 and 2016B-05-02), Strategic Priority Research Program of the Chinese Academy of Science (Grant No. XDB10010103) and National Natural Science Foundation of China (Grant No. 41072105).