
Abstract
The widely distributed, thick Chang 7 Shale is the richest shale oil formation in China. A calculation method for the evaporative hydrocarbon recovery coefficient based on formation volume factor is proposed considering the correction of heterogeneity-based total organic carbon differences to improve the adsorbed oil calculation method, and light hydrocarbon evaporative sampling losses, which can make mobile and total oil calculations more accurate. The adsorbed oil, S1 evaporative loss, total oil yield, and movable oil yield of 200 shale samples from the Chang 7 Member were calculated using the new methods. Results show that S1 evaporative loss accounts for 29% of S1, total oil yield is 3.5 times S1, and movable oil yield accounts for 37% of total oil yield. Based on the calculated total oil yield and movable oil yield results, the relationships among total oil yield, movable oil yield, and total organic carbon of the Chang 7 were established yielding total oil yield and movable oil yield estimates of 11.12 × 10⁹ t and 4.01 × 10⁹ t, respectively, revealing its tremendous shale exploration potential.
Introduction
In the past decade, as the exploration and development of conventional oil and gas has become increasingly difficult, the focus of oil and gas exploration has gradually turned to shale oil. Shale oil exploration has made major progress in the Permian Basin, Williston Basin, Western Gulf, Appalachian Basin, and Western Canada Sedimentary Basin in North America (Abouelresh and Slatt, 2012; Attar and Pranter, 2016; Bernard and Horsfield, 2014; Browning et al., 2013; Chen and Jiang, 2016; EIA, 2015, 2016, 2017; Hackley and Cardott, 2016; Han et al., 2019; Kuske et al., 2019; Lewan and Pawlewicz, 2017; Marra, 2018). Breakthroughs in shale oil have also been made in the Ordos Basin, Bohai Bay Basin, Songliao Basin, and Junggar Basin in China (Liang et al., 2017; Liu et al., 2019; Zhang et al., 2018; Zou et al., 2019a). Shale oil, with great resource potential, will be the main target for oil and gas exploration and development in the future. With wide distribution and large thickness, the Chang 7 Shale in the Upper Triassic in the Ordos Basin has the most abundant shale oil in China (Guo et al., 2019; Zou et al., 2019b).
Shale oil is self-generated and self-retained in fine-grained organic-rich source rocks, where additional storage space for hydrocarbon is provided by pores and microfractures created by conversion and shrinkage of kerogen associated with hydrocarbon generation (Chen and Jiang, 2016; Chen et al., 2017a, 2017b, 2017c, 2017d; Li et al., 2018, 2019; Loucks and Reed, 2014; Modica and Lapierre, 2012). In this paper, shale oil is liquid hydrocarbons, mainly occurring in mature shale reservoirs with a large portion of the oil yield in sorption sorped or partially soluble states.
The evaluation method of shale oil resource potential mainly adopts volumetric methods and includes the volumetric method based on porosity (Chen and Jiang, 2016; Modica and Lapierre, 2012) and based on pyrolytic S1 yield (Jiang et al., 2016a, 2016b; Li et al., 2019; Michael et al., 2013).
Modica and Lapierre (2012) proposed the PhiK approach for calculating the organic matter porosity of shale. In this approach, the kerogen pore system is considered as an oil-wet pore system without water; thus, relative water saturation is not accounted for. Modica’s method assumed “matrix” or “mineral” porosity that is dominated by bound water and that may be largely irrelevant to hydrocarbon storage capacity. The oil in-place (OIP) of the Mowry Shale was estimated by both PhiK and volumetric methods, and the results show that the OIPs calculated with the two methods are close at low shale maturity (Ro <0.75%), but when Ro is more than 0.75%, the OIP calculated by PhiK is over twice that calculated by the S1 yield method (Ro >0.75%). Chen and Jiang (2016) proposed a revised method for organic porosity estimation and suggested that a significant amount of hydrocarbon might be stored in the organic nano-pores in the Duvernay Formation in the Western Canada Sedimentary Basin.
This paper mainly focuses on the volumetric method based on pyrolytic S1 yield. The core problem of this method is how to effectively correct S1 yield, which includes the calculation of evaporative loss of S1, the absorbed oil, and their impact on the total oil yield (TOY) estimation as well as shale oil mobility evaluation. Many authors (Abrams et al., 2017; Burnham et al., 2018; Chen et al., 2018; Jarvie, 2012, 2018; Jiang et al., 2016a, 2016b; Li et al., 2019; Michael et al., 2013; Romero-Sarmiento, 2019) have discussed these questions.
At present, the main method to study adsorbed oil and total oil content is pyrolysis based on the “two sample procedure,” in which one whole rock sample and one post-solvent extracted sample are evaluated. This method assumes that the two samples are homogeneous, and the total organic carbon (TOC) content is the same. However, most rocks are heterogeneous, and the two samples once divided are more or less different. The main concern is the difference in TOC content, which has a direct effect on S1 and S2.
This paper proposes an evaluation method of the heterogeneity of the shale sample to correct the TOC difference and improve the adsorbed oil calculation method, which can make the calculation results of adsorbed oil and total oil more accurate. Meanwhile, the loss of evaporative hydrocarbon and movable oil calculation methods are also discussed. These methods are used to evaluate the resource potential of the Chang 7 Shale oil.
Geological setting
The Ordos Basin spans five provinces: Shaanxi, Gansu, Ningxia, Mongolia, and Shanxi in China. The northern part of the basin is the Ordos Plateau at an elevation of 1200 m–1500 m, and southern part is the Loess Plateau at an elevation of 800 m–1600 m. It forms part of the North China Platform and is a cratonic basin, with stable settlement and depression migration, covering an area of 250 × 103 km2 (Figure 1).
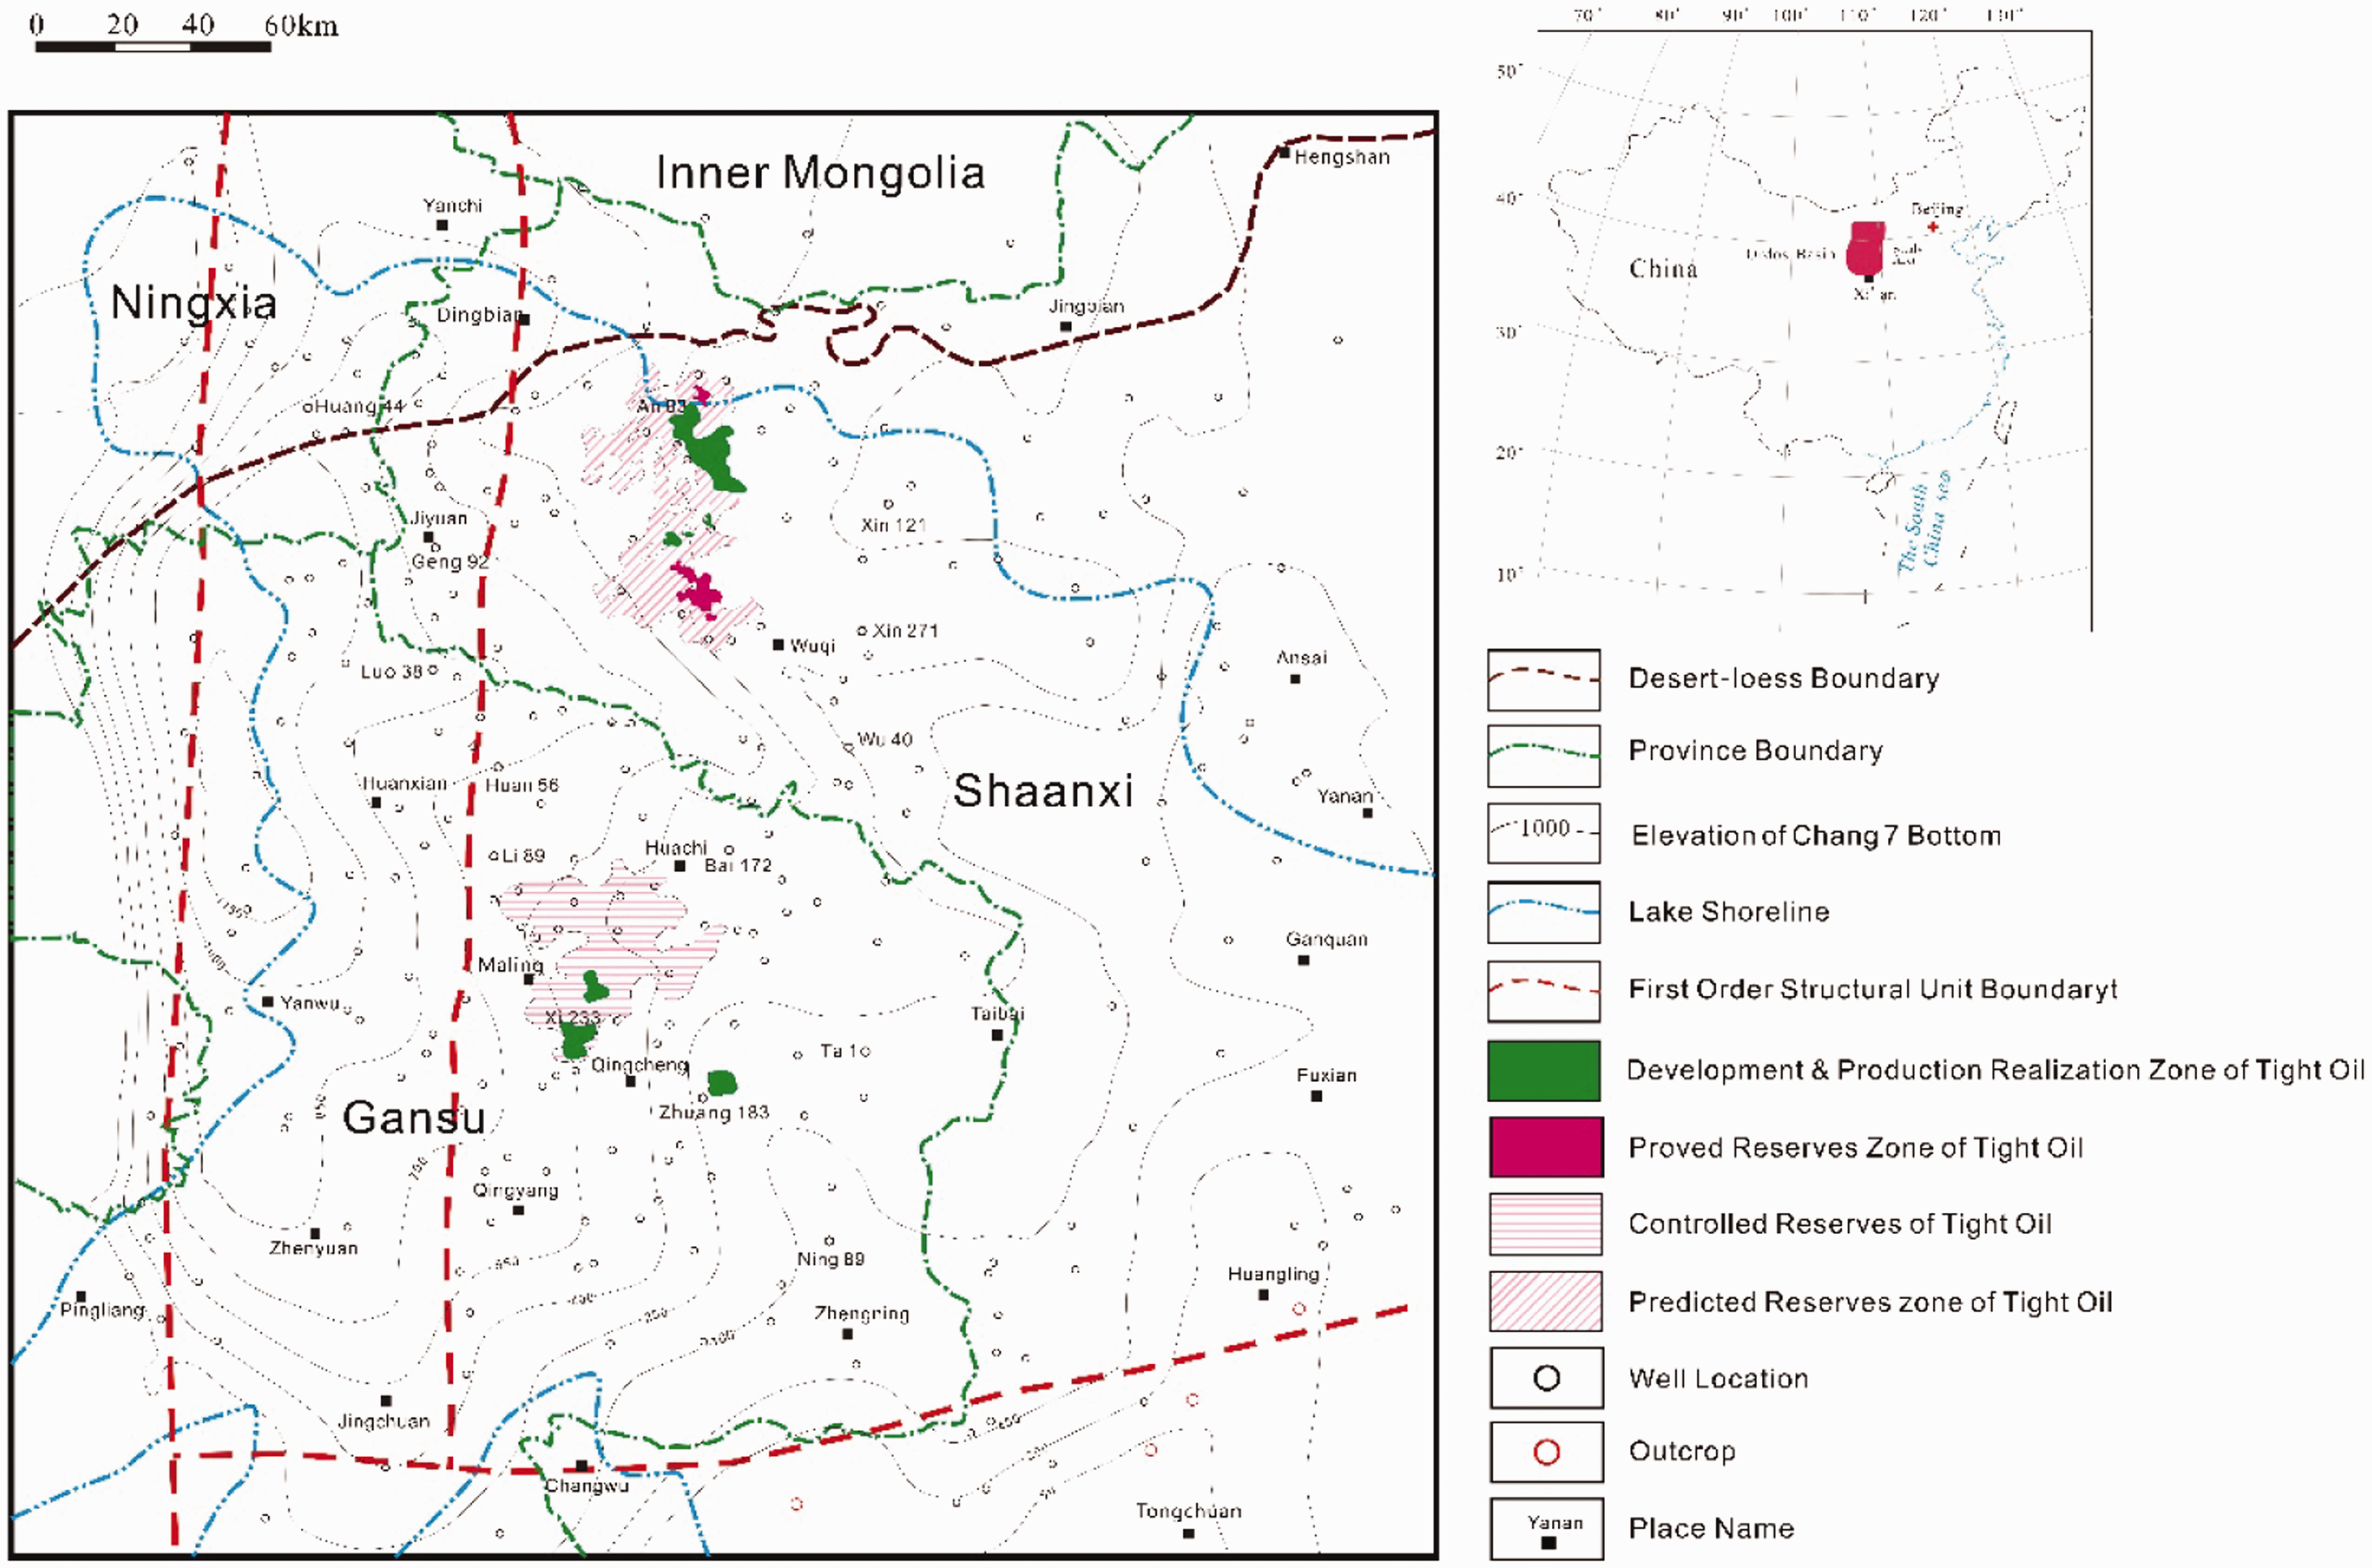
Schematic geologic map and favorable area distribution of the Chang 7 tight oil in the Ordos Basin.
The Triassic Yanchang Formation in the Ordos Basin is a set of continental clastic sedimentary strata more than 1000 m thick and is thick in the south and thin in the north. It is divided into 10 reservoir members, Chang 1 to Chang 10 from top to bottom, with the tight oil and shale oil mainly occurring in the seventh member (Chang 7 for short). Chang 7 is further subdivided into three sub-members: Chang 71, Chang 72, and Chang 73 from top to bottom (Figure 2).
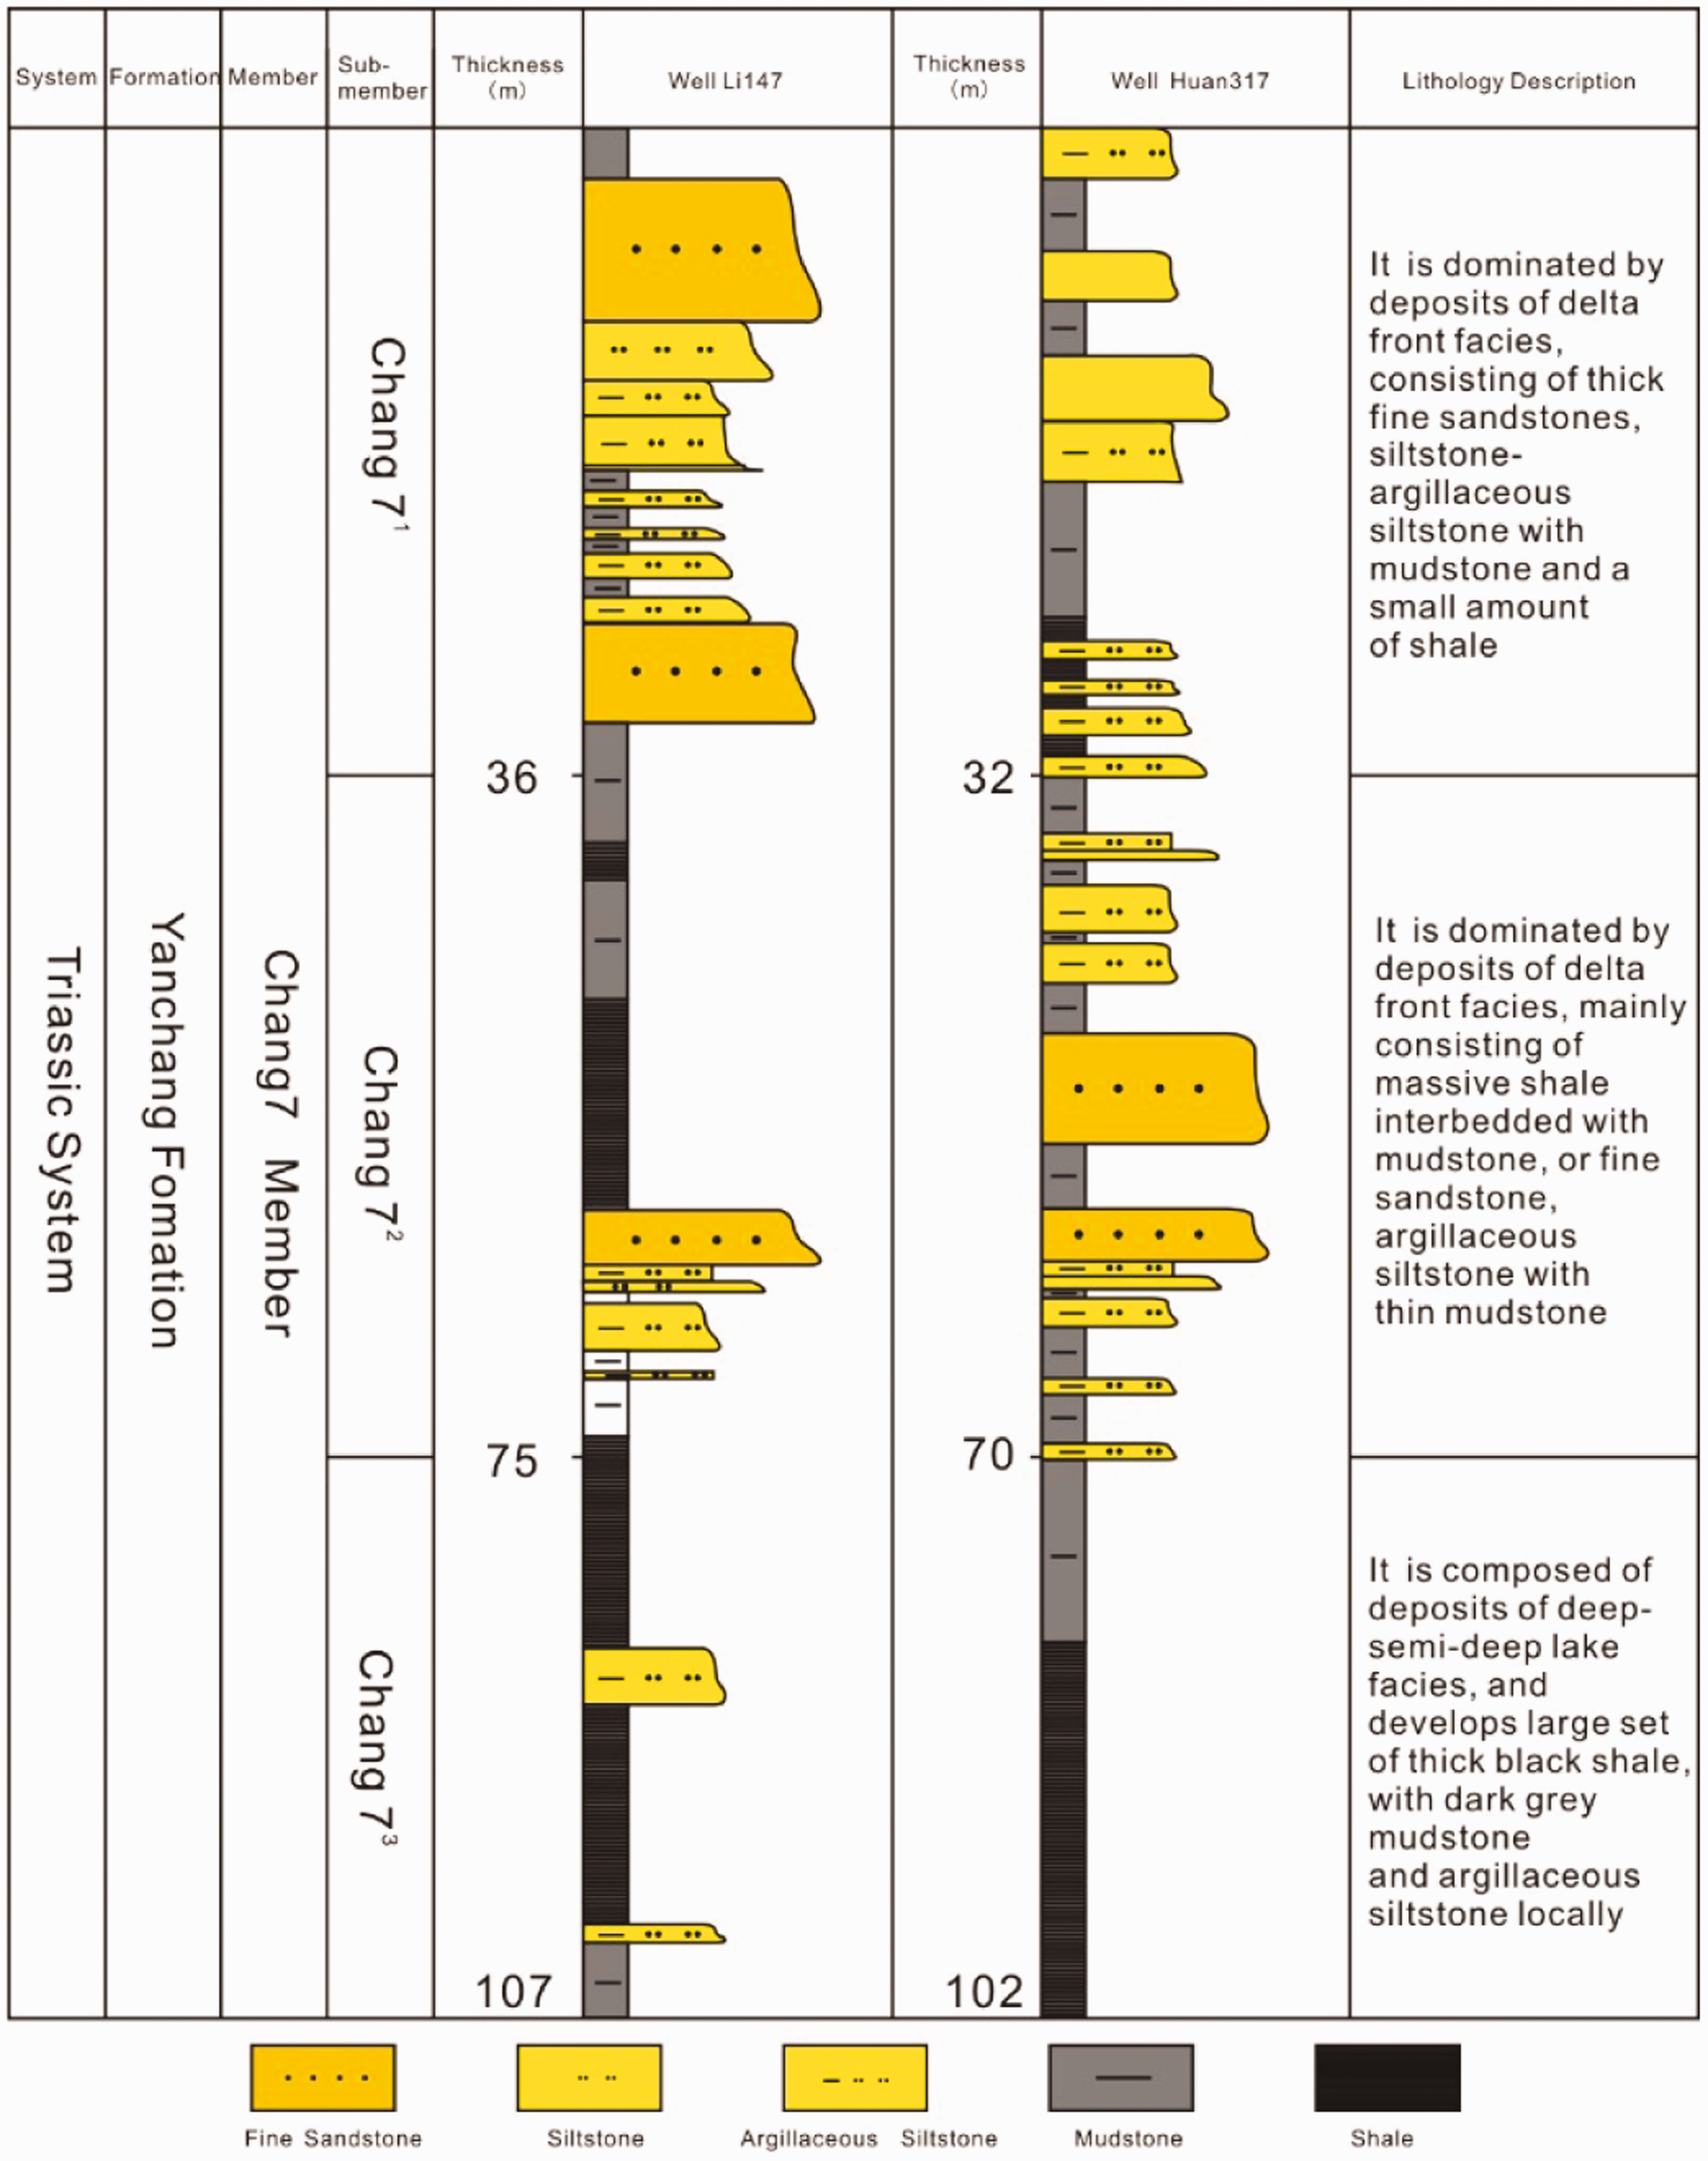
Lithological columnar section of Chang 7 in the Ordos Basin.
Chang 7 covers an area of approximately 100 × 103 km2, with burial depth range from 600 m to 2900 m and thickness range from 70 to 130 m. It is a set of deep, semi-deep lacustrine, shallow lacustrine, and delta front deposits and is one of the most important shale oil formations in China. Chang 71 and Chang 72 are the main tight oil plays and are composed of thick fine sandstone, thin siltstone, and argillaceous siltstone. Continuous sand bodies extend up to 150 km long and 25–80 km wide, and the area with sand-to-formation ratio greater than 30% exceeds 8000 km2. The sandstone layers are 2–25 m thick each and 5–50 m thick combined, with 4–14% in porosity and less than 1 mD air permeability (Guo et al., 2017). Chang 73 is largely composed of thick black shale and dark gray mudstone and is deemed the main target for shale oil exploration.
Estimation methods of in-place and movable resources of shale oil
An evaluation method of the heterogeneity of the shale sample to correct the TOC difference
Commonly, samples are divided into two pieces: A and B, which are, respectively, used for whole-rock pyrolysis before and after extraction. We use TOCA and TOCB to represent the TOC content’s each sample. If these two pieces of TOC contents are inconsistent, they differ by ΔTOC as follows

For Piece A (TOCA), part of S1 + S2 after pyrolysis is from ΔTOC, and the remaining quantity from TOCB is

For Piece B (TOCB), TOCB becomes TOCEX after extraction, and the pyrolysis result is S1EX + S2EX.
According to the principle of conservation of matter

When ΔTOC is small or TOCB/TOCA approaches 1 (such as 1.0 ± 0.1)


We approximate the value of equivalent TOC correction coefficient (kap)


When ΔTOC is large


The exact value of the equivalent TOC correction coefficient (kex) is


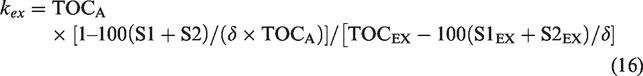
Assume that S2EX is proportional to TOC, then

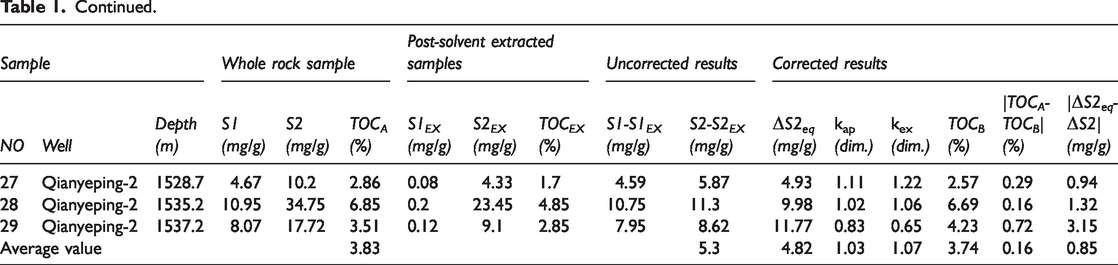
To verify the feasibility of the method, equivalent TOC calculations were performed on the sample test data (Tables 1 and 2) of the Qianjiang Formation Shale in Jianghan Basin, China (Chen et al., 2018) and the Shahejie Formation Shale in Bohai Bay Basin, China (Li et al., 2019). The calculation results are shown in Tables 1 and 2 and Figures 3 and 4.
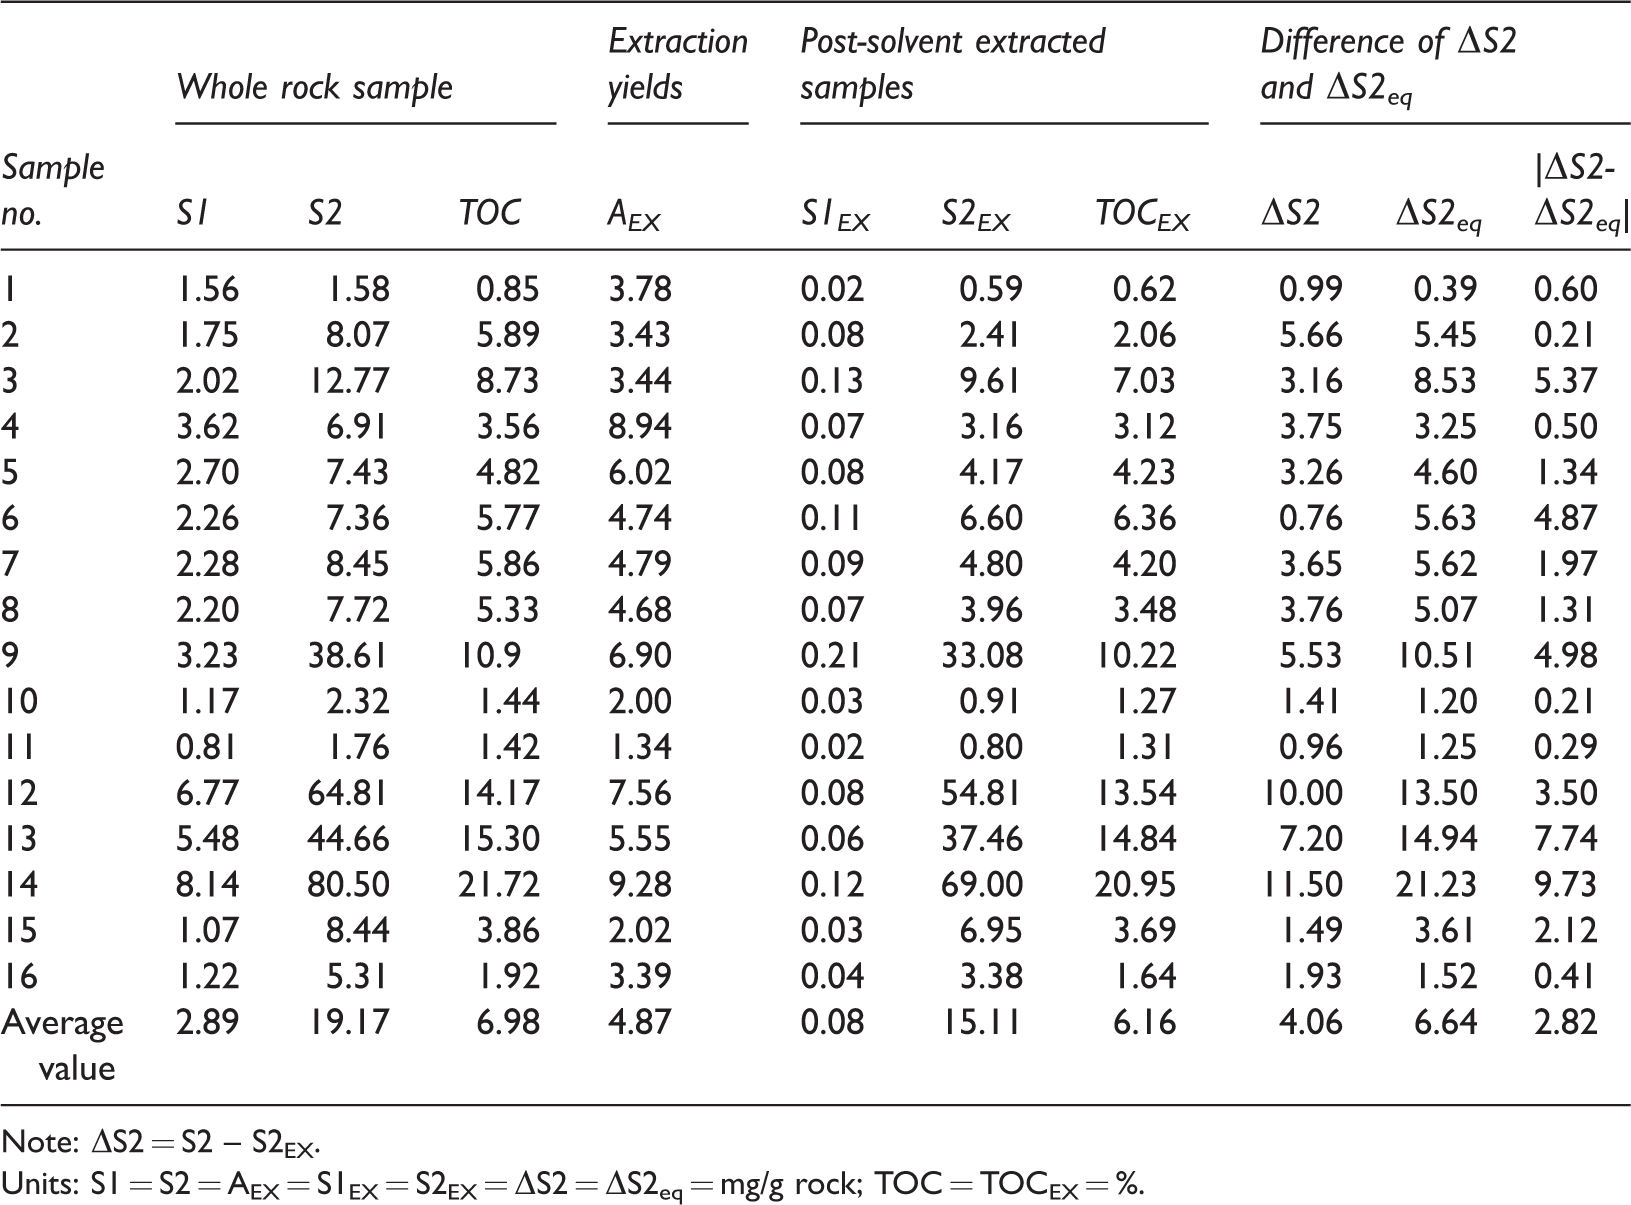
Rock–Eval pyrolysis results, ΔS1, ΔS2, ΔS2eq, kap, kex, and TOCB of the Qianjiang Formation Shale in Jianghan Basin, China (Rock–Eval data from Chen et al., 2018).
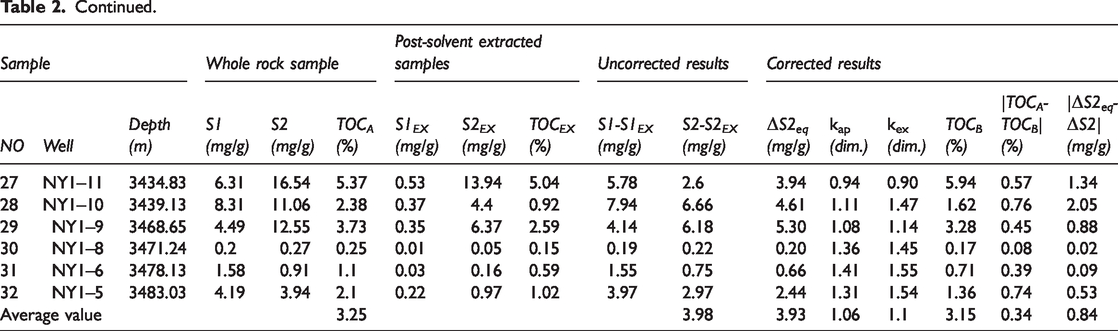
Rock–Eval pyrolysis results, ΔS1, ΔS2, ΔS2eq, kap, kex, and TOCB of the Shahejie Formation Shale in Bohai Basin, China (Rock–Eval data from Li et al., 2019).
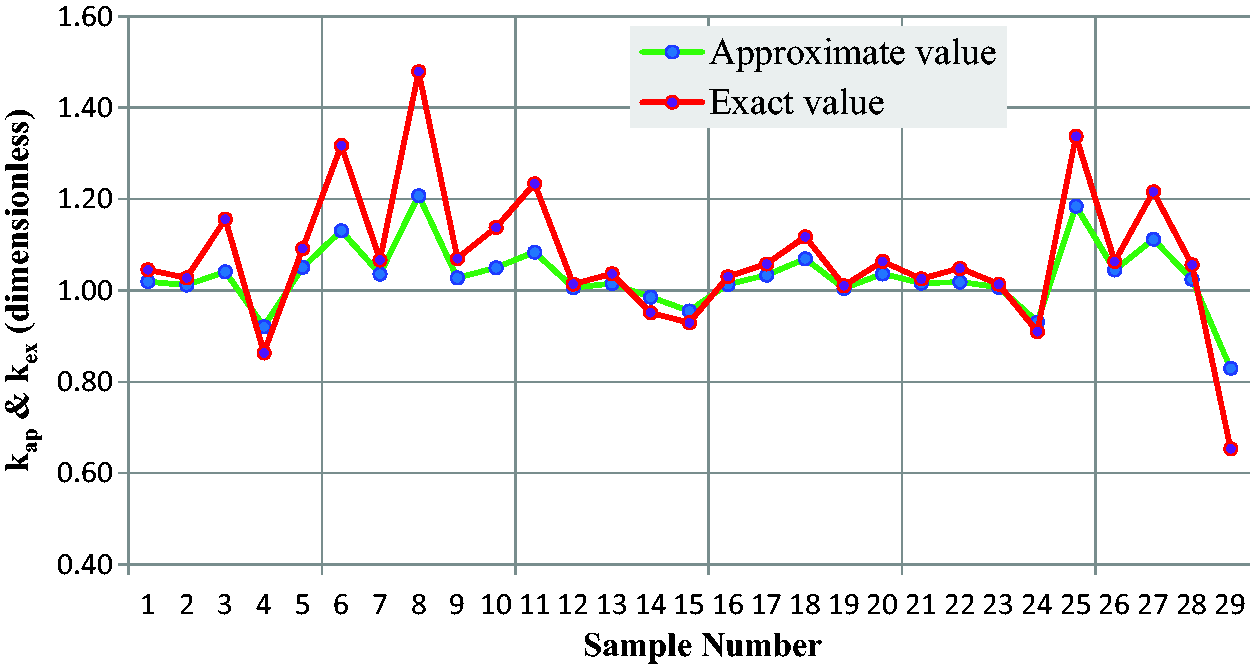
kap and kex curves of the Qianjiang Formation shale in Jianghan Basin, China.
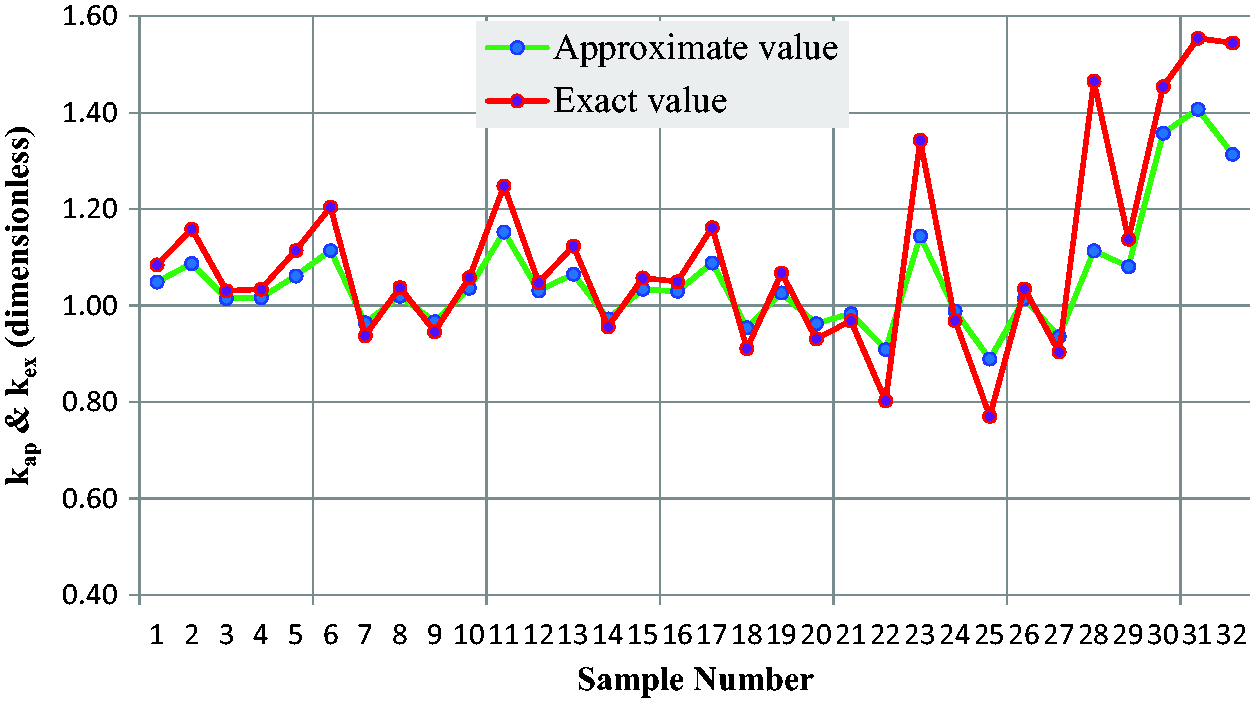
kap and kex curves of the Shahejie Formation shale in Bohai Basin, China: (a) the Eocene Qianjiang Formation, Jianghan Basin, China (Rock-Eval data from Chen et al., 2018); (b) the Eocene–Oligocene Shahejie Formation, Jiyang Depression, and Bohai Bay Basin (Rock–Eval data from Li et al., 2019).
For the Qianjiang Formation Shale, the maximum kex value is 1.48, the minimum kex value is 0.65, and the average value is 1.07. ΔTOC has a maximum value (in absolute value) of 0.72% and an average value of 0.16%, and ΔS2eq–ΔS2 has a maximum value (in absolute value) of 3.56 mg/g and an average value of 0.85 mg/g.
For the Shahejie Formation Shale, the maximum kex value is 1.55, the minimum kex value is 0.77, and the average value is 1.10. ΔTOC has a maximum value (in absolute value) of 0.74% and an average value of 0.34%, and ΔS2eq – ΔS2 has a maximum value (in absolute value) of 4.68 mg/g and an average value of 0.84 mg/g.
The data above show that the equivalent TOC correction is quite necessary for these samples.
An improved method for estimating TOY
TOY (milligram per gram rock) is the quantity of petroleum already present in the sample prior to pyrolysis and can be detected by flame ionization detection during pyrolysis experiments (Jarvie, 2012; Li et al., 2019). To obtain a reliable TOY from a rock sample by programmed pyrolysis, Jarvie (2012) suggested two separate pyrolysis experiments for the same sample: a whole rock (unextracted) and a post-solvent extracted sample replicate. The TOY can then be estimated from the two pyrolysis results by the following relationship

Abrams et al. (2017) added a term (S1LOSS) for the evaporative loss in equation (18) to emphasize the importance of correcting the loss in resource evaluation

Li et al. (2018) proposed a numerical method for calculating TOY using a single-routine Rock–Eval program. There is also a method for calculating TOY using a single-routine Rock–Eval program based on the production index (S1 + S2) (Li et al., 2019). Li et al. (2019) observed S1EX peaks from solvent-extracted samples of Well FY1 and attributed the S1EX to physically isolated or unreached residue of heavy oil and bitumen in the solvent-extracted samples. Thus, equation (19) has the following expression

Due to the strong shale heterogeneity, even if two samples are small, the divided shale samples could have unequal TOC contents. Therefore, the two tests, before and after extraction, are actually tests on these two small samples. Considering the possibility of unequal TOC contents, TOC equivalence correction is required to guarantee the comparability of these two test results. In addition, since S1EX is smaller and unclear in source, it will not be accounted for in this paper. Additionally, under the same conditions, S2 is proportional to TOC, and the relation is almost linear. Therefore, equation (20) can be rewritten as
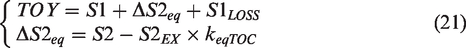
Table 3 gives an example of calculating ΔS2eq of the Chang 7 Shale in the Ordos Basin, which shows some differences between ΔS2 before correction and ΔS2eq after correction. The average difference is 2.82 mg/g rock. Figure 5(a) and (b) shows the comparison between ΔS2 and ΔS2eq in the Qianjiang Formation Shale and Shahejie Formation Shale, respectively. The average difference between ΔS2 and ΔS2eq of 29 shale samples from the Qianjiang Formation is 0.85 mg/g rock and that of 32 shale samples from the Shahejie Formation is 0.84 mg/g rock. These results suggest that the equivalence correction of TOC is necessary.
Rock–Eval data before and after solvent extraction and ΔS2eq of Chang 7 Shale samples from the Yanchang Formation in the Ordos Basin.
Note: ΔS2 = S2 – S2EX.
Units: S1 = S2 = AEX = S1EX = S2EX = ΔS2 = ΔS2eq = mg/g rock; TOC = TOCEX = %.
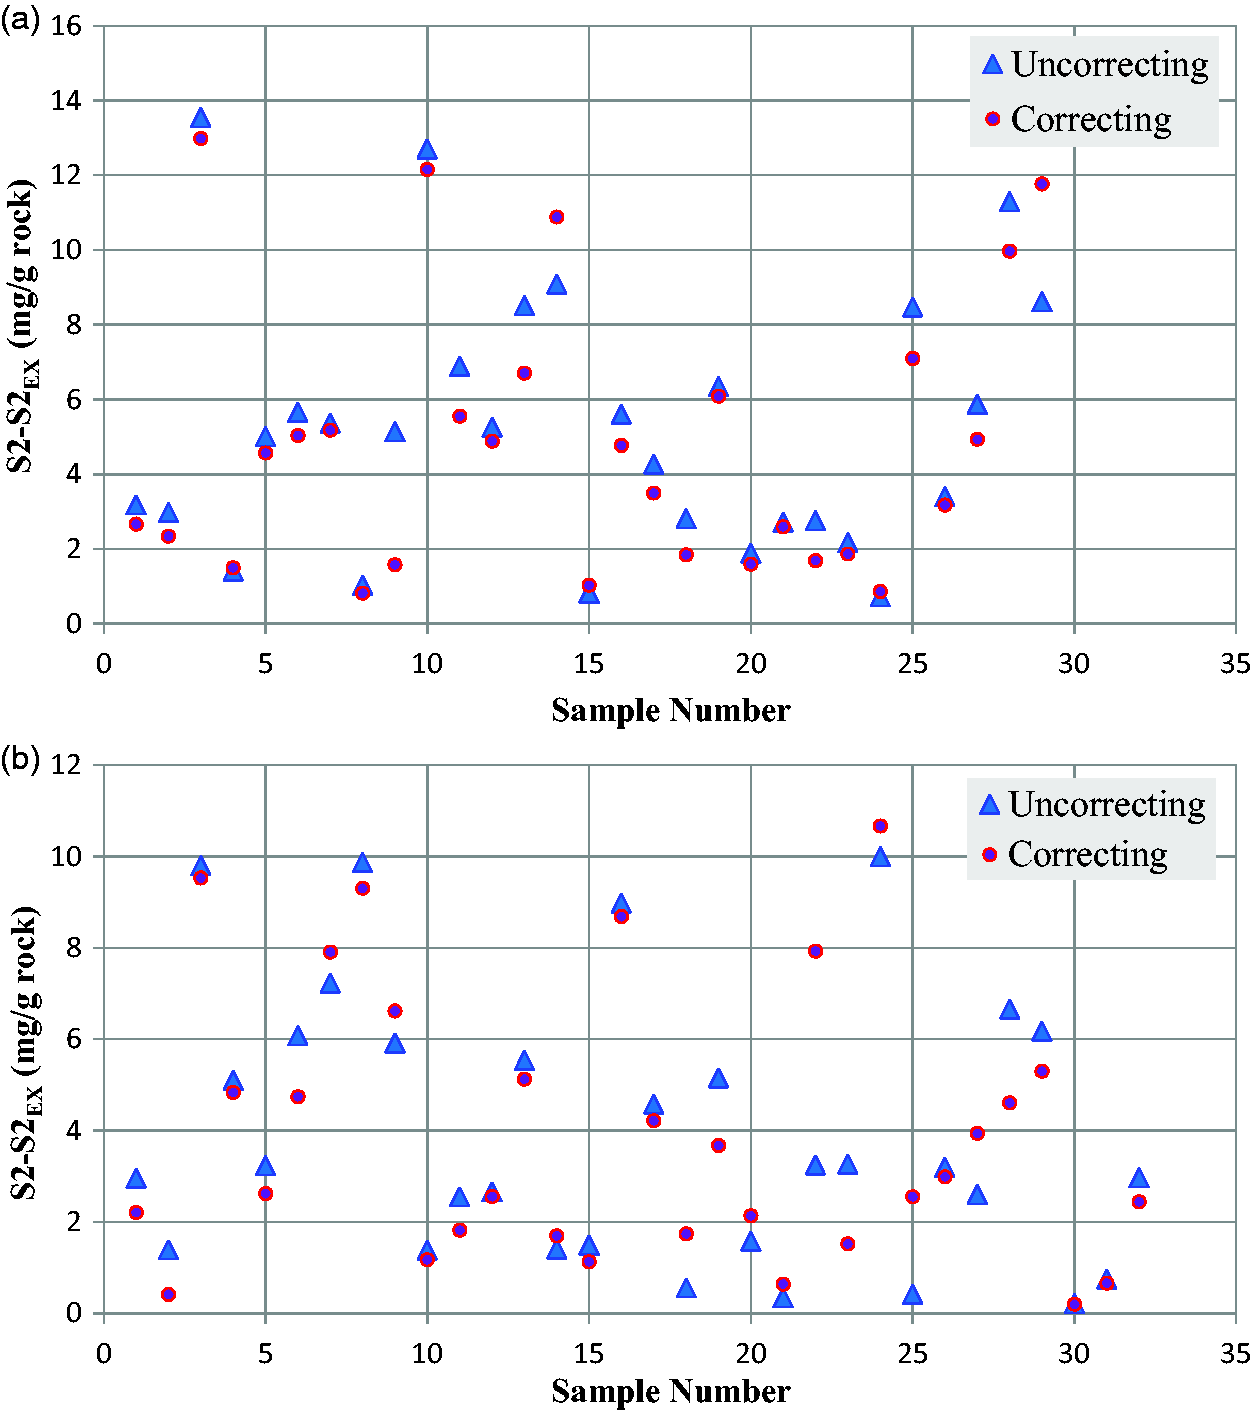
Comparison of ΔS2 and ΔS2eq.
Because of the limitations of test cost, test period, and other factors, the majority of samples are tested only prior to solvent extraction. Without tests after solvent extraction, absorbed oil cannot be calculated by equation (21). To solve this problem, a fitting method is proposed to calculate the absorbed oil, and the details are given as follows. Based on the data in Table 3, the relationship between S1 and ΔS2eq (equation (22)) is obtained by plotting S1 as a variable (x-axis) and ΔS2eq of absorbed oil as the dependent variable (Figure 6)

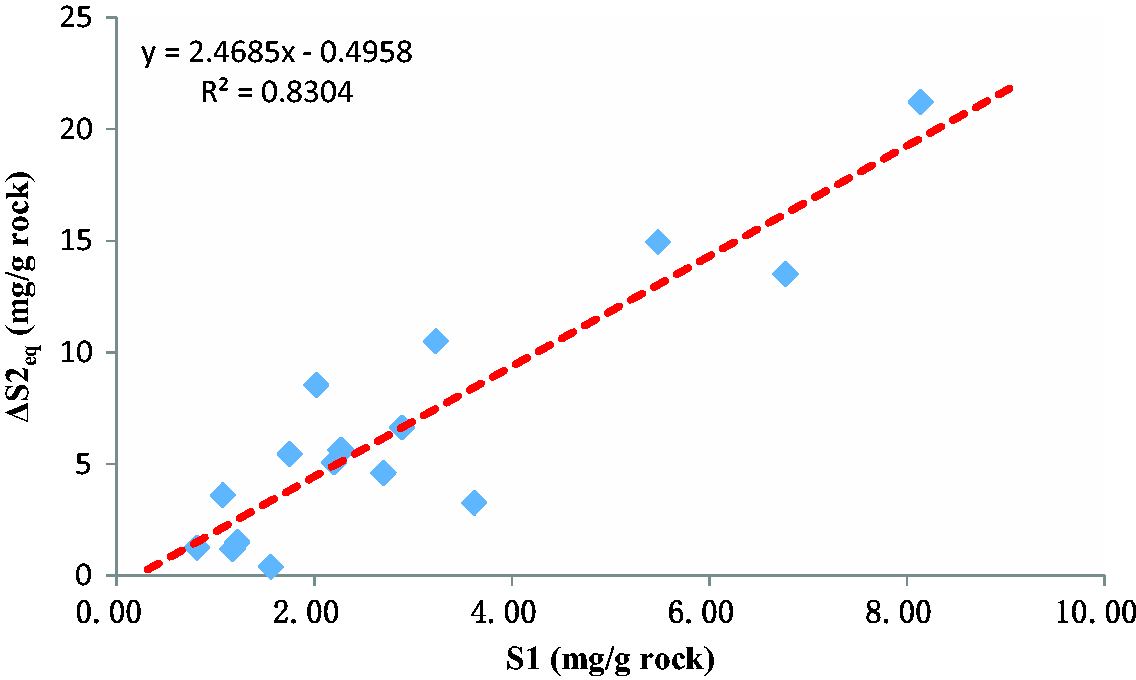
Relationship between adsorbed oil and soluble hydrocarbons in Chang 7 Shale of the Yanchang Formation, Ordos Basin.
Method estimating movable oil yield
Li et al. (2019) defined the movable oil yield (MOY, mg/g rock) as the portion of free hydrocarbon in S1 (after correcting for evaporative loss) that exceeded its sample TOC value and provided examples of calculating movable oil porosity. Jarvie (2012) proposed that S1/TOC > 100 mg/g is the criteria for shale oil “sweet spots.” Based on numerous other comparative Rock–Eval data from LRS that exhibit similar behavior as observed, Michael et al. (2013) proposed that almost all the S1 peaks in Rock–Eval pyrolysis can be considered as mobile oil. Improved Rock–Eval pyrolysis results show that S1 released before 300°C and movable hydrocarbons released before 200°C (Jiang et al., 2016; Li et al., 2020; Romero-Sarmiento, 2019).
No clear standard has been decided for the evaluation of shale oil resource potential, and “S1/TOC > 100 mg/g” may be the standard for industrial oil flow. The movable oil in this paper refers to the maximum movable oil content. Limited by experimental means and existing data, this paper adopts Michael’s point of view, taking S1 (after correcting for evaporative loss) as the MOY

The S1loss is a well-known problem in data analysis. Jiang et al. (2016) recorded up to a 38% decline in the Rock–Eval S1 value from fresh samples analyzed immediately after preparation. The oil lost during core recovery is mostly low-boiling-point hydrocarbons in the diesel and gasoline range. The S1LOSS can be estimated by knowing the density of the hydrocarbon fluid in-place, which can be estimated from the whole oil extract gas chromatogram or estimated from relationships based on biomarker compounds (Michael et al., 2013). A factor of an average medium crude oil of 15% is used for correcting the S1 of all samples (Michael et al., 2013). The phase behavior and PVT analysis were introduced in the calculation to make a full correction for evaporative loss (Li et al., 2020).
Since volatile light hydrocarbons in shale would be lost during coring and Rock–Eval sample preparation, evaporative hydrocarbon compensation is required. A method for calculating the evaporative hydrocarbon recovery coefficient based on material balance is proposed.
The original quantity of underground shale oil is calculated by

The current quantity of surface shale oil is calculated by

The evaporative hydrocarbon recovery coefficient, the ratio of loss quantity to current quantity, is calculated by

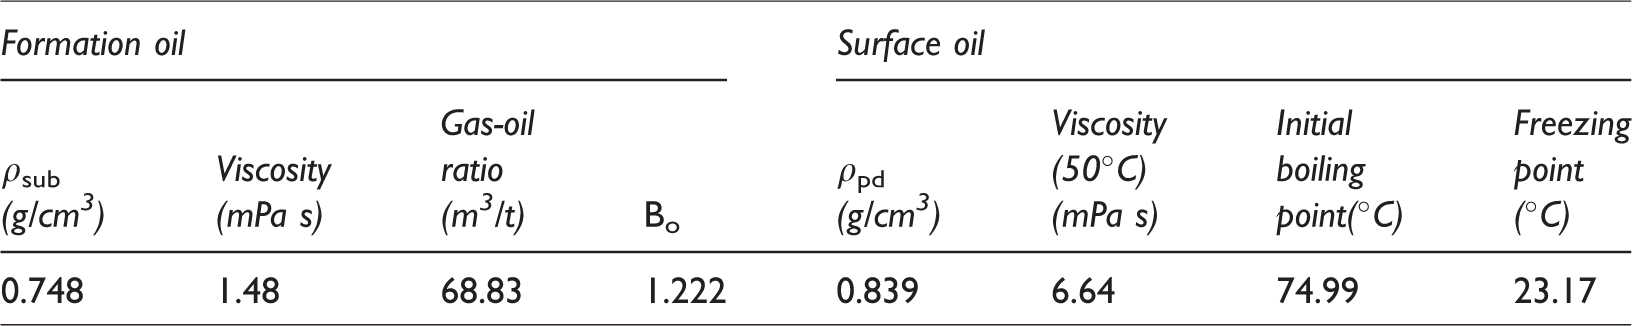
The density and volume coefficient of crude oil from the Chang 7 Shale are shown in Table 4. According to equation (26), the evaporative hydrocarbon recovery coefficient is 0.09.
Main properties of the Chang 7 Shale oil.
According to equation (26), the formula for calculating evaporative hydrocarbon loss is as given below

The formula for calculating movable oil is as given below

Method of shale oil resource evaluation based on TOY and MOY
Considering the heterogeneity of shale, it is necessary to subdivide the evaluation area into several small evaluation units and evaluate them separately. The formulas for calculating in-place and movable shale oil are as given below
Chang 7 Shale oil resource potential
Basic geologic features of Chang 7 Shale
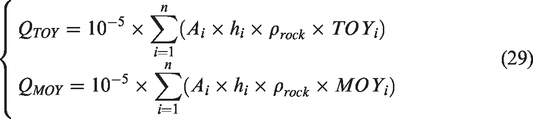
Chang 7 source rocks include black shale and dark gray mudstone, with mainly type I and type II organic matter, and are at the stage of massive oil generation with great hydrocarbon-generation potential. The shale is a high-quality source rock (Table 5).
Geologic features of the Chang 7 Shale.
Distribution of Chang 7 Shale
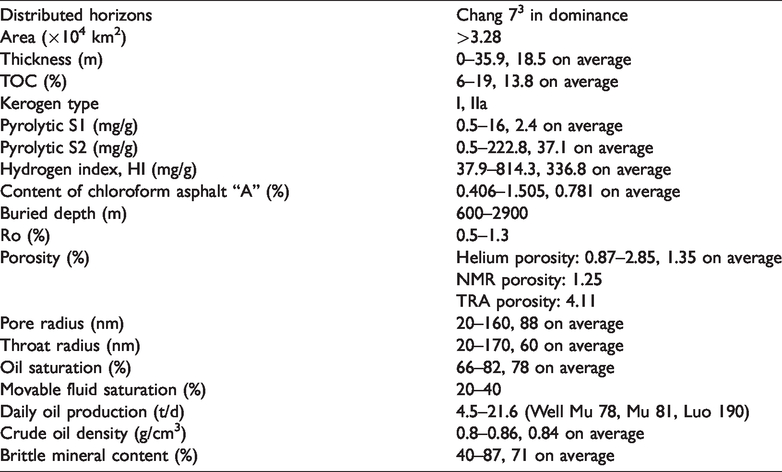
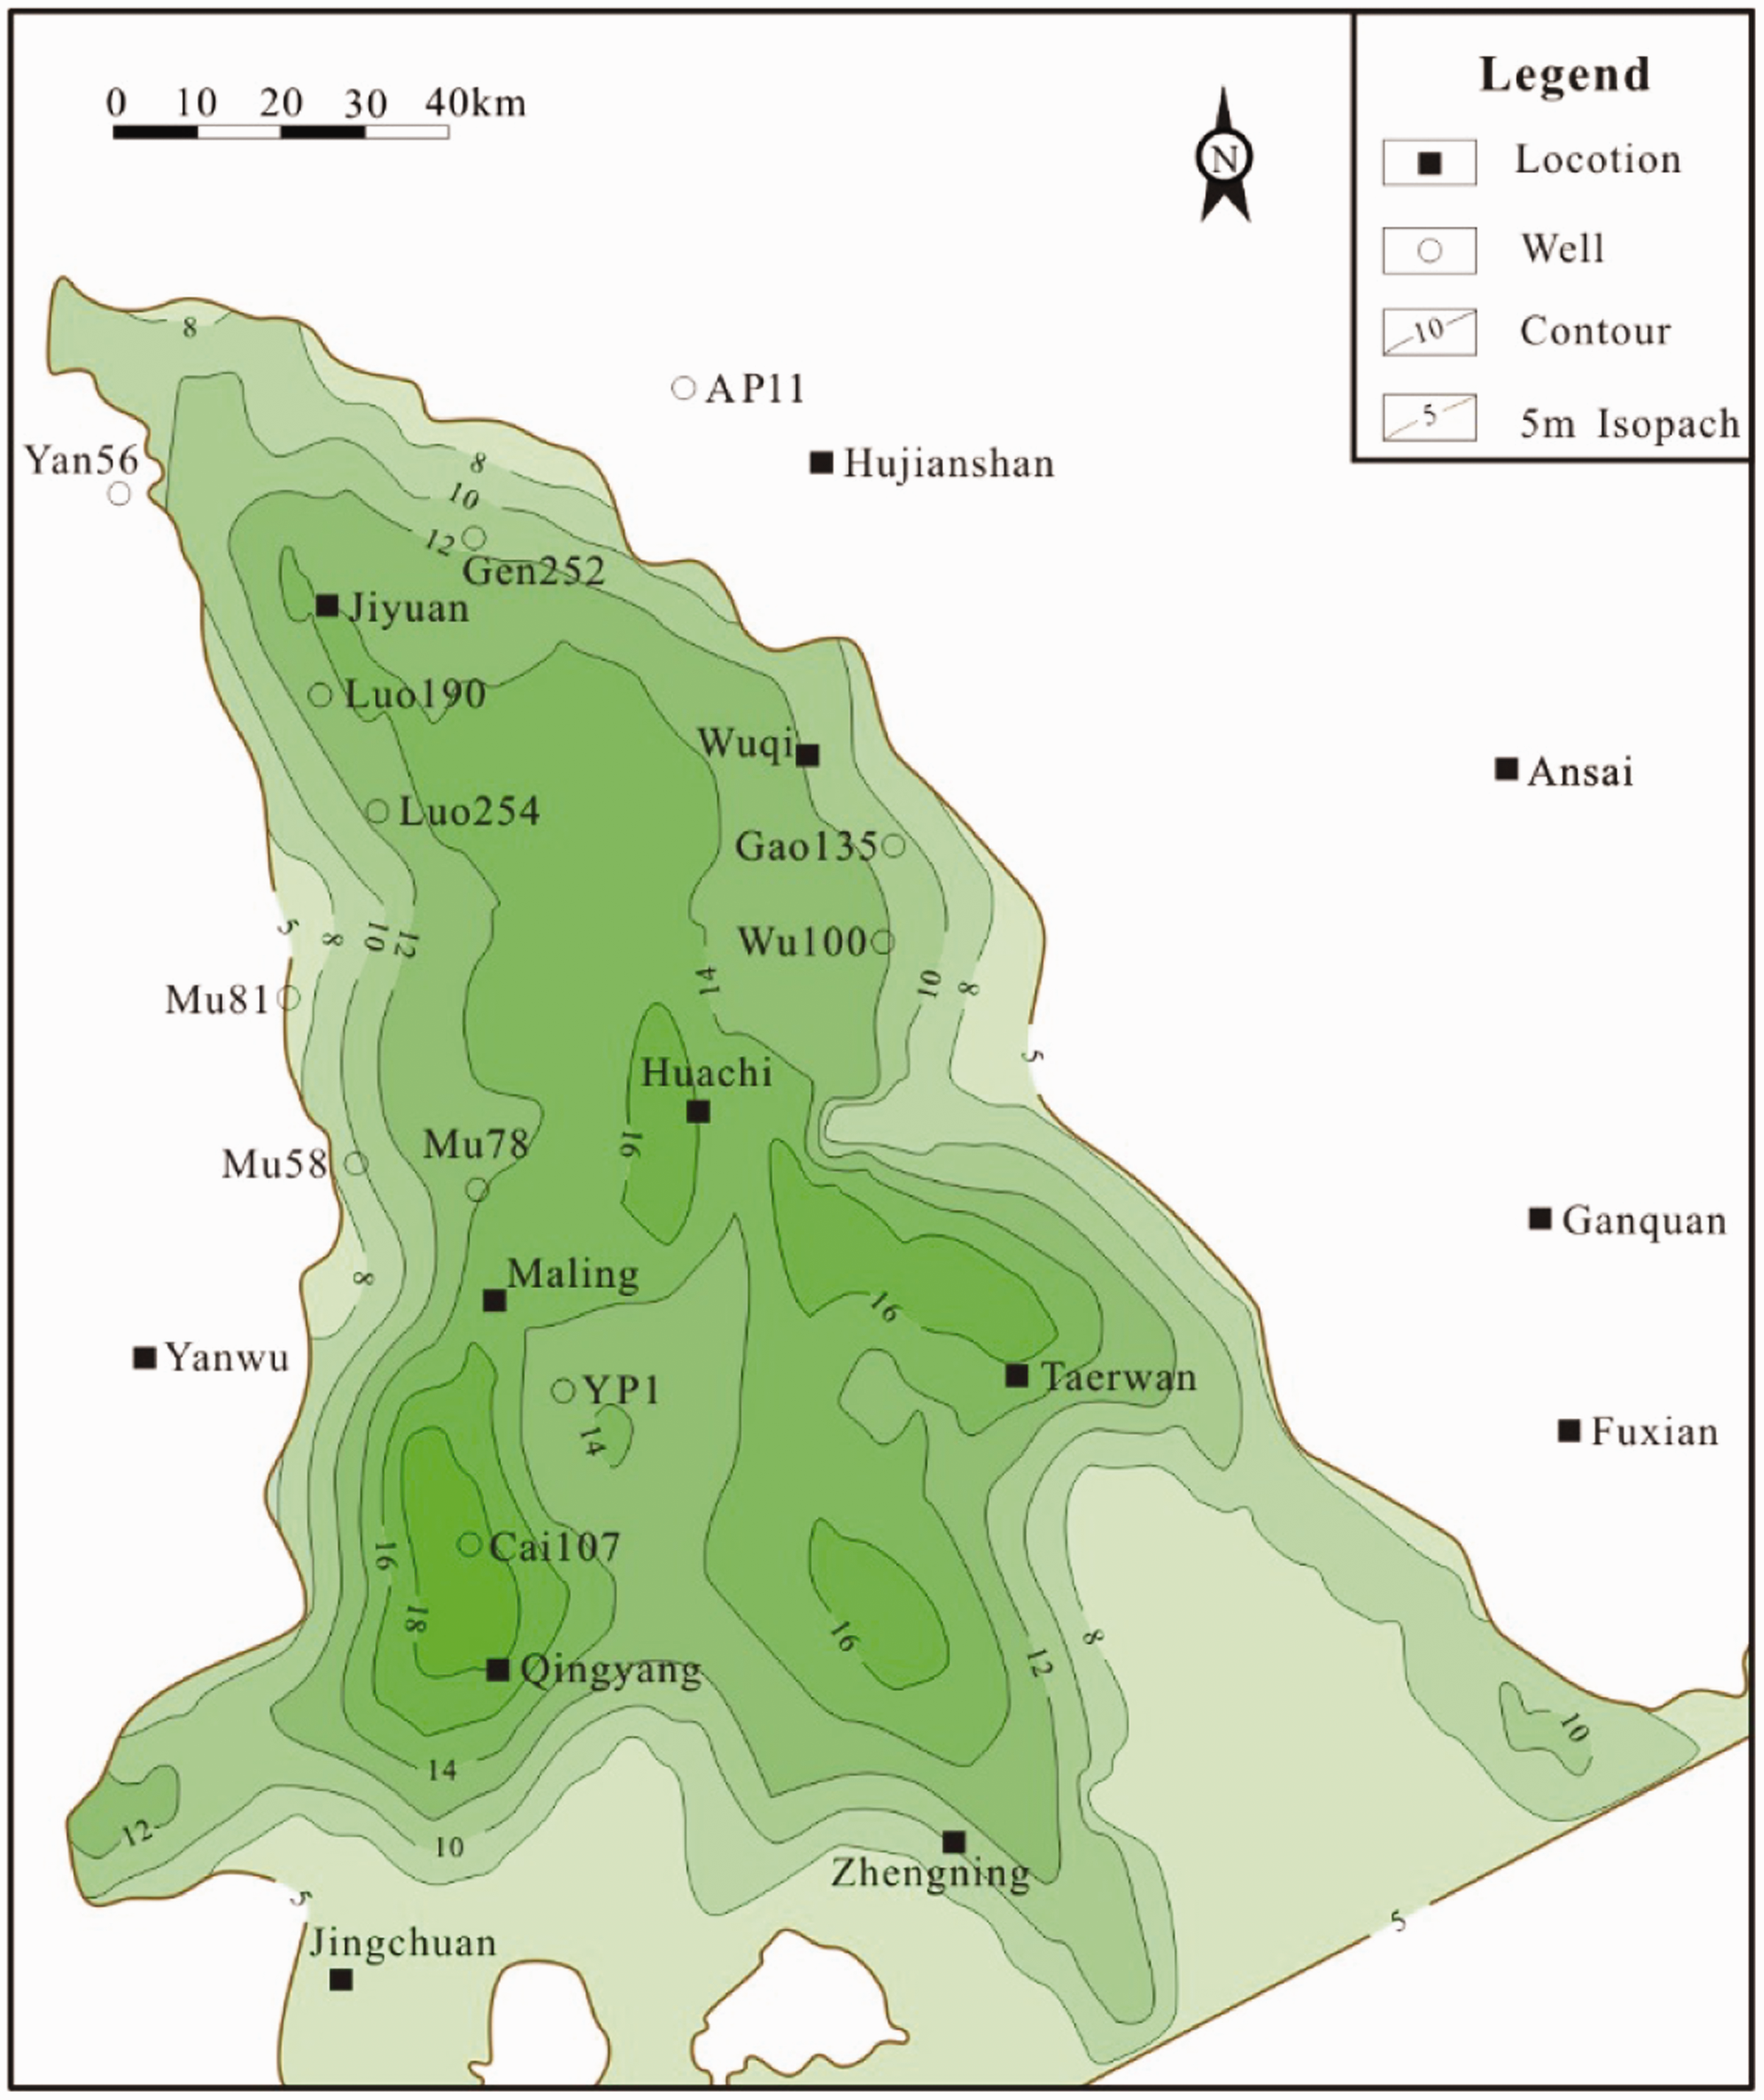
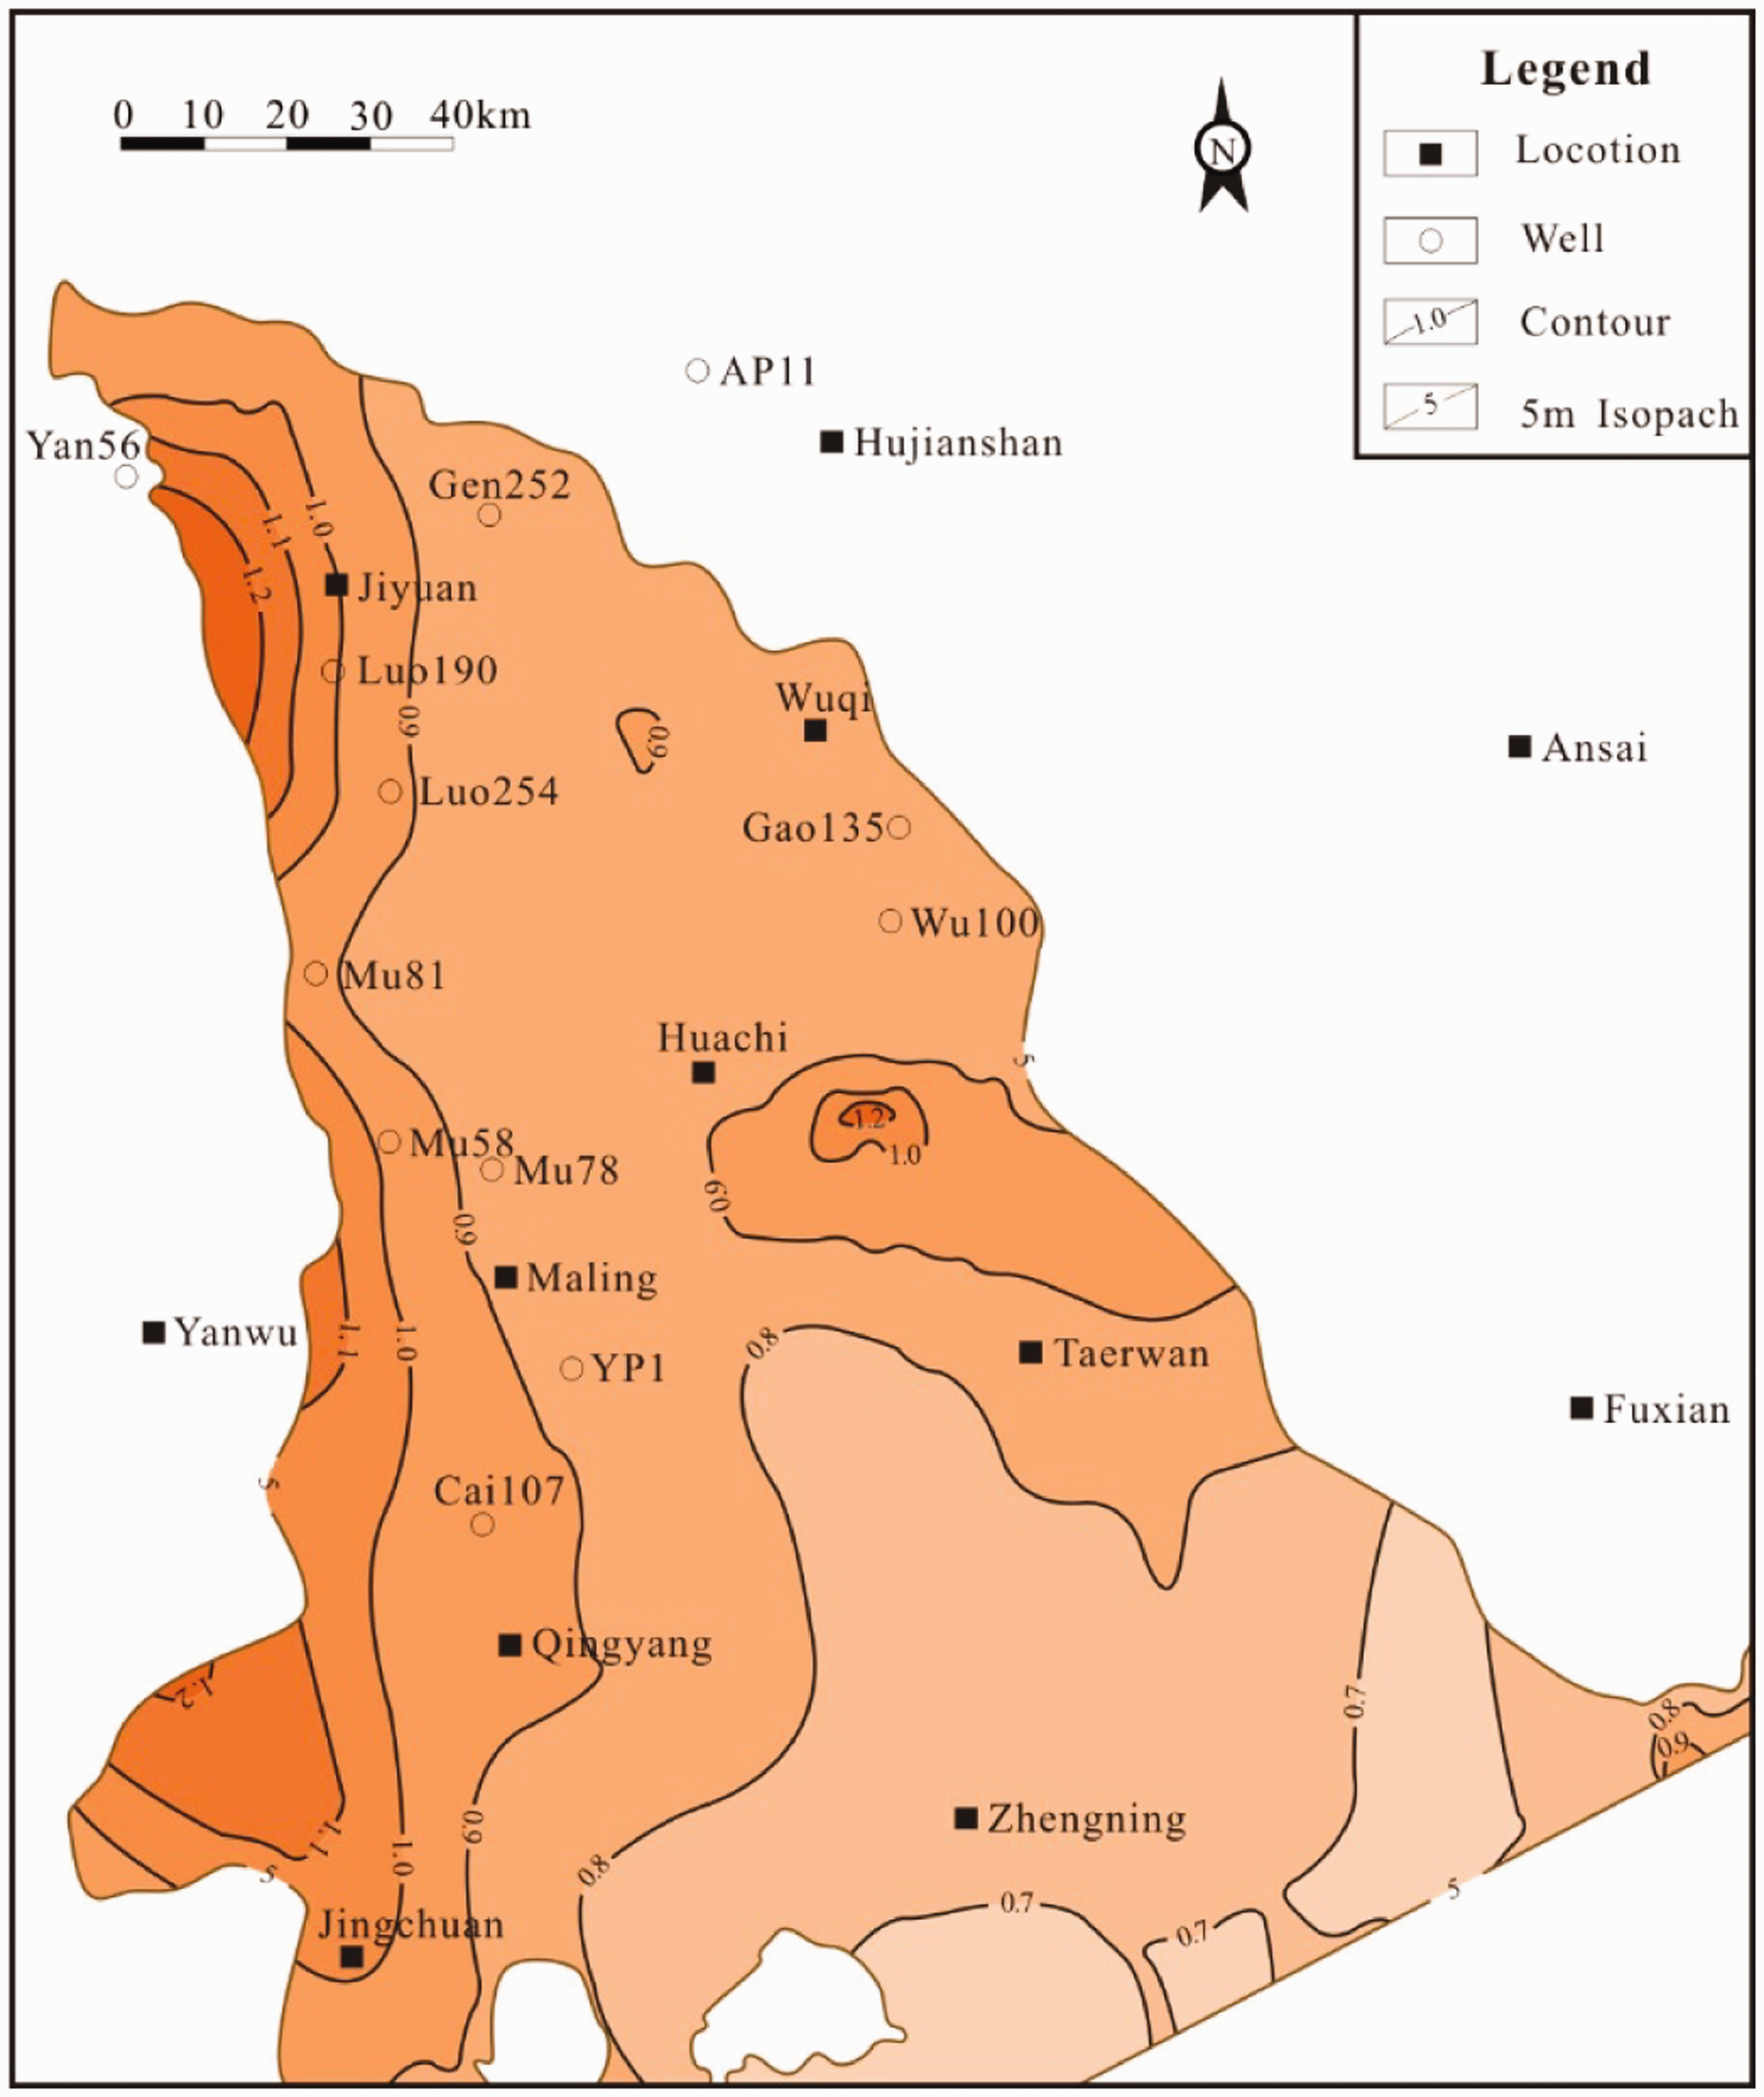
The Chang 7 Shale is distributed widely, and shale with thickness over 5 m covers an area of 3.28 × 10⁴ km2. The Chang 7 Shale is 18.5 m thick on average and 35.9 m thick at its maximum. In Jiyuan–Maling–Huachi, it is over 25 m thick, and in Taerwan—Zhengning, it is over 20 m thick (Figure 7). The shale has a maximum TOC content of 19% and has higher TOC in Taerwan–Huachi–Maling–Qingyang of over 15% on average (Figure 8).
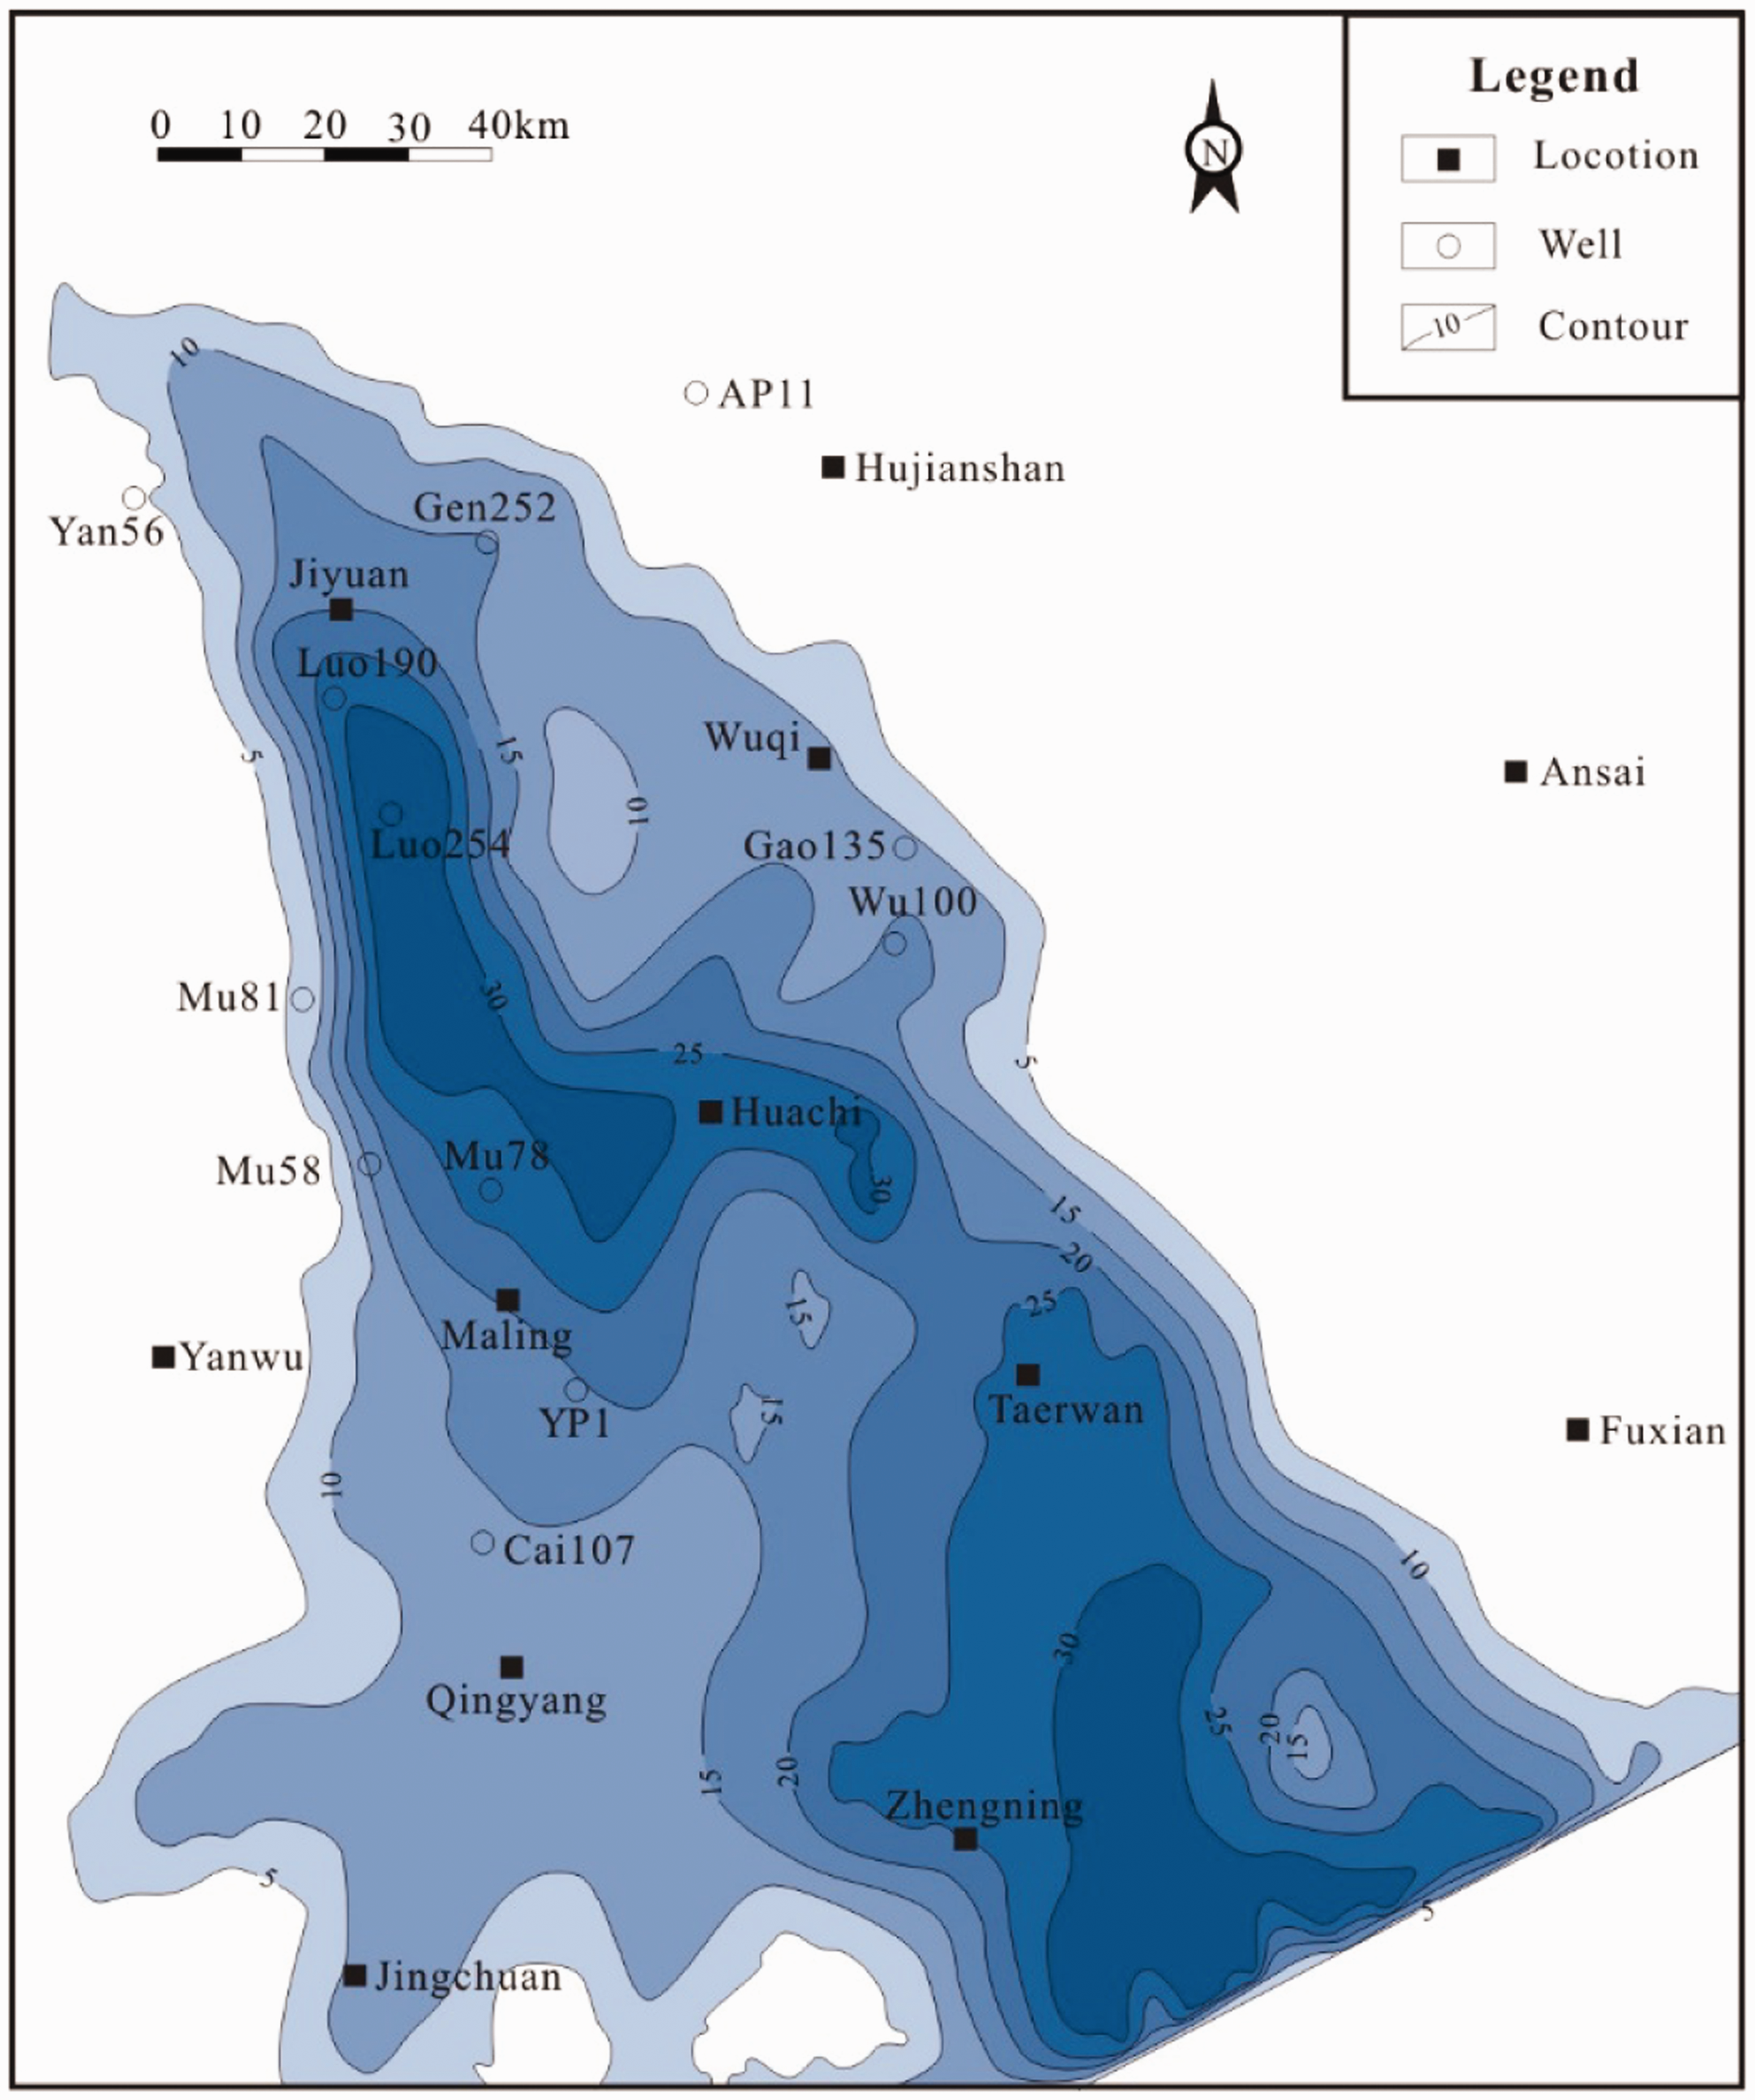
Thickness contour map of Chang 7 Shale (Unit: m).
TOC contour map of Chang 7 Shale (Unit: %).
Organic geochemical features
The shale burial depth (base of the Chang 7) ranges between 600 and 2900 m, with the maximum depth in Jiyuan—Huanxian at more than 2500 m, but smaller at less than 1400 m in the southeastern basin, the east of Zhengning. The Ro of the shale (base of the Chang 7) ranges from 0.5% to 1.3%, reaching the largest value of over 1.2% in the west of Jiyuan in the northwest Ordos Basin and dropping to less than 0.7% near Zhengning in the southeast (Figure 9).
Ro contour map of Chang 7 Shale base (Unit: %).
Among 395 samples, 299 samples have the maximum S1 content of 16 mg HC/g rock and an average S1 content of 2.4 mg HC/g rock. Only 96 samples have S1 values below 0.5 mg HC/g rock. The S1 and TOC show good positive correlation, with a multiple correlation coefficient of 0.64 (Figure 10).
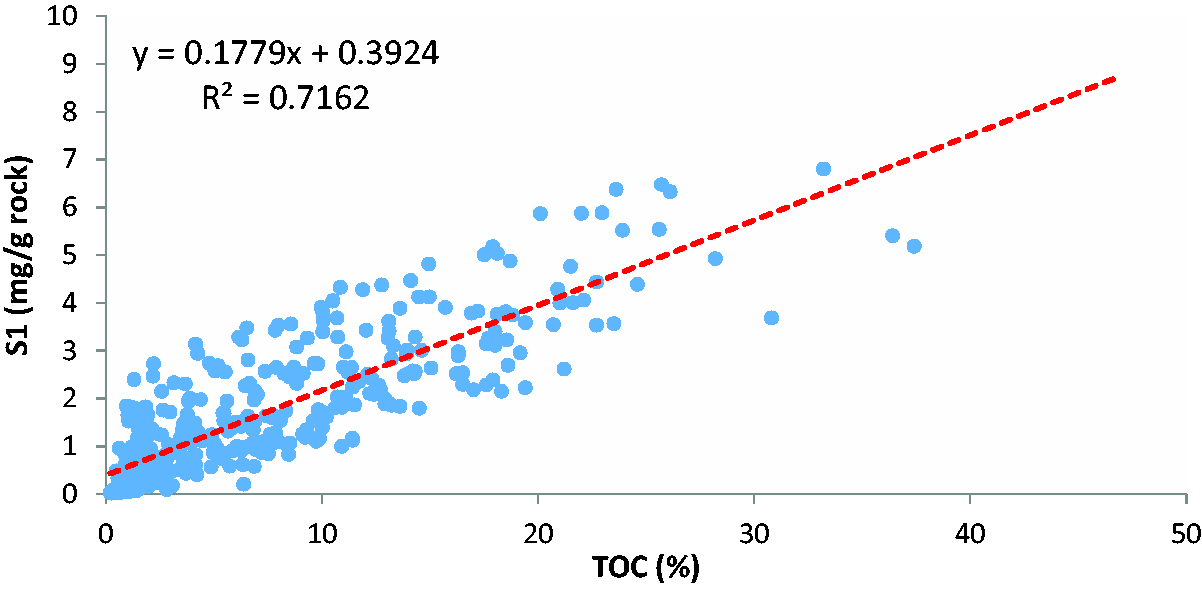
Relationship between S1 and TOC of Chang 7 Shale.
Estimating TOY and MOY of the Chang 7 Shale
Table 6 shows part of the Rock-Eval data of 200 shale samples from the Chang 7. The S1 values range from 0.30 to 6.81 mg/g rock and average 1.99 mg/g (Table 6).
Rock–Eval data, ΔS2eq, S1LOSS, TOY, and MOY of the Chang 7 Shale.
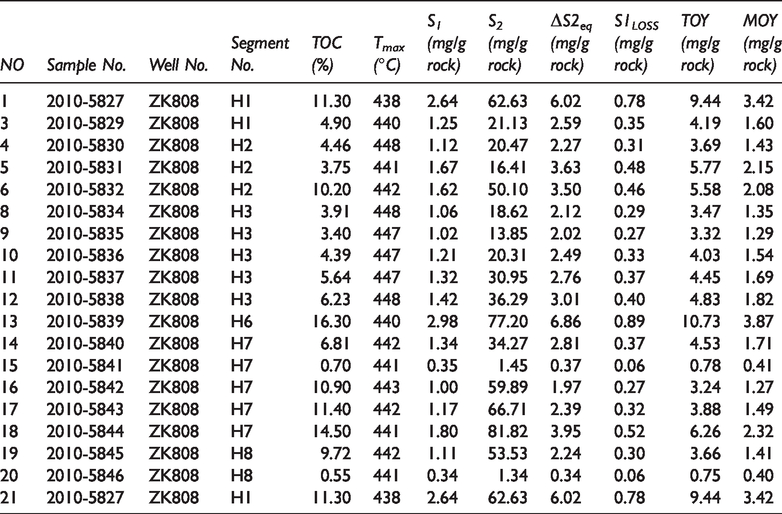
The estimated results using the method in this paper (a = 2.4685, b = –0.4958, ks1 = 0.09) are listed below. The ΔS2eq values range from 0.24 to 16.13 mg/g rock, with an average of 4.42 mg/g rock (Table 6), and S1LOSS values range from 0.05 to 2.08 mg/g rock, with an average of 0.58 mg/g rock (Table 6). TOY values range from 0.59 to 25.21 mg/g rock, with an average of 6.98 mg/g rock (Table 6). MOY values range from 0.35 to 8.89 mg/g rock, with an average of 2.57 mg/g rock (Table 6).
Based on the above data, the following conclusions are reached. The average S1LOSS/the average S1 = 0.58/1.99 = 29.15%, indicating that the evaporative hydrocarbon loss accounts for approximately 29% of S1. The average of MOY/the average of TOY = 2.57/6.98 = 36.82%, indicating that the MOY accounts for approximately 37% of TOY. The average TOY/average S1 = 6.98/1.99 = 3.51, indicating that the TOY is approximately 3.5 times larger than S1.
Data fitting shows that there are linear relationships between TOY, MOY, and TOC (Figure 11(a) and (b)) as below


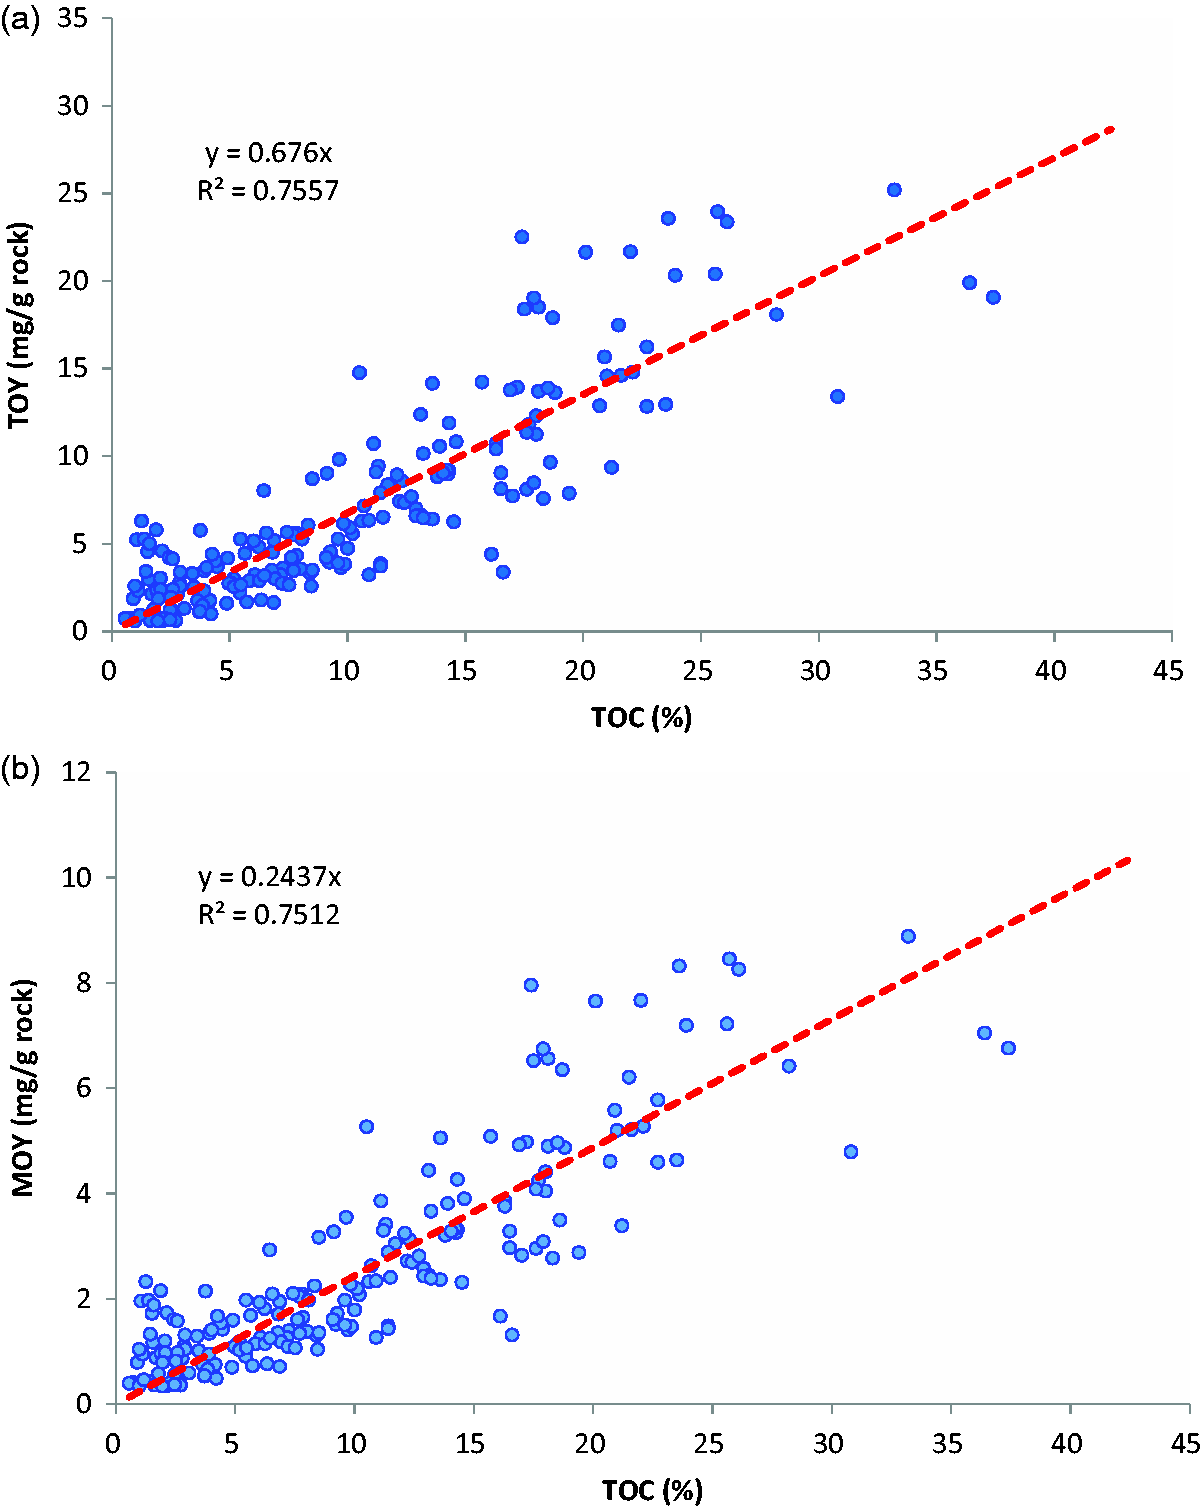
Relationships between TOY, MOY, and TOC of the Chang 7 Shale: (a) total oil; (b) movable oil.
Resource potential of the Chang 7 Shale oil
For our estimations, we assume that shale thickness is greater than 5 m, and TOC is greater than 3%. According to the above two assumptions, the evaluation area has an effective area of 32789 km2 and average shale thickness of 18.45 m. The evaluation area was divided into 13,280 evaluation units (divided automatically by computer). Combined with the TOC content distribution map (Figure 8), the TOY and MOY of each evaluation unit and its corresponding resource abundance were calculated by equations (30) and (31) (Figure 12(a) and (b)).
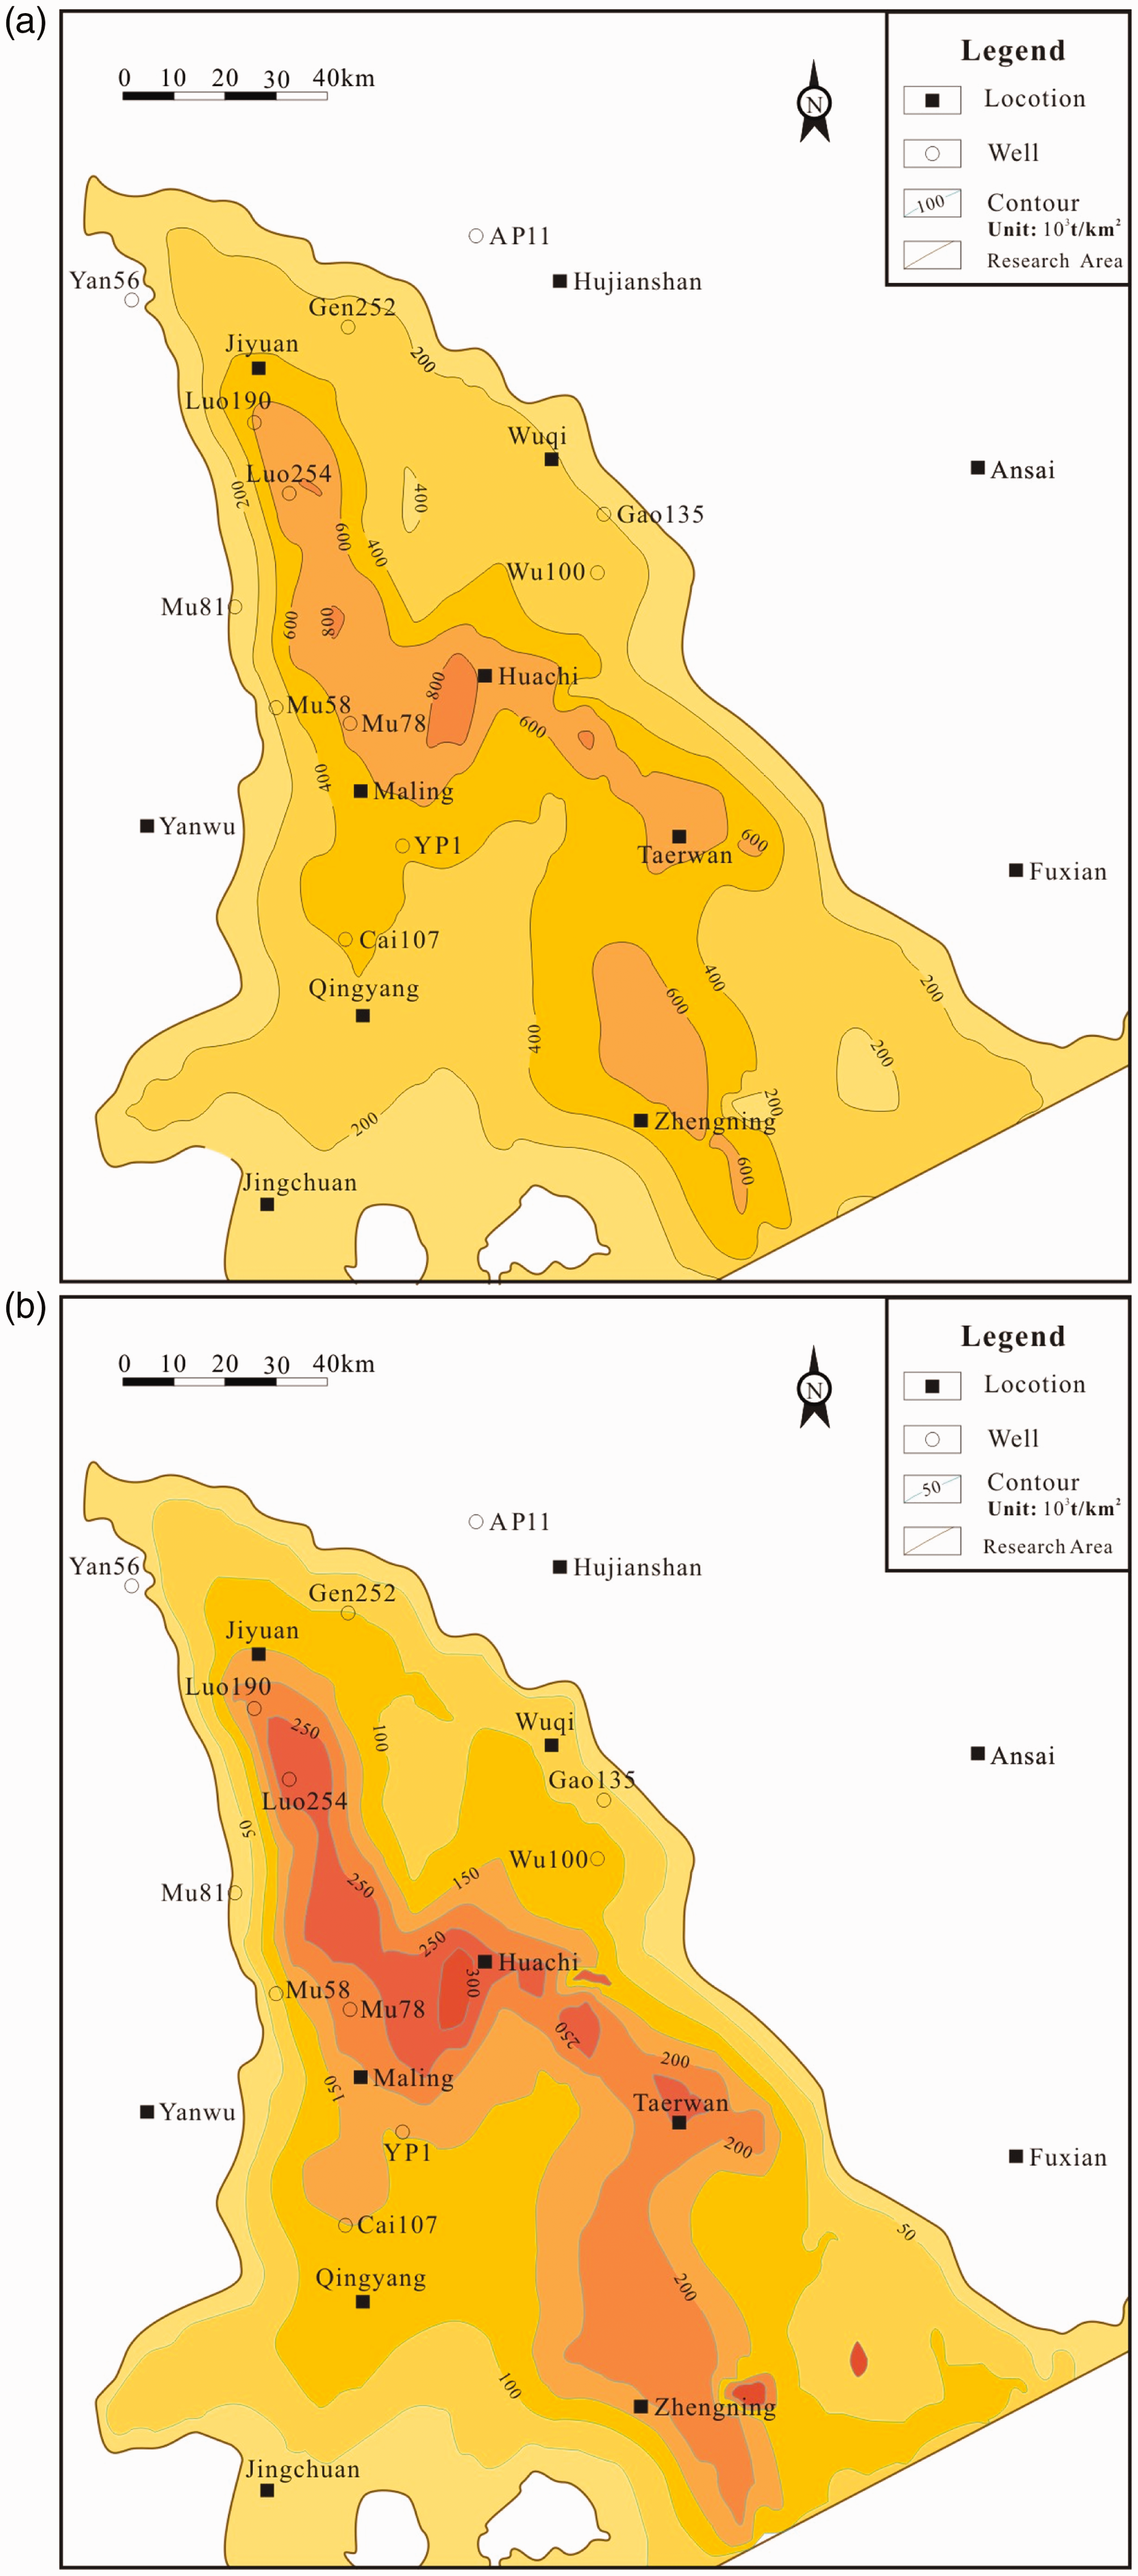
Resource abundance of shale oil in-place in Chang 7 (Unit: 103 t/km2).
According to the statistics, the total shale oil in place was 11.12 × 10⁹ t, with an average resource abundance of 339 × 103 t/km2 and maximum resource abundance of 930 × 103 t/km2 (Figure 12(a)). The movable oil was 4.01 × 10⁹ t, with an average resource abundance of 122 × 103 t/km2 and maximum resource abundance of 337 × 103 t/km2 (Figure 12(b)). Taking the movable oil resource abundance of greater than 200 × 103 t/km2 as the boundary of core area, the core area predicted was 5535 km2, with movable oil of 1.31 × 10⁹ t, and was mainly distributed in Well Luo254—Well and Mu78 well—Huachi–Taerwan–Zhengning (Figure 12(b)).
Conclusions
The paper has proposed an evaluation method for heterogeneous shale samples to correct the TOC difference and improve the adsorbed oil calculation method, which can make the calculation results of mobile oil and total oil more accurate. Evaluation of shale samples from 29 Qianjiang Formation and 32 Shahejie Formation samples reveals that the mean values of ΔTOC are 0.16 and 0.34%, and ΔS2eq–ΔS2 have average values of 0.85 and 0.84 mg/g, respectively. This demonstrates that the equivalent TOC correction is very necessary. A calculation method of evaporative hydrocarbon recovery coefficient based on the formation volume factor has been proposed. The calculated S1LOSS of 200 shale samples from the Chang 7 by the above method indicates that the evaporative hydrocarbon loss accounts for 29% of S1. The estimated results of the Chang 7 Shale using the method in this paper show: (a) ΔS2eq average of 4.42 mg/g rock, S1LOSS average of 0.58 mg/g rock, TOY average of 6.98 mg/g rock, MOY average of 2.57 mg/g rock; (b) MOY accounts for 37% of TOY, and TOY is approximately 3.5 times of S1; (c) total oil in-place and the maximum movable oil in-place were 11.12 × 10⁹ t and 4.01 × 10⁹ t, respectively, revealing its tremendous exploration potential.
Footnotes
Acknowledgements
Careful reviews and constructive suggestions of the manuscript by anonymous reviewers are also greatly appreciated.
Declaration of conflicting interests
The author(s) declared no potential conflicts of interest with respect to the research, authorship, and/or publication of this article.
Funding
The author(s) disclosed receipt of the following financial support for the research, authorship, and/or publication of this article: This work is supported by the National Science & Technology Major Project “Distribution Law & Resource Evaluation of Deep Oil & Gas in Petroleum-bearing Basins in China” (2017ZX05008-006); PetroChina Key Scientific & Technological Project of “Study on Mechanism, Distribution & Resource Potential of Continental Shale Oil Reservoirs in China” (2019E-2601) and “Enrichment rules & key technologies of large and medium-sized litho-stratigraphic reservoirs” (2019B-0301).