
Abstract
We investigate the productivity and product selectivity of diverse thermal in situ upgrading processes in oil shale reservoirs. In situ upgrading processes applying the ideas of Shell In situ Conversion Process, ExxonMobil Electrofrac, and Texas A&M Steamfrac are simulated by using sector models with the assumption of symmetric patterns. In-house fully functional simulator is used, which has been developed for the kerogen pyrolysis and hydrocarbon production. In the simulation cases, sensitivity analyses to the factors having major influence on the productivity and product selectivity are conducted. The effects of the temperature of vertical heaters, the spacing of hydraulic fractures, and the position of horizontal production wells are analyzed in the applied In situ Conversion Process, Electrofrac, and Steamfrac, respectively. In the applied In situ Conversion Process cases, hydrocarbon production increases with the increasing heater temperature. In the applied Electrofrac cases, hydrocarbon production increases with the increasing spacing of hydraulic fractures, even though longer time period for the process is needed. In the applied Steamfrac cases, the case of production well located at the same depth to the injection well shows the least hydrocarbon production. Among the processes, the applied In situ Conversion Process cases show the highest weight percentage of total hydrocarbon components in the produced fluid, and the applied Electrofrac cases follow it. The applied Steamfrac cases show far lower weight percentage of hydrocarbon production than the other methods. In terms of the mass ratio of produced hydrocarbon to decomposed kerogen, the applied Steamfrac cases show the largest value among the processes by aqueous phase sweeping liquid organic phase, but they also show the huge water oil mass ratio by the continuous injection of hot water. All the applied In situ Conversion Process cases and the Electrofrac case with the short spacing of hydraulic fractures show good heating efficiency by decomposing whole kerogen in the system.
Introduction
Oil shale is a sedimentary rock that contains solid hydrocarbon called kerogen. Kerogen generates a number of solid and fluid components including hydrocarbons when it is heated to a high temperature above 563 K. Oil shale is a promising energy source, regarding that the rich oil shale is expected to yield 2.6 trillion barrels of oil in worldwide (Crawford et al., 2008). The success likelihood of hydrocarbon production from oil shale reservoirs is closely tied to the efficiency and the effectivity of a thermal process.
In situ upgrading processes, which can be applied to all formation depths unlike the mining and subsequent surface pyrolysis, is the practical method of heating the oil shale. Besides their applicability, in situ upgrading processes have a few advantages over the mining and subsequent surface pyrolysis, such as the easier handling of materials, less water requirements, less waste disposal, and reduced emissions of pollutants (Crawford and Killen, 2010). There still exist considerations for the application of in situ upgrading processes; excess heat should be avoided for better shale oil quality and higher recovery efficiency; natural or induced fracture systems are needed for the effective distribution of heat, because shale is not a good conductor; longer heating time is needed than the mining and subsequent surface pyrolysis; effective means for sweeping the generated hydrocarbon are needed (Crawford and Killen, 2010).
In this study, we examine the effects of factors on the productivity, product selectivity, and process efficiency of the diverse in situ upgrading technologies in the oil shale reservoir system by conducting numerical simulations. We investigate the in situ upgrading methods applying the ideas of Shell In situ Conversion Process (ICP; Vinegar, 2006), ExxonMobil Electrofrac (Symington, 2006), and Texas A&M Steamfrac (Thoram and Ehlig-Economides, 2011). From the simulations, we examine the effect of heating element geometry by comparing ICP and Electrofrac, and the effect of heating material by comparing Electrofrac and Steamfrac.
ICP method involves the heating process using multiple vertical electric heaters in a hexagonal pattern as shown in Figure 1 (Vinegar, 2006). Heat is transferred from the heaters to the oil shale formation by conduction. As kerogen decomposes, vertical production wells, which are located in the centers of the hexagons, produce converted fluids. Because heat is transferred mainly by conduction in this method, a number of heaters and producers are drilled in a small area to efficiently and timely produce the converted fluid while avoiding the cracking of liquid hydrocarbons. The pressure increases by the temperature increase and subsequent fluid expansion will be a significant driving force for the production in such systems where heaters are densely installed.
Concept of ICP method.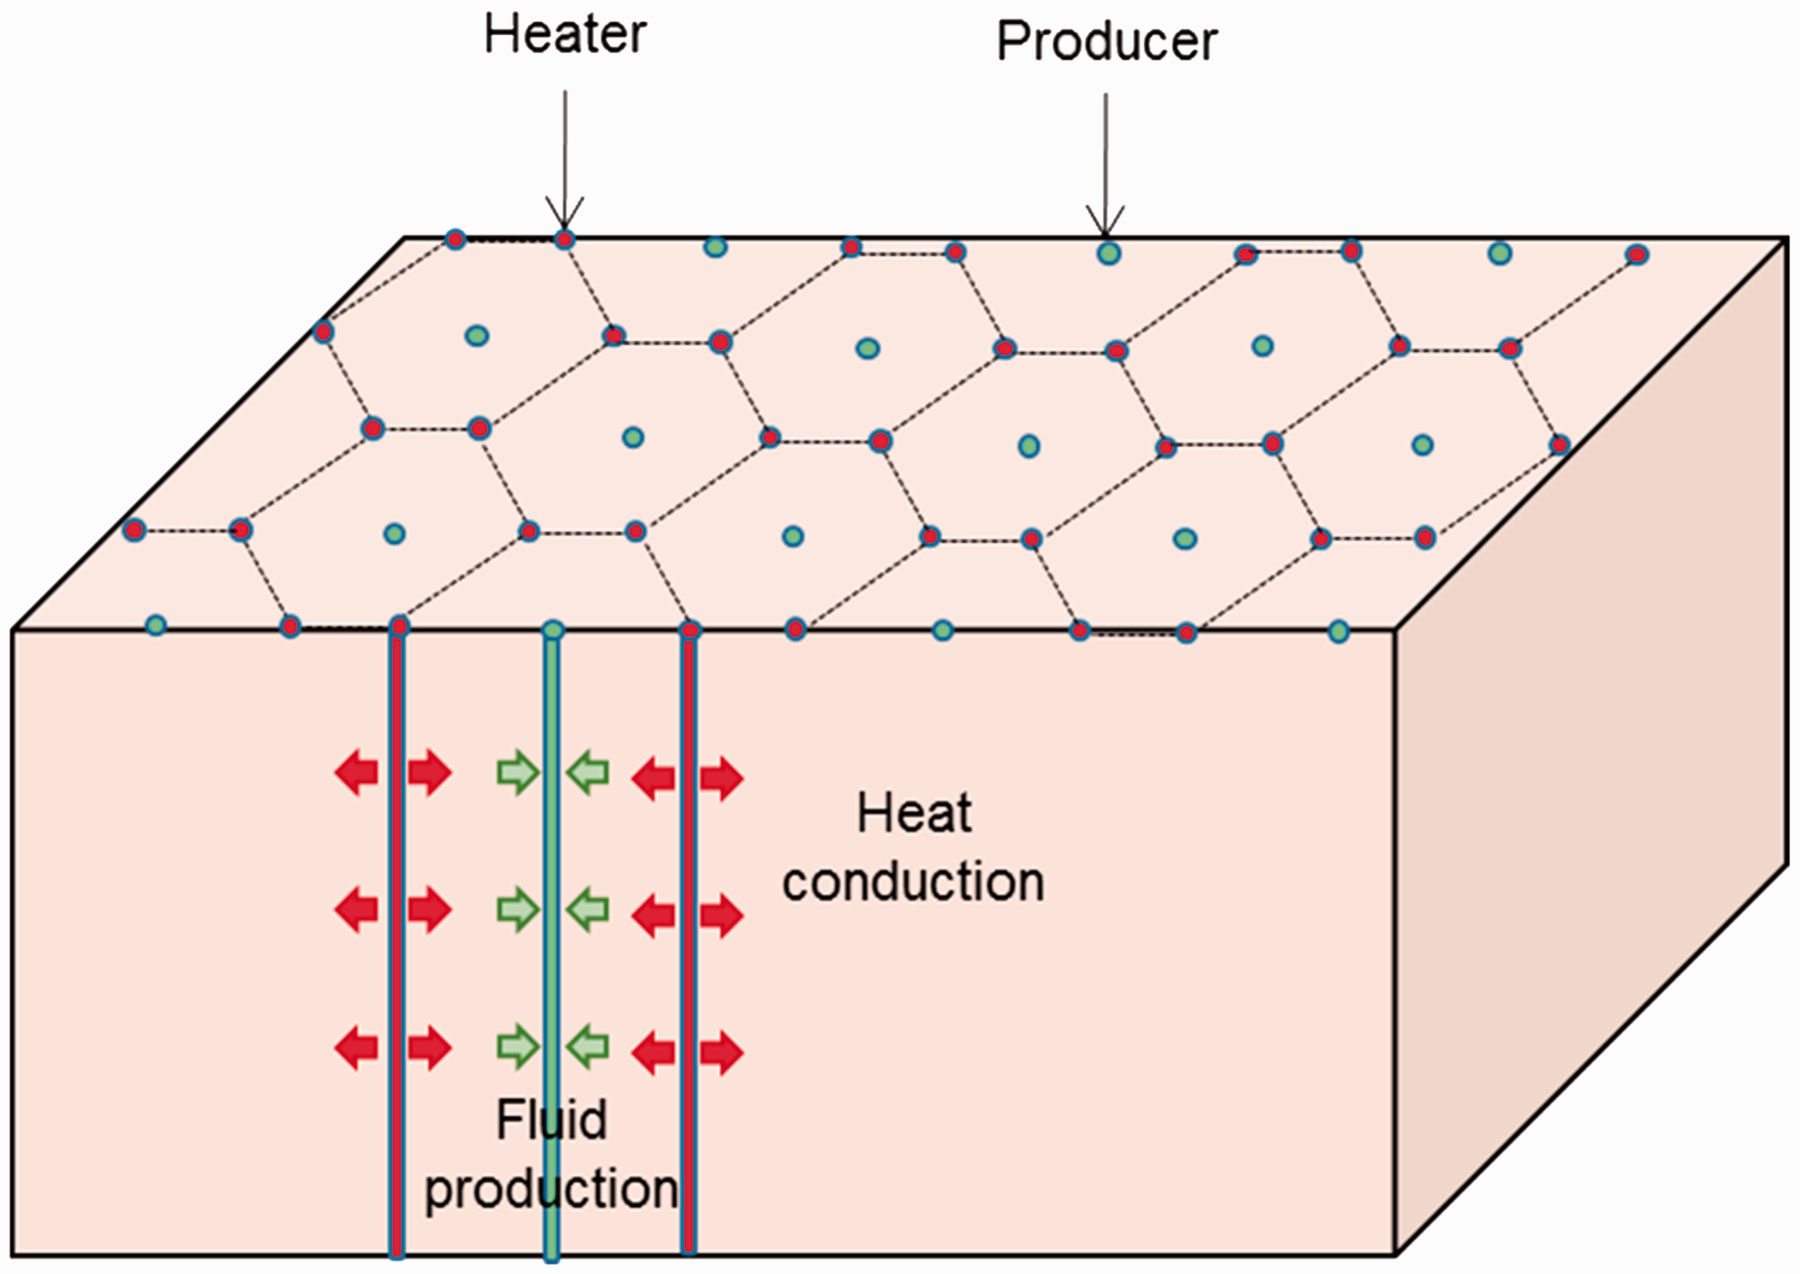
Electrofrac method uses a hydraulic fracture propped with electrical conductive material, so that it can transfer heat to the oil shale formation linearly from the heated hydraulic fracture (Symington, 2006). Calcined petroleum coke or steel shot can be used for the electrical conductive proppant (Symington, 2006). The concept of the Electrofrac is provided in Figure 2. This method is applicable in large reservoir systems by using a multilateral horizontal well. Here, each horizontal well contains a longitudinal hydraulic fracture. The fluid generated from the kerogen decomposition is produced by the vertical wells drilled between the hydraulic fractures. Because the heat is mainly transferred into the oil shale formation by conduction as the ICP method, the dimensions and geometry of hydraulic fractures are expected to significantly affect the process efficiency and productivity.
Concept of Electrofrac method.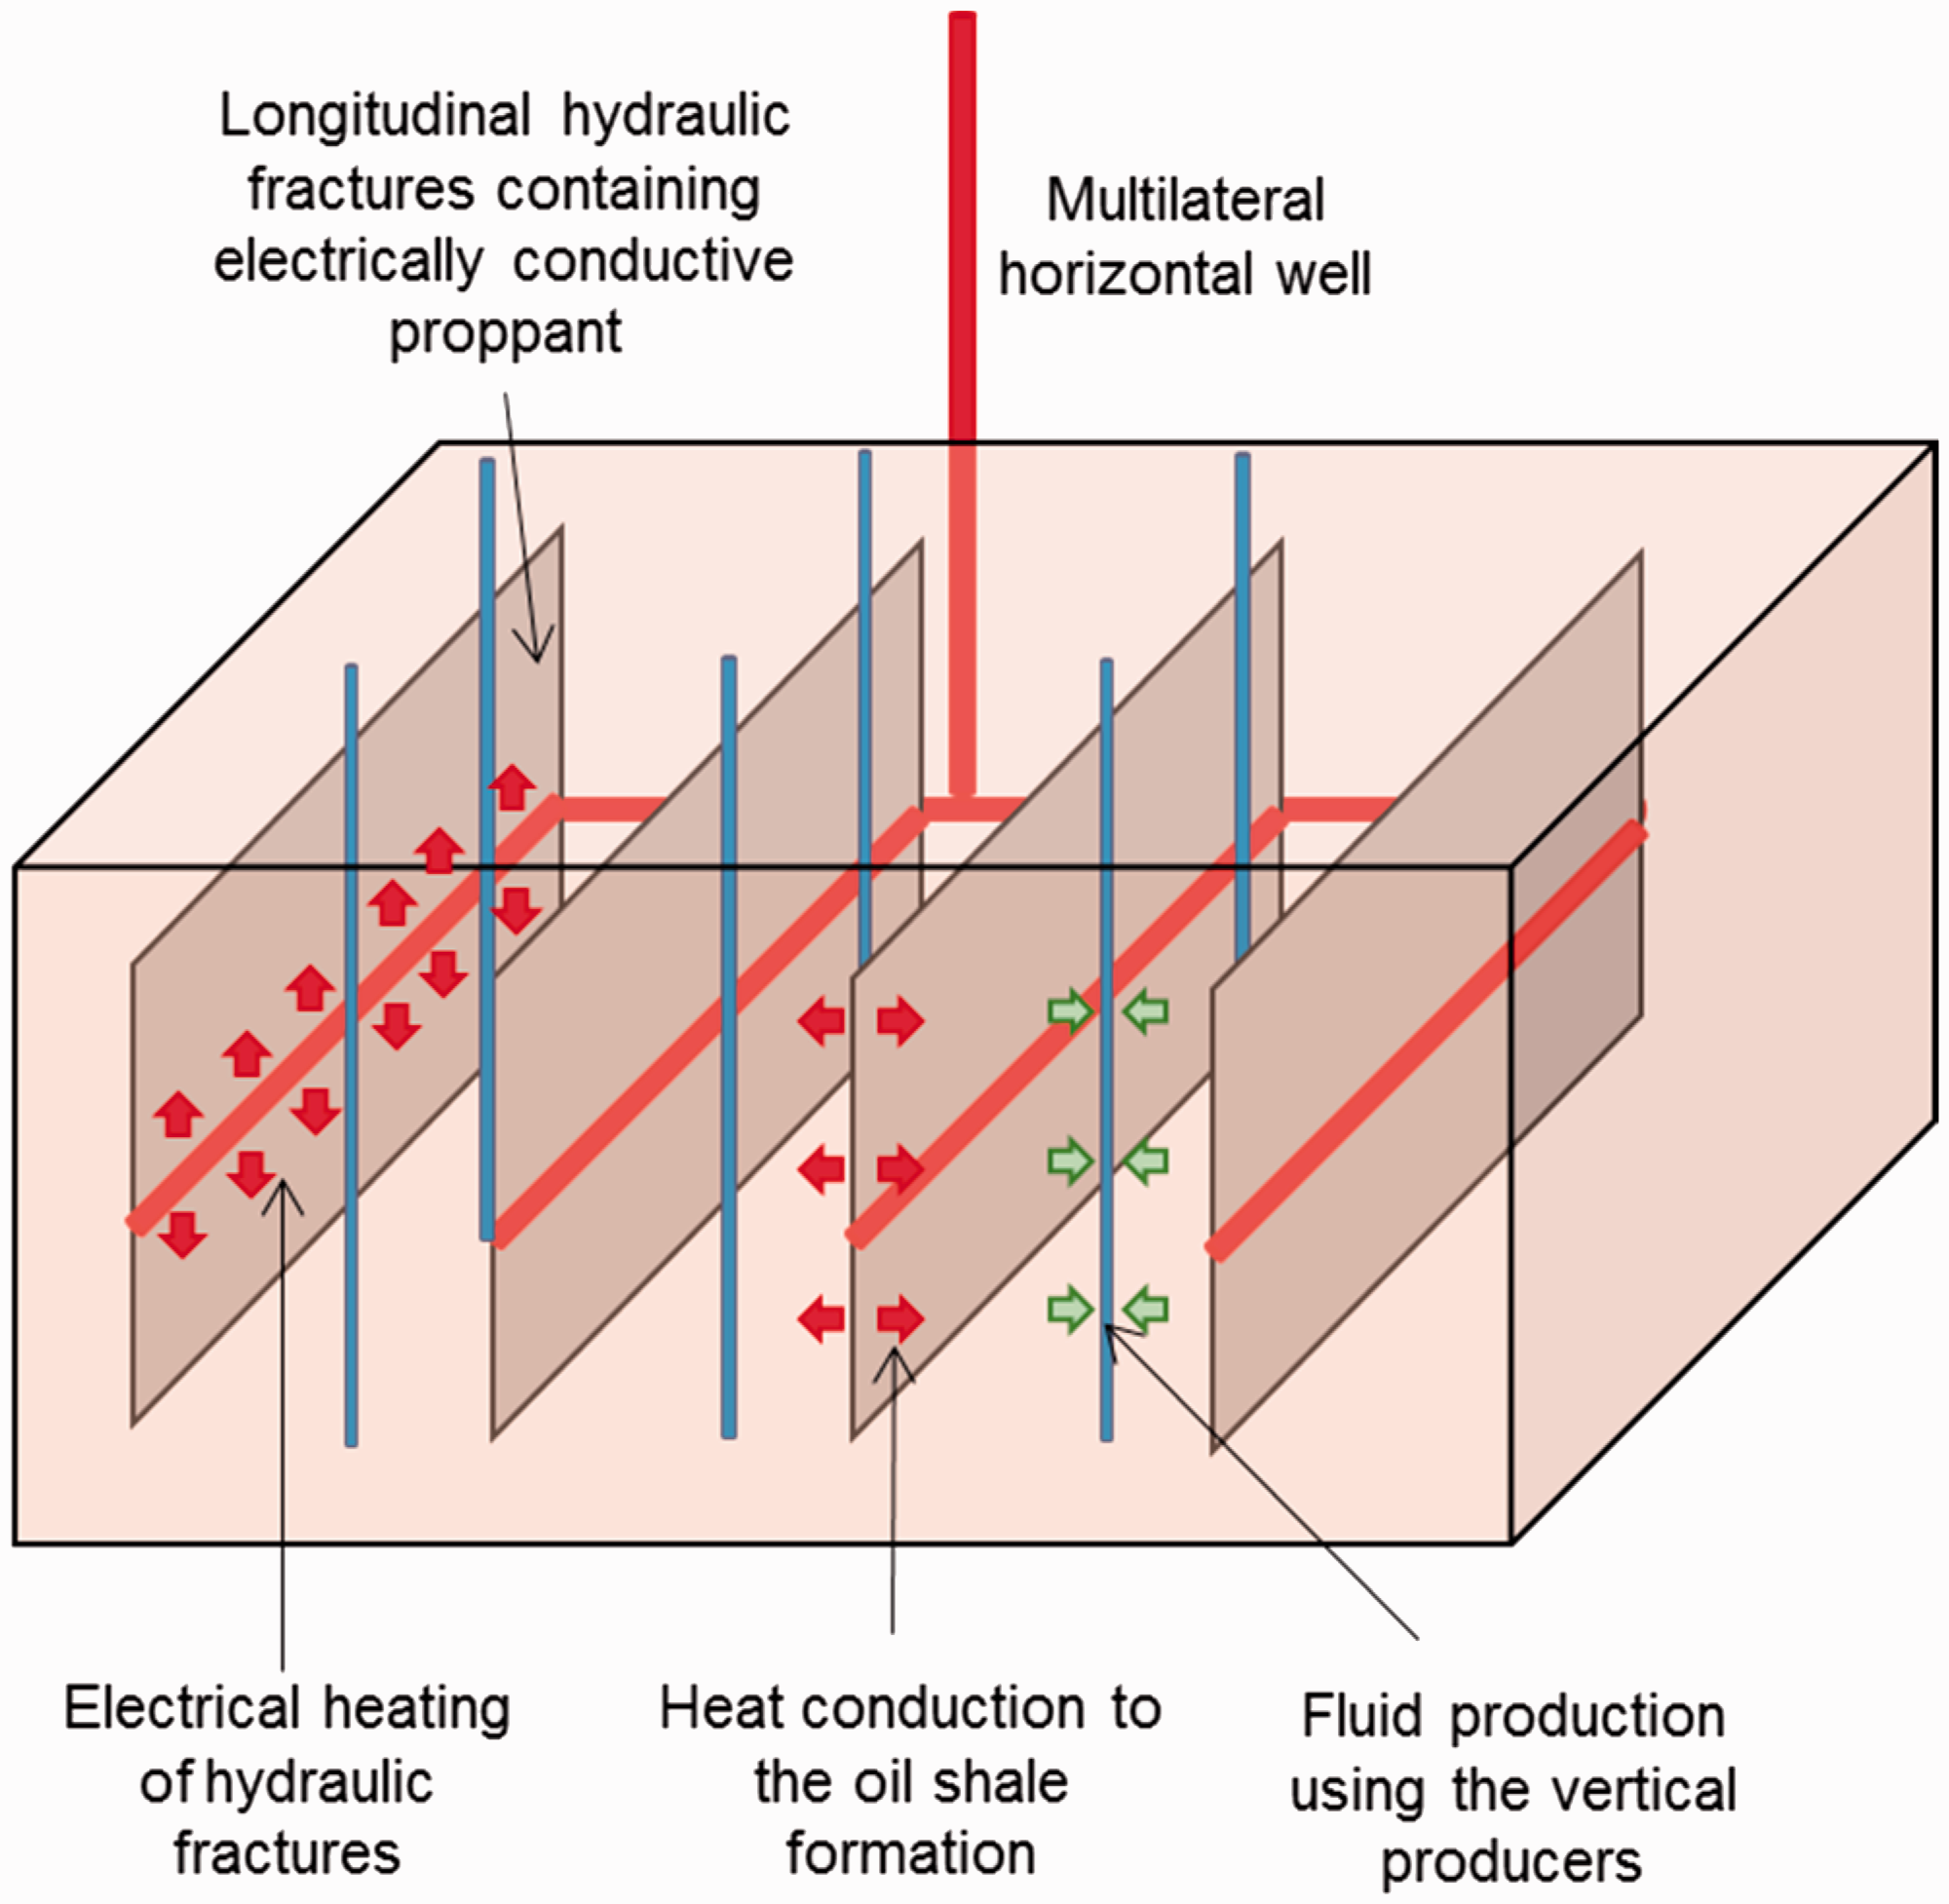
Steamfrac method involves steam or hot water injection into the horizontal well system containing multiple vertical hydraulic fractures as shown in Figure 3 (Lee, 2014; Thoram and Ehlig-Economides, 2011). Three horizontal wells are involved in this method; one horizontal well is drilled, and hydraulic fractures are made; then two additional horizontal wells are drilled at the edges of the reservoir to produce the fluids generated from the kerogen decomposition. Injected water component presents as steam (gaseous phase) or hot liquid water (aqueous phase) according to the pressure and temperature of the reservoir system. In many cases, it presents as aqueous phase by a high reservoir pressure. Because the injected hot water can flow through the preexisting fracture network as wells as the horizontal wells and hydraulic fractures, heat is transferred by convection as well as conduction.
Concept of Steamfrac method.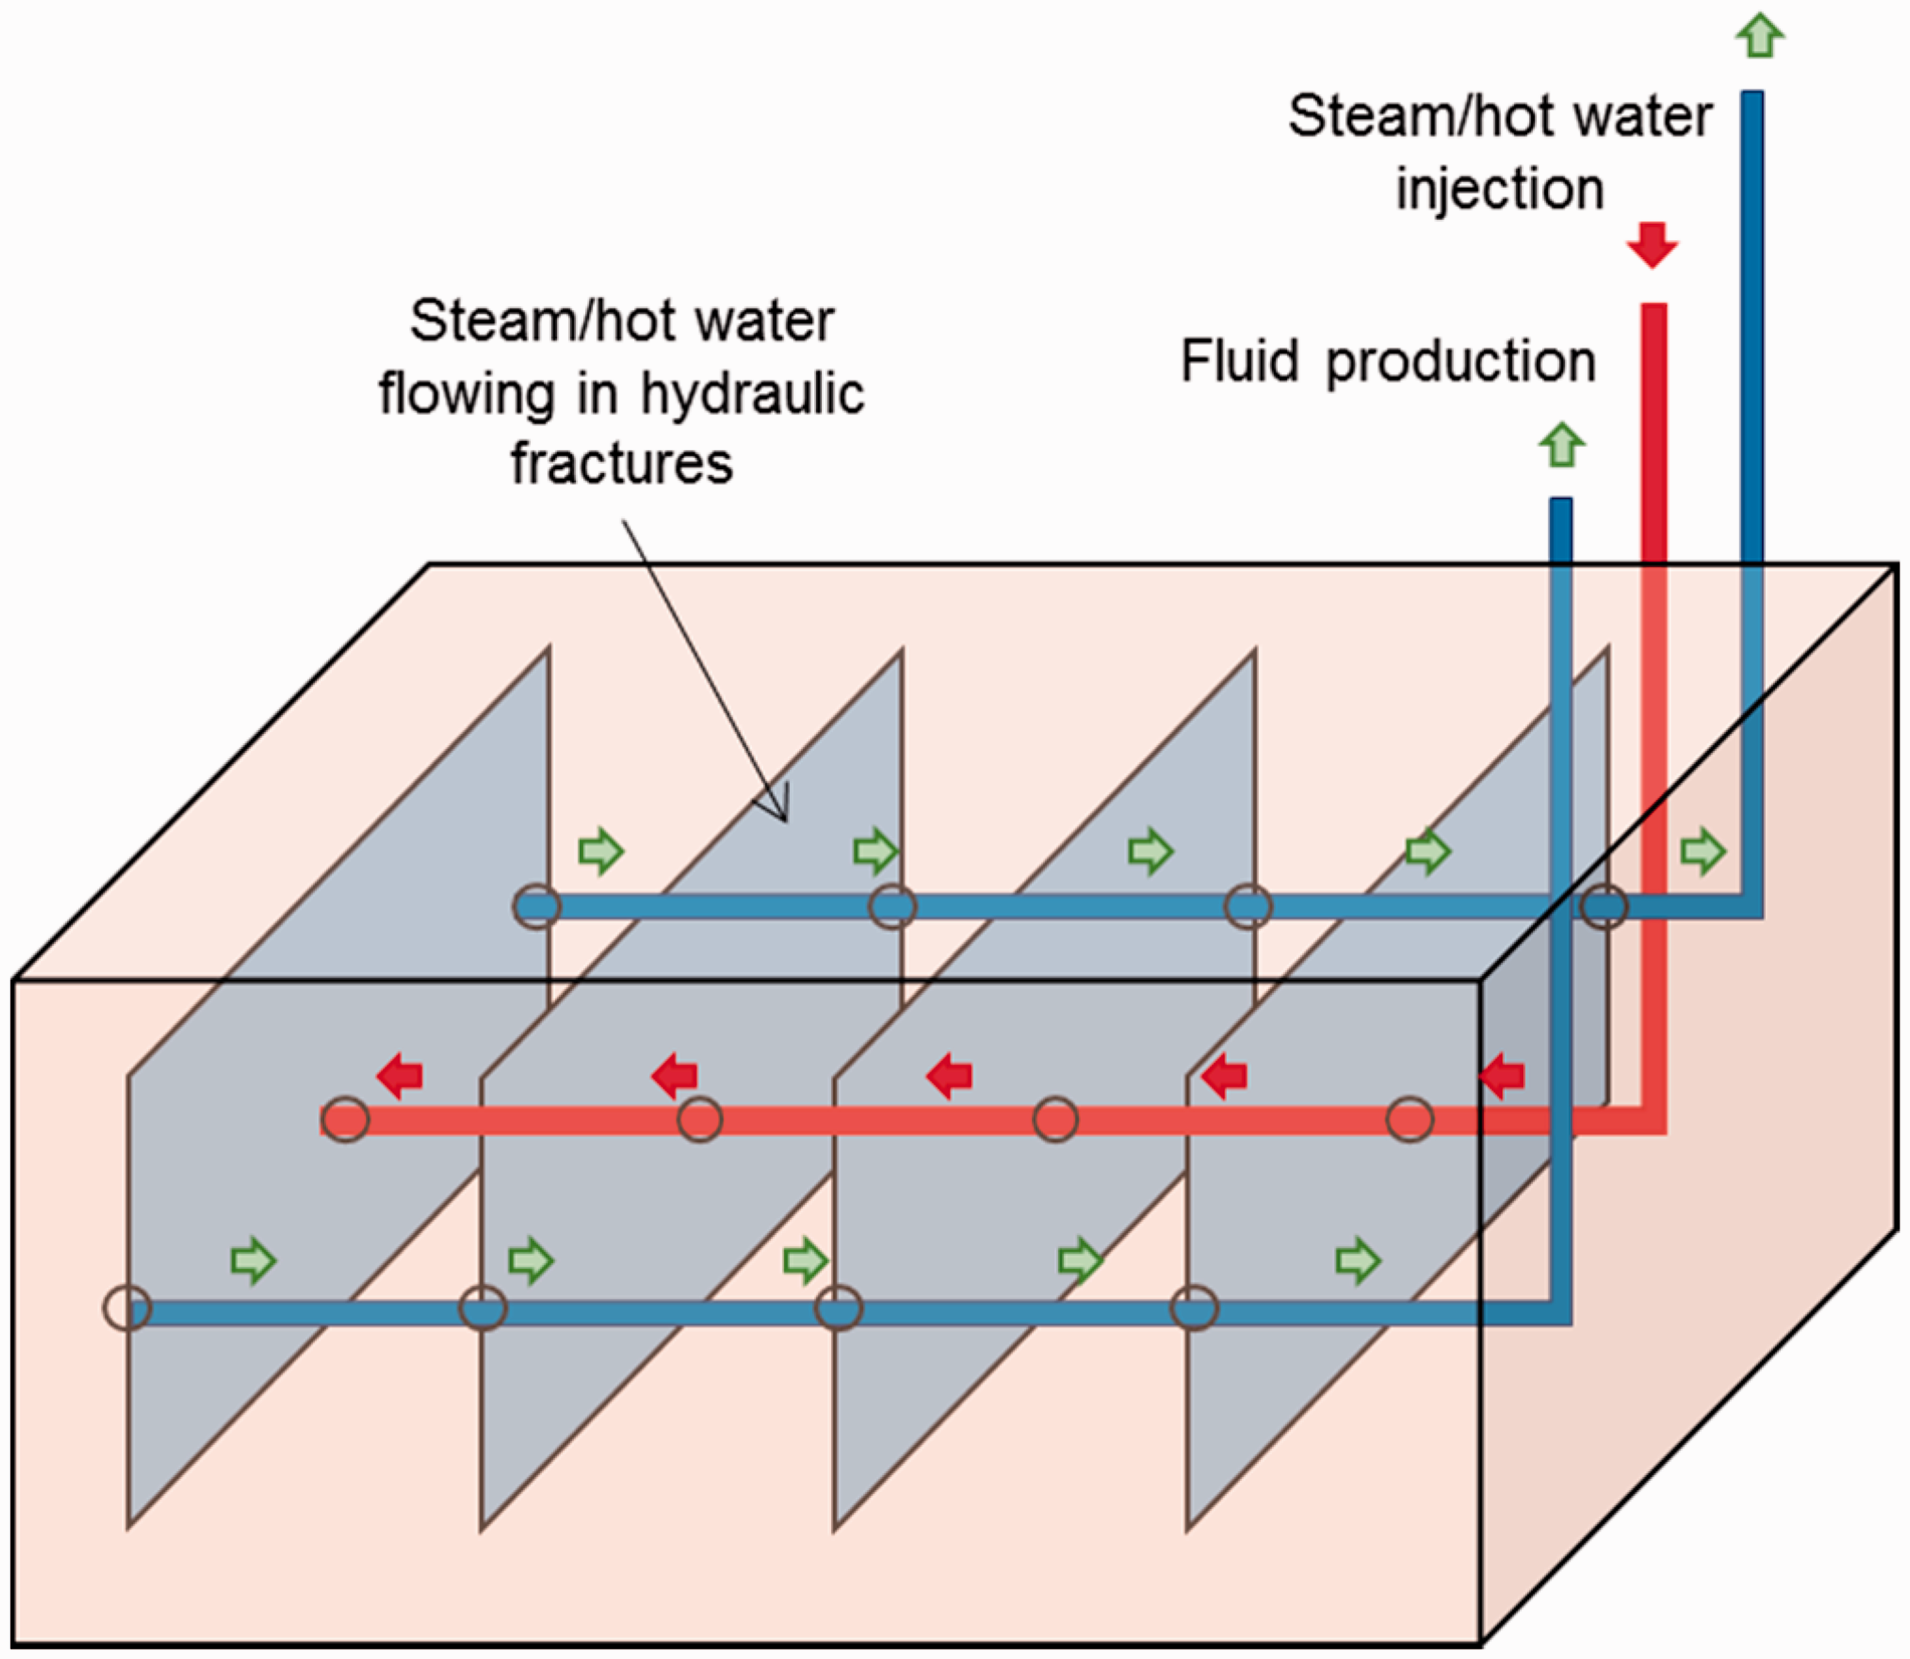
There are a few simulation works on the numerical simulations of ICP, Electrofrac, and Steamfrac methods. Shell has been actively conducted research to expect the heating efficiency and production behavior using the ICP method in the oil shale system of Green River Formation (Fowler and Vinegar, 2009; Shen, 2009; Vinegar, 2006). In the application of ICP method, the pattern, temperature, and spacing of heating wells have been analyzed by using a non-fractured and high permeable reservoir model (Fan et al., 2010). In the previous simulation studies of Electrofrac method, the effects of hydrostatic pressure (Symington et al., 2010), effective stress (Symington et al., 2010), thermal conductivity of proppant (Lee, 2014) have been estimated. In the previous study of Steamfrac, the effects of the number of horizontal wells and injection strategy have been analyzed (Lee, 2014). A simplified economics evaluation of each in situ upgrading method has been conducted by assuming fixed and operating cost (Lee, 2014). It has revealed that the Steamfrac method was feasible in reservoirs with large volume.
In this study, we conduct the numerical simulations by applying the ideas of ICP, Electrofrac, and Steamfrac to examine the production behavior and process efficiency, which are sensitive to the implementation details of thermal processes. In the simulations, a fully functional simulator developed to describe the production behavior and system response during the in situ upgrading processes is used (Lee et al., 2016). In the sensitivity analysis in each process, the factor affecting the productivity and heating efficiency is examined. The factors are significant to the production of phases and components by controlling chemical reactions, heat conduction, and transport properties of fluids and porous media.
Model description
Summary of the simulator
The simulator has been built on FTSim, which has the built-in capability to simulate the fluid flow in porous media (Lee et al., 2016). FTSim is a variant of the TOUGH + code of Lawrence Berkeley National Laboratory (Moridis, 2014). The all known physical and chemical phenomena of kerogen pyrolysis have been described in the developed simulator (Lee et al., 2016).
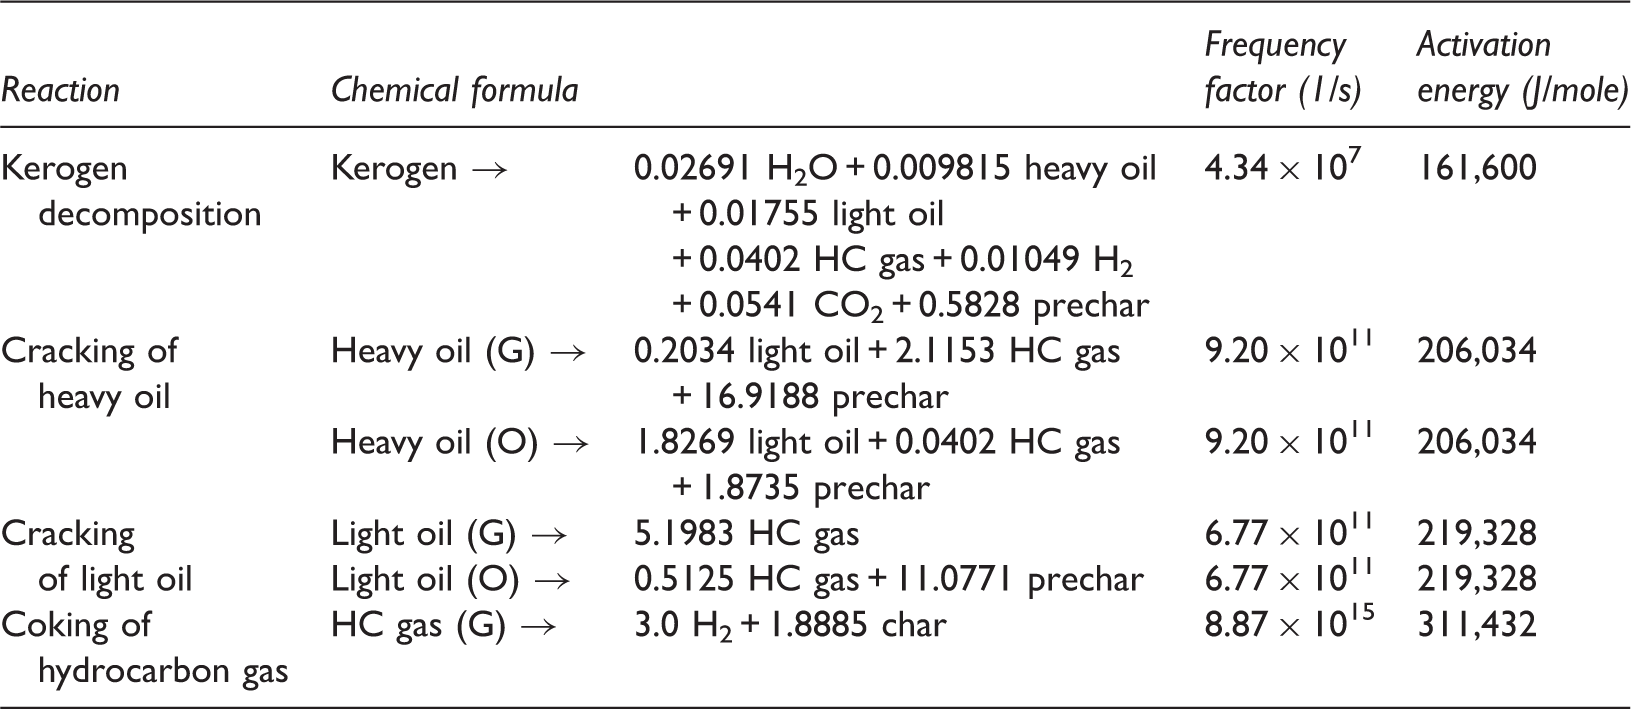
Formulae and parameters of the kinetic reactions of kerogen pyrolysis (Wellington et al., 2005).
Including nitrogen, the simulator handles the system of 10 components and 4 phases. Ten components include seven fluid components—water, heavy oil, light oil, hydrocarbon gas, hydrogen, carbon dioxide, and nitrogen—and three solid components—kerogen, prechar, and char. Four phases include three fluid phases—aqueous, liquid organic, and gaseous phases—and one solid phase. The system is either in the single phase state or in the multiphase equilibrium state, and transition between the states occurs according to the evolution or disappearance of phases. The phase evolution and disappearance are found based on the equations of state to compute the vapor pressure of liquid phases and the solubility of gas components. In our simulation cases, solid kerogen and aqueous phase present initially, and liquid organic phase, gaseous phase, and solid products of prechar and char are generated as kerogen decomposes.
The thermophysical properties of phases and the transport properties of mobile phases are computed considering the fractions of individual components distributed in the phases. To compute the properties of individual components, diverse equations of state are used. Then the mixing rule and the effect of pressure above the vapor pressure are applied. In this process, the dynamic change of phase properties as a function of system pressure, temperature, and phase composition is accurately described. Details of the computation methods can be found from the work of Lee et al. (2016).
As kerogen decomposes, and the fluid and solid products are generated, the effective porosity and the absolute permeability of porous media change every moment. From the porosity and permeability data of the Green River Formation, the effective permeability increases from 0 to 6.908 × 10⁻¹⁵ m2 as the effective porosity evolves from 0 to 0.25. The simulator computes the effective porosity by accounting for the amount of solid phase in the pores, and assigns corresponding absolute permeability. It accounts for the media deformation by applying the thermo-poro-mechanics effect, and computing the evolution of effective porosity, as the system pressure and temperature change. It also accordingly computes the increasing heat convection flow with increasing effective porosity and permeability. The simulator computes the relative permeability of fluid phases and capillary pressure in the multiphase equilibrium states by using appropriate functions for two-phase or three-phase systems (Lee et al., 2016).
The simulator computes 11 simultaneous equations of mass and energy balance per element in finite volume domains, because the system involves heat and 10 mass components. The equations of mass conservation and energy conservation are transformed into residual equations. Then the Jacobian matrix is constructed to solve the matrix equation in a fully implicit method. The matrix equation can be solved only by the fully implicit method, because of its nonlinearity due to the drastic changes of mass and energy caused by the chemical reactions. Newton–Raphson method is used to compute solutions of the matrix equations.
Many oil shale reservoirs contain preexisting fracture networks, which significantly affect the flows of heat and fluid in the system. The simulator is designed to describe the fractured porous media by using Multiple Interacting Continua (MINC) method (Pruess, 1985). It divides the primary grids into the multiple homocentric secondary grids to describe the nested fracture and matrix domains. In our study, we use the two secondary grids per primary grid and assigned fracture domain and matrix domain to the outer grid and the inner grid, respectively. Global flows of heat and flow occur in the fracture domain network, while the local flows occur between the outer fracture domain and the inner matrix domain.
Governing equations
Mathematical equations of the simulation.
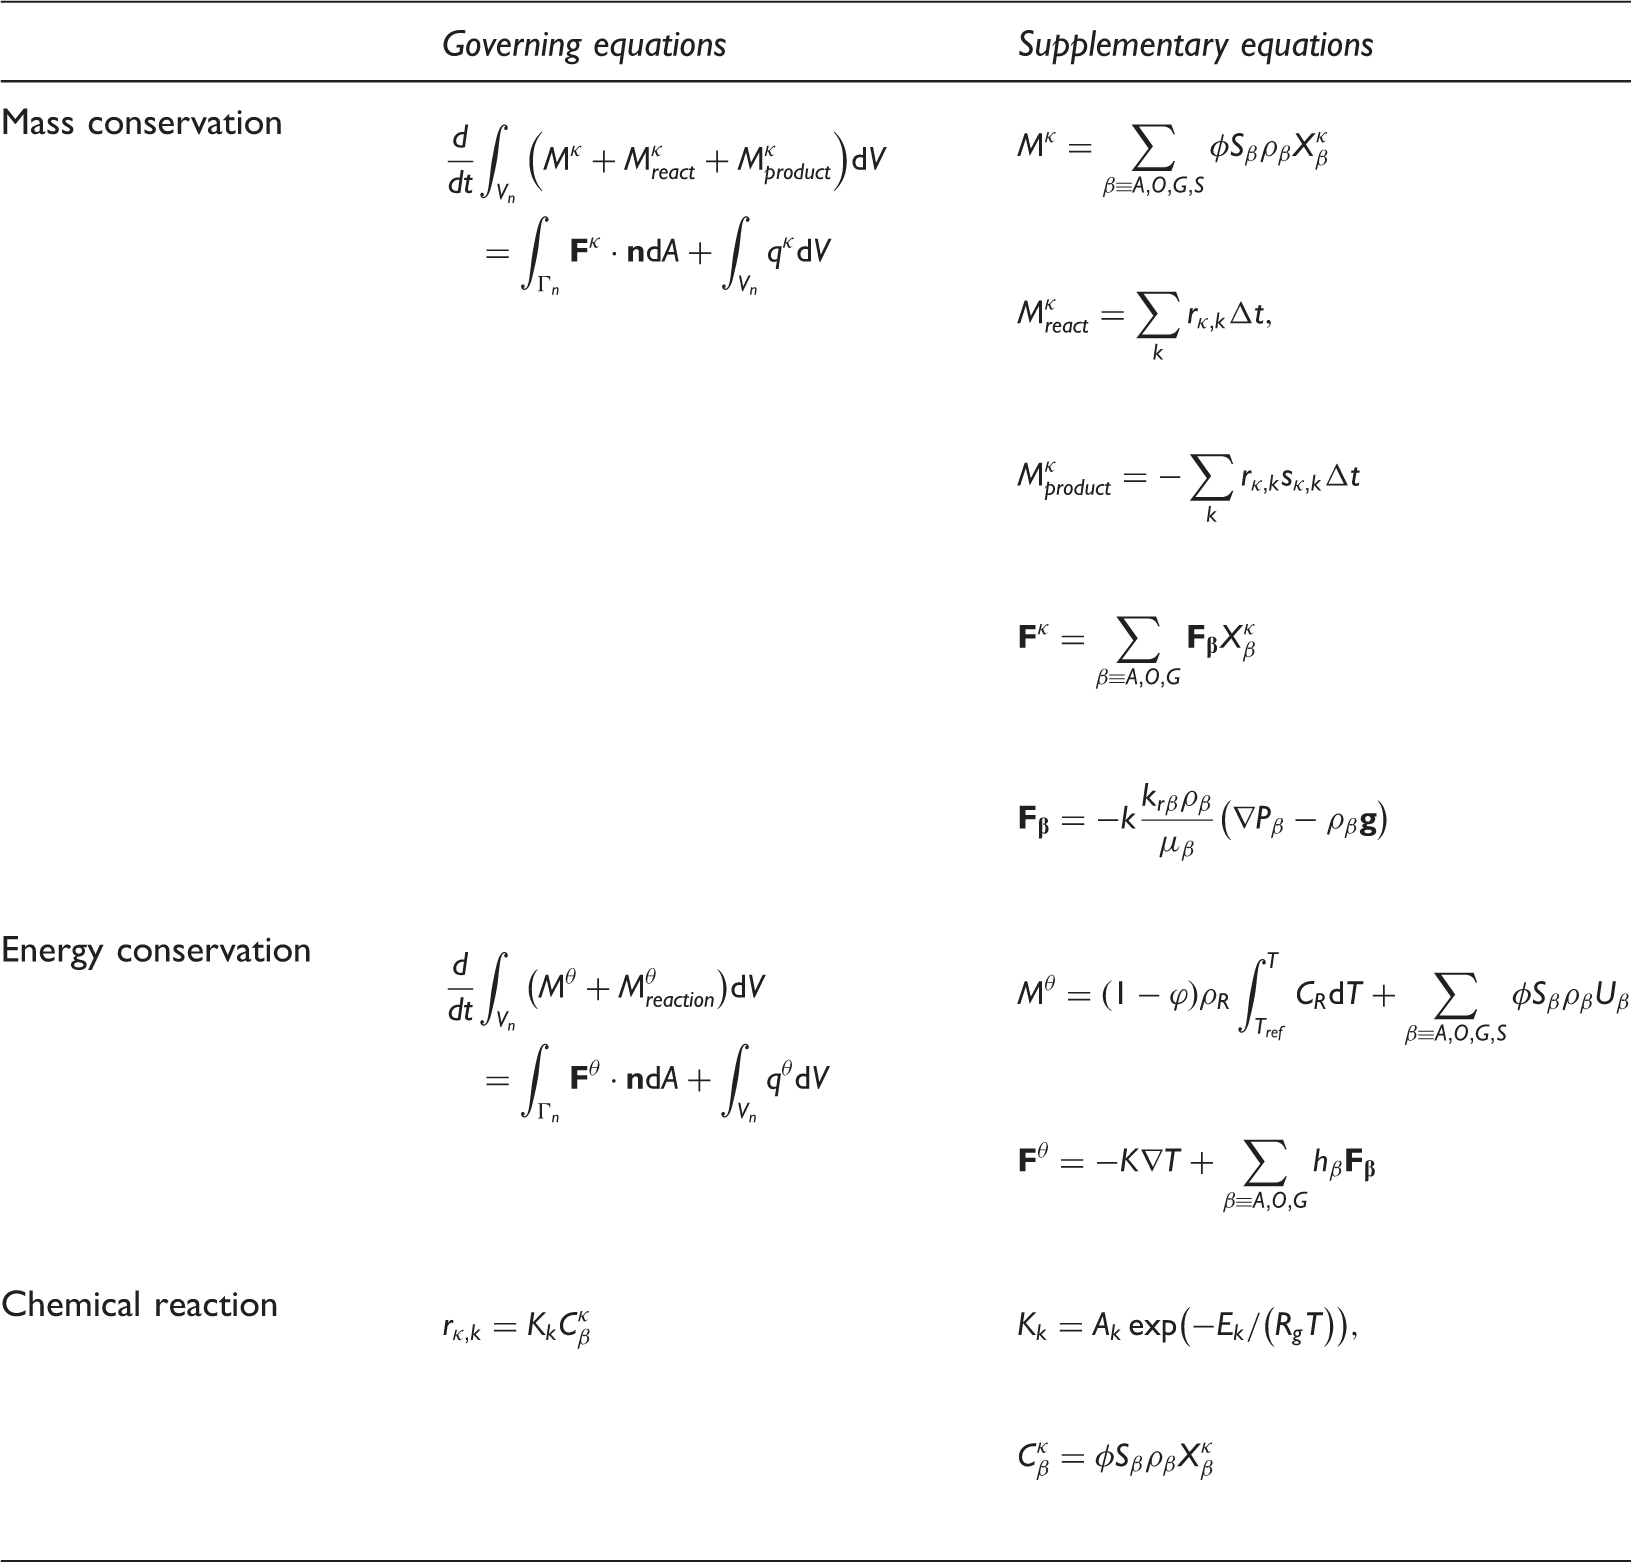
The energy conservation equation is derived by applying the heat accumulation caused by heat flow, sources and sinks of heat, and reaction heat. Here,
For the mathematical implementation of chemical reactions, the first rate law is used to compute the reaction rates as presented in the prevalent studies (Braun and Burnham, 1990, 1992). Here,
Reservoir properties and initial condition
Reservoir properties and initial condition for the simulation cases.
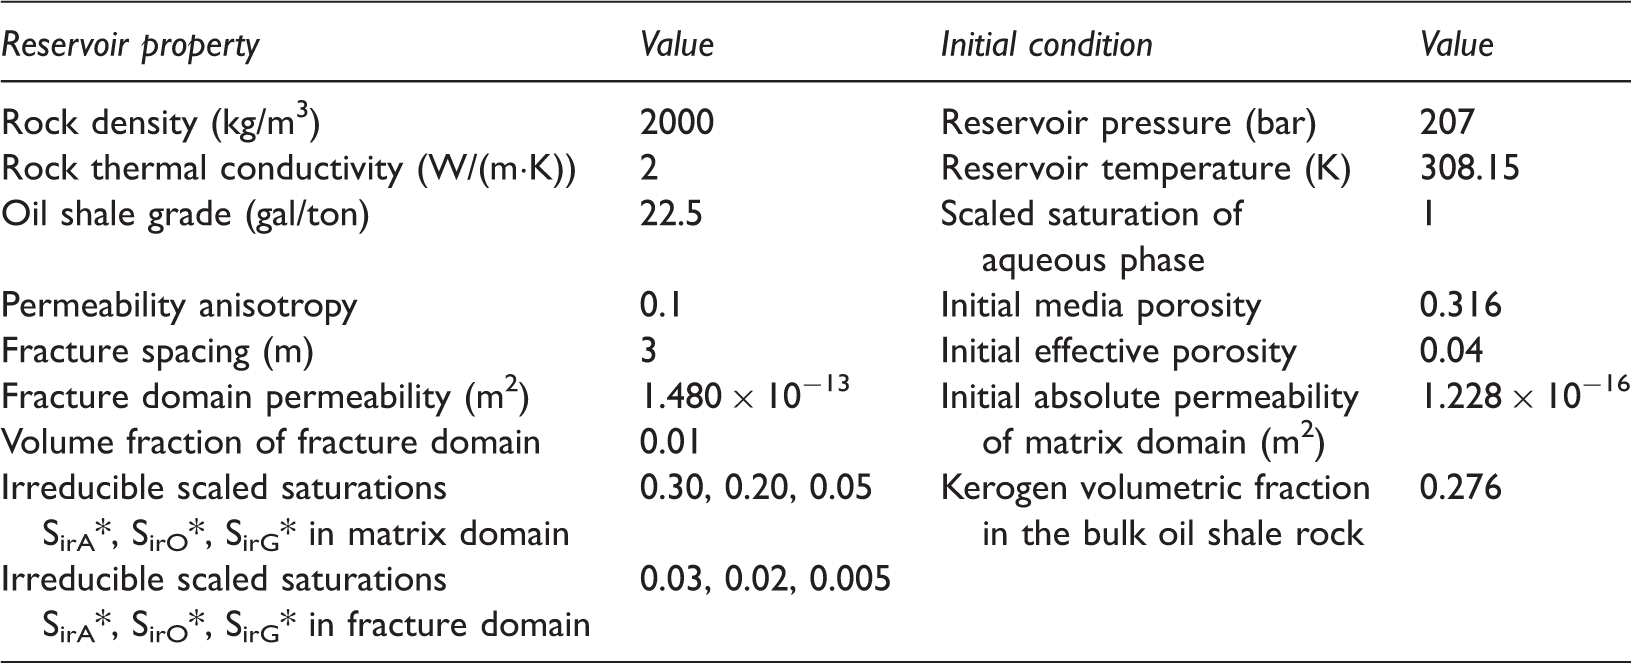
In the initial condition of the reservoir system, the fracture domain and the void space of pores were filled with aqueous phase. The kerogen volume fraction has been computed from the oil shale grade; the sum of the kerogen volume fraction and the initial effective porosity gives the initial media porosity, the total porosity including solid phase. Initial effective permeability has been obtained by inserting the initial effective porosity into the permeability model of the Green River Formation (Kibodeaux, 2014). The changing absolute permeability has been computed as the evolution of effective porosity (Nimblett and Ruppel, 2003).
Simulation models and strategies
The simulation cases applying the ideas of ICP, Electrofrac, and Steamfrac have been conducted. In each process, we assume that the principle of symmetry can be applied to the problems. A sector model, which is the minimum unit of the reservoir system, is simulated in each process by applying the no-flow of fluid and heat at the boundaries. Each model includes the overburden and underburden formations to account for the heat loss. Zero permeability is applied to the overburden and underburden formations, in order to only provide the heat loss. Each process is continued until the kerogen mass in place approached its plateau.
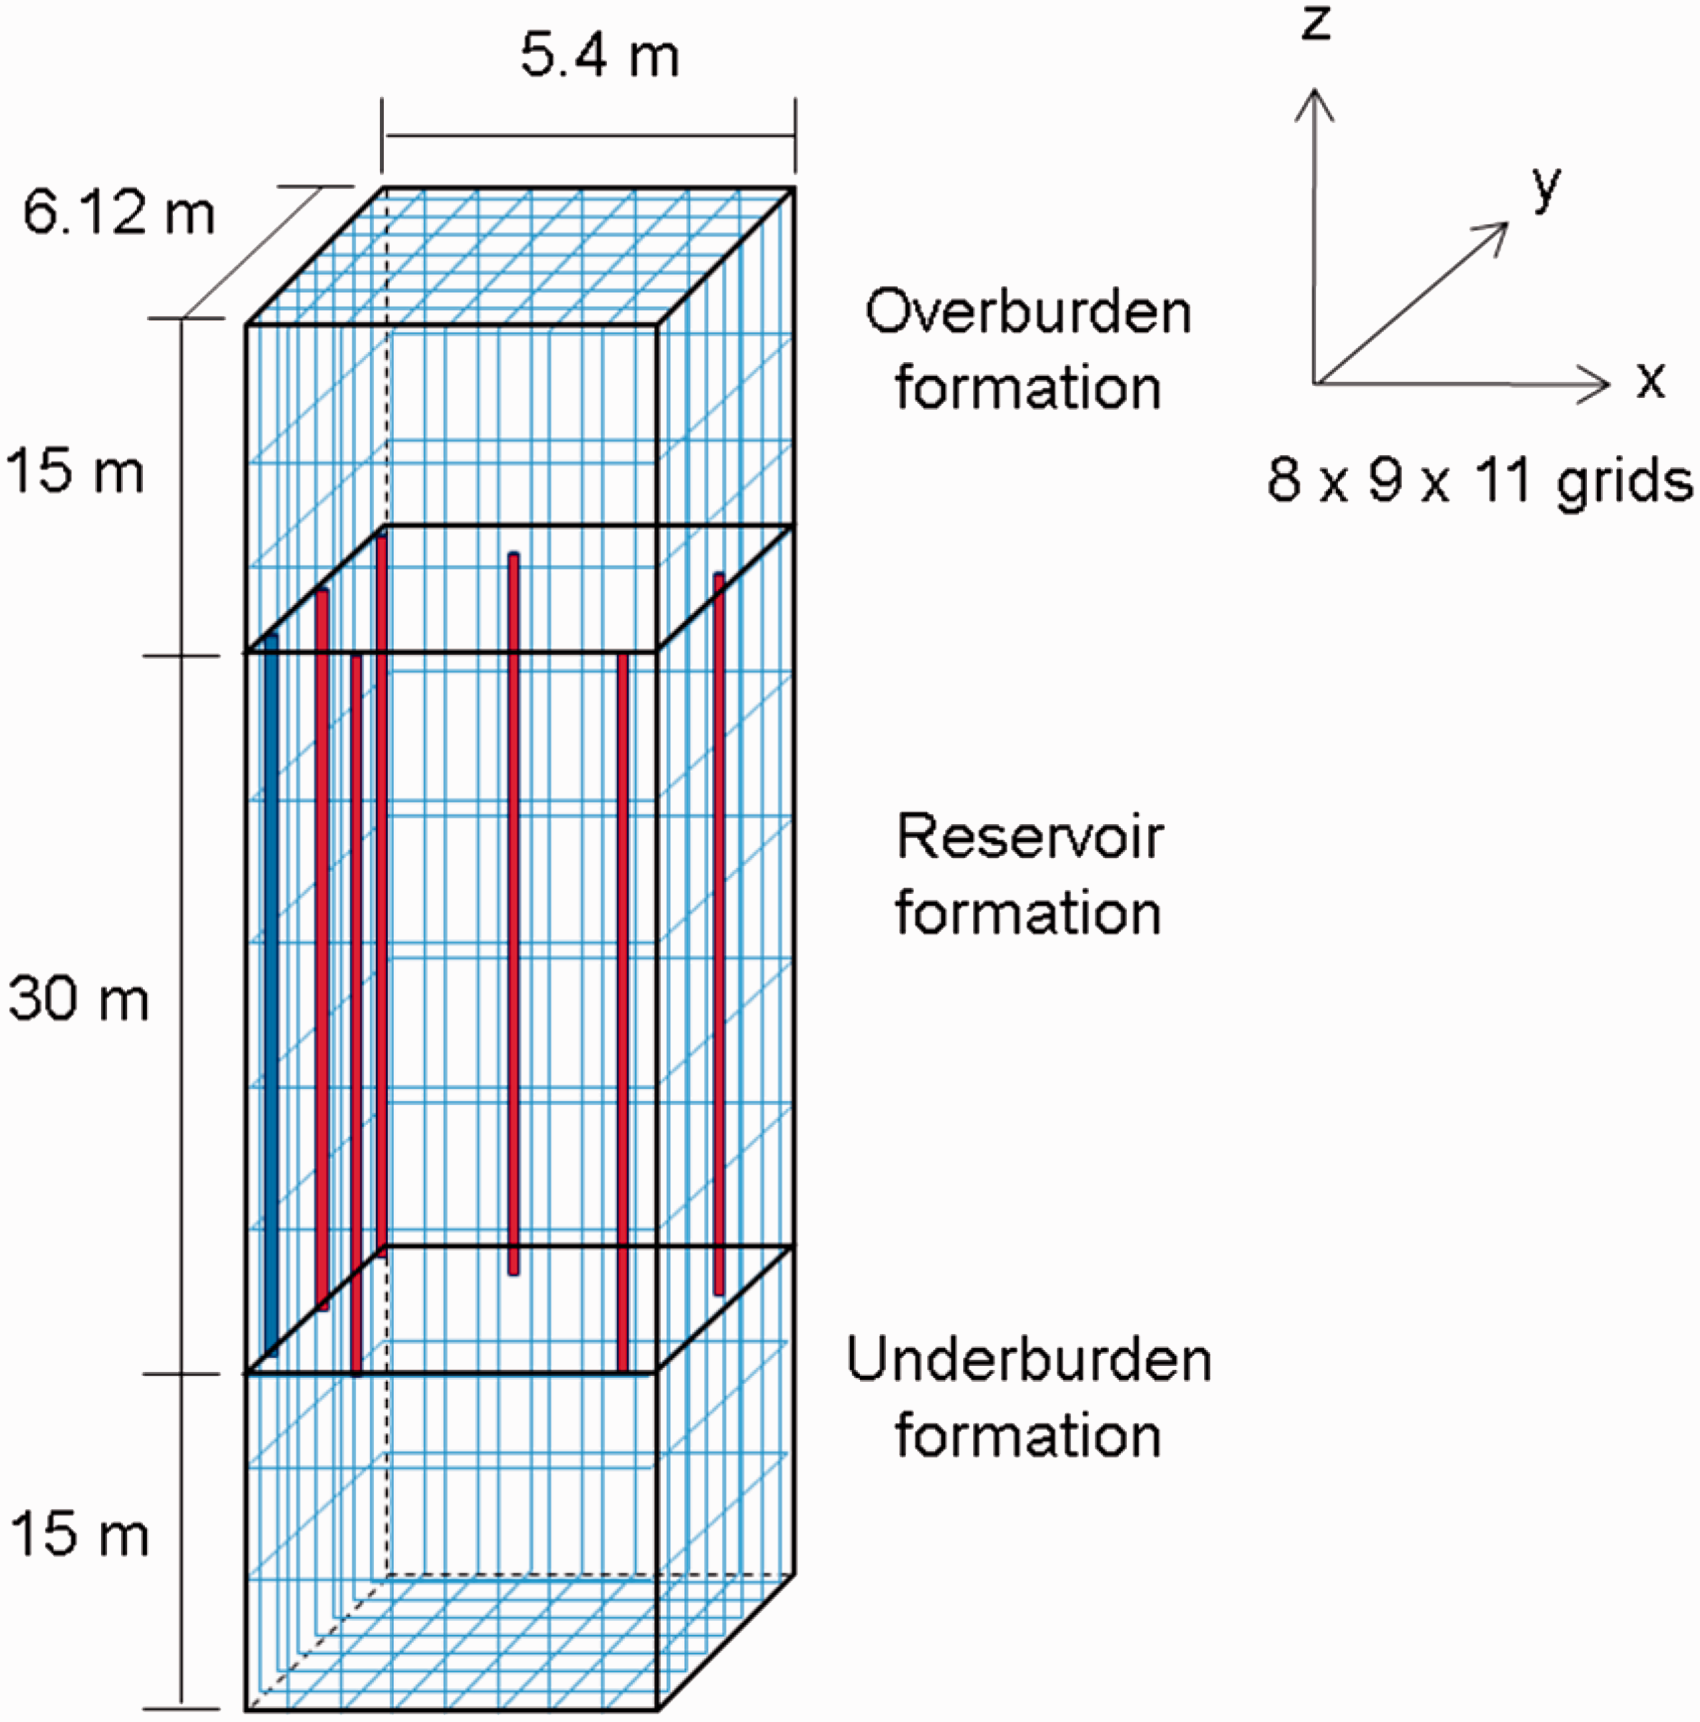
The simulation cases of the applied ICP have been conducted by considering the reservoir configuration as shown in Figure 4. The multiple hexagons of heaters and producers are considered; in one hexagon, 16 electric heaters and 2 producers are located. A quarter of one hexagon as a sector model is simulated as shown in Figure 5. On the assumption that the spacing and the pattern of heaters are fixed as proposed by the Shell’s MDP-S (Fowler and Vinegar, 2009), the temperature of heaters is the most important factor for the productivity and the heating efficiency. In this regard, the sensitivity analysis of production behavior to the temperature of heaters has been conducted. The temperatures of heaters = 598.15 K, 603.15 K, 608.15 K, and 613.15 K are used. It is expected that this range of temperature makes the kerogen decomposition active while avoiding the excessive cracking of hydrocarbons, especially for the cracking of liquid organic phase.
Top views of the reservoir system and the quarter of one hexagon in the applied ICP cases: (a) Top view of the reservoir system and (b) Top view of the quarter of one hexagon. Simulation model of the applied ICP cases.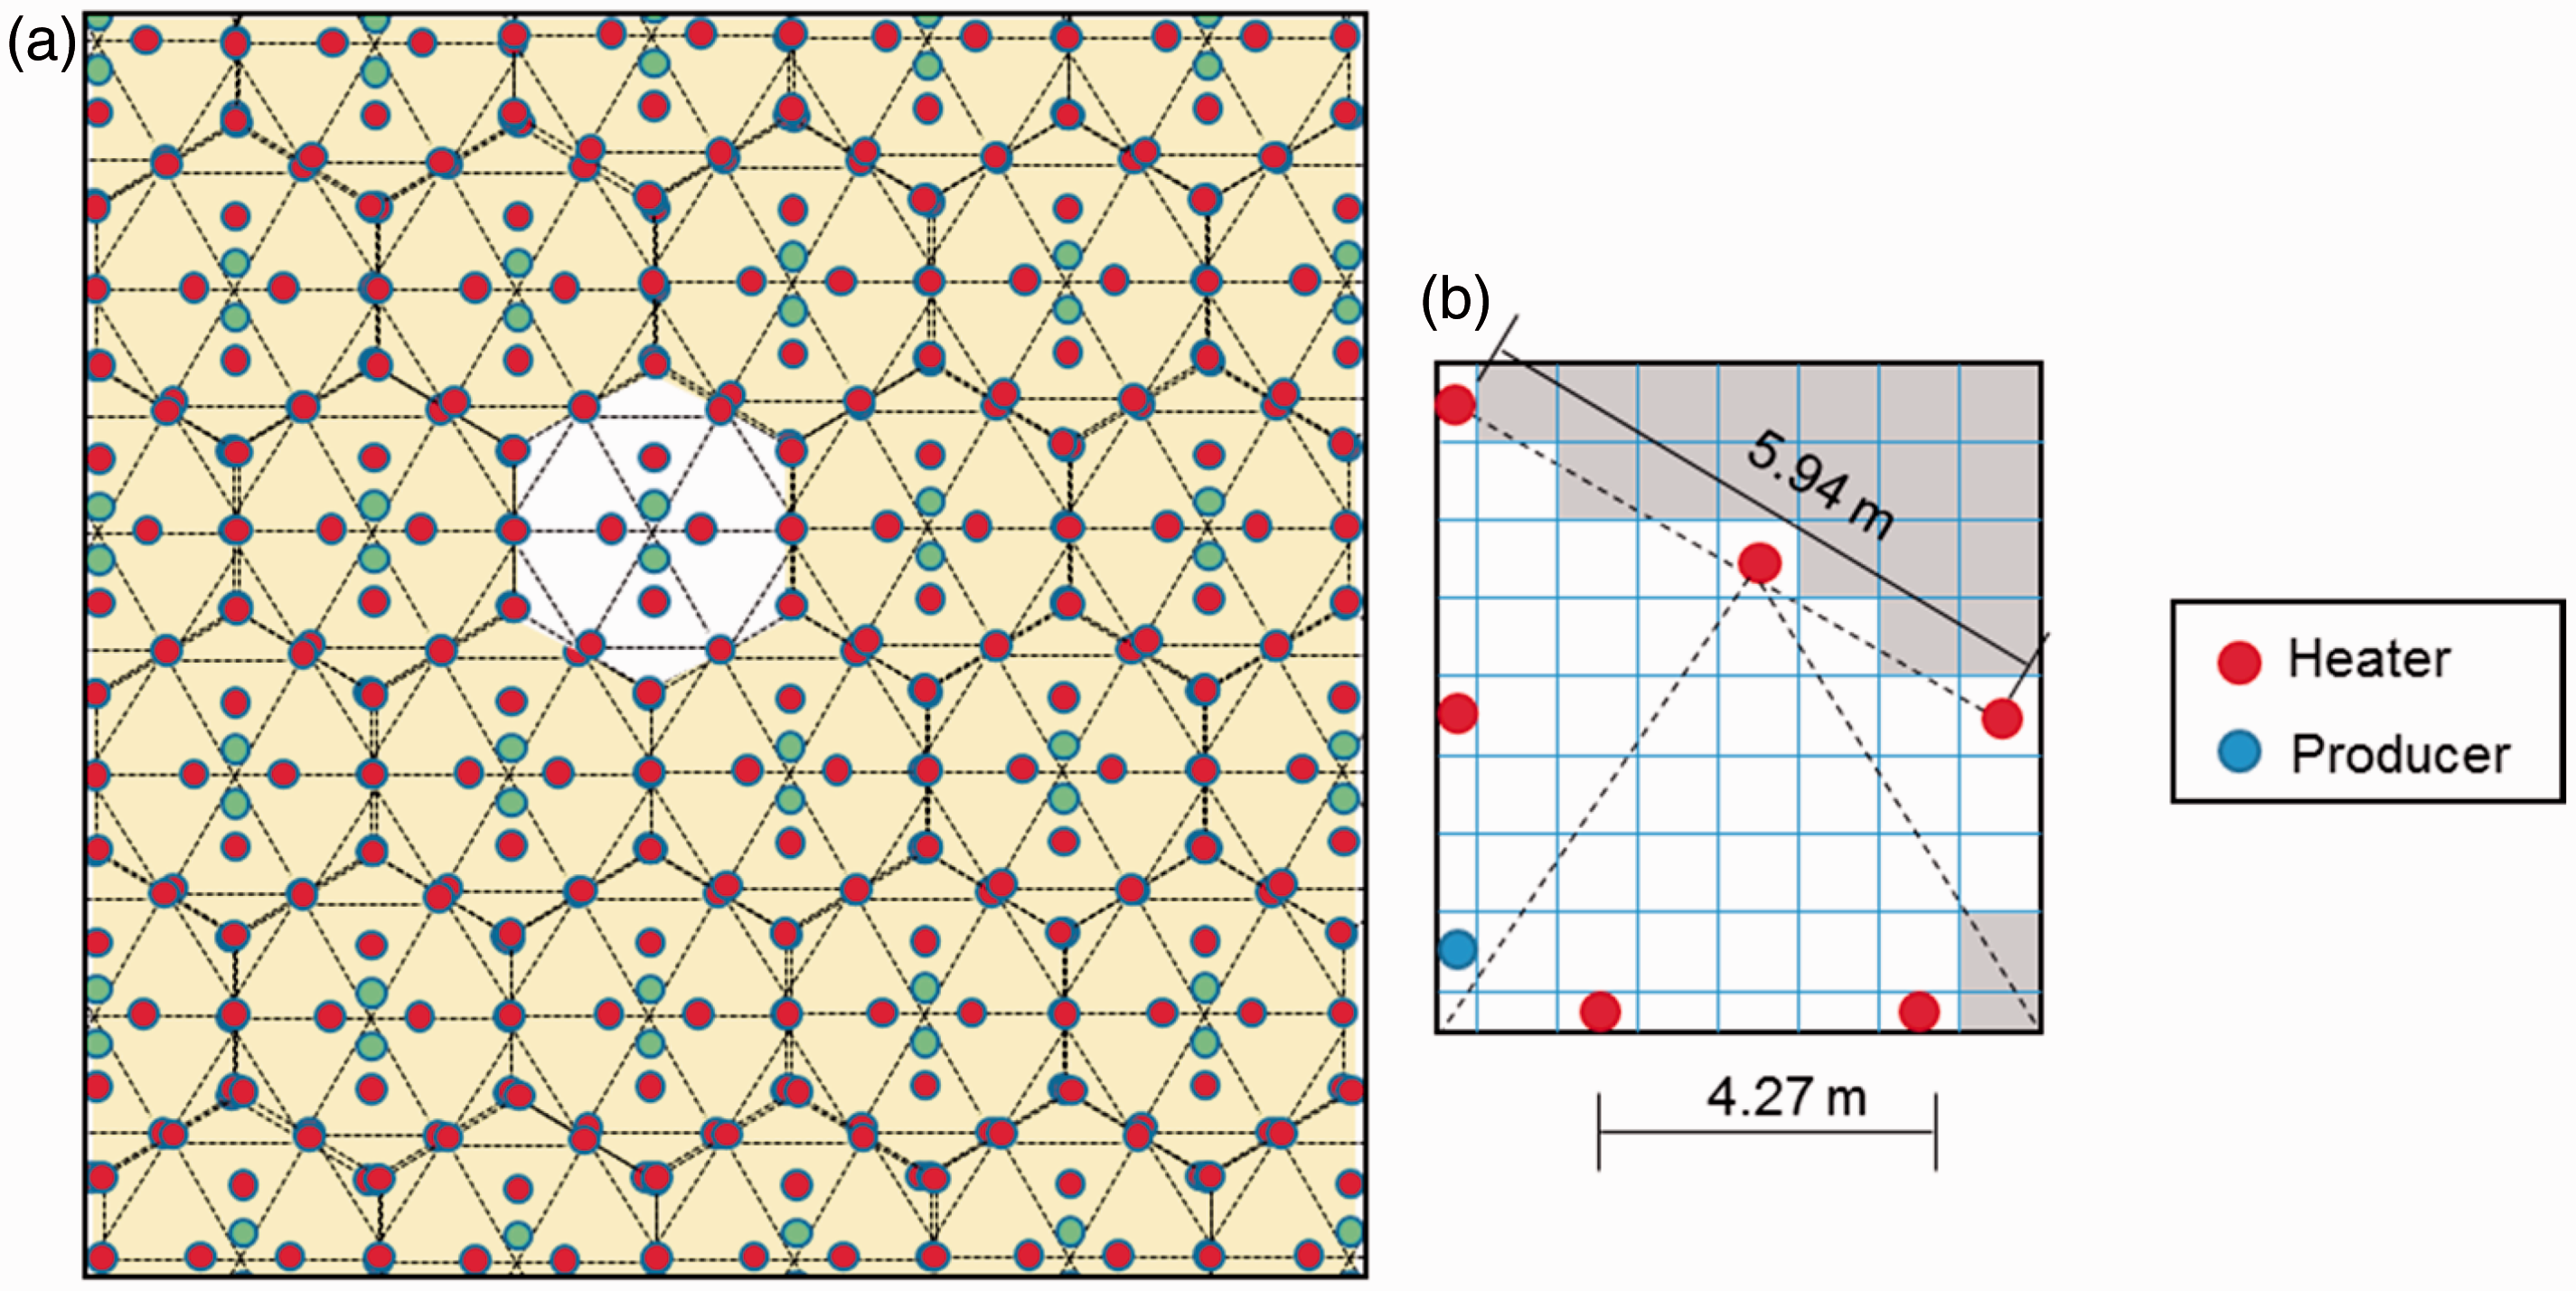
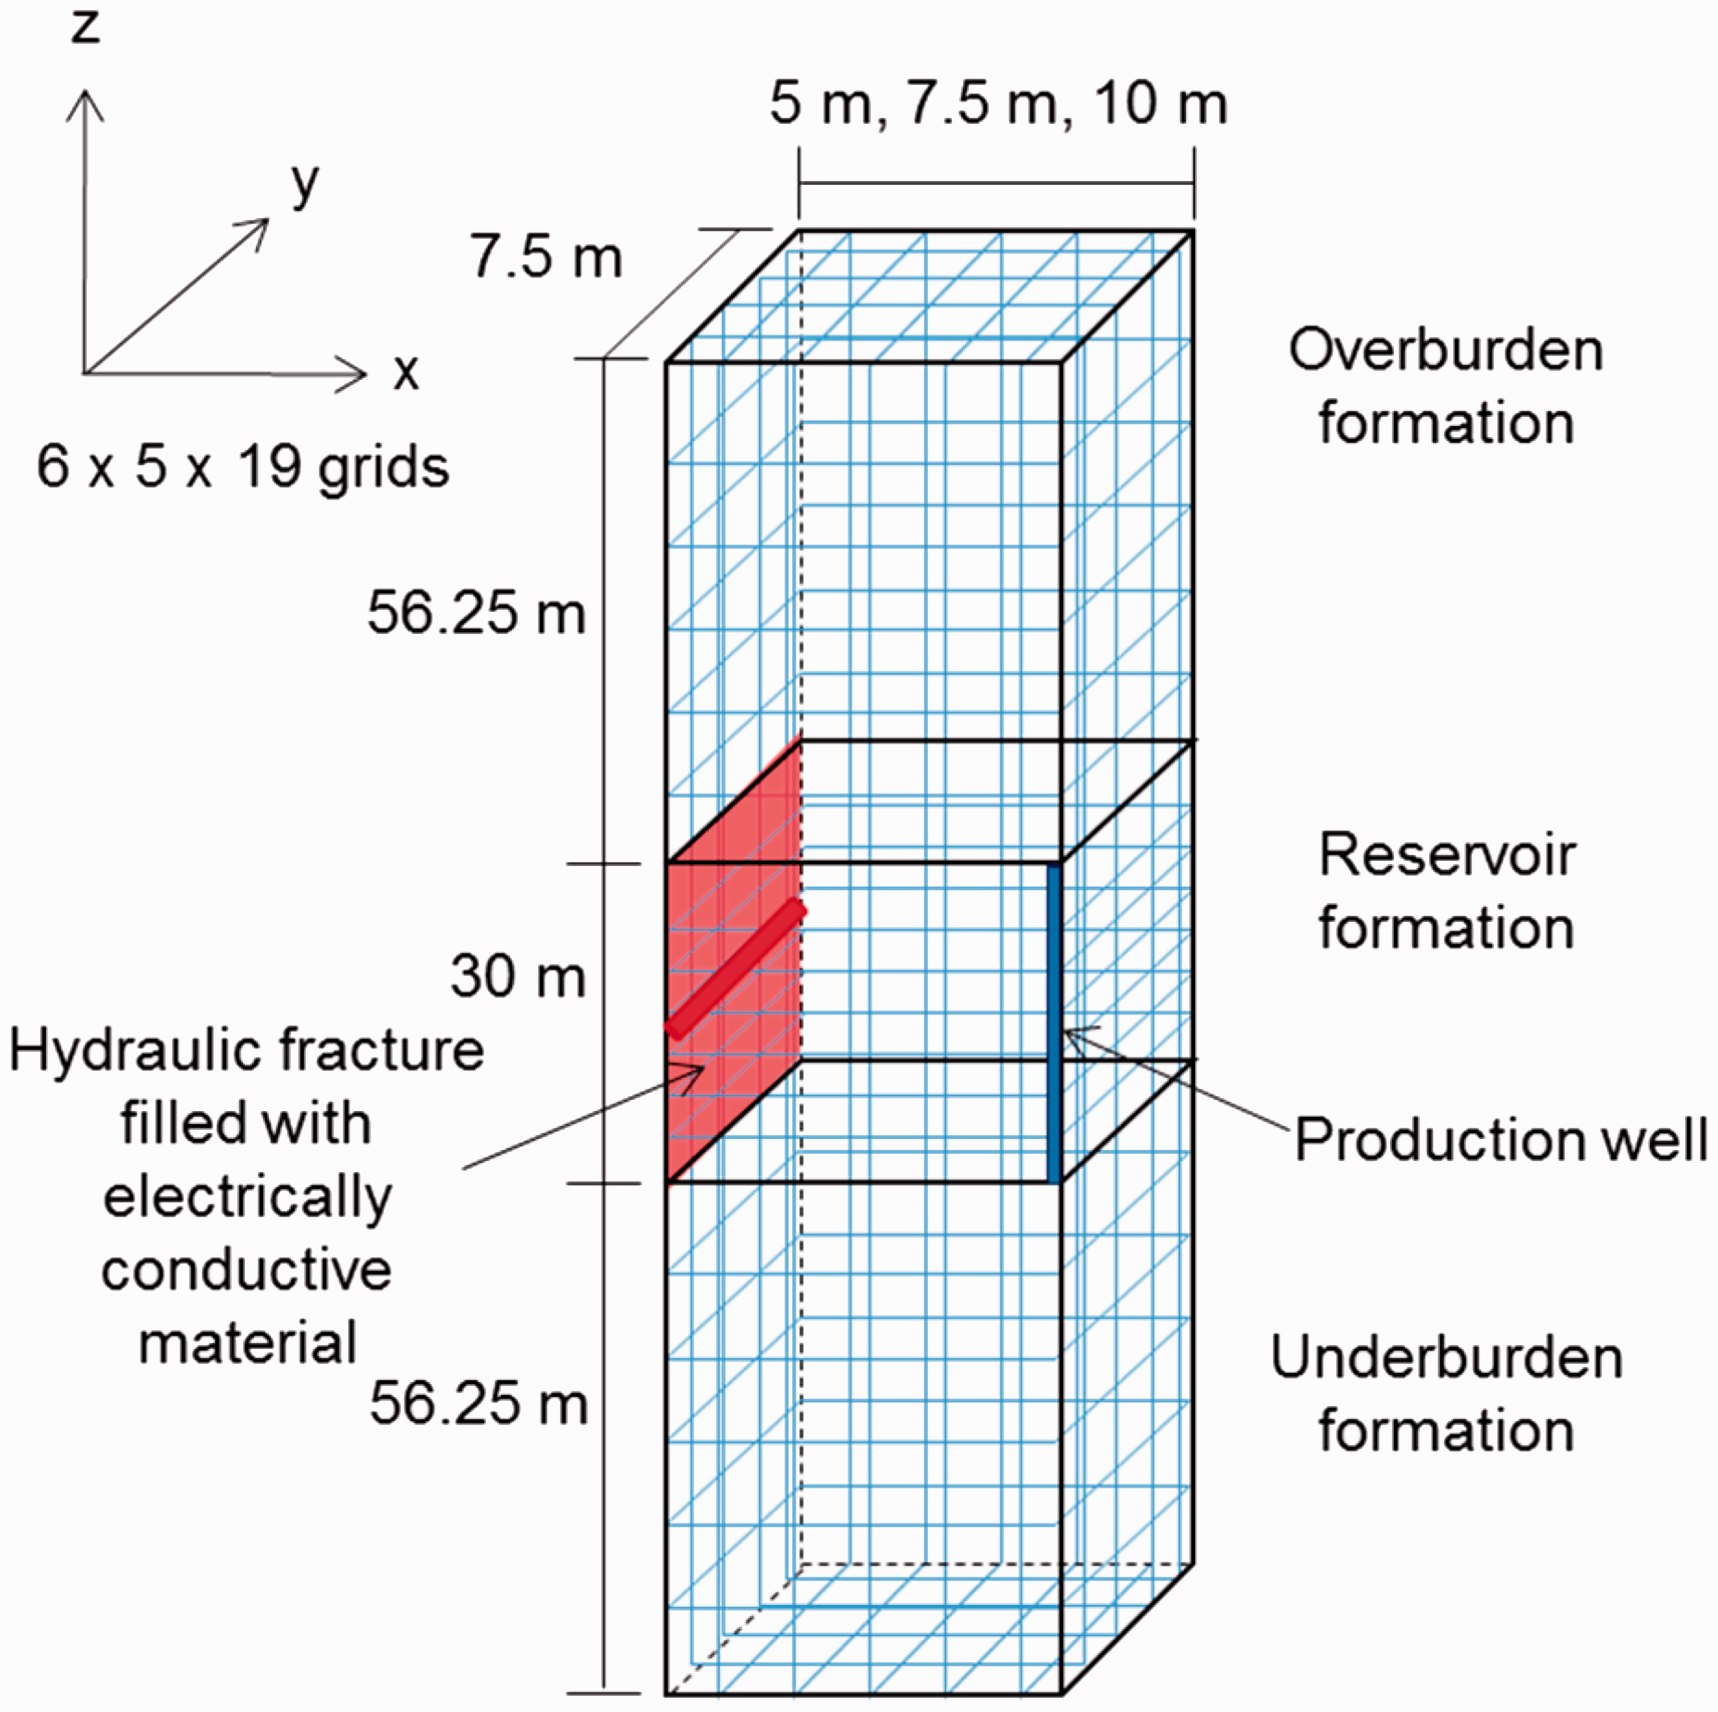
The top view of the reservoir system in the applied Electrofrac simulation is provided in Figure 6. A multilateral horizontal well system is considered, where the longitudinal hydraulic fracture has been made in each branch well. Each horizontal well transfers heat into its hydraulic fracture, which is propped with electrically conductive proppant. Two vertical production wells are located between the hydraulic fractures to produce converted fluids including hydrocarbons. The sector model of an eighth of one hydraulic fracture system as shown in Figure 7, which is the minimum unit of the system, is simulated. The hydraulic fractures are 30 m-high and 30 m-wide, and the temperature of each horizontal well is kept as 613.15 K during the whole heating and production processes. The sensitivity analysis of production behavior to the spacing of hydraulic fractures has been performed by using the spacing = 10 m, 15 m, and 20 m, because it was expected to significantly affect the process efficiency as well as productivity. Because the spacing of hydraulic fractures affects the size of the one fracture unit of the reservoir, the duration necessary for the heating and production processes varies with the spacing of hydraulic fractures.
Top view of the reservoir system in the applied Electrofrac cases. Simulation model of the applied Electrofrac cases.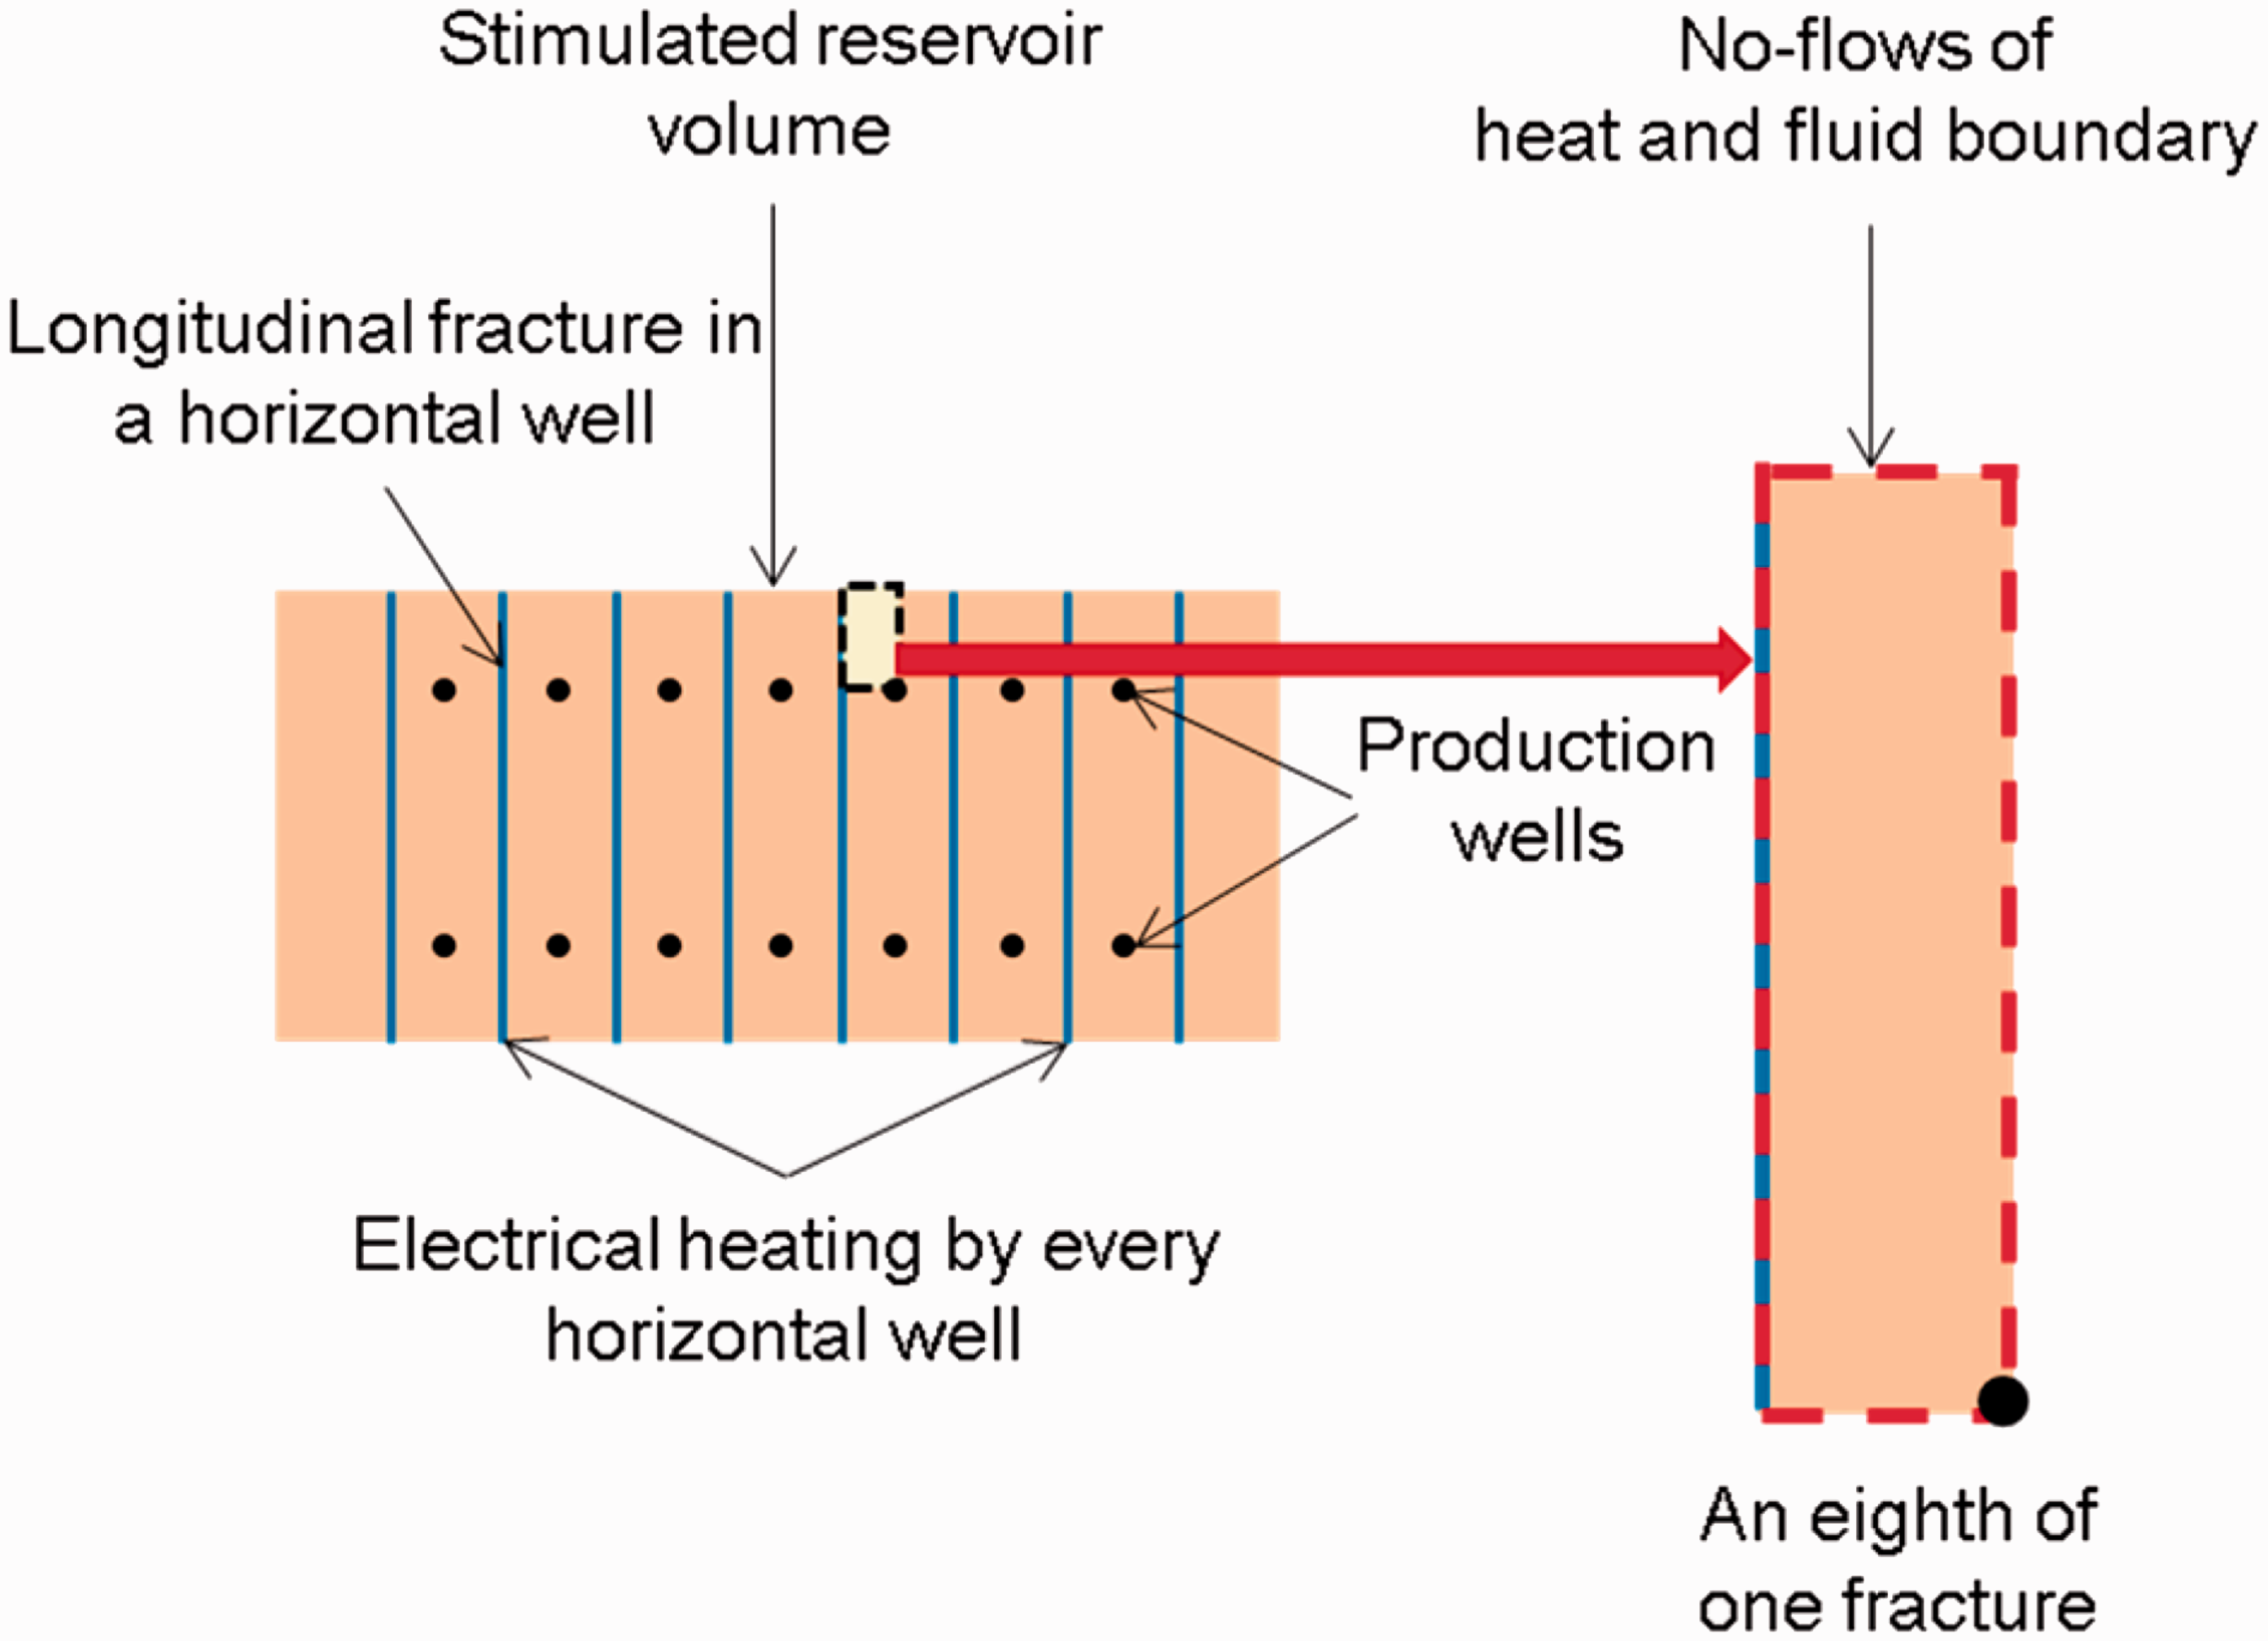
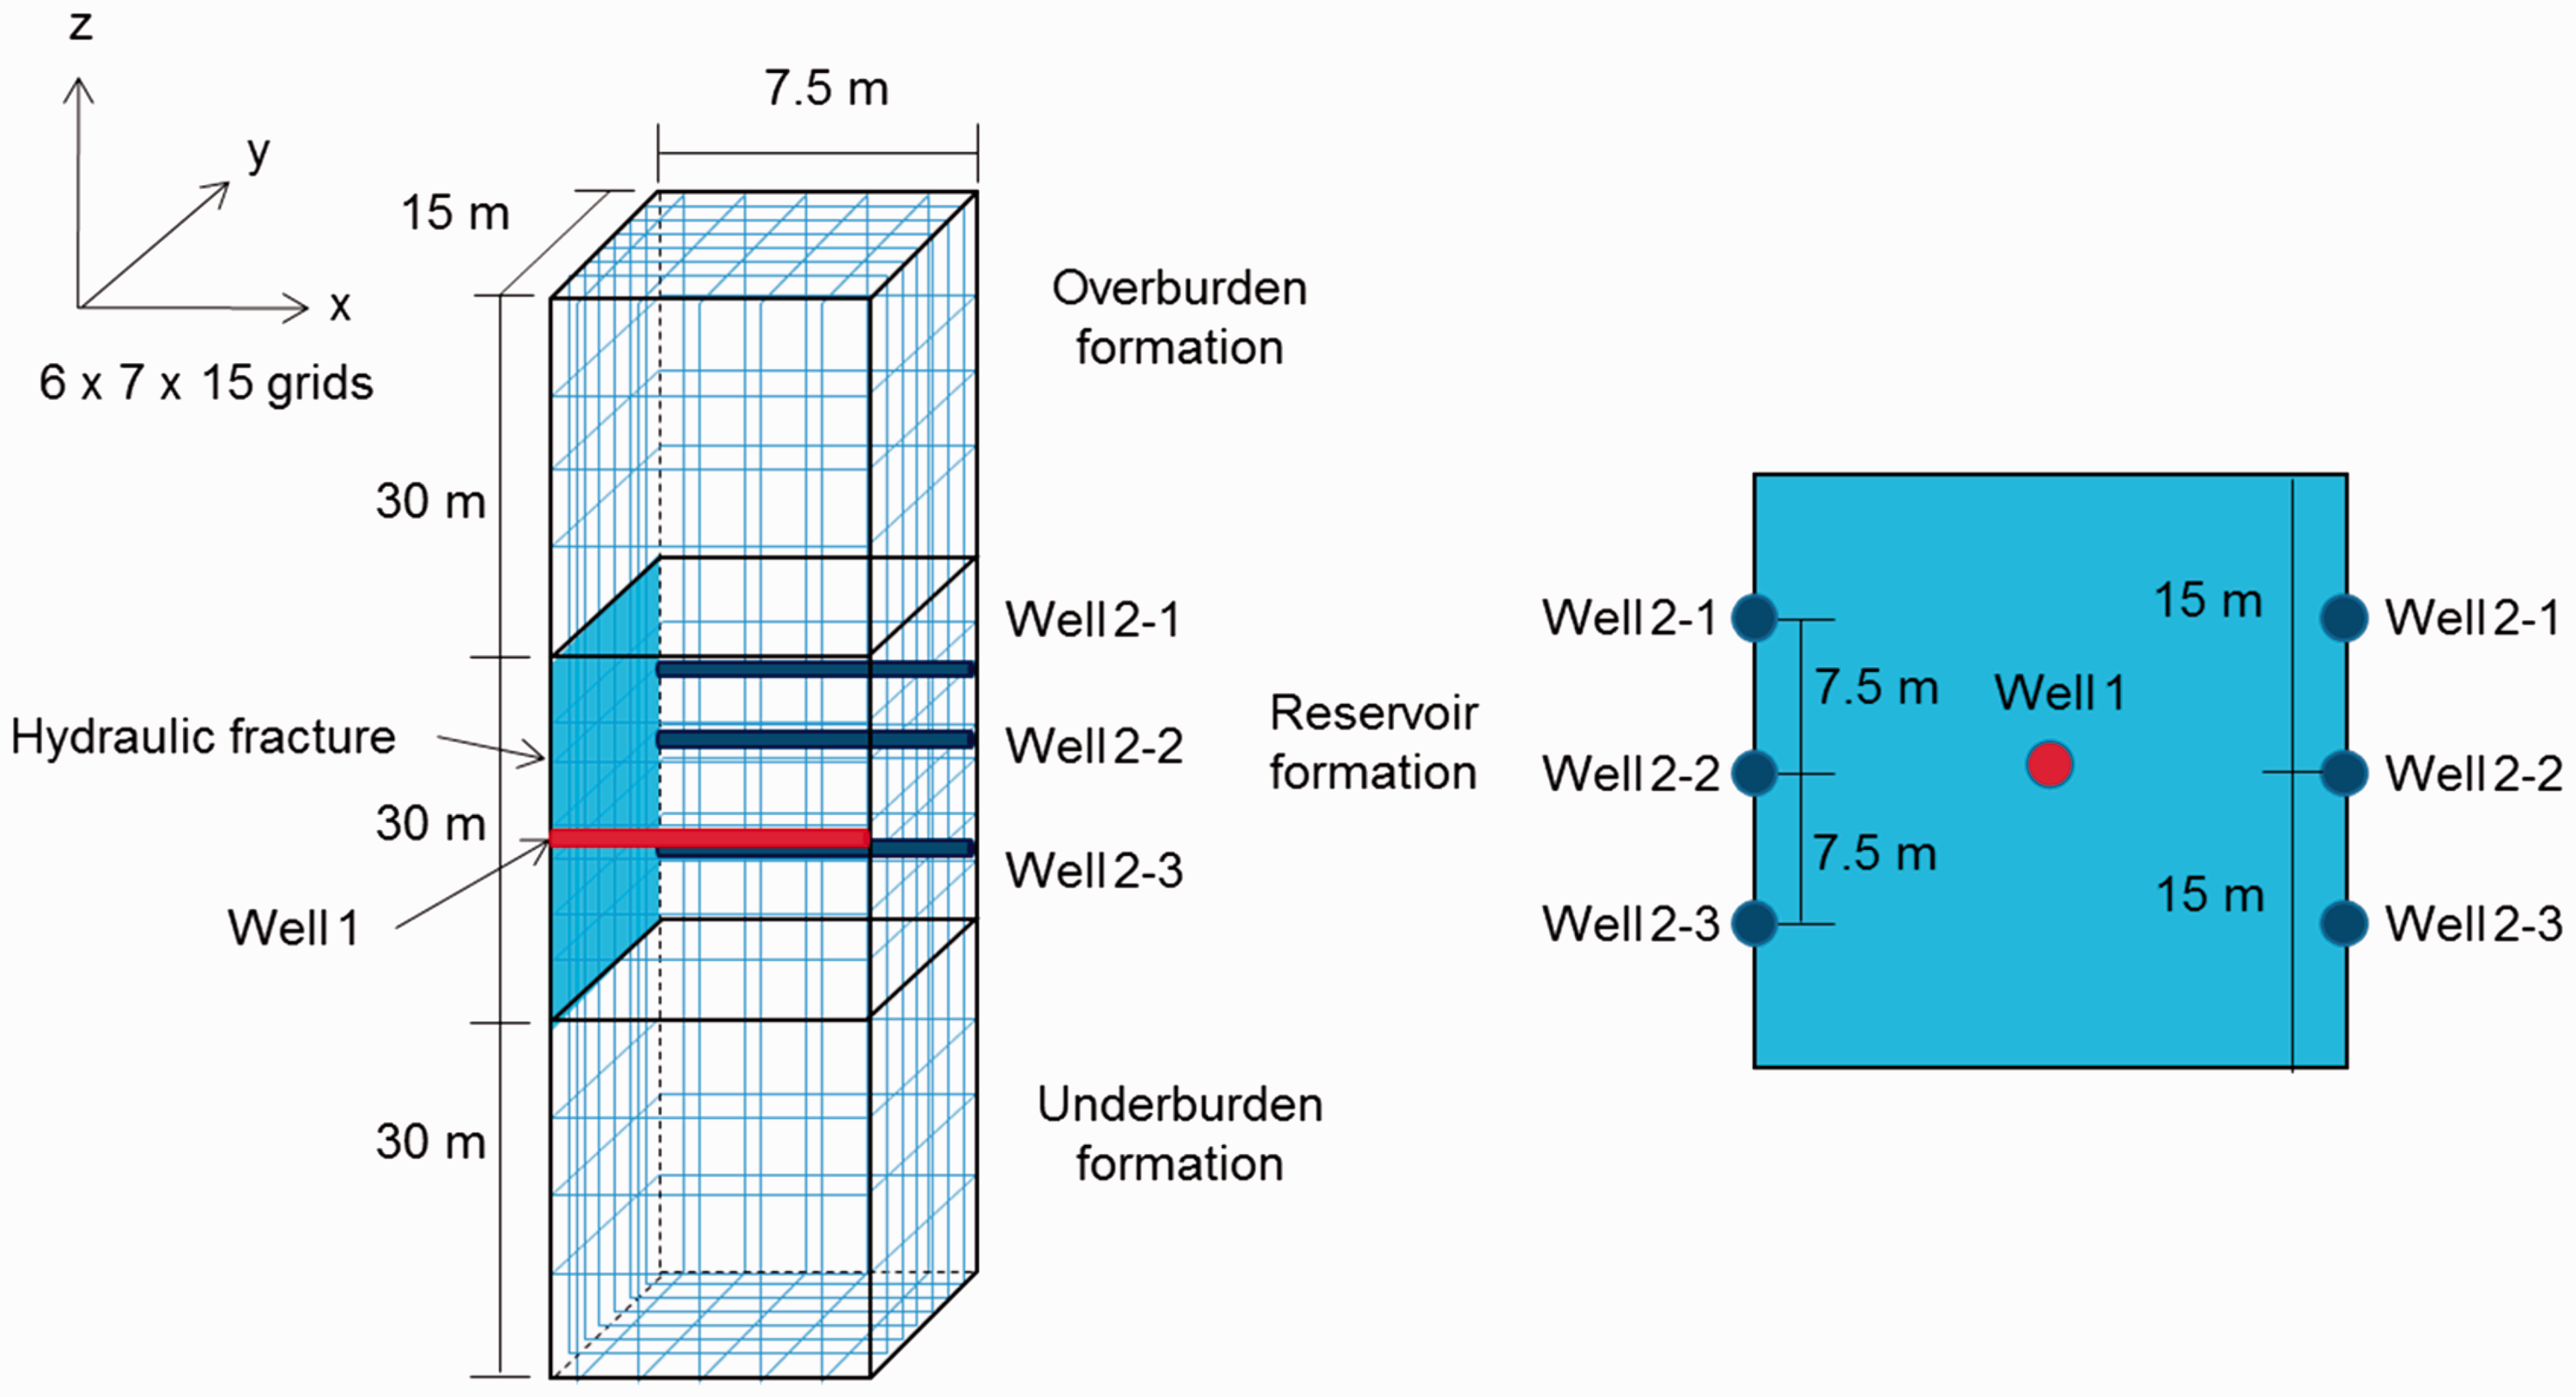
The top view of the reservoir system in the applied Steamfrac simulation is provided in Figure 8. A horizontal well system with multistage transverse vertical fractures is considered. Two production wells have been drilled at the side edges of the reservoir after fracturing. The hydraulic fractures are 30 m-high and 30 m-wide and evenly distributed with the spacing of 15 m. The minimum unit of the reservoir system is simulated as the cases of applied ICP and Electrofrac methods. The sector model of a quarter of one hydraulic fracture system is simulated as shown in Figure 9. The sensitivity analysis of production behavior to the position of the production wells has been conducted, because it was expected to significantly affect the heat distribution in the reservoir and following fluid production. In the Figure 9, the well 1 is the injection well located at the center of the reservoir, which has been used to make the hydraulic fractures, and the well 2-1, well 2-2, and well 2-3 are the production wells located at the different depths; each of the production well is used in the each case of sensitivity analysis. In the simulation cases, the injected water component presents in aqueous phase (hot water) due to the high pressure of the reservoir system. Hot water is injected into the well 1 during the whole process; injection rate per one hydraulic fracture unit is 0.4 kg/s. Simultaneously, the fluid is produced from the well 2-1, well 2-2, and well 2-3 in the cases 1, 2, and 3, respectively.
Top view of the reservoir system in the applied Steamfrac cases. Simulation model and the positions of horizontal wells on the hydraulic fracture in the applied Steamfrac cases.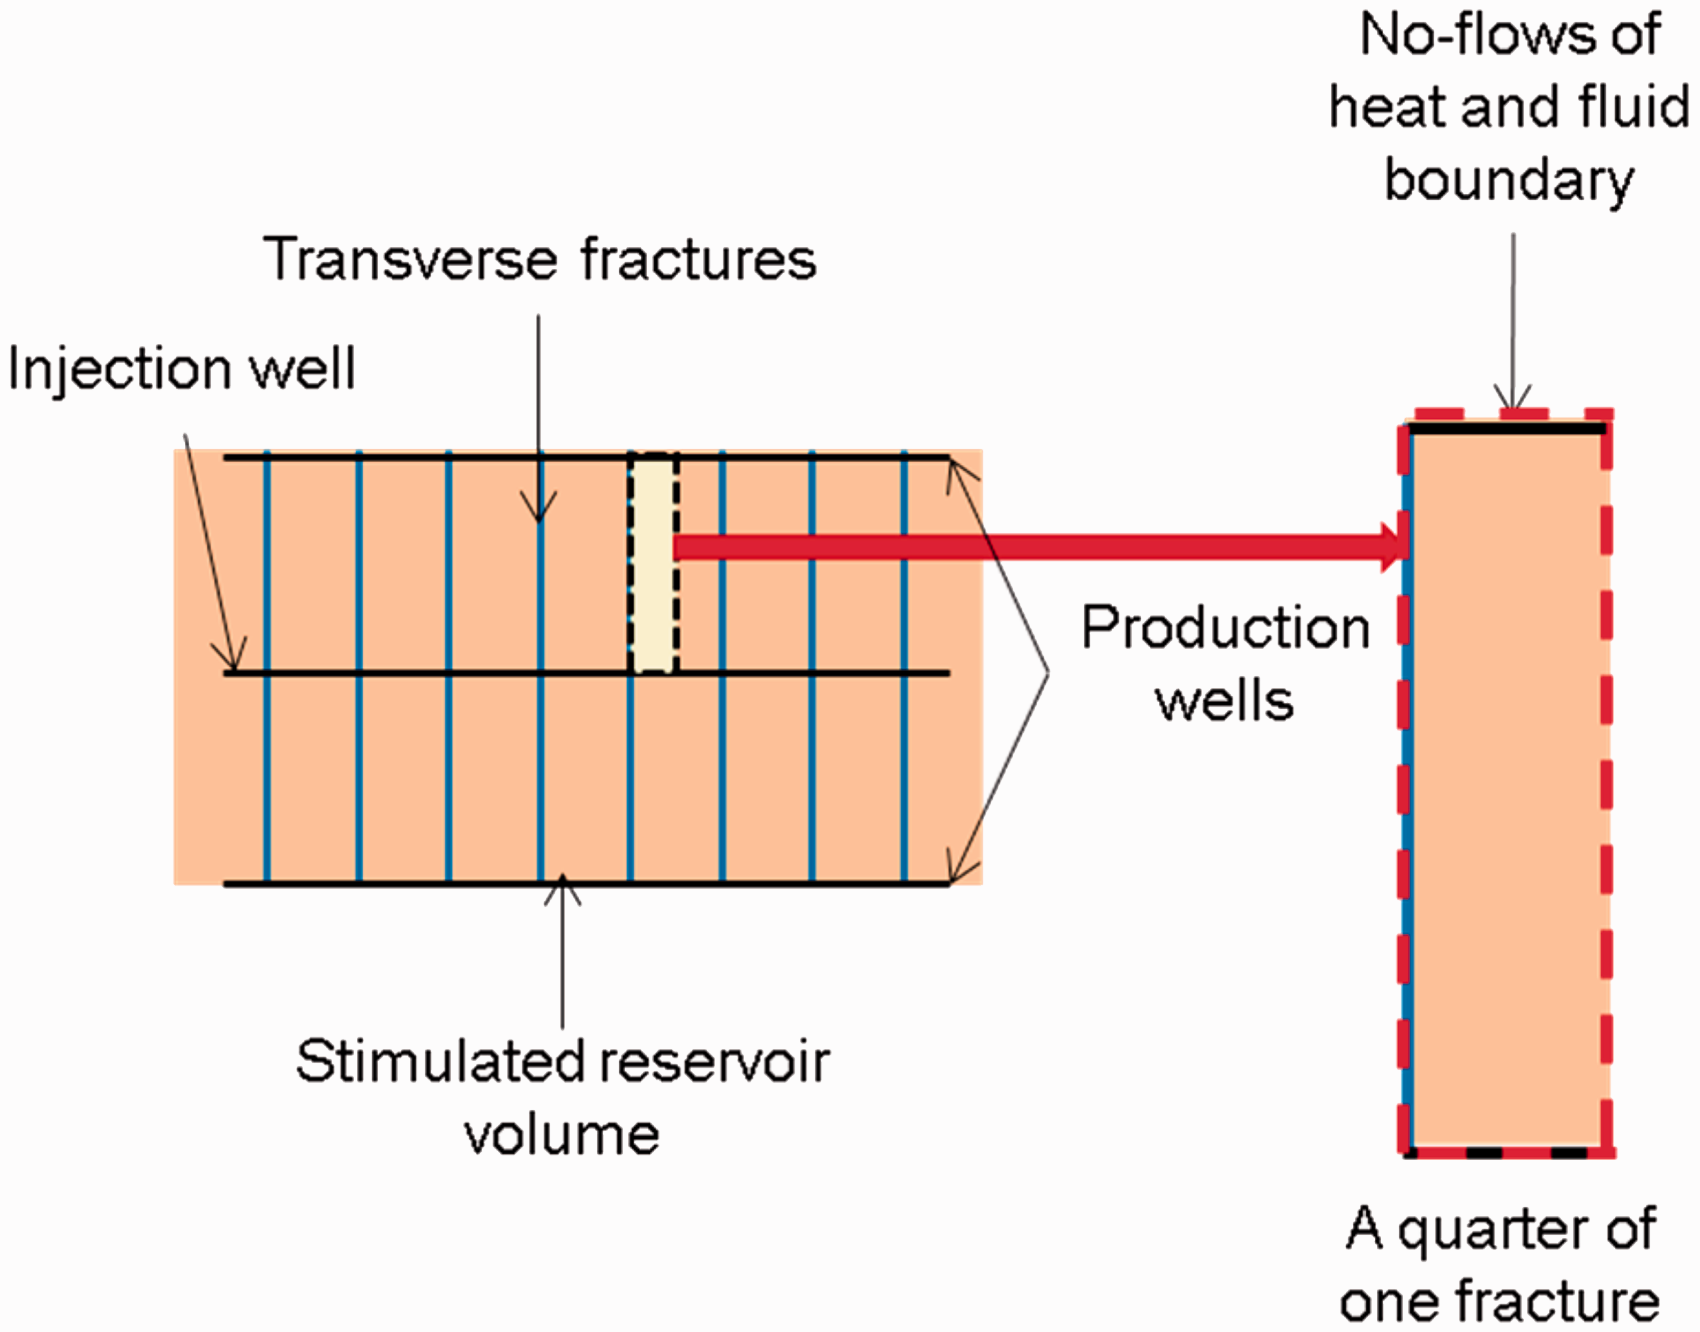
Results and discussion
Applied ICP cases
Kerogen mass in place and phases productions of the applied ICP cases are provided in Figure 10. Figure 10(a) shows that whole kerogen in the system has decomposed at the end of the process in every case. From the production rates of aqueous phase in Figure 10(a), it is found that the aqueous phase production rate increases from t = 45 days to t = 90, 80, 70, and 70 days, in the cases 1, 2, 3 and 4, respectively. The peaks of the aqueous phase production rates are 0.010 kg/s (=7.522 Stock Tank Barrels/Day [STB/D]), 0.010 kg/s (=7.522 STB/D), 0.012 kg/s (=8.514 STB/D), and 0.013 kg/s (=9.222 STB/D) in those cases, respectively. After the peaks, the production rates of aqueous phase gradually decrease until they approach zero, because the generation of hydrocarbons and the evaporation of aqueous phase by the increase of temperature. As the heater temperature increases, the production time and the cumulative production of aqueous phase decrease; Table 4 shows the result quantitatively. This has been caused by that more aqueous phase vaporized, and more liquid organic phase and gaseous phase were produced with increasing heater temperature.
Applied ICP cases–kerogen mass in place and phases productions in one hexagon: (a) Kerogen mass in place, (b) Production rates of aqueous phase, (c) Production rates of liquid organic phase and (d) Production rates of gaseous phase. Applied ICP cases–phases productions, gas oil mass ratio, and water oil mass ratio in one hexagon. ICP: In situ Conversion Process.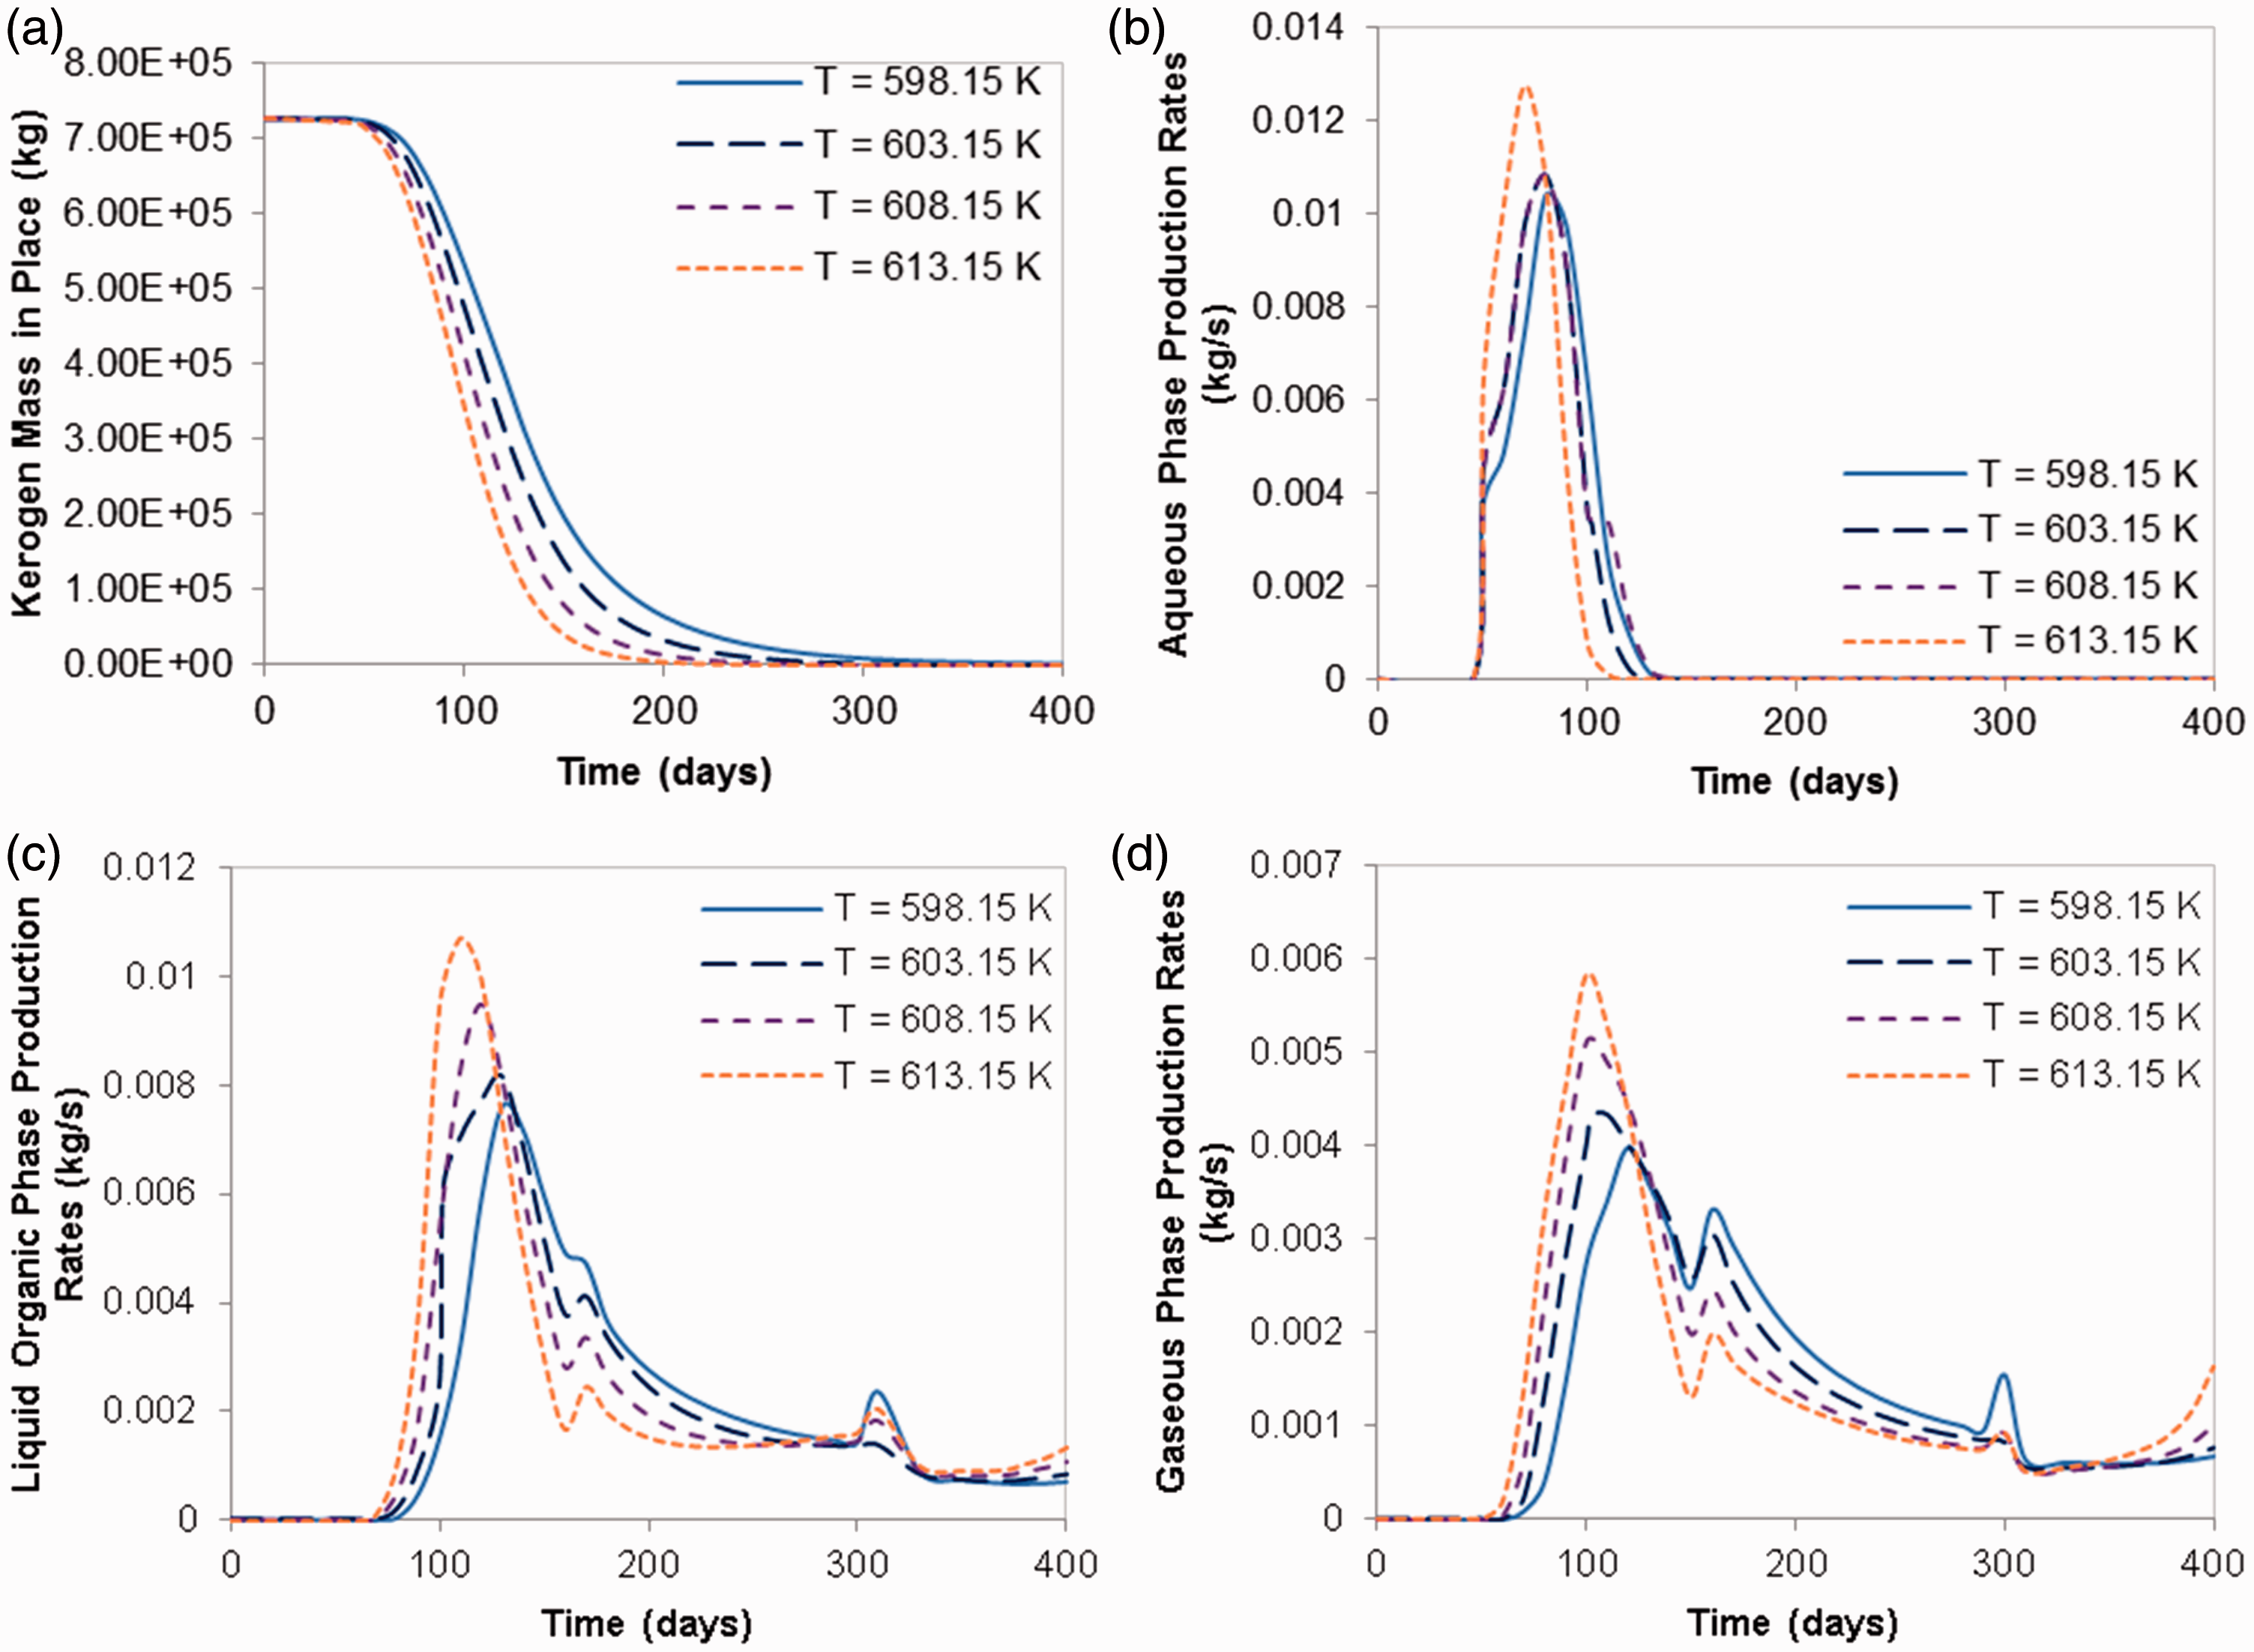
From Figure 10(c) and (d), it is found that the peaks of liquid organic phase production and gaseous phase production increase with increasing heater temperature. The peaks of liquid organic phase production rate are 7.618 × 10⁻³ kg/s (=7.359 STB/D), 8.181 × 10⁻³ kg/s (=7.904 STB/D), 9.491 × 10⁻³ kg/s (=9.170 STB/D), and 0.011 kg/s (=10.338 STB/D); the peaks of gaseous phase production rate are 3.987 × 10⁻³ kg/s (=11.060 MSCF/D), 4.332 × 10⁻³ kg/s (=12.012 MSCF/D), 5.125 × 10⁻³ kg/s (=14.217 MSCF/D), and 5.840 × 10⁻³ kg/s (=16.199 MSCF/D) in the cases 1, 2, 3, and 4, respectively. The oscillations of production rates of liquid organic and gaseous phases have been caused by the decreasing wellbore flowing pressure of the production well and the flow of newly generated oil and gas from the decomposition of kerogen.
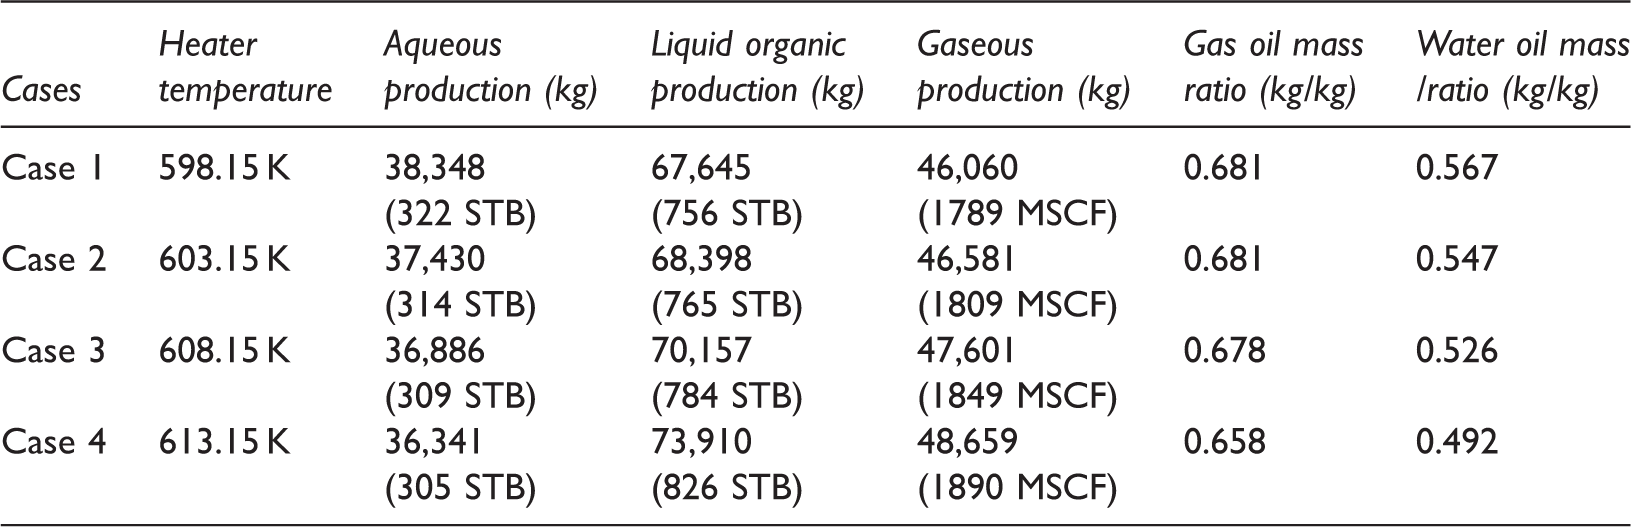
The quantitative cumulative productions of liquid organic phase and gaseous phase in one hexagon are found in the Table 4. The liquid organic phase production shows the highest mass among the productions of fluid phases in every case. Gas oil mass ratio—the mass ratio of gaseous phase production to the liquid organic phase production—decreases, as the heater temperature increases; this is because the rate of increase is higher in the liquid organic phase production than the gaseous phase production with increasing heater temperature. The decrease of liquid organic phase viscosity leads to more cumulative production of liquid organic phase with increasing heater temperature. Water oil mass ratio—the mass ratio of aqueous phase production to the liquid organic phase production—also decreases with increasing heater temperature, by the more production of liquid organic phase and the more evaporation of aqueous phase.
Applied ICP cases–masses of decomposed kerogen and produced components in one hexagon.
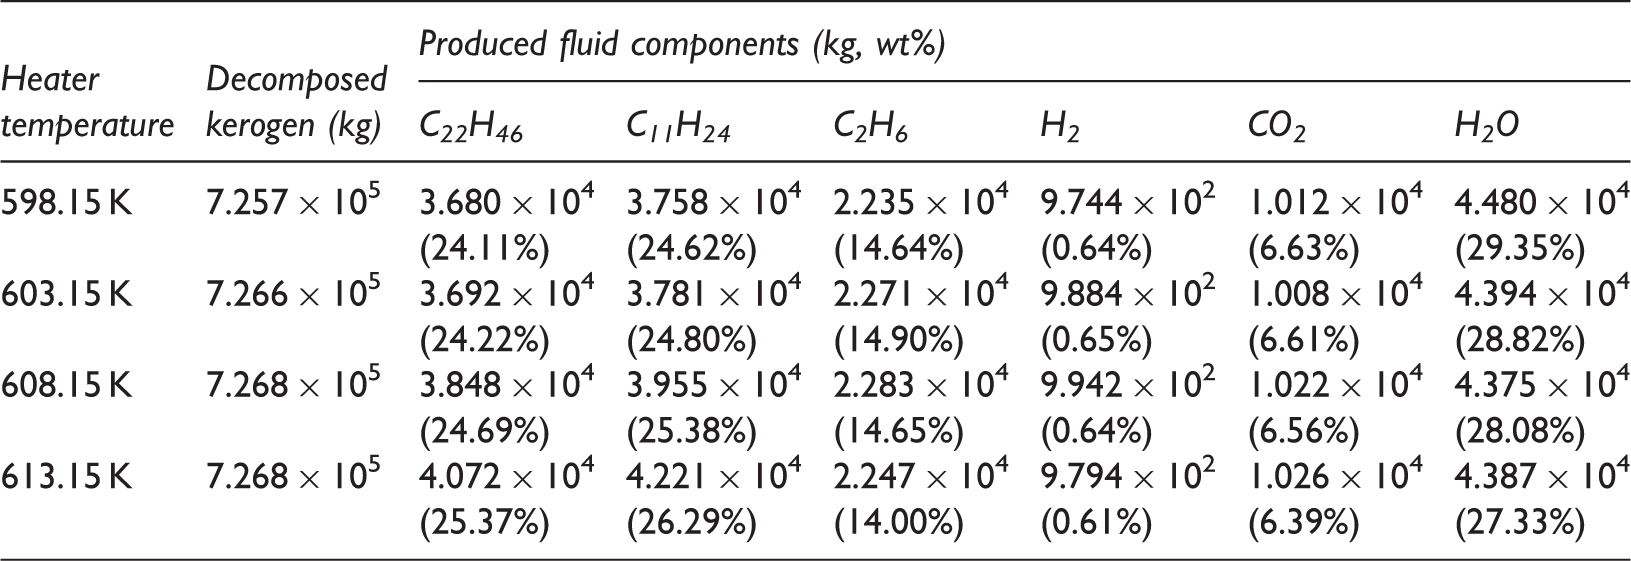
ICP: In situ Conversion Process.
A grid block at the center of the simulation model has been monitored to measure the kerogen volume fraction in solid phase, saturation of solid phase, effective porosity, and absolute permeability of the matrix. Figure 11 shows the observation results. In Figure 11(a), it is found that kerogen actively decomposes from 80 to 85 days in each case. In Figure 11(b), the solid phase saturation at the monitoring point gradually decreases from t = 0 to 80 days, because the saturation of aqueous phase increases due to the expansion as the reservoir pressure increases by heating. From t = 80 days, the saturation of solid phase rapidly decreases by kerogen decomposition in every case until it approaches constant value. The saturations of solid phase at the end of the simulation are 36.66%, 36.70%, 36.78%, and 37.91% in the cases 1, 2, 3, and 4, respectively. The slight increase of the solid phase saturation is caused by the increase of the masses of solid products as the heater temperature increases, by the more vigorous chemical reactions.
Observation results at the monitoring point in the applied ICP cases: (a) Kerogen volume fraction, (b) Saturation of solid phase, (c) Effective porosiy and (d) Absolute permeability of matrix domain.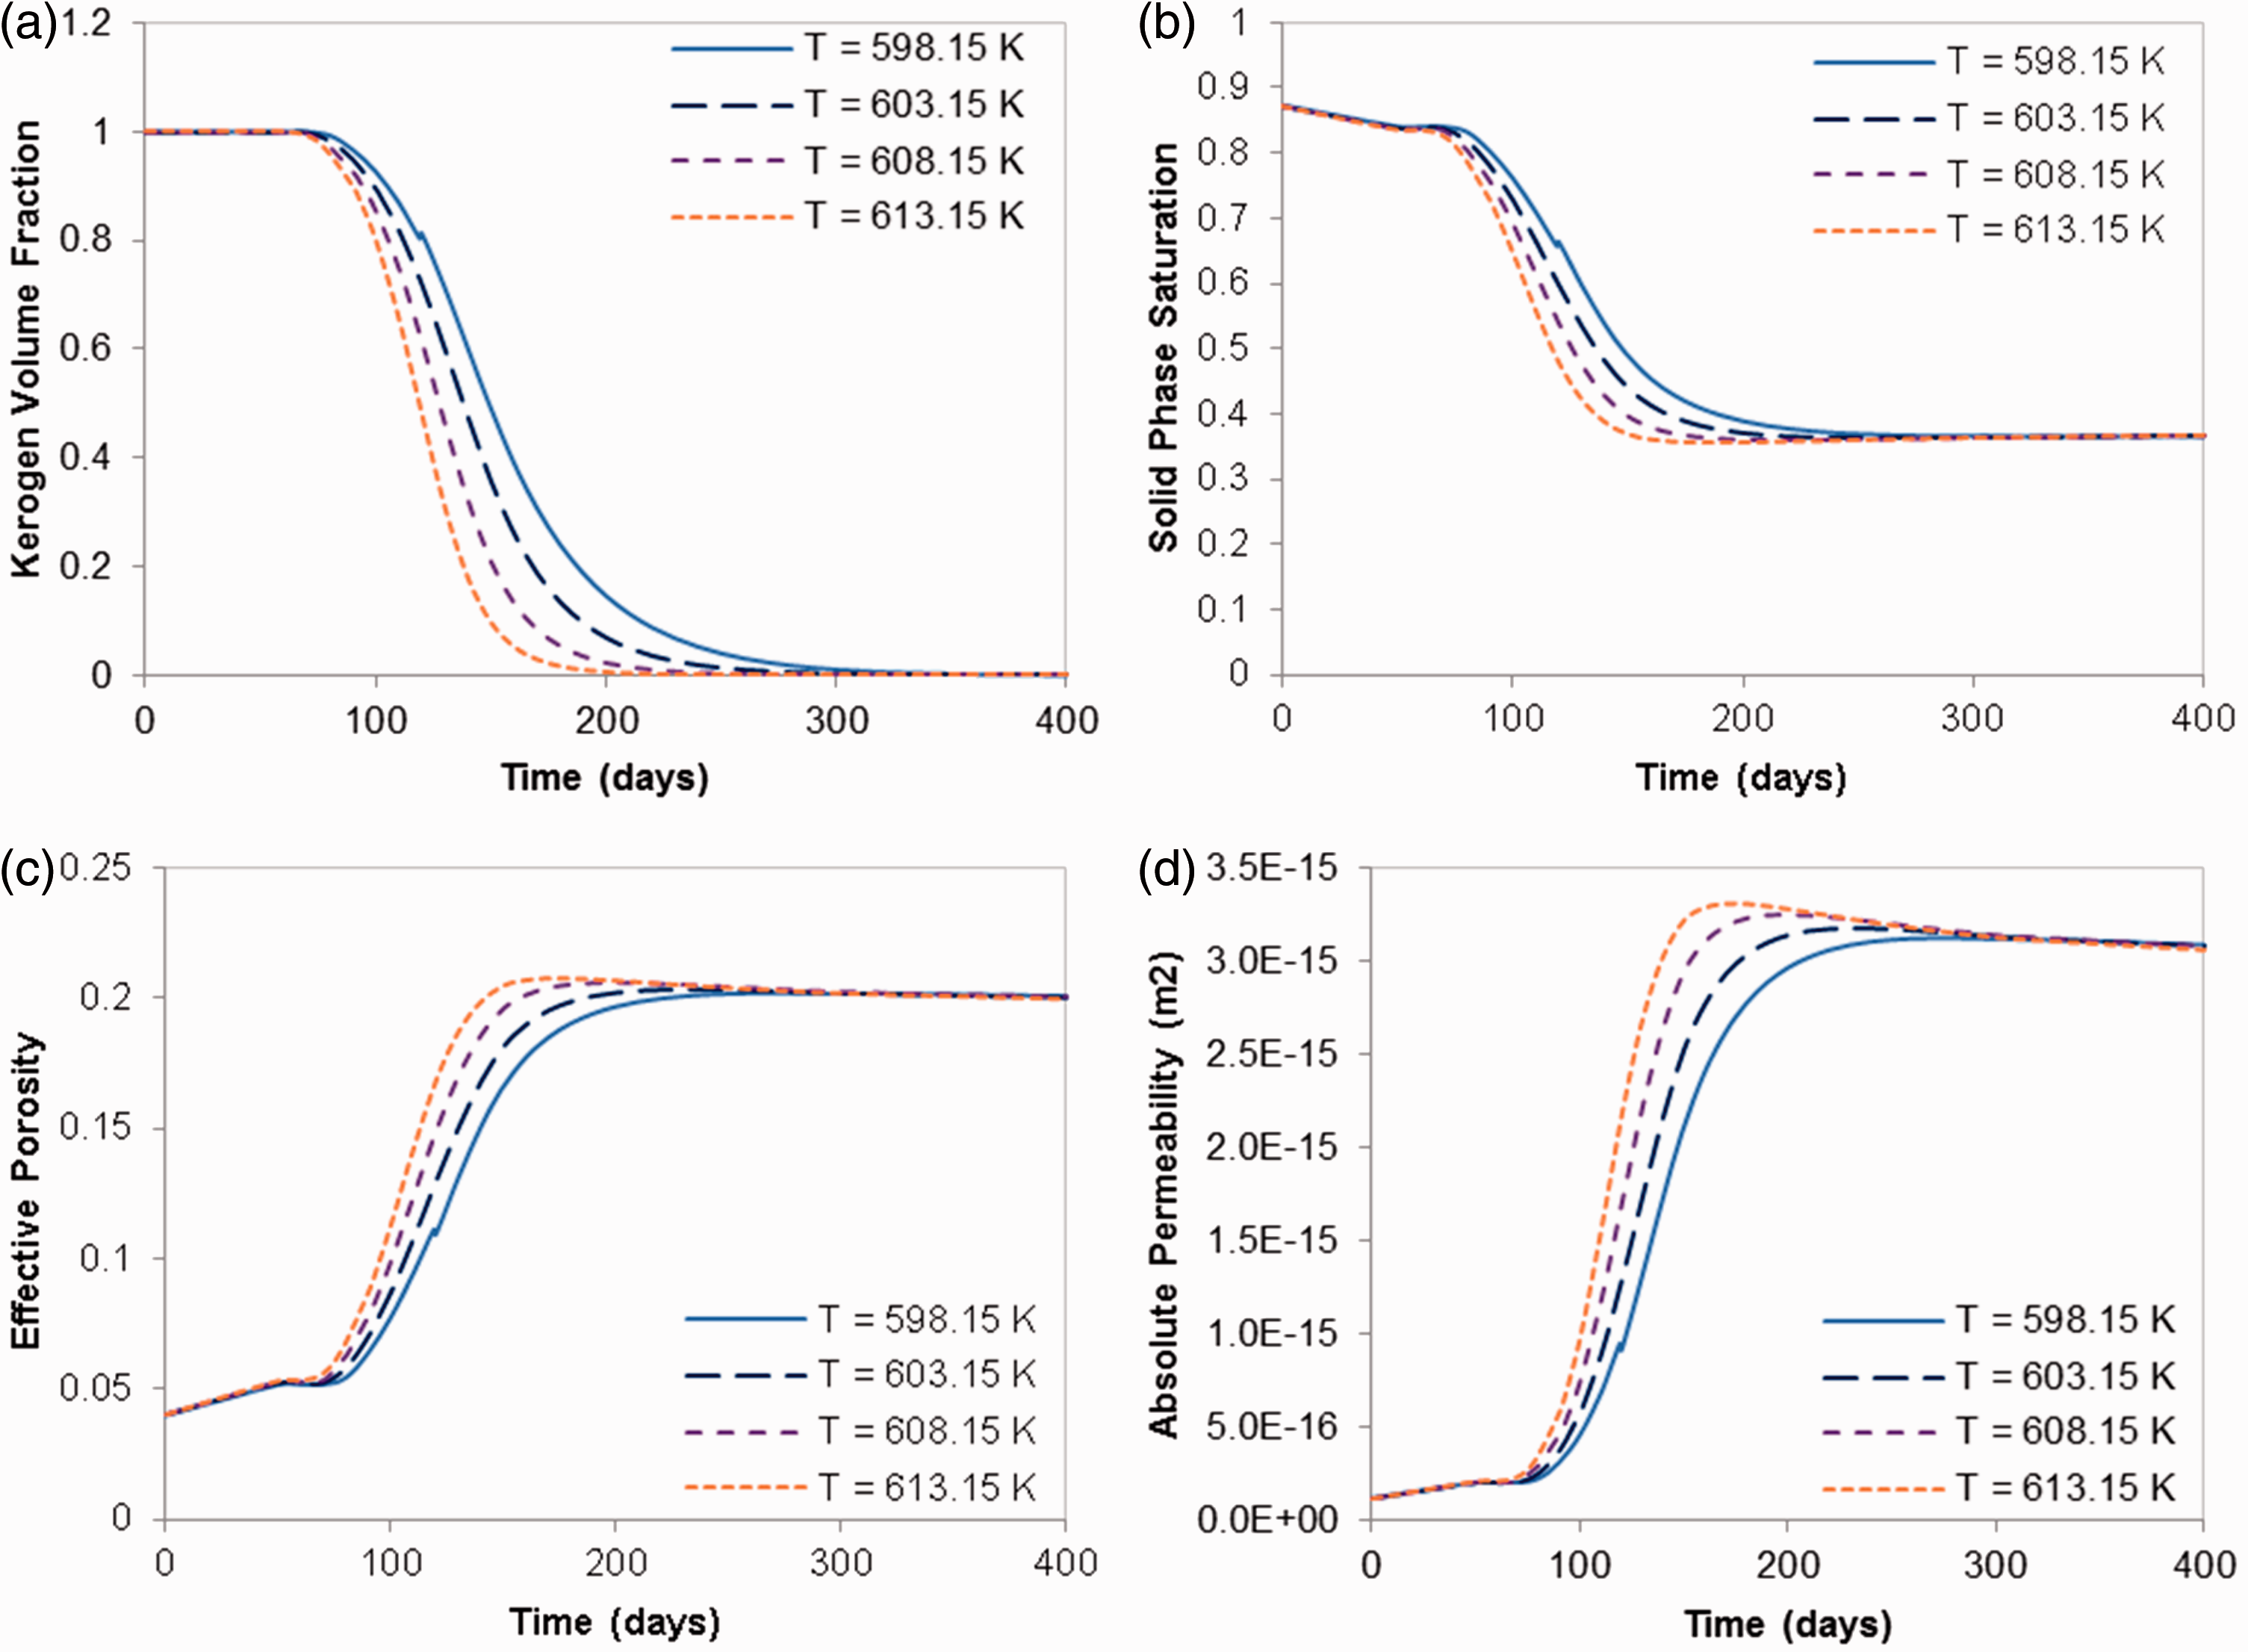
Figure 11(c) and (d) shows the evolution of effective porosity and absolute permeability of the matrix domain as the process of heating and production proceeds. From t = 0 to 80 days, the effective porosity and corresponding absolute permeability gradually increase by increasing reservoir pressure due to the heating, and following fluid expansion. As kerogen decomposes, the effective porosity and the absolute permeability rapidly increase after t = 80 days.
At the end of the simulation, the values of effective porosity are 20.06%, 20.05%, 20.03%, and 19.99% in the cases 1, 2, 3, and 4, respectively. The values of corresponding absolute permeability of the matrix are 3.090 × 10⁻¹⁵ m2, 3.086 × 10⁻¹⁵ m2, 3.079 × 10⁻¹⁵ m2, and 3.066 × 10⁻¹⁵ m2, respectively. The media porosity including solid phase at the end of the simulation is around 31.7% in every case, and the presence of solid phase reduces the absolute permeability of the matrix. The decrease of absolute permeability due to the presence of solid phase is 4.736 × 10⁻¹⁵ m2.
Applied Electrofrac cases
Kerogen mass in place and phases productions of the applied Electrofrac cases are provided in Figure 12. Figure 12(a) shows that the kerogen mass in place stops decreasing and reaches to a certain value at the end of the process in each case. Almost whole kerogen has decomposed in the case of hydraulic fracture spacing = 10 m, while there has remained kerogen mass in place in the cases of hydraulic fracture spacing = 15 m and 20 m. Figure 12 shows the phases productions of the simulation cases. In Figure 12(b), it is found that the aqueous phase production rate reaches to a high value at the beginning of the process and gradually decreases in each case. This is because the distance between the hydraulic fracture and the production well is far, and only aqueous phase is produced at the early time of the process. The peaks of the aqueous phase production rates are 7.429 × 10⁻³ kg/s (=5.383 STB/D), 7.043 × 10⁻³ kg/s (=5.103 STB/D), and 7.095 × 10⁻³ kg/s (=5.141 STB/D) in the cases 1, 2, and 3, respectively. The unstable aqueous phase production rate has been caused by the compositional effects of decreasing wellbore flowing pressure of production well, continuous decomposition of kerogen into oil, gas, water, and other components, and changes of relative permeability of phases.
Applied Electrofrac cases–kerogen mass in place and phases productions in one hydraulic fracture unit: (a) Kerogen mass in place, (b) Production rates of aqueous phase, (c) Production rates of liquid organic phase and (d) Production rates of gaseous phase.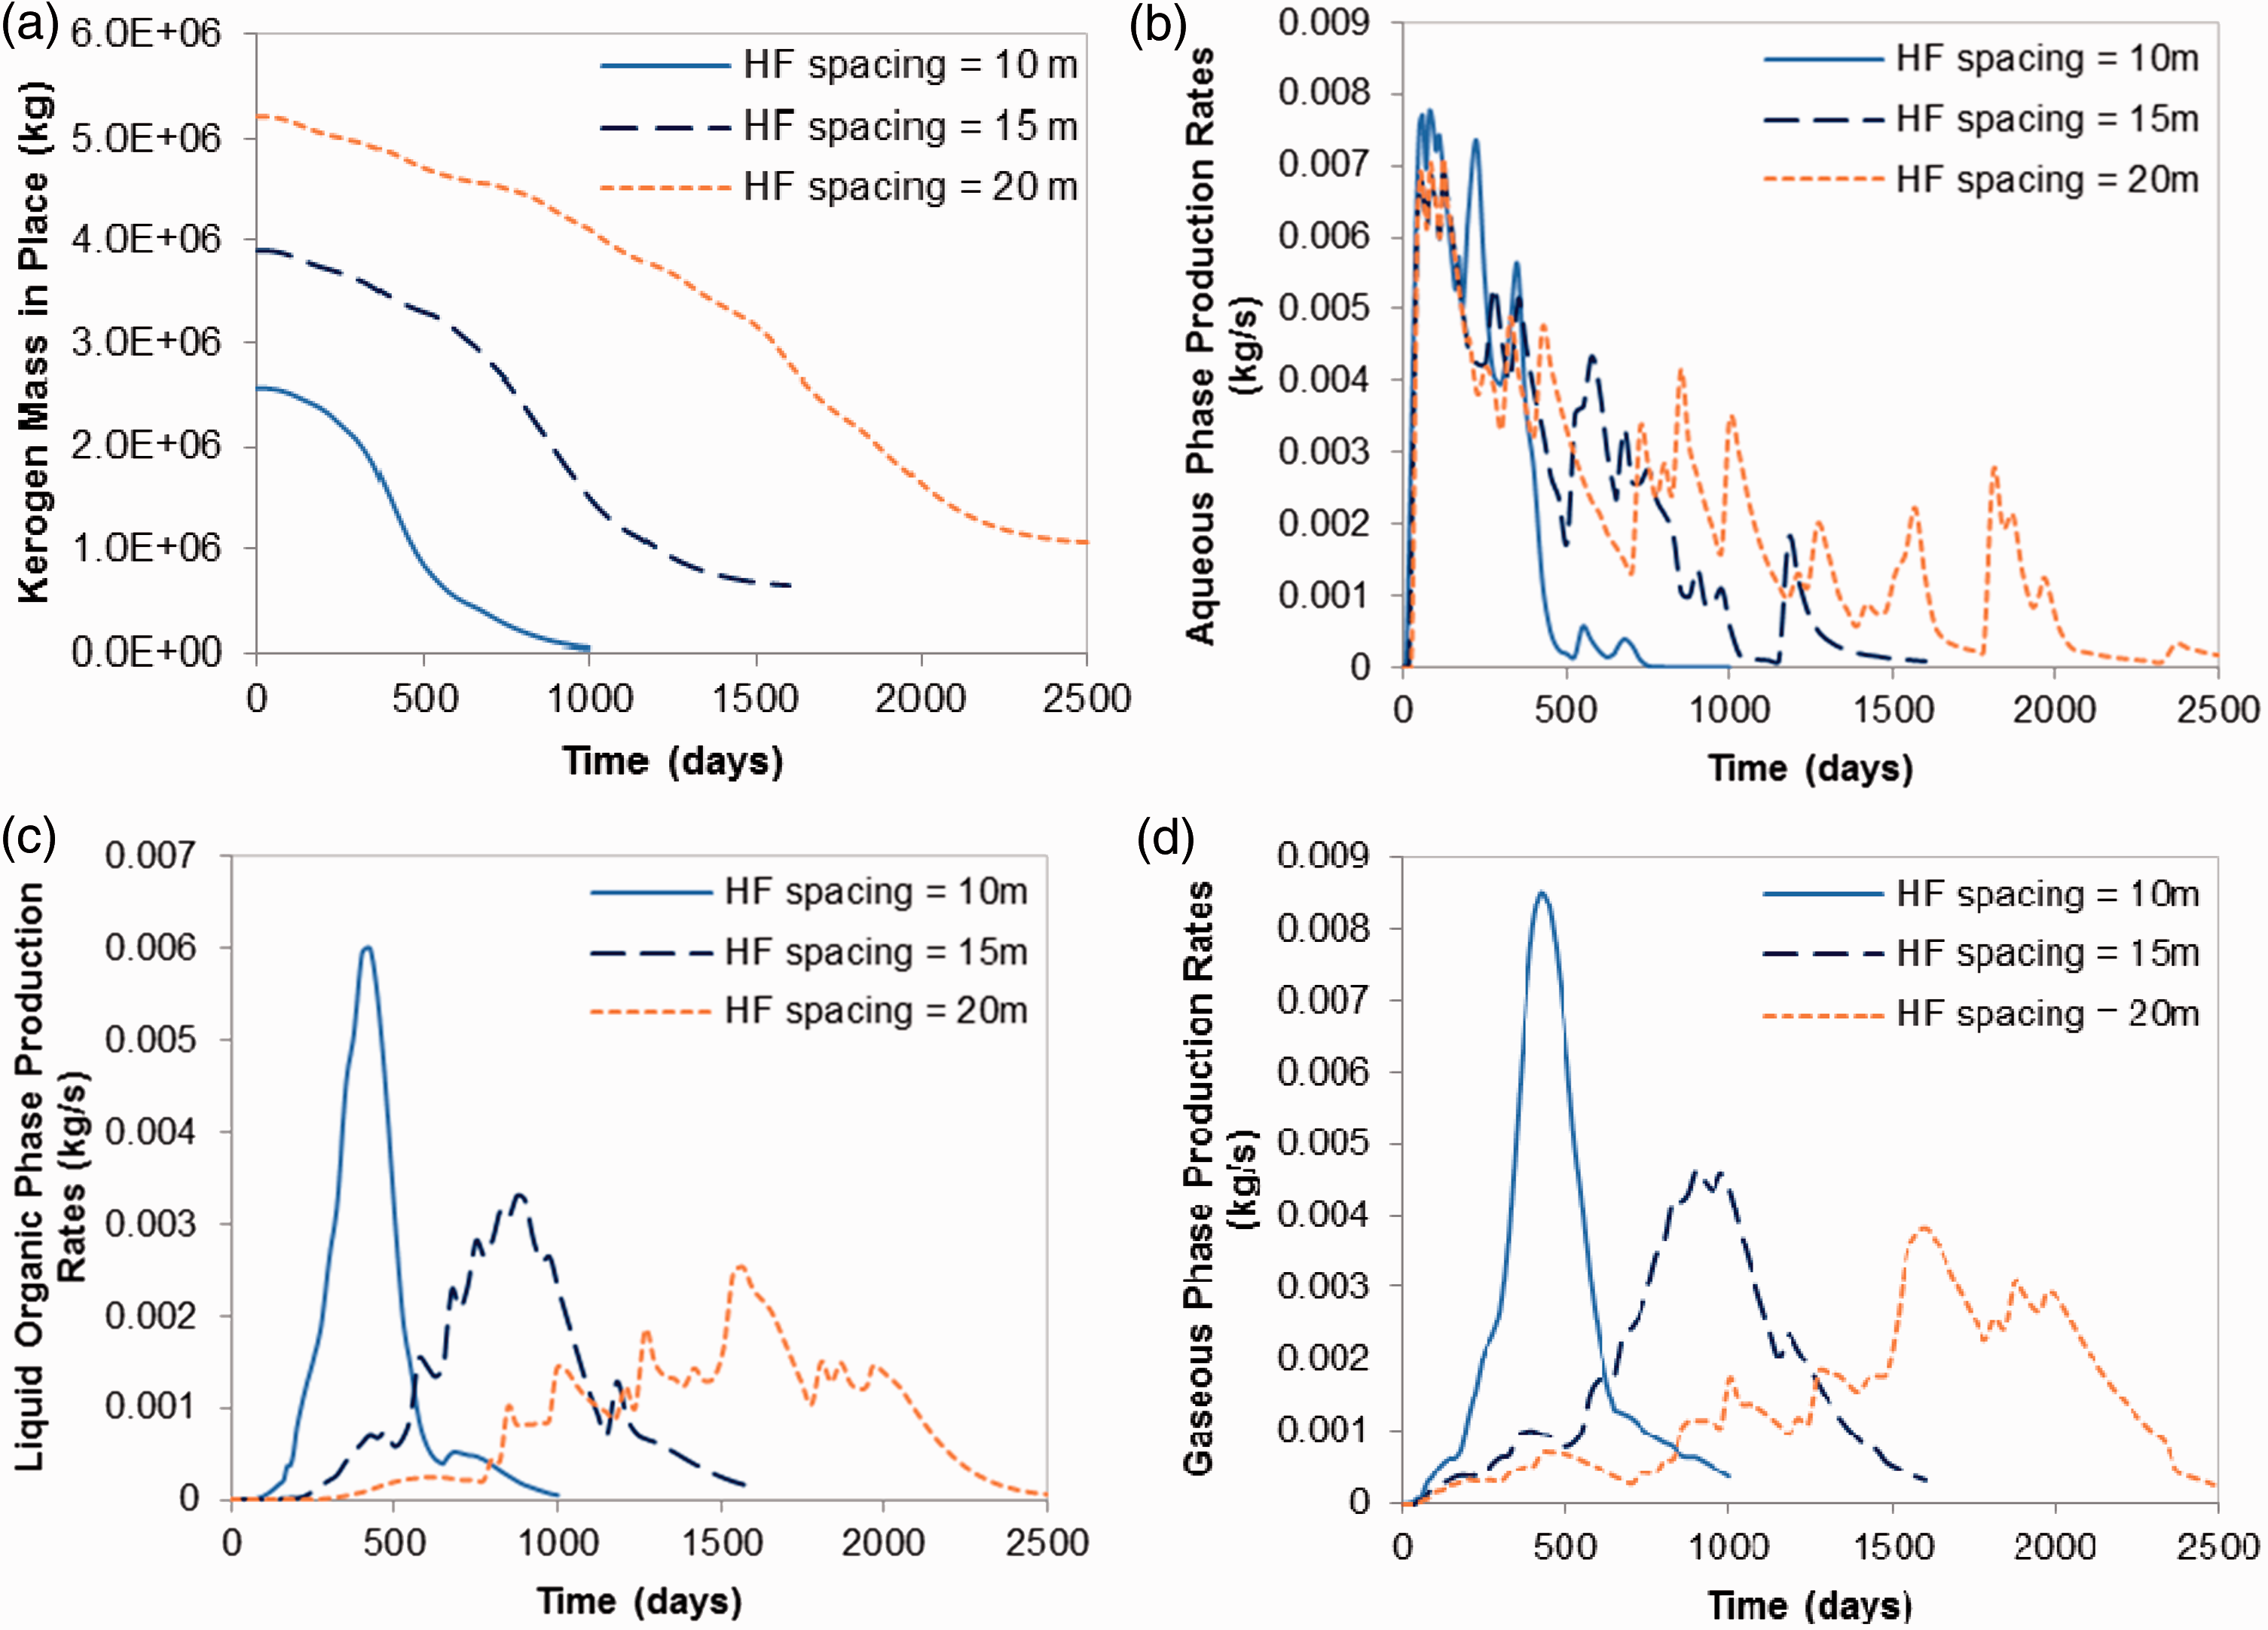
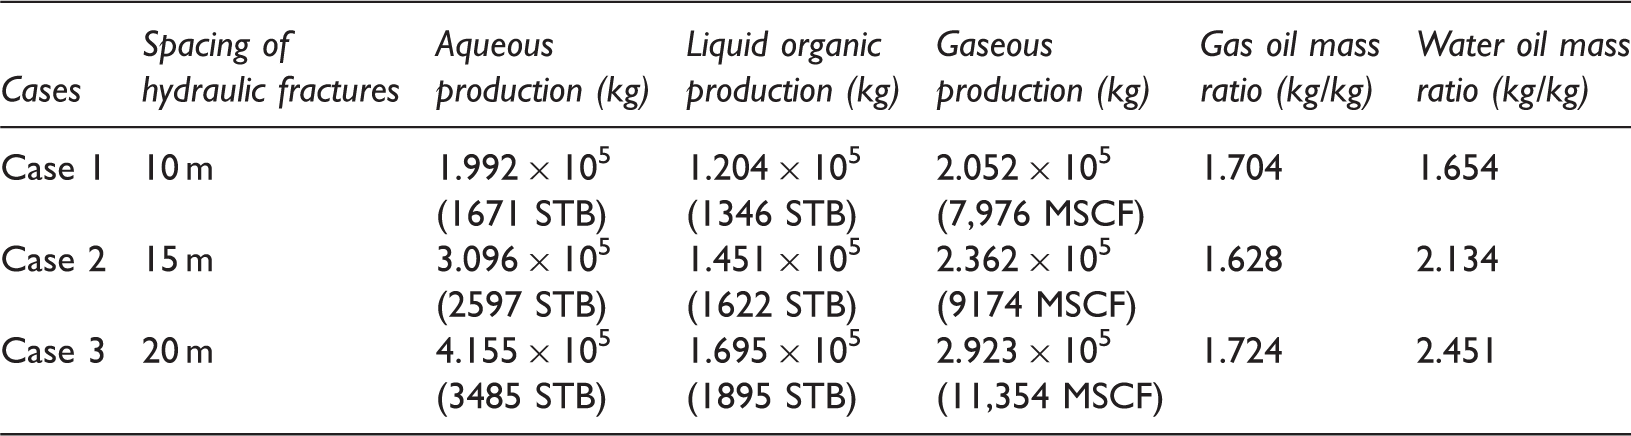
Applied Electrofrac cases–phases productions, gas oil mass ratio, and water oil mass ratio in one fracture unit.
Applied Electrofrac cases–masses of decomposed kerogen and produced components in one fracture unit.
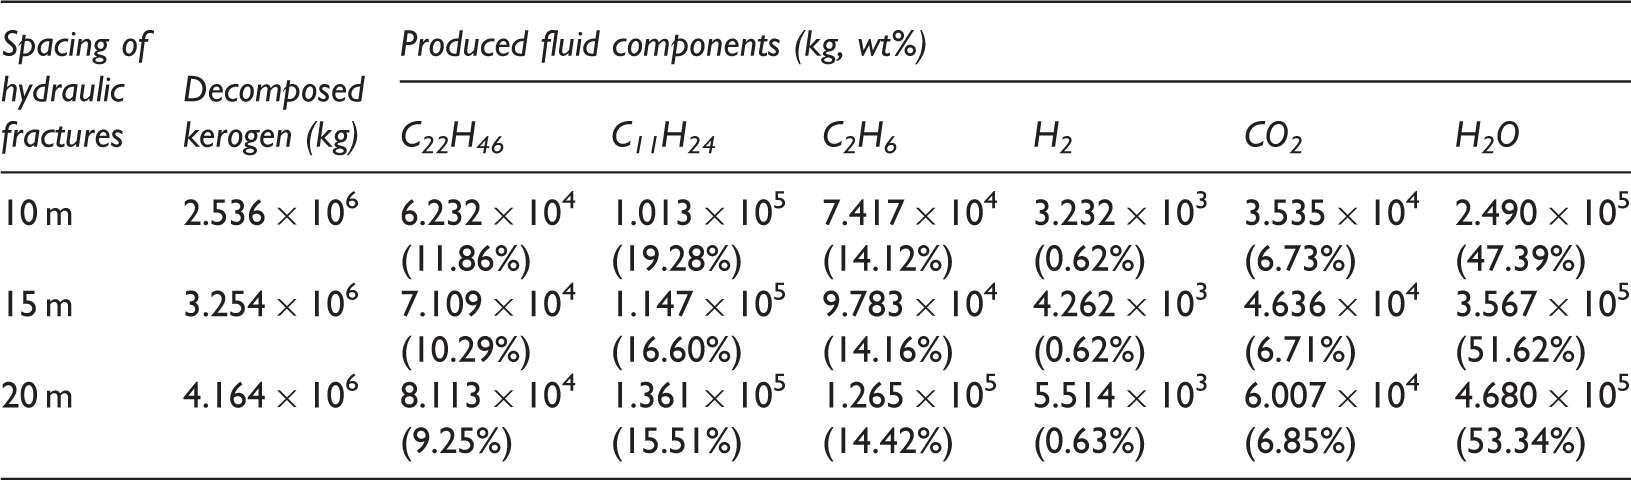
The total weight percentages of hydrocarbon components in the produced fluids are 42.56%, 41.05%, and 39.18% in the cases 1, 2, and 3, respectively. The percentages of produced hydrocarbon mass to the decomposed kerogen mass are 9.38%, 8.72%, and 8.26% in the cases 1, 2, and 3, respectively.
Applied Steamfrac cases
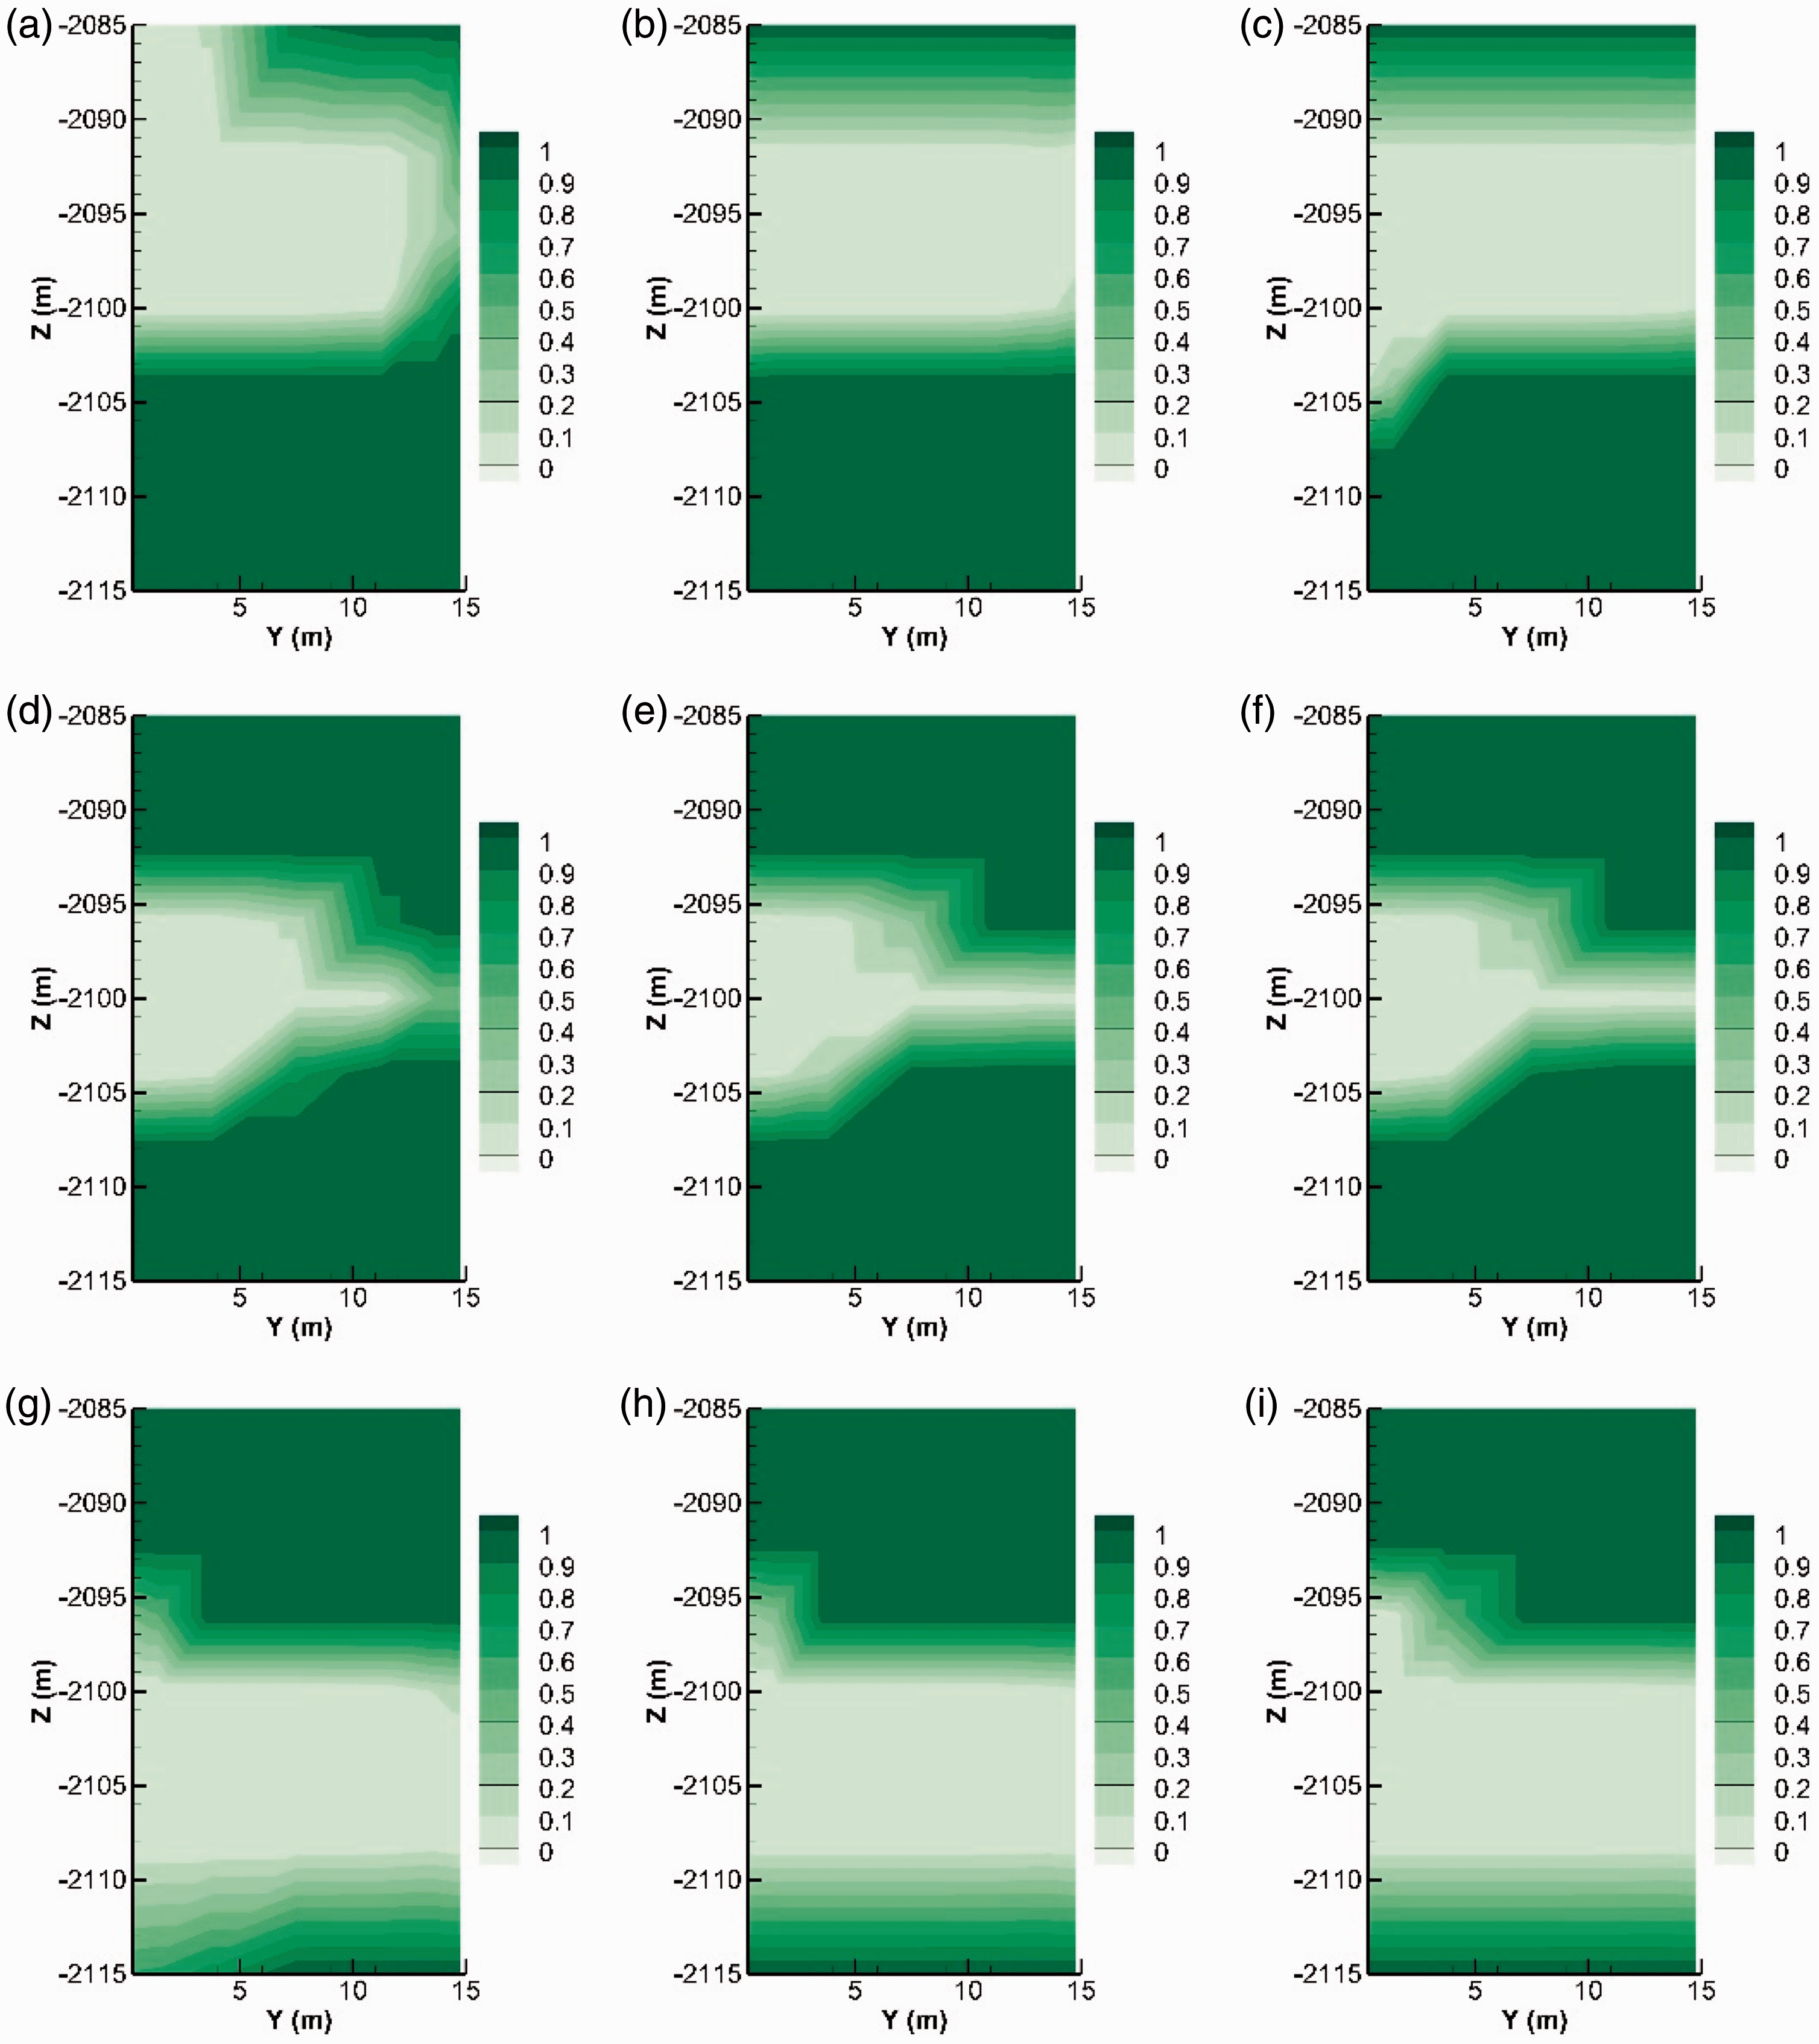
Kerogen mass in place and phases productions of the applied Steamfrac cases are provided in Figure 13. Figure 13(a) shows that the more kerogen has remained in the system after the process in the case 2, where the production well is located at the same depth to the injection well. In Figure 13 and Table 8, it is found that the total hydrocarbon production in the case 2 is smaller than that of the case 1 or case 3. The kerogen distribution profiles of each case in Figure 14 provide the reason; the volumes of kerogen decomposition are larger in the case 1 and case 3 than in the case 2 at the end of the process.
Applied Steamfrac cases–kerogen mass in place and phases productions in one hydraulic fracture unit: production well depth = 7.5 m above the injection well (case 1), production well depth = same depth to the injection well (middle of the reservoir) (case 2), production well depth = 7.5 m below the injection well (case 3): (a) Kerogen mass in place, (b) Production rates of aqueous phase, (c) Production rates of liquid organic phase and (d) Production rates of gaseous phase. Applied Steamfrac cases–phases productions, gas oil mass ratio, and water oil mass ratio in one fracture unit: production well depth = 7.5 m above the injection well (case 1), production well depth = same depth to the injection well (middle of the reservoir) (case 2), production well depth = 7.5 m below the injection well (case 3). Applied Steamfrac cases–profiles of kerogen volume fraction in solid phase at t = 1000 days: production well depth = 7.5 m above the injection well (case 1), production well depth = same depth to the injection well (middle of the reservoir) (case 2), production well depth = 7.5 m below the injection well (case 3): (a) X = 0.04 m (case 1), (b) X = 3.75 m (case 1), (c) X = 7.5 m (case 1), (d) X = 0.04 m (case 2), (e) X = 3.75 m (case 2), (f) X = 7.5 m (case 2), (g) X = 0.04 m (case 3), (h) X = 3.75 m (case 3) and (i) X = 7.5 m (case 3).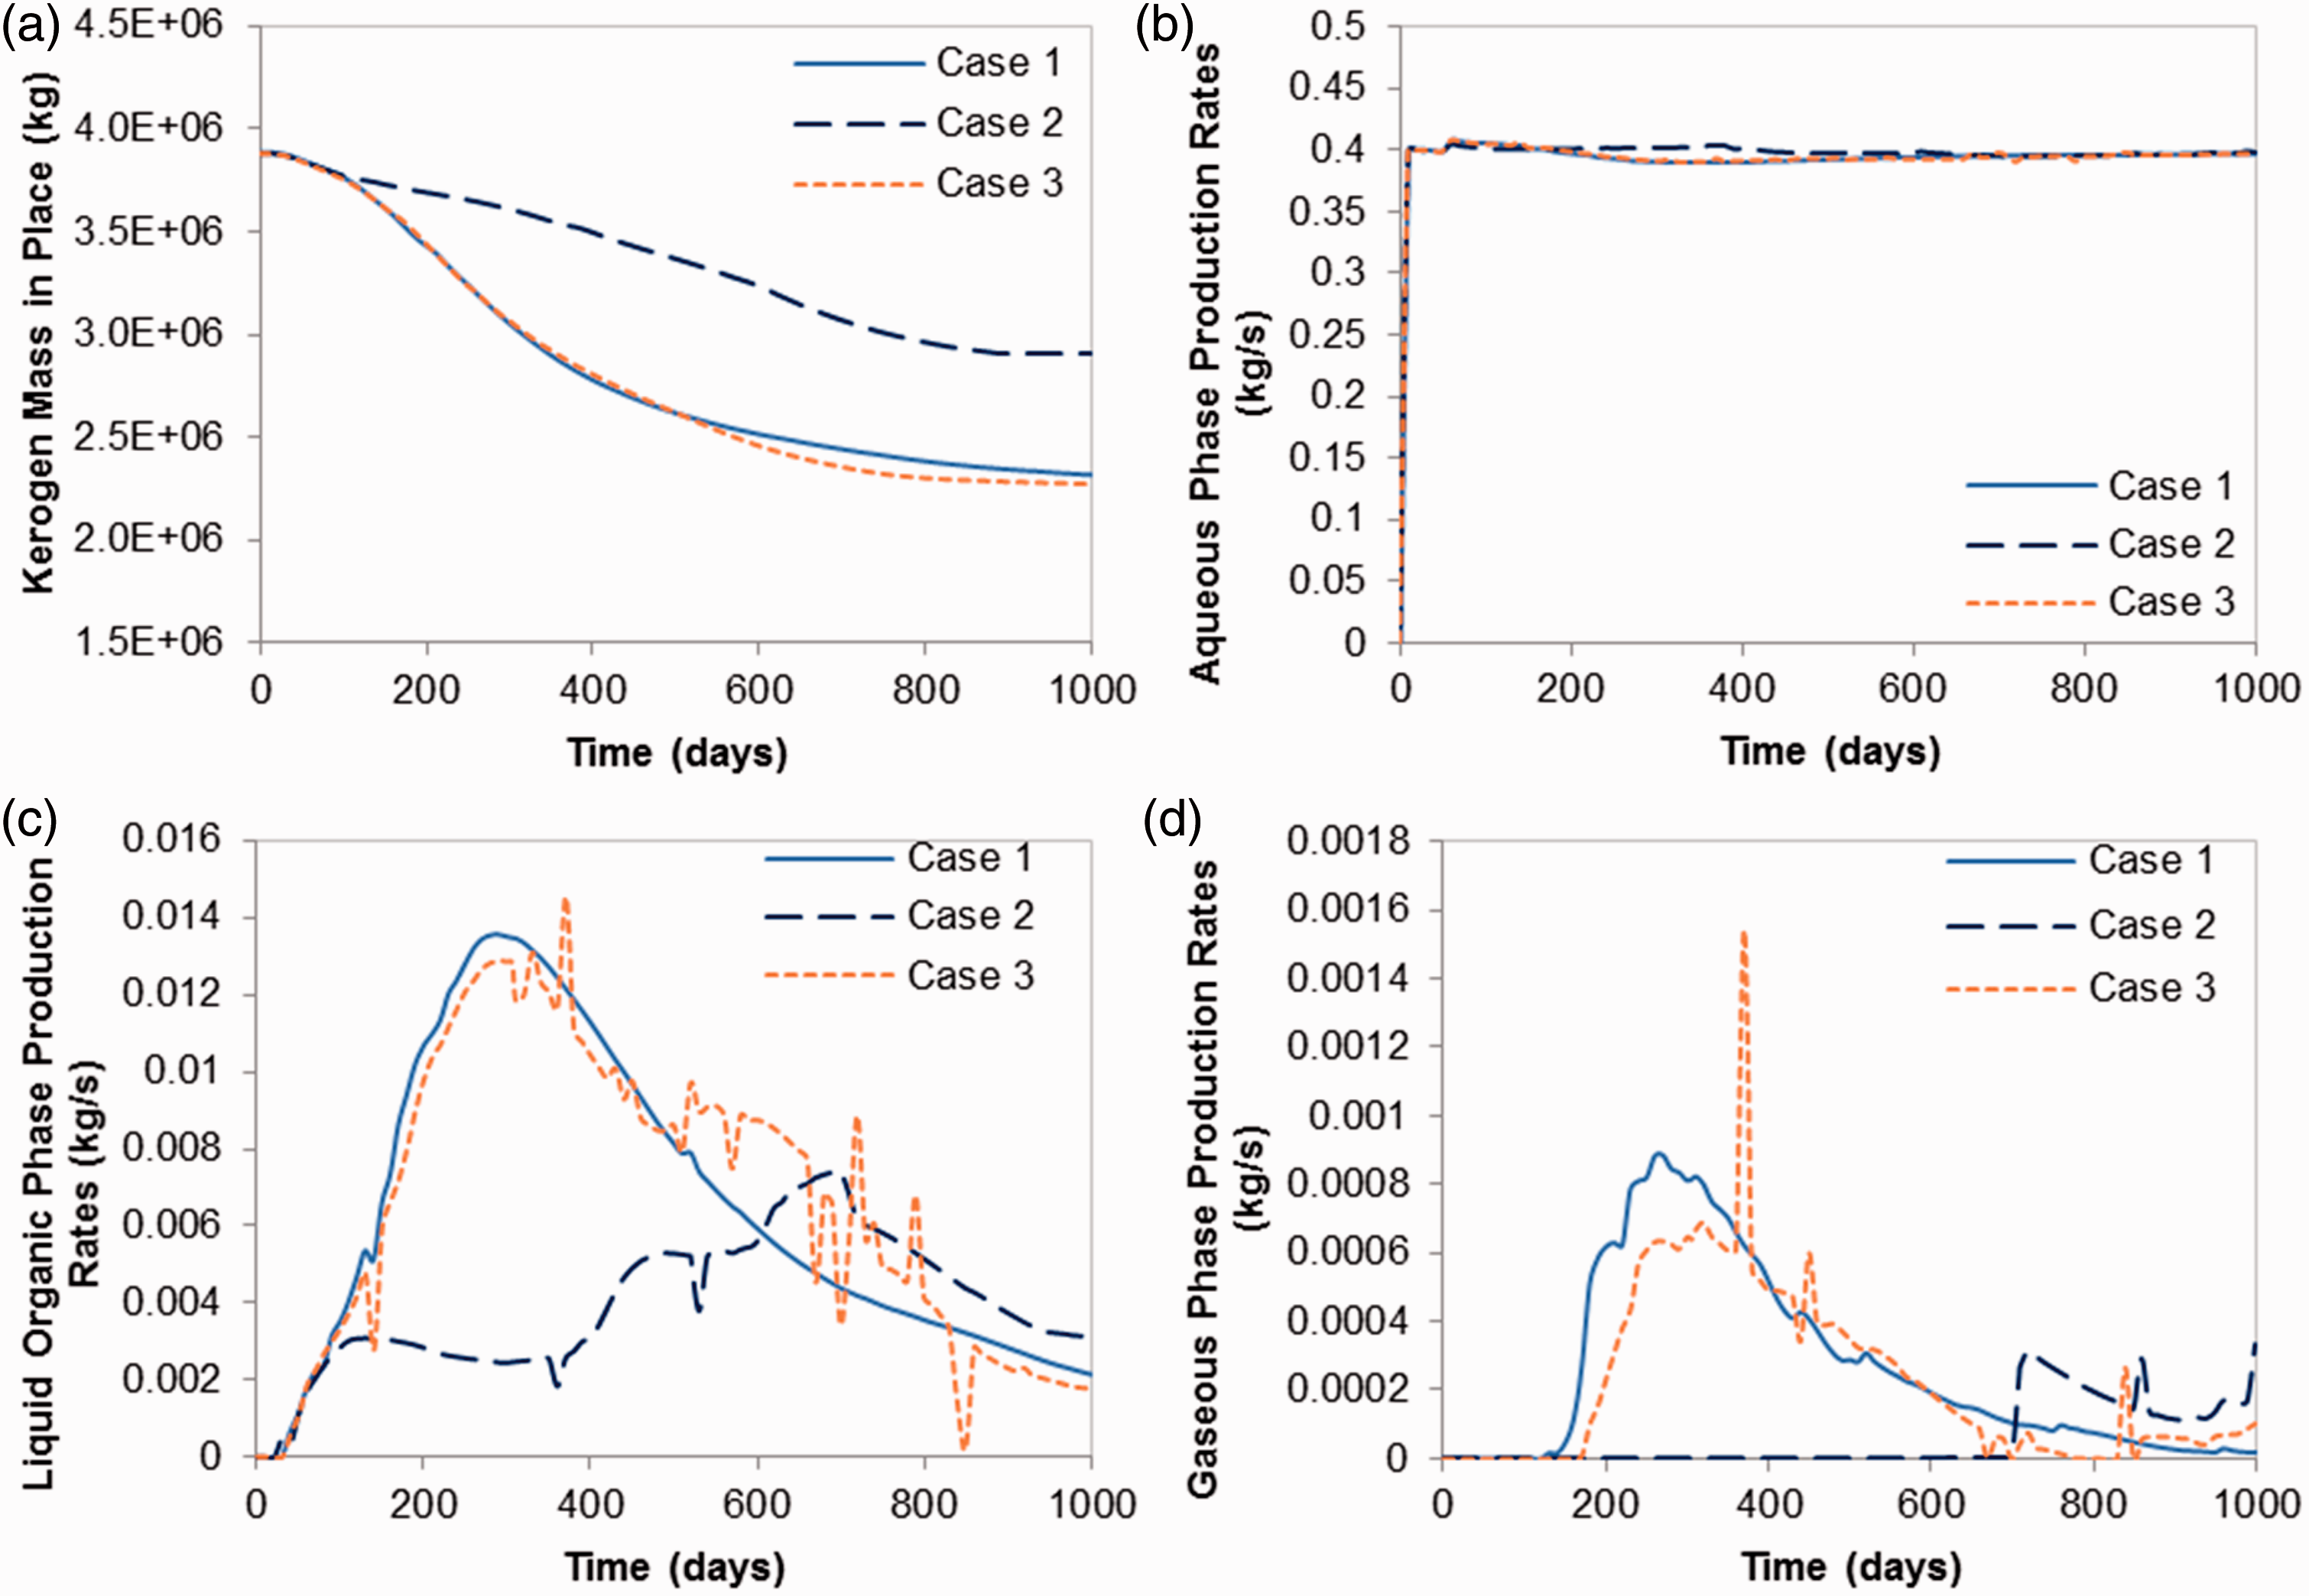
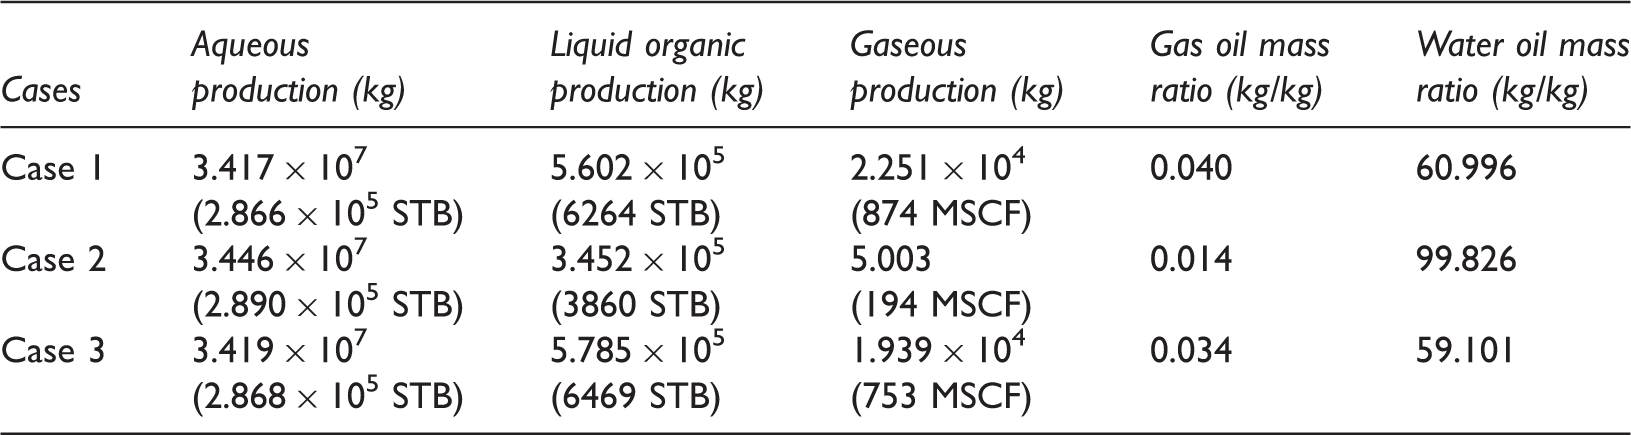
In Figure 13(b), it is found that the aqueous phase production rate remains the same to the injection rate of hot water in every case. The cumulative productions of liquid organic phase are higher in the case 1 and case 3 than in the case 2. The peaks of liquid organic phase production rate are 0.014 kg/s (=13.098 STB/D), 7.437 × 10⁻³ kg/s (=7.185 STB/D), 0.015 kg/s (=14.063 STB/D) in the cases 1, 2, and 3, respectively. Figure 13(e) shows that the case 2 has the later start and the lower rate of gaseous phase production than the case 1 or case 3. This is caused by that the small amount of generated gaseous phase rises rather than flows to the production wells in the case 2. The case 1 has the highest cumulative production of gaseous phase and the highest gas oil mass ratio as provided in Figure 13(d) and Table 8. Comparing with the applied ICP and Electrofrac cases, this process shows the much lower gas oil mass ratio because of dominant productions of aqueous phase that sweeps liquid organic phase. The peaks of gaseous phase production rate are 8.846 × 10⁻⁴ kg/s (=2.454 MSCF/D), 2.823 × 10⁻⁴ kg/s (=0.783 MSCF/D), 1.545 × 10⁻³ kg/s (=4.286 MSCF/D) in the cases 1, 2, and 3, respectively. As expected, the water oil mass ratio is far higher than the applied ICP and Electrofrac cases in this process.
Applied Steamfrac cases–masses of decomposed kerogen and produced components in one fracture unit: production well depth = 7.5 m above the injection well (case 1), production well depth = same depth to the injection well (middle of the reservoir) (case 2), production well depth = 7.5 m below the injection well (case 3).
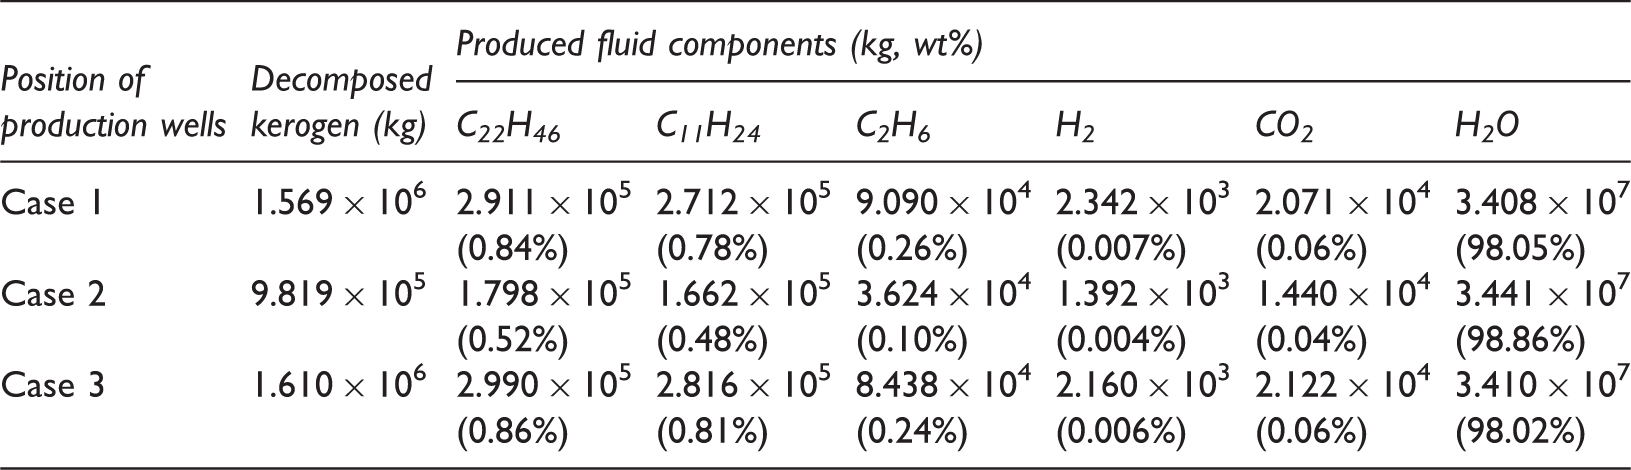
The total weight percentages of hydrocarbon components (heavy oil, light oil, and hydrocarbon gas) in the produced fluids are 1.88%, 1.10%, and 1.91% in the cases 1, 2, and 3, respectively. The percentages of produced hydrocarbon mass to the decomposed kerogen mass are 41.64%, 38.93%, and 41.29% in the cases 1, 2, and 3, respectively.
Conclusion
In this study, we investigated the diverse in situ upgrading processes applying the ideas of ICP, Electrofrac, and Steamfrac methods. The effects of each process on the productions of phases and components have been analyzed. From the simulations, we have the following specific conclusions.
Applied ICP cases have showed increasing hydrocarbon production with increasing heater temperature. Applied Electrofrac cases have showed increasing hydrocarbon production with increasing spacing of hydraulic fractures. Applied Steamfrac cases have showed that the case of the production well at the middle of the reservoir (case 2) had the lowest hydrocarbon production due to the least distribution of heat among the cases. In every case of applied ICP and one case of applied Electrofrac, whole kerogen in the system has decomposed. The applied ICP cases have showed the highest total weight percentage of hydrocarbon components in the produced fluids, and the applied Electrofrac cases have followed it. The weight percentage of produced hydrocarbons to the decomposed kerogen was highest in the cases of applied Steamfrac, by the continuously injected hot water sweeping the liquid organic phase.
The improved results can be brought by considering following issues.
Sector models have been used in the simulations, by assuming that the system responded identically in each repeatable patterns of minimum units. However, the better description of subsequent heating and boundary conditions will achieve more realistic simulations. Coarse grids systems have been used in the simulations for the computation efficiency. Finer grids systems will reduce the numerical dispersion. By the same reason to (2), the hydraulic fracture systems of small sizes have been used in the simulations of applied Electrofrac and Steamfrac. Differing application strategies such as pattern geometry and heating period in each in situ upgrading process are expected to produce very variable results of productivity, product selectivity, and heating efficiency. The simulations have revealed technical feasibility of each process. Envisioned works include the evaluation of energy efficiency and process economics of each process.
Footnotes
Declaration of conflicting interests
The author(s) declared no potential conflicts of interest with respect to the research, authorship, and/or publication of this article.
Funding
The author(s) disclosed receipt of the following financial support for the research, authorship, and/or publication of this article: The authors appreciate Crisman Institute for Petroleum Research of Texas A&M University for supporting this study.