
Abstract
Shale oil and gas have the potential to support the global shift towards clean energy. Despite numerous studies on bituminous sand within the Turonian-Maastrichtian Afowo Formation, comprehensive data on its shale oil and gas potential remain limited. Subsurface samples were collected from shale exposures along stream channels at 100 m and investigated. The rock-eval pyrolysis of the samples indicates total organic carbon (TOC) values from 0.9 to 4.2 wt%, indicating good to excellent source rock. The S1 values range from 0.56 to 9.64 mg HC/g rock. At the same time, S2 values range from 1.25 to 25.56 mg HC/g rock. The Tmax values of <435 and PI < 0.4 indicate that the samples are immature. The inferred vitrinite reflectance (Cal%Ro) between 0.02% and 0.42% shows immature source rock. Mineralogical and scanning electron microscopy (SEM-EDX) analysis show that the sample is characterized by a high content of quartz (12.8–61.8%), framboid pyrite, plant pollen-like structures, spore-like structures, and high porosity. The mass chromatogram of the saturated hydrocarbon fraction of the shale indicates an oxidative-reduction condition of organic matter sedimentation due to the slight dominance of nC27 regular sterane over nC28 and nC29 steranes. Furthermore, the abundance of nC24 tetracyclic terpanes could be associated with higher land-plant sources, suggesting a mixed source input. However, the cross plot of Pr/nC17 and Ph/nC18 indicates a mixed organic matter from continental and marine environments in a transitional depositional milieu. The marine-continental shales are interbedded with bitumen exhibiting highly anomalous resistivity bodies (closures) distorting the sedimentary sequence based on the electrical resistivity tomography, prone to generate shale oil and gas.
Introduction
Shale oil and gas are critical to a sustainable economy due to their potential to contribute to the global transition to clean energy. Unlike the conventional hydrocarbon system that requires migration from a source to a reservoir rock, sealed by trapping rock units, the shale gas system acts as a self-sourced rock, storage, and cap rock in a low-permeable organic-rich shale rock (Katz and Everett, 2016). At its best, shale gas development and production would require enhancing driver mechanisms to increase the reservoir pressure during exploitation from impermeable organic-rich shales. Enhancement mechanism techniques involving combined horizontal well-drilling and hydraulic fracturing technologies have been used to extract natural gas impregnated in the source rock (Akintola et al., 2023). Many countries have successfully applied these techniques at a commercial level, including the United States (Bilgili et al., 2020; Hammond et al., 2020; Jarvie et al., 2007), Canada (Pinti et al., 2016; Thomas et al., 2017; Umeozor et al., 2018), China (Feng et al., 2022; Sun et al., 2021; Zhang et al., 2022), Britain (Nwaobi and Anandarajah, 2018; Palci et al., 2020; Turk et al., 2018), and Poland (Adamus and Florkowski, 2016; Jarzyna et al., 2017; Johnson and Boersma, 2013).
In Sub-Saharan countries, petroliferous studies of inland basins for shale oil and gas exploration are in the early stages. In South Africa, the Whitehill Formation of the Ecca Group (De Kock et al., 2017; Nolte et al., 2019) has significantly contributed about 211 Tcf of technically recoverable shale gas to the Main Karoo Basin (MKB) of South Africa, positioning it as the sixth-largest global scale resource (EIA, 2013). Petrographic and geochemical evaluations of the Madzaringwe Formation (Akintola et al., 2022; Akintola and Edokpayi, 2023) and Mikambeni Formation (Akintola, 2023; Akintola et al., 2021). The Tuli Basin in the northeastern part of South Africa has revealed the predominance of kerogen Type-III with Tmax values ranging from 430 to 466°C, indicating thermal maturity levels with potential for wet gas generation. Furthermore, in Angola, the offshore Kwanza shale has revealed excellent reservoir and petrophysical characteristics to host natural gas based on well logs and seismic data interpretation (Bhuiyan et al., 2022; de Sá et al., 2020). In recent studies (Liu et al., 2023; Liu et al., 2022), the Kwanza Basin was found to contain high thermogenic shale gas composed of methane, and CO2, and solid bitumen in the Barremian-Aptian Red and Grey Cuvo formations.
In the same vein, the eastern Dahomey Basin has been characterized by an enormous onshore deposit of bitumen horizon and heavy oil from tar sands (Ogala et al., 2019). The Dahomey Basin is a trans-frontier transform basin that straddles the boundaries of West African countries, including Nigeria, Ghana, Togo, and Benin, with a varying sedimentary sequence of more than 3 km thickness, particularly towards the proximal offshore province. The Cretaceous stratigraphic succession of the basin comprises the Abeokuta Formation, characterized by three lithostratigraphic formations consisting of the Ise, Afowo, and Araromi formations.
Some studies (Akinmosin et al., 2009; Akinmosin and Melifonwu, 2017) have concentrated on the black shales in the Agbabu area, associated with the bitumen of the Afowo Formation of the Dahomey Basin. The proven reserve of tar sand and bitumen, estimated at 43 billion barrels of oil equivalent (bboe) is comparable to the conventional oil reserve in the Niger Delta Basin (Milos, 2015). Other studies have focused on tectonic evolution (Martins et al., 2021; Okoro et al., 2021), palynological and sequence stratigraphy (Bolaji et al., 2020; Fadiya et al., 2021; Olayiwola et al., 2021), petroleum occurrence (Adeoye et al., 2020; Falufosi and Osinowo, 2021), bituminous sediments (Bolaji et al., 2023; Jekayinfa et al., 2023; Ogala et al., 2019), and groundwater flow (Aladejana et al., 2021; Oyeyemi et al., 2023). Despite the decades of successful exploration on the bitumen horizon and heavy oil, prospecting for shale oil and gas on the onshore deposit of the Eastern Dahomey Basin has remained elusive. As such, this research aims to investigate the shale oil and gas potential of the carbonaceous shale in the eastern Dahomey Basin to mitigate the recent increasing demand for electricity supply, which is probably the most obvious sign of the energy security crisis.
Geological setting
Dahomey Basin is a trans-frontier transform basin that straddles the boundaries of West African countries, including Nigeria, Ghana, Togo, and Benin. The basin overly the Precambrian Basement complex in an unconformable manner with a varying sedimentary sequence of more than 3 km thickness, particularly towards the proximal offshore province (Falufosi and Osinowo, 2021). The Cretaceous stratigraphic succession of the basin comprises the Abeokuta Formation, characterized by three lithostratigraphic formations consisting of the Ise, Afowo, and Araromi Formations (Okosun, 1990). At the same time, the Tertiary lithostratigraphic sequence includes the Ewekoro, Oshosun, and Ilaro formations (Figure 1).
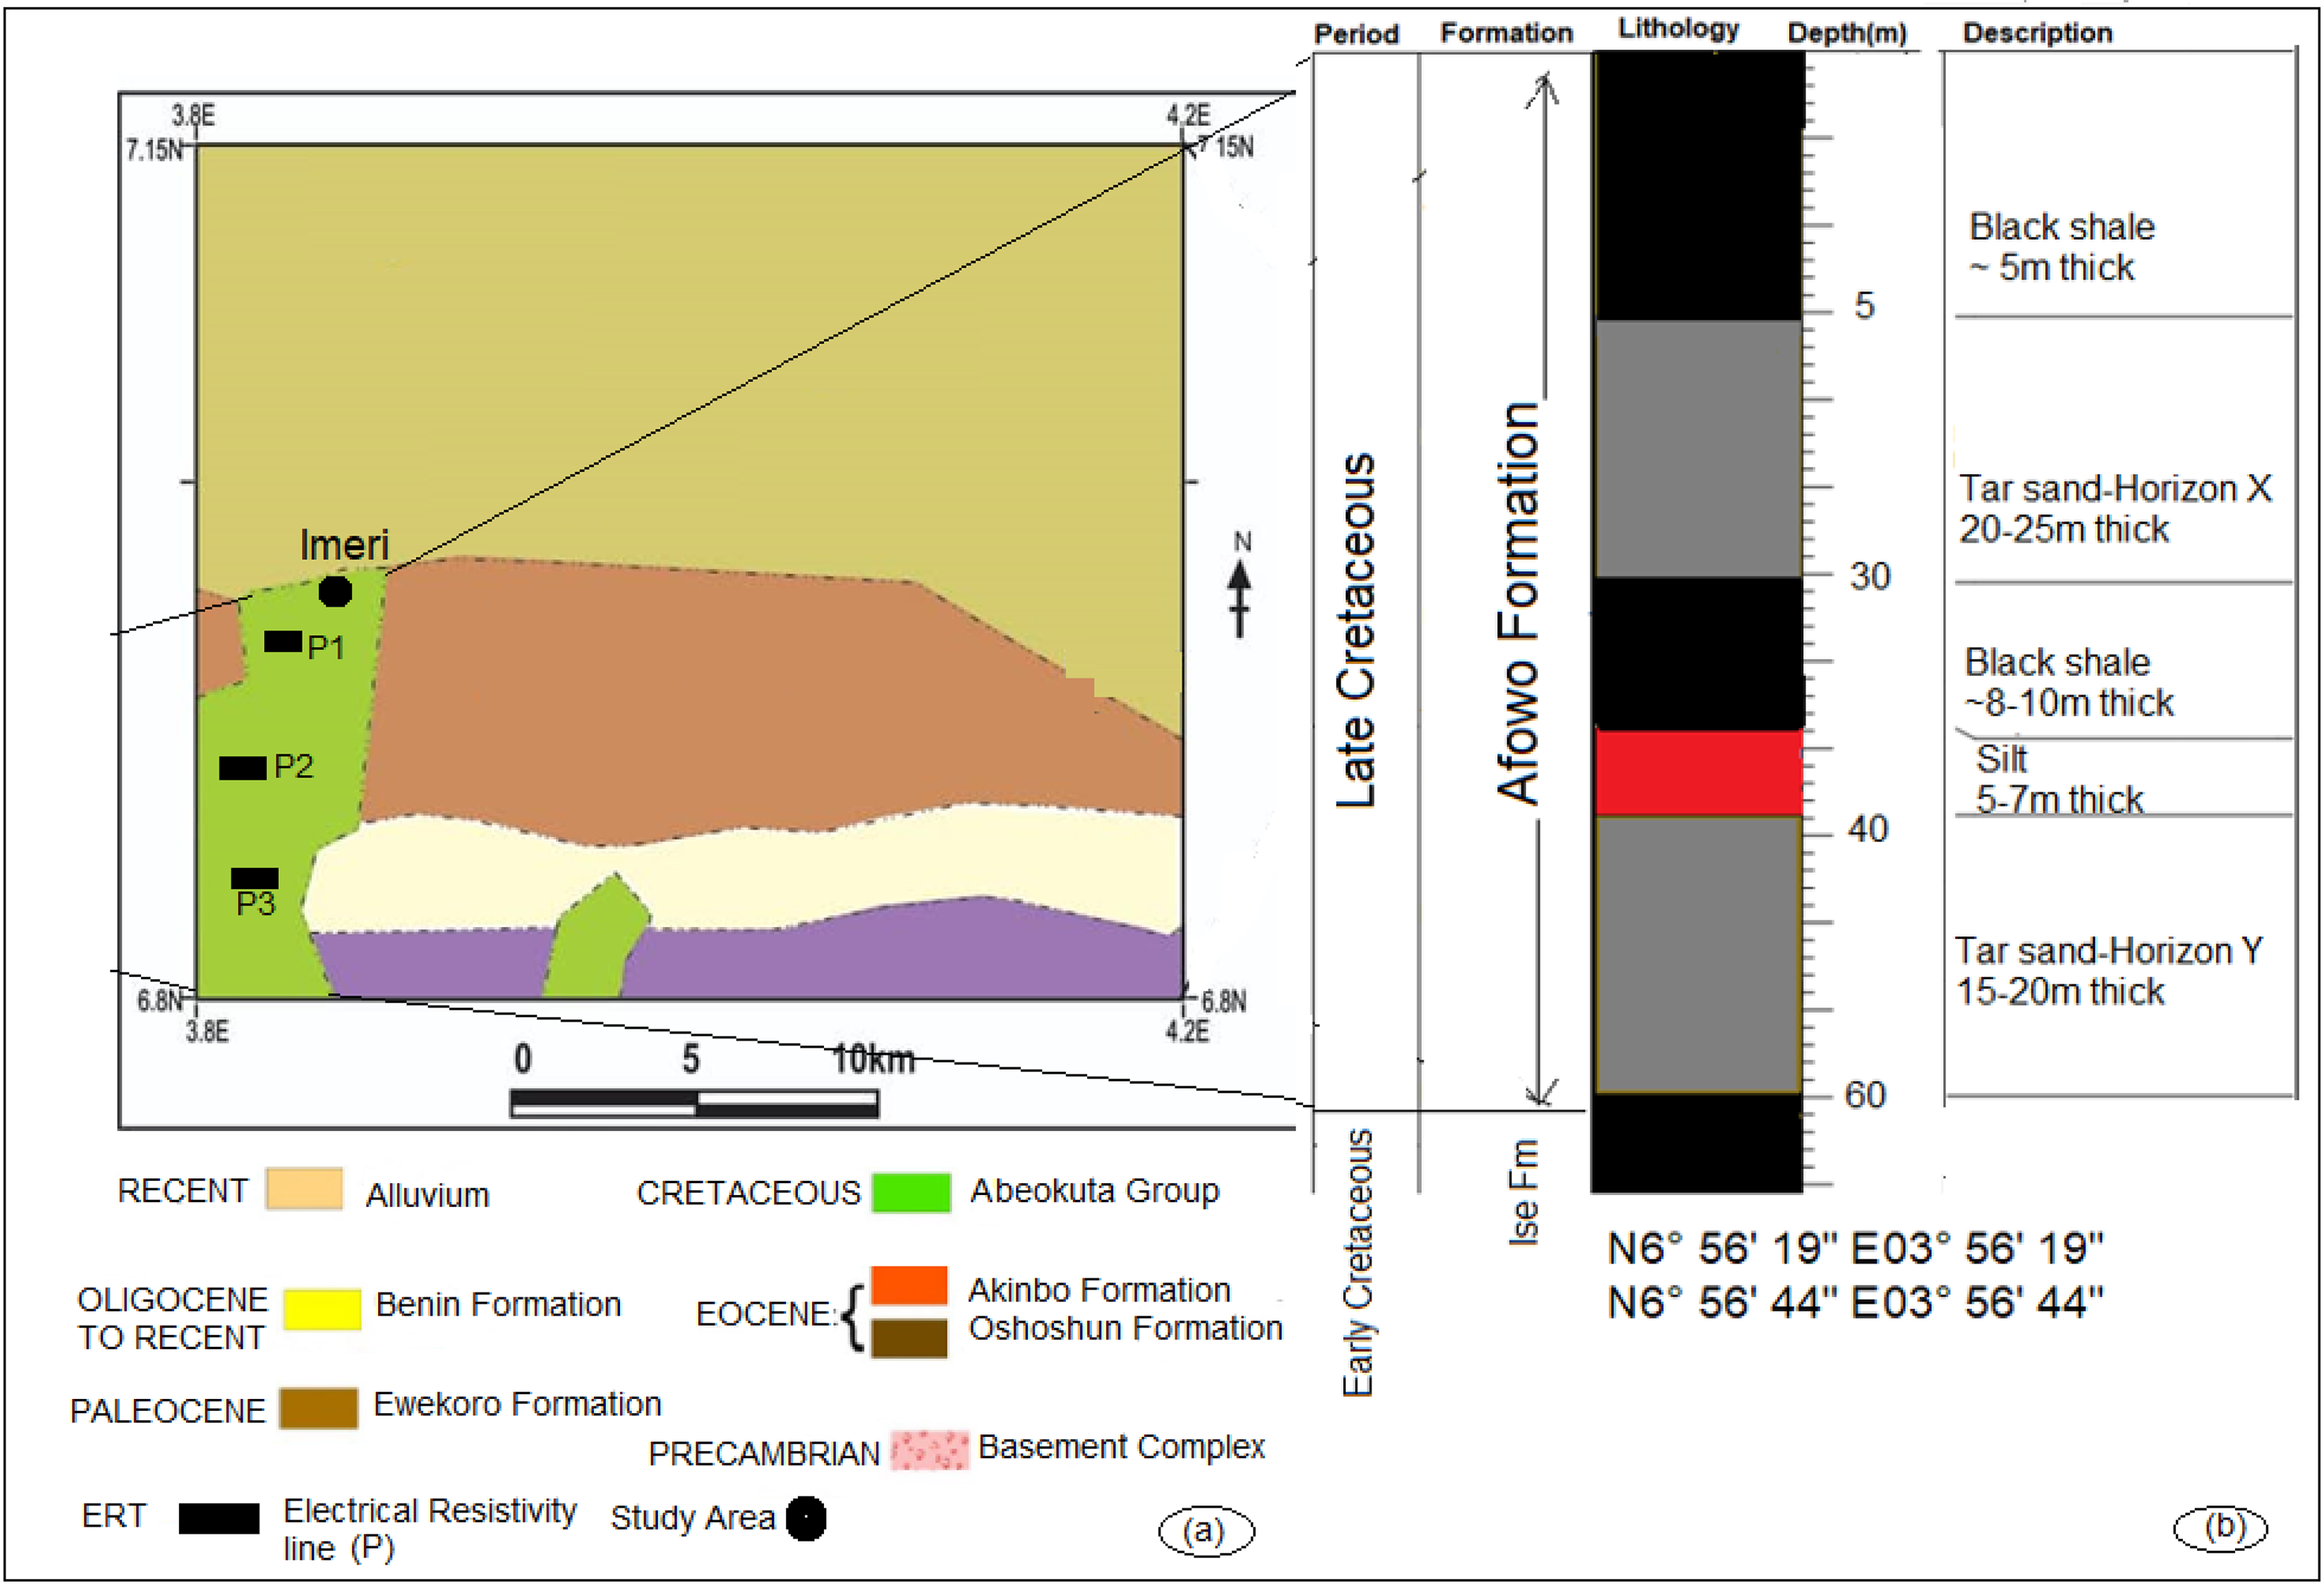
(a) Geological map of the Dahomey Basin with the study area location; (b) lithologic column of the Afowo Formation.
The older sedimentary sequence occurred towards the distal onshore province as the Cretaceous sediments composed of Cretaceous grit, sandstone, siltstone, mudstone, black shale, marine limestone, and marginal to marine sand. The lithological composition of the formation is well-defined, exhibiting a consistent alternation between brackish and marine sandstone and shale layers. Additionally, there is a notable occurrence of intense pyritization within the clay horizon. In the upper part, the Afowo Formation contains a high percentage of marine foraminifera and ammonites (Billman, 1984). The Cretaceous assemblages are overlaid by the Palaeocene lithofacies, comprising black shale and mudstone. On top of the Palaeocene lithofacies, the sedimentary sequences revealed a transitional to continental sandstone spanning from the Oligocene to the Recent Age.
The development of the Dahomey Basin has been interpreted as an interplay of episodic subsidence, rifting, and block faulting during the breakup of Africa and South America. Basin evolution comprises the intracratonic (pre-drift), synrift (or rift), and post-rift (drift) stages, resulting in the east-to-west structural basin, with the boundaries of each basin defined by the east-west transform fault systems. Several authors (Brownfield and Charpentier, 2006; Ola and Olabode, 2018) have reported the development of a chain of horsts and graben structures in the Dahomey Basin. Meanwhile, continental drifting and the opening of the Atlantic Ocean during the separation of the African and South American plates have been attributed to the initiation of the basin formation.
Materials and methods
Gas chromatography–mass spectrometry (GC-MS) analyses
A total of 32 samples were collected from the Afowo Shale Formation to a total depth of 100 m, exposed by streams and channels. The samples were pulverized and prepared for various analyses. GC-MS analysis was conducted on representative 18 samples from the study area. Approximately 80 g of powdered shale samples (<200 mesh) were extracted using a dichloromethane/methanol mixture (93:7) for 77 h in the Soxhlet apparatus. Elemental sulphur was removed by activated copper during extraction. The whole extract analysis of saturated and aromatic fractions was analysed on an Agilent 7890A Olympic-02 Gas chromatograph (GC) interfaced with an Agilent 5975C mass selective detector. The GC was fitted with a 60 m × 0.25 mm fused silica capillary column coated with a 0.25-μm film. The oven was programmed at an injection temperature of 40°C with an initial hold time of 1 min. The temperature was increased at 3°C/min to 330°C and kept isothermal for 35 min. Ultra-high-purity helium was used as a carrier gas and maintained at a constant flow of 1.1 mL/min. An Agilent 5973 mass selective detector (MSD), interfaced with the GC, was operated at 70 eV and a source temperature of 230°C with mass spectra acquired in full scan mode at about four scans per second. The relative concentrations in gas chromatography and mass fragmentations were determined based on peak heights.
Rock-Eval 6 pyrolysis and total organic carbon (TOC)
Rock-Eval 6 pyrolysis was conducted on six selected samples from each profile. Approximately 70 mg of crushed rock samples are heated in an inert environment within the Rock-Eval to determine the yield of hydrocarbons and CO2. The sample is held isothermally at 300°C for 3 min, producing the S1 peak by vaporizing the free (unbound) hydrocarbons. High S1 values indicate large kerogen-derived bitumen (as in an active source rock) or migrated hydrocarbons. The oven then increases in temperature by 25°C/min to a final temperature of approximately 650°C. During this time, hydrocarbons that evolve from the sample as a function of the pyrolytic degradation of the kerogen are measured, generating the S2 peak, and are proportional to the amount of hydrogen-rich kerogen in the rock. The temperature at which the S2 peak reaches a maximum of Tmax. It is a measure of the source rock maturity. The inferred vitrinite reflectance was estimated using equation [1] (Jarvie et al., 2001). The accuracy of Tmax is 1–3°C, depending on the instrument, programme rate, and sample size, but it can also vary by organic matter type. Tmax values for samples with S2 peaks less than 0.2 mg HC/g rock are often inaccurate and should be rejected unless a definitive kerogen peak is noted from the program. Any carbon dioxide released between 300°C and 390°C is also measured, generating the S3 peak. providing an assessment of the oxygen content of the rock.

For TOC, approximately 0.080 g of ground rock is accurately weighed and then treated with concentrated Hydrochloric Acid to remove carbonates. Sample weight may be variable depending on the organic richness of the sample. After 2 h of acidification, the acid is removed from the sample with a filtration apparatus fitted with a glass microfiber filter. The filter is placed in a LECO crucible and dried at 110°C for 2 h. After drying, the sample is analyzed with a LECO C744 Carbon Analyzer with detection limits of 0.01 wt%.
Scanning electron microscopy (SEM) imaging
Thin sections were studied using classical optical microscopy as well as SEM. Backscattered electron images were taken on carbon-coated thin sections using a Zeiss Ultra-Plus FEG-SEM coupled with a Bruker X-Flash energy dispersive X-ray spectroscopy (EDS) detector for elemental analyses. An accelerating voltage of 20 kV in high current mode was used.
Mineralogical characterization
Mineralogical identification and quantification of the samples from the organic-rich shale Formations at different depths were determined using X-ray diffraction (XRD). Samples were tightly mounted on an oriented sample holder with very little pressure using a backloading preparation technique using a PANalytical X'Pert Pro-powder diffractometer equipped with an X'Celerator detector coupled with receiving slits, variable divergence, and Fe- filtered Cu-K radiation. Whilst the receiving slit was positioned at 0.040°, and the counting area was from 2 to 80° on a 2θ Scale at 1.5 s. The significance of the mineralogical characterization is reflected in their alteration as temperature and pressure increase with depth. Invariably, the mineralogical alteration with depth provides valuable information on their diagenetic changes, which is an important shale maturity indicator.
Electrical resistivity tomography (ERT)
The electrical resistivity survey technique employed 50 electrodes positioned 10 m apart in a Schlumberger arrangement, and 240 m long lines were used to test the apparent resistivity of the subsurface in the field. An IRIS Instruments Orleans (FRANCE) SYSCAL R1 Plus resistivity metre was used as the geophysical instrument, and it was configured for automated and calibrated data collection for 200 mA transmission in 1 s current transmission on each reading. In Vertical Electrical Sounding (VES), current penetrates deeper in the ground with increasing separation of the current electrode, thereby reflecting resistivity variations with depth. The information was then integrated into a fictional cross-section of apparent resistivity beneath the survey line using ingenious combinations of current and potential electrode pairs. The depth of the examination was determined by both geometry and electrode separation, with larger electrode separations corresponding to observations of bulk resistivity at deeper depths. True resistivity models are displayed as colour contour sections that illustrate the spatial variation in subsurface resistivity.
Results and discussion
Biomarker characteristics
Normal alkanes (n-alkanes) and isoprenoids
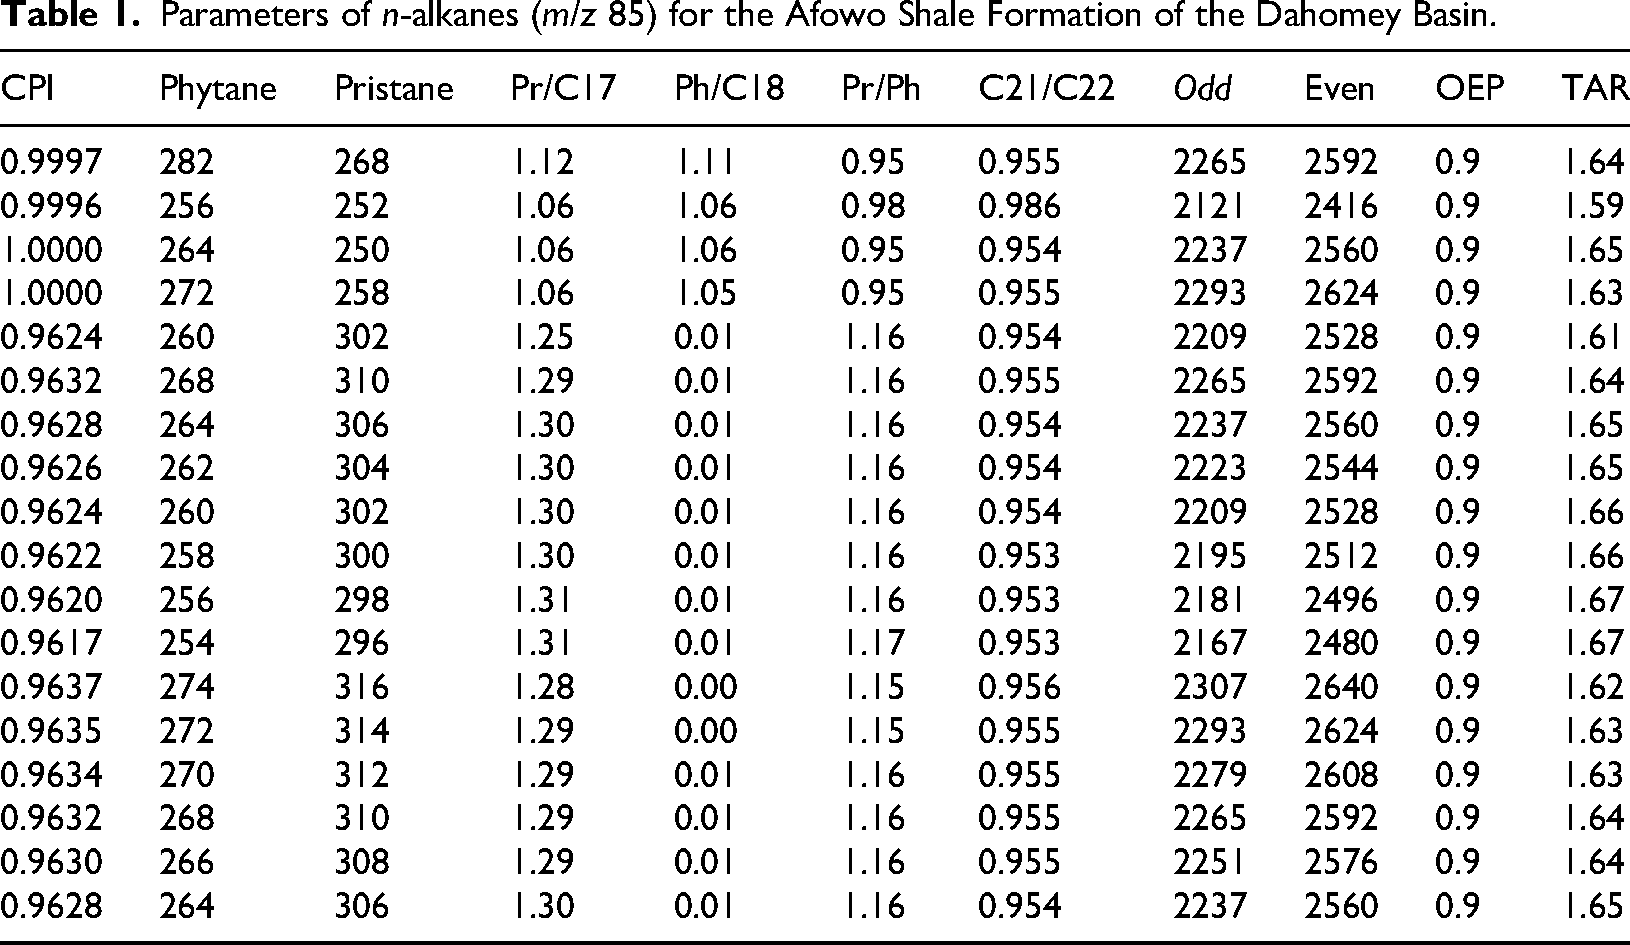
The mass chromatogram of the saturated hydrocarbon fraction at m/z 85 of the 18 shale samples shows a unimodal distribution of n-alkanes ranging from n-C10 to n-C44 with a carbon peak in the range of nC15-nC28 (Figure 2 and Table 1). The odd-even predominance (OEP) of carbon number and carbon preference index (CPI) indicates the thermal maturity and type of organic matter source. The OEP value of 0.9 means that the studied shale does not display any dominance of even or odd carbon numbers. The CPI values range from 0.96 to 1.0, suggesting the source rocks are not biogenic but petrogenic, thermally matured, and predominantly composed of aquatic organisms. The nC21−/nC22+ ratio value (0.95) is approximately 1, indicating that the relative abundance of light hydrocarbons is roughly equal to that of heavy hydrocarbons. The Pr and Ph are significant isoprenoid compounds whose ratio exceeds or is less than 1, indicating an alternating anoxic and oxic condition of sedimentation of different sources other than chlorophyll-derived phytol (Hughes et al., 1995; Philip, 1994). The results indicate that the Pr/Ph ratio ranges from 0.95 to 1.17, averaging 1.1, suggesting a mixed redox condition during sedimentation.
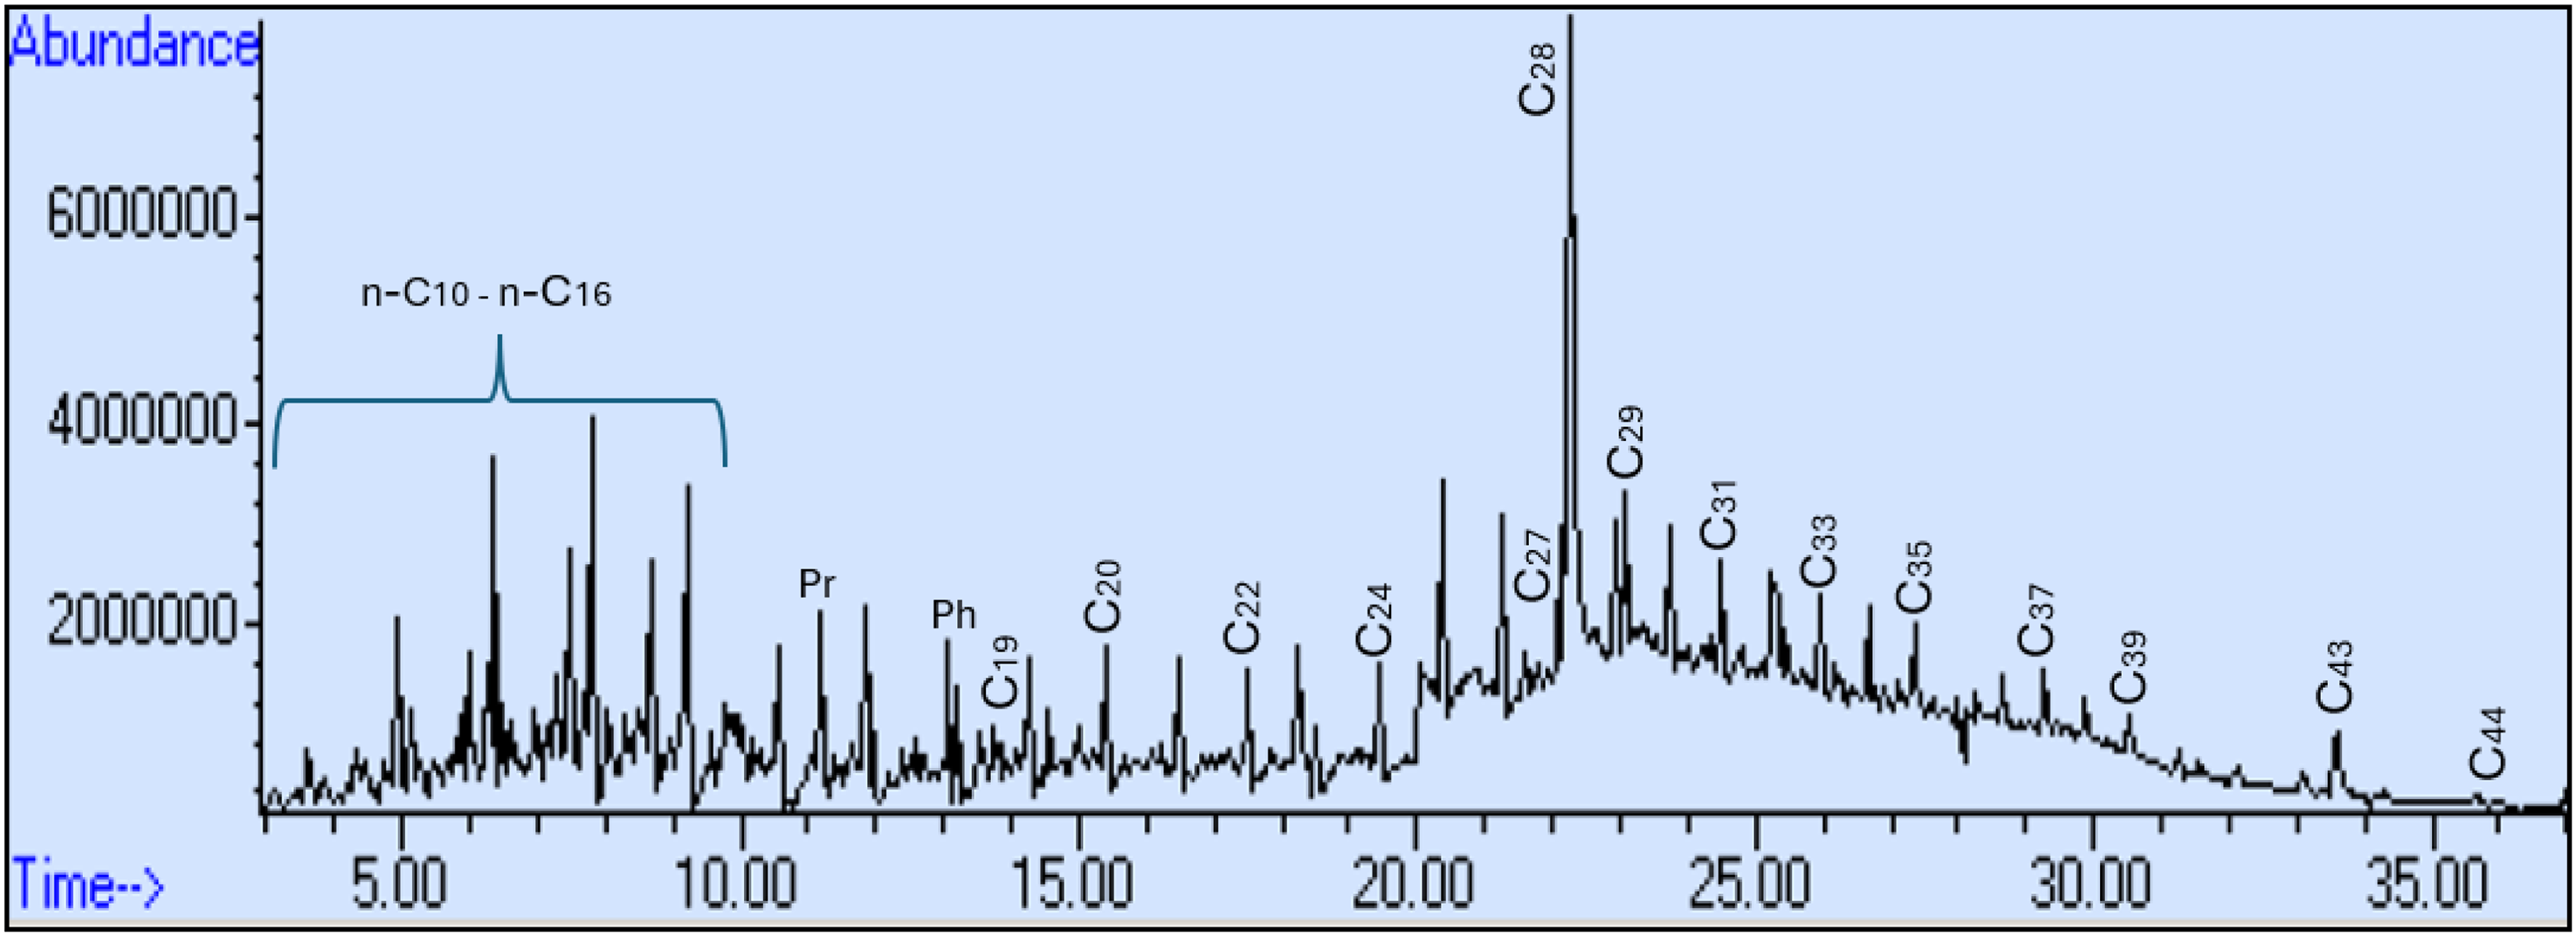
Gas chromatogram of saturated hydrocarbons fraction at m/z 85 for the Afowo Shale Formation of Dahomey Basin.
Parameters of n-alkanes (m/z 85) for the Afowo Shale Formation of the Dahomey Basin.
The relative abundance of acyclic isoprenoid to n-alkanes is expressed in Pr/ n-C17, ranging from 1.0 to 1.3, and Ph/n-C18, ranging from 0.01 to 1.1 (Table 1). The average terrigenous-aquatic ratio (TAR) value of 1.6 suggests terrestrial inputs, and the variations in sediment deposition may be attributed to the rapid fluctuation of sea level (Falufosi and Osinowo, 2021). Sediments in the lower parts of the formation are transitional zones, having mixed brackish to marginal or terrestrial deposition.
Tricyclic terpanes and hopanes biomarkers
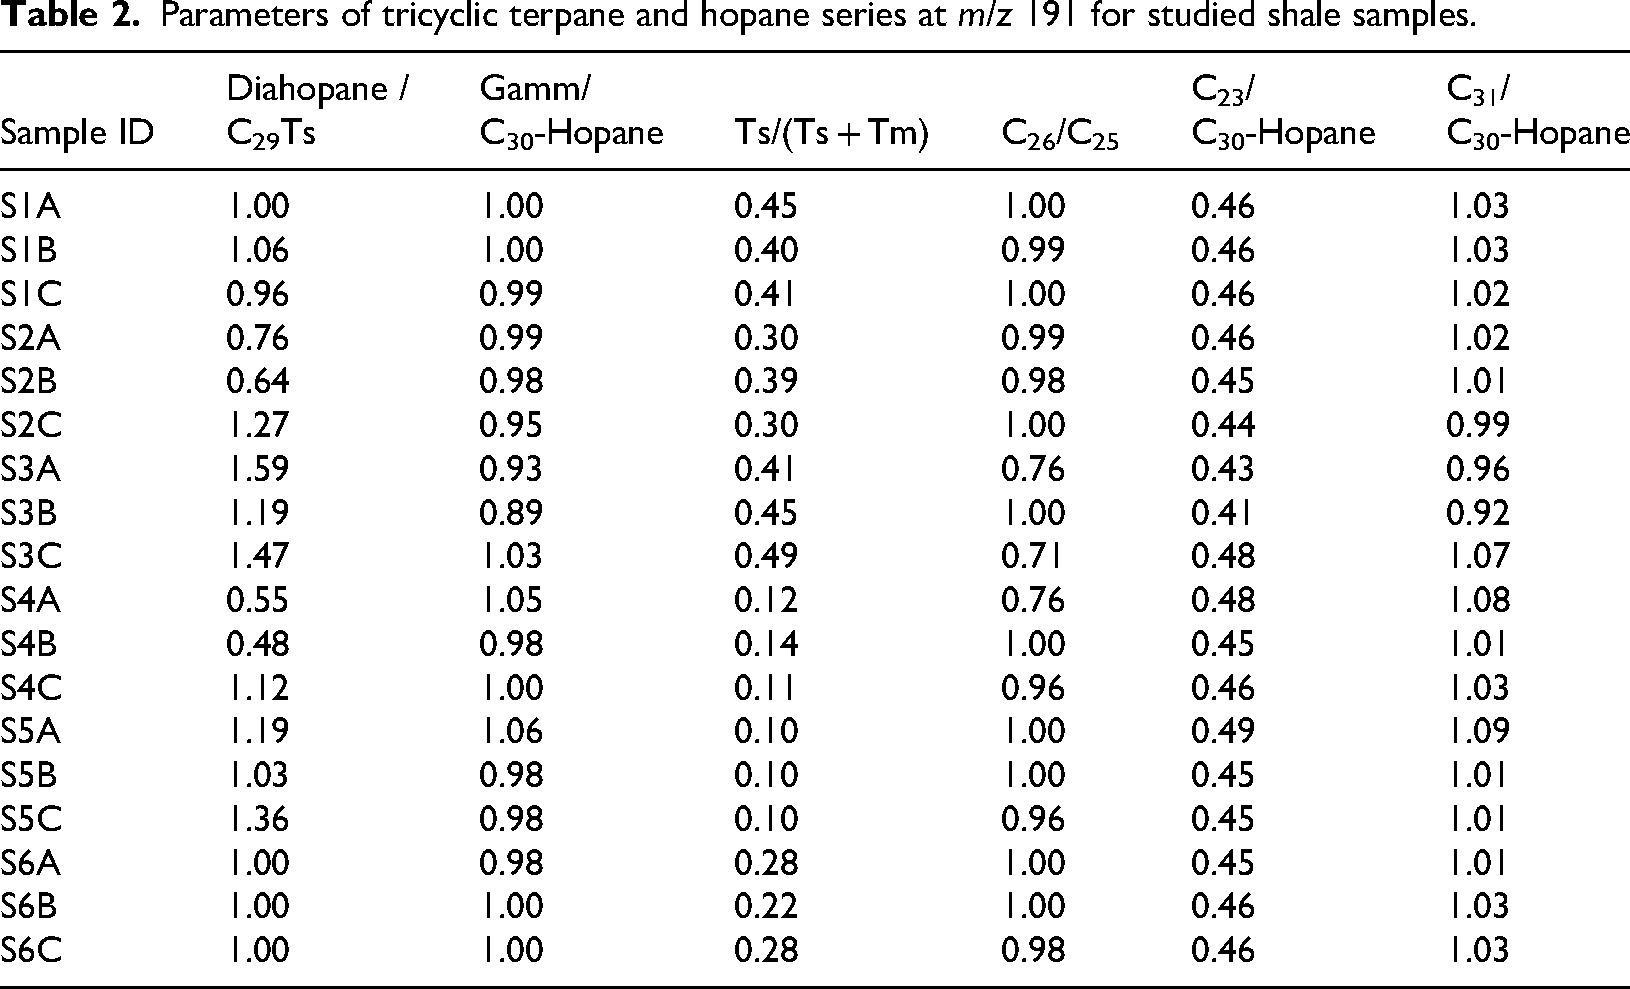
The mass chromatogram of the saturated hydrocarbon fraction at m/z 191 of all studied shale samples reveals a similar pattern and presence of tricyclic terpane, C24-tetracyclic terpane, and hopane series with molecules ranging from nC23 to nC35 as shown in Figure 3. Among the tricyclic terpanes, the C23 terpane predominates, and the presence of C24 tetracyclic terpane suggests a marine kerogen component in all the studied shale samples. Meanwhile, the low relative abundance ratio of regular C30-hopane (17α21β-hopane) and gammacerane ranges from 0.89 to 1.03 (Table 2), indicating a shale-type source rock. On the other hand, the gammacerane index (GI) is the ratio of Gamm/C30-hopane that indicates water column stratification in relation to temperature or salinity (Ten Haven et al., 1987; Zhang et al., 2018). The GI values of the present study indicate significant alterations due to maturity. Furthermore, the molecular ratio of diaphone (17α-Diahopane) and C29Ts Norneophane (18α21β-30-Norneohopane) ranges from 0.48 to 1.59, suggesting an oxidative-reduction condition of organic matter sedimentation since a value greater than 1 indicates anoxic conditions and values less than 1 represent the oxic condition of deposition. Additionally, the relative concentration of Ts-trisnorneohopane (18α-22.29.30-trisnorneohopane) and Tm- trisnorhopane (17α-22.29.30-trisnorhopane) Ts/(Ts + Tm) ratio is commonly used to assess the thermal maturity in source rocks (Ji et al., 2020). The values of the Ts/(Ts + Tm) ratio of 0.10 and 0.49 measured for Afowo shale suggest immature conditions.
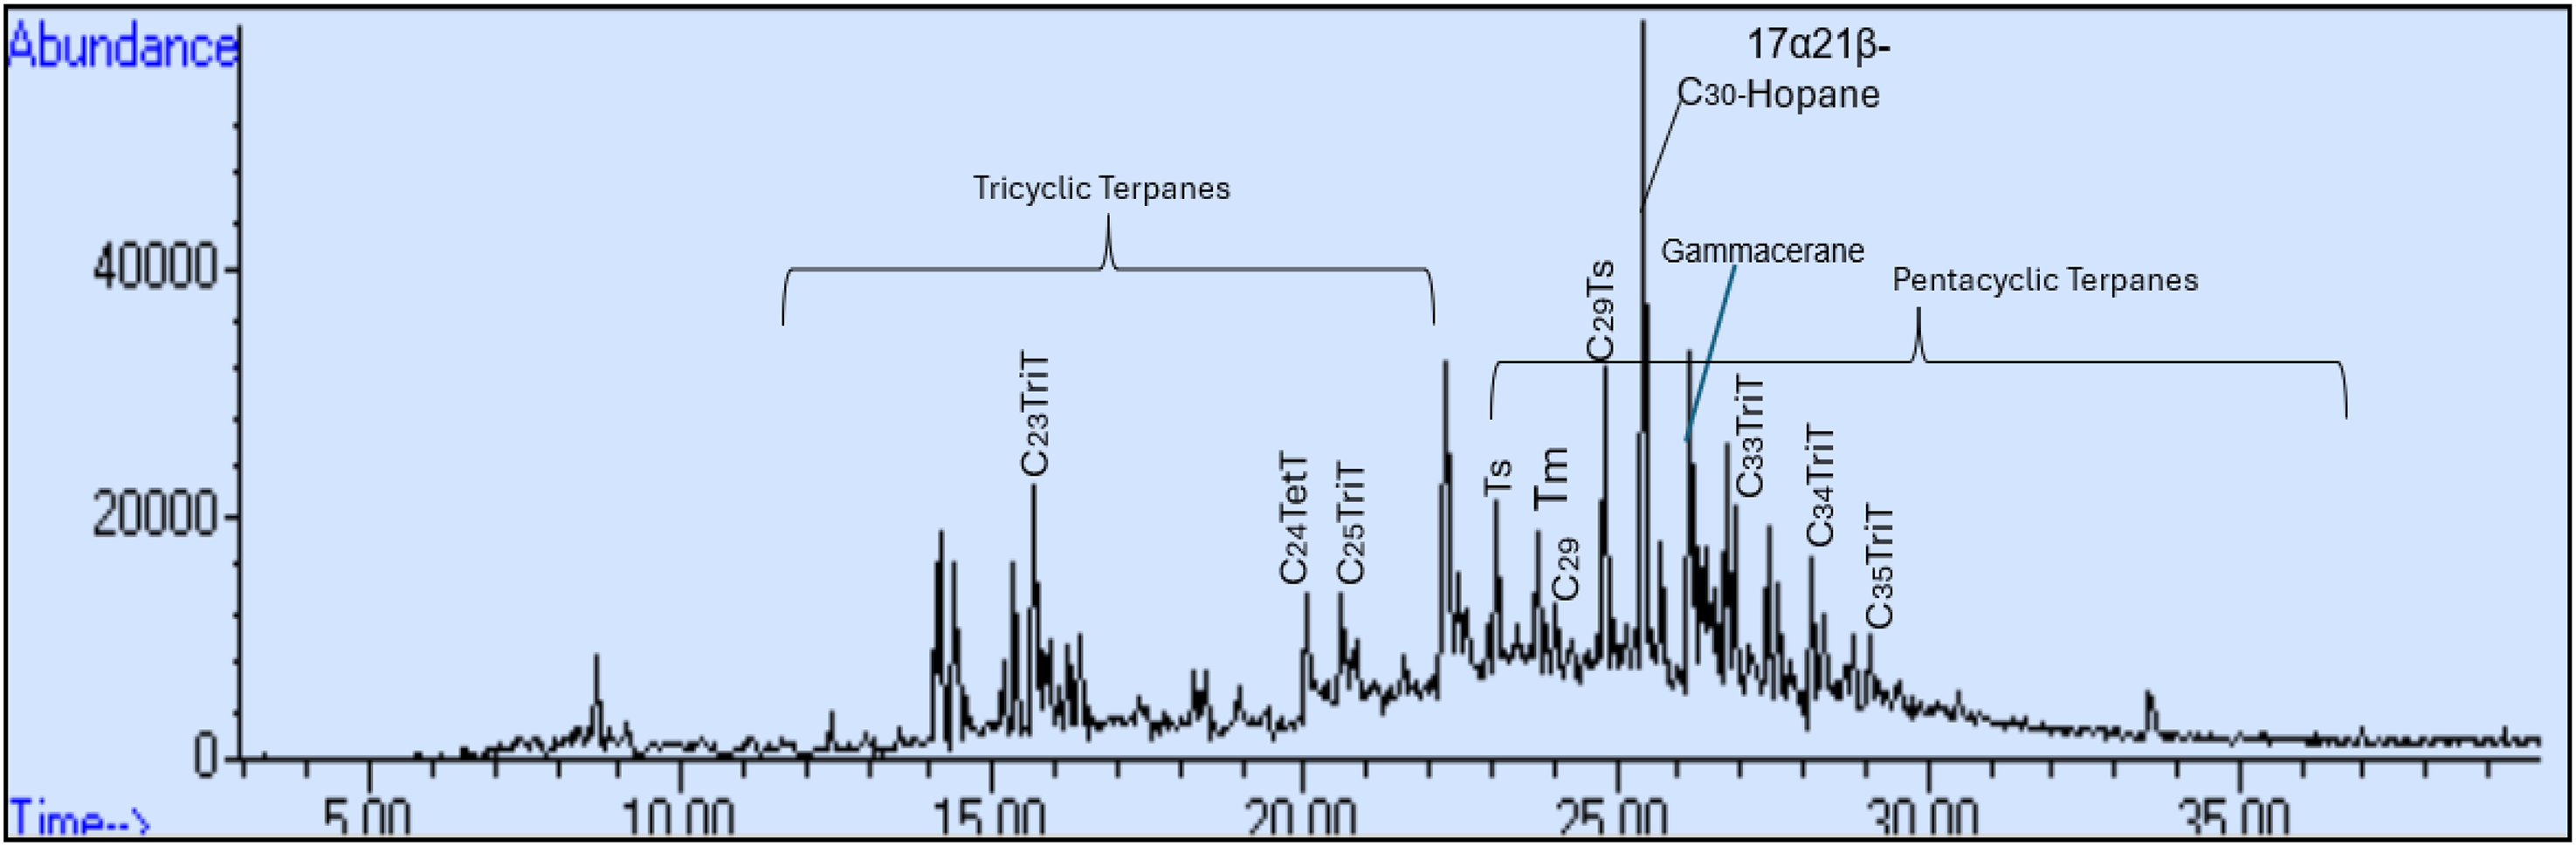
Mass chromatogram of saturated hydrocarbon at m/z 191 from the Afowo Formation of the Dahomey Basin.
Parameters of tricyclic terpane and hopane series at m/z 191 for studied shale samples.
Steranes biomarkers
The mass chromatograms of sterane at m/z 217 reveal the presence of monoaromatic sterane and Triaromatic sterane biomarkers in the Afowo Formation Shale (Figure 4(a) and (b)). Figure 4(a) shows the low abundance of C21–C23 monoaromatic steranes, a relatively higher concentration of C27–diasteranes (20S + 20R), and a predominance of regular steranes C27–C29. The regular steranes are utilized to identify the organic matter sources and their paleoenvironmental condition (Huang and Meinschein, 1979). The regular C27 sterane predominates in all studied samples, ranging from 40.5% to 42.3%, followed by the regular C29 from 38.5% to 39.9%, and lastly, the C28 ergostane and diaergostane (20S + 20S) (Figure 4(b)). In most studied samples, the predominance of C27 sterane and C29 sterane over C28 indicates a high input of aquatic planktonic-bacterial organic matter with a minor contribution of terrigenous organic matter [53]. The relative abundances are given in Table 3 as a percentage, indicating a high algal organic matter input. The C29 steranes are predominant in nearly all higher plants, whilst C27 is often dominant in most plankton. It is reported that C28 and C29 sterols are prevalent in brown algae and some species of green algae, while C27 steranes are present in red algae (Salih et al., 2020). In this study, the C27/C29 ratio is >1, as shown in Table 3, ranging from 1.01 to 1.11, suggesting a relative abundance of marine organic matter compared to terrigenous higher plant material input. The diagnostic ratio of Dibenzothiophene (DBT)/Phenanthrene (PHEN) is 1.03, which is >1, indicating the shale is a source rock deposited in an anoxic sulfidic condition. At the same time, the studied samples are characterized by triaromatic sterane, cholesterane, and stigmastane, resembling shale sediment prone to oil and gas source rock.
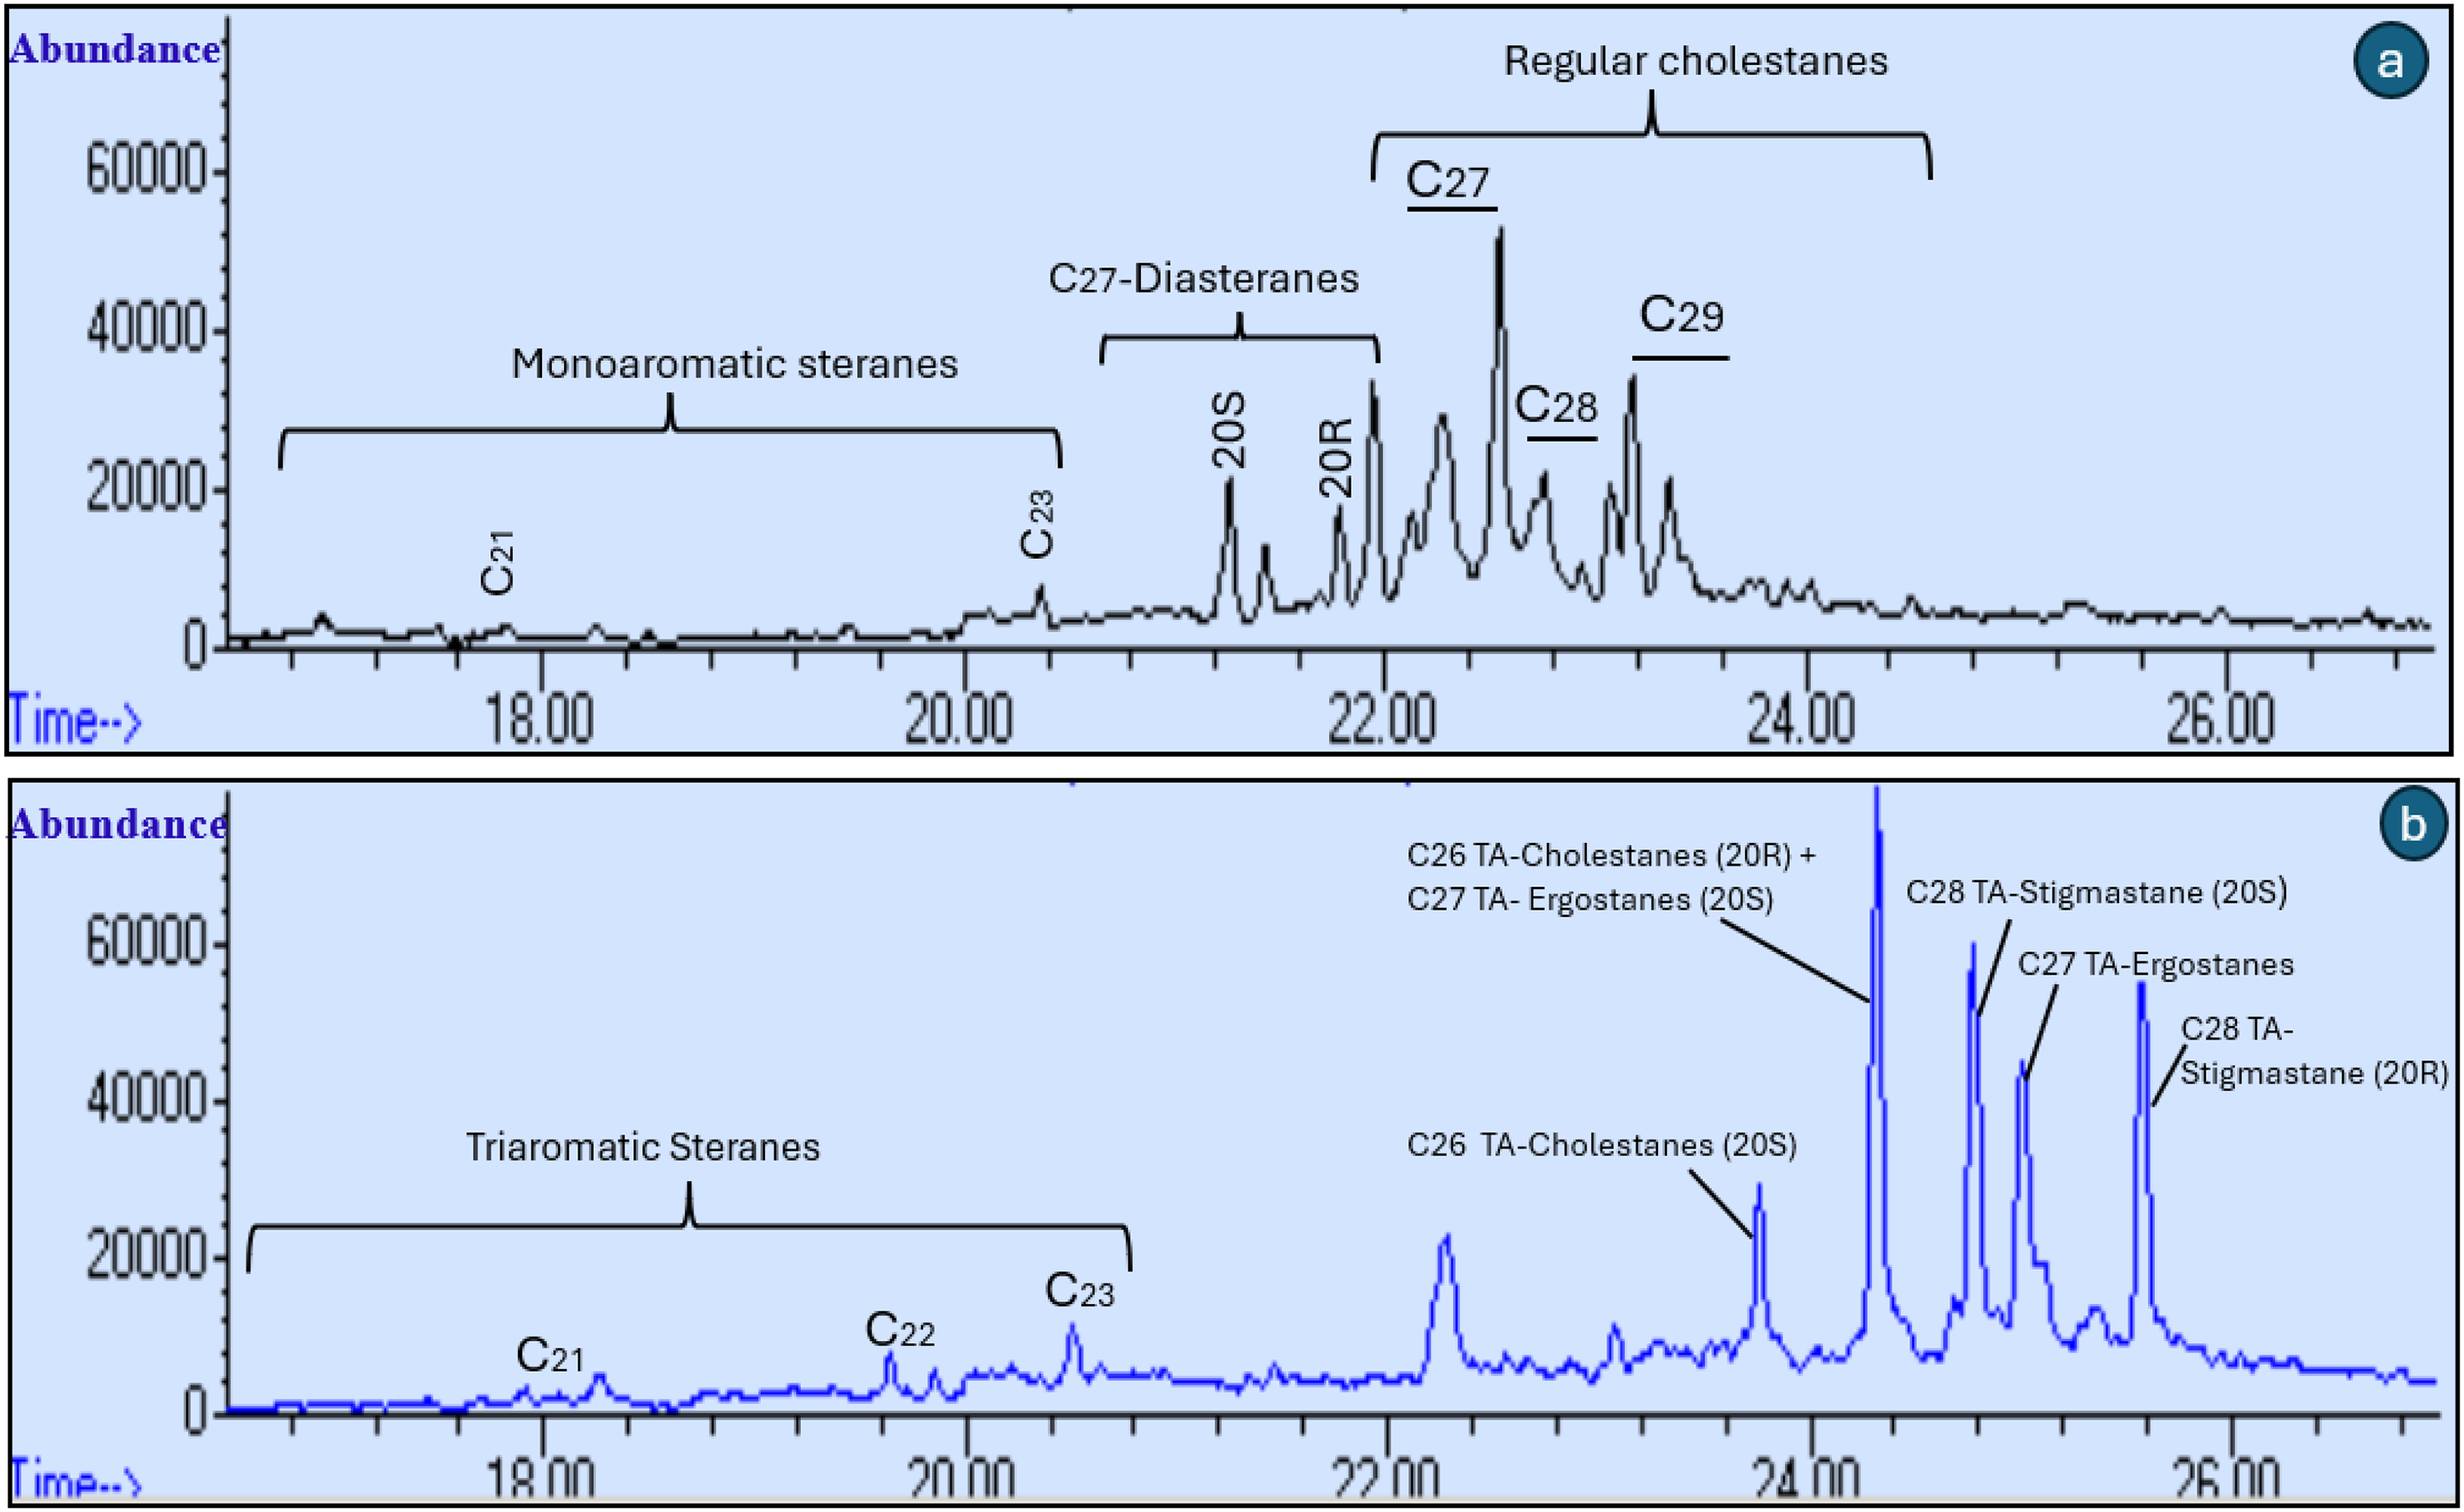
Mass chromatograms of sterane m/z 217 showing (a) monoaromatic sterane and (b) triaromatic sterane biomarkers of the Afowo Formation Shale.
Sterane and diasteranes series at m/z 217 and aromatic biomarkers.
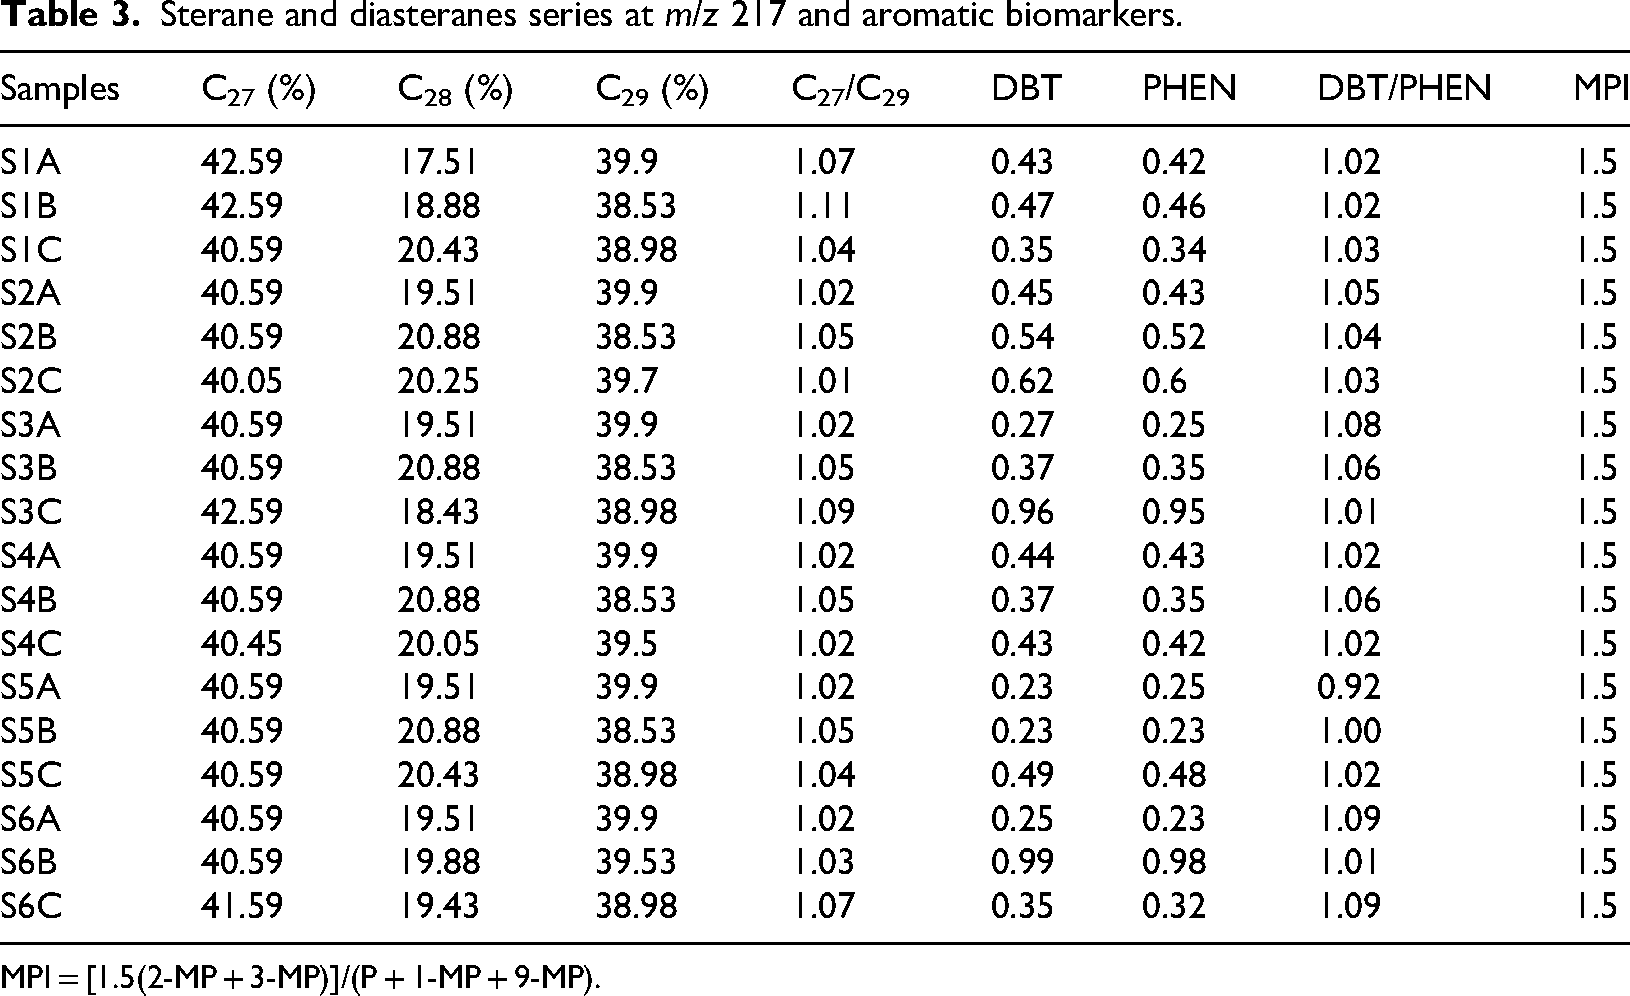
MPI = [1.5(2-MP + 3-MP)]/(P + 1-MP + 9-MP).
Kerogen characteristics and total organic content (TOC)
The TOC content and kerogen characteristics are presented in Table 4. The TOC value of the studied shale samples ranged from 0.9 to 4.2 wt%, averaging at 2.2 wt%, exceeding the threshold limit of 0.5 wt%, indicating excellent source properties. The Rock-Eval 6 programmed pyrolysis shows the hydrocarbon generation potential, kerogen type, and thermal maturity. The Afowo samples have S1 values ranging from 0.56 to 9.64 mg HC/g rock and an average of 4.97 mg HC/g rock. At the same time, S2 values range from 1.25 to 25.56 mg HC/g rock with an average of 11.33 mg HC/g rock.
Rock-Eval parameter and TOC.
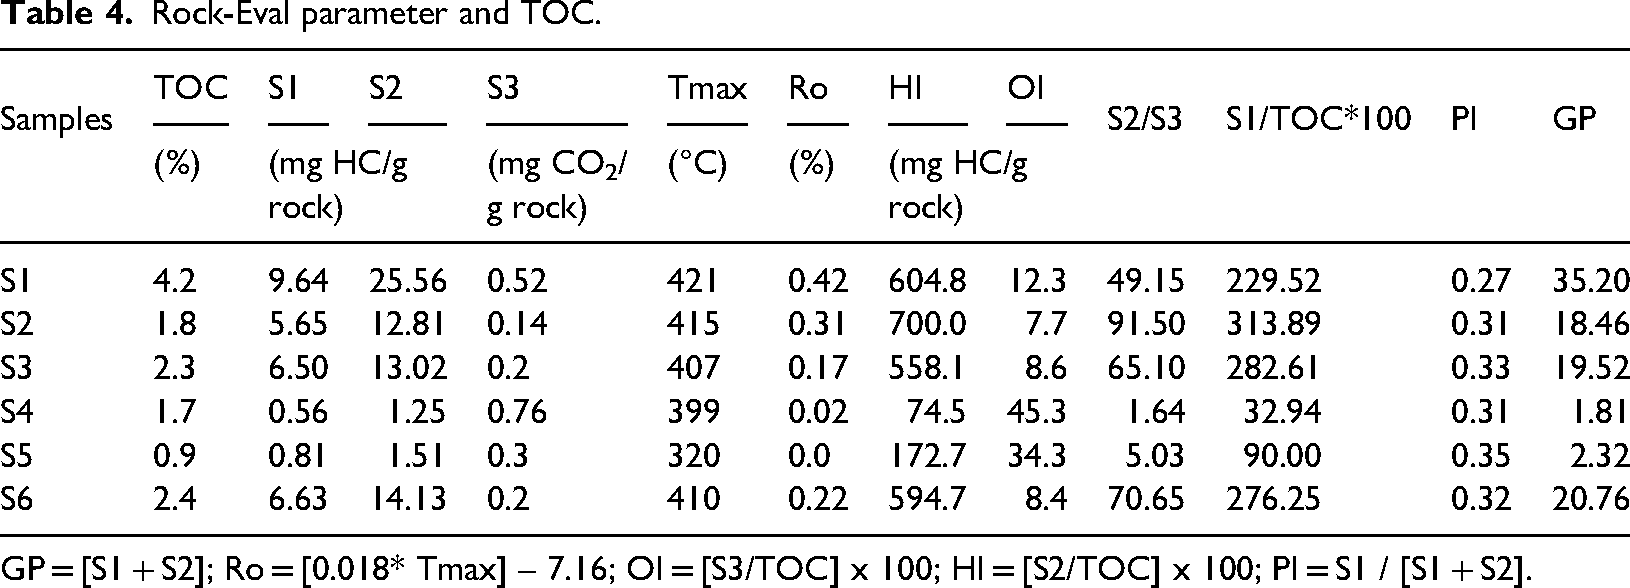
GP = [S1 + S2]; Ro = [0.018* Tmax] – 7.16; OI = [S3/TOC] x 100; HI = [S2/TOC] x 100; PI = S1 / [S1 + S2].
The genetic potential (GP) measures the total amount of petroleum that would be generated from a rock. The GP values (2.32–35.2 mg HC/g rock) show an excellent genetic hydrocarbon potential because they exceed the minimum threshold value of 2 mg HC/g rock. S3 values range from 0.1 to 0.8 mg CO2/g rock in the studied shale. Meanwhile, the trend of S3 values shows a decrease in CO2 generation, suggesting a reduction in microbial activities on organic matter due to the thermal breakdown of kerogen as depth increases. The calculated reflectance values for S5 (0.02%) are very low relative to other values. This low value is more likely to be related to bitumen impregnated in the samples, as the ERT showed bitumen presence. Hydrogen index (HI) values in the studied samples range from 74.5 to 700.0 mg HC/g TOC, suggesting a Type II-III Kerogen dominance. The hydrogen index for S4 (74.5 mm HC/g rock) and S5 (172.7 mm HC/g rock) is relatively low compared to other samples that ranged from 558.1 to 700 mm HC/g rock, probably due to depositional degradation of organic matter. The HI values are affected by the type and maturity of organic matter, indicating the quality of kerogen. On the other hand, oxygen index (OI) values range from 8.4 to 45.3 mg HC/g TOC in the studied samples. Moreover, the OI values are functions of the volatile hydrocarbons generated in relation to the amount of organic matter in the studied shale samples. The ratio of the S2/S3 parameter ranges from 1.64 to 91.50, indicating the potential of the Afowo Shale Formation to generate gas with values less than 2 and greater than 5 for oil-prone shale (Garry et al., 2016; Peters and Cassa, 1994).
Morphological compositions
The representative scanning electron microscopy-Energy Dispersive X-ray (SEM-EDX) images of the studied Afowo shales reveal a combination of hollow fossils, organic matter, and groundmass minerals (Figure 5(a)-(e)). The elemental components of organic matter and inorganic materials were depicted by the representative EDX shown in Figure 5(d)-(f). The organic matter consists of scattered hollow fossils in various shapes, like foraminifera structures (see Fig. 5(d)), spore structures (see Figure 5(b)), pollen-like structures (see Figure 5(a)), and algae-like structures (see Figure 5(c)). Organic matter pore structures predominated the macerals in the Afowo shale, supposedly hosting the potential gas and oil. The representative EDX results show the predominance of carbon-rich compounds reflecting the preponderance of various organic matter in the Afowo shale (Figure 5(e)). At the same time, the presence of inorganic elements such as Al, Si, O, and Sr indicates the occurrences of quartz and kaolinite composition in the studied shale (Figure 5(f)).
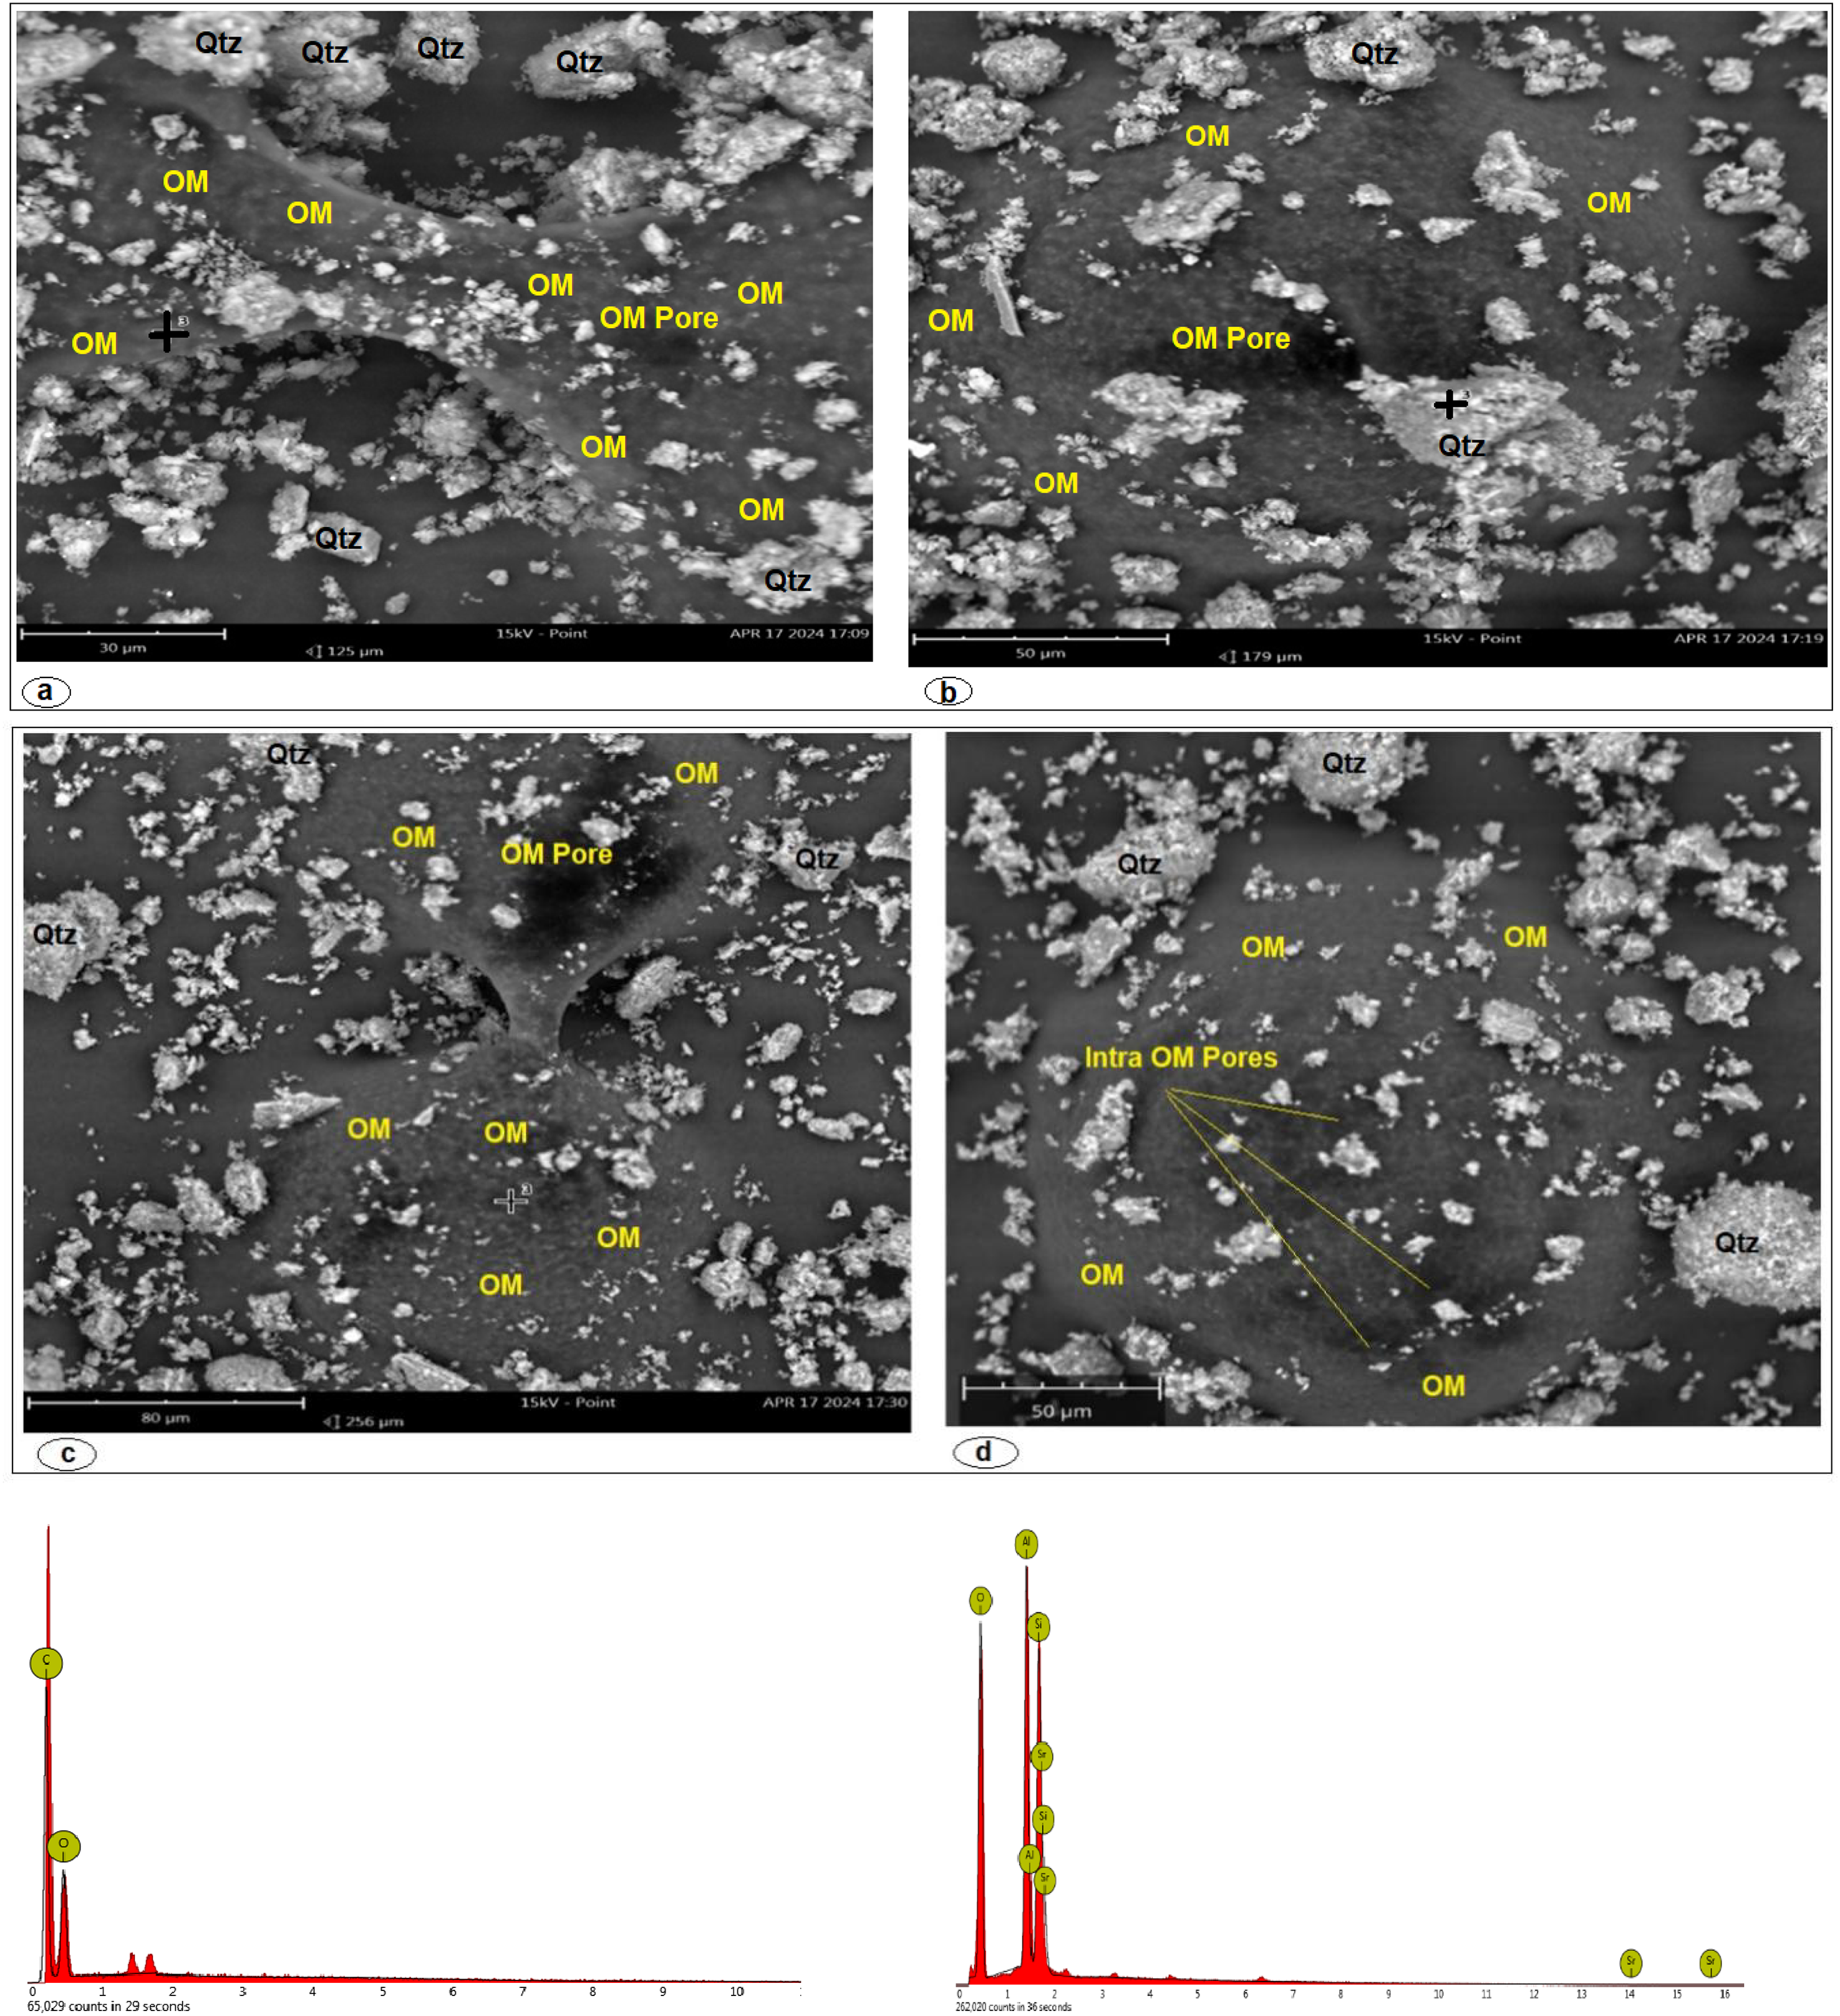
SEM-EDX images showing (a) pollen-like structure, (b) spore-like, (c) algae-like, (d) foraminifera-like structures, (e) organic elemental compositions, and (f) inorganic elemental compositions of the Afowo Shale.
Mineralogical composition
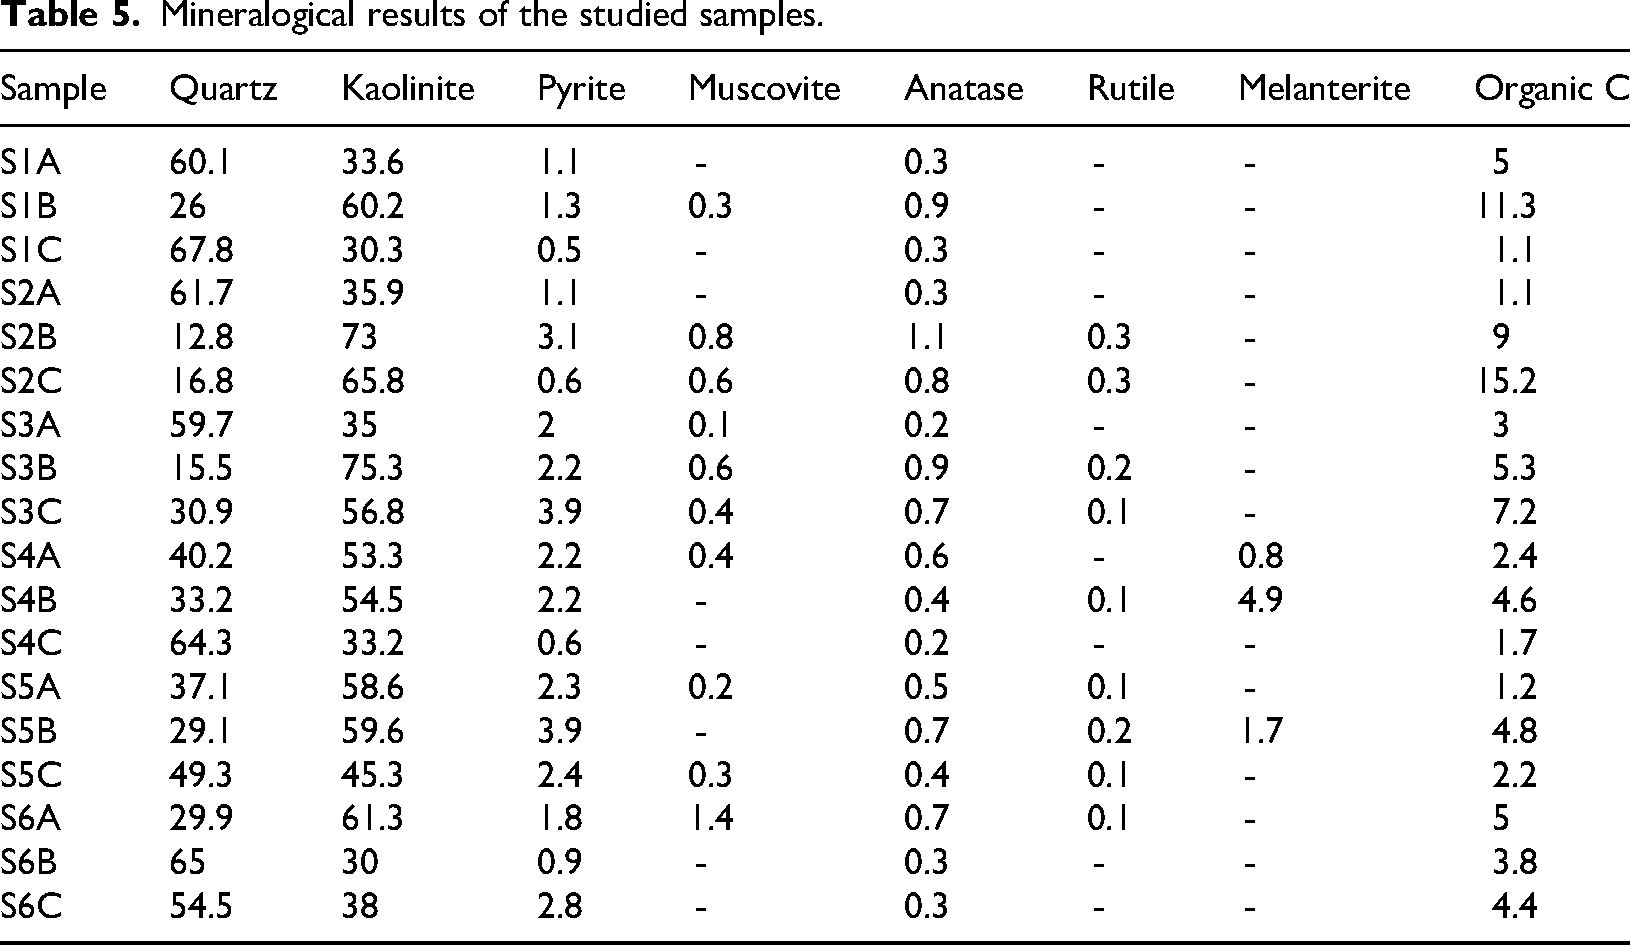
The XRD result reveals the presence of organic carbon, kaolinite, pyrite, muscovite, anatase, rutile, and melanterite, as shown in Table 5. The Afowo shale is predominated by kaolinite minerals (30–75.3%, averaging 50.0%), contributing to a greater abundance of micropores and reduced adsorption capacity of gas content to the pore surface. The relative abundance of quartz ranges from 12.8% to 61.8%, averaging 41.9%, suggesting easy formation fracturing during enhanced production. The presence of organic carbon (1.1–15.2%, averaging 5%) indicates the preponderance of varied organic matter in the shale. The pyrite mineral ranges from 0.5% to 3.9%. averaging 2.0%, indicating a sulphide-reducing paleoenvironment. Intense pyritization of the Afowo shale horizons is common and suggests an age range extending into the Maastrichtian age (Falufosi and Osinowo, 2021). Melanterite minerals barely occur in the shale, while muscovite, anatase, and rutile occur in small amounts, averaging at 0.5%, 0.5%, and 0.2%, respectively.
Mineralogical results of the studied samples.
Geo-Electrical resistivity boundaries
Profile one
The geoelectrical resistivity results, conducted in three profiles, are presented in Figures 6–9. Figure 6 shows three major resistivity boundaries, which are further subdivided into four major geo-electric stratums. The first inferred major boundary line is a gently inclined demarcation encountered at 10 m near the end of the profile to a depth of about 26 m. The line abruptly separates the laterally heterogeneous topmost geo-electric stratum and the highly resistive underlying impregnated stratum.
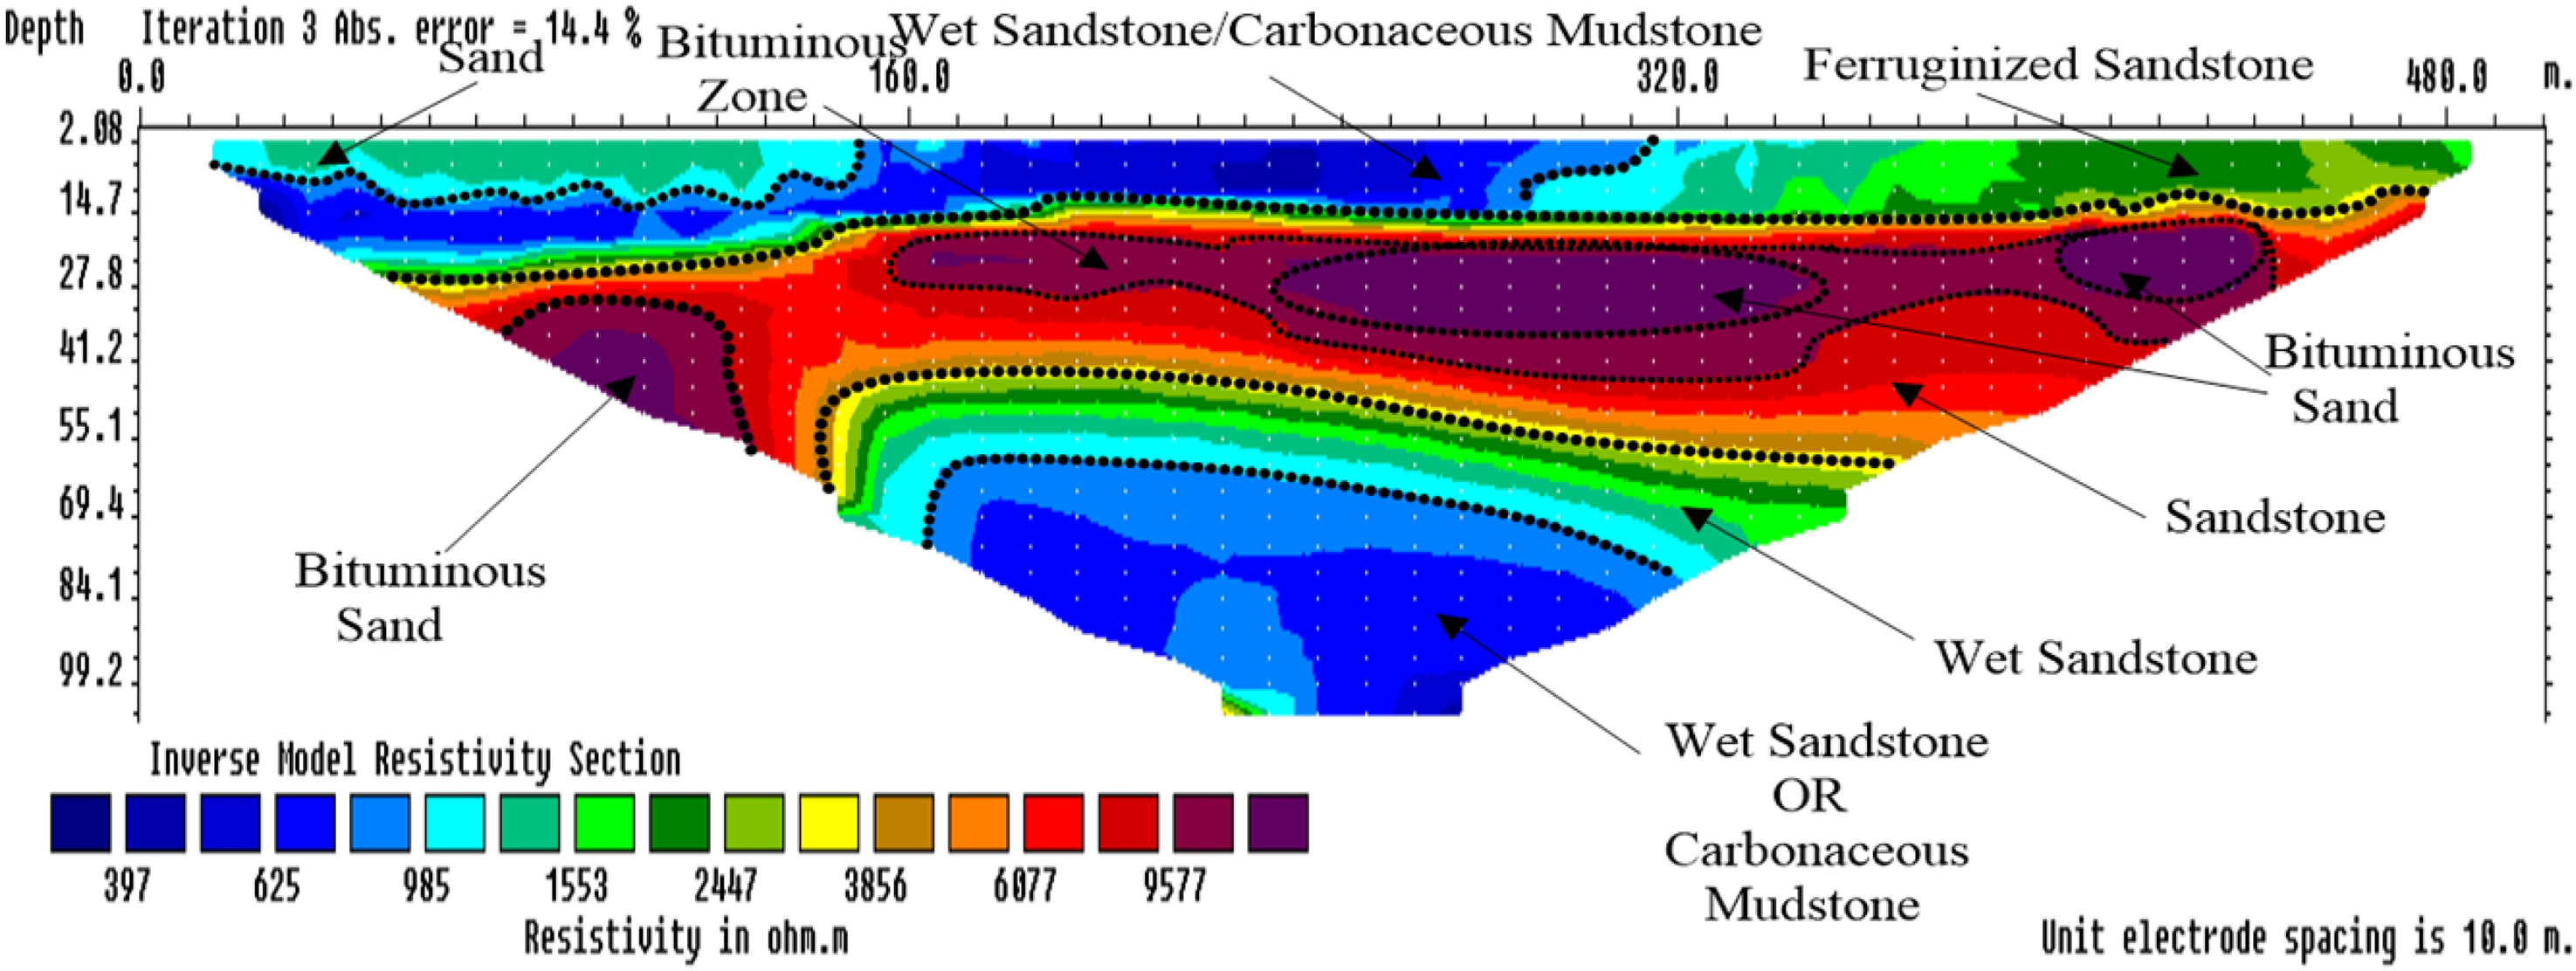
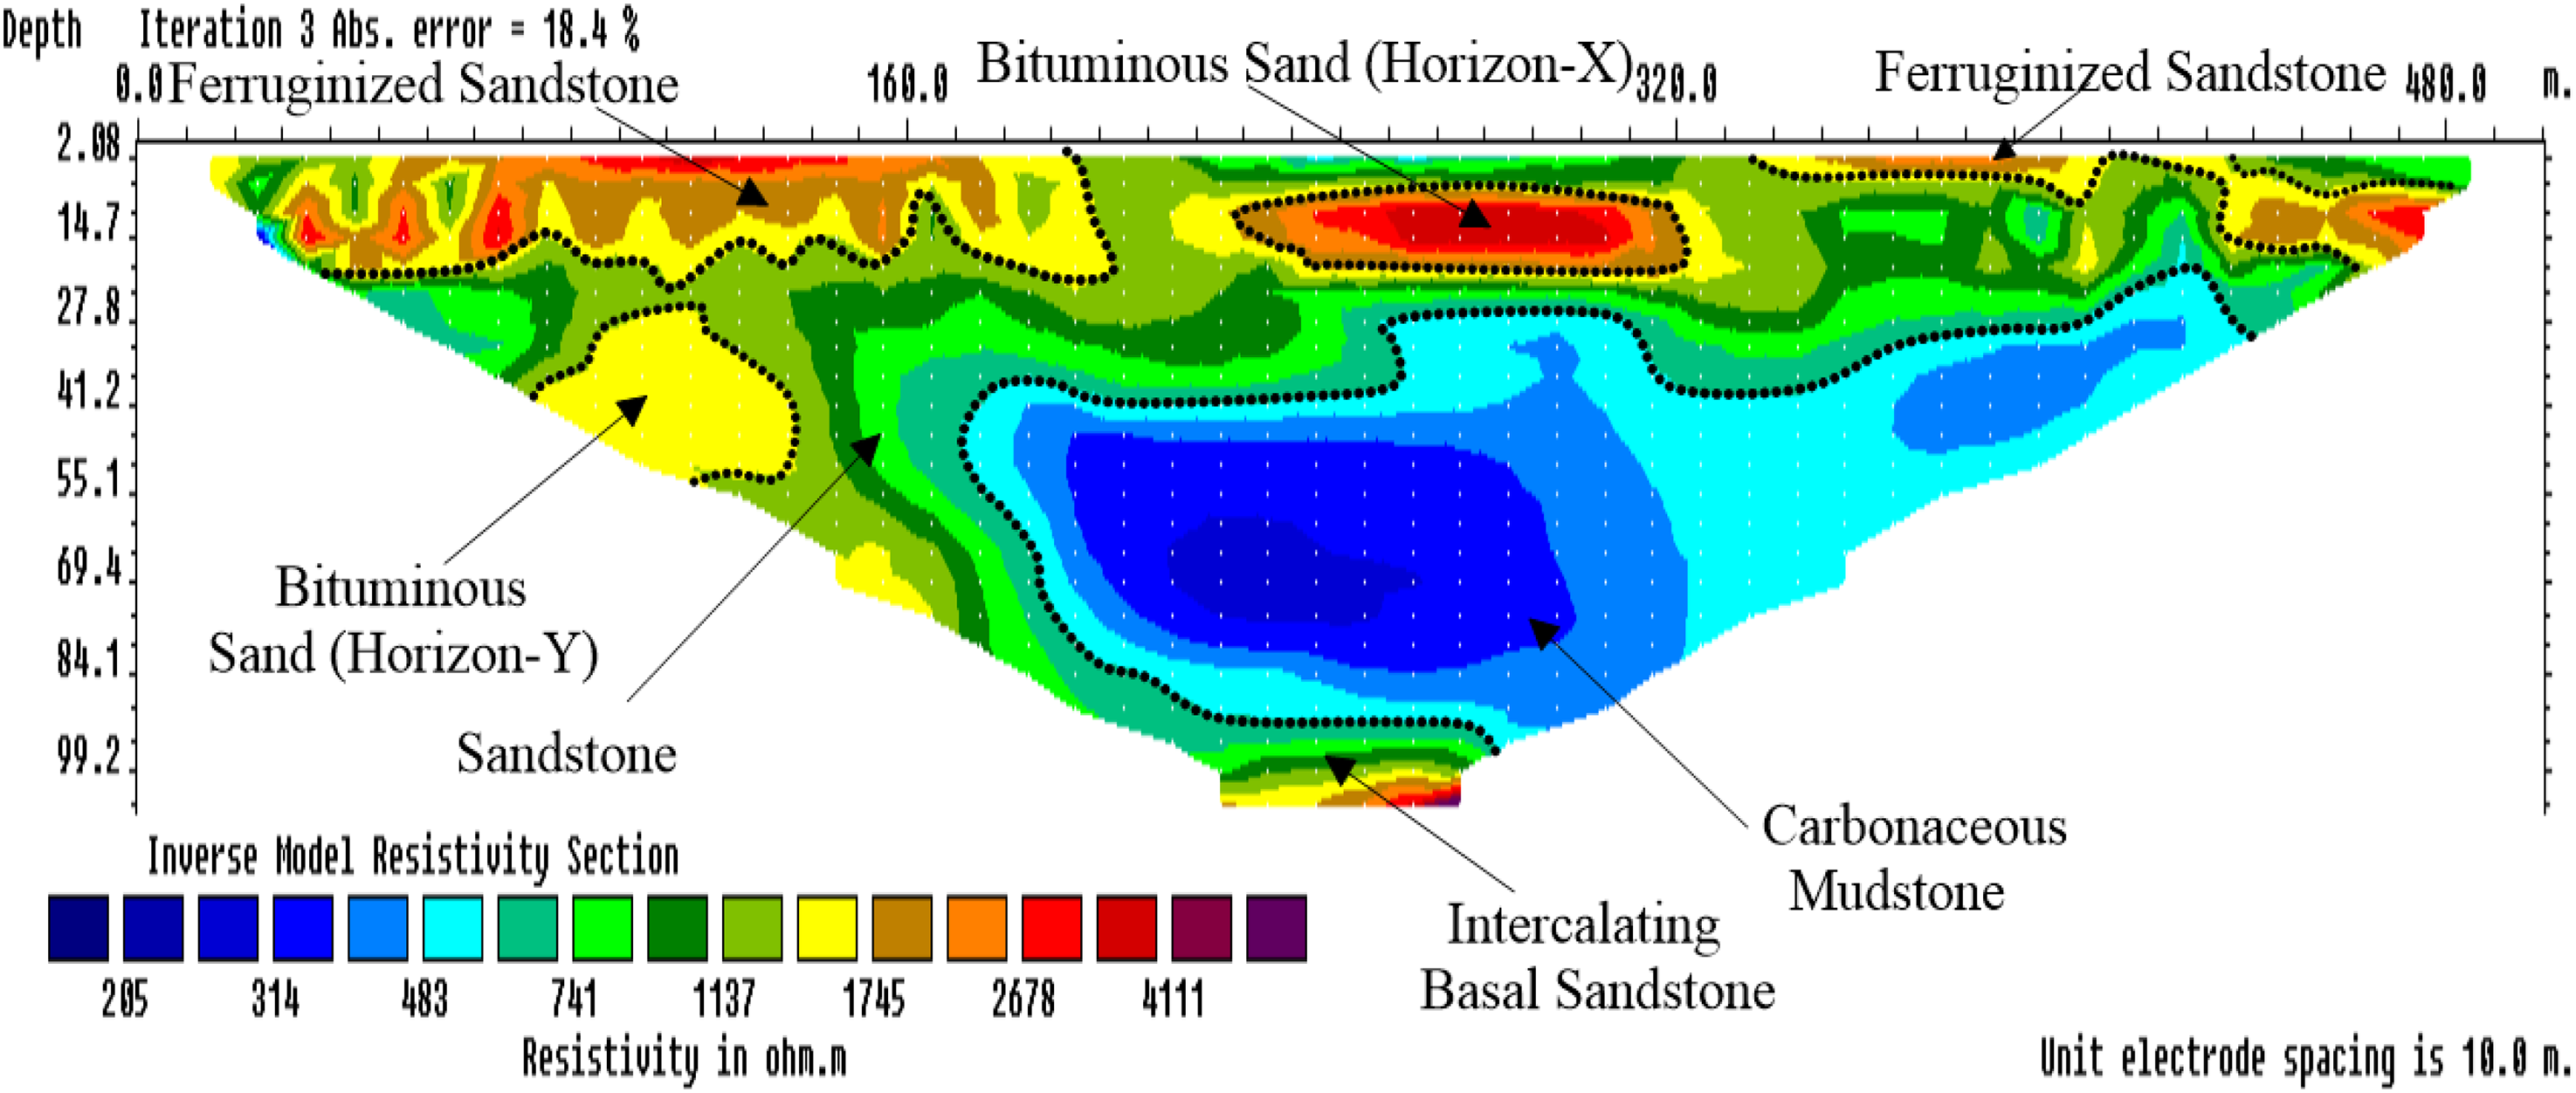
Resistivity section along profile one in the study area.
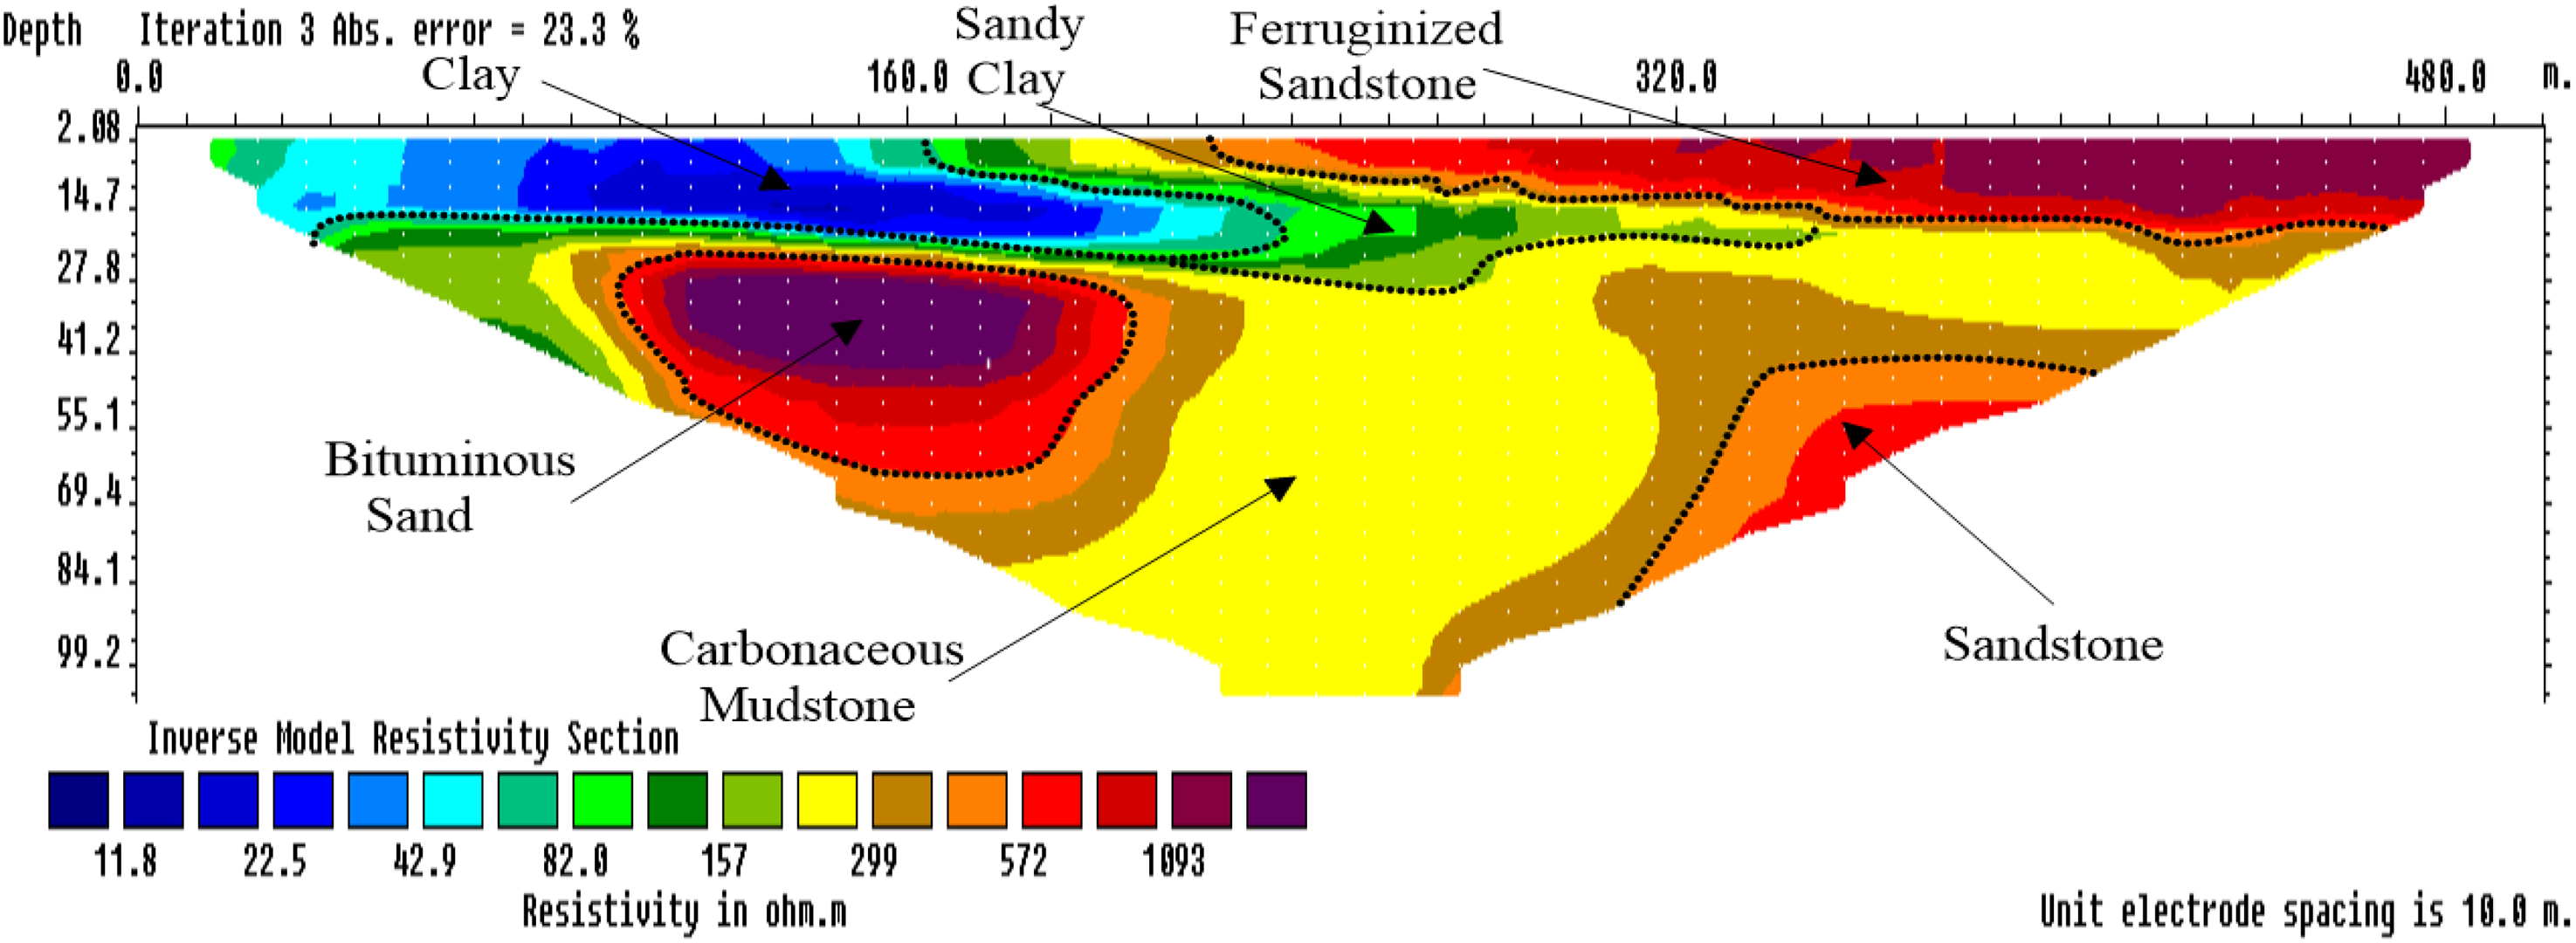
Resistivity section along profile two in the study area.
Resistivity section along profile three in the study area.
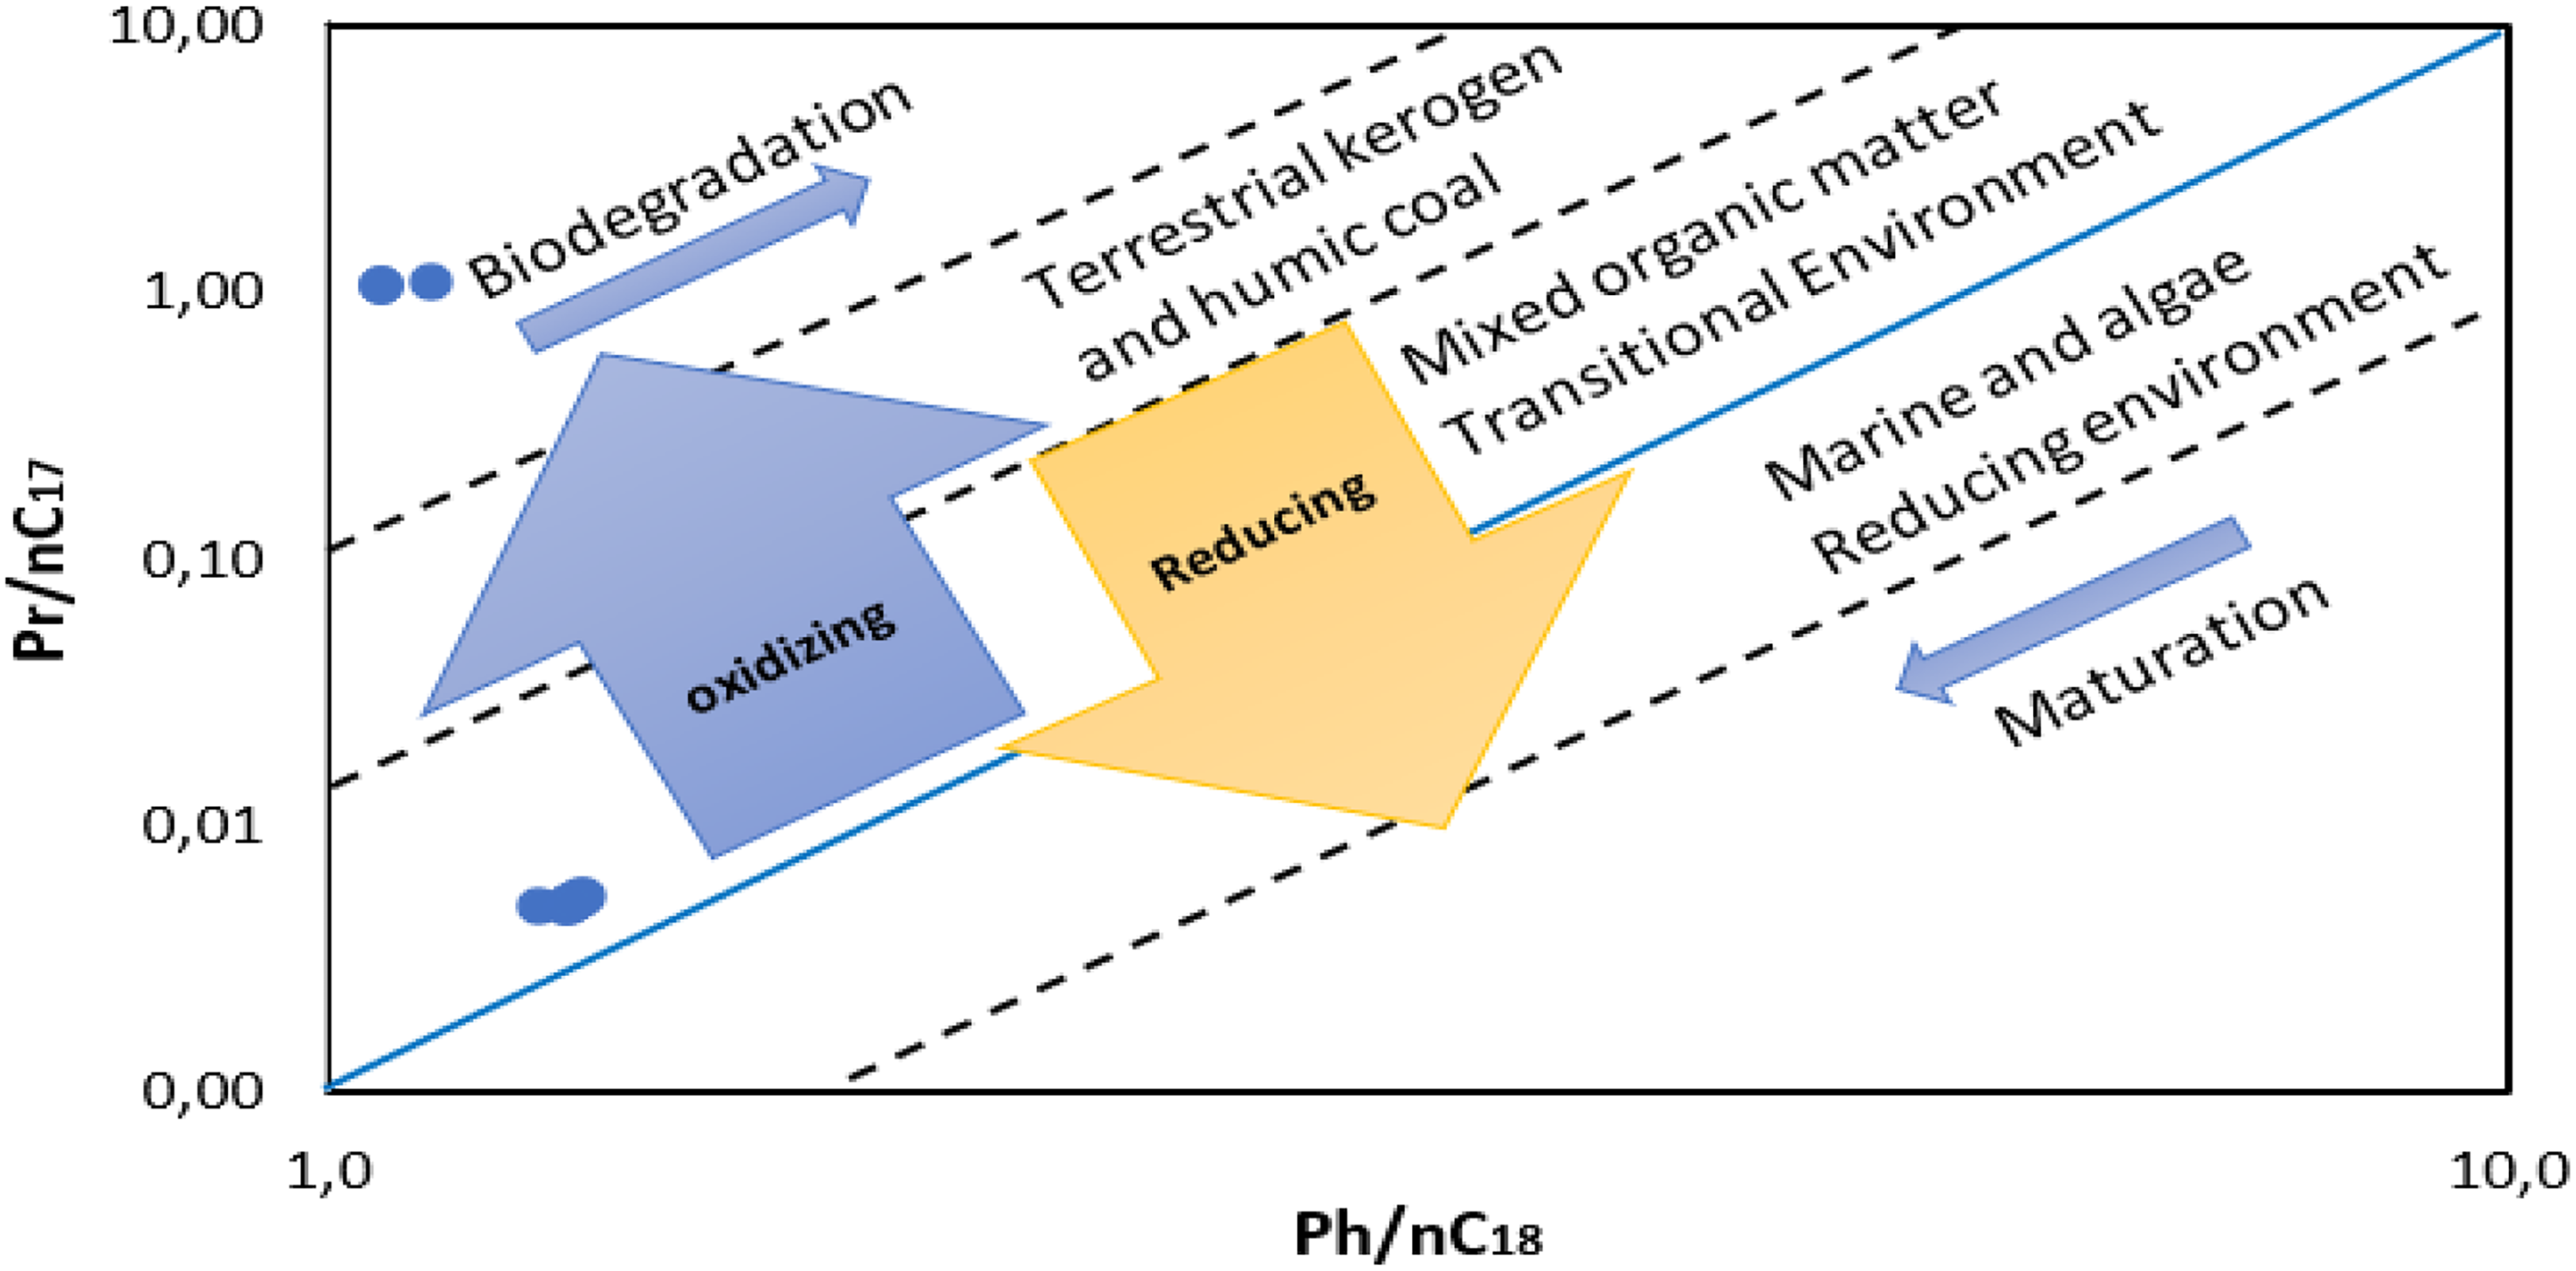
Plot of Pr/nC17 vs. Ph/nC18 of the Afowo Shale Formation showing mixed organic matter and terrestrial kerogen input.
The resistivity and thickness of the topmost geo-electric stratum generally varied between 200 and 2000 Ωm and 10–26 m, respectively (Figure 6). Based on the resistivity values, the geo-electric stratum comprises sand/sandstone (985–1500 Ωm) with thickness (5–12 m), micaceous sandstone/carbonaceous shale sequence (200–900 Ωm) with thickness (10–15 m) and ferruginized sandstone (985–3000 Ωm) with thickness (10–18.5 m).
Furthermore, stratum 2 shows a bitumen-impregnated sandstone unit with a thickness of 30–43 m, having high resistivity values from 3500 to 9900 Ωm, beneath the topmost stratum. Meanwhile, the non-bituminous and bituminous portion of the sandstone exhibits resistivity values that vary between 4000–6000 Ωm and >9700 Ωm. The bitumen impregnations were discrete hydrocarbon lumps (closures) of the resistivity section. Although the trapping mechanism is stratigraphic, the sedimentary pile is slightly disrupted by the forceful viscous migration of the bitumen deposits.
Additionally, stratum 3 depicts a water-saturated sandstone, disparately homogenous and laterally continuous, varying in thickness between 10 and 15 m. Noticeably, it disappears around the 140 m distance mark, possibly due to an upward hydrocarbon migration. The strategic positioning of the stratum within the sequence potentially made it an excellent aquifer. Meanwhile, the geo-electric stratum 4 is interpreted as carbonaceous shale with a resistivity range of 985–2900 Ωm with a thickness >30 m.
Profile two
The upper sequence of profile two shows geoelectric units comprising clay (10– 80 Ωm), sandy clay (82–167 Ωm), and overlapping sandstone/ferruginized sandstone units (572–1100 Ωm) as shown in Figure 7. This section's major resistivity boundary line undulates between depths 18.5 and 20 m occurring as a continuous stratification interface between the upper geo-electric sequence and the thick, disrupted basal sequence.
The basal sequence consists of a thick geo-electric stratum of carbonaceous shale (100–200 Ωm) and bituminous sand (572–1100 Ωm) at a distance mark of 0–320 m within the profile. The thickness of the carbonaceous shale is 25 m near the end of the profile. Beyond the 320 m distance mark, the subsurface section is sequenced into two geo-electric units, with a resistivity value of 200–299 Ωm and 401–572 Ωm, indicating a lithologic transition from shale to sandstone from top to bottom.
Profile three
The resistivity section of profile three (Figure 8) delineated a multilayered sequence partly distorted by lenticular to sub-circular anomalies of very high resistivity near the Earth's surface. Its electrostratigraphic succession broadly consists of three geo-electric strata encountered at a depth range of 2–35 m, 35–90 m, and >90 m (Figure 8).
The topmost stratum exhibits a wide resistivity range of 741–4111 Ωm, inferred as sandstone bodies. Sub-classification of this stratum to a resistivity range of 741–1210 Ωm, 1300–3500 Ωm, and 1745–4111 Ωm is imperative to infer the laterally extensive sandstones, delineate the 17 m thick ferruginized sandstone localized between 0 and 190 m, and unveil the bituminous sand impregnations, respectively. The thinner occurrence of the ferruginized sandstone (2–9 m) runs from a 340 m distance mark to the end of the profile. The mid-stratum is a 50–55 m thick geo-electric layer with a resistivity range of 190–533 Ωm corresponding to carbonaceous shale. Between the 70 and 120 m distance mark, it is impregnated by an anomalous resistive body of 1350 Ωm delineated as bituminous sand (Figure 8). Nearly horizontal at the base of the shale stratum is a geo-electric layer characterized by a resistivity range of 741–4111 Ωm (Figure 8). The layer is similarly inferred as a sandstone stratum intercalating the carbonaceous shale units, indicating a repetitive cycle of sedimentation.
Shale oil and gas prospect
The n-alkane profile of the organic-rich shale consists of low molecular weight <nC21, indicating inputs of organic matter from planktonic materials, and the long-chain n-alkanes (>nC25) are predominantly derived from higher plants (Feng et al., 2023). The values of pristane/phytane <1 (0.95–0.98), >1, and carbon preference index (CPI, ∼ 1) indicate that the oils and gas have been generated from anoxic marine shale containing a mixture of types II and III kerogen with terrestrial organic matter input during their deposition (Connan et al., 1986). Several studies (Alizadeh et al., 2020; Zhu et al., 2008; Burwood et al., 2003) have used the ratio of Pr/Ph to decipher the depositional environment as strongly oxidizing (>2.0), weakly oxidizing to reducing (1.0–2.0), weakly reducing (0.5–1.0), and strongly reducing (<0.5). In this study, the cross plot of Pr/nC17 and Ph/nC18 indicates a mixed organic matter from continental and marine environments sedimented in a transitional depositional condition (Figure 9). The condition can be attributed to alternating marine transgressions and regressions of the South Atlantic Ocean, which deposited sediments of varied thicknesses within the Cretaceous to Neogene stratigraphic units of the Dahomey Basin.
Different biomarker indicators have been used to identify the depositional environment of the source rock (Alizadeh et al., 2020). High concentration of gammacerane, and the C35-hopane over the C34-hopane, suggesting high salinity and anoxic conditions typical of a saline lacustrine sedimentary environment (Gurgey et al., 2007). Furthermore, the gammacerane index (GI), ratio of Gamm/C30-hopane, indicates water column stratification in relation to temperature or salinity deposited under anoxic environments with some input from higher plants. The low salinity condition, as well as restricted stratification in the depositional environment of the source rock, is represented by the low gammacerane parameter for the studied organic-rich shale.
The distribution of regular steranes can be a veritable tool to characterize the depositional environment of the source rock. Several studies have revealed that C27 regular steranes are predominant in most aquatic plankton, while C28 and C29 are dominant in terrestrial higher plant materials (Schwark and Empt, 2006; El Diasty et al., 2016; Salih et al., 2020). Considering the distribution and abundance of regular steranes of the organic-rich Afowo shale, as shown in Figure 10, it can be interpreted that there is a minor input of terrigenous organic matter of higher plants and a considerable contribution of aquatic planktonic/bacterial steranes were skewed towards the marine, although all plotted in the transitional environment domain. All the studied organic-rich samples show identical sterane profiles with a higher relative abundance of C27 compared to C29 steranes, dominated in marine organisms and terrestrial plants, respectively (Alizadeh et al., 2020).
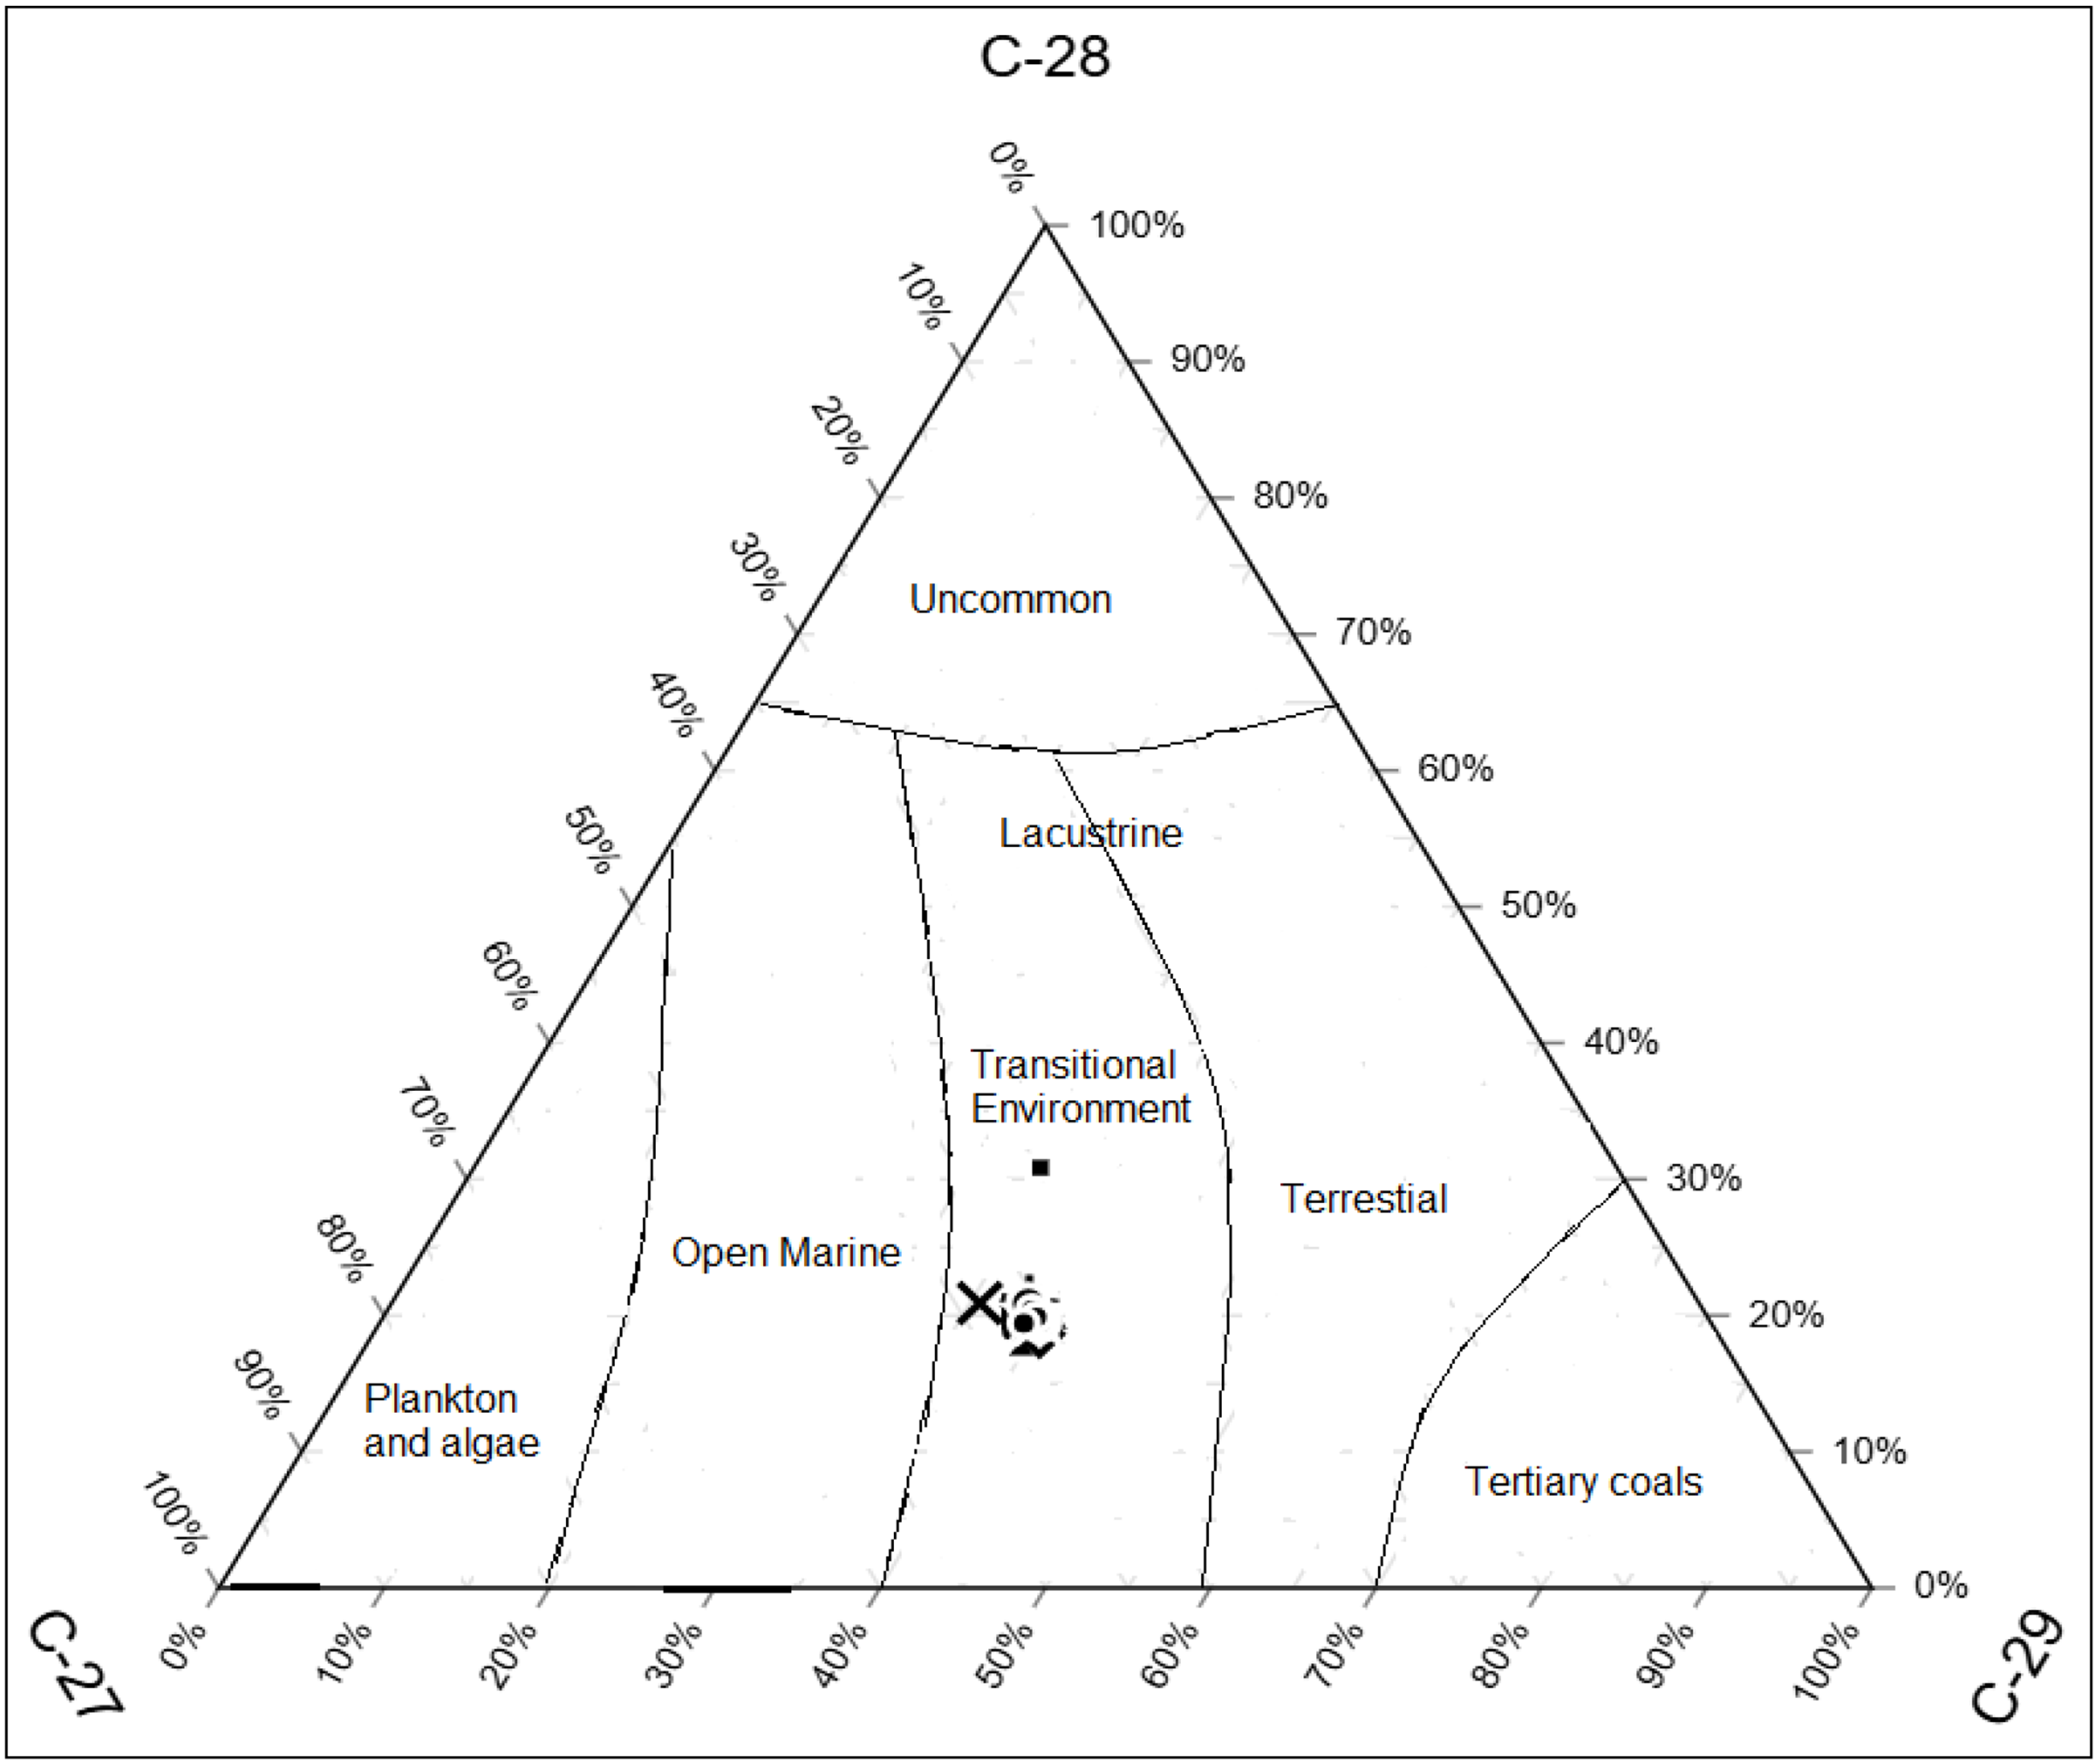
Distribution of regular steranes C27, C28, and C29 of the studied Afowo Shale samples indicating paleoenvironmental condition and source input, modified by Huang and Meinschein (1979).
The thermal maturity of the organic-rich Afowo samples was evaluated using biomarker isomerization ratios of Ts/(Ts + Tm) ratio and C31-hopane 22S/(22S + 22R). The relative concentration of Ts/(Ts + Tm) ratio Ts-trisnorneohopane (18α-22.29.30-trisnorneohopane) and Tm- trisnorhopane (17α-22.29.30-trisnorhopane) is commonly used to assess the thermal maturity in source rocks (Ji et al., 2020). The values of the Ts/(Ts + Tm) ratio 0.49 indicated immature conditions, values between 0.5 and 0.6 indicated oil-window maturity, and values > 0.6 indicated gas-window maturity (Fang et al., 2019). During the catagenesis stage with increasing maturity, the17α(H)-22,29,30-trisnorhopane (Tm) is less stable than 18α(H)-22,29,30-trisnorneohopane (Ts), so the Afowo shale Ts/(Ts + Tm) ratio of 0.10–0.49 indicates the immature stage. Biomarkers such as the ratios of C31 22S/(22S + 22R), C29 20S/(20S + 20R), and C29 ββ/(αα + ββ) are used to determine source rock maturity.
The organic richness of Afowo shale rock is regarded as an excellent source rock, with the TOC exceeding the threshold value of 0.5 wt%. The insoluble organic matter consists of aquatic plankton and terrestrial input of higher plants because the Afowo shale indicates a littoral or estuarine near-shore deposition environment in which there is a rapid fluctuation of water level (Falufosi and Osinowo, 2021). Sediments in the lower parts of the Afowo Formation are transitional zones with mixed brackish to marginal horizons (Omatsola, 1981). The organic matter consists of predominant marine or lacustrine and shows characteristics of Type II kerogen with high TOC contents (TOC > 5.0%), high oil-prone generation potential with an initial HI of approximately 700 mg HC/g rock, as shown in Figure 11(a). At the same time, the presence of the terrestrial higher plants infuses vitrinite exhibiting Type III kerogen, having gas-prone generation potential (Figure 11(a)).
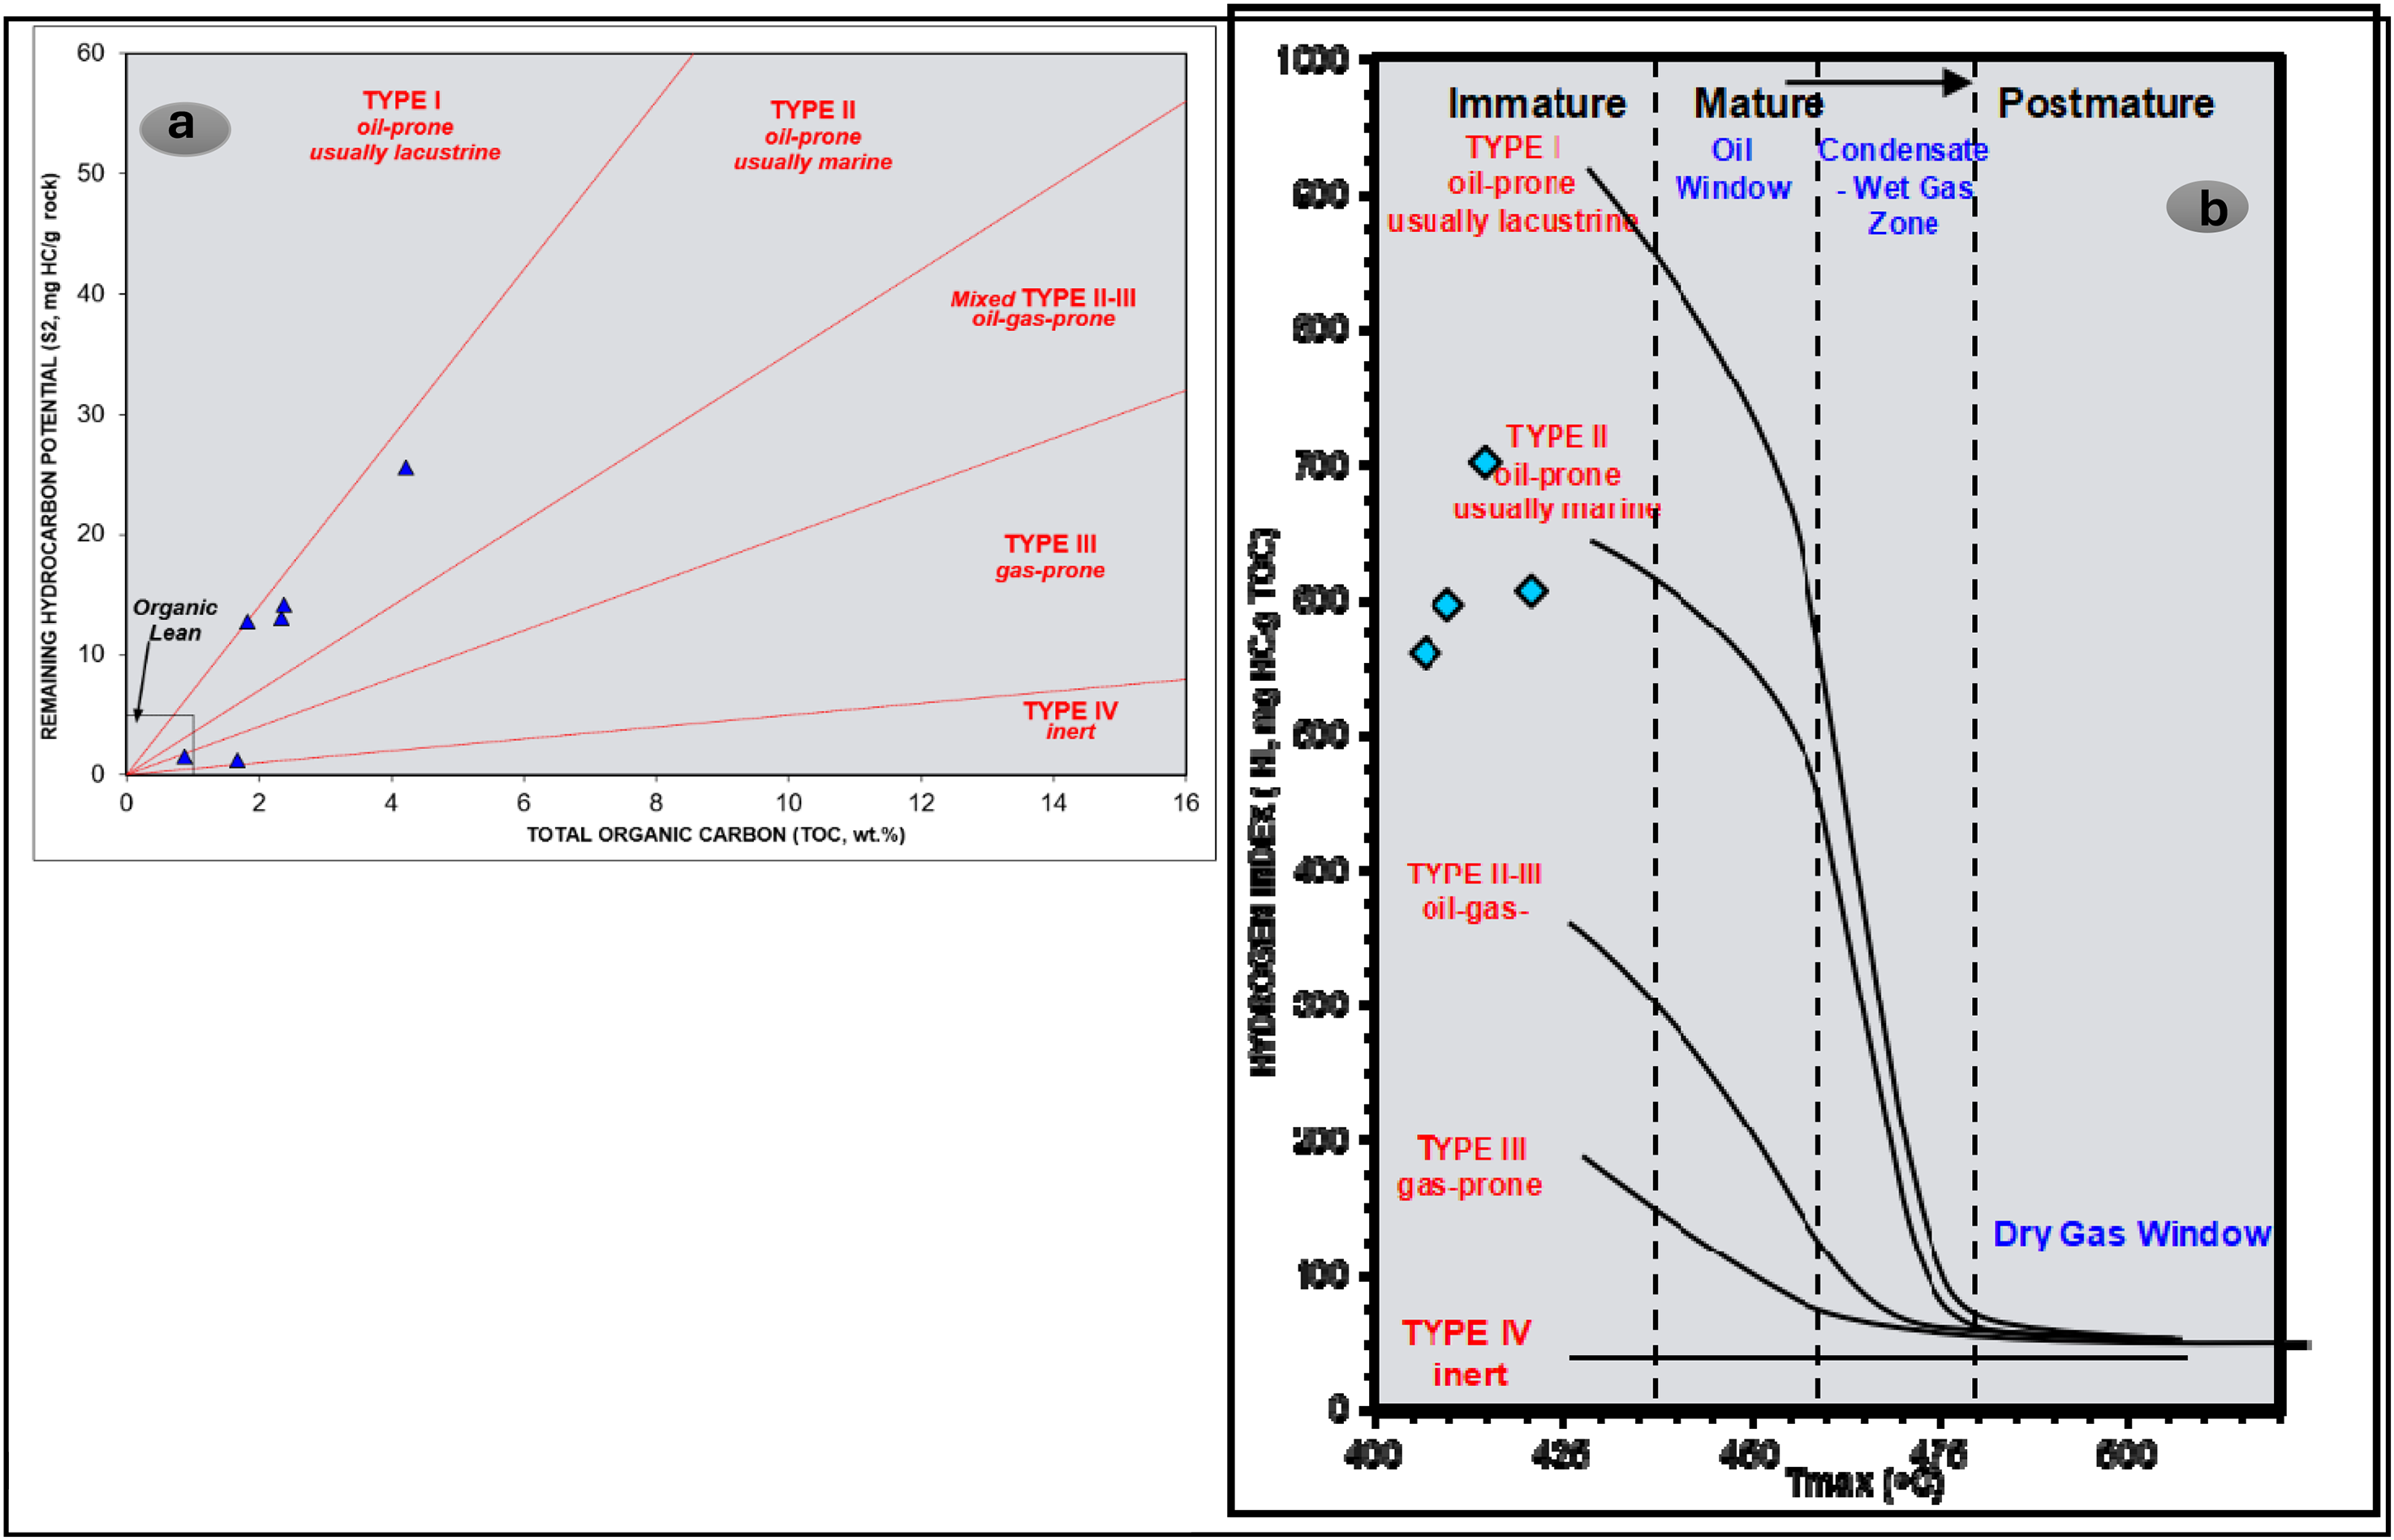
Modified van Krevelen diagram for the studied samples. (a) A plot of remaining hydrocarbon potential (S2) vs TOC showing kerogen type-II-III and type III. (b) A plot of HI vs T max showing maturity levels of the studied shale. Lines divide samples into the following: I—type I kerogen, II—type II kerogen, III—type III kerogen, and IV—type IV kerogen.
Meanwhile, vitrinite is composed of lignin, cellulose, and tannins of vascular plants, particularly from the periderm and xylem tissues. The preponderance of vitrinite input in the Afowo shale imparted the kerogen type-III prone to potential gas generation due to occasional terrestrial inputs brought in by deltaic contribution. Additionally, the plot of the hydrogen index (HI) and Tmax (Figure 11(b)), and inferred vitrinite reflectance (Cal%Ro) between 0.02% and 0.4% indicates potential gas-prone source rocks at thermal maturity, but S1 and S2 values reveal thermally immature source rocks, although TOC, thermal maturity, and source rock quality increase with depth. Presently, the proven Afowo reservoir rocks have been found offshore and belong to the group of Middle Cretaceous sediments (Falufosi and Osinowo, 2021).
Conclusion
The studied shales are generally interbedded with bitumen exhibiting highly anomalous resistivity bodies (closures), distorting the sedimentary sequence based on the electrical resistivity tomography. The shale reveals the preponderance of C27 sterane and C28 sterane, which reflect sterols derived from the diagenetic process of aquatic or marine organisms, and C29 sterols indicate a higher plant organic matter product. The molecular ratio of diaphone (17α-Diahopane) and C29Ts Norneophane (18α21β-30-Norneohopane) indicates an oxidative-reduction condition of organic matter sedimentation. Additionally, the ratio of isoprenoid alkanes, pristine (Pr) to phytane (Ph), threshold values exhibit a weak oxidizing–reducing paleo-redox condition, indicating a mixed organic matter from continental and marine environments sedimented in a transitional depositional milieu.
Furthermore, the relative concentration of Ts-trisnorneohopane (18α-22.29.30-trisnorneohopane) and Tm-trisnorhopane (17α-22.29.30-trisnorhopane) indicates a late-generation hydrocarbon stage. In addition, the Rock-eval pyrolysis indicates that the samples are immature source rocks with good to excellent organic richness. The organic matter contained in the samples has good to excellent potential kerogen types II/III for generating oil/gas. So, the petroliferous record of marine-continental shale has indicated potential for unconventional oil/gas generation.
Footnotes
Acknowledgements
The authors appreciate the Research and Publication Committee of the University of Venda for providing running costs to conduct this research. In addition, we extend our sincere gratitude to the Editor-in-Chief and the anonymous reviewers for their invaluable contributions to the development of this article. Their thorough evaluation, constructive feedback, and insightful suggestions greatly enhanced the quality and clarity of this work. We appreciate their time, expertise, and commitment to maintaining the high standards of this scholarly publication.
Author contributions
Akintola GO conceptualized the research, designed the methodology, and wrote the manuscript; Ikhane P collected the Geophysical data.
Funding
The authors received no financial support for the research, authorship, but publication of this article is supported by the University of Venda, Research and Publication Committee.
Declaration of conflicting interests
The authors declare that they have no known competing financial interests or personal relationships that could have appeared to influence the work reported in this paper.