
Abstract
The inter-salt argillaceous dolomite reservoirs in the central region of China contain large abundance of oil resources with ultra-low permeability and porosity. However, the oil wells in this area show a very quick reduction with the decline of formation pressure. This article aims to investigate the main possible reasons that affect oil well productivity in the target oilfield. This study begins with analysis of capillary microscopic model, core stress sensitivity experiments, and non-Darcy percolation experiments. The impact of effective stress on permeability and porosity of the reservoir was revealed in this article. The novel productivity model and productivity evaluation model which couples stress sensitivity and threshold pressure gradient were proposed. The analysis of capillary microscopic model shows stress sensitivity of permeability to be much greater than that of porosity during the process of depressurization. The core stress sensitivity experiments results indicate that permeability and effective stress show index relationship while porosity and effective stress show binomial relationship. Damage rate and recovery rate of permeability and porosity were put forward to describe the degree of influence of stress sensitivity on permeability and porosity. The models were used to investigate the factors that affect single well productivity for the target oilfield. Application of the proposed model to this tight oilfield indicates that, the degree of influence of stress sensitivity is much greater than that of threshold pressure gradient. In addition, the greater the stress sensitivity coefficient and threshold pressure gradient are, the greater the productivity reduction will be.
Keywords
Introduction
The stress sensitivity of reservoir rock is that, its permeability and porosity change when the effective stress acting on it changes. Permeability stress sensitivity has become a key factor in the development of low-permeability reservoir for the reason that stress sensitivity has great influence on the well productivity. Many important achievements have been obtained by numerous studies on permeability stress sensitivity. The studies of the stress sensitivity have experienced the following stages.
Terzaghi (1943) first studied the flow behavior in saturated deformable medium and defined the concept of effective stress, which is the foundation of permeability stress sensitivity research. Fatt and Davis (1952) also studied permeability stress sensitivity and they found out that, permeability reduction ranges from 11% to 41% when the effective stress acting on it changes. McLatchie et al. (1952) used oil to study the stress sensitivity of cores whose permeability ranges from 3 to 102 × 10−3um2. Their experimental results suggested that the irreversible reduction for permeability is 4% in high permeability cores while it is 60% in low-permeability cores. This phenomenon indicates that the strain of the cores includes both elastic and plastic strain. Vairogs and Rhoades (1973), Kilmer et al., (1987), and Osorio et al. (1997) studied permeability reduction of stress sensitivity of different cores. Davies and Davies (1999) and Zheng et al. (2013) systematically studied permeability stress sensitivity and its factors affecting unconsolidated, consolidated reservoir rock, and coal rocks, they pointed out that, pore geometry is the key factor controlling the strength of permeability stress sensitivity. Su et al. (2000), Ruan et al. (2002), Li (2006), and Jiao et al., (2011) studied permeability stress sensitivity of different low-permeability rocks. Their research results indicated that the lower the permeability of the rocks, the stronger the permeability stress sensitivity of the reservoir rock will be. Liao et al. (2012), He et al. (2012), and Li et al. (2013) considered that interstitial materials support throats and they greatly affect the strain of throats and permeability stress sensitivity.
Numerous researches on characterization of permeability stress sensitivity have been done to study the change law of permeability when effective stress changes. Nur and Yilmaz (1985) came up with the permeability modulus to describe the strength of stress sensitivity as shown in equation (1). Zhang and Cui (2001) conducted some experiments on cores to evaluate the permeability stress sensitivity and they provided a new method to evaluate the permeability stress sensitivity as shown in equation (2). The equations are widely used in the permeability stress sensitivity evaluation for low-permeability reservoir.


Li et al. (2005), Yu et al. (2007), Cheng et al. (2010), and Lateef et al. (2015) studied the influence of stress sensitivity on well productivity and they pointed out that effective stress acting on the reservoir rock increases gradually with the development of an oilfield and compression deformation will occur in pores and throats which may lead to reduction in reservoir rock permeability. The reduction of permeability results in the decline of well productivity.
Threshold pressure gradient is the other important factor that affects well productivity. It is defined as the pressure gradient that enables the fluid to start flowing against viscous forces between reservoir rocks and oil. As one of the most important parameters to characterize the nonlinear flow in low-permeability reservoir, threshold pressure gradient has been studied for a long time (Bennion et al., 2000; Civan, 2008; Hassker et al., 1944; King, 1900; Miller and Low, 1963; Simmons, 1938; Thomas et al., 1968). In general, threshold pressure gradient was considered as a constant in engineering calculation (Civan, 2013; Guo, 2012; Liu et al., 2012; Lu et al., 2012). A large number of experimental results show that there exist threshold pressure gradient in the reservoir whose permeability ranges from 0.042 to 201.800 × 10⁻³um2. The lower the permeability, the greater the threshold pressure gradient will be (Li and He, 2005; Li et al., 2010a, 2010b; Xiong et al., 2009). Threshold pressure gradient has a significant influence on production of low-permeability reservoir.
The aims of this article are (1) variation rules of porosity and permeability based on core stress sensitivity experiments for target reservoir, (2) to establish the productivity model and productivity evaluation model that considered stress sensitivity and threshold pressure gradient for the target reservoir, and (3) investigate the factors that affect single well productivity for the target oilfield.
Reservoir background
The tight oil reservoir in Jianghan basin located in the central region of China contains large abundance of oil resources with high salt, which belongs to inter-salt argillaceous dolomite reservoir. Insert-salt argillaceous dolomite reservoir is not only the source bed but also the oil reservoir, where rich oil resources are generated and stored in insert-salt argillaceous dolomite reservoir due to the effect of upper and lower salt formation. The single layer of the reservoir is very thin, but there are many layers in the longitudinal direction and the accumulated thickness is large. In addition, connectivity and distribution range of layers are relatively good. There are 193 salt rhythm layers develops in Qianjiang group, and the accumulated thickness reaches up to 2000 m.
Qian-3 segment, the target inter-salt argillaceous dolomite reservoir in this study is the most important industrial zone with the characteristics of ultra-low porosity and permeability. The mineral of the target segment mainly includes clay mineral, salt mineral and carbonate mineral, and the content of the three kinds of minerals are 33.54%, 22.2%, and 27.67%, respectively (as shown in Figure 1). Statistical results from a large number of core samples indicate that Qian-3 is a tight formation with average porosity of 11.5% and an average permeability of 8.45 × 10⁻³um2 (Xiong et al., 2015).
Map showing lithology and other properties of the target oil reservoir.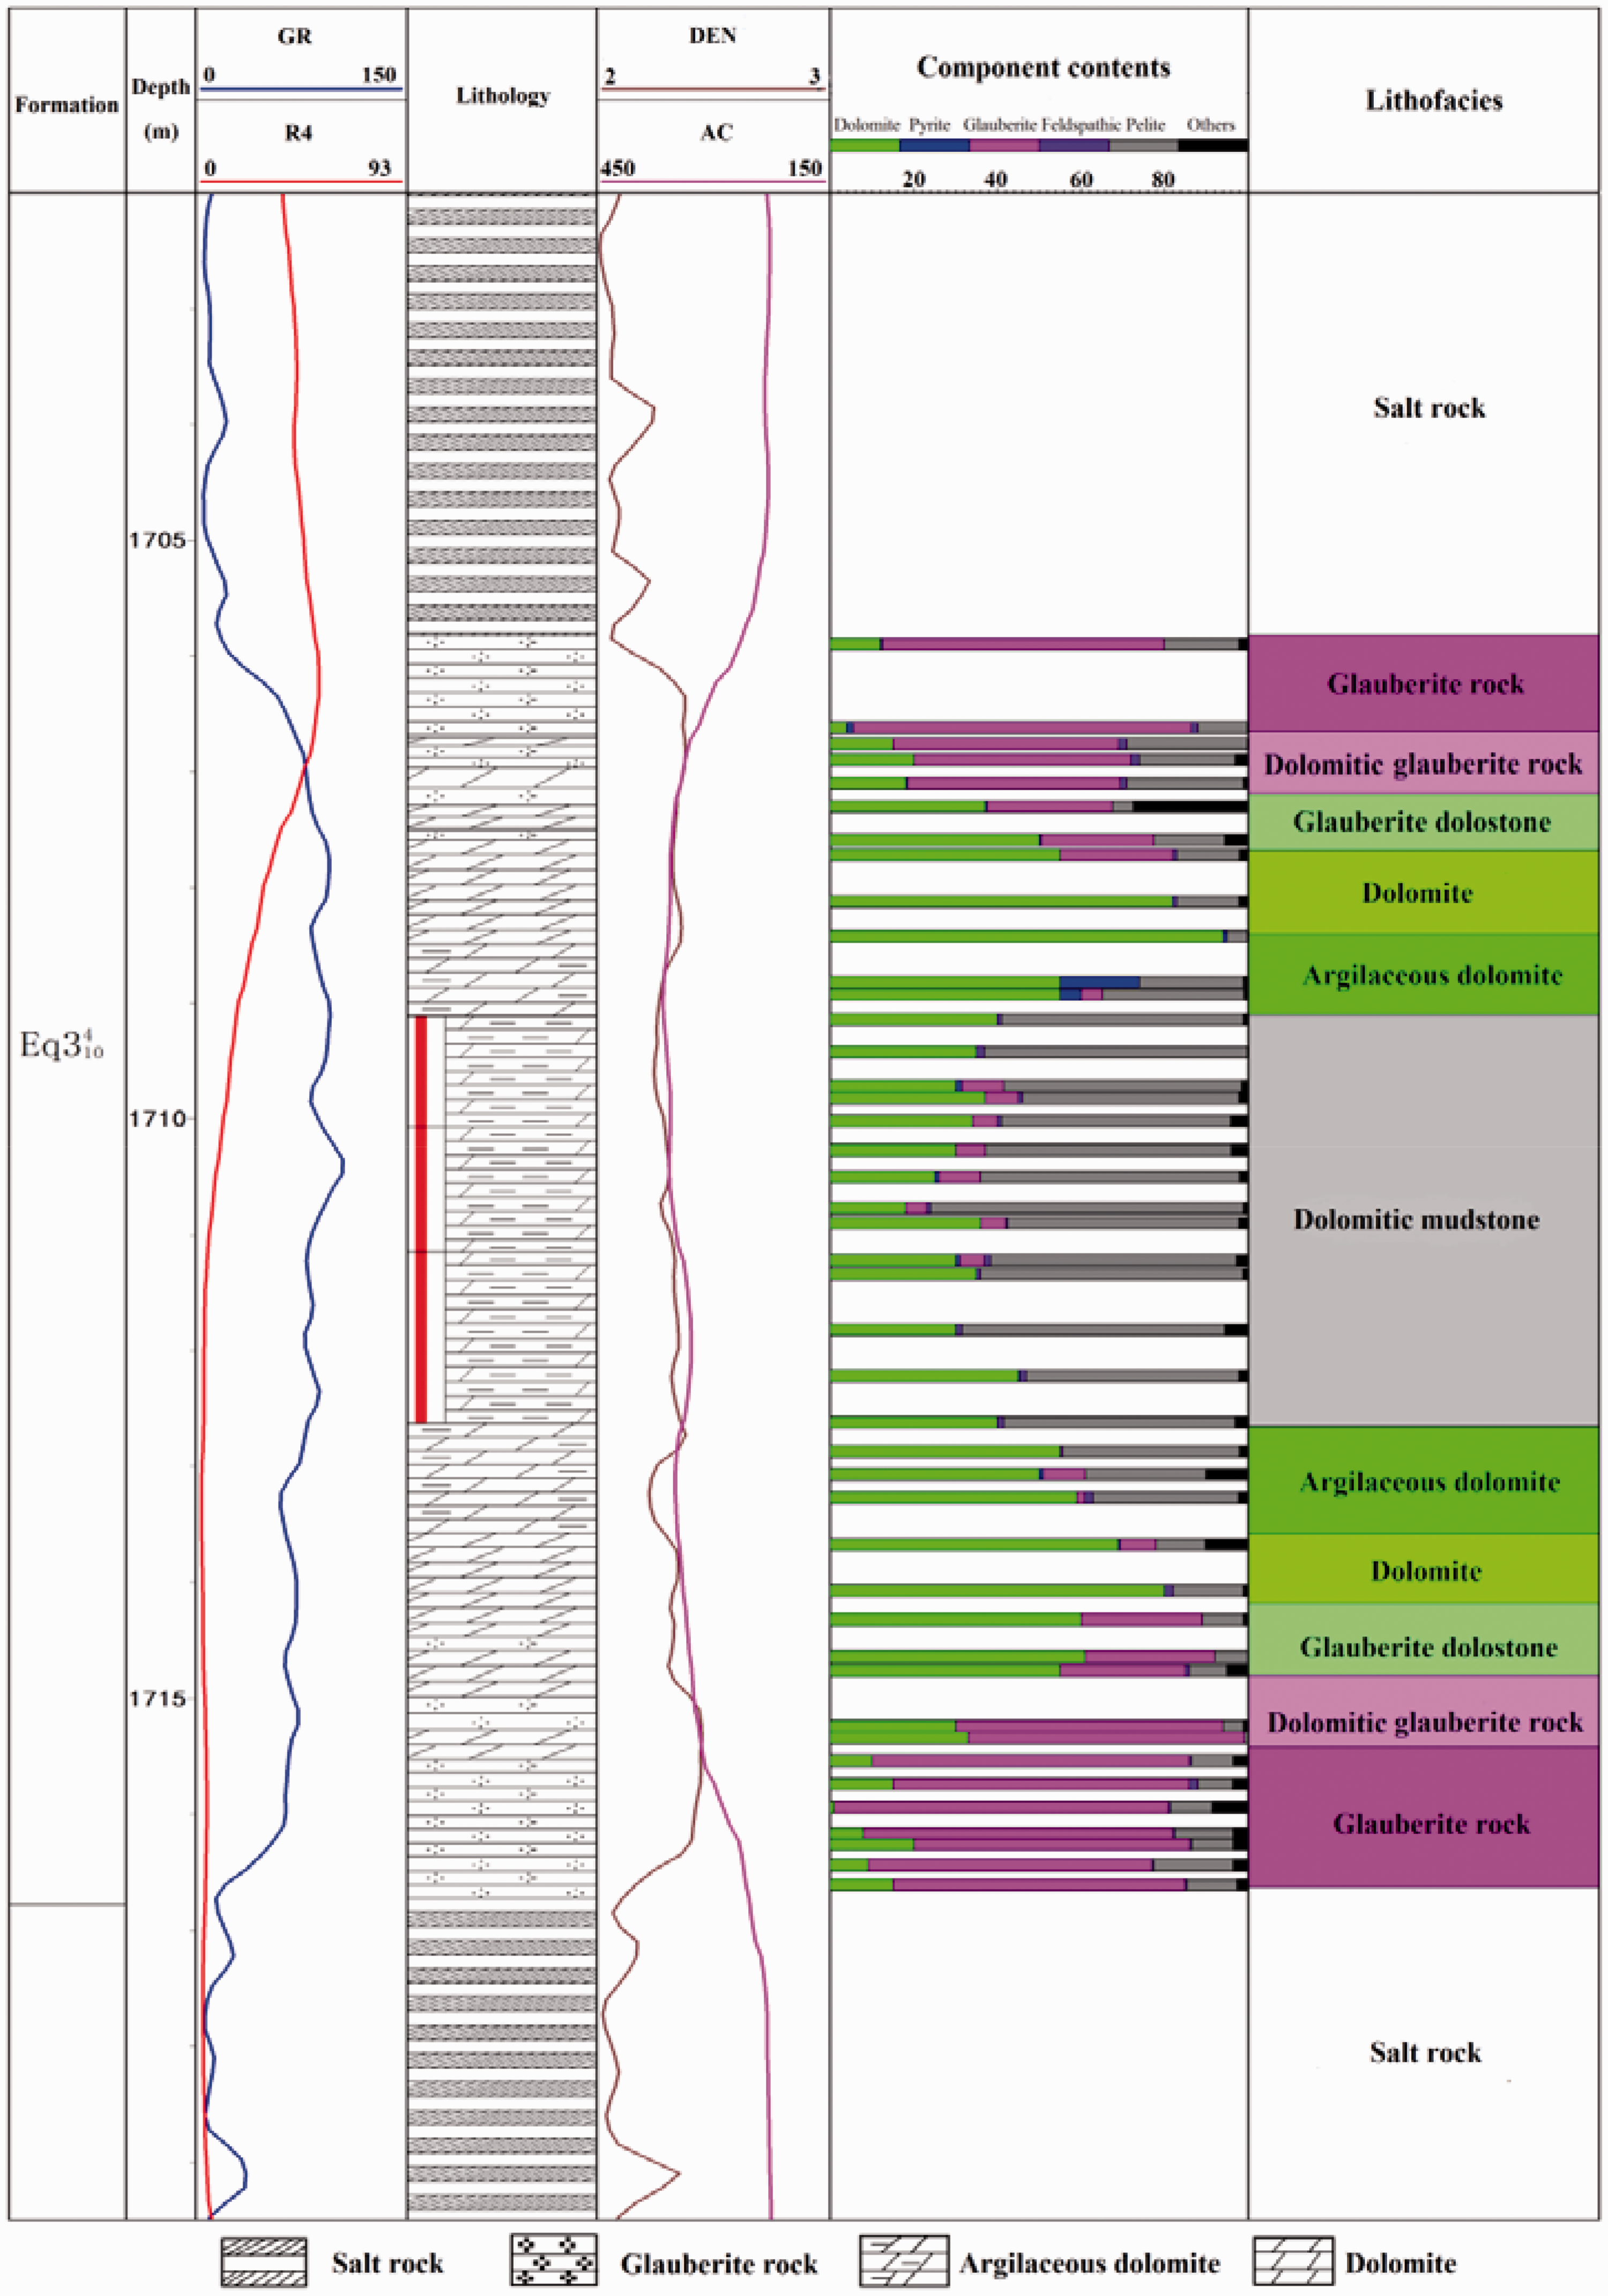
Influence of stress on porosity and permeability
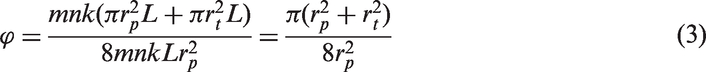
The reservoir spaces mainly include pores and throats. Throats make greater contribution to permeability. In order to study the impact of throats on permeability, the ideal capillary model of pores and throats was used in this article (as shown in Figure 2). Large diameter capillaries and small diameter capillaries represent pores and throats, rp and rt represent large and small capillary radius, respectively. Set each large pore to be connected by two small throats at each end. Flow as shown to be in the straight line, which means tortuosity is equal to 1. The length of pores and throats are L and L/2 respectively. Assuming that one pore and two connected throats as one unit, then, there are m × n × k units in per unit volume. The porosity of the ideal capillary model can be expressed as follows:
Capillary microscopic model.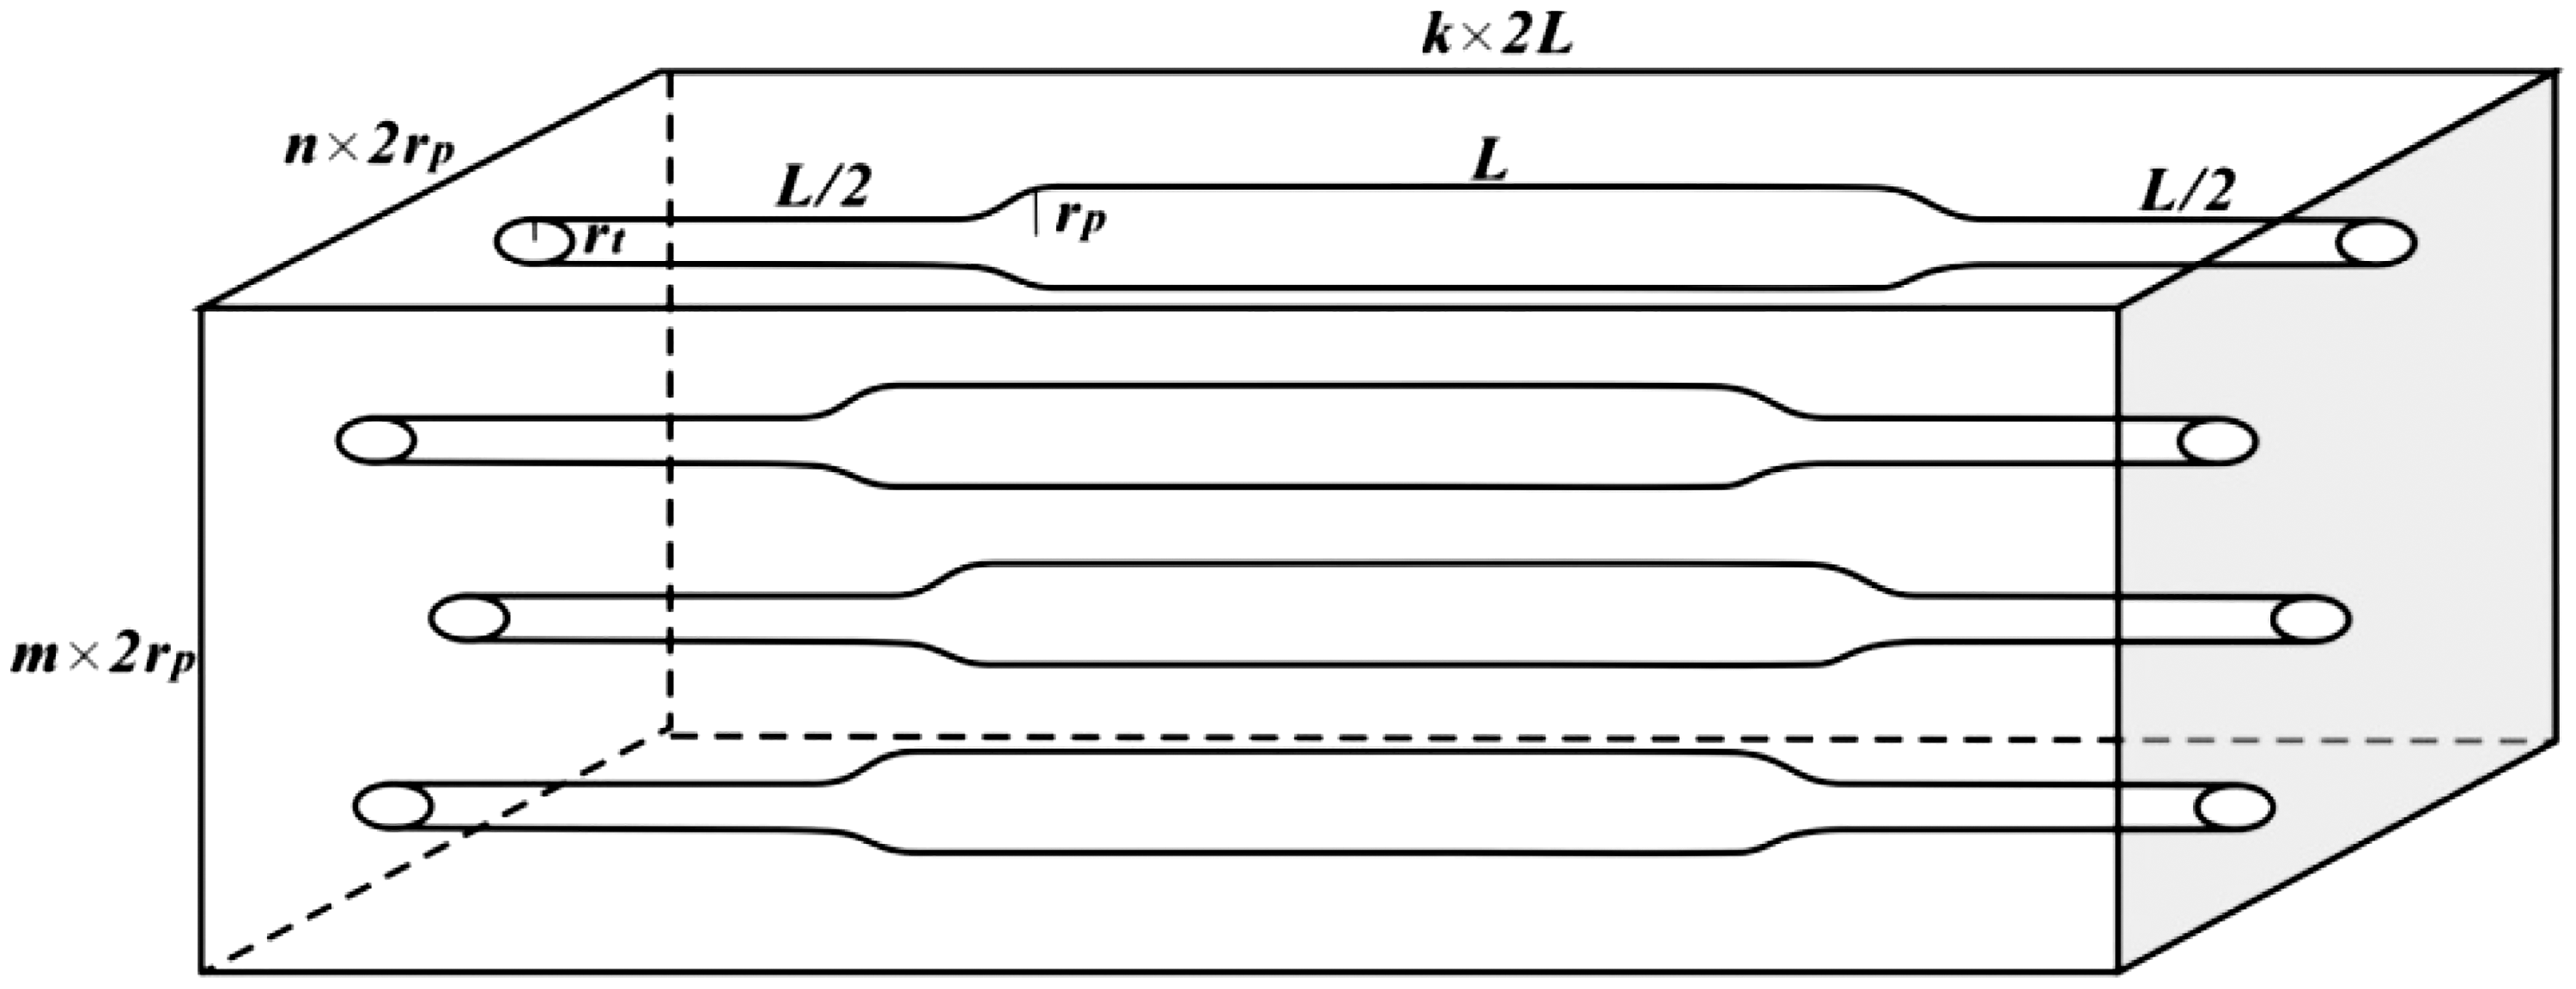
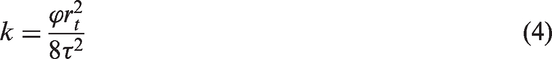
According to the Carman–Kozeny formula, the relationship between throats and permeability can be stated as follows:
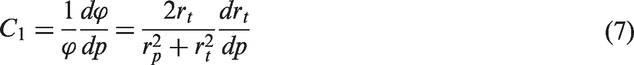
Rock pore structure includes two parts, which are pores and throats. Deformation theory of pores and throats indicates that throats are compressed first rather than pores when the reservoir suffers from compression. Therefore, the permeability of rock is mainly subjected to the limit of throats. Assuming that the pore radius does not change and only throats radius changes when the reservoir suffers from compression, then, the porosity rate and permeability rate can be stated as follows:
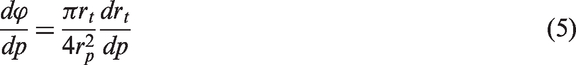
The porosity and permeability change coefficients are defined as C1 and C2 respectively, as stated in equations (7) and (8):

As already known, pore radius is much larger than throats radius, namely,
Research on stress sensitivity and non-Darcy percolation experiments
Experiments
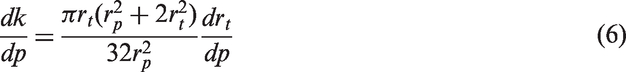
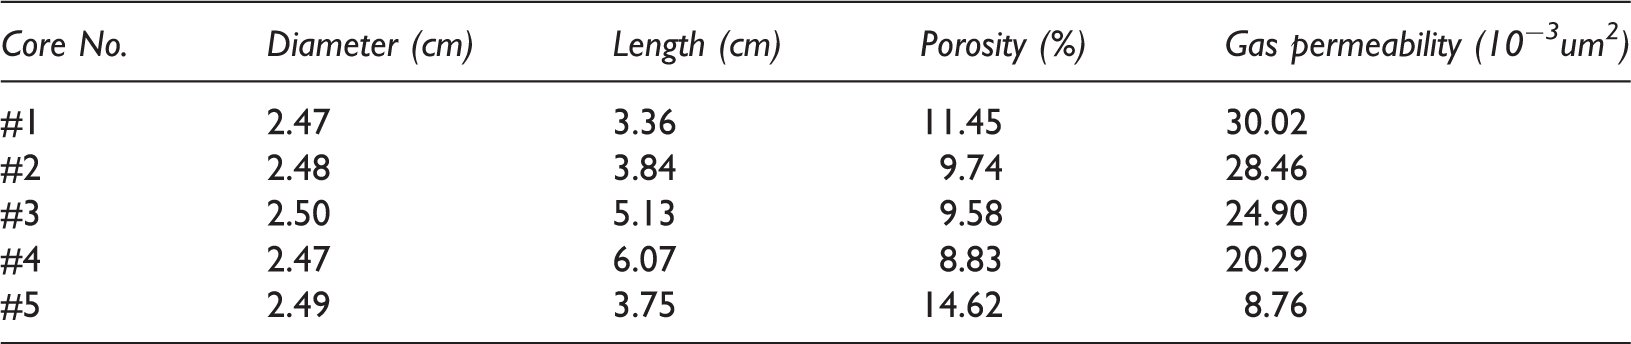
Stress sensitivity experiments. The real cores were selected from Qian-3 member in Wangchang oilfield. The experimental gas was compressed air and the experimental temperature was set at 25℃. The initial reservoir pressure was 40 MPa. Then, test the porosity and permeability of cores under the initial condition before conducting experiments. In order to reflect stress sensitivity phenomenon more clearly to the situation in the reservoir, confining pressure was set to 40 MPa as a constant while porosity and permeability of cores were tested at different internal pressure during the whole process of the experiments. Internal pressure was first switched from 40 MPa to 0 MPa, and then rose from 0 MPa to 40 MPa. Experimental processes were strictly in accordance with the “Reservoir Sensitivity Evaluation Method SY/T 5358-2002” and “Measuring Method for Rock Porosity and Permeability SY/T 6385-1999.” The basic parameters of cores are shown in Table 1. Non-Darcy percolation experiment. In order to indicate the impact of threshold pressure gradient on well productivity truly, percolation experiments of core#5 was conducted. Experimental steps are strictly according to “SYT 6703-2007.” The main steps are as follows: (1) The core porosity and permeability test Permeability and porosity of cores. (2) The non-Darcy percolation test
Step 1: Test and record the basic parameters of the core, which includes geometric parameters, porosity and permeability.
Step 2: Saturate the core with saline water (salinity is 29,884 mg/l).
Step 3: Determine the relationship between flow velocity of saline water and injection-production pressure after putting the core in the gripper.
Step 4: After finishing step 3, the simulation oil with viscosity is 1.5 cp was used to drive water with a flow velocity of 0.1 ml/min until no water is driven out.
Step 5: Switch the displacement flow velocity to 0.01 ml/min, and then gradually increase the oil flow velocity when the pressure is stable until the Darcy percolation curve of oil is obtained. Record the inlet and outlet pressures of core gripper during the experiment.
Step 6: After finishing step 5, use CO2 with 0.1 ml/min flow to drive oil until no more oil is driven out.
Step 7: Switch the displacement flow velocity to 0.01 ml/min, and then gradually increase the CO2 flow velocity when the pressure is stable until the Darcy percolation curve of gas is obtained. Then, record the inlet and outlet pressures of core gripper during the experiment.
Experimental results and analysis
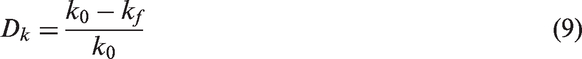
Stress sensitivity evaluation. In order to evaluate stress sensitivity of cores, permeability sensitivity index was defined as Dk, porosity sensitivity index was defined as Evaluation standard of stress sensitivity.
Stress sensitivity evaluation results.
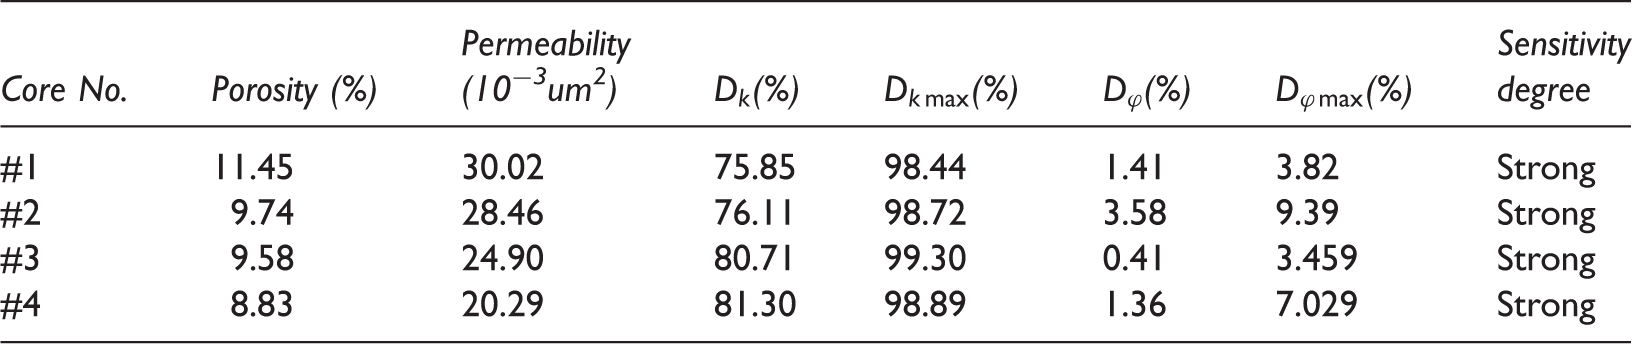


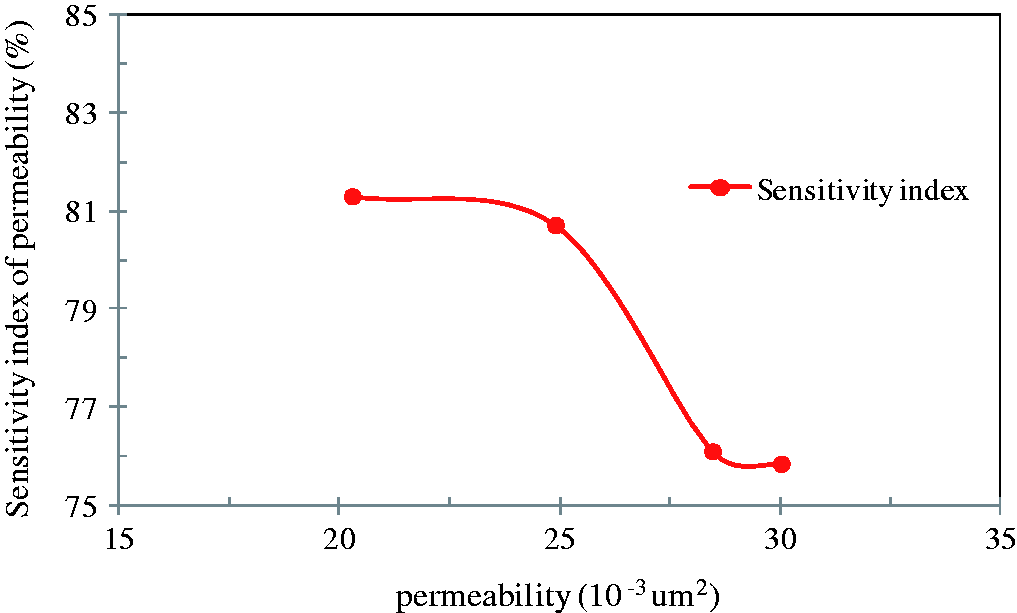
The stress sensitivity evaluation results indicate that reservoir stress sensitivity of the study area is very strong. Permeability sensitivity indexes of cores are more than 75% and the biggest permeability damage rates of cores exceeds 98%. However, the average porosity sensitivity index of cores is 1.69% and the average biggest porosity damage rate is 5.92%. Thus, permeability stress sensitivity is far more than porosity stress sensitivity. In addition, the results also indicate that the lower the permeability, the stronger the permeability stress sensitivity will be (as shown in Figure 3).
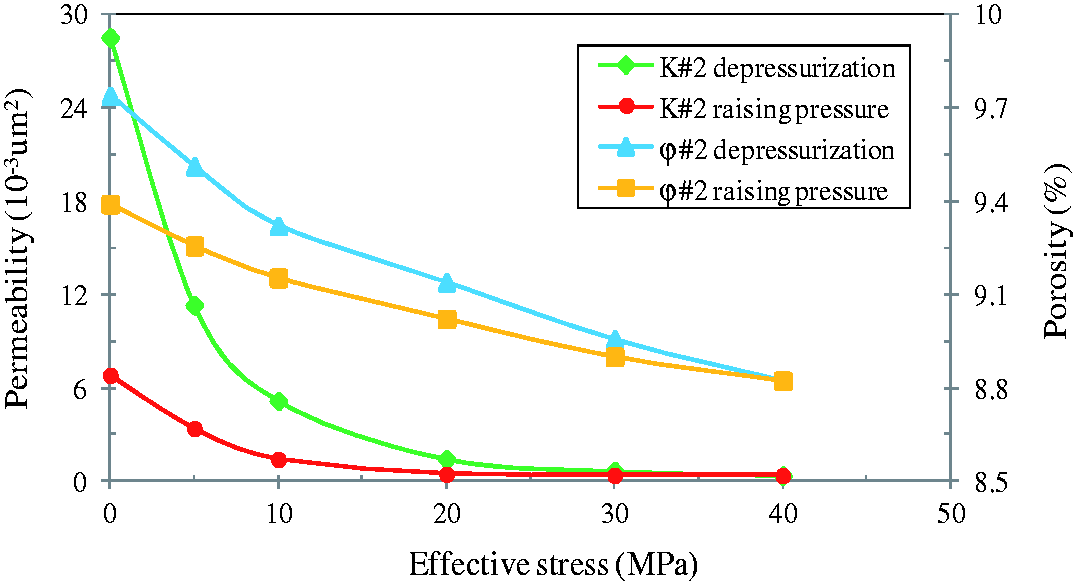
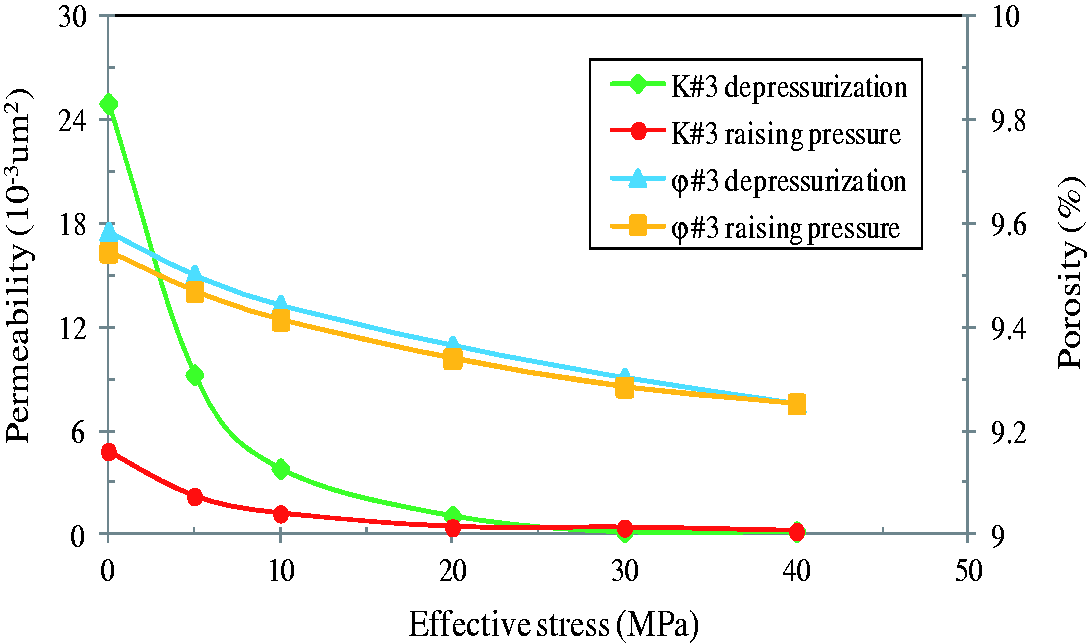
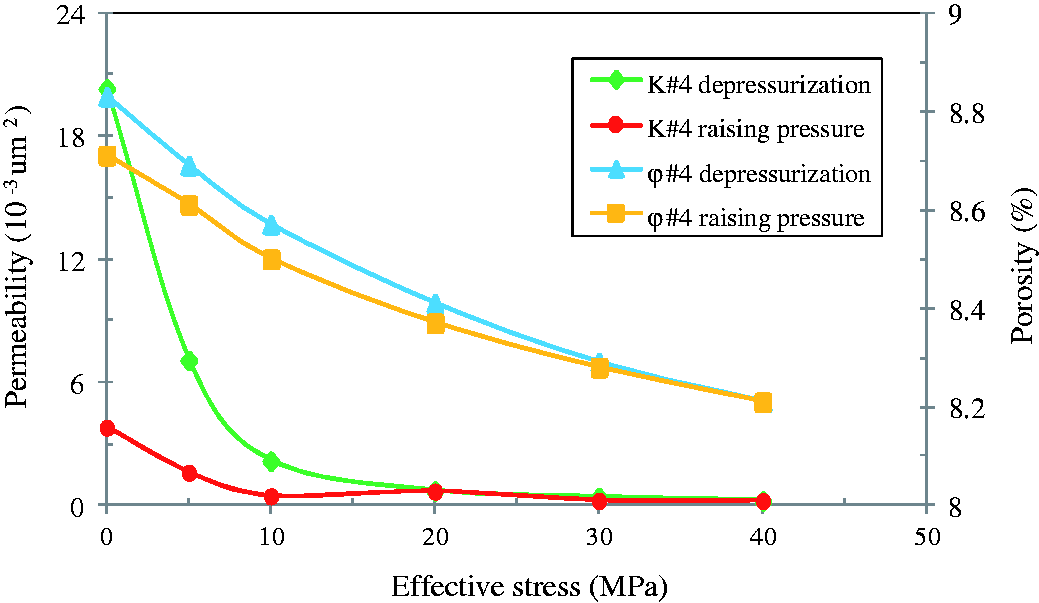
Variation rules of porosity and permeability. Relationships between permeability/porosity and effective stress for cores were obtained after conducting the experiments as displayed from Figures 4–7. The results indicate that, the reduction degree of permeability is far more than reduction degree of porosity during the process of depressurization. The recovery degree of permeability is less than recovery degree of porosity during the process of pressure increment.
Relationship between permeability sensitivity index and permeability. Relationships between permeability/porosity and effective stress of core #1. Relationships between permeability/porosity and effective stress of core #2. Relationships between permeability/porosity and effective stress of core #3. Relationships between permeability/porosity and effective stress of core #4.
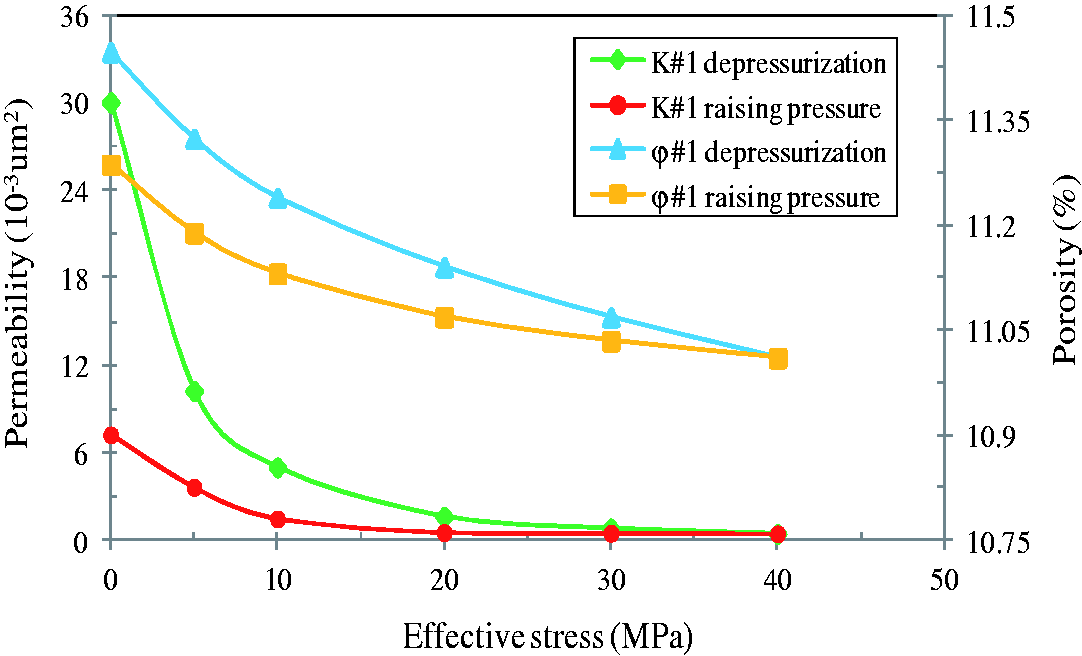
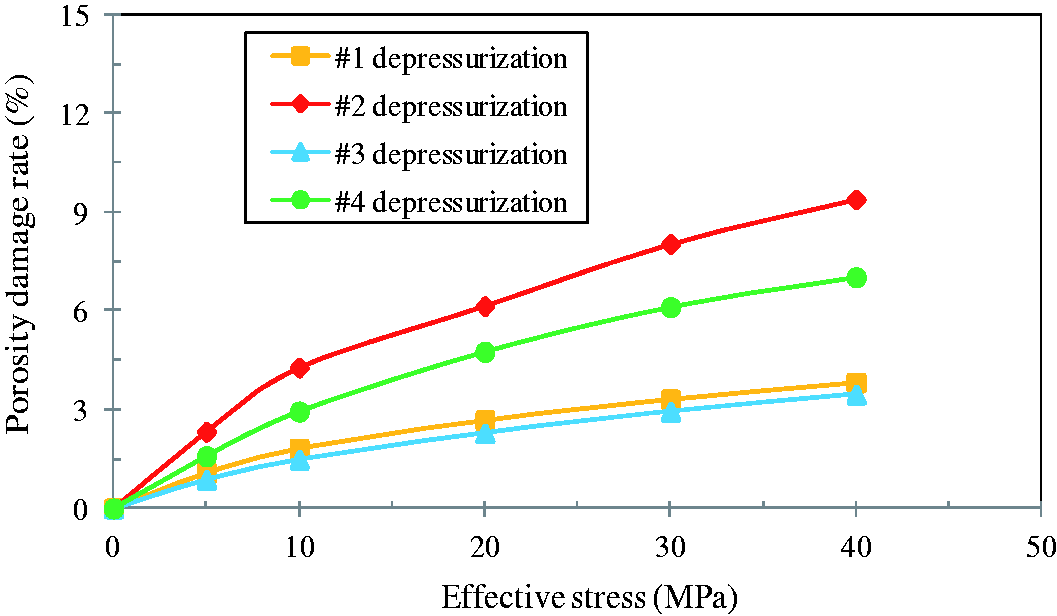
The variation rules of permeability for cores are similar during the process of depressurization. Permeability of cores dropped sharply at the beginning of depressurization process and the permeability damage rates of cores exceeded 95% after the effective stress reached 30 MPa (as shown in Figure 8). Porosity of cores dropped gently during the process of depressurization, and porosity damage rates of cores were much less than that of permeability. Moreover, the porosity damage rates of core #2 and core #4 went up faster than that of core #1 and core #3 and the biggest porosity damage rate was less than 10% with the average porosity damage rate at 5.92 % (as shown in Figure 9).
Relationships between permeability damage rate and effective stress during the process of depressurization. Relationships between porosity damage rate and effective stress during the process of depressurization.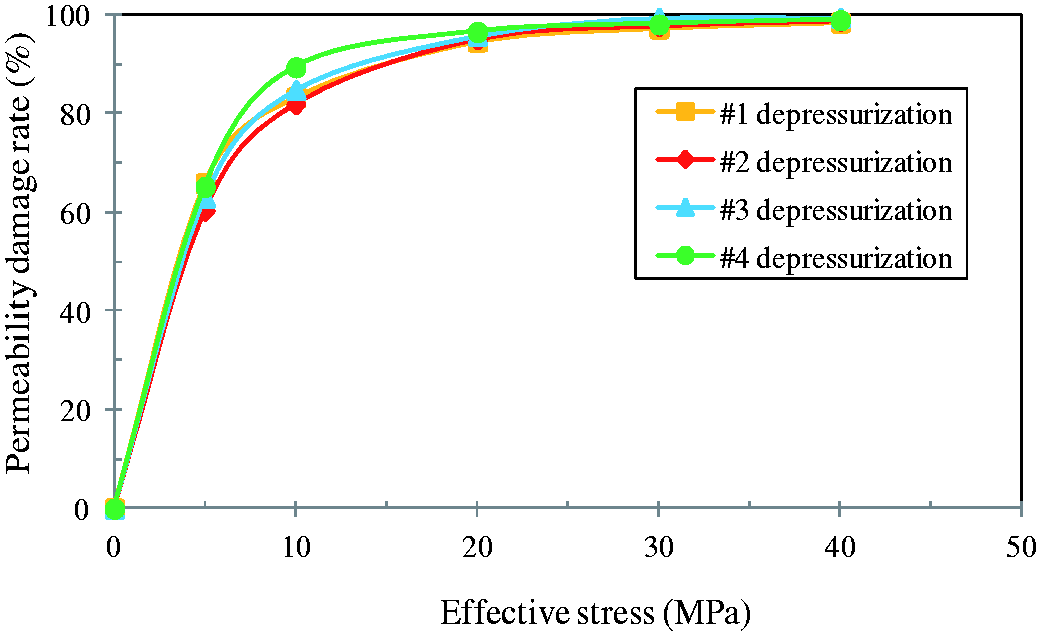
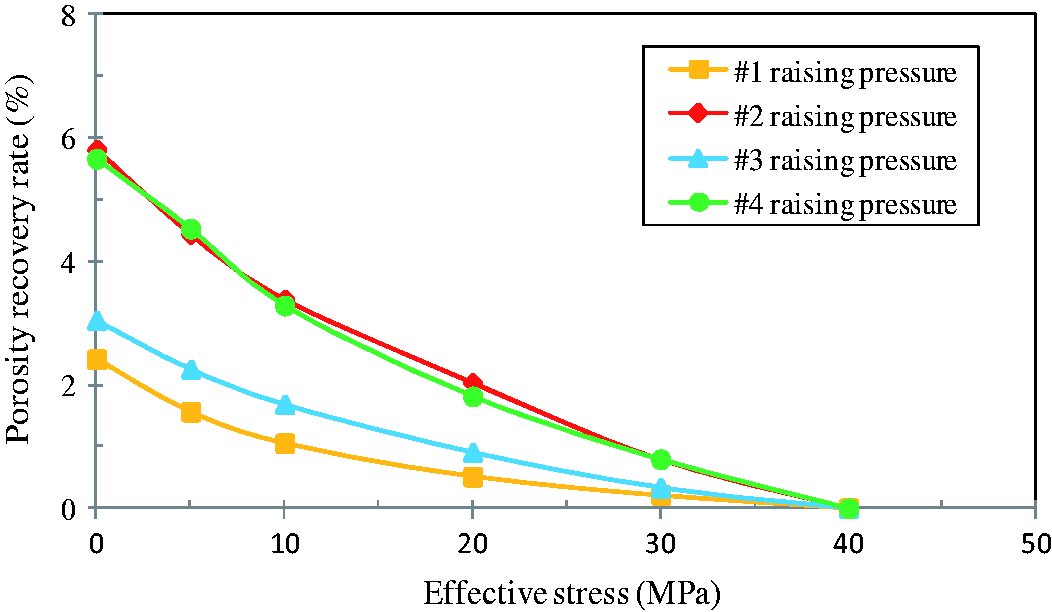
Permeability recovery rate went up gently at the beginning of increasing pressure and it went up faster after the effective stress declined to 10 MPa. Permeability recovery rate of core #1 and core #2 went up faster than that of core #3 and core #4. The biggest permeability recovery rate was 22.61 % when the effective stress declined to the initial state (as shown in Figure 10). Porosity recovery rate of cores went up gently during the process of increasing pressure and porosity recovery rate of core #2 and core #4 went up faster than that of core #1 and core #3. As the porosity damage rate of cores are far less than permeability damage rate, porosity recovery rate of cores are also much less than permeability recovery rate (as shown in Figure 11).
Relationships between permeability recovery rate and effective stress during the process of raising pressure. Relationships between porosity recovery rate and effective stress during the process of raising pressure.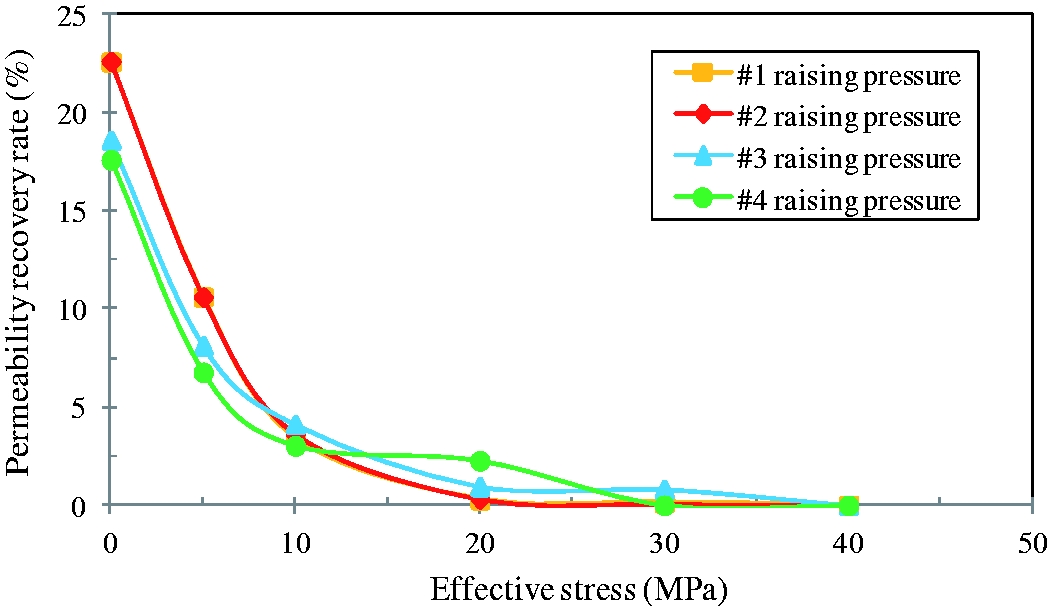
The results indicate that permeability stress sensitivity is far more than porosity stress sensitivity in the target oilfield. Permeability dropped sharply at the beginning of depressurization process, then, permeability damage rate went up slower after the effective stress reached to 20 MPa and permeability recovery rate went up faster after the effective stress declining to 20 MPa.
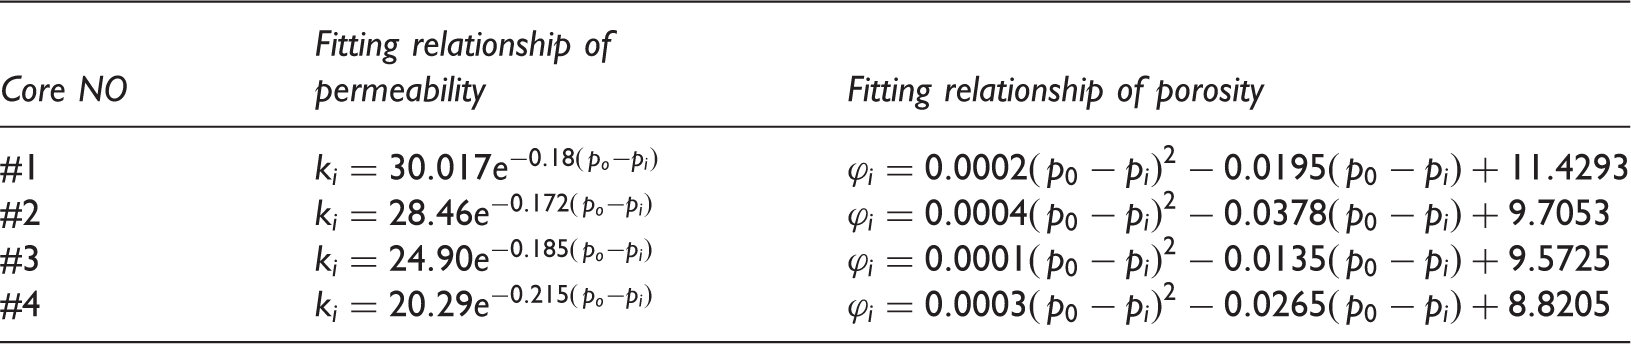
Relationship between porosity/permeability and effective stress. The process of depressurization in the experiment is similar to the development process of the oilfield. The experimental results indicate that permeability and effective stress shows index relationship while porosity and effective stress show binomial relationship. The equations are as follows.


The fitting results for permeability and porosity indicated that all the correlation coefficients for the curves were greater than 0.95, which means these equations can be used to describe permeability stress sensitivity and porosity stress sensitivity of the research oilfield. The fitting equations of stress sensitivity are shown in Table 4.
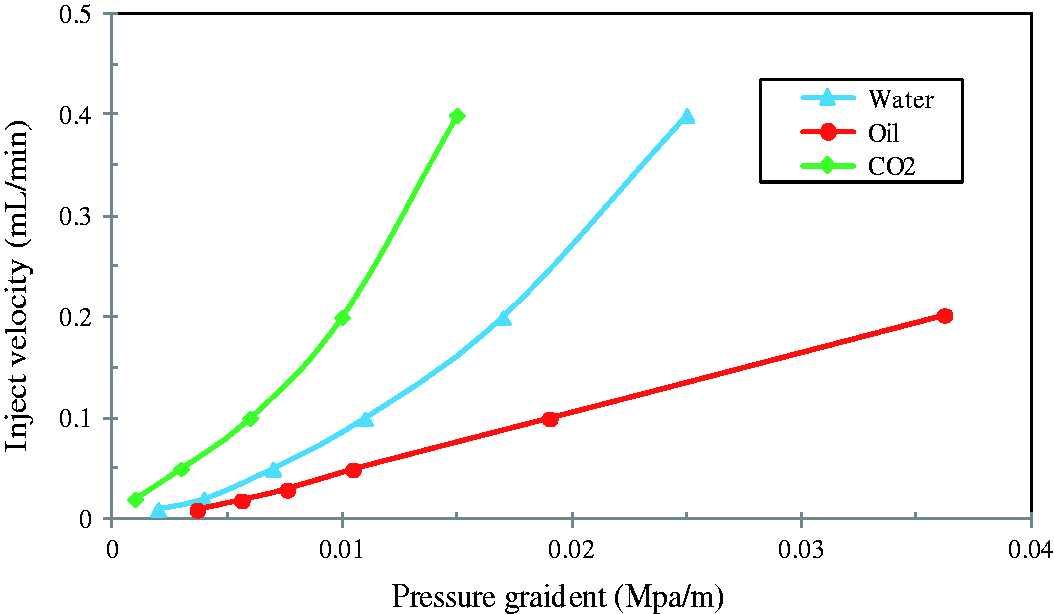
Analysis of threshold pressure gradient. Threshold pressure gradient is an important factor that affects well productivity in the development of low permeability oilfield. Figure 12 shows the percolation curves of core#5 that was obtained under conditions of different displacement medium. The value of threshold pressure gradient can be obtained by measuring the pseudo-stable displacement section of oil percolation curve and the value is about 0.002 MPa/m. Fitting relationship for cores. Percolation curve of core.
Application and discussion
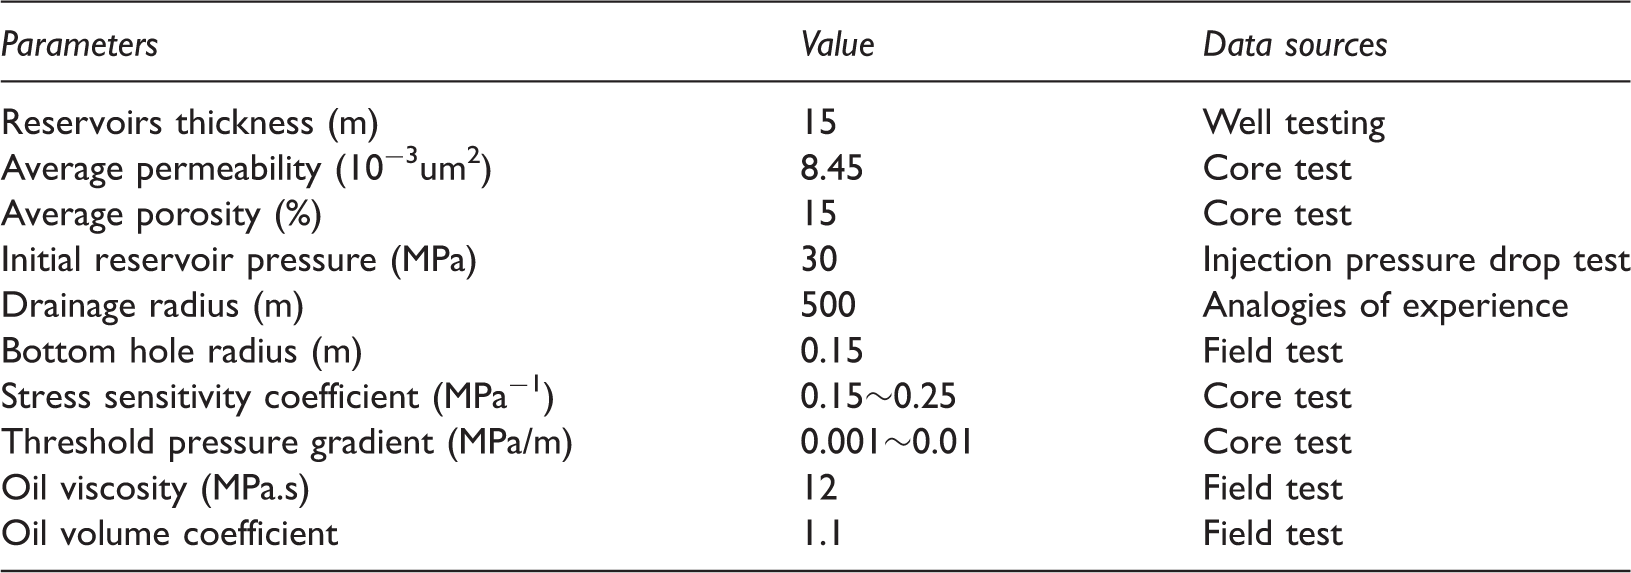
Basic parameters of the target oilfield.
Influence of stress sensitivity on permeability
Figure 13 indicates that the characteristic of permeability considering stress sensitivity are as follows: (1) The permeability distribution of reservoir shows a funnel shape during the development process of depressurization with permeability reduction near the wellbore much larger than that of the outer boundary and (2) the greater the stress sensitivity coefficient is, the larger the permeability reduction will be. Under the condition of production pressure is 10 MPa, the permeability reduction rate reaches 72.12% near the wellbore when stress sensitivity coefficient is 0.15 MPa−1. The permeability reduction rate exceeds 89.4% near the wellbore when stress sensitivity coefficient is 0.225 MPa−1, which means stress sensitivity has a significant influence on permeability.
Influence of stress sensitivity on permeability.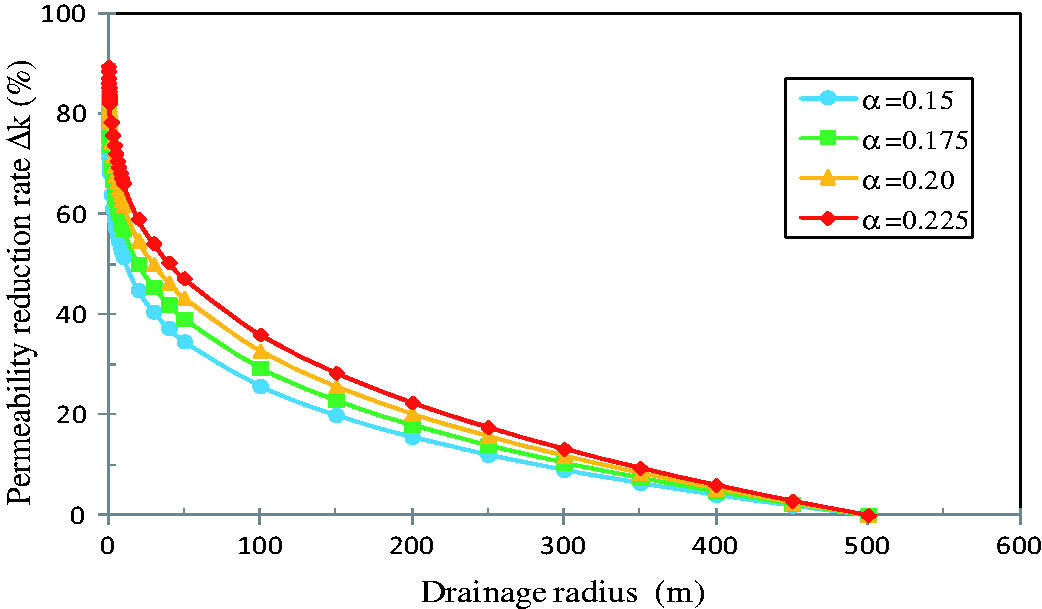
Discussion on influence factors of single well productivity
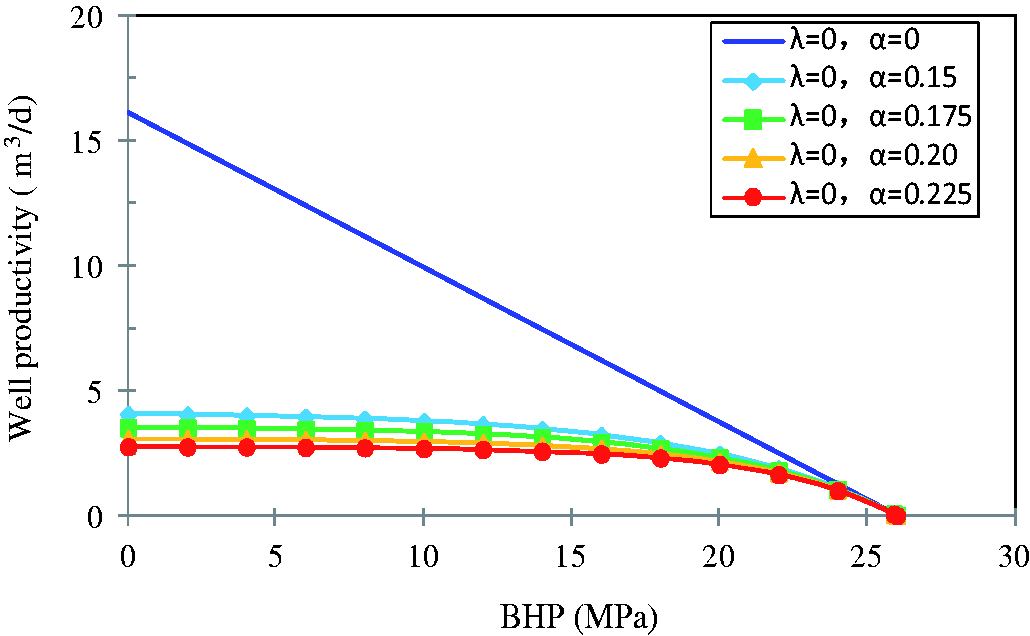
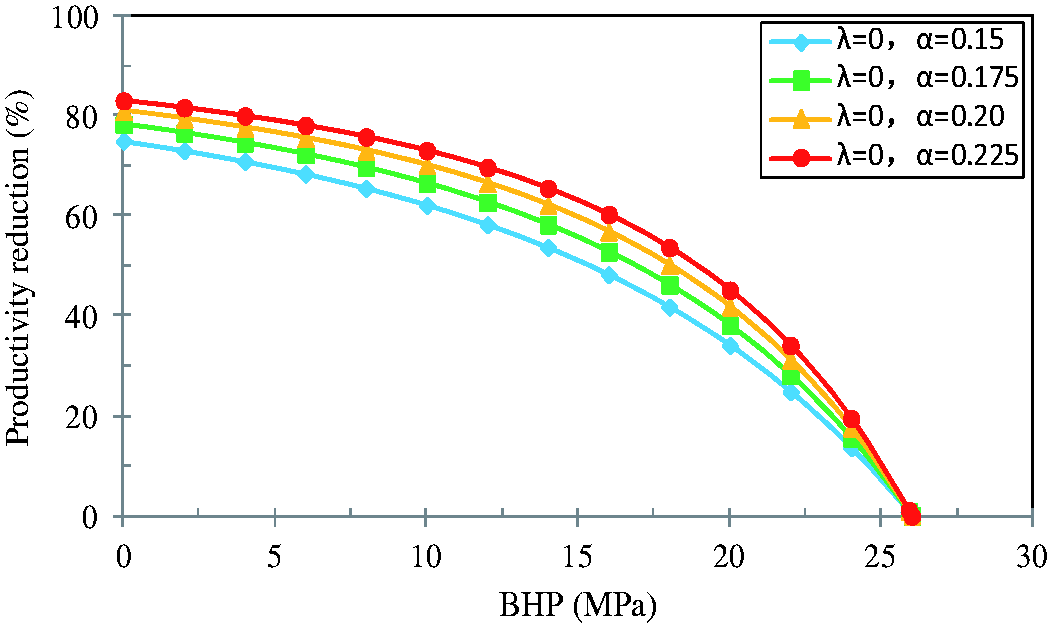
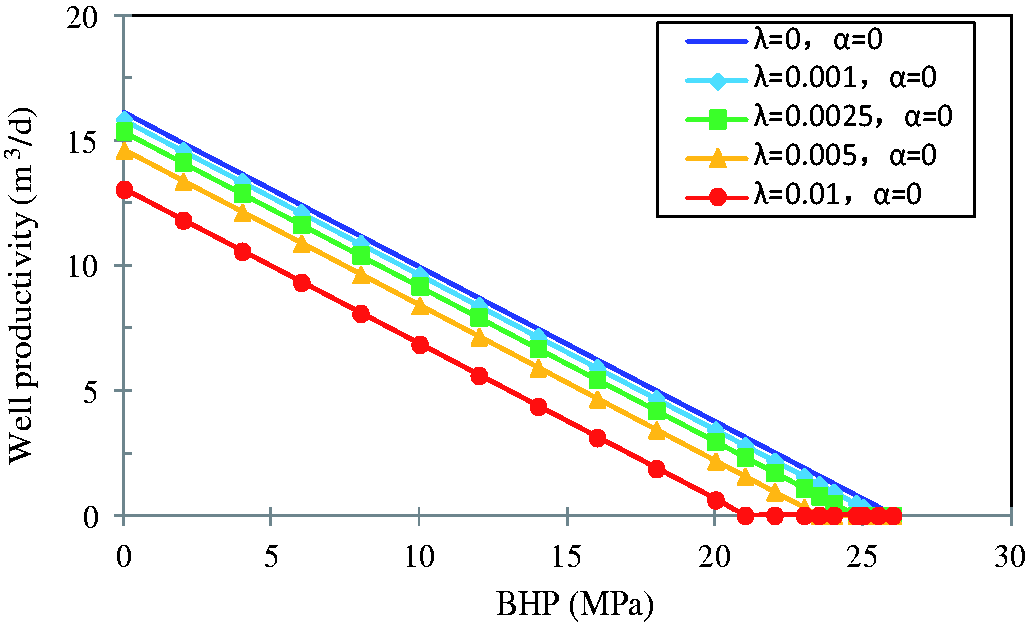
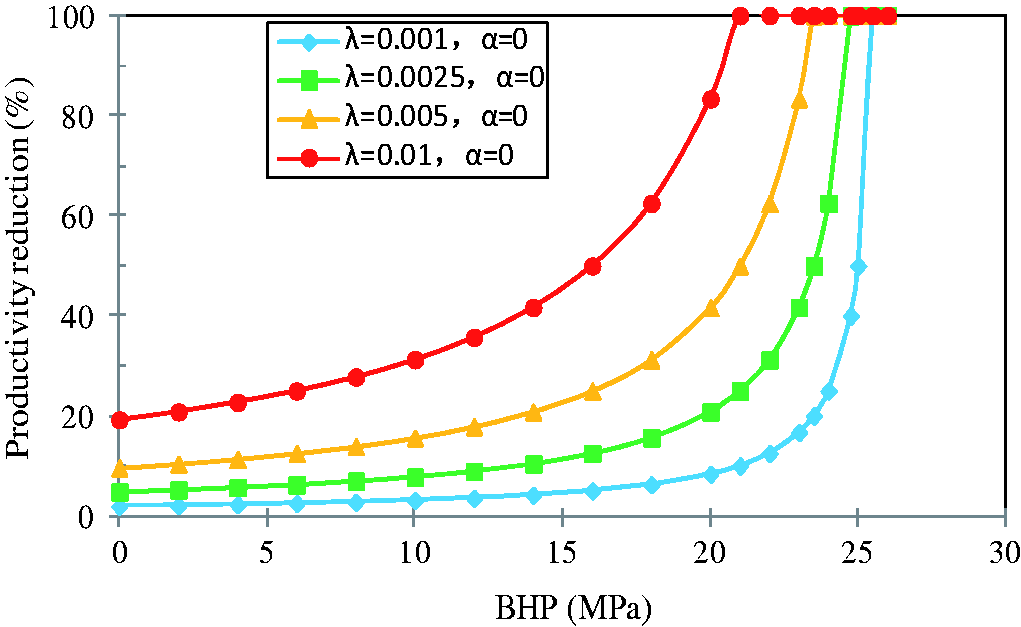
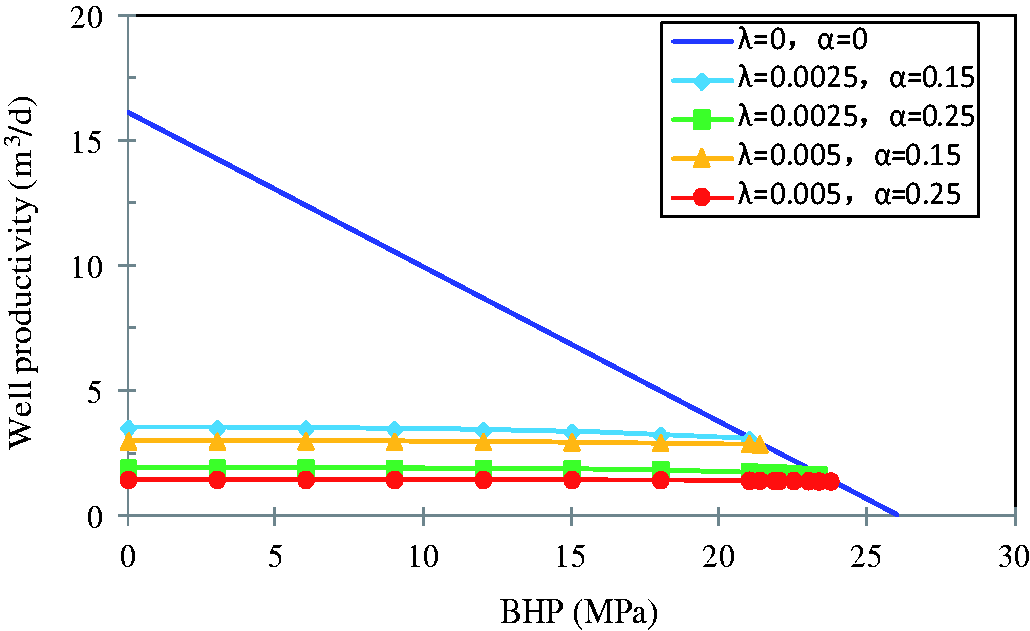
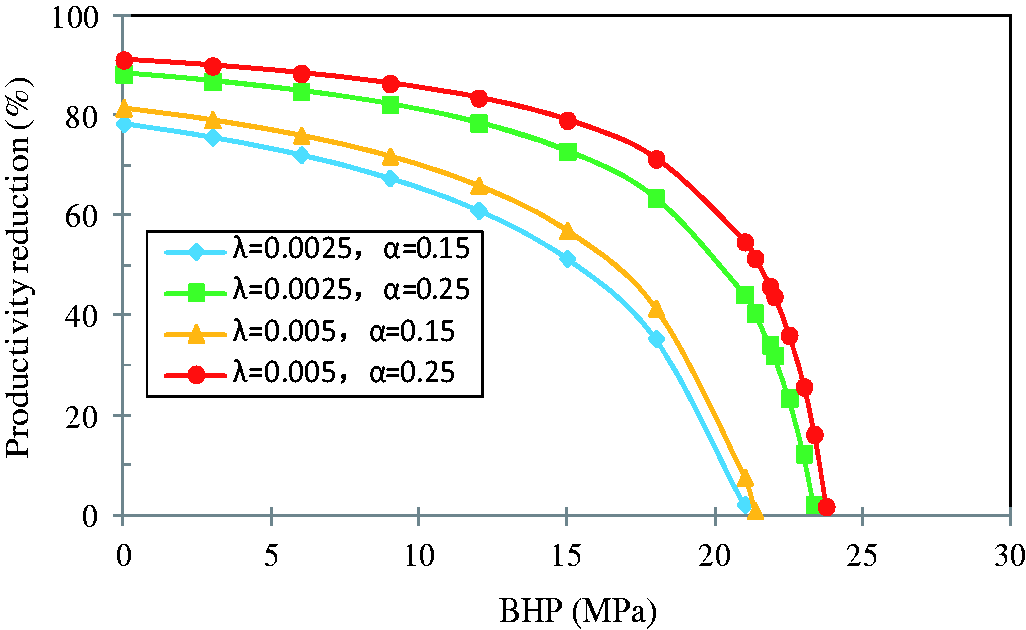
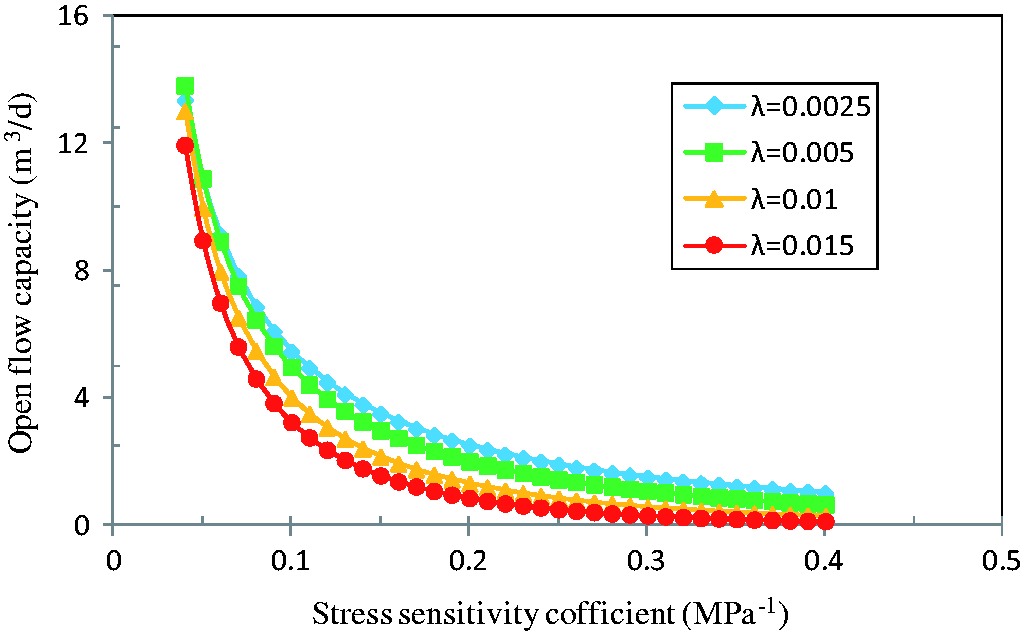
Influence of stress sensitivity on productivity. From Figure 14, it is found that stress sensitivity has great influence on well productivity. The greater the stress sensitivity coefficient is, the more serious the degree of influence of the well productivity will be. From Figure 15, the influence of stress sensitivity on productivity reduction is obtained. Under the same condition of bottom hole pressure, the greater the stress sensitivity coefficient is, the greater the productivity reduction will be. Also, the greater the bottom hole pressure is, the smaller the productivity reduction will be. Influence of threshold pressure gradient on productivity. For low-permeability reservoir, there will be no productivity unless the drawdown pressure is greater than threshold pressure. Figure 16 indicates the influence of threshold pressure gradient on well productivity. As can be seen from Figure 16, the well productivity considering threshold pressure gradient is much lower than that of not considering threshold pressure gradient. If the bottom hole pressure is great, the drawdown pressure is small, there will be no production from the oil well. The greater the threshold pressure gradient is, the lower the well productivity will be. From Figure 17, it is found that under the same condition of bottom hole pressure, the greater the threshold pressure gradient, the greater the productivity reduction will be. In addition, the smaller the bottom hole pressure is, the larger the drawdown pressure and the smaller the productivity reduction will be. Influence of stress sensitivity and threshold pressure gradient on productivity. Single well productivity will be affected more seriously when considering stress sensitivity and threshold pressure gradient simultaneously. From Figures 18 and 19, it is found that under the condition of same threshold pressure gradient, the greater the stress sensitivity is, the lower the well productivity and the greater the productivity reduction will be. Under the condition of same stress sensitivity coefficient, the lower the threshold pressure gradient, the greater the well productivity and the lower the productivity reduction will be. It is also found that the influence of stress sensitivity on the single well productivity is greater than that of threshold pressure when comparing Figure 17 with Figures 14 and 16. In addition, there is a significant influence on open flow capacity when considering stress sensitivity and threshold pressure gradient. The increase in stress sensitivity coefficient results in the reduction of open flow capacity under the same condition of threshold pressure gradient. The greater the threshold pressure gradient is, the lower the open flow capacity will be (as shown in Figure 21). Influence of flowing bottom hole pressure on productivity. Figure 22 indicates the influence of bottom hole pressure on productivity reduction considering stress sensitivity under the condition of threshold pressure gradient been 0.0025 MPa/m. the greater the bottom hole flowing pressure is, the lower the drawdown pressure and the smaller the productivity reduction will be. Under the same condition of bottom hole flowing pressure, the greater the stress sensitivity coefficient is, the greater the productivity reduction will be.
Influence of stress sensitivity on well productivity. Influence of stress sensitivity on productivity reduction. Influence of threshold pressure gradient on well productivity. Influence of threshold pressure gradient on productivity reduction. Influence of stress sensitivity and threshold pressure gradient on well productivity. Influence of stress sensitivity and threshold pressure gradient on productivity reduction. Influence of stress sensitivity and threshold pressure gradient on open flow capacity. Influence of BHP on productivity reduction considering stress sensitivity and threshold pressure gradient.
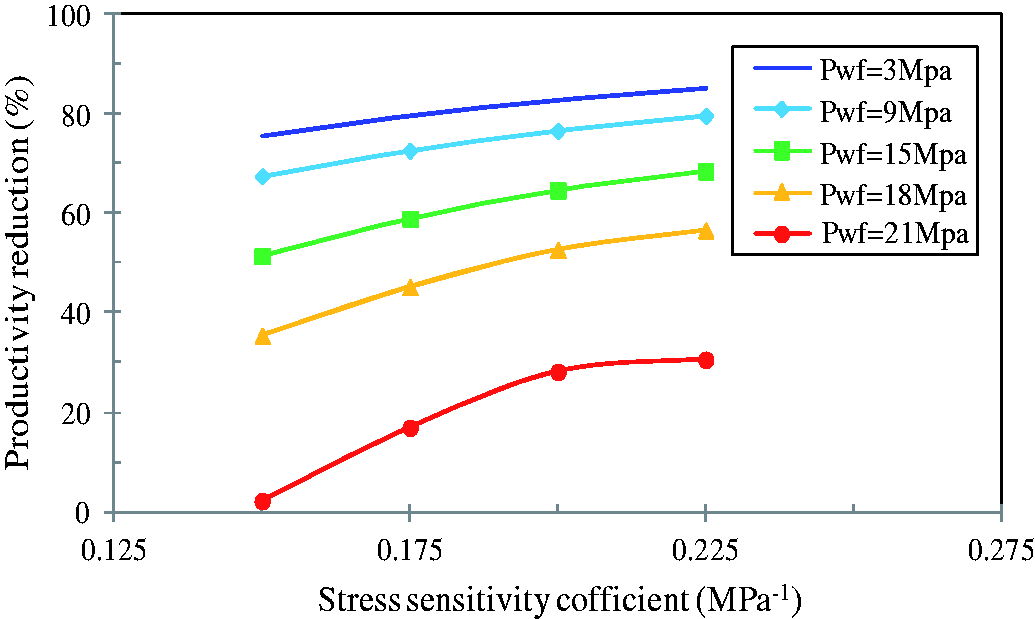
Bottom hole flowing pressure is the key factor to control the well productivity during the development process of oilfield. As already known, the greater the bottom hole flowing pressure, the lower the drawdown pressure and the smaller the productivity reduction will be. However, on one hand, there may be no productivity if the drawdown pressure is less than threshold pressure when considering stress sensitivity and threshold pressure gradient. On the other hand, high drawdown pressure may bring serious stress sensitivity, which results in serious reduction of permeability and oil productivity. Therefore, in order to ensure a reasonable productivity of wells, reasonable bottom hole flowing pressure must be decided to decline the reservoir damage of stress sensitivity and threshold pressure gradient. The reasonable bottom hole flowing pressure can be obtained by numerical simulation method.
Conclusions
Microscopic capillary model considering complex connectivity, tortuosity, and coordination number of pores was used to analyze the influence of stress on permeability and porosity. The reason why permeability stress sensitivity is far greater than porosity stress sensitivity during the development process of depressurization was elaborated. The stress sensitivity evaluation results indicate that permeability and effective stress shows index relationship whiles porosity and effective stress shows binomial relationship during the depressurization process. It also indicates that, the lower the permeability, the stronger the permeability stress sensitivity will be. Damage rate and recovery rate of permeability and porosity were put forward to describe the degree of influence of stress sensitivity and the impact of the effective stress on the permeability of the reservoir were finally revealed. The productivity model and productivity evaluation model for the influencing factors of the production of well considering the stress sensitivity and threshold pressure gradient were deduced based on stress sensitivity experiments and non-Darcy percolation test. The models were used to study the influencing factors that affect single well productivity for the target oilfield. The results indicate that, the permeability distribution of reservoir shows a funnel shape during the development process. Hence, the permeability reduction near the wellbore is much larger than that of outer boundary. Stress sensitivity and threshold pressure gradient should be considered during the development process, and the greater the stress sensitivity and the threshold pressure gradient are, the greater the productivity reduction will be. In addition, the influence of stress sensitivity on the single well productivity is greater than that of threshold pressure.
Footnotes
Acknowledgment
We would like to thank all editors and anonymous reviewers for their comments and suggestions.
Declaration of conflicting interests
The author(s) declared no potential conflicts of interest with respect to the research, authorship, and/or publication of this article.
Funding
The author(s) disclosed receipt of the following financial support for the research, authorship, and/or publication of this article: Parts of this work were supported by the Fundamental Research Funds for the Central Universities (2652016119, 2652015142), National Science and Technology Major Projects (2016ZX05011–002).