
Abstract
The purpose of this paper is to probe into the nature and variability in vertical microstructure within Longmaxi gas shales of well WX2, Lower Silurian, located in the NE Sichuan Basin of China. To understand the pore system of these rocks, the total porosity, pore size distribution (PSD), surface area, organic geochemistry, and mineralogy, some image analyses by electron microscopy are performed. The obtained results indicated the following. (1) Gas shales have a complex pore structure. Total porosity from helium pycnometry ranges between 0.75% and 4.62%. Total organic content ranges between 3.4 wt.% and 11 wt.%, and vitrinite reflectance measured between 2.5% and 3.1%. The gas shales are quartz and clay rich. (2) Focused ion beam milling and field emission scanning electron microscopy provide high-resolution images of pores distribution and types. Three primary types of pores, organic matter (OM)-hosted pores, mineral-hosted pores, and micro-fractures, and 11 subgroups have been recognized. (3) The N2 isotherm curves are grouped into two types, II b as well as IV a, with the hysteresis loop belonging to Type B, reflecting the morphology of slits pores, and Type A, presenting cylinder pores. Combination of N2 and CO2 isotherm curve shows bimodal in two diameter sections, 0.3–1 nm and 2–5 nm, revealing meso-pores play important role in pore volume, whereas the micro-pores have great influence on pore specific surface area. (4) Total organic carbon (TOC) is considered to be the dominant contributor to total porosity and pore types, with the proportion of OM-hosted pores following the upward decreasing tendency of TOC. In plane, pore types are controlled by sedimentary facies. The OM-hosted pores are more prevalent in deep shelf facies within lower part of shale other than upper formation, instead of shallow shelf facies.
Introduction
The successful commercial exploitation of shale gas in the U.S., has garnered significant attention and focus of the countries in the world, particularly China. Risked shale gas in-place resources for China is estimated at 4746Tcf, and technically recoverable resources is 1115Tcf, in Sichuan Basin of 626 Tcf (EIA, 2015). Shale gas leasing and exploration drilling are already underway in China, mainly on the Longmaxi Shale, in Sichuan Basin and Upper Yangtze Platform areas. The government has set an ambitious target for shale gas production of 5.8-9.7 Bcf by 2020 (Li et al. 2016; Zou et al. 2016). The successful development in Fuling Shale Gas Field is led by Sinopec, with production reaching 3 × 10⁹ m3 in 2015 (Zou et al. 2016), indicating a new stage is dawning.
WX2 has been recently drilled by Research Institute of Petroleum Exploration and Exploitation-Langfang, CNPC, in the northeastern Chongqing and high gas content(2-8m3/t) has been obtained (Liang et al. 2016). This breakthrough has made lower Silurian Longmaxi shale in northeastern Sichuan Basin a focus of attention and it is regarded as the next exploration target in addition to the hot spots of shale gas development in southern Sichuan Basin. Previous studies focus on the sedimentary environments, large thickness and organic richness of this area. However, these studies were based on outcrops. Due to weathering, dissolution and erosion, the outcrops cannot truly reflect the shale reservoir properties. By studying the fresh cores from well WX2, this paper intends to shed light on the Longmaxi shale microstructure of NE Sichuan Basin, giving implications of controlling on amount of gas in place.
Important to shale gas storage and migration, the nanometer-size pores popularity of Longmaxi Formation (LMF) in Sichuan Basin have been well identified. Although previous extensive efforts on the gas shale pore properties have been well documented and discussed, direct vertical comparisons of pores traits within shale up and down is relatively limited. Knowledge concerning the controls on pore distribution, size and morphology remains poor. Vertical complex heterogeneous pore properties found in the Longmaxi shale are described in this article by using multiple experimental methods so as to ascertain their potential controlling factors of gas capacities.
Pore structure is characterized by size, volume, surface area, shape, connectivity, and spatial distribution. Mudrock’s porous properties have been studied mainly through direct high resolution imaging techniques such as scanning electron microscopy SEM(Curtis et al. 2012; Pommer et al. 2015), or alternatively, bulk characterization techniques such as gas adsorption, mercury intrusion, or small-angle neuron scattering (Löhr et al. 2015; Mastalerz et al. 2012). Electrical images techniques reveal pore types, shapes and radium by high resolution observing, without information of average pore diameter, specific surface area distribution, and pores size less than 5 nm (Curtis et al. 2012; Slatt et al. 2011; Wang et al. 2009). An advantage of the bulk pore characterization techniques is that they reveal the presence of pore types, shapes, radium, interactions and configuration by providing quantitative assessments of pore volumes, specific surface area, and pore size distribution calculated by BET, BJH, HK and DFT equations from adsorption volume (Gregg et al. 1982; Labani et al. 2013). Among them, low pressure gas isotherm techniques have been widely used for broad testing radium (0.35–400 nm), with easier operation and high economy. As discussed by Bustin (2008), CO2 adsorption at 0℃ can be used to investigate micropore volume and N2 adsorption at −196℃ can be used to investigate pore volume in the larger micropore to macropore range, demonstrating a wide range in adsorption for all samples. However, bulk characterization techniques cannot distinguish organic matter hosted pores from intra or interparticle poreshosted with mineral, this requires high resolution imaging. Besides, before criteria for nanopore diameter are clearly defined, we prefer to use the pore-size terminology of International Union of Pure and Applied Chemistry (IUPAC,1994): micropores (<2 nm), mesopores (2–50 nm), and macropores (>50 nm).
In this paper, pore networks are analyzed by both quantitative and visual qualitative methods of shale gas reservoir in NE Chongqing. Qualitative analysis is based on FE-SEM imaging technique to define the pore types in shale system. Meanwhile, quantitative analysis is completed to detect pore volume, surface area, and pore-size distribution by using low pressure N2 and CO2 isotherm analyses. Moreover, the surface fractural dimensions are calculated from nitrogen adsorption data, and interpreted to quantitatively characterize the complexity and heterogeneity of pore structure and surface. Ultimately, the potential controlling factors of pore structure are also illustrated. These data of subsurface samples will facilitate understanding of microstructure of over-mature shale reservoirs and will be of reference value to future exploration of NE Sichuan Basin.
Geological setting
Sichuan Basin is located on the northwestern Yangtze Plate (Figure 1a), and is the remnant of Originally Lower Paleozoic Upper Yangtzecratonic basin (Liang et al. 2014; Zou et al. 2015). Gas shale of the target member is mainly situated in Wufeng-Longmaxi Formations (W-F), in Late Ordovician and Early Silurian (447–438 Ma). Yangtze Craton saw a widespread regression in the Late Ordovician due to glaciations, and a global-scale transgression in the Early Silurian, providing favorable conditions for organic matter preservation to form Longmaxi shale. Depositional centers are located in the southern and eastern parts of Sichuan Basin, with a thickness of strata varying from several meters to more than 100 meters, and deposited in muddy deep shelf marine subfacies in NE Sichuan Basin. Black shale, carboniferous shale and black siliceous shale sets are the main lithofacies of W-F Formations.
Location of Longmaxi Formation Well WX2 in NE Sichuan Basin in this study. Percentage of minerals obtained from the XRD analysis of the core samples taken from different intervals of Well WX2.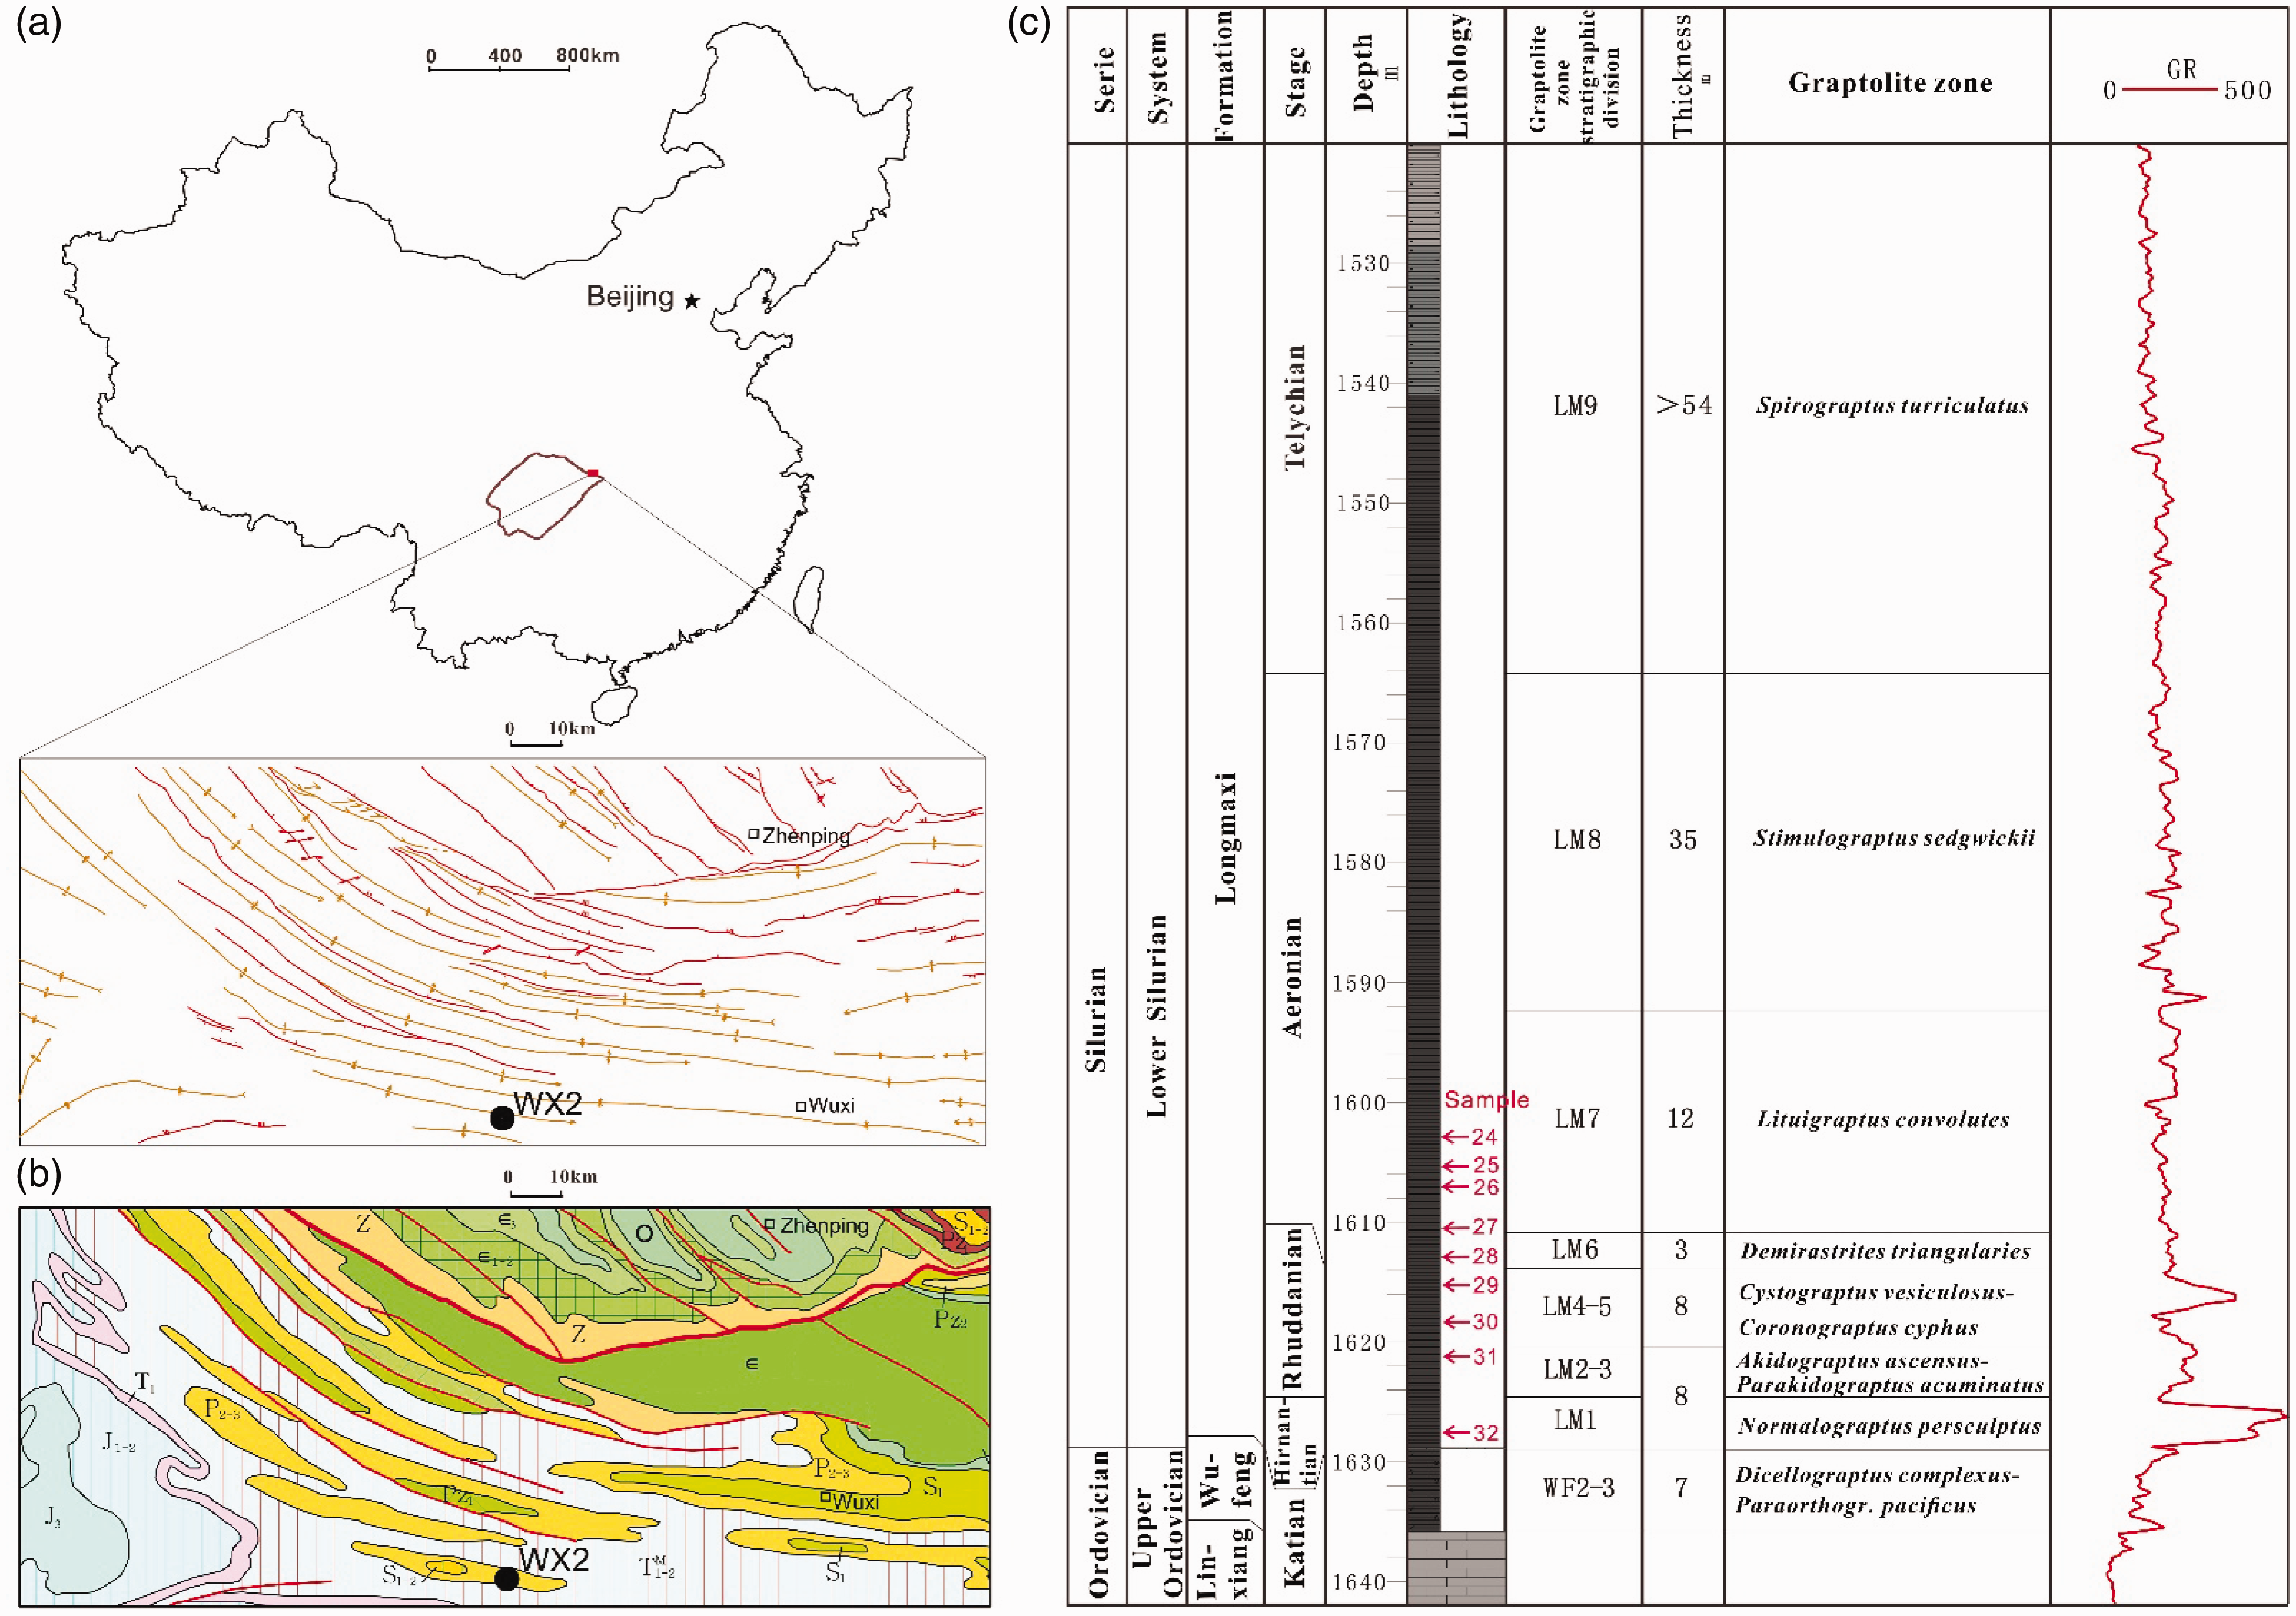
The drilling site of WX2 is situated in Qilongxue Village, Chaoyang Town, Wuxi County, at 1081 meters above the sea level. The drilling and coring operation in the well was fully automated with core recovery at 90%, and all the cores were stored in RIPED-LF. Figure 1 shows detailed well WX2 location and an outline of the structure of the NE Sichuan Basin. The well located on the NE margin of the Sichuan Basin, southern Dabashan arc fold belt, northern Tianba anticline. Emergence stratum is of Upper Permian, its thickness for W-F shale is proximately 105 m, dip angle of 10°–15°, and no obvious faults on the ground.
The main lithofacies of the Ordovician-Silurian shales at well WX2 span five stages and thirteen graptolite zones upwards, late-mid Katian (Paraorthograptus pacificus), Hirnantian (Normalograptus extraordinarius- N.ojsuensis and Normalograptus persculptus), Rhuddanian (Akidograptus ascensus, Parakidograptus acuminatus, Cystograptus vesiculosus and Coronograptus cyphus), Aeronian (Demirastrites triangularis, Lituigraptus convolutes and Stimulograptus sedgwickii) and early Telychian (Spirograptus turriculatus), full graptolite zones.
Samples and methods
Samples
A suite of Longmaxi Formation shale of lower Siluran from well WX2, Chongqing, NE Sichuan Basin, were chosen for this study owing to their vertical variability of (1) Total organic carbon (TOC) contents; (2)inorganic composition and (3) thermal maturity-attributes which ultimately control the gas storage potential of unconventional gas reservoirs.
Nine samples were taken from diverse intervals of organic-rich Longmaxi Formation, drilling cores of well WX2, Hirnantian stage to Aeronian stage (Normalograptus persculptus -Lituigraptus convolutes), corresponding symbols of graptolite zones are LM1-LM7 following subdivision of the Ordovican-Silurian graptolite biozones (Chen et al. 2015), buried at 1602.99 m-1627.5 m. Sample location and distribution are summarized in Figure 1-c.
Methods
All the experiments were done in the Key Lab of Unconventional Oil and Gas, Research Institute of Petroleum Exploration and Exploitation-Langfang, CNPC. Prior to these experiments, relevant tests and performance analyses were conducted, such as X-ray diffraction, organic geochemistry, porosity and gas content.
X-ray diffraction and geochemical analysis
To investigate the effect of inorganic matter upon shale pore gas-bearing, X-ray diffraction (XRD) was performed to determine inorganic minerals of shale in an instrument of Riga TTR3. The rock samples were crushed and milled to a 200-mesh power and were continuously scanned at an accelerating voltage of 40KV, a current of 30 mA, with scanning speed of 2°/min at 0.02° increments, half-qualified analyzing compositions by Jade 6.0.
Subsamples were crushed, milled to a fine power (<250 µm), and analyzed for bulk rock properties including TOC and porosity. Organic carbon content was measured using a Leco carbon-sulfer analyzer, after samples treated by hydrochloric acid to remove the carbonates. Samples for organic petrography were prepared as standard polished block, and macerals examined with an Axioskop 2 plus biological microscope to identify the kerogen type. The absence of the maceral vitrinite in LMF does not permit the use of the vitrinite reflectance index (Ro) for estimations of thermal maturation. Instead, bitumen reflectance measurements were carried out on polished block using a MPV-SP microscope photometer. Bitumen reflectance (RB) was then converted to equivalent Ro using the equation of Jacob (1989), Ro = 0.618RB + 0.40. Total and adsorption gas contents were determined from canister desorption data, a most commonly used direct method. Shale porosities were measured with helium method, instrument of PDP-200.
Ar iron beam polishing-SEM
Until the combination of SEM and Ar-ion-beam milling by Loucks et al. (2009), the nanometer-sized organic-matter pores can be clearly observed. Microtextural imaging was performed using FEI Quanta 200F, field emission scanning electron microscopy, resolution of 1.2 nm, amplification of 25-200000, accelerating voltage of 100–30000 V. Nine samples perpendicular to bedding were prepared and polished to obtain a surface free of mechanical damage by argon ion beam polishing are scanned at an accelerating voltage of 20kv, and all the samples were coated with a layer of carbon to provide a conductive surface layer.
Lower pressure gas isotherm analyses
Lower pressure CO2 and N2 isotherms (<0.127 MPa) were used to describe the pore space of organic-rich, microporous materials as average pore size distributions are in the nanometer scale, into which gases can effectively penetrate.
Carbon dioxide analyses were performed using Nova 4200e surface area analyzer to investigate micropores (<2 nm diameter). Calculated over a pressure rang of 4 × 10⁻⁴ ∼ 3.2 × 10⁻² at 0℃ for the main pore size of 0.3-1.47 nm due to fast balance, strong energy, and high testing temperature for lower CO2 molecular kinetic under low temperature, required degassing for 12 hours at 70℃prior to operation. Data was also reported as equivalent surface area (m2/g), pore volume, average DFT pore size, and could be compared with N2.
N2 adsorption analyses were performed using Thermo SURFER surface area analyzer to investigate mesopores (2–50 nm diameter) and macropores (>50 nm diameter). Crushed samples of 5–10 g (0.8 and 2 g), <40-meshwere air dried and degassed under vacuum at 120℃ for 5 hrs, and performed at −196℃ for pressure at 0.127 Mpa.
Results and discussion
Now we firstly clarify the pore structure of LMF shale and then consider the boarder implications of the CH4 storage. CO2, N2 and SEM analyses are described separately since the accessibility of pores in microporous materials is dependent upon the molecular size of the fluid-hence different fluids that measure different surface areas (Rouquerol et al. 1999). Ultimately, understanding the controls of CH4 storage is needed because such analyses determine the degree of gas saturation of shale gas reservoir.
Mineralogy and organic petrography
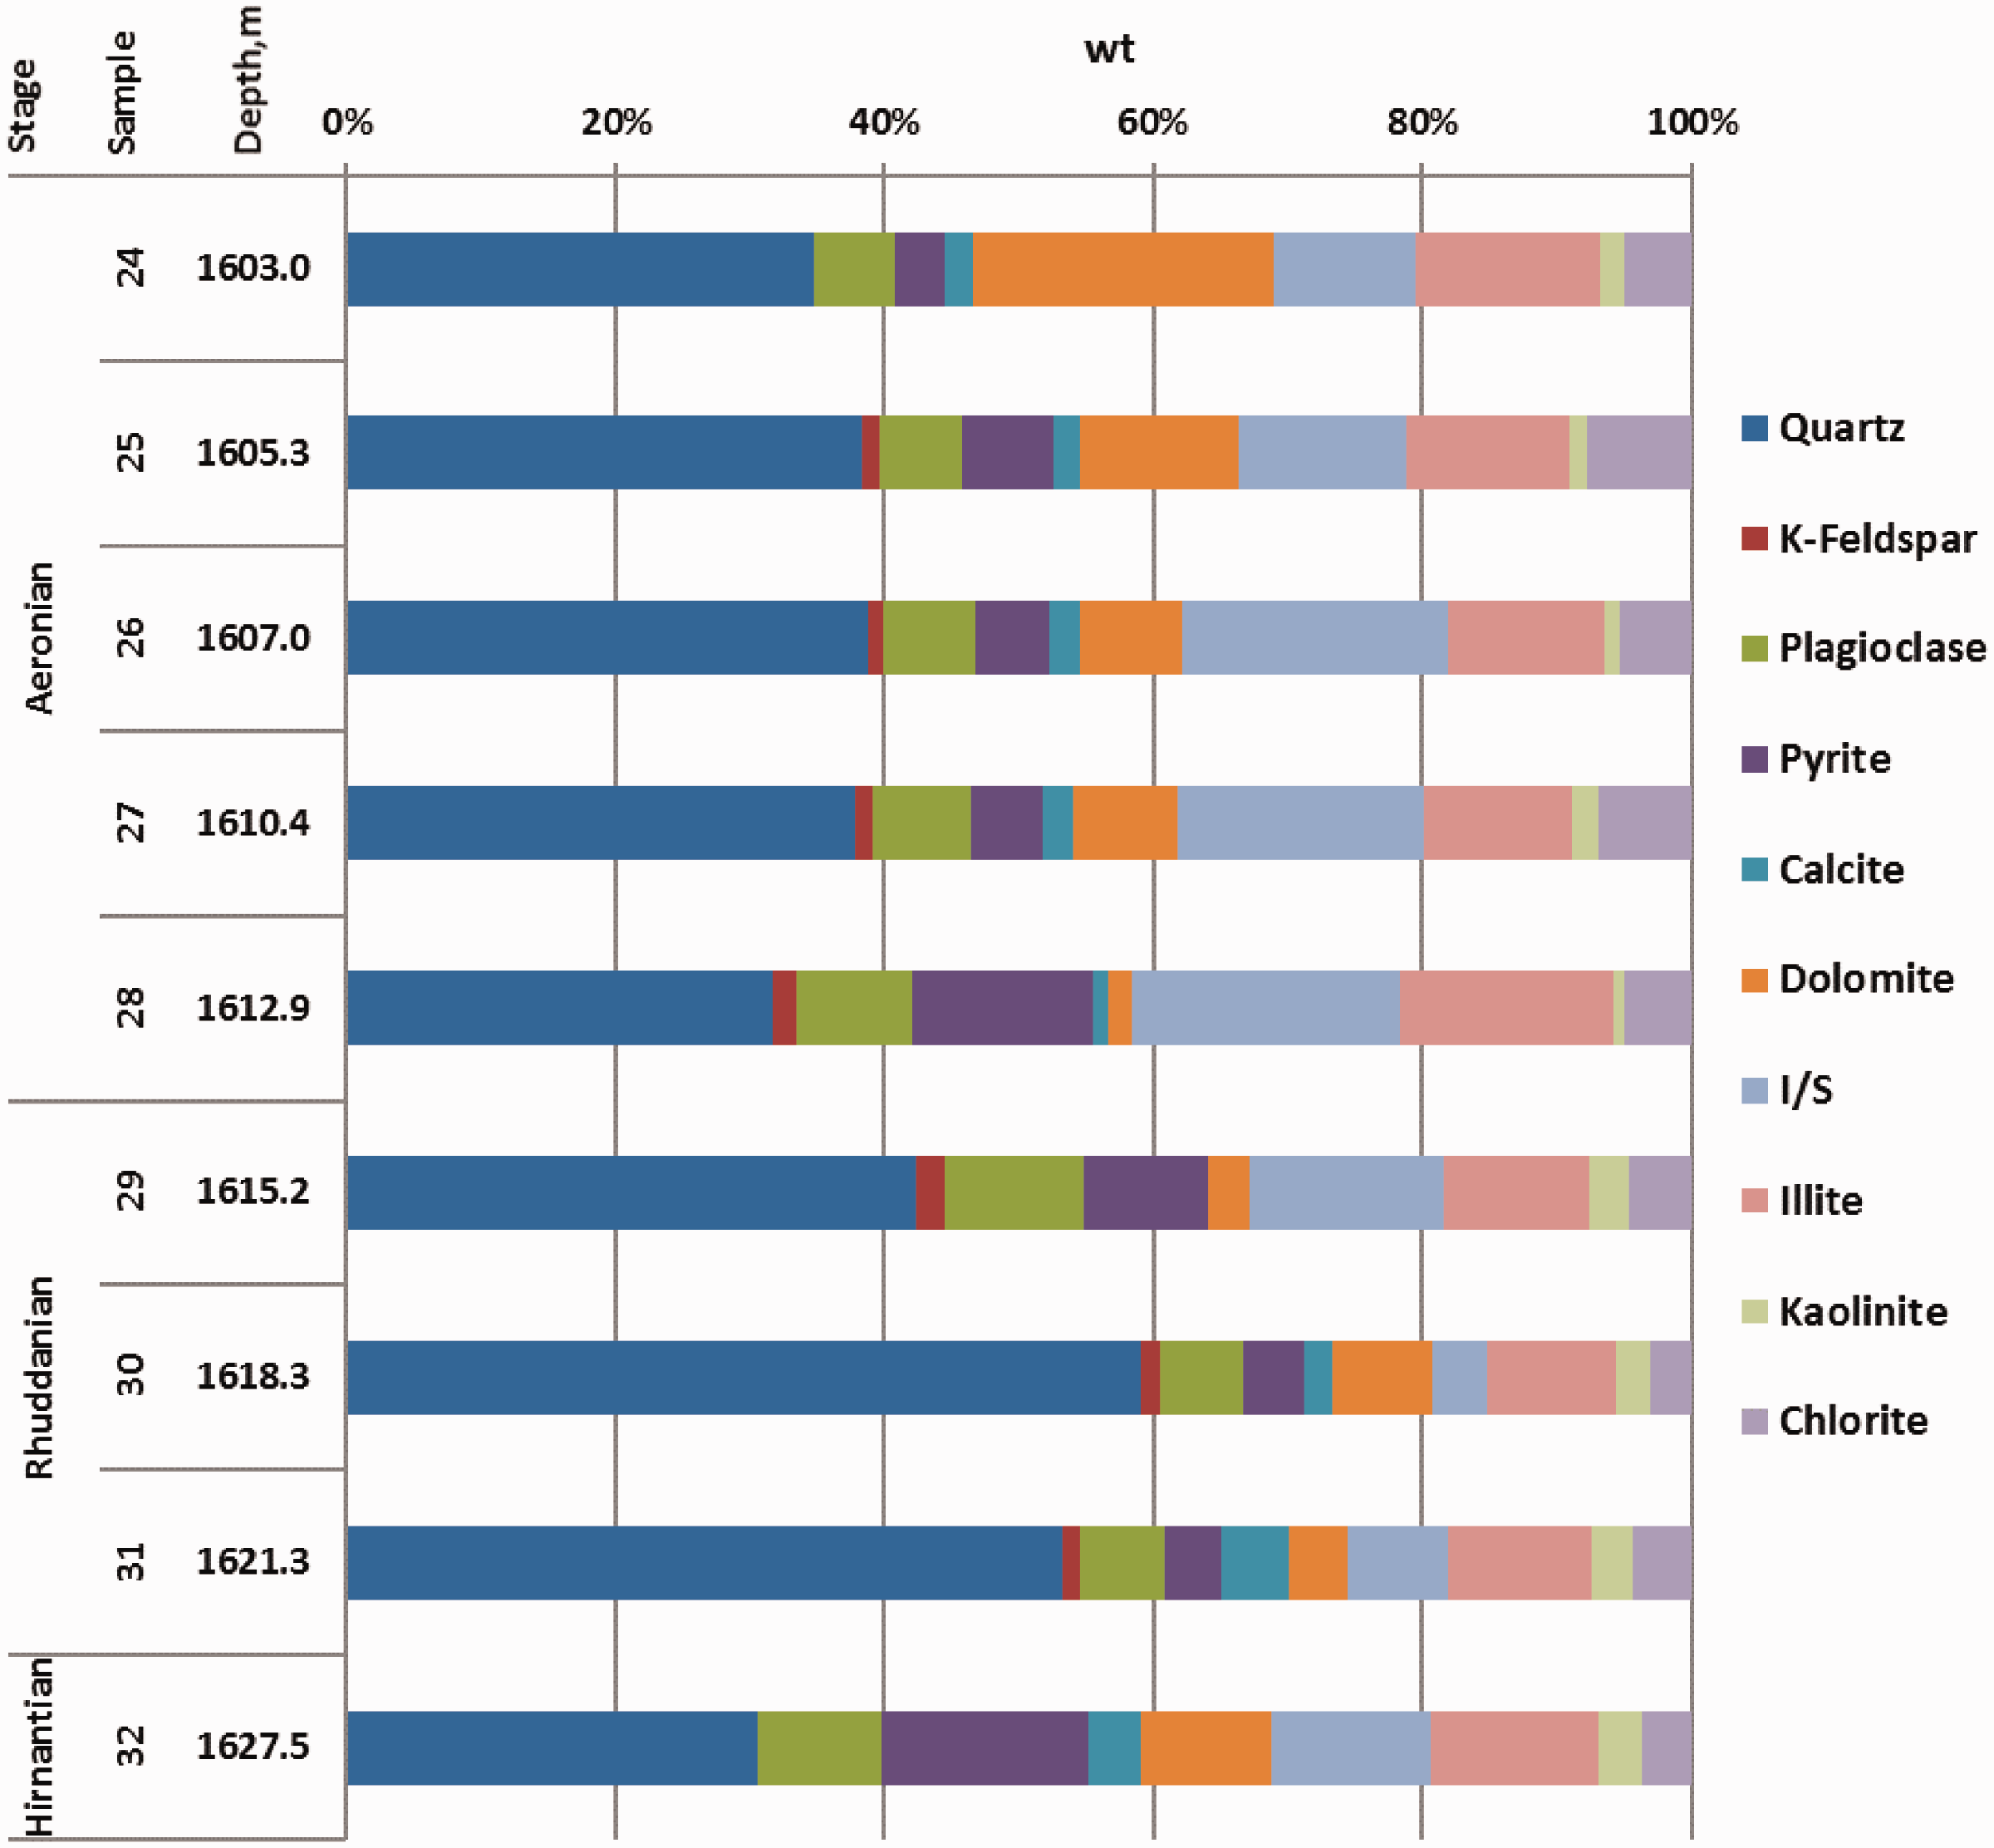
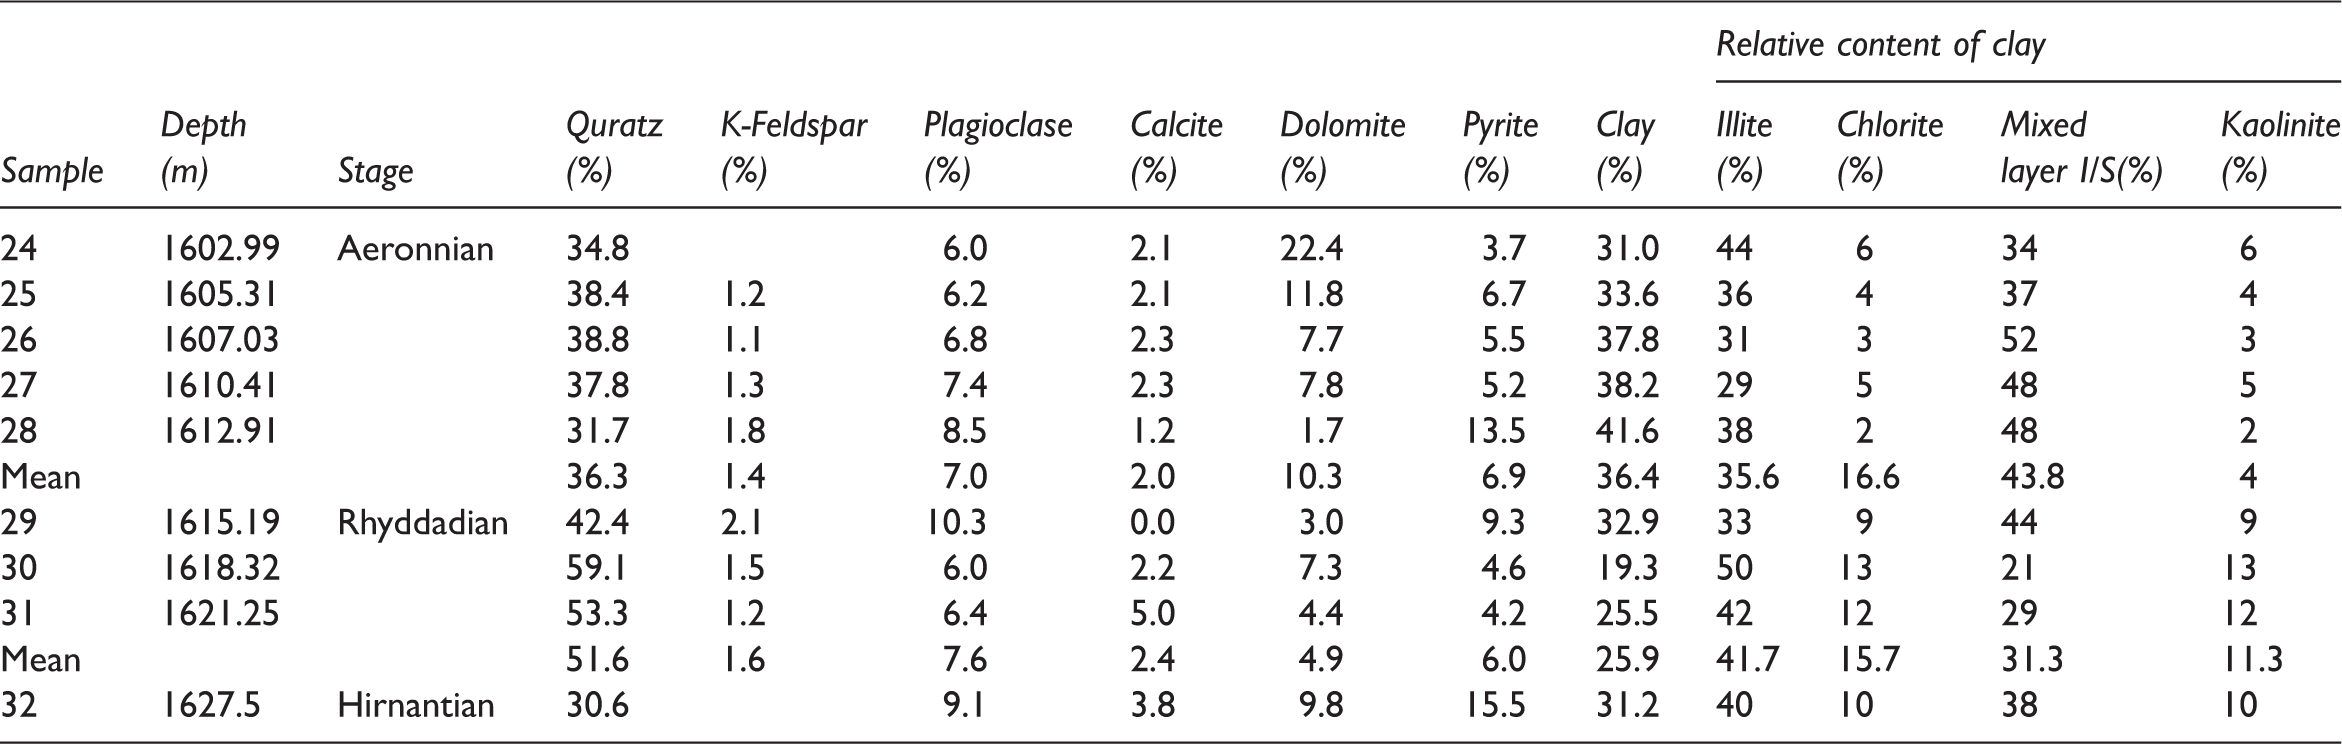
Mineral content in Longmaxi shale samples with XRD of well WX2.
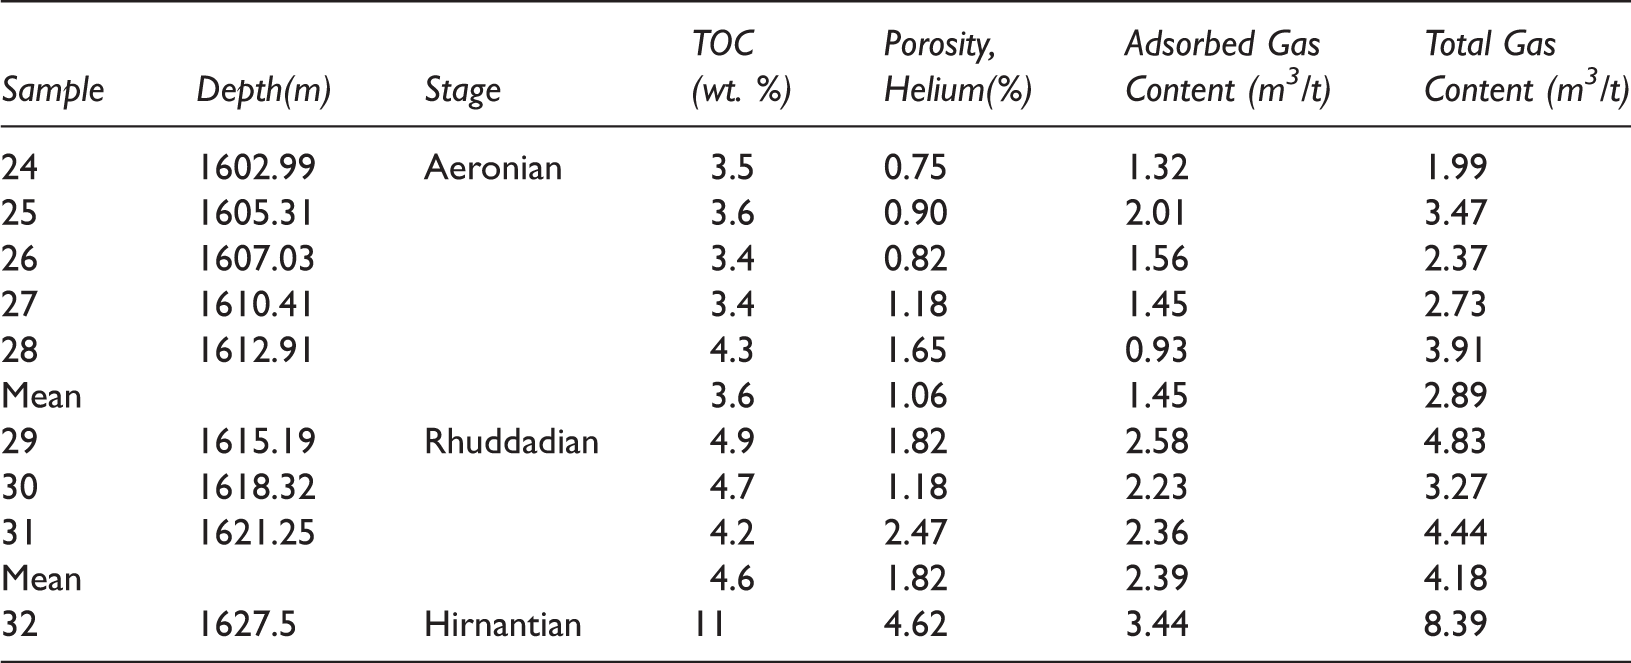
TOC, He porosity, adsorbed gas, total gas content results for shale samples.
A significant varying amount of carbonate contents (calcite + dolomite) is also recorded in the formation with a range of 2.9% to 24.5% (average10.8%). Clay mineral contents interpret a diagenetic stage experienced of shale, corresponding to a mature or highly mature evolutionary stage of hydrocarbons. Mixed layer I/S and illite are identified as the dominant clay minerals, totaling 71% and 86%, mean value of 39% and 38%, respectively. Chlorite, however, displays the lower content with average at 15.8%, and the abundance of smectite is the lowest with a mean value of 7.1%.
This mineralogical report reveals that in the Rhuddanian stage, the low part of shale mainly consists of a relatively high quartz (average 53.3%) but a low content of clay (average 25.9%). It is also found that the percentage of quartz increases towards the lower part of formation (Rhuddanian Stage) while clay is higher in the upper part (Aeronian Stage) with an average of 36.4%. The presence of carbonate is higher both in the Aeronian Stage and the Hirnantian Stage, with a mean value of 12.3% and 13.6%, respectively, showing shallow water in these two periods, whereas a mean value of 7.3% in Rhuddanian period is found with a relatively deep water.
Table 2 illustrates TOC of LMF spaning from 3.4% to 11% with a mean value of 4.8%, indicating organic-rich shale, found to be higher at greater depths, reaching the highest value at 11%, in the lowest Hirnantian stage. Graptolite group as well as sapropelitic group dominate organic macerals, showing kerogen type of II1. The shale core samples are highly over-matured with an equivalent vitrinite reflectance (EqVRo) between 2.5 and 3.1%, and Tmax ranging between 370–541℃. The total gas content and adsorbed gas content are obtained proximately between 1.99-8.39m3/t and 0.93-3.44m3/t, respectively. Helium porosity covers from 0.75% to 4.62%. The basic sample informations including sample depth, total organic carbon contents and helium porosity are listed in Table 2. Figure 3 presents the relationship between TOC content and other parameters. It seems that correlations between clay, quartz, carbonate and TOC are weaker in these high-maturity samples, except pyrite (Figure 3-a). However, TOC displays a positive correlation with total gas content, adsorbed gas content, and helium porosity (Figure 3-b). Figure 4 indicates the kerogen of Type II 1 with large amounts of graptolites containing abundant pores.
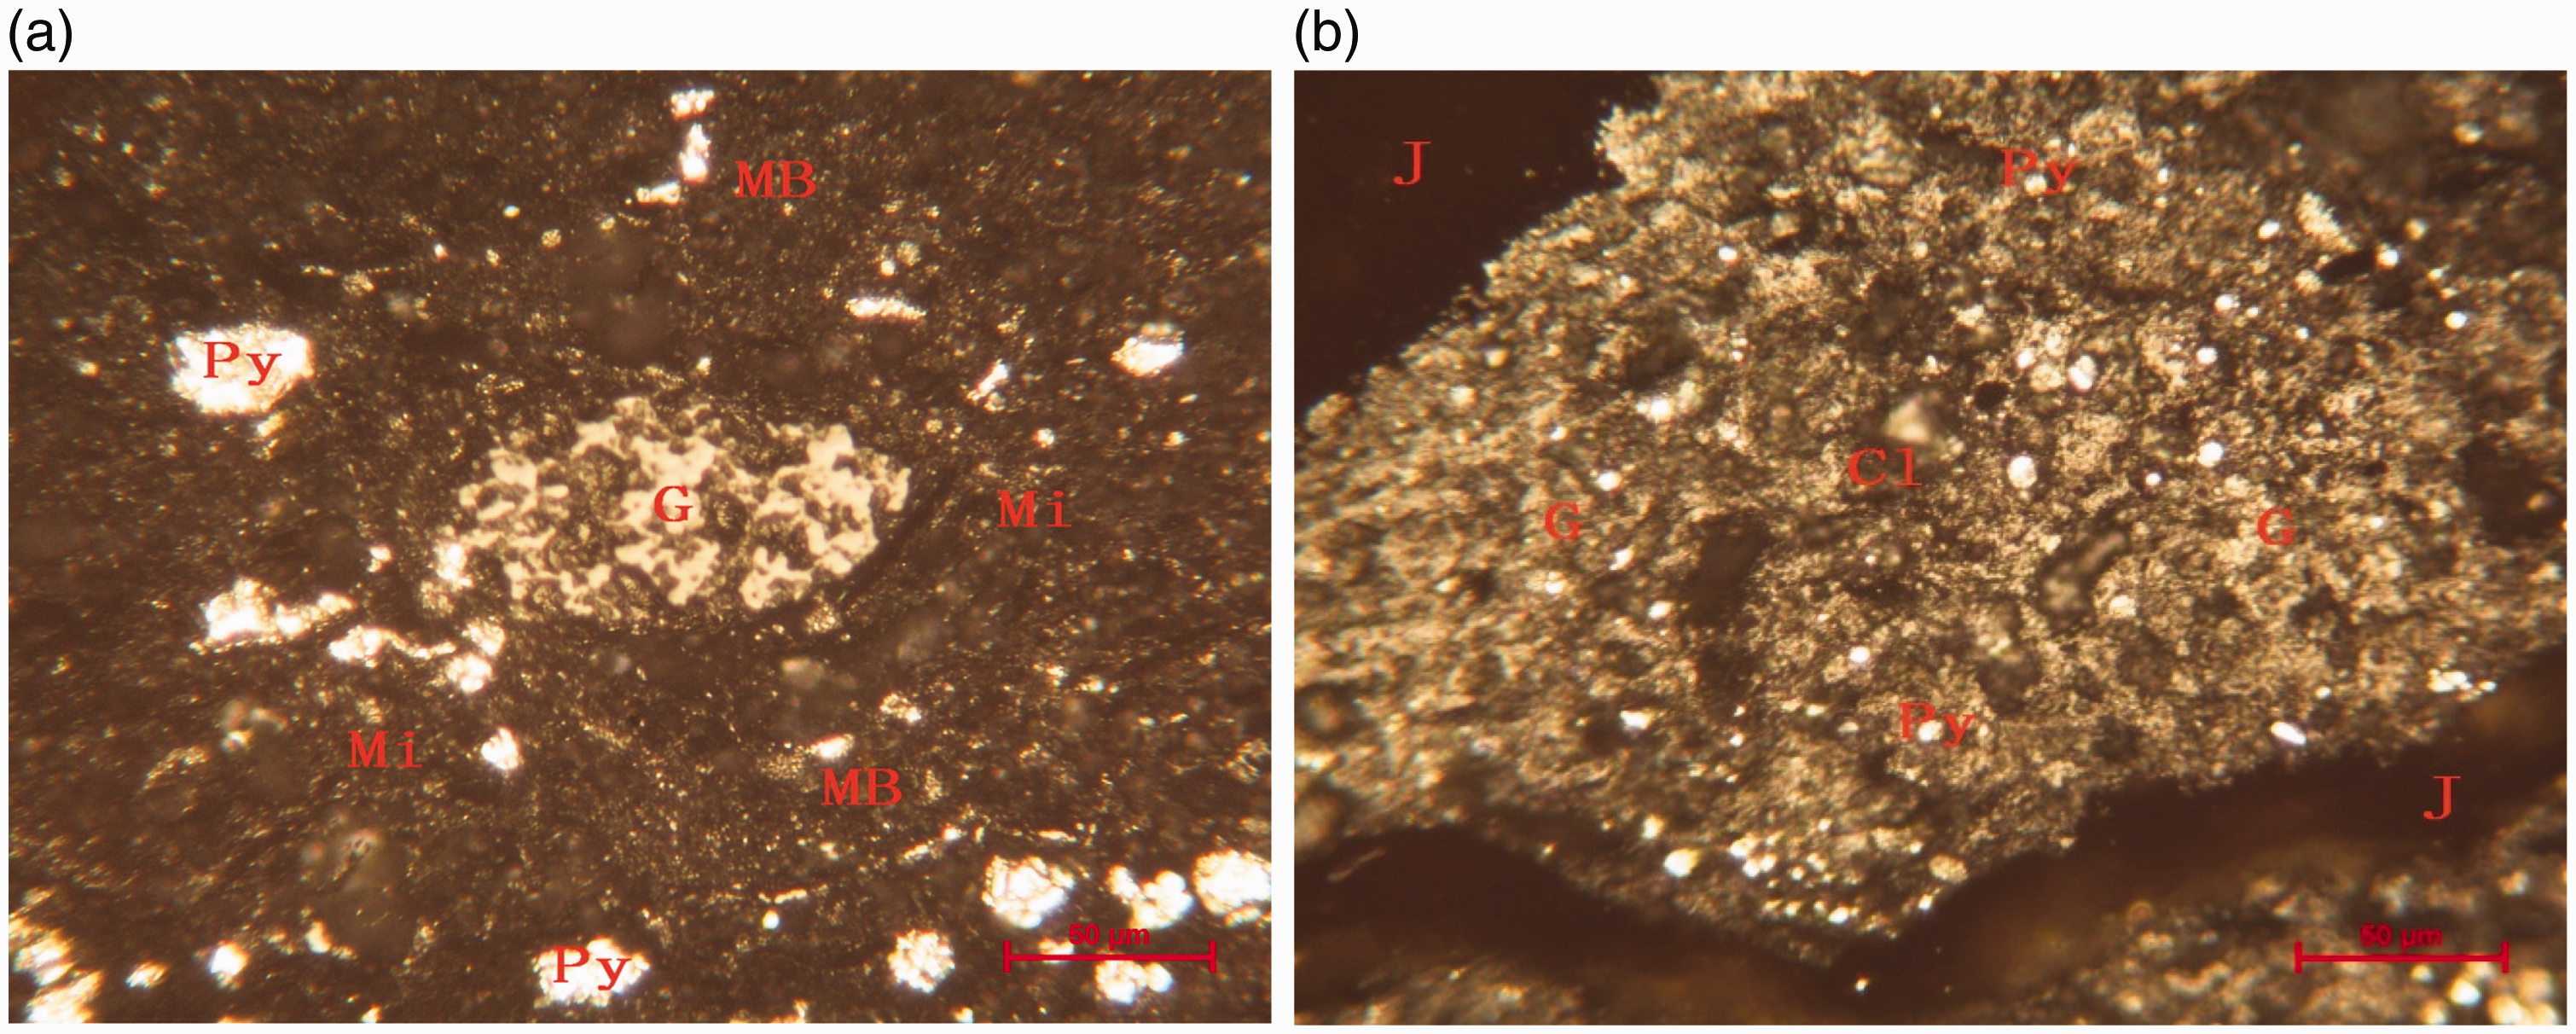
Relationship between TOC and other parameters. (a) TOC versus clay, quartz, pyrite, carbonate; (b) TOC versus adsorbed gas, total gas, He porosity. Reflected mode photomicrographs showing organic matter types of II1. (a) Lenticular porous graptolite, surrounded by micronites; granular pyrite aggregates parallel with layer; sample No. 32, at depth 1627.33 m. (b) Stacks of graptolite fragments, pyrite framboids and clay fill within detritus. Sample No. 30, at depth 1618.3 m. Py: pyrite; Mi:micronite; G:graptolite; MB: matrix of bitumen; CL:clay.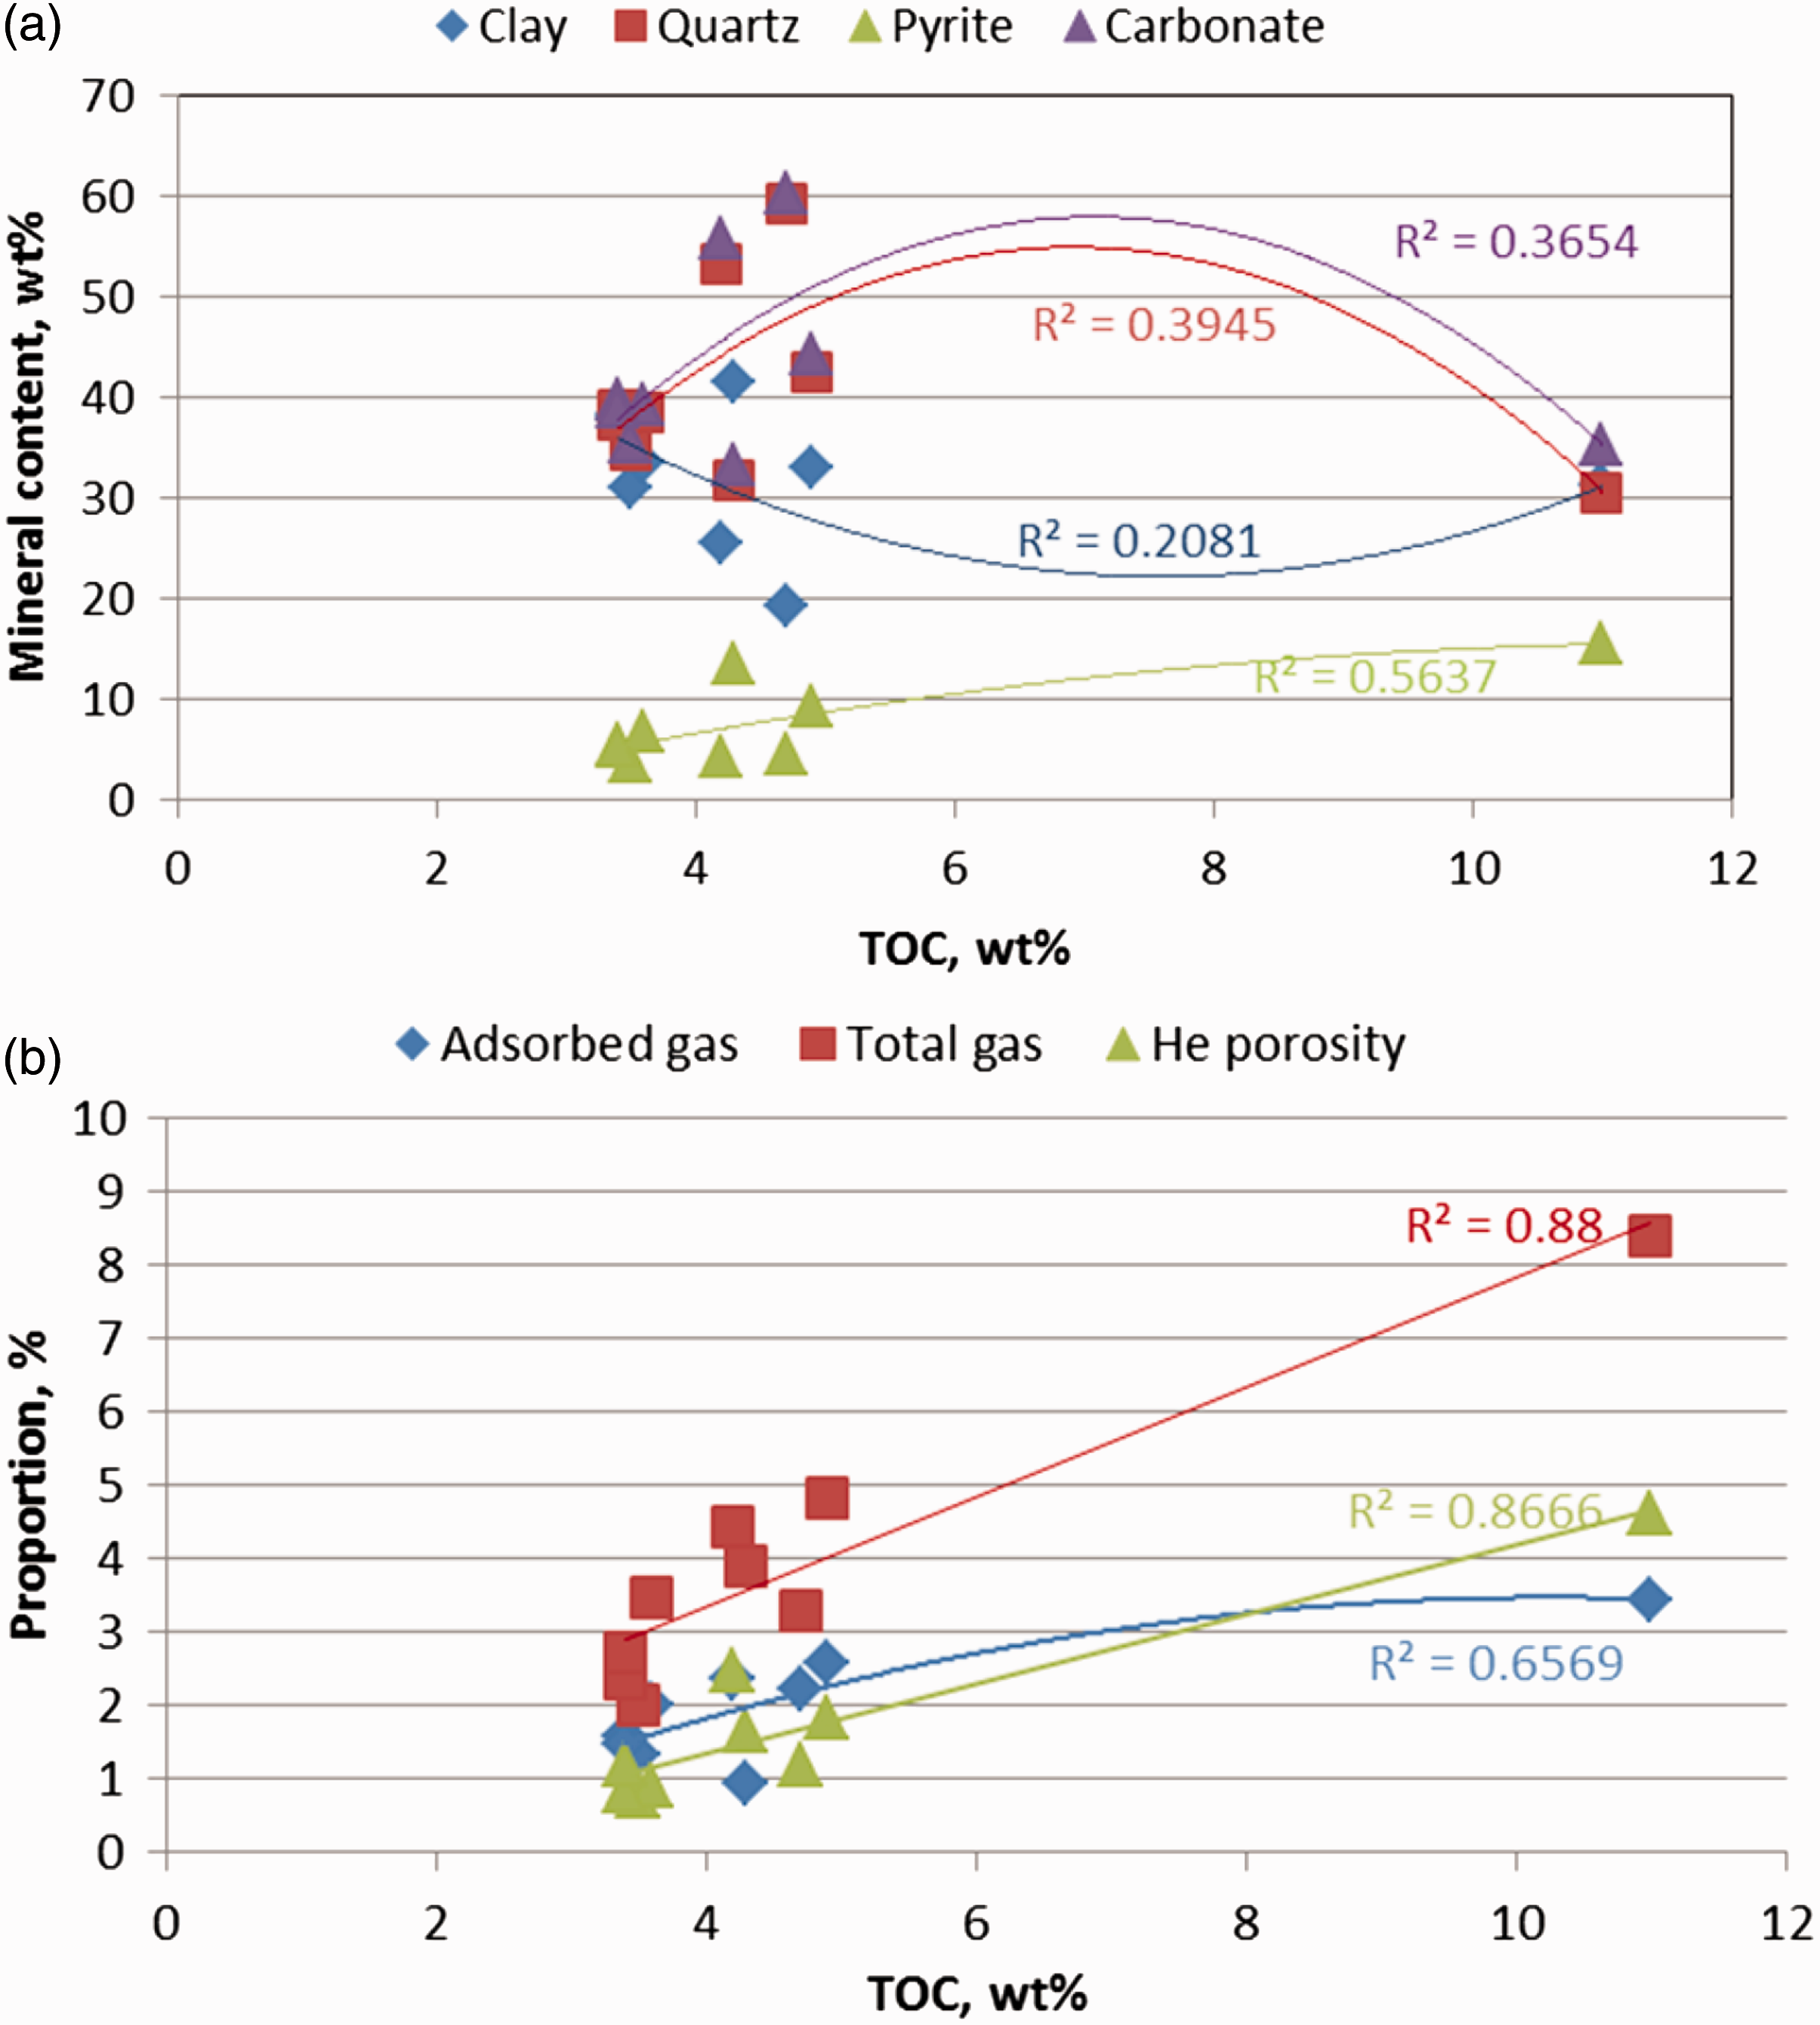
Pore types from FE-SEM imaging
Selected samples representing a typical range of TOC content and mineral compositions are performed with FE-SEM. Pore networks in mudrocks are composed of nanometer-to micrometer-size pores, which are of importance of gas storage and flow. Nanopores were firstly described by Reed et al. (2014) by using FE-SEM and until no criteria of classification for pore types. Three broad pore categories are recognized by Loucks et al. (2012).1) interparticle pores, 2)mineral-hosted intraparticle pores and 3)intraparticle, organic matter (OM)-hosted pores, widely to define pore types for simple and practical.
Here we refer to this classification, various nanometer to micrometer size pores revealed, 2 nm to micrometer in size, and recognize three pores types in specimen by qualitative and half-quantitative imagings: 1) OM-hosted pores, including simple pores and complex pores; 2) mineral-hosted pores, containing InerP pores and IntraP pores; and 3) micro-fracture. Different minerals and pores could be distinguished by brightness in SEM observations, the highest brightness for metallic minerals, darkest for OM.
OM-hosted pores
Abundant in prevalent space of relatively small diameter, OM-hosted pores count the most. Hundreds of pores could exist within a single OM grain, 4–5 µm in diameter, presenting mesopores mostly, macropores as well. Intra P pores occur frequently within separate OM particles, having multiple and varied shapes, such as round, ellipsoid, irregular polygon or honeycomb shape. OM-hosted pores are thought to develop during thermal maturation as generated hydrocarbons are expelled from the kerogen, leaving behind pores, relevant to maturity and TOC. Generally speaking, the more TOC, the more porous OM-hosted pores are developed. Besides, pores are also found to be surrounded by quartz or within pyrite framboids. The SEM results illustrate broad distribution of OM-hosted pores, ranging from 5 nm–500nm, concentrated on 10–200 nm, smaller size compared with mineral-hosted pores and micro-fractures.
Mineral-hosted pores
InterP pores, IntraP pores are observed associated with both mineral components and OM.
Mineral-hosted interP pores between mineral particles or mineral particles and OM are classified as 1) OM-mineral interface pores between mineral particles and OM (Figure 5-c); 2) intermineral pores between mineral particles (Figure 5-d);3)clay-hosted pores between or within clay particles, including pores within clay-clasts (Figure 5-e); and 4) inter-crystalline pores between pyrite crystal lines (Figure 5-f). Inter-crystalline pores are common within clay platelets and pyrite framboids, though many of these pores are occluded with OM. Their latticed, strip and slit shapes and distributions are dominated by mineral crystal or aggregates. Mineral-hosted type tends to associate with mineral grain boundary, often connect two rigid particles, thought to be primary porosity developed after compaction. With large pore size (ranging from nm to µm scale) and good connectivity, these pores formed highly permeable pore network, varying from several nm to µm in size.
Images of three types of pores.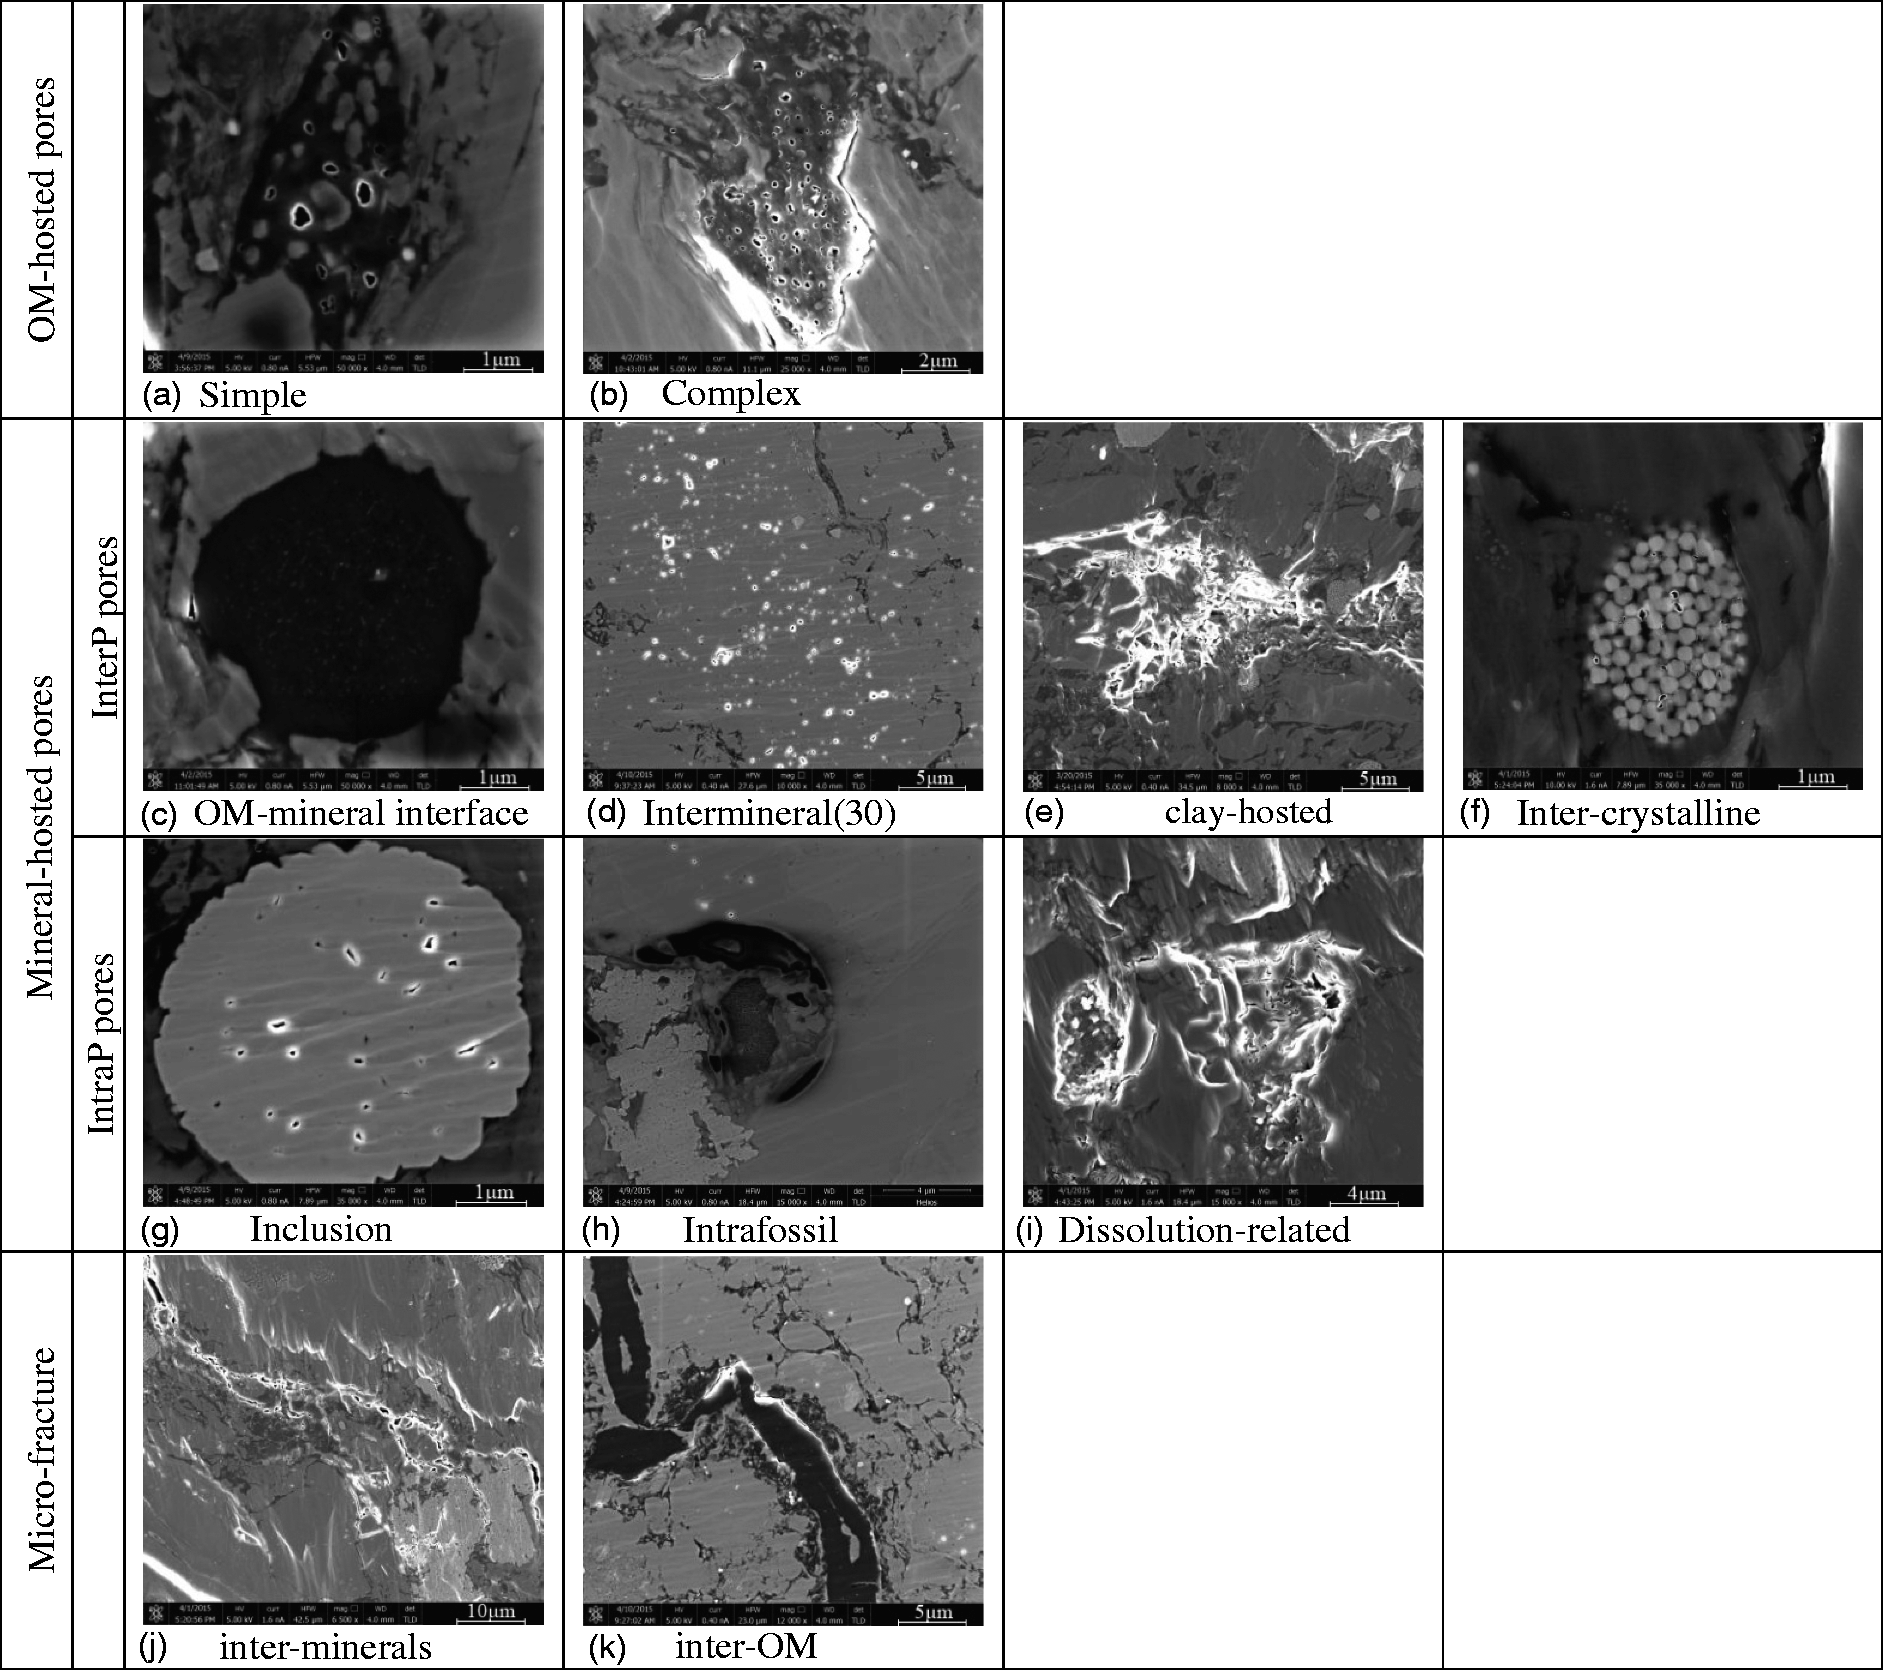
IntraP pores are often developed within particles (such as quartz, feldspars) and associated with diagenesis, including inclusion pores (Figure 5-g), preserved intrafossil pores (Figure 5-h) and dissolution-related pores (Figure 5-i). These pores often occur in clays and quartz accompanied with interP pores. Dissolution-related pores occur along the grain boundary, and are commonly observed when there are abundant carbonate grains scattered through the matrix of the shales, observed in calcite grains. They are secondary pores, most likely formed by partial corrosion of unstable mineral, commonly isolated, larger size, >100 nm.
Micro-fracture
Micro-fracture serves as the bridge between the micropores and a reservoir space, and is of importance for gas storage and transport. Observations illustrate that micro-fractures often occur at the edge or inner of brittle minerals, and in zigzag shapes with high tortuosity for the edge fracture, well connected and length ranging from 2–15 µm, width of 100–600 nm proximately. Besides, micro-fractures are also found at the edge of the organic matter, with limited length, thought to be left behind due to OM shrinkage after hydrocarbon was expelled. The higher brittleness, brittle minerals content prevail, the easier of micro-fractures developing. Moreover, dissolution-related fractures are also found in carbonate minerals.
Pore shapes
Low pressure nitrogen adsorption can be used to obtain the following information in microporous materials (Labani et al. 2013): pores shapes, specific pore volume, specific surface area, and pore size and distribution. The amount of gas adsorbed can be illustrated by an equation of parameters such as adsorbate, adsorbent, equilibrium temperature, and pressure when adsorption occurs during gas molecular flow along the solid surface (Gregg and Sing 1982).
N2 isotherm adsorption curve is measured by quantifying the amount of gas adsorbed at increasing relative pressure (P/P0), the ratio of gas vapor pressure in the system to saturation pressure of the adsorbent. The desorbed isotherm can be obtained by measuring the amount of gas removed from the sample when the relative pressure is decreasing. Brunaner et al. (1938), IUPAC(1994), and Rouquerol et al. (1999) studied the classifications of adsorption curves. Rouquerol et al. grouped into eight types, as shown in Figure 6, and developed from six types made by International Union of Pure and Applied Chemistry (IUPAC, 1994). Type I is attributed to micropores; Type II and III are associated to non-pore or macropores; Type IV is produced by meso-pores; Type V has relevance with weak gas-solid interaction of micro-meso pores, rarely; Type VI presents ladder-like, led by uniform multilayer adsorption successfully.
Different types of adsorption isotherms, after Rouqueroletal et al.(1999).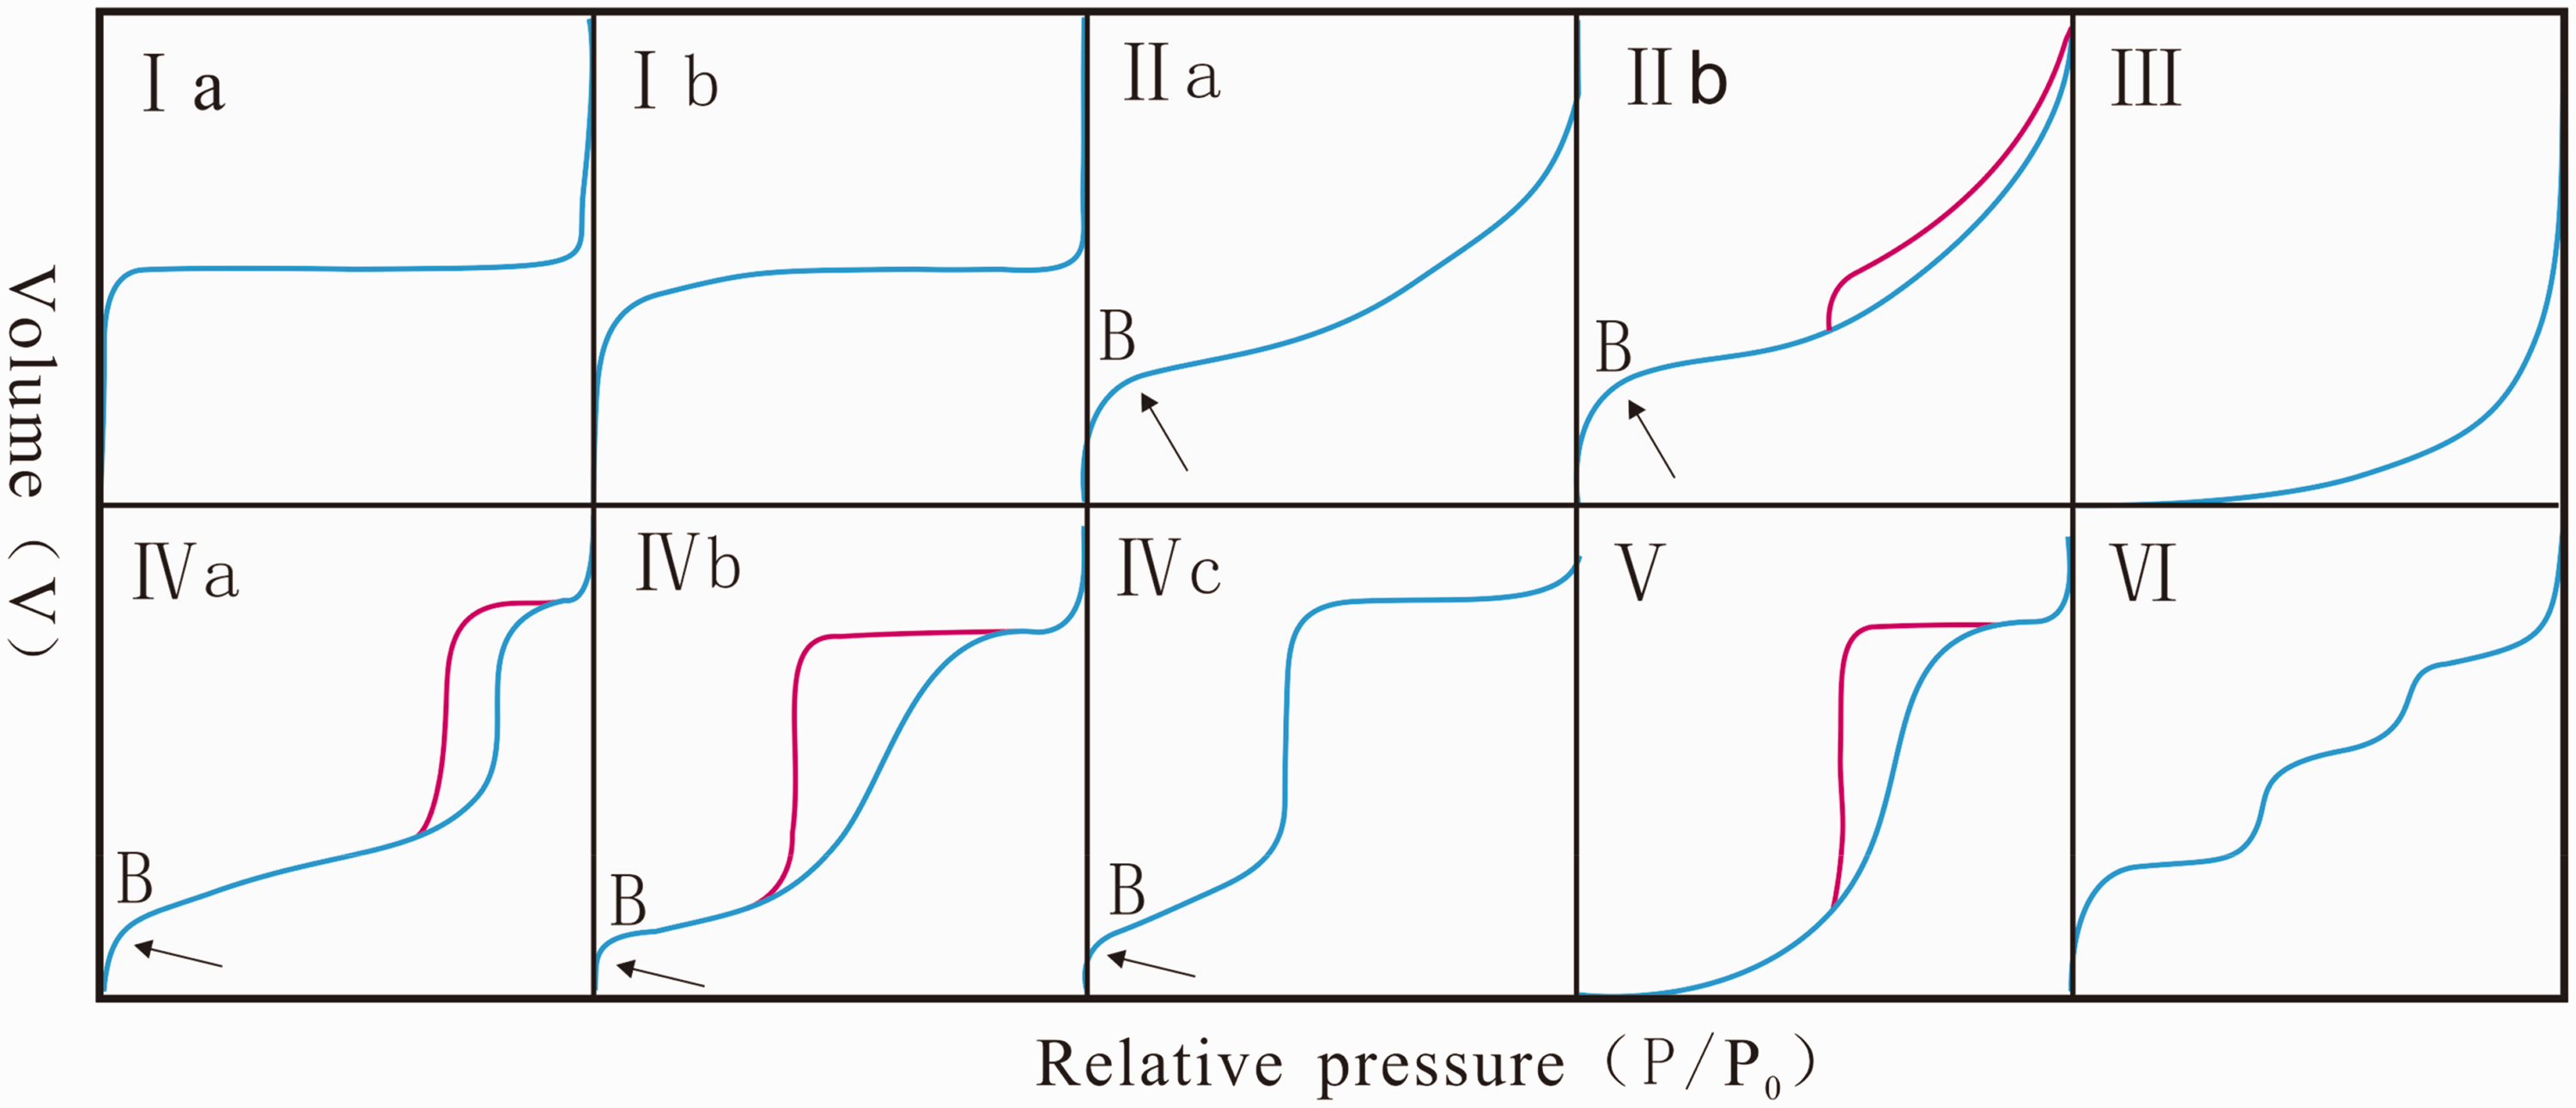
Desorption curve and adsorption curve cannot coincide with each other, generating different hysteresis loops, connected to various pore shape. Do Boer (1958) identified five types of hysteresis loops, and then another type has been added by Sing et al. (1985) (Figure 7-Type A-E). Based on the measurement, we calculate the specific surface area using the widely accepted multi-point Brunauer-Emmett-Teller method in the relative pressure range of 0.05–0.30, and estimate the total pore volume and the PSD using the multi-point Barrett-Joyner-Halenda method. Type A hysteresis is attributed to cylindrical pore; Type B is associated with slit shaped pores; Types C and D hysteresis are produced by wedge shaped pores and Type E hysteresis has been attributed to bottle neck pores. The existence of hysteresis indicates complex micro-structure, substantial difference of shape and connectivity of micropores, hence capillary condensation developed on the surface of matrix, leading to the unfully-adsorbed gas.
Five types of hysteresis loops and their related pore shapes(Guan et al. 2016).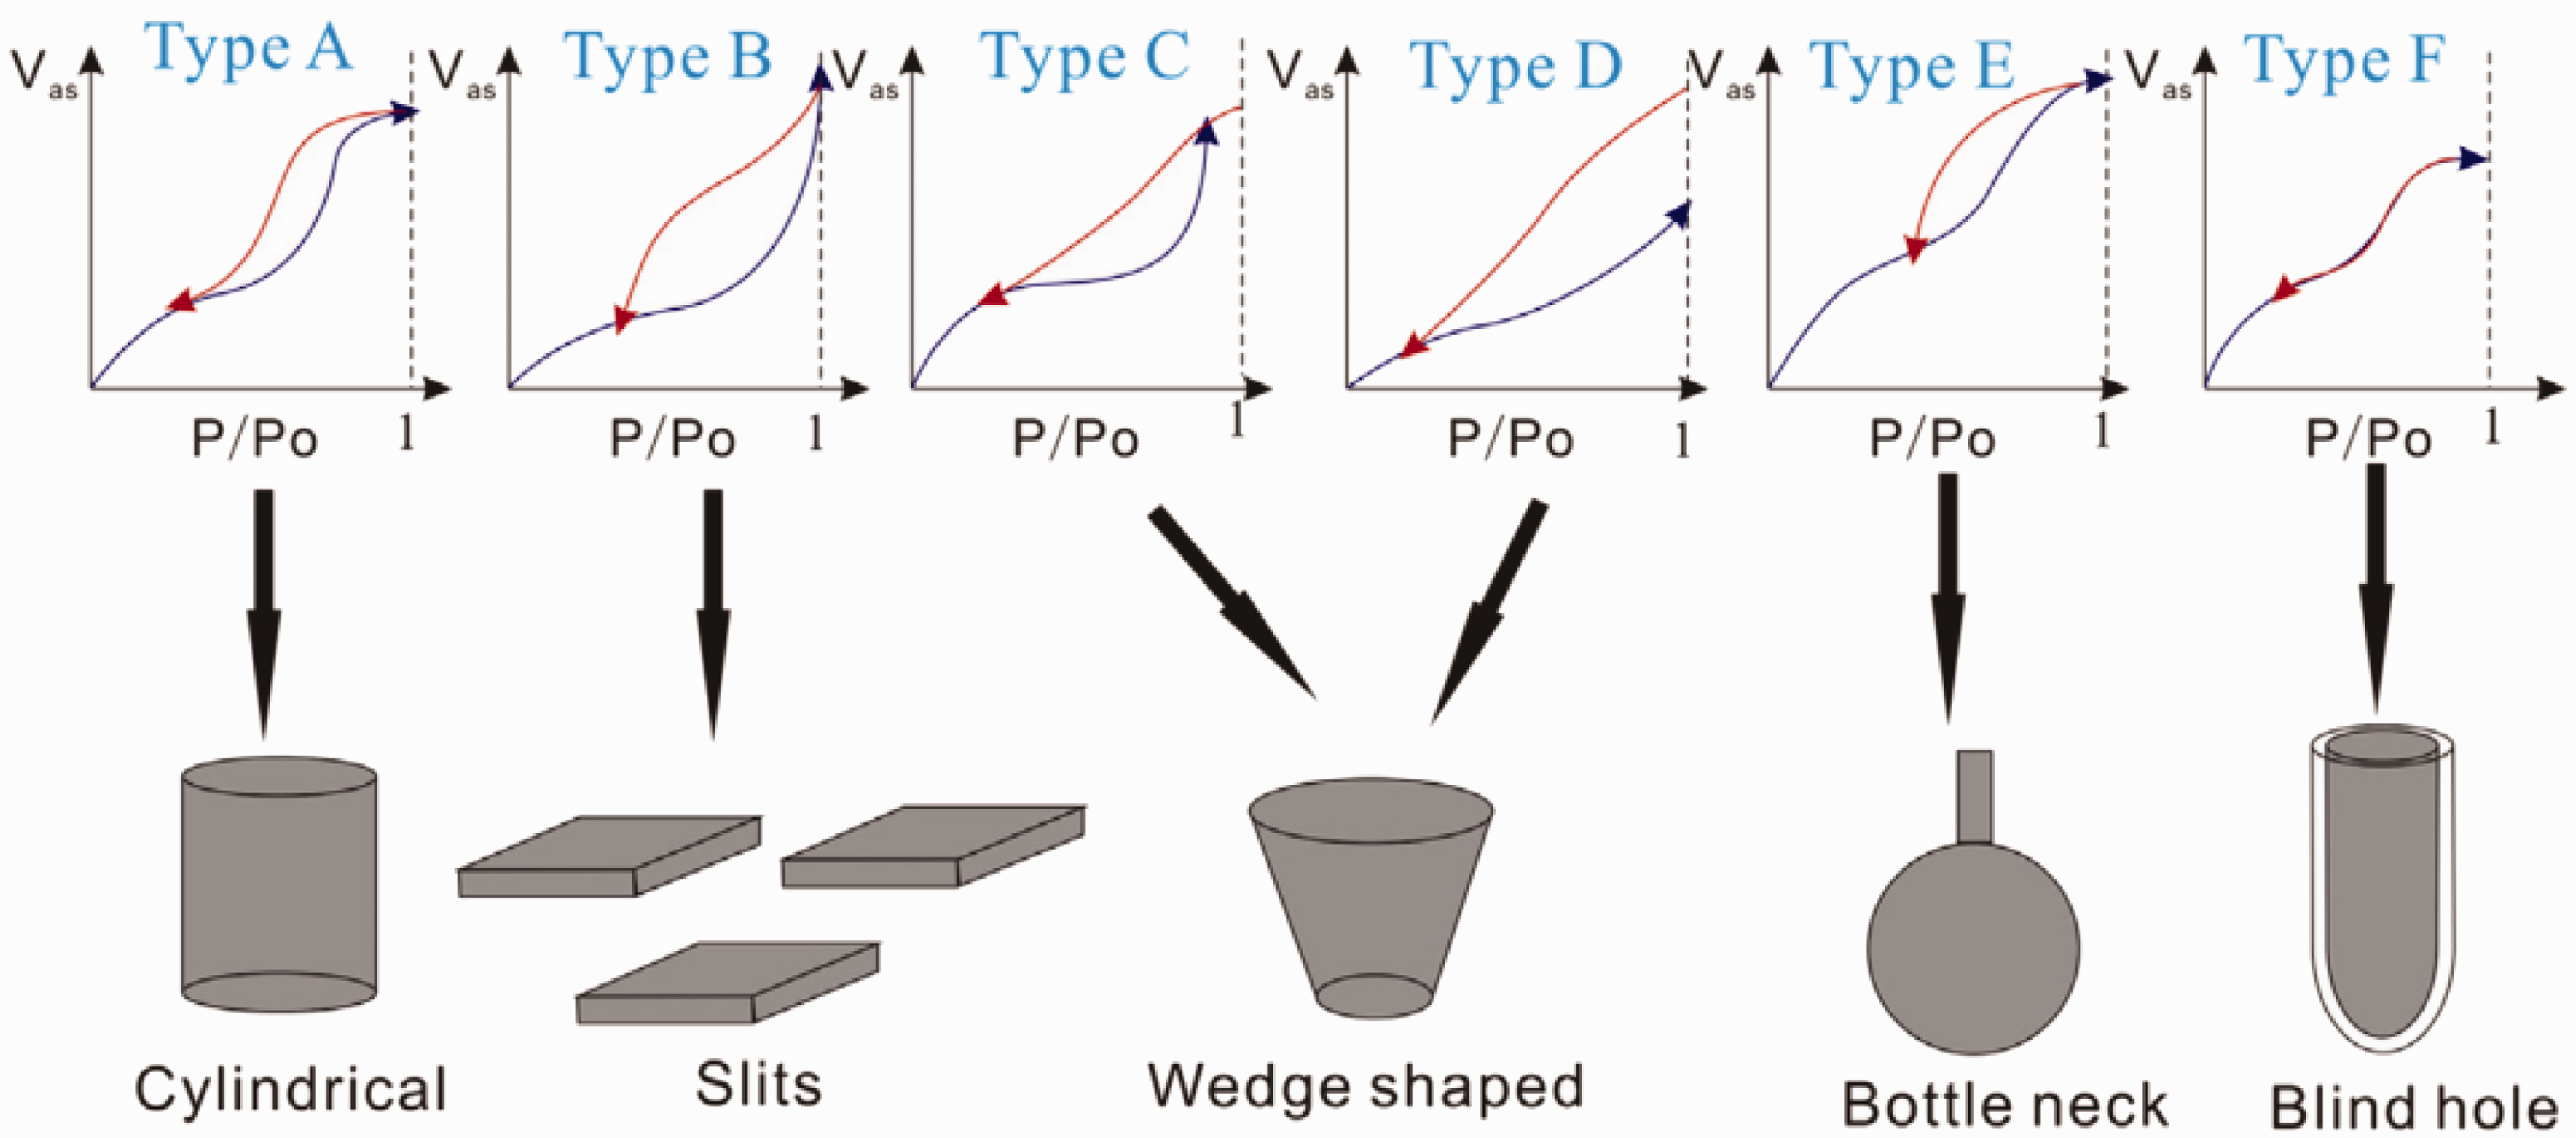
Figure 8 illustrates low pressure nitrogen isotherm for the samples. The reversed S-shaped isotherms and hysteresis loops are obtained in all the nine samples. The shapes curves are grouped into two types, IIb and IVa. The sorption volume at a low pressure ratio of P/P0<0.01 is considered indicative of presence of nanopores smaller than 2 nm (Hinai et al. 2014; Kuila et al. 2011; Kuila et al. 2013). A significant quantity of adsorption at relatively low pressure (<0.05), with the initial adsorption of 8.5 ml/g and the maximum of adsorption of 39 ml/g far more than others, implying the substantial occurrence of micorpores (<2 nm), sample 32, is the first group (Figure 6-c). Located within Hirnantian stage, LM1 graptolite zone, sample 32 is an organic-rich siliceous shale, with the highest TOC of 11% among all the samples. The isotherm curve climbs steadily as the relative pressure increases. The gentle linear curve grows slowly during relatively low pressure ranging from 0.08-0.4, an exponential curve increasing rapidly at relatively middle pressure of 0.4–0.88, and then during the high pressure stage (>0.88), the adsorption volume raises sharply. Whereas, the desorption curve tends to be stable when relative pressure decreases to 0.88, and a turning point appears when the pressure reaches 0.55, and then desorption accelerates during P/P0 at 0.55-0.45, later tends to be stable again. This hysteresis loop is relatively broader compared with other samples, and more steep of desorption curve. The isotherm curve is Type II b, interpreted of due to micropores filling at low pressures and multilayer sorption at higher pressures, which suggests some pores are mesopores. The hysteresis loop belongs to Type B, reflecting the morphology of slits pores, primarily contributed by macropores.
Low-temperature N2 isotherms of nine samples.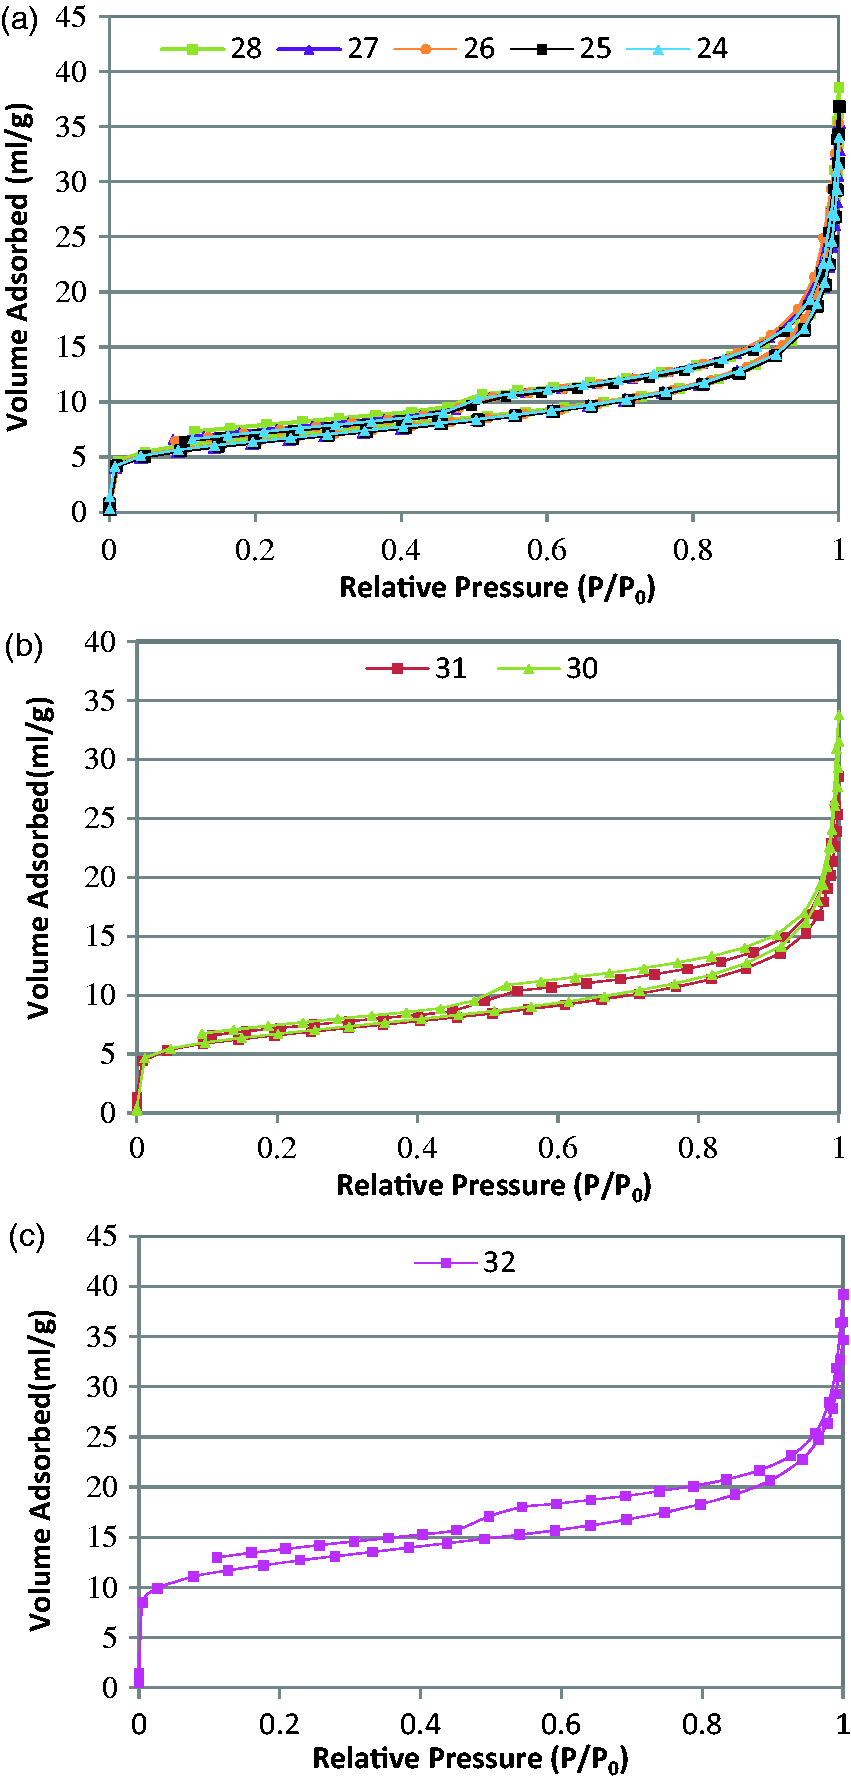
The second group can be found in the other samples, No.24–31. The adsorption amount is very low, less than 5 ml/g, at a relatively low pressure zone (i.e., P/P0 < 0.01), whereas the adsorption and desorption isotherms display steeply slope at a high relative pressure zone (i.e., P/P0 ≈ 0.9–1.00). The adsorption curve is similar with the first group, but the difference in that desorption curve remains steady during a long period, P/P0 ≈ 0.88–0.55, and then accelerates. The isotherm curve is Type IV a, contributed by mesopores (2–50 nm); hysteresis loop belongs to Type A, presenting cylinder pores.
Pore size distribution (PSD), surface area, total pore volume
PSD can be presented by cumulative, incremental and differential pore volume or surface area versus pore size diameter curves, from which we can obtain significant information on pore structure, including pore size range, dominant pore size and contributions provided by different pore size ranges to the total pore volume (total surface area)(Clarkson et al. 2013; Mastalerz et al. 2012; Meyer et al. 1998).
Low pressure N2 isotherm
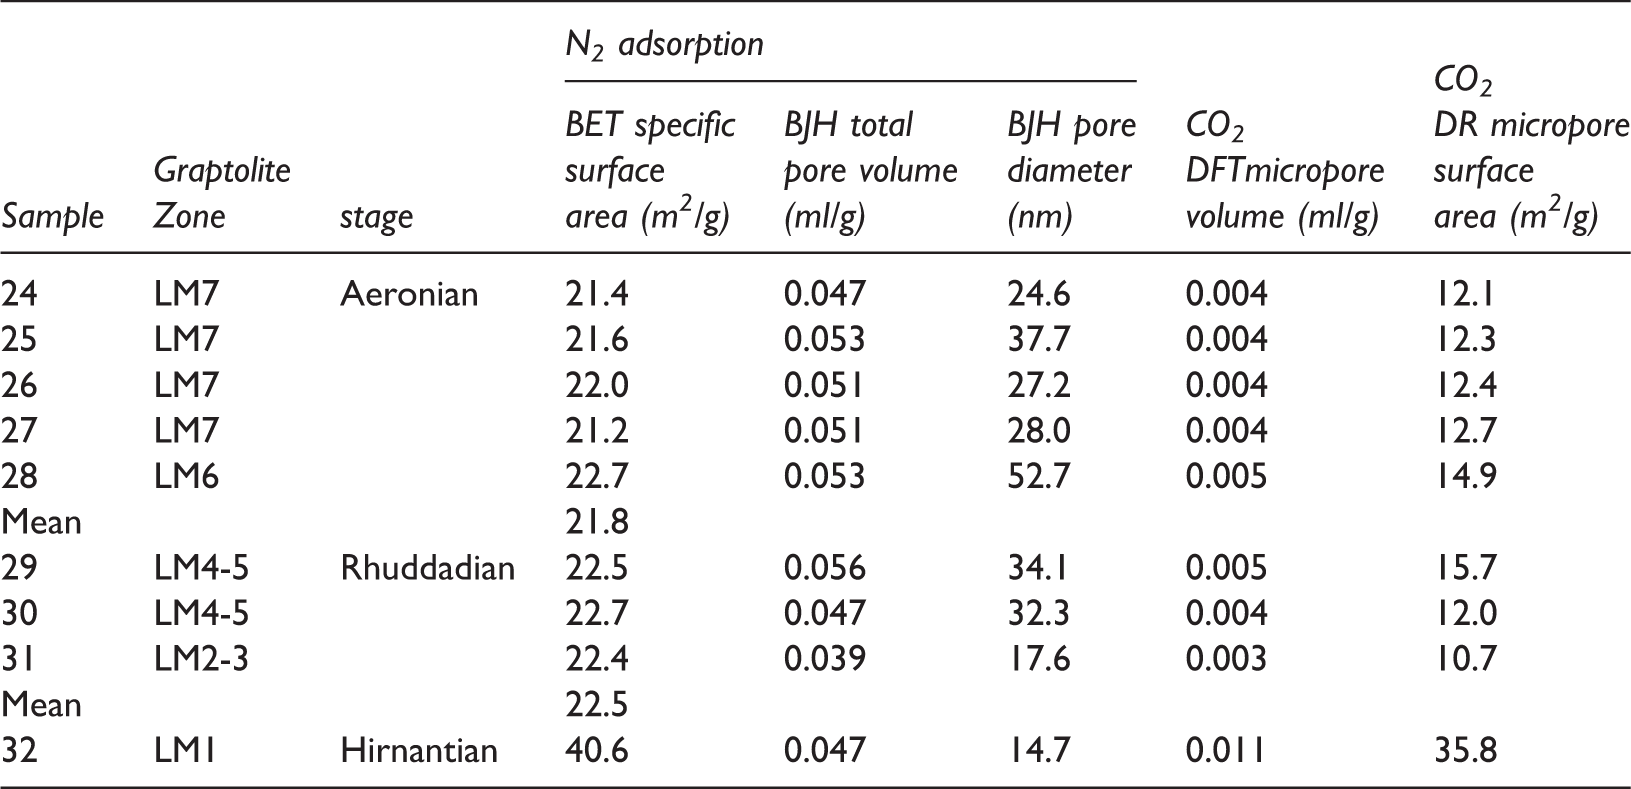
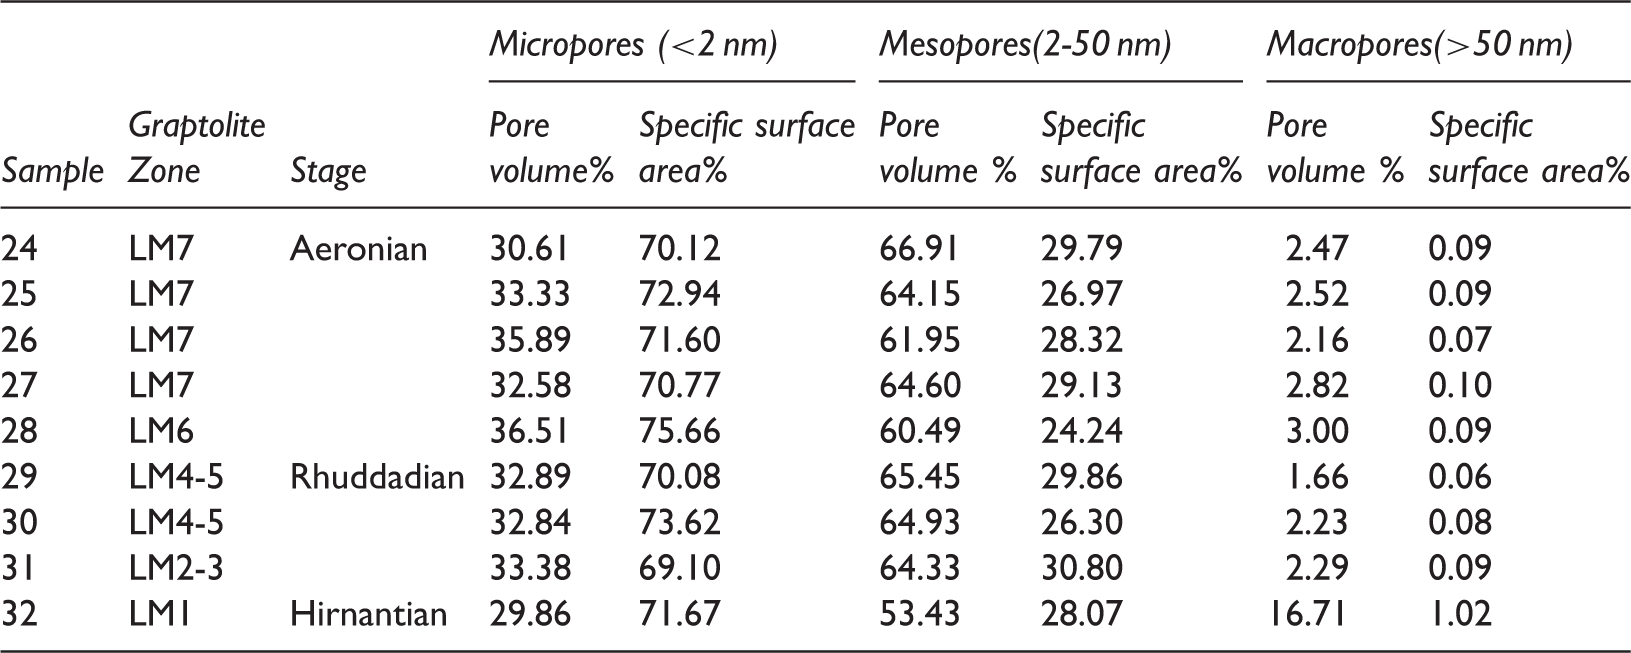
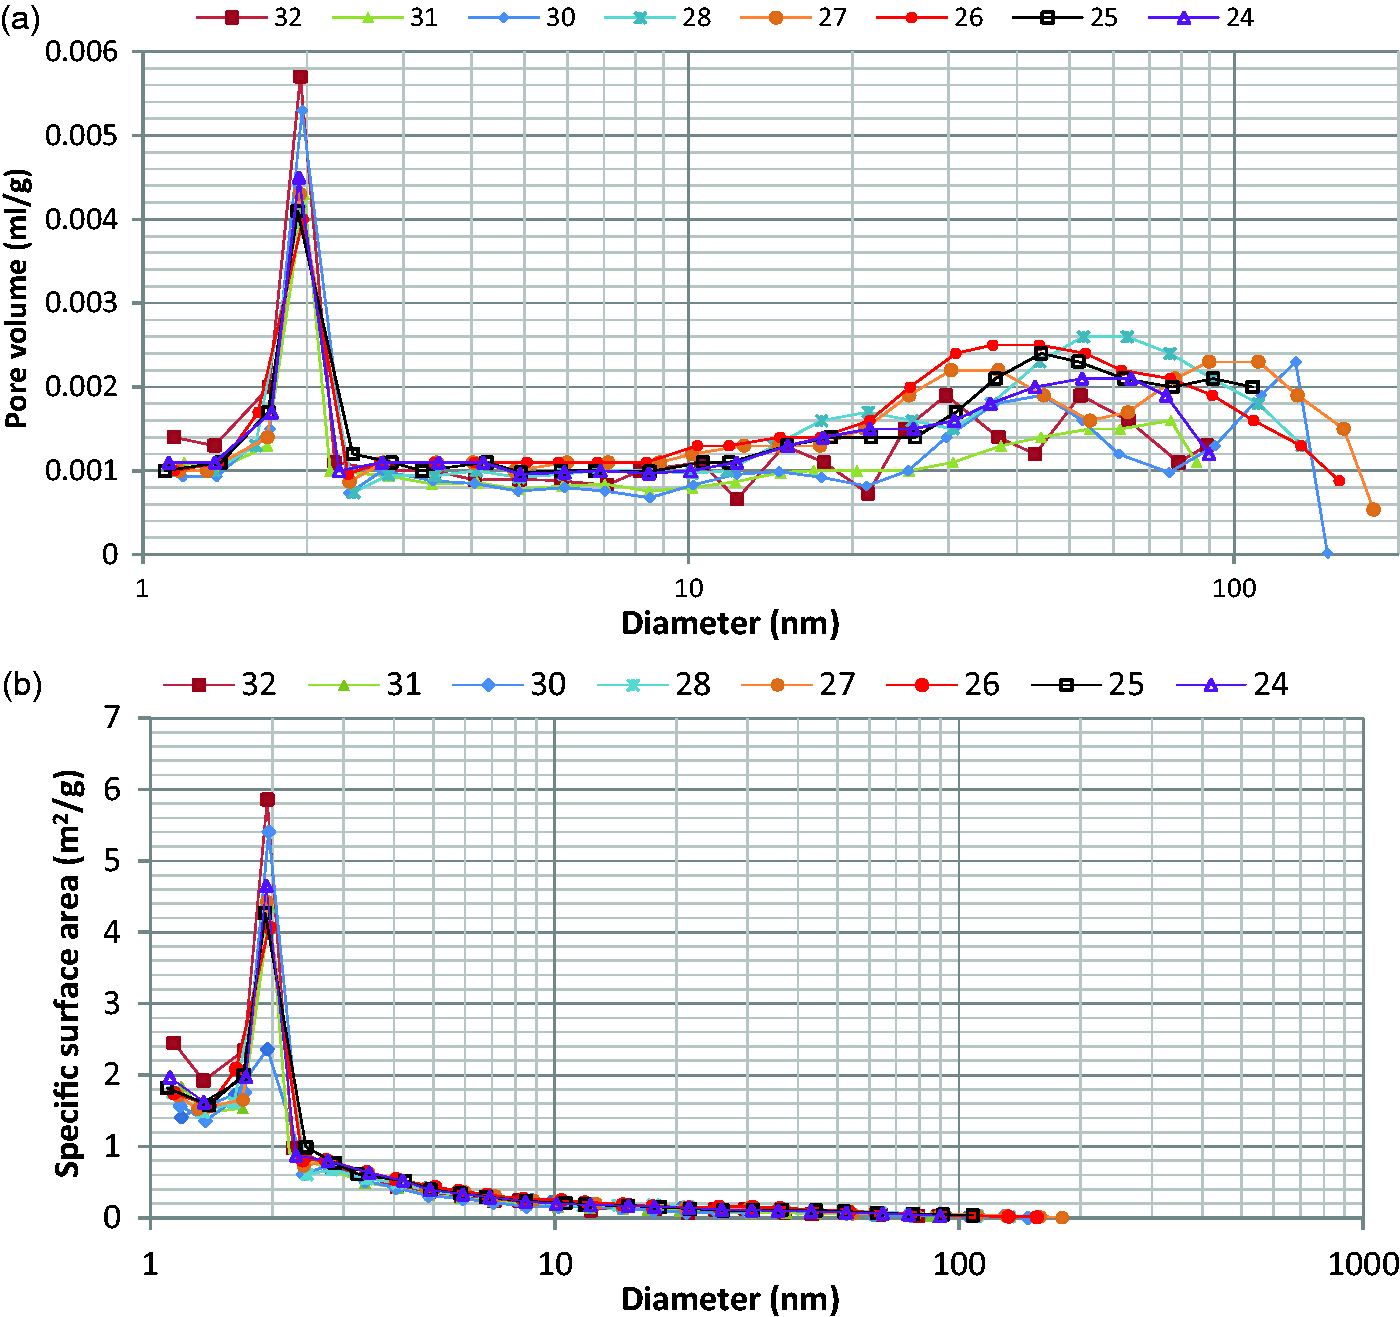
N2 pore volume distributions (Figure 9-a) reveal that the shale pore structure may be bimodal, dominant pore size intervals within 1.7 nm-2nm and 30–50 nm. The results of nitrogen isotherm also illustrates the average pore size ranging from 14.7-43.5 nm, shown in Table 3. The pore structure parameters are shown in Table 3. BET surface areas, obtained from N2 adsorption analysis, exhibit a wide range of values and a similar distribution properties compared with that of pore volume, ranging between 21.2 and 40.6 m2/g, with a mean value of 24.3m2/g. The BET surface areas are found to decrease upwards, with the highest value in the lowest Hirnantian shale, presenting a similar trend with porosity. Whereas, the total pore volume shows ranges from 0.039 ml/g to 0.056 ml/g, with the higher volume in the upper shale of Aeronian stage, a mean value of 0.0509 ml/g. Pore diameter provides a similar variation with porosity, rising upwards, with lowest Hirnantian lowest value of 14.7 nm, lower part of Rhuddanian ranges between 17.6–34.1 nm, and higher value between 27.2-52.7 nm for upper Aeronian shale, caused by high silts content in this section. Table 4 shows the percentage of the total pore volume, specific area for three classifications of pores. The micropores (<2 nm, diameter) provide the primary adsorbed specific surface area, whereas the mesopores support the volume for gas storage. Vertically, most samples present similar proportions of surface area and volume, except for 32 and 30, getting the higher values. (2) Low pressure CO2 isotherm
Low pressure CO2 isotherms Specific surface area and total pore volume in samples of well WX2. Percentages of total pore volume and surface area for differential pores. Pore size distribution curves. (a)Pore-size distribution defined by differential pore volume by the pore volume from porosimetry pore diameter ranges between 3 nm and 100 µm;(b)Defined by the pore surface area from porosimetry analyses. The boundaries between micropores, mesopores, and macropores are highlighted by dashed lines.
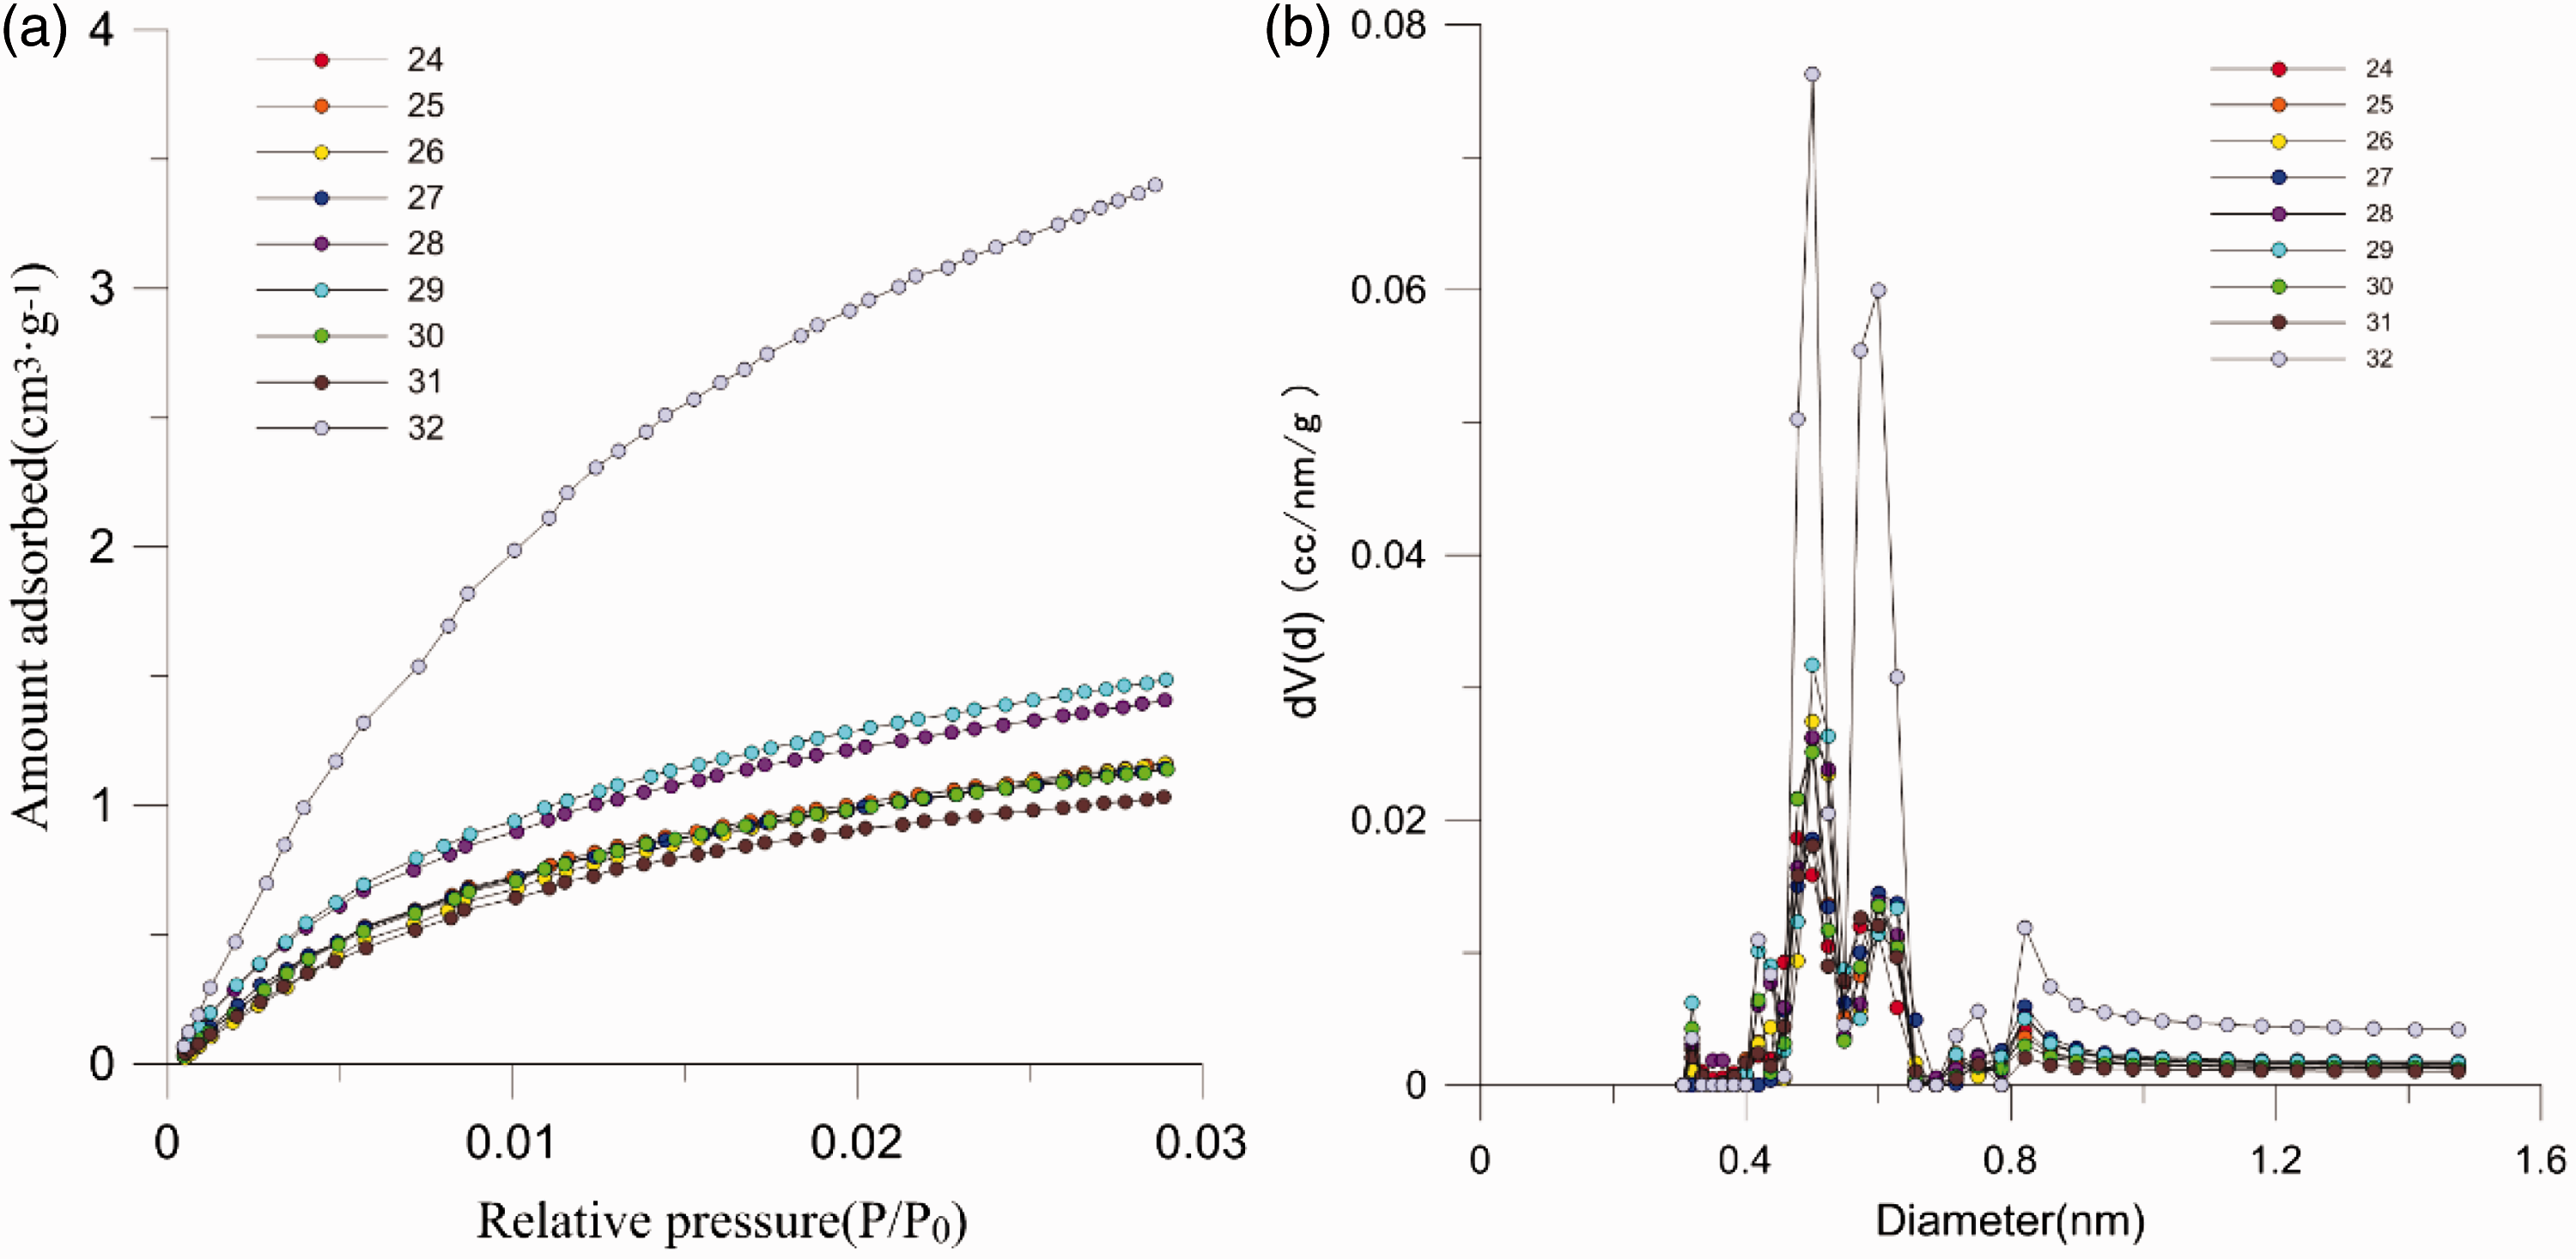
Carbon dioxide adsorption experiment is commonly used to characterize micropore (<2 nm) due to the fact that CO2 molecule is more accessible than N2 molecule (Chalmers et al., 2012). The micropore (0.3-1.4 nm) volume and surface area of nine samples tested by CO2 adsorption with DFT method are shown in Table 3. Meanwhile, lower pressure D-R CO2 isotherms and pore-size distribution are shown in Figure 10-a and Figure 10-b. The adsorption curves display similarity, belonging to Type I, following the classification of IUPAC, implying abundant micropores. Adsorption of the largest amount occurs in sample No.32, with a value of more than 3cm3/g, indicating substantial micropores. And the shales in Aeronian Stage produce a moderate amount, >1cm3/g; whereas other samples obtain the lowest adsorption, <1cm3/g. As shown in Figure 10, two volumetric maxima (DFT molecular model) are present at pore width intervals of 0.42–0.46 nm and 0.46–0.62 nm, indicating the most proportion of micropores. Table 3 illustrates the micropores specific surface area span 9.9-35.8m2/g, a mean value of 14.8 m2/g, with the highest value of 35.8% in the lowest Hirnantian sample; and micropores volume range from 0.003 to 0.011 ml/g, on average at 0.005 ml/g.
Low pressure CO2 and N2 isotherms Left is adsorption curves measured by CO2 isotherm. Right is PSD defined by dV(d) measured by CO2 isotherm.
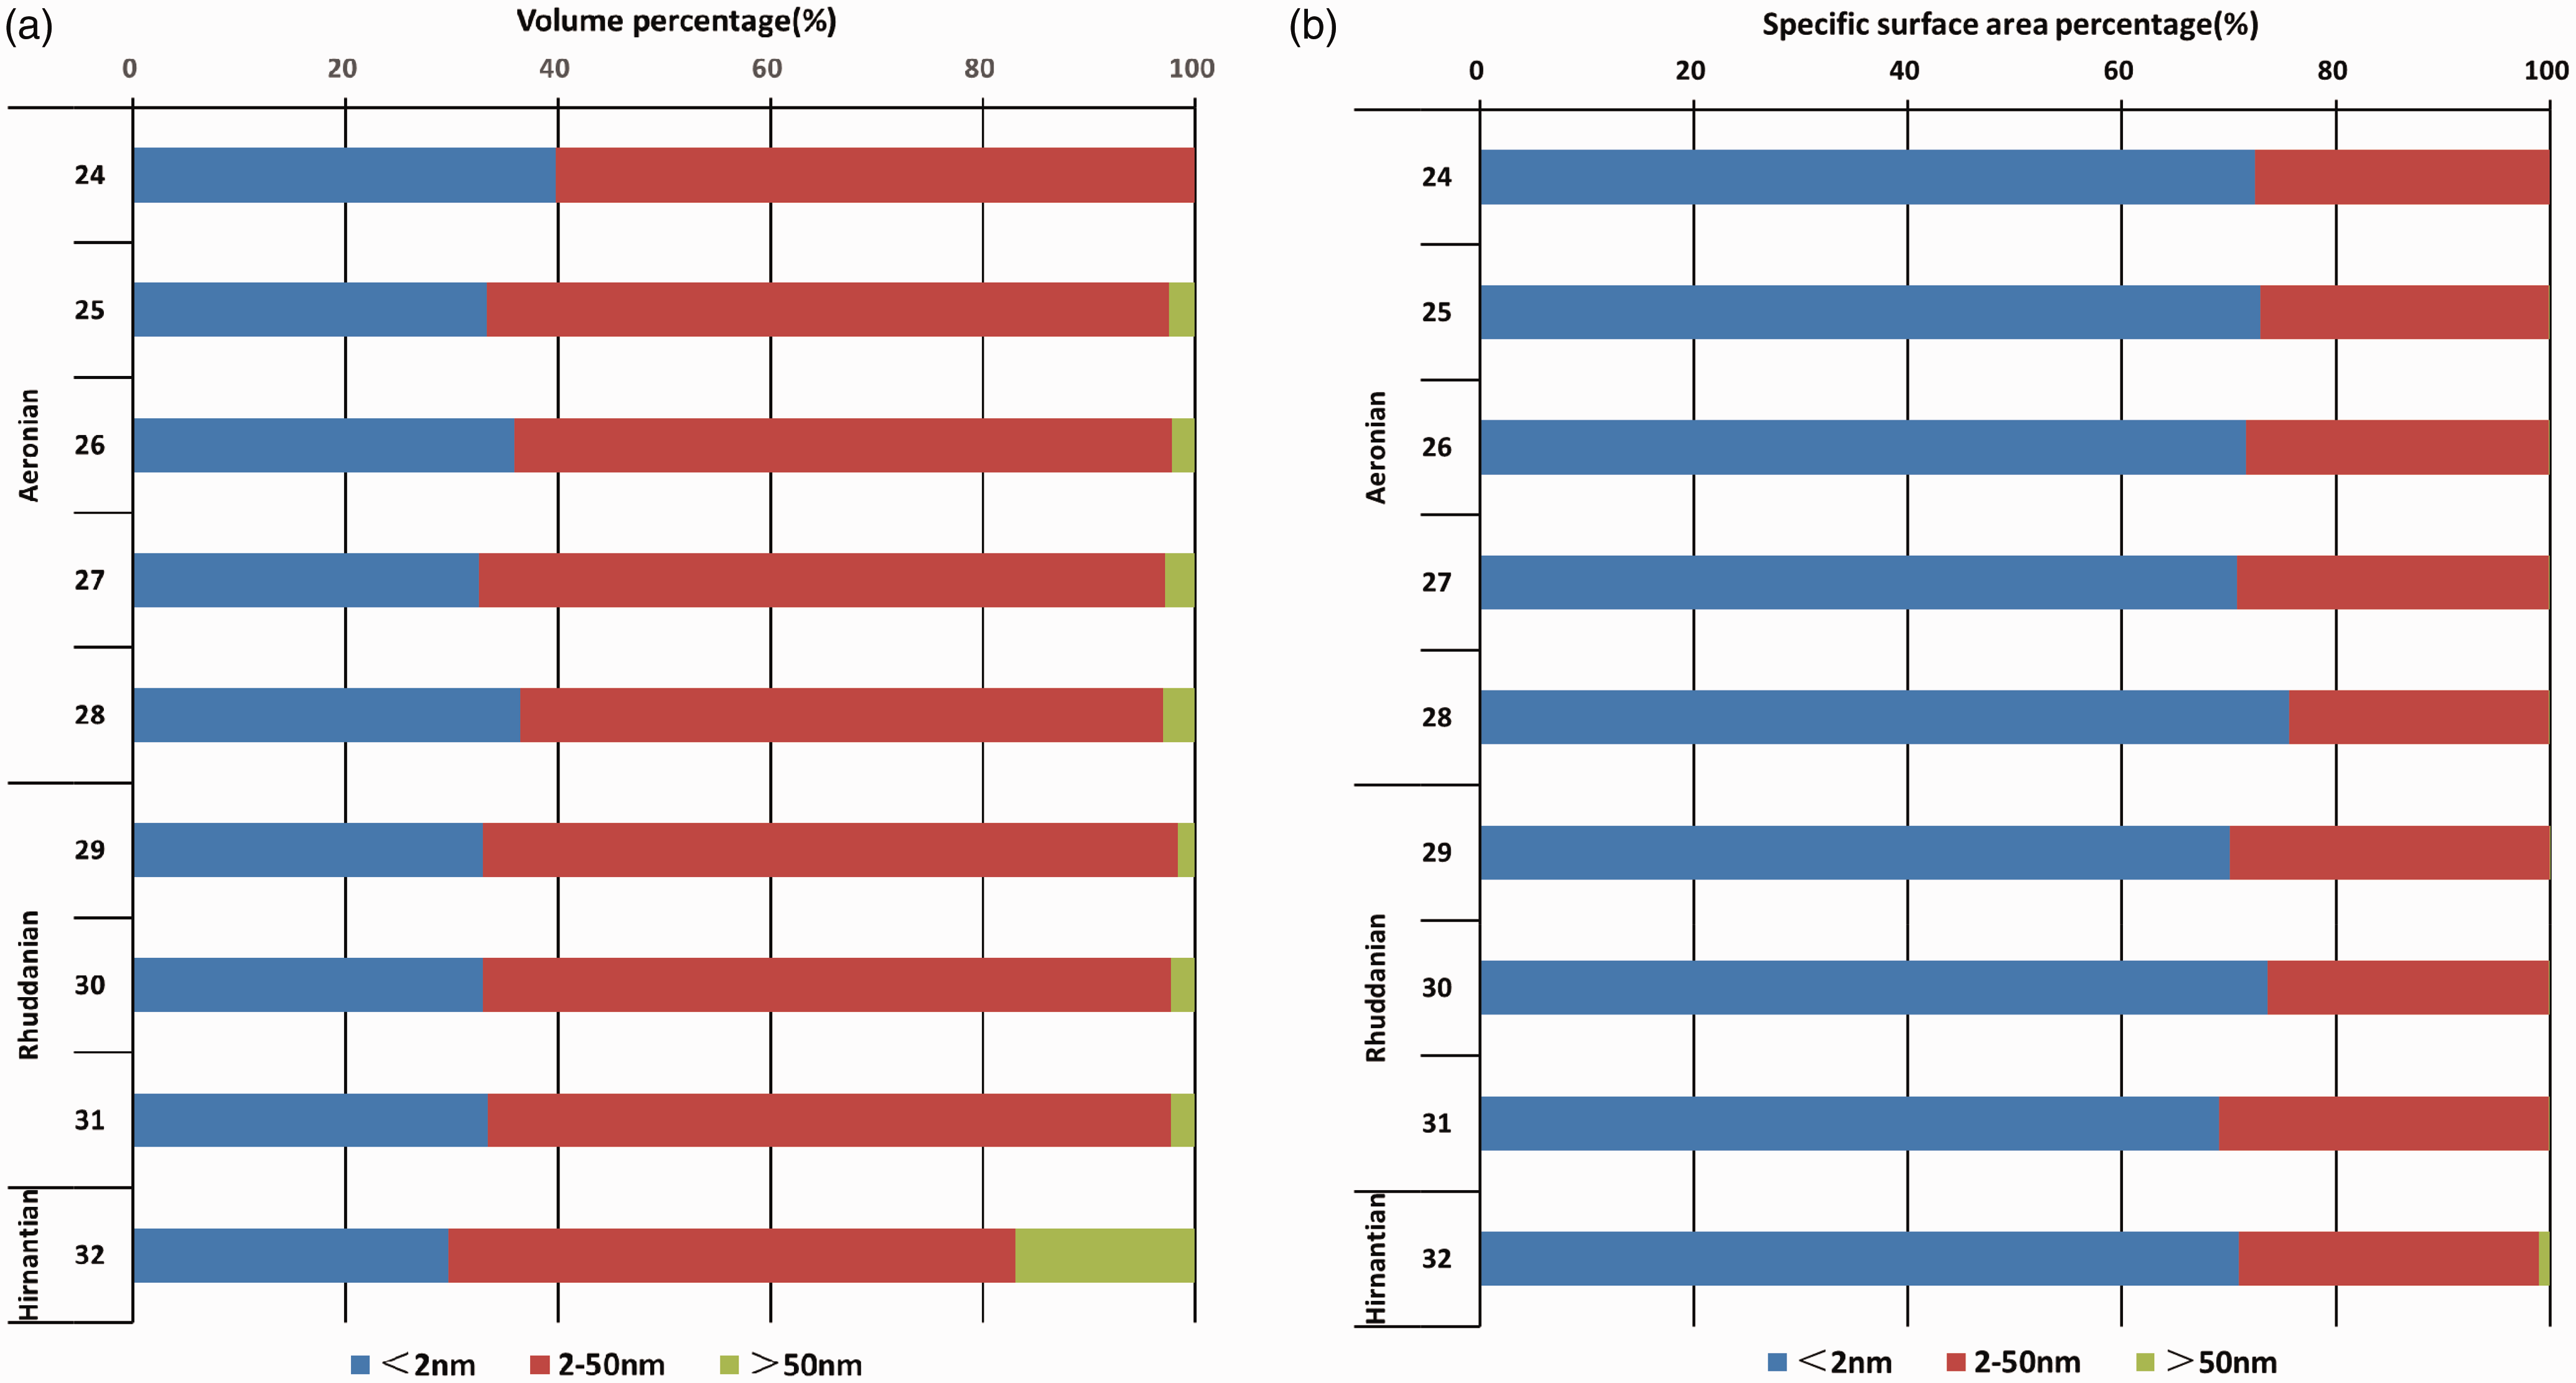
The overall PSD result is shown in Figure 11, presenting bimodal combined with data from N2 adsorption for meso-macropores and CO2 adsorption for micropores. As illustrated in this plot, the bimodal curve presents two diameter sections, 0.3–1 nm and 2–5 nm, indicating the high proportion of these diameters. From the bottom to upwards (Figure 12-a,b), the contribution to the total pore volume of three types follows this order: mesopore > micropore > macropore. The macropores of sample No.32 contribute most within all the samples for the volume. Whereas the contribution to specific surface area is different: micropore > mesopore > macropore.
PSD defined by dV(d) using combinations of CO2 and N2 isotherm. Proportions histograms with three pore types defined by specific surface area and pore volume. (a) Total pore volume percentage distribution of pore diameter; (b) Pore specific surface area distribution of pore diameter.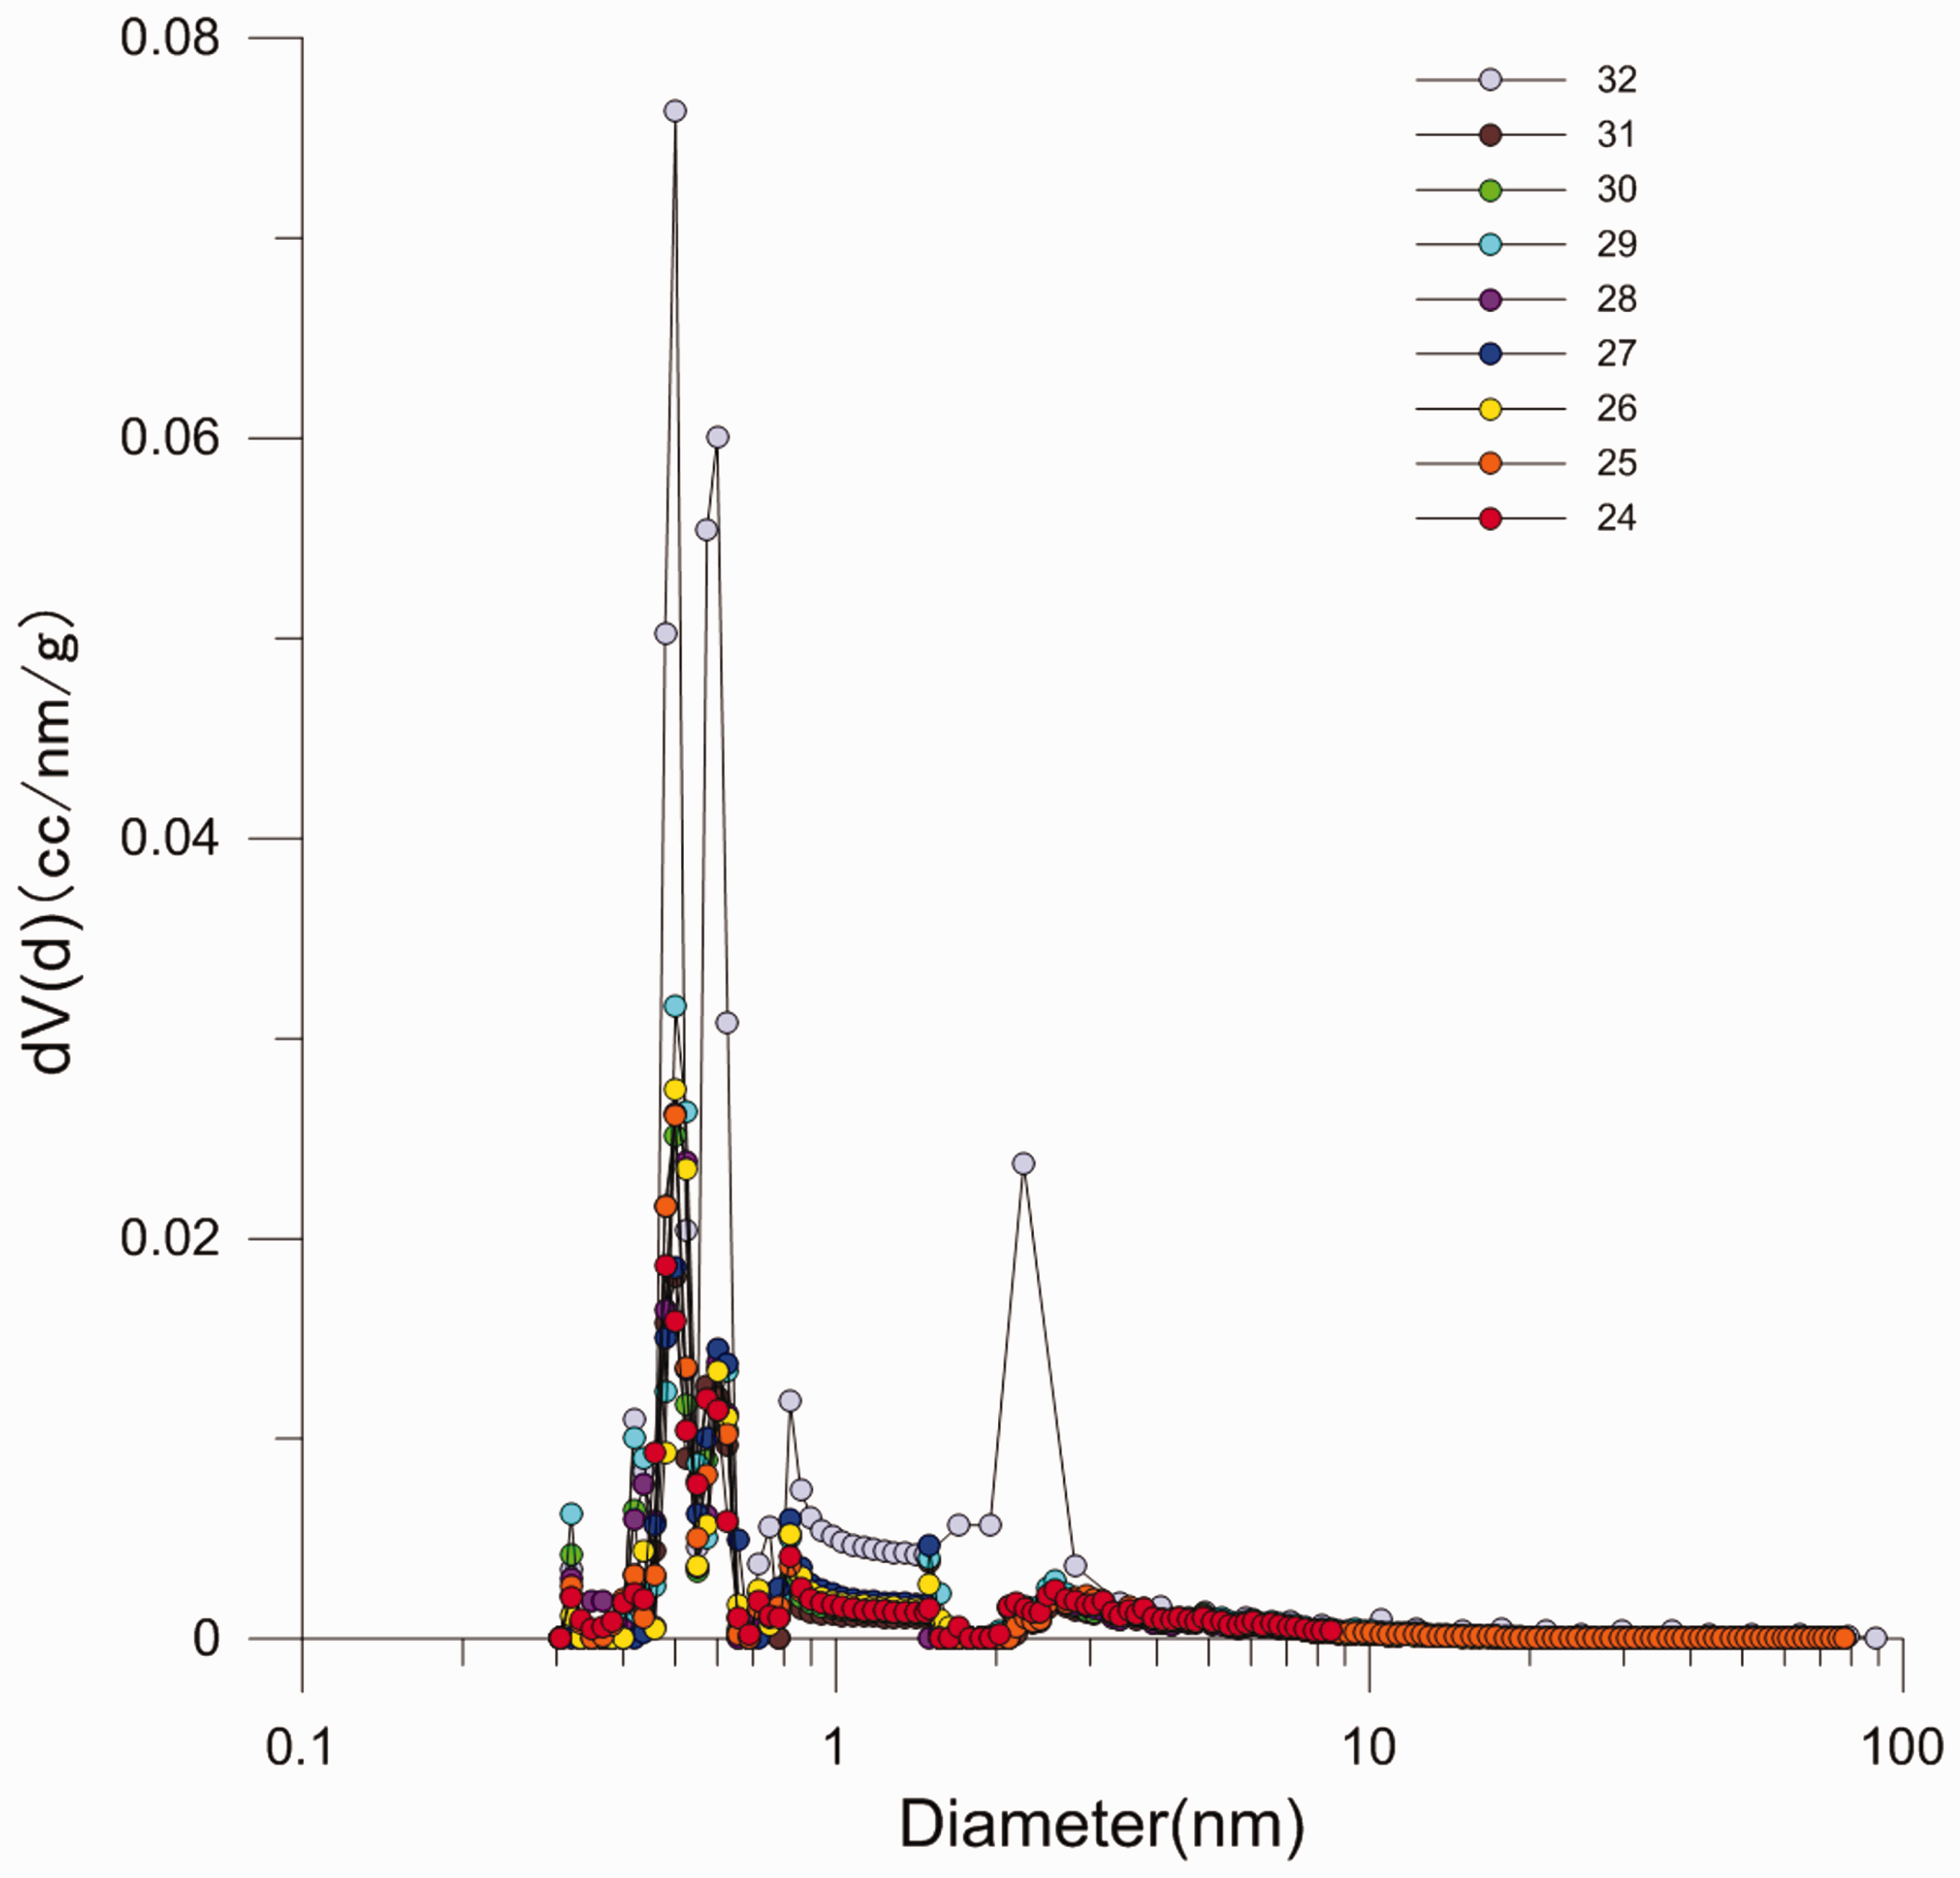
Discussion
Effect of organic matter on pore volume and surface area
Results illustrate that TOC is the chief factor to control pore volume and surface area, presenting obvious positive relationship between BET specific surface area and total pore volume (Figure 13-a,b), with the correlation coefficient of 0.96 and 0.92, respectively. Whereas, mineral contents, like quartz and clay, show no correlation with the surface area and pore volume. As the supreme inner factor, the more TOC, the more surface area and volume will be, providing a physical basis for gas storage and volume, controlling the development of nanometer pores.
Scatter plots of TOC and total gas content versus total pore volume and specific surface area.(a) TOC versus total pore volume presents positive trend; (b) TOC versus total surface area presents positive trend; (c) Total gas content versus total pore volume shows positive trend; (d) Total gas content versus specific surface area shows a positive trend.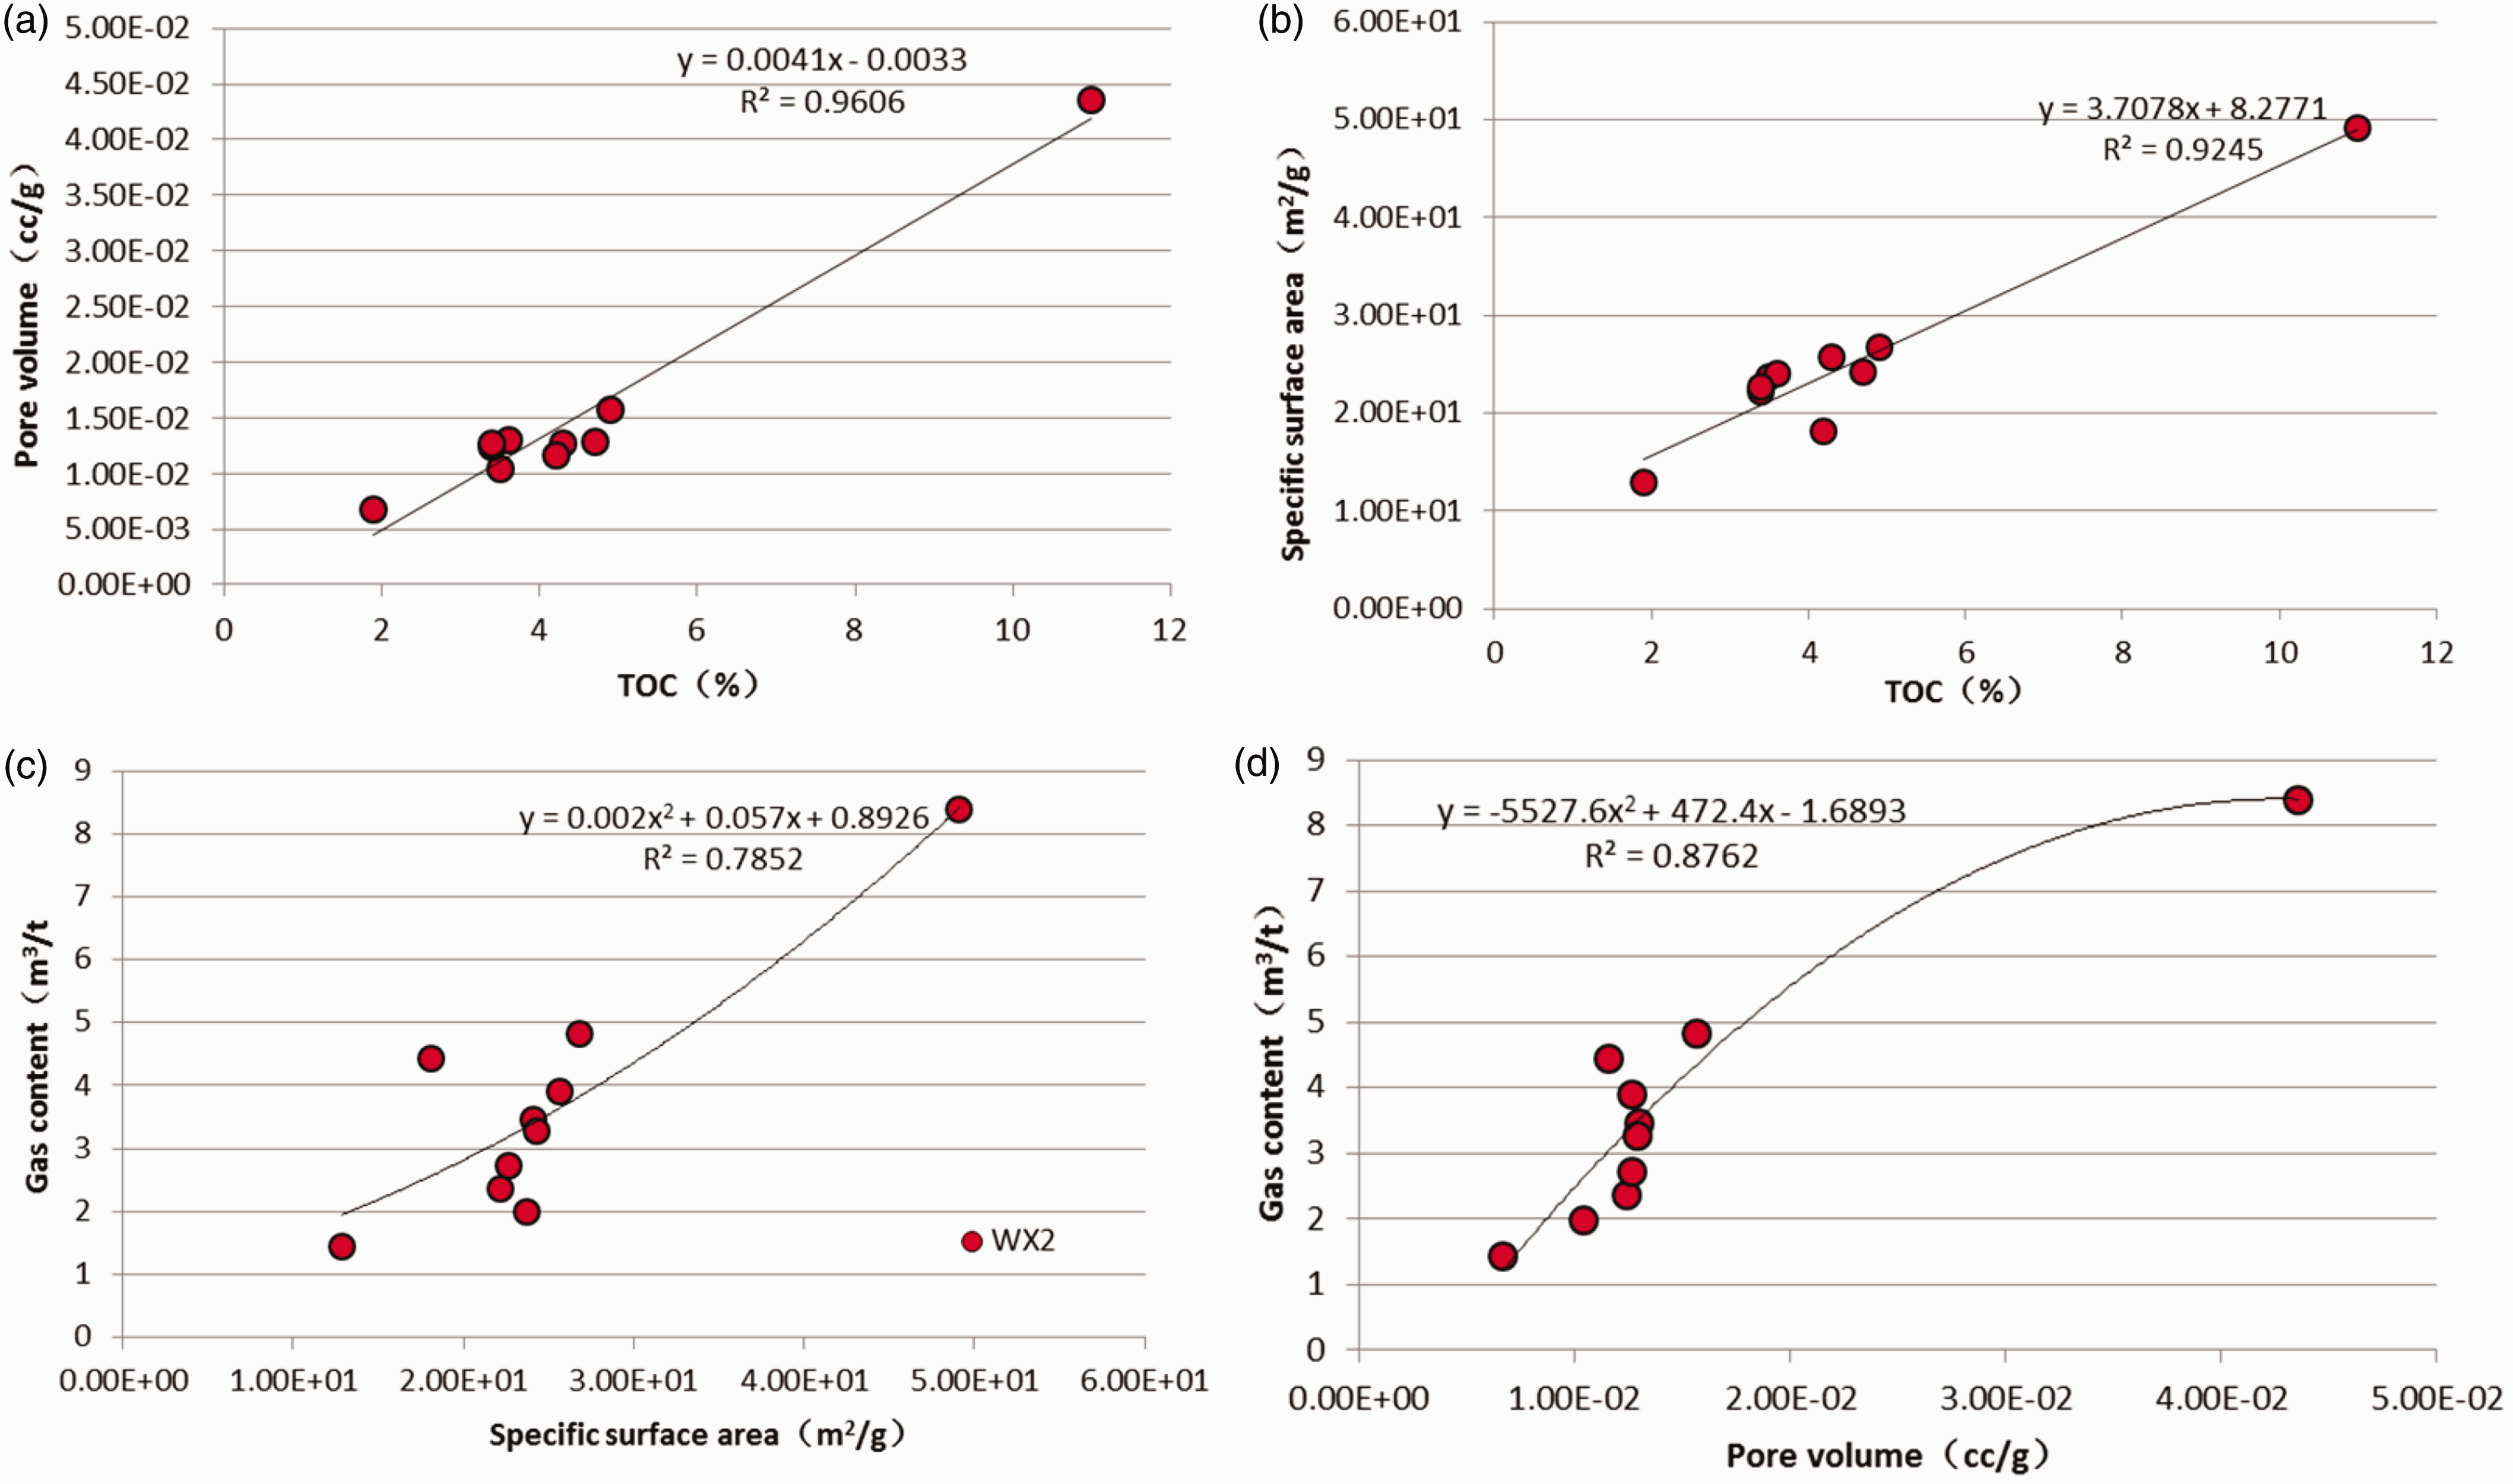
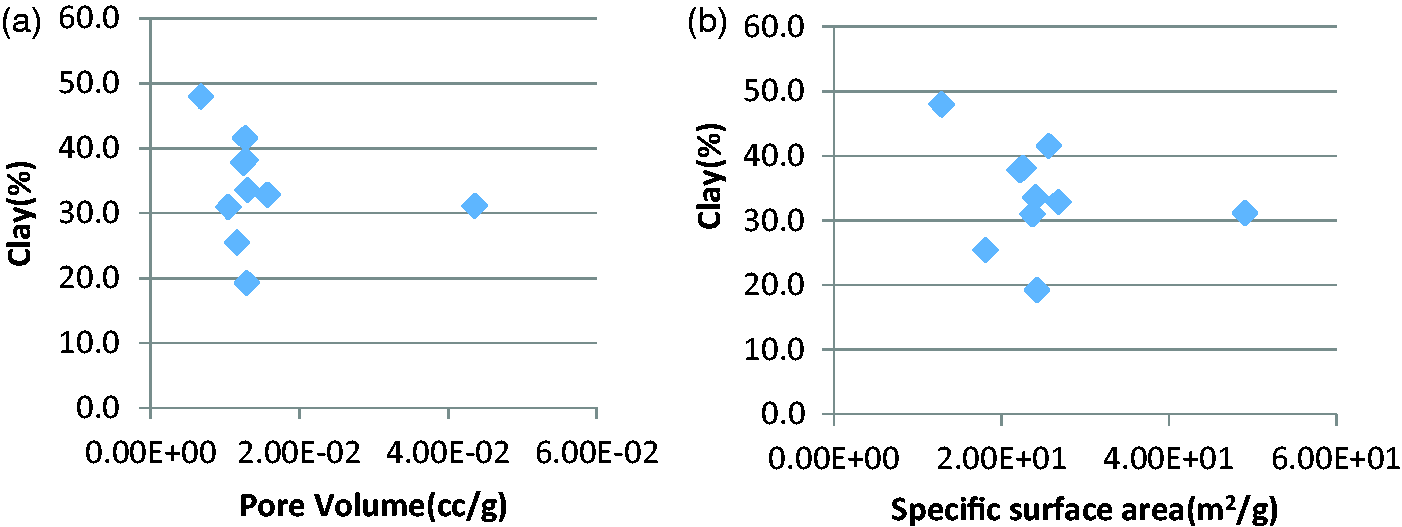
Previous published documents revealed clays usually have relatively higher pore volume and larger specific surface area than brittle minerals (quartz and calcite), and differential clays are featured by differential adsorb availability (Ambrose et al. 2010; Passey et al. 2010; Sondergeld et al. 2010). In this paper, the results between clay versus pore volume and surface area are demonstrated in Figure 14. There seems to be no correlation between them, given that pores associated with clay are relatively negligible compared with OM-hosted pores, which is identical with the analysis of OM-hosted pores dominant observation from FE-SEM pore imaging. Clay content may provide pores spaces with large diameters but could not be measured by N2 adsorption isotherm, which are also important reservoir spaces for gas storage and transportation. The correlations between total gas content versus pore volume and specific surface area demonstrate good positive linear tendency as high TOC led to high gas content and high level of OM-hosted pores existence (Figure 13-c, d).
Controlling factors of vertical variation of pore types Scatter plots of clay versus total pore volume and specific surface area. (a) Clay versus pore volume; (b) Clay versus specific surface area.
Heterogeneity within shale leads to substantial differentials in micro-porous vertically and in a plane. Images observed from FE-SEM show that vertically, the proportion of OM-hosted pores follows the upwards decreasing trend of TOC. The lowest Hirnantian shale, with the highest TOC, obtains the highest percentage of OM-hosted pores, whereas, proportion of OM-hosted pores is reduced within lower Rhuddanian shale, and there is continuous reduction in the upper Aeronian shale with higher percentage of mineral-hosted pores. Besides the variation of pore types, pore diameters from FE-SEM images also present heterogeneity vertically, following the tendency of porosity. The lowest part of Hirnantian shale suggests the largest diameter, 5–300 nm, decreasing upwards, primarily with OM-hosted pores, presenting the dominant controlling factor of TOC to porosity. Besides, differential lithology also affects the pores types, organic matter-rich siliceous shale and organic matter-rich argillaceous shale within the lower part of shale which seems to occupy more proportion of OM-hosted pores than any other kinds of lithology of upper shale in Aeronian shale.
In plane, pore types are controlled by sedimentary facies. The OM-hosted pores are more prevalent in deep shelf facies, like the lower part within well WX2, than that in shallow shelf facies, like lower part of shale in Weiyuan area located in the SW of Sichuan Basin. In the siliceous shale lithology of deep shelf facies, there is biogenetic quartz and fewer clay content due to limited detrital debris, contributing to the dominant OM-hosted pores within lower part of WX2 shale. Whereas, due to near Chuanzhong uplift terrigenous provenance, substantial clay of detrital debris and terrigenous clastic quartz led to the multiple layers of limestone and calcite shale within Wufeng Formation and the lower part of Longmaxi Formation, resulting in a high percentage of mineral-hosted pores.
Conclusions
The combined use of X-ray, low-pressure adsorption and FE-SEM imaging of Longmaxi shale reveals significant differences and similarities in complex micro-porous structure, confirming high heterogeneity vertically which in turn affects gas storage and transportation properties. The followings can be concluded:
Pores tend to fall into three classes by FE-SEM: organic matter-hosted pores, mineral-hosted pores and micro-structures. Eleven subclasses have been recognized: dominant OM-hosted pores including simple and complex pores; mineral-hosted pores cover intraP pores or interP. The intra-fossil pores, and dissolution-related pores are within intraP pores, while inter-mineral pores, clay-hosted pores, and inter-crystalline pores are contained in interP-pores. Micro-fractures include inter-minerals and inter-OM. Shale is primarily composed of varying amounts of clay, quartz, kerogen, carbonate, and pyrite by XRD results. Pore size distributions obtained from N2 and CO2 adsorption analysis reveal bimodal in two diameter sections, 0.3–1 nm and 2–5 nm, showing meso-pores play an important role in pore volume, whereas the micro-pores have great influence on pore specific surface area. As the dominant controlling factor of pore size distribution and total volume, TOC influences pore types vertically, with the proportion of OM-hosted pores following the decreasing upwards tendency of TOC. In plane, pore types are controlled by sedimentary facies. The OM-hosted pores are more prevalent in deep shelf facies within the lower part of shale than the upper formation.
Footnotes
Acknowledgments
This research is funded by the National Science and Technology Major Project of the Ministry of Science and Technology of China (Project No. 2017ZX05035).
Declaration of conflicting interests
The author(s) declared no potential conflicts of interest with respect to the research, authorship, and/or publication of this article.
Funding
The author(s) received no financial support for the research, authorship, and/or publication of this article.