
Abstract
The electrical conversion efficiency of the monocrystalline photovoltaic module is adversely affected due to the higher temperature of the solar cells. Therefore, cooling technologies to remove the excess heat generated by the photovoltaic modules play a vital role to enhance its output. In this article, thermal management of the conventional monocrystalline photovoltaic modules using phase change material has been experimentally evaluated. Phase change material with a melting point of 30°C to 32°C was encapsulated in the aluminium tubes that were 500 mm long having 19 mm inner diameter. Phase change material-filled tubes were attached to the rear side of the photovoltaic module at an equal distance to cover the module area of 0.30 m2. The total mass of the phase change material used in the current experimental study was 1.0 kg. The average temperature of the modified photovoltaic module was 2.4°C to 2.8°C lower than conventional photovoltaic module during sunshine hours. The peak temperature of the conventional photovoltaic panel was lowered from 6°C to 9°C due to the inclusion of phase change material. The electrical conversion efficiency enhanced up to 2.0%. The current configuration of integrating phase change material with photovoltaic modules was observed advantageous as it assisted in enhancing the natural convection from the back of the photovoltaic module rather suppressing. An energy balance showing the trend of energy losses from conventional photovoltaic and photovoltaic with phase change material is also presented and discussed.
Keywords
Introduction and background
The efficiency of the silicon photovoltaic (PV) module is adversely affected due to the rise in its operating temperature (Islam et al., 2016). It is reported that 1K rise in the surface temperature of the PV cell above standard testing conditions, the electrical conversion efficiency generally decreases by 0.08% to 0.1% and the power output decreases by 0.45% (Browne et al., 2015). In this scenario, cooling technologies to remove the unwanted heat generated by the PV modules play a vital role. Many researchers around the globe are working on the thermal management of the PV modules not only to improve the photoelectric conversion efficiency but also to enhance the working life of the PV modules that can be adversely affected due to high temperature (Bahaidarah et al., 2016; Chow, 2010). Various active and passive cooling techniques have been adopted to remove the excess heat from PV modules. In active approaches, which have been widely studied, excess heat from the PV modules is removed by circulating air or water through PV modules (Aste et al., 2008; Joshi & Tiwari, 2007; Popovici et al., 2016). Active systems are observed efficient in removing excess heat from the PV module leading to enhanced photoelectric conversion efficiency compared to the passive systems. In active systems, heat collected by the coolant (air or water) from PV modules may be utilized in other thermal energy applications such as water heating, space heating, and so on. However, active techniques consume additional energy to keep the heat transfer fluid flowing thus surpassing the energy saved due to PV cooling. System maintenance and overall cost are also observed key issues with active techniques (Ma et al., 2015). On the other hand, passive cooling systems are based on the techniques that do not use pumps or blower for the circulation of coolant through PV modules rather depend on natural convection, conduction, and radiation heat transfer mechanisms. The main advantage of using passive cooling techniques is that they do not require any parasitic energy for their operation, and the maintenance cost is either zero or very low. Cooling down PV modules by utilizing the phase change materials (PCMs) is one of the passive techniques that have attracted many researchers in the recent years. PCMs absorb and release a large amount of thermal energy in the form of latent heat at certain phase change temperature without using any moving part and parasitic energy from PV module.
Very first study on the integration of conventional PV module with PCM was conducted by Huang et al. (2004) in which a 2-D numerical model was developed to study the effectiveness of PCM in keeping down the PV surface temperature. The numerical results were further validated by the series of small-scale experiments. The operating temperature of the PV module was reduced up to 10°C and 20°C using PCM having a melting point of 32°C. PCM was encapsulated in a rectangular container having the thickness of 20 mm and 30 mm. Keeping in view the low thermal conductivity of the PCM, Huang et al. (2006) also used internal fins in the PCM container for rapid dissipation of the heat to and from PCM. It was observed that by using the internal metal fins in PCM container the temperature rise of the conventional PV module can be reduced by more than 30°C. Temperature distribution on the surface of the photovoltaic with phase change material (PV-PCM) system was observed more uniform compared to the PV-PCM system without fins. However, the overall weight of the PV module was very high with metal fins. Instead of using internal fins, a PV-PCM system in which metallic fins were attached to the PCM container externally was studied by Atkin and Farid (2015). Graphite was mixed with PCM to increase the overall thermal conductivity of the organic PCM. The overall efficiency of the PV module increased by 12.8% with graphite-mixed PCM capsulated in a container with external fins. PV-PCM with external fins reduced the peak temperature of the PV module from 77.5°C to 61°C. Mass of the PCM used by Atkin and Farid (2015) was 22 kg per m2 of PV area. Hasan et al. (2010) conducted a series of experiments to study the effect of PCM on PV module temperature using different types of PCM (organic and inorganic). It was concluded that inorganic PCM, CaCl2·6H2O having a melting point of 29°C kept PV temperature 10°C lower for 5 h under 1000 W/m2 while inorganic PCM (RT20) with a melting point of ∼21°C was able to provide a temperature difference of 10°C for only 1.8 h under 1000 W/m2. During the experiment, PCM was encapsulated in aluminium container and the total mass of the PCM was 38 kg per m2 of PV area. Hasan et al. (2015) also compared the performance of PV-PCM systems in different climatic conditions. Climates selected for the experimental study were dry-hot climatic conditions (Pakistan) and cooler European climatic conditions (Ireland). Two PCMs with a melting point of 29°C and 22°C were encapsulated in separate rectangular containers having internal dimensions of 600 mm × 700 mm × 40 mm. PCM effect on PV temperature was more profound and dominant in hot climate compared to the cooler climate. The peak temperature of the PV in the hot climate was reduced from 63°C to 46°C and 42°C by PCM1 (Tm = 22°C) and PCM2 (Tm = 29°C), respectively. While in a cooler climate, it was reduced from 49°C to 43°C by PCM1 and 39°C by PCM2. PV power enhanced up to ∼13% and 5% in hot climate and cool climate, respectively. Financial benefits and payback period were observed more satisfactory in hot climate compared to cool climate (Hasan et al., 2014). The total mass of the PCM used for the thermal regulation of the PV module was ∼48 kg per m2 of PV area (Hasan et al., 2014). Hachem et al. (2017) conducted an experimental study to observe the effect of the PCM mixed with metal additives on the thermal performance of the PV module. It was observed that conventional PCM reduced the temperature of PV up to 6.5°C with an average of 2.7°C. The electrical conversion efficiency was enhanced up to 2.0%. Altered PCM, mixed with 20% copper and 10% graphite, reduced the peak temperature of the PV module up to 6.3°C with an average of 5.6°C. Electrical output was increased by an average of 5.8%. The maximum reduction of ∼32°C in the surface temperature of the conventional PV module was achieved by Stropnik and Stritih (2016). Operating temperature of the conventional PV module was reduced from 75.5°C to 44°C due to the addition of PCM. Stropnik and Stritih (2016) used PCM with a melting point of 28°C and the specific mass of the PCM was 32 kg per m2 of PV area. Japs et al. (2016) reported that PCM enclosed in the rectangular container and attached to the back side of the PV module can suppress the natural convection currents from the PV back surface. This can adversely affect the PV surface temperature and its performance during afternoon time period if PCM is completely melted during the morning session. To avoid such situation, higher quantity of PCM must be used with a rectangular configuration to make sure that the PCM storage is available till late afternoon otherwise expected results may not be achieved. Utilization of PCM is a simple and low-cost method to remove the unwanted heat from the PV module for keeping the electrical conversion efficiency at a satisfactory level (Klugmann-Radziemska & Wcisło-Kucharek, 2017). Hasan et al. (2017) conducted an experimental study in extremely hot environment of the United Arab Emirates to evaluate the energy saving performance of the PV-PCM module. Paraffin-based PCM with melting range of 38°C to 43°C encapsulated in the rectangular container was integrated at the back of the PV panel and its cooling effect is monitored. The modified PV-PCM system enhanced the PV annual electrical energy yield by 5.9% in the hot climatic conditions. Recently conducted study on PV-PCM topic suggested that the PCM melting temperature should be at least 5°C above the ambient temperature otherwise expected results cannot be obtained (Ma et al., 2018).
Above mentioned studies (Atkin & Farid, 2015; Hachem et al., 2017; Hasan et al., 2010, 2014, 2015; Huang et al., 2006; Japs et al., 2016; Klugmann-Radziemska & Wcisło-Kucharek, 2017; Stropnik & Stritih, 2016) clearly show that PCM can be effectively used for the thermal management of the conventional PV module, and the surface temperature of the PV module can be reduced up to 10°C to 20°C. One similarity in all these studies is that a rectangular container of appropriate dimensions is filled with PCM and attached at the back side of the conventional PV module that covers the back side of the PV module fully. The major drawback of rectangular PCM configuration is that it can suppress the natural convention from the back side of the PV surface due to which PV module cannot be cooled down naturally. Also, it was observed that PV-PCM configuration was operating at a higher temperature compared to the conventional PV system during the afternoon time period as reported by Japs et al. (2016). It has been observed in all previous studies that ∼25 to 40 kg of PCM per meter square of the PV area has been used to effectively cool down the PV module. Such a high quantity of PCM can make PV modules more expensive. Also, a PV-PCM module with current configuration may be 40% to 50% heavier compared to the conventional PV module. Such heavy modules may consume extra cost during their installation time period due to heavy and more stable mounting structure. This will collectively affect the overall cost and of the PV-PCM modules.
In the current research, a novel configuration to integrate PCM with conventional PV module has been proposed, investigated, and analyzed. PCM is filled in the tubes made of aluminium having an internal diameter of 19 mm sealed with silicone plugs. PCM-filled tubes are attached to the back side of the PV module using thermal adhesive. The main aim of using tube-based configuration is to enhance the natural convention from the back of the PV module which was observed suppressed in rectangular-shaped containers in the previous studies. It is also expected that aluminium tubes will act as fins and assist in enhancing the convection heat transfer from the PV module which is not addressed in the previous studies. To study the thermal and electrical behavior of the PCM-filled aluminium tubes attached to the back side of the conventional PV module, contents of the current article are arranged in the following manner: Experimental setup and procedure are explained in Section 2 while the experimental results are analyzed and discussed in Section 3. Results of the current study are compared with the already published literature in Section 4 while the future work and conclusions are presented in Section 5.
Experimental setup and procedure
In this section, experimental setup, that is, equipment used along with the procedure adopted to conduct the experiments is discussed in detail. The experimental setup consists of two conventional PV modules of 50 W capacity and monocrystalline type (PVM-50, Dongguan Singfo Solar Technology Co., Ltd.). The overall weight of the conventional PV module was ∼3.5 kg. Physical and electrical properties of the PV modules provided by the manufacturer are tabulated in Table 1. The effective area of the PV module was ∼0.285 m2 with a maximum electrical conversion efficiency of 17.5% at standard testing condition. One conventional PV module was integrated with PCM while the other was kept unchanged. PCM was filled in the tubes made of aluminum, and both ends of the aluminum tube were sealed using the silicon plugs of appropriate dimensions as shown in Figure 1(a). The inner and outer diameter of the tube was 19 mm and 20 mm while the length was 500 mm; 75% of the tube volume was filled with PCM while 25% was kept empty keeping in view the thermal expansion of the PCM. Before adding PCM into the tubes, PCM was heated up to 50°C above its melting temperature. One tube accommodated about 110 ml of the liquid PCM shown in Figure 1(d). PCM-filled tubes were attached to the back surface of the PV module with the help of thermal epoxy. A layer of locally manufactured thermal grease (Figure 1(b)) was placed between the PV surface and tube in order to improve the thermal contact between PV and PCM tube and remove the air gaps that can affect the heat transfer from PV module to PCM. The thermal conductivity of the thermal grease was greater than 5 W/m-K as provided by the manufacturer. The resulting PV module integrated with PCM-filled aluminum tubes and conventional PV module is demonstrated in Figure 1(c). Commercially available PCM of organic nature was used for the current study that was obtained from the local company. Although the thermal conductivity of the organic PCM was low (0.2 W/m-K) than salt hydrate, by using organic PCM there was no risk that it will react with the metal tubes. Peak melting temperature of the PCM was 31°C having the latent heat of 200 kJ/kg. Other thermal and physical properties of the PCM provided by the manufacturing are provided in Table 1 while PCM in the solid state is shown in Figure 1(d).
Properties of the PV module and PCM.
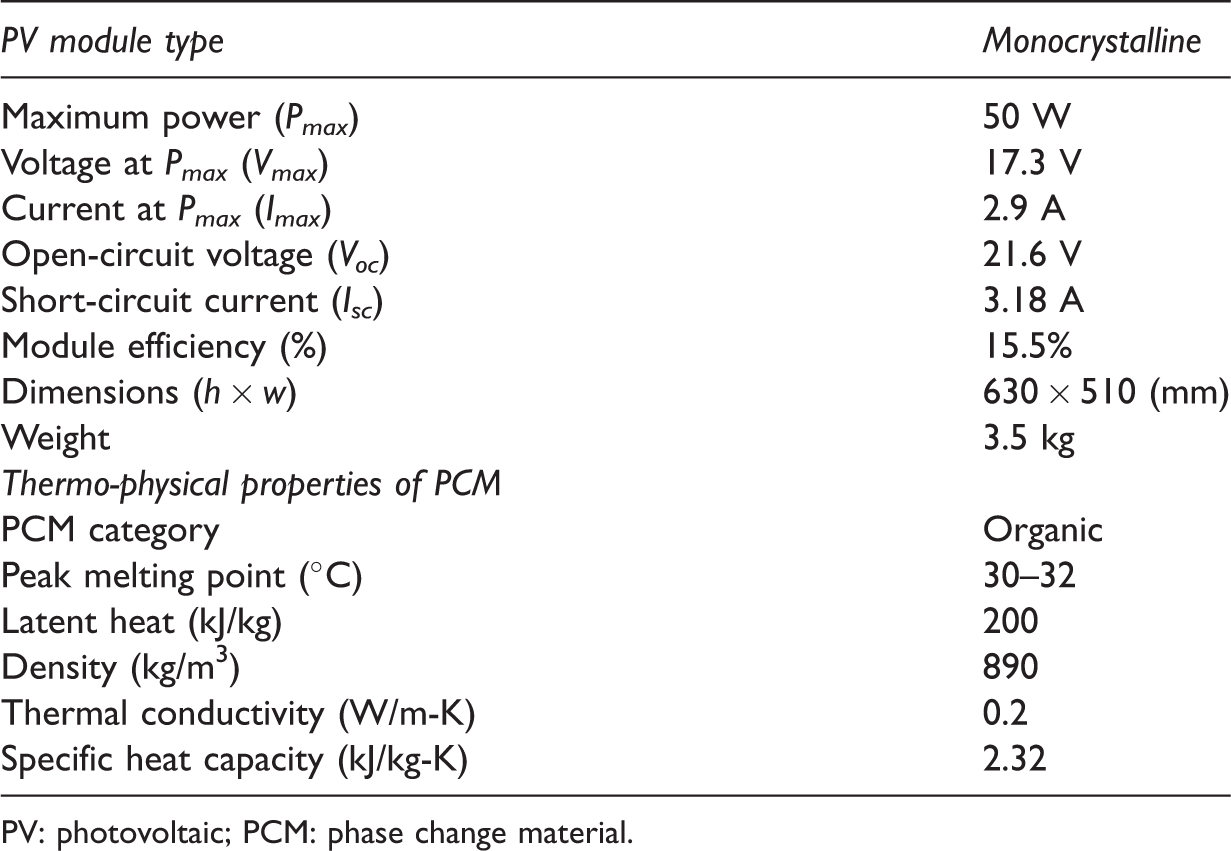
PV: photovoltaic; PCM: phase change material.
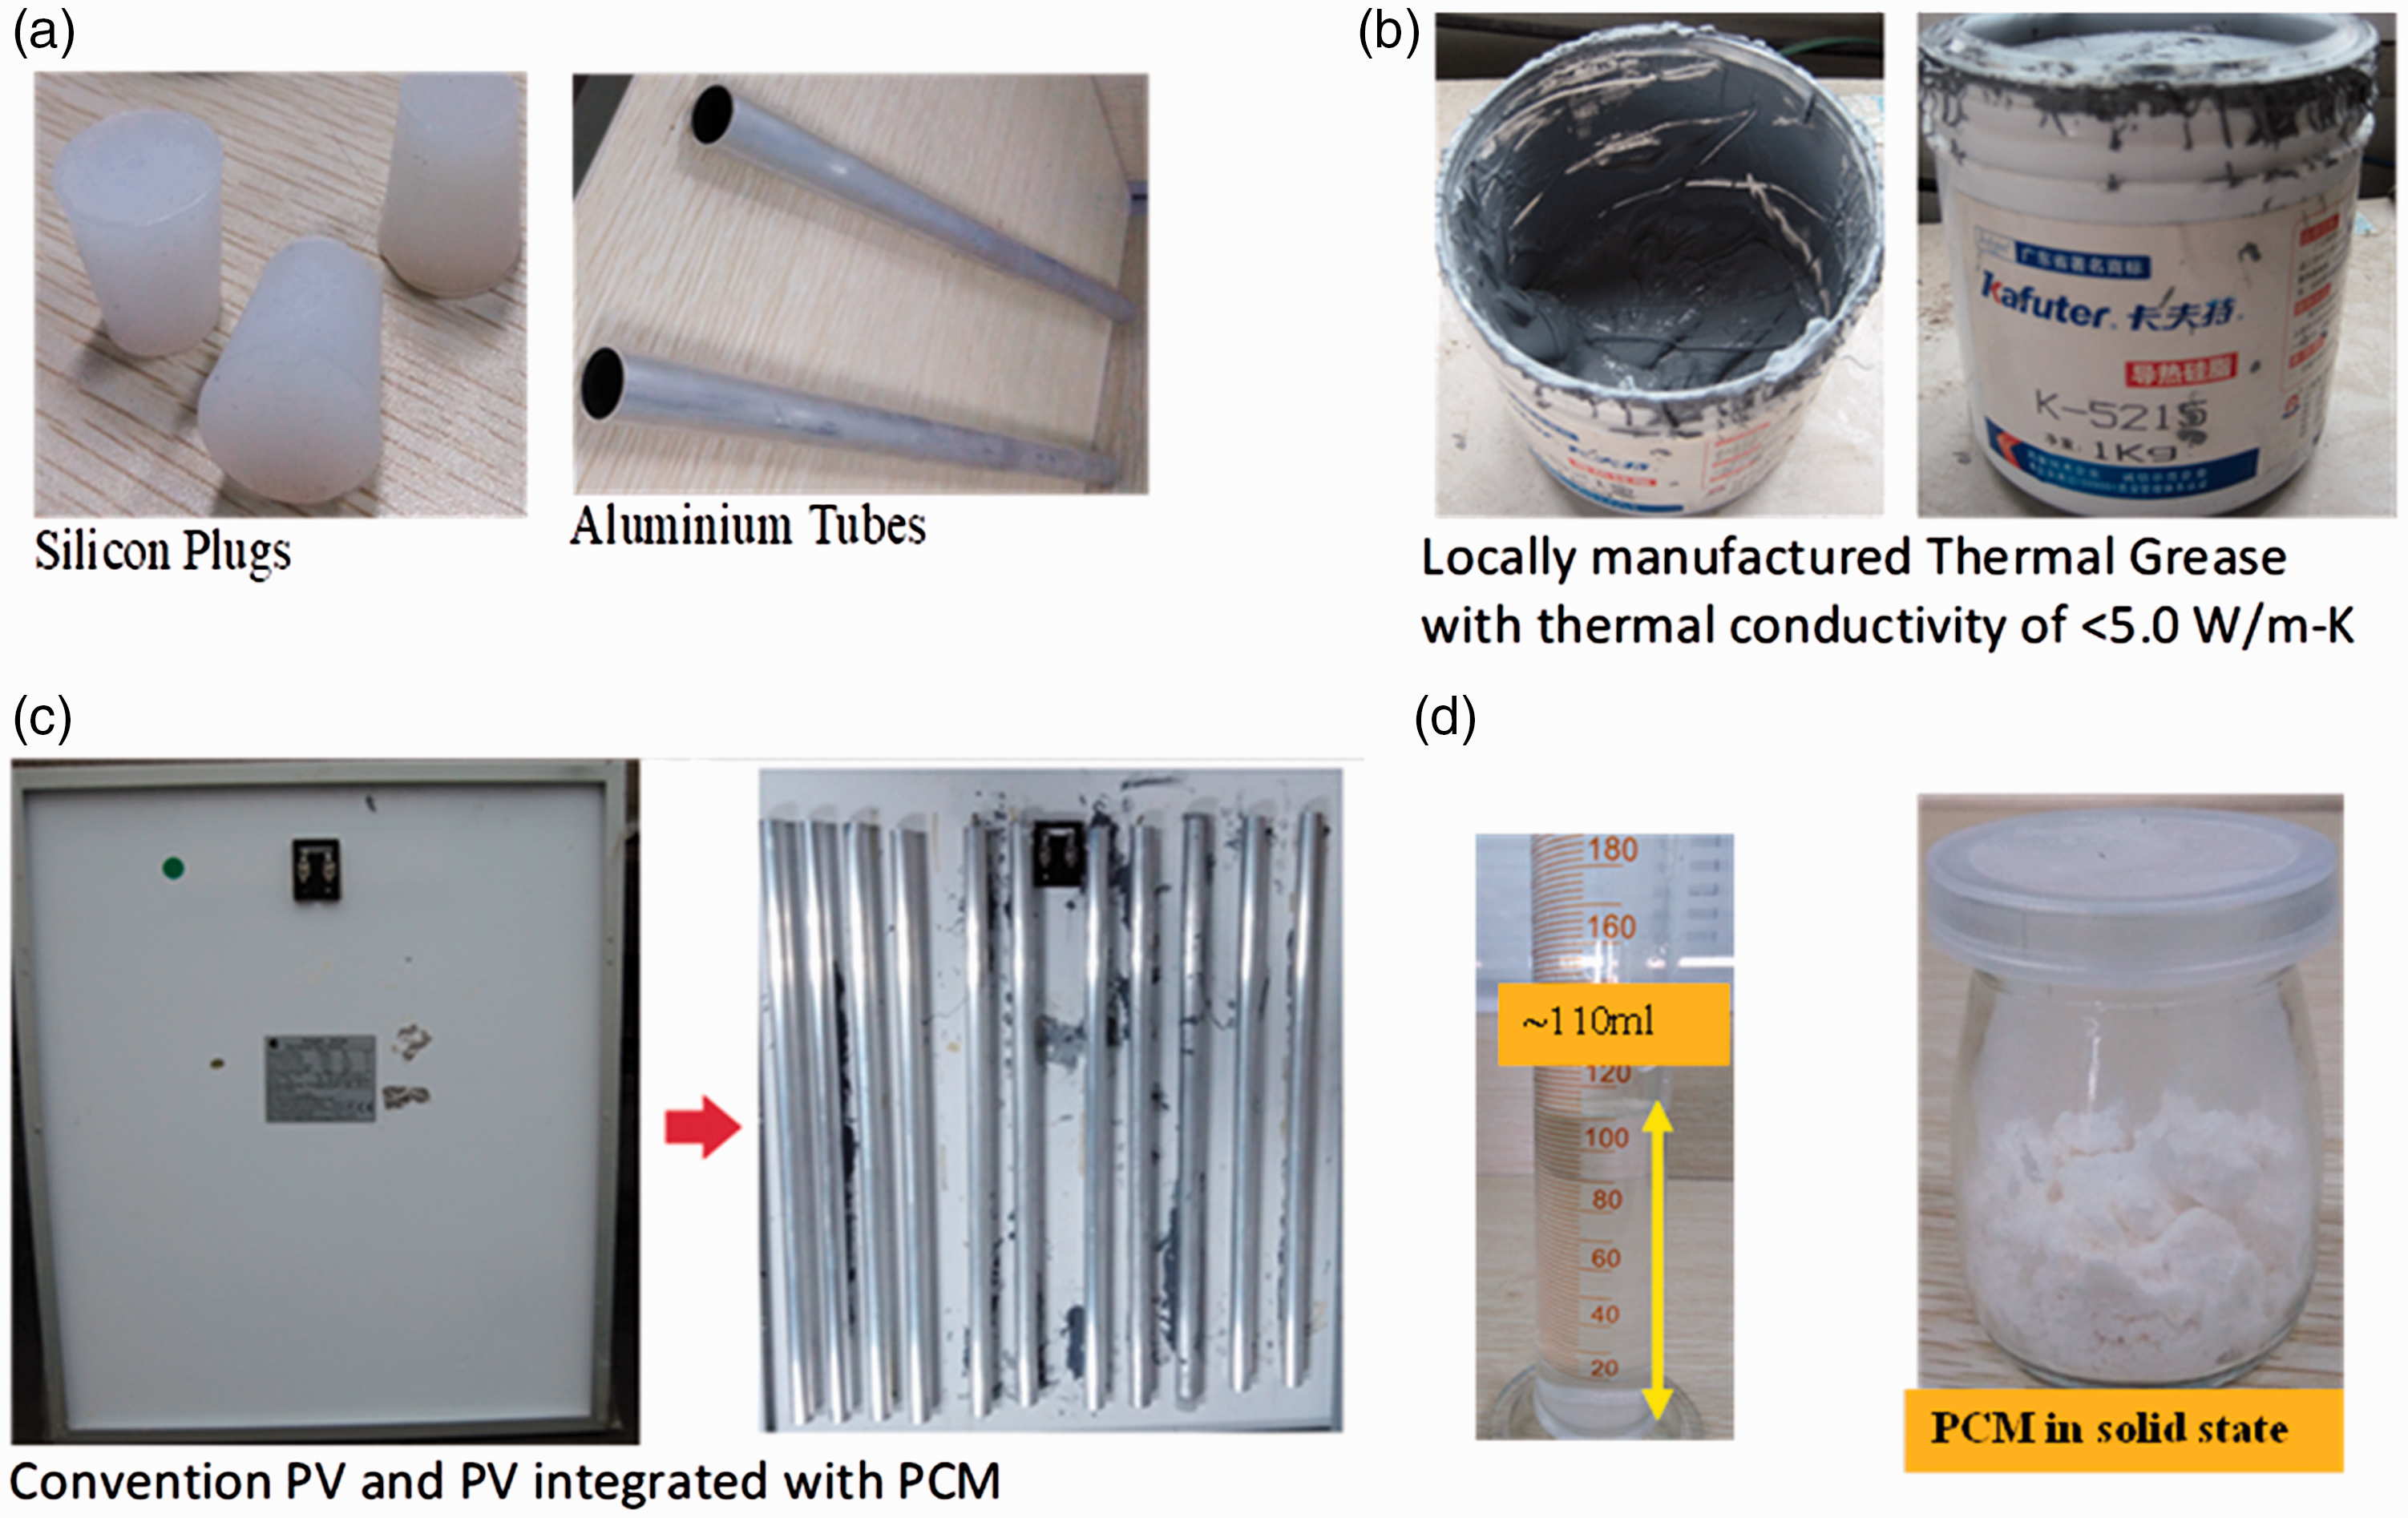
Integration of PV module with PCM-filled aluminium tubes. (a) Silicon plugs along with aluminum tubes. (b) Thermal grease. (c) Conventional PV module and PV-PCM module. (d) PCM volume filled in the tubes. PV: photovoltaic; PCM: phase change material.
Energy storage capability of PV and PV-PCM modules.
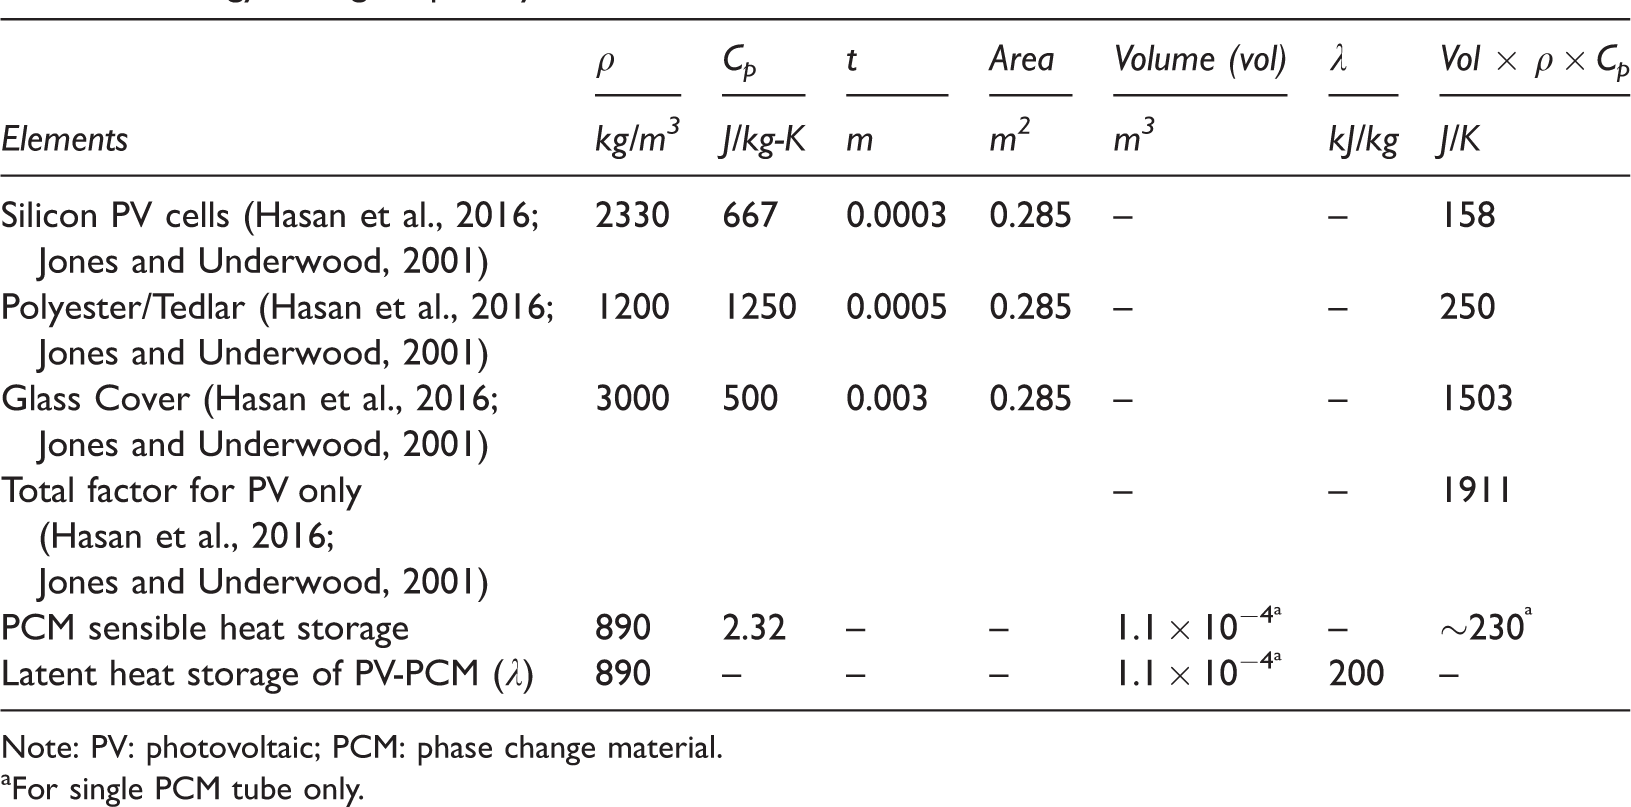
Note: PV: photovoltaic; PCM: phase change material.
For single PCM tube only.
The temperature of PCM and PV modules was measured using the K-type thermocouple. These thermocouples were calibrated in an ice bath with a measurement error of ±0.4°C. The thermocouples were placed at the back and the front surface of both PV modules, inside the tube to measure the PCM temperature, and outside the tube to measure the temperature of the tube at the outer side. Thermocouples at the front and back side of the PV modules were fixed with the help of adhesive tape. All thermocouples were checked continuously to assure the fixation. TBQ-2-B pyranometer was used to measure the solar radiation intensity. Solar radiation and temperature of both PV modules were recorded after every 30 s using 20-channel data acquisition system. The conventional PV module and the PV module integrated with PCM were placed on the roof of the engineering department facing south at an angle equal to the latitude of Hefei-China (31.82° N, 117.2° E) as shown in Figure 2. Experiments were conducted for the two consecutive days on 8th October and 9th October. These two days being clear, warm, bright, cloudless, and relatively calm were chosen for the experiments.
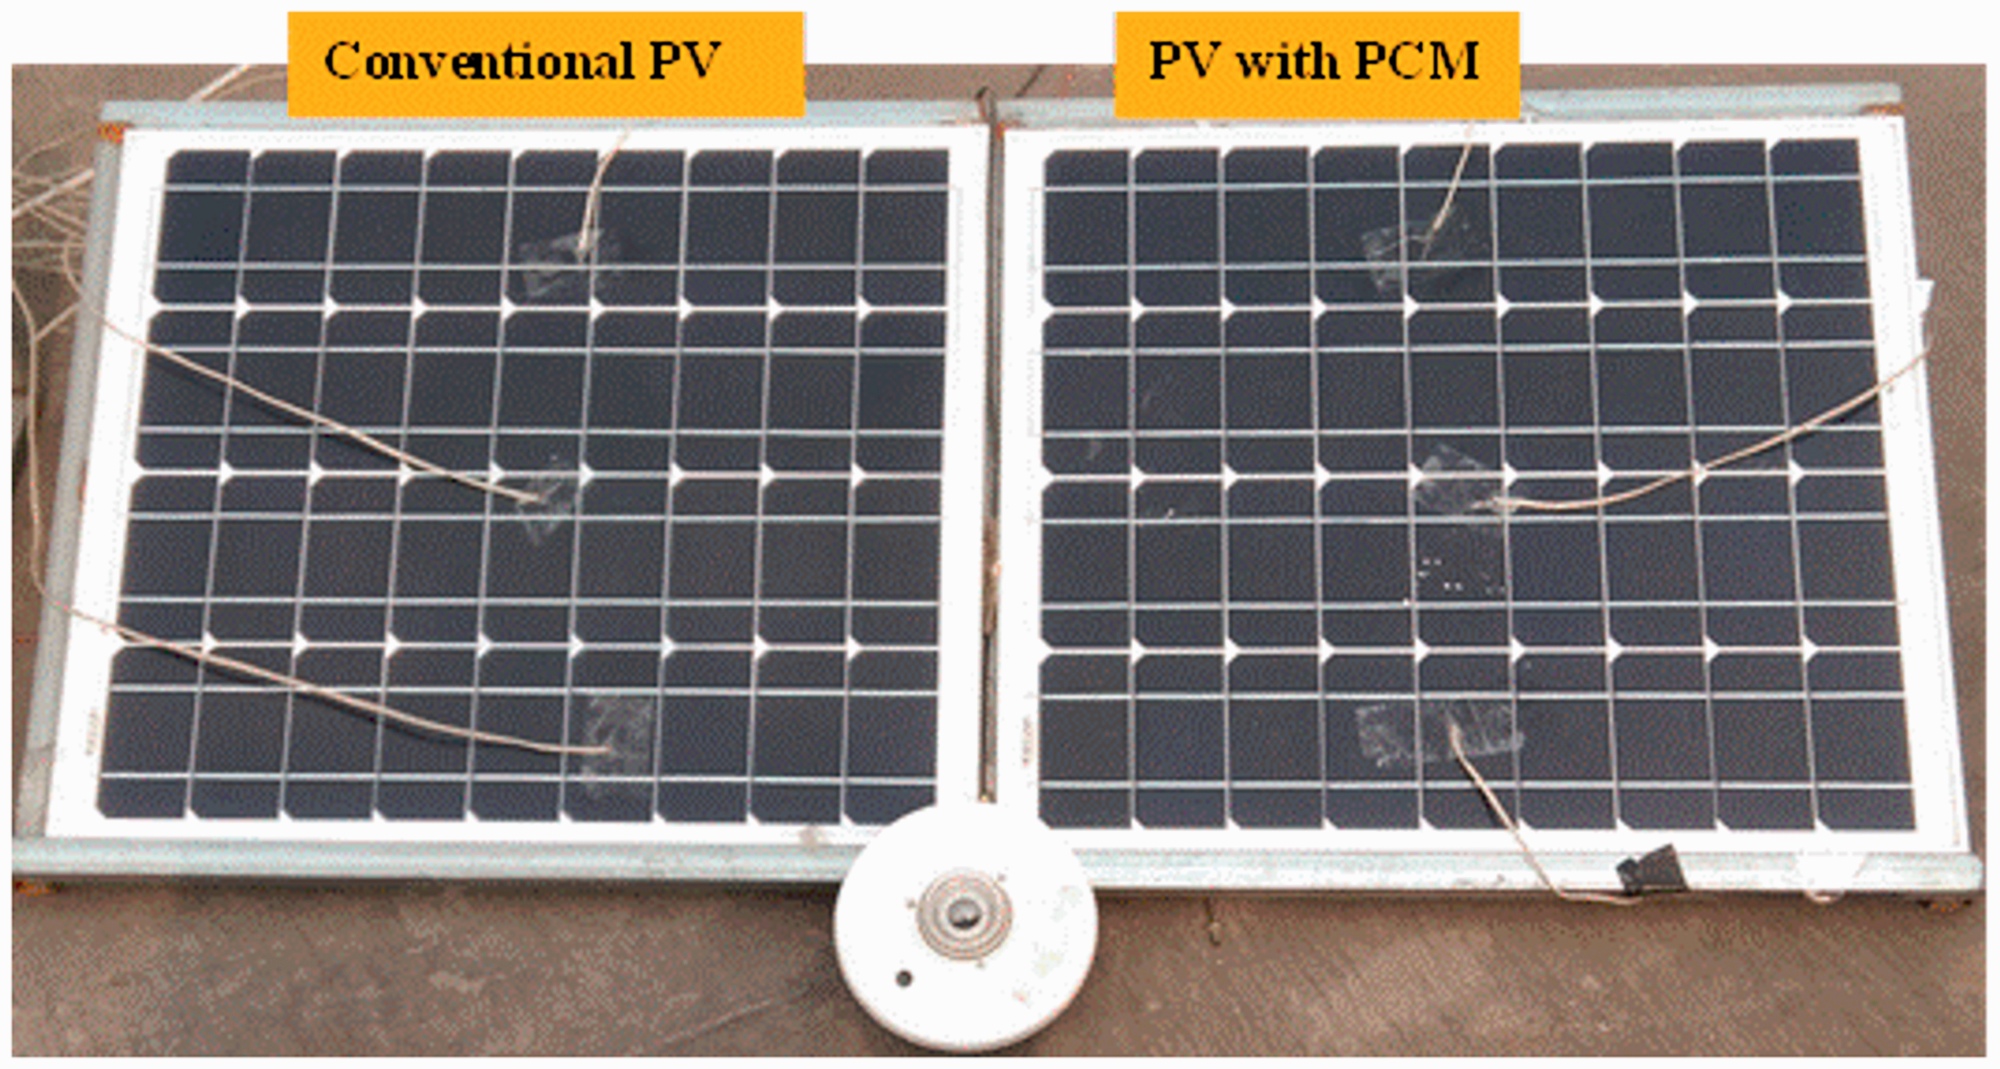
Experimental setup. PV: photovoltaic; PCM: phase change material.
Experimental results: Discussions and analysis
Experimental results are discussed and analyzed in this section. First, the effect of PCM on the temperature of the front and back surface of the PV module is analyzed and discussed. Afterward, the effect of temperature on the efficiency of the PV module and energy generation is discussed. In the end, the detailed energy balance of both PV modules is conducted and discussed to analyze the heat losses from both PV modules.
Weather data
Weather data for the experimental days including solar radiation, ambient temperature, and wind speed are shown in Figure 3. Solar radiation data were collected using pyranometer while the ambient temperature was recorded using thermocouple placed under shade. Wind speed data were collected from meteorological weather center of the university. Solar radiation during both experimental days was as high as 980 W/m2 without any significant fluctuation. Average solar radiation during day 1 (7:00–16:00) was 686 W/m2 while during day 2 (7:00–16:00) average solar radiation was 685 W/m2. So there was not so significant difference in the solar radiation falling on the PV surface during both days. Ambient temperature was observed as high as ∼34°C and as low as 20°C to 22°C during both experimental days. From solar radiation data and ambient temperature, it can be seen that it was very clear, sunny, and a hot day. Wind speed was observed little bit higher during day 1 compared to day 2. During day 1, average wind speed was 3.33 m/s while during day 2 it was 2.67 from 7:00 till 16:00. Therefore, the experimental day 1 was a little bit windy while day 2 was a very calm day without any overcast conditions.
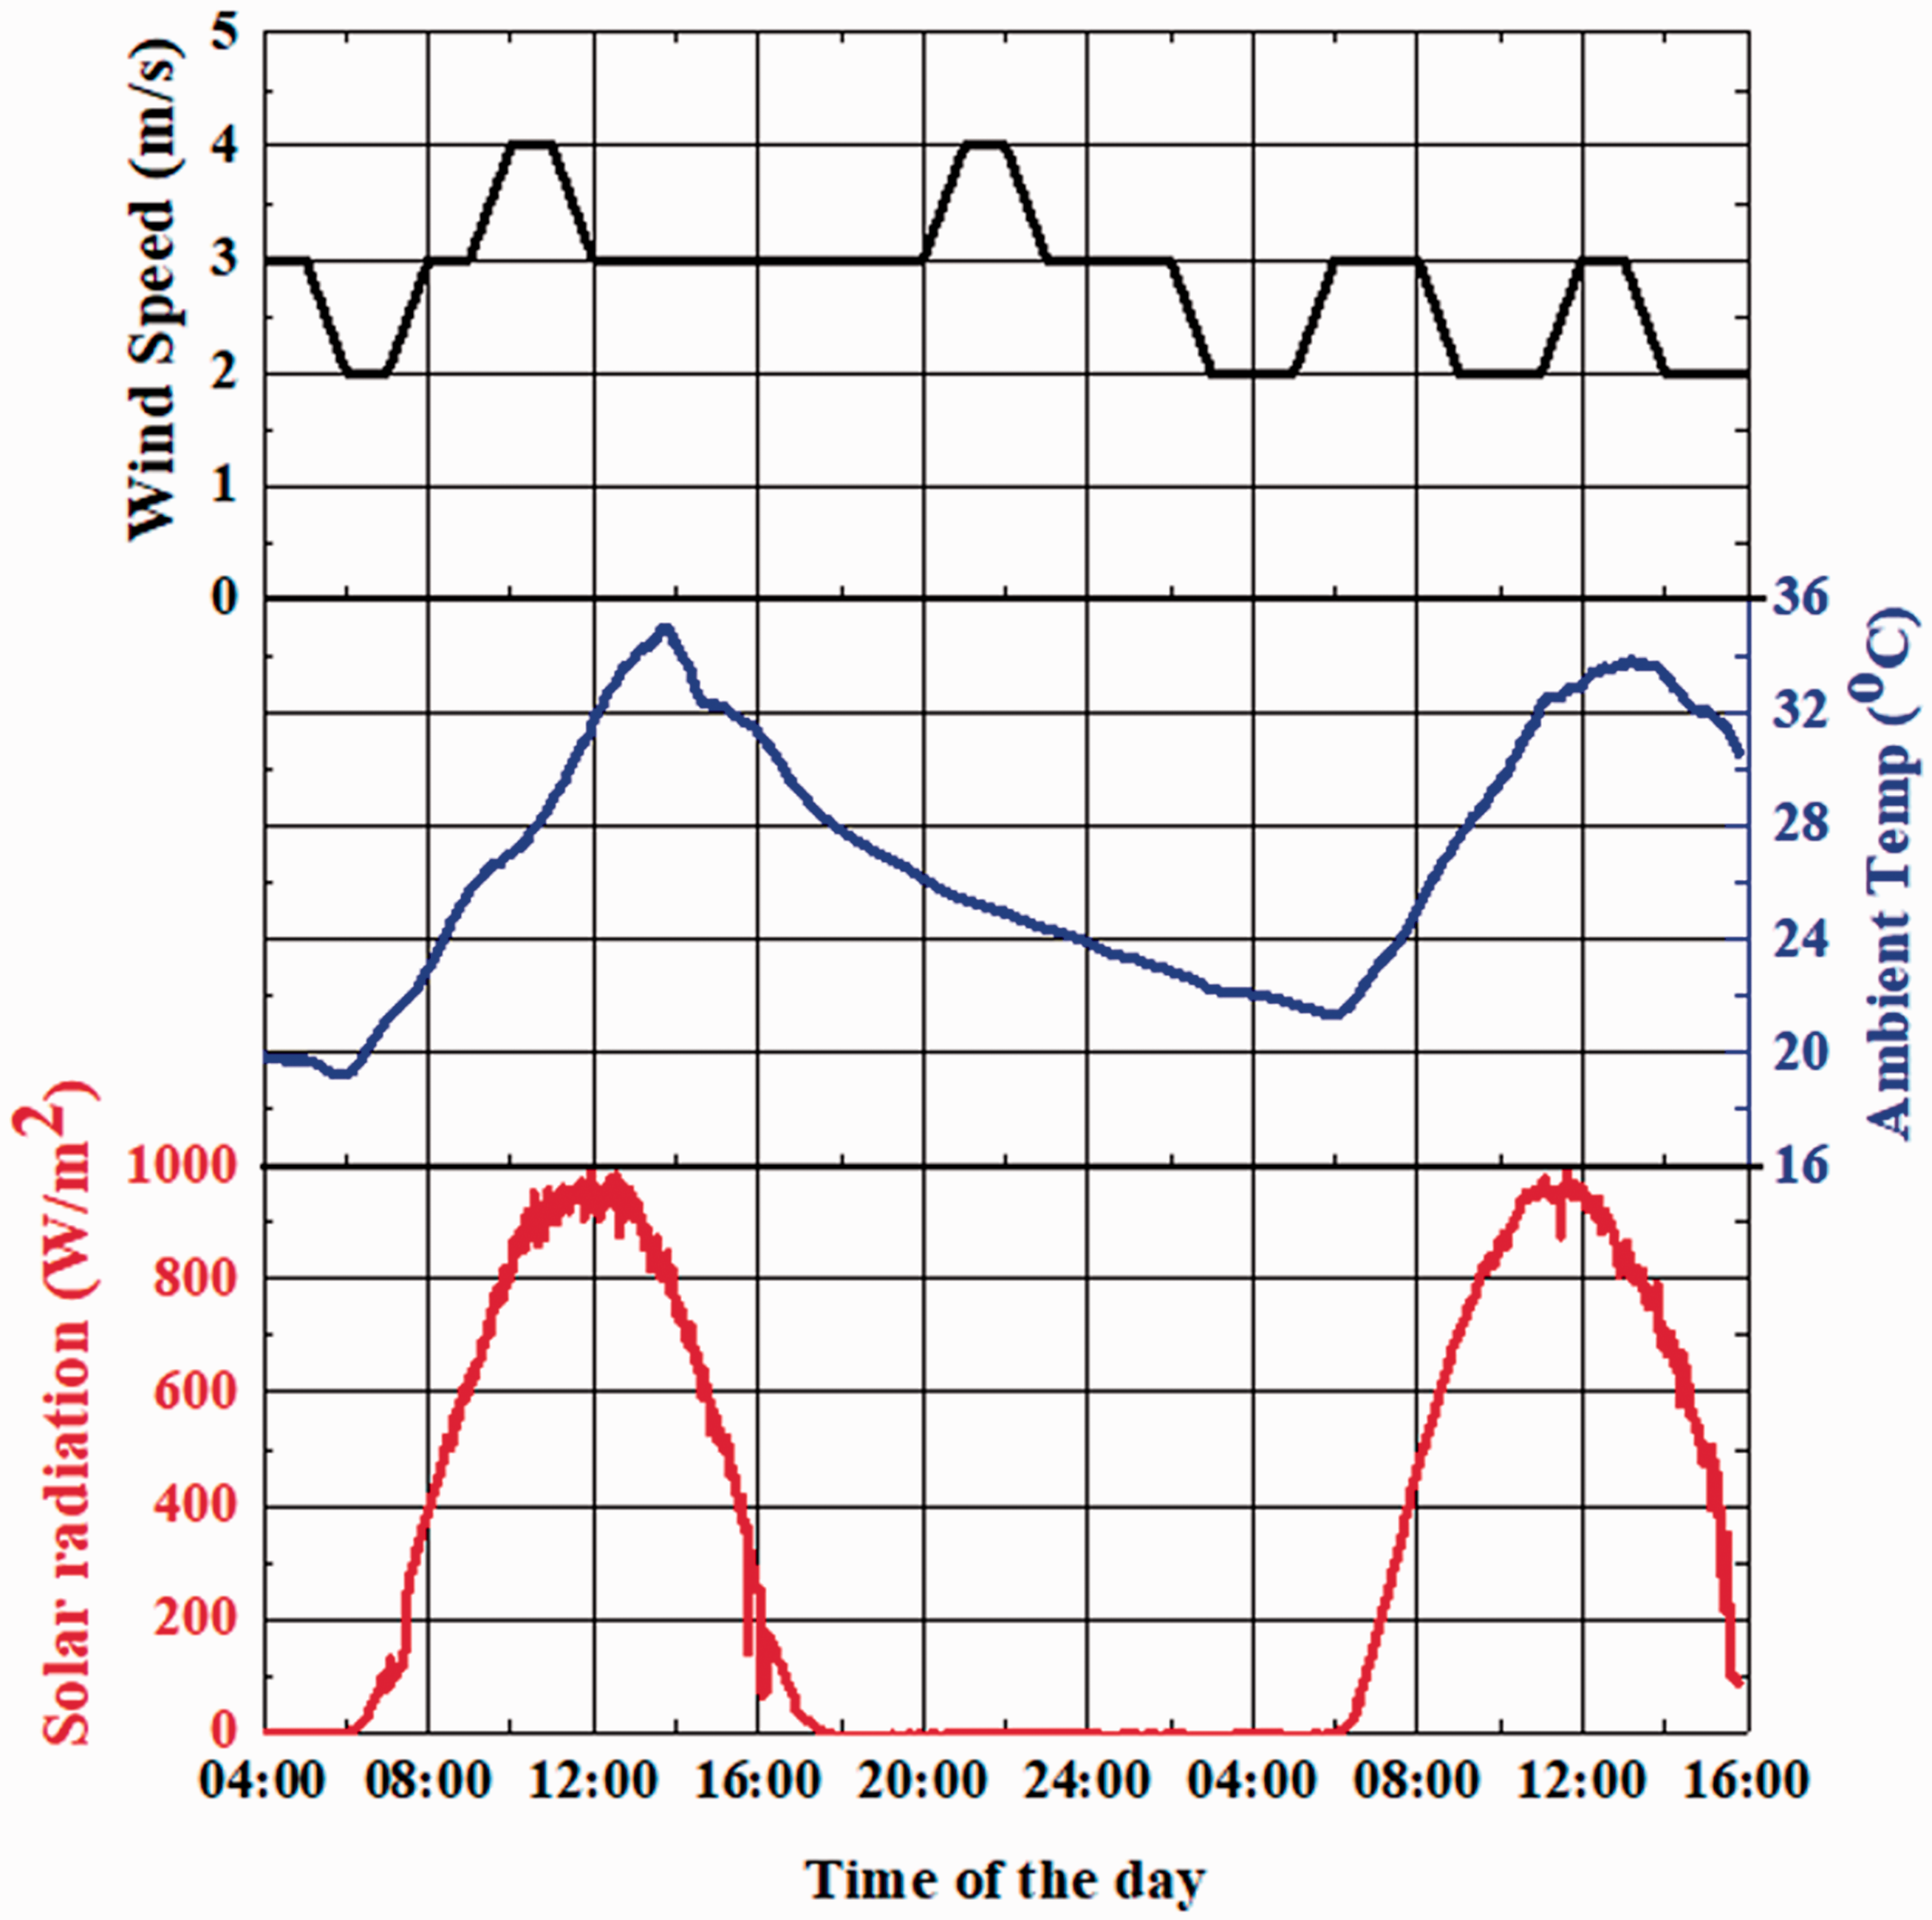
Ambient conditions during the experimental time period.
Effect of PCM on the front surface temperature of the PV module
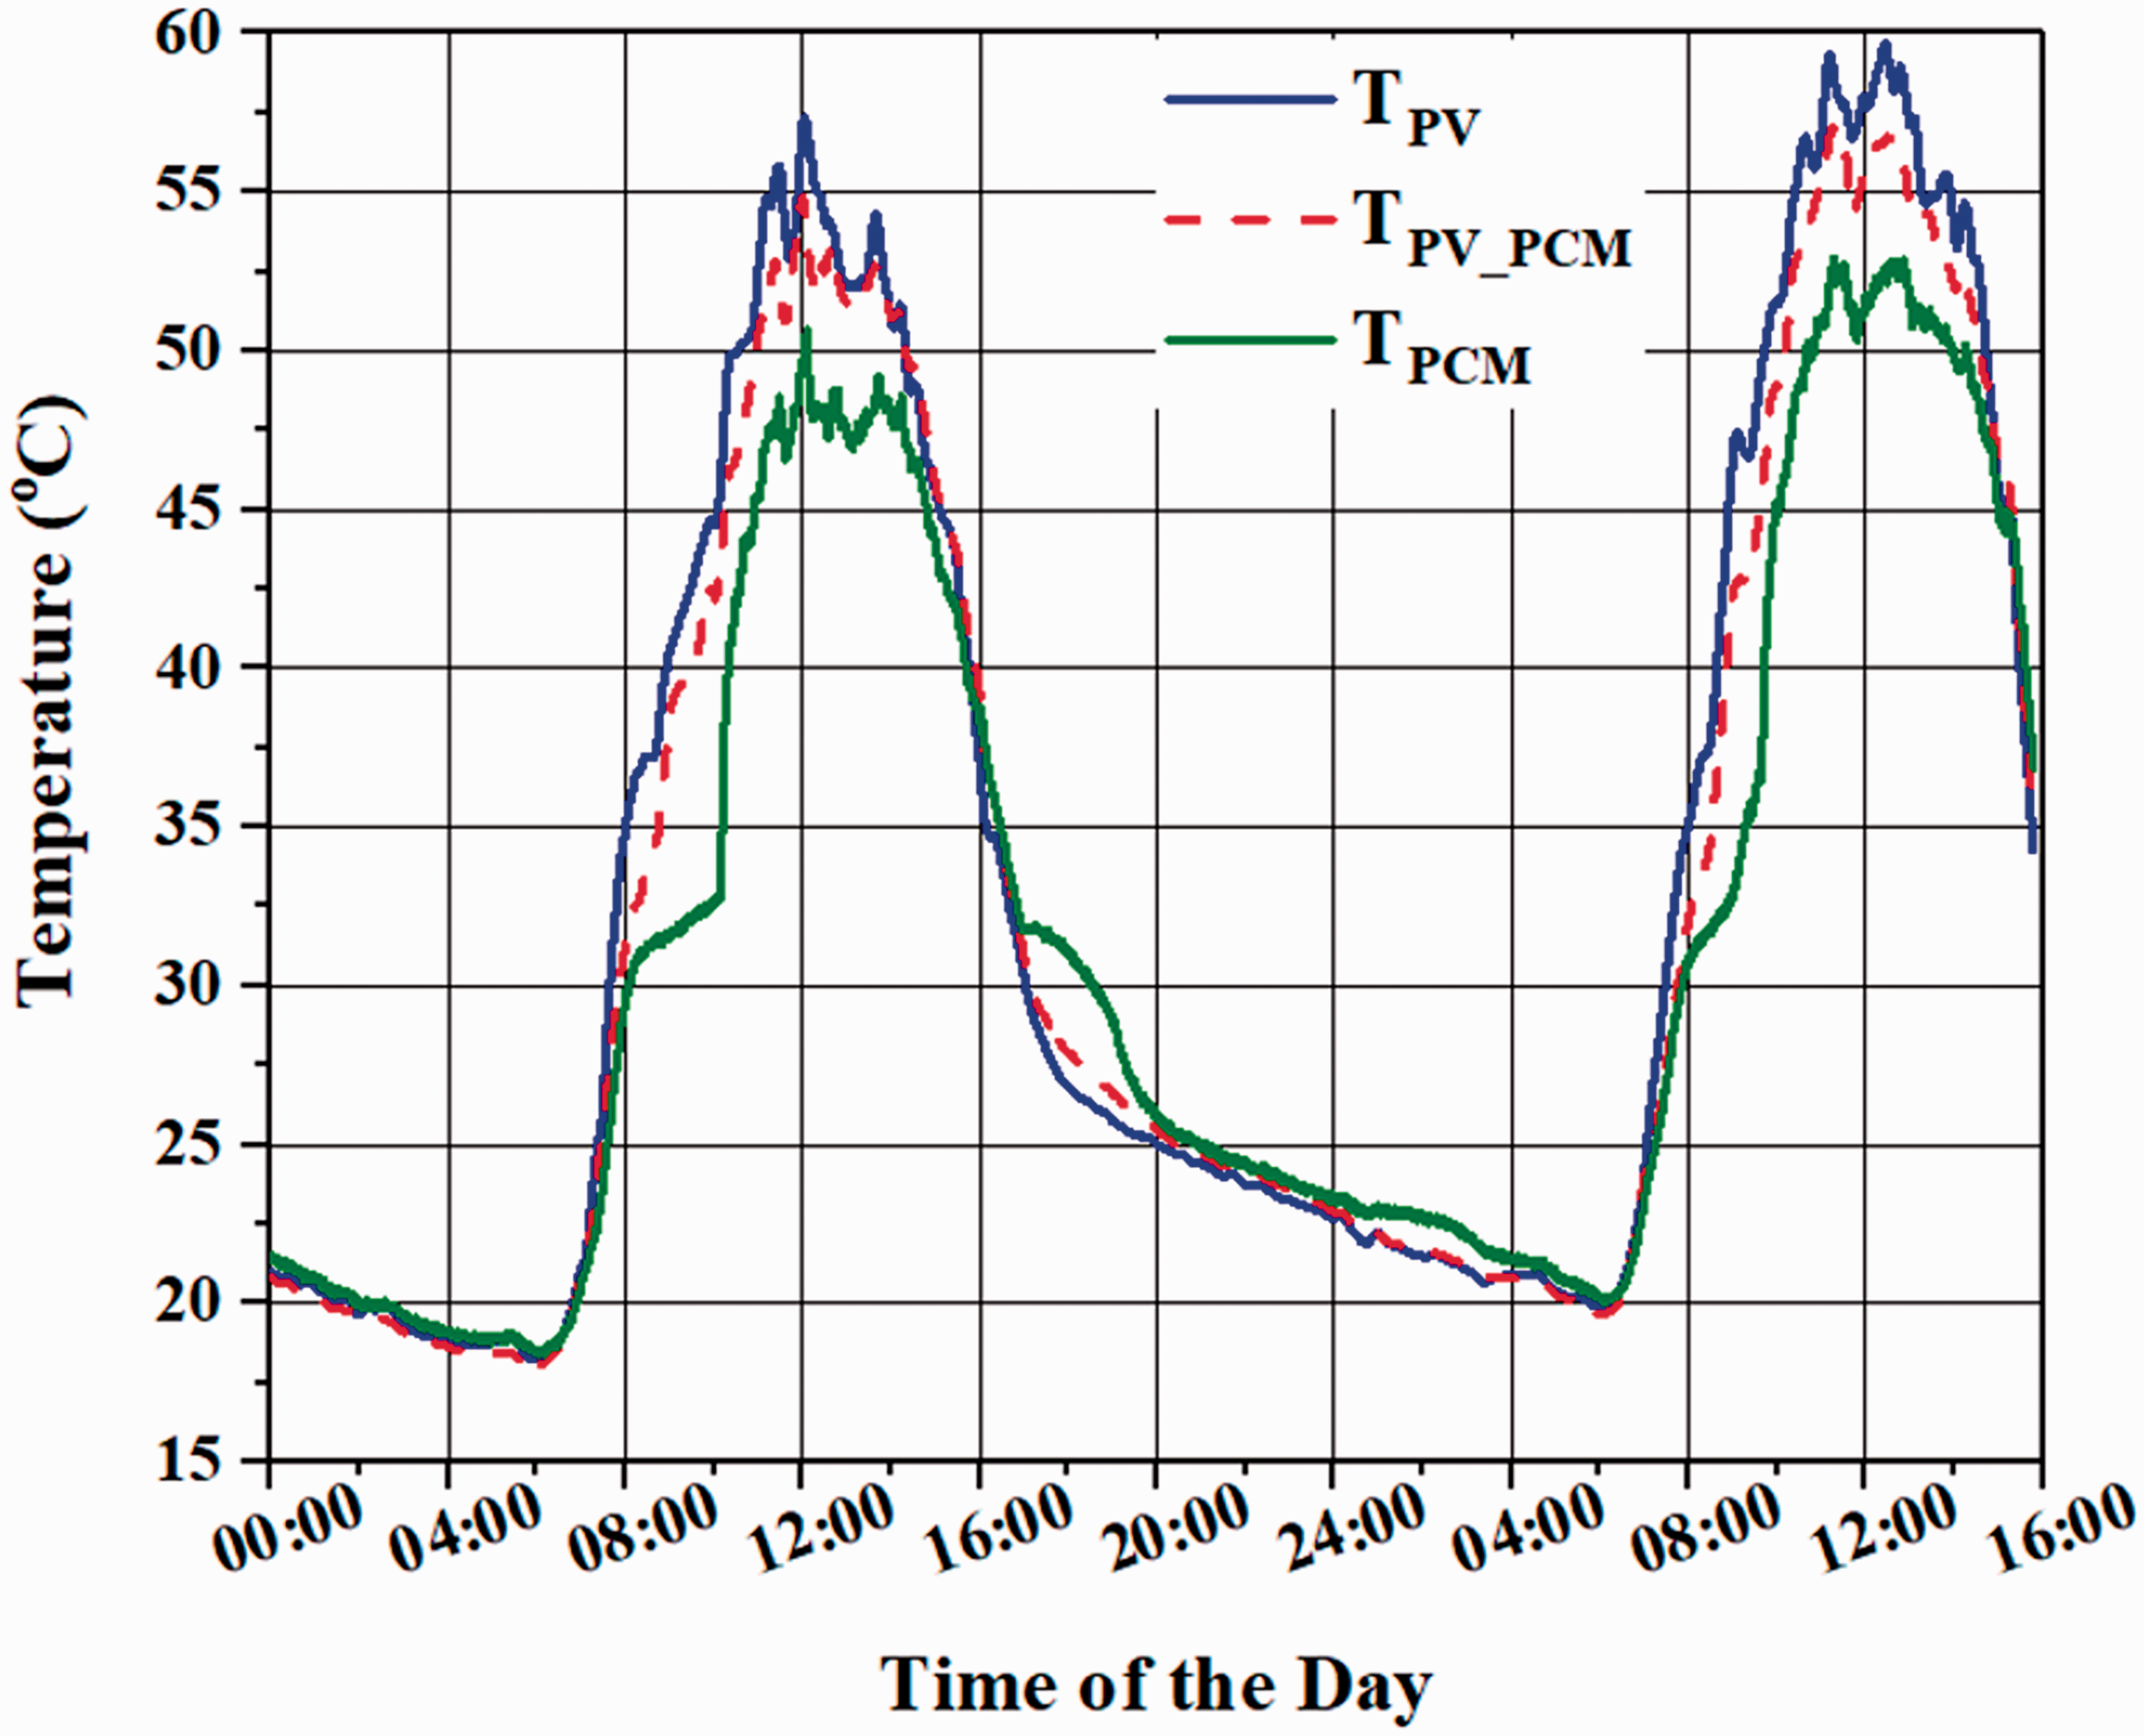
The surface temperature of the conventional PV and the PV with PCM for day 1 and day 2 is compared in Figure 4(a) while the temperature difference (ΔT = TPV − TPV_PCM) is provided in Figure 4(b). The maximum rise in the temperature of the conventional PV module was observed as high as 54°C and 58°C during day1 and day 2, respectively, which was ∼24°C above the ambient temperature. The solar radiation during these two experimental days was observed as high as ∼980 W/m2. The effect of PCM on the surface temperature of the PV module can be clearly observed from 8:00 till 11:00 during both days. The phase change effect started at 8:00 when the temperature of the both PV modules was 32°C. At this time, the intensity of the solar radiation was 400 W/m2. The phase change effect was completed at ∼11:00 when the surface temperature of the PV module with and without PCM was 42°C and 47.5°C, respectively. At this time, solar radiation intensity was ∼850 W/m2. The maximum deviation in the temperature of the PV module with PCM from the conventional PV module was 6°C at ∼10:00 during day 1 while during day 2 it was up to 9°C approximately at the same time period as shown in Figure 4(b). Afterward, the temperature difference between two PV modules was in the range of +1.5°C to +2.2°C during both days.
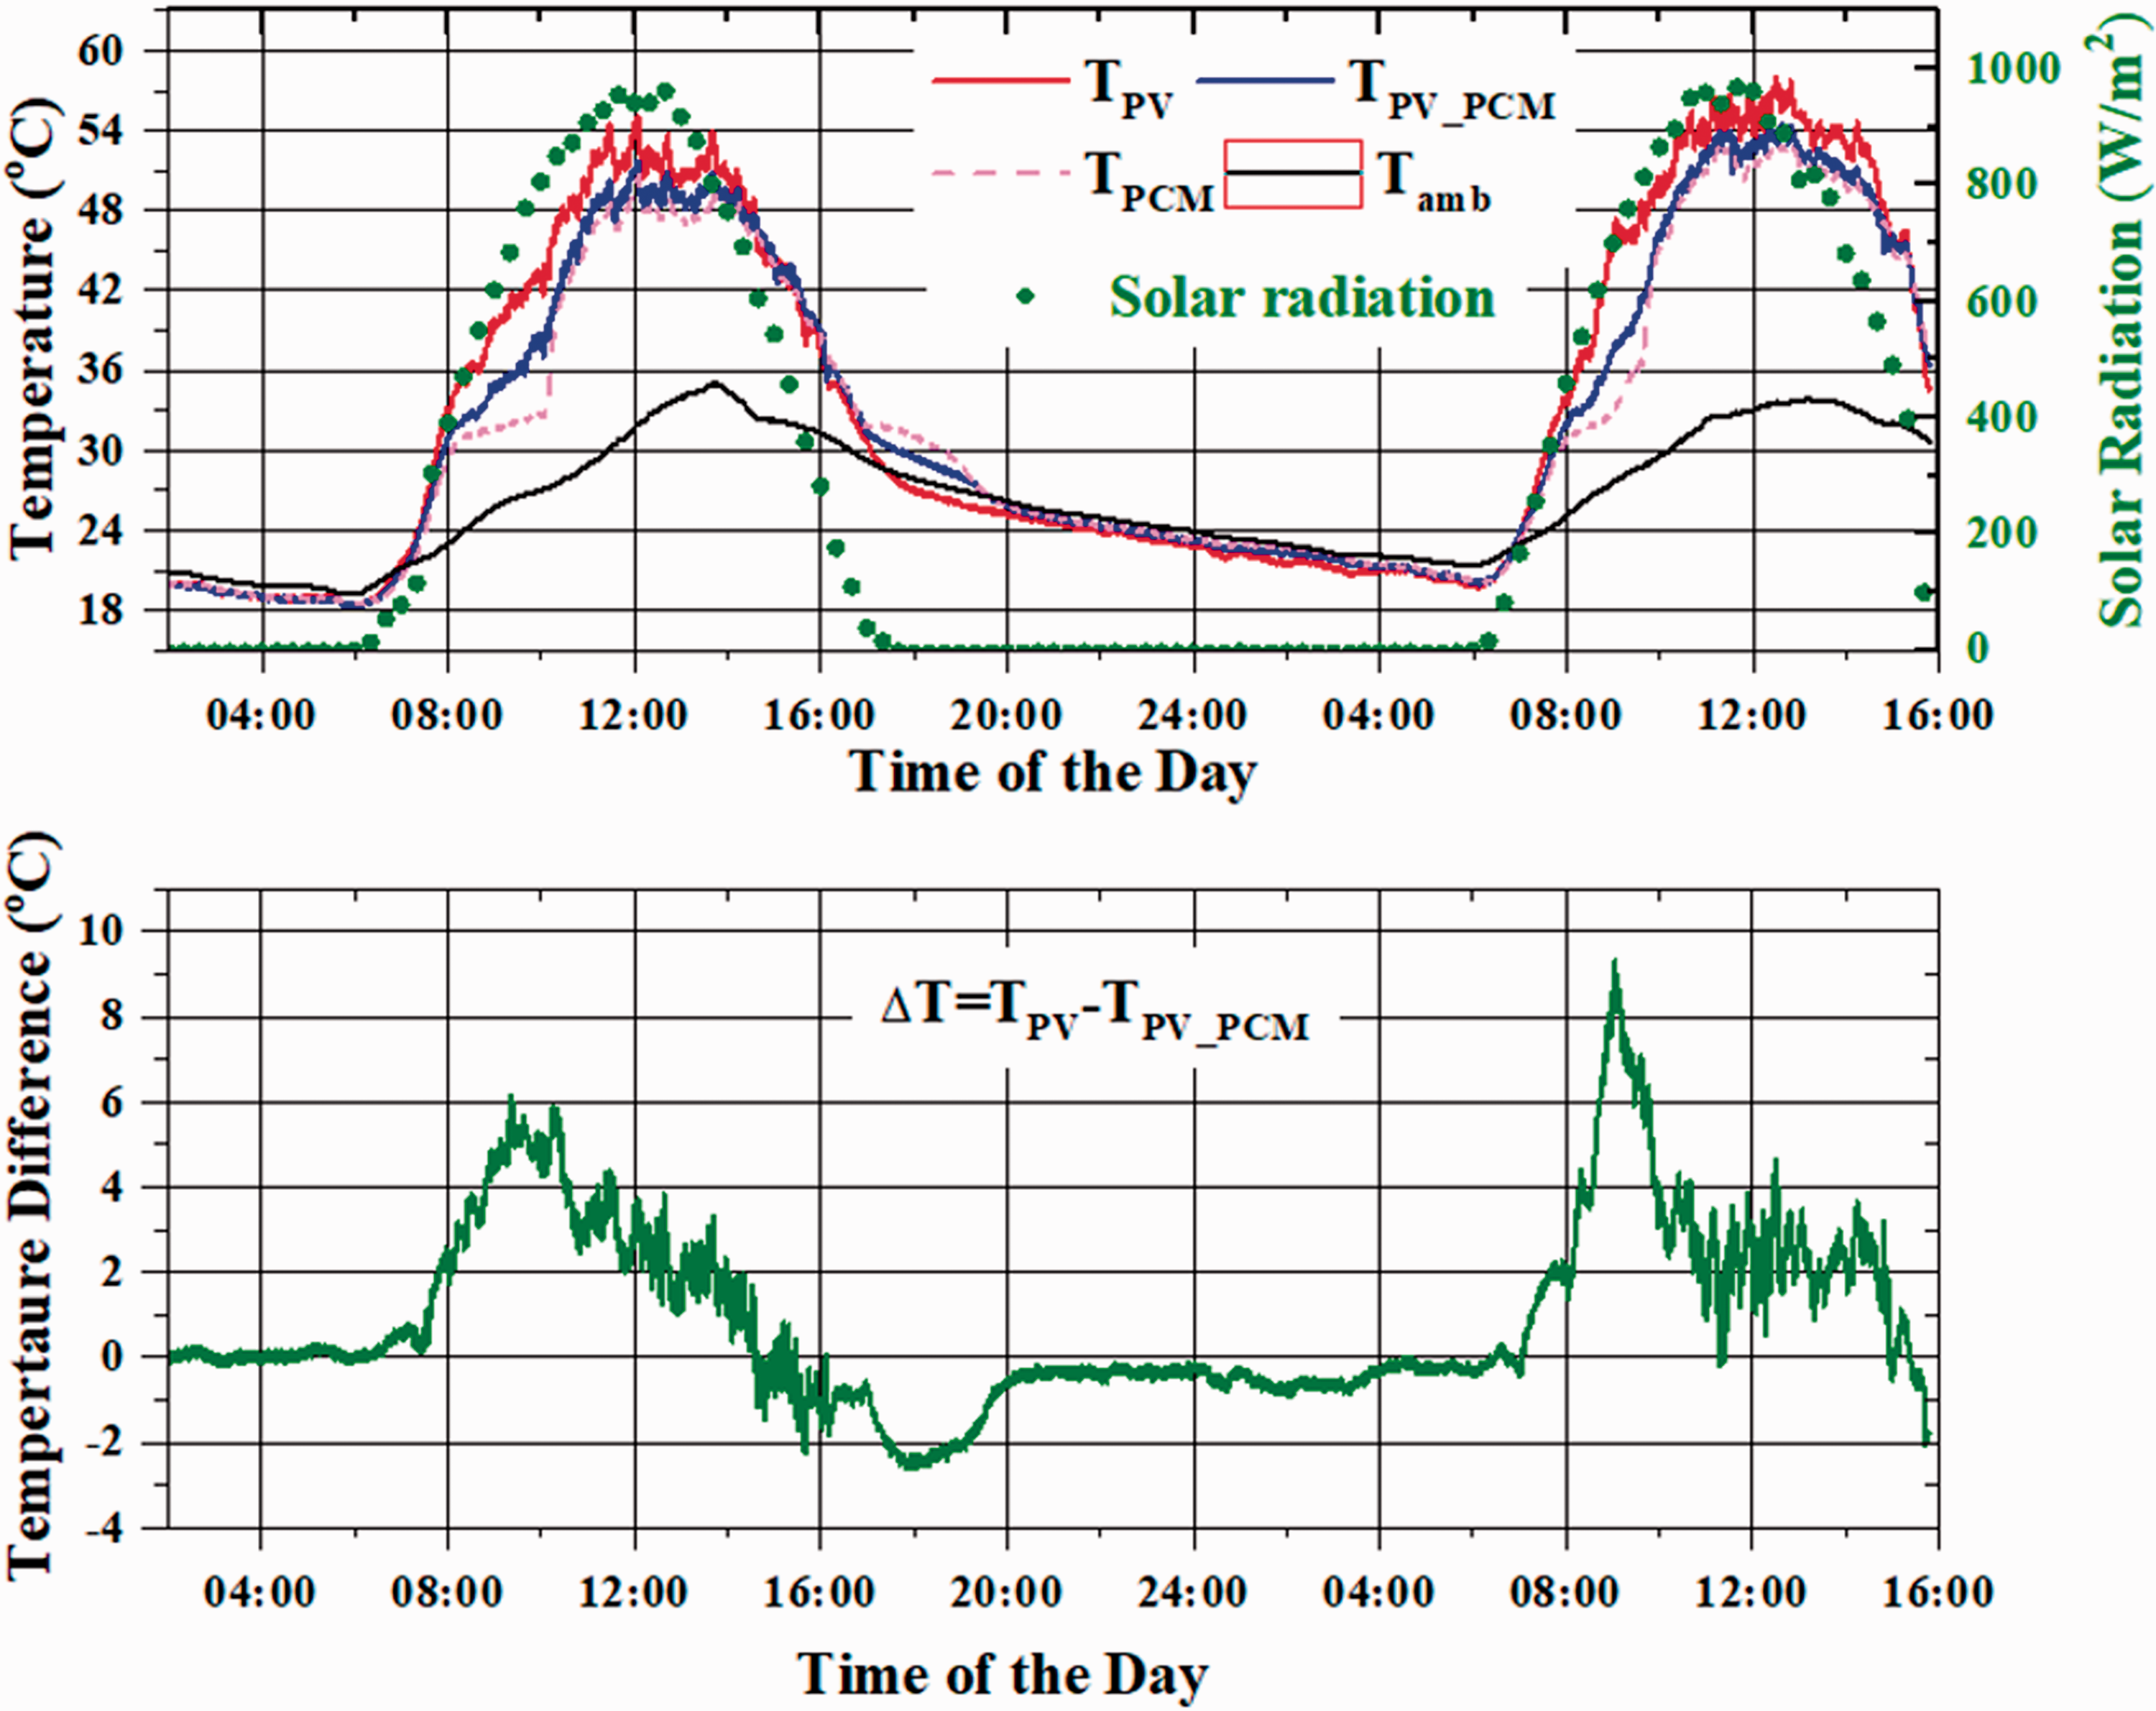
PV surface temperature with and without PCM during the experimental time period.
After 11:00, the temperature difference between conventional PV and PV-PCM was still positive as the heat generated by the PV module was absorbed by the PCM in the form of the sensible energy and rejected to the ambient. During this time period, PCM-filled tubes also behaved as fins and assisted in the increasing convection heat transfer from the PV module. The finned behavior introduced in the current study is lacking in the previous studies that discussed the inclusion of PCM with conventional PV modules in the form of the rectangular containers attached at the back side of the PV module. From 15:00 until 18:00, the temperature of the conventional PV module dropped quickly compared to the PV-PCM module. During this time period, the surface temperature of the PV-PCM system was observed higher as the heat absorbed by the PCM was supposed to be released until PCM completely changed its phase from liquid to solid. From 20:00 till next morning 6:00, again PV module integrated with PCM was observed a little bit warmer compared to the conventional PV due to sensible heat storage by the PCM. The higher temperature of the PV module during night time may be beneficial during the winter season in minimizing the frost conditions on the front surface of the PV module. But currently, this effect has not been analyzed in this study. During sunshine hours (7:00–16:00 for both days), the average temperature of the conventional PV module was 43.9°C and 47.4°C which was reduced to 41.5°C and 44.7°C, respectively, due to the PCM-filled metal tubes.
The peak temperature of the conventional PV module for each hour along with the PV-PCM temperature for the same time is shown in Figure 5. The main purpose of showing Figure 5 is to observe and show how the peak temperature of the conventional PV module was lowered by the PCM during the same time period. For example, during the time period from 11:00 to 12:00, the peak temperature of the PV module during day 1 was 54.5°C at 11:28, and at the same time period, PV-PCM temperature was 50°C. Similarly, during day 2, the peak temperature of the conventional PV module was 56.5°C at 11:30, and for PV module with PCM, it was 54°C at the same time period. For both days, from 8:00 till 14:00, the peak temperature of the PV module integrated with PCM was always lower than conventional PV module. The hourly peak temperature of the modified PV-PCM module was still lower than the conventional PV module even after the 11:00 a.m. when the latent heat was completely utilized. The main reason for the lower peaks of the PV-PCM module was due to the presence of the metallic tubes that enhanced the convective heat transfer from the modified back of the PV-PCM module.
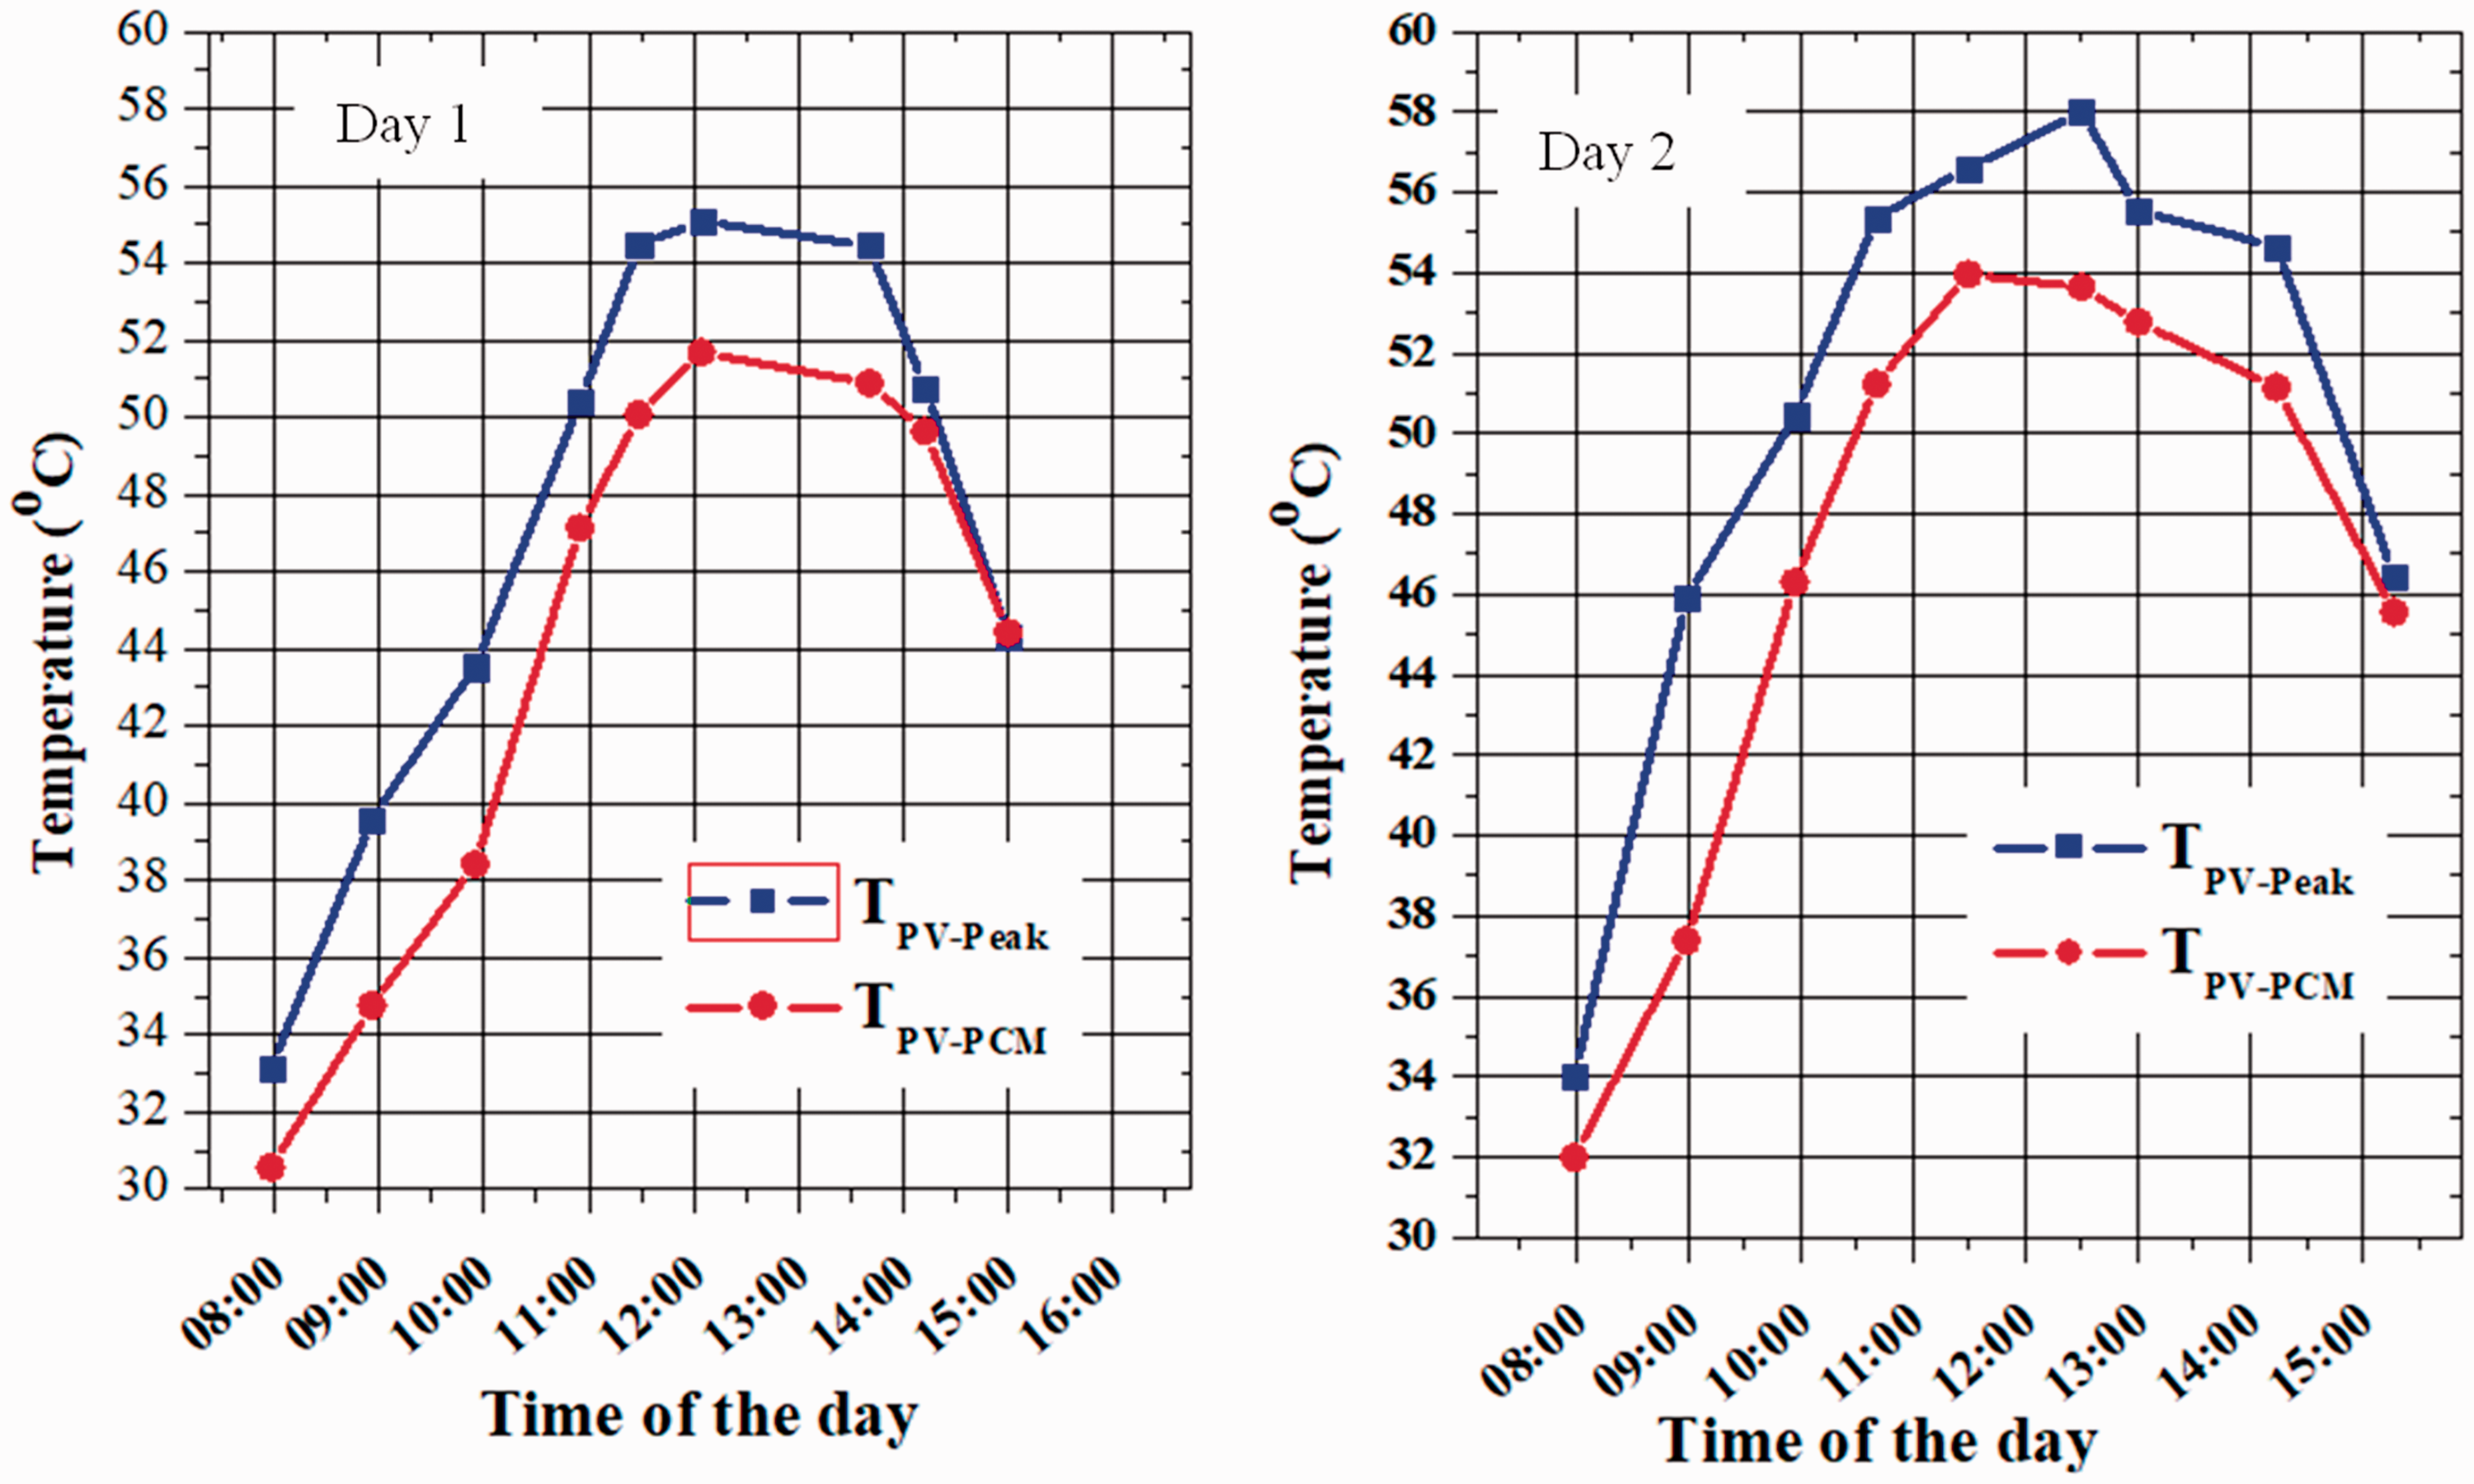
Hourly peak temperature of PV-PCM and conventional PV modules. PV: photovoltaic; PCM: phase change material.
It was only after 14:00 when the conventional PV module started cooling rapidly due to low thermal inertia. The thermal inertia of the PV-PCM system was higher than conventional PV module due to the presence of PCM so it took a long time to cool down than the conventional PV module during the afternoon time period.
Enhancement in the thermal performance
Enhancement in the thermal performance of the PV module based on the surface temperature is calculated using equation (1). Results are presented in Figure 6. By the incorporation of the PCM filled in aluminium tubes, thermal performance of the PV module was enhanced by 14% during day 1 with an average of 5.3% per day while during day 2 it enhanced up to 19% with an average of 6% per day. The thermal enhancement was observed negative only during the evening and night time due to the high thermal inertia of the PV-PCM system compared to the conventional PV module.

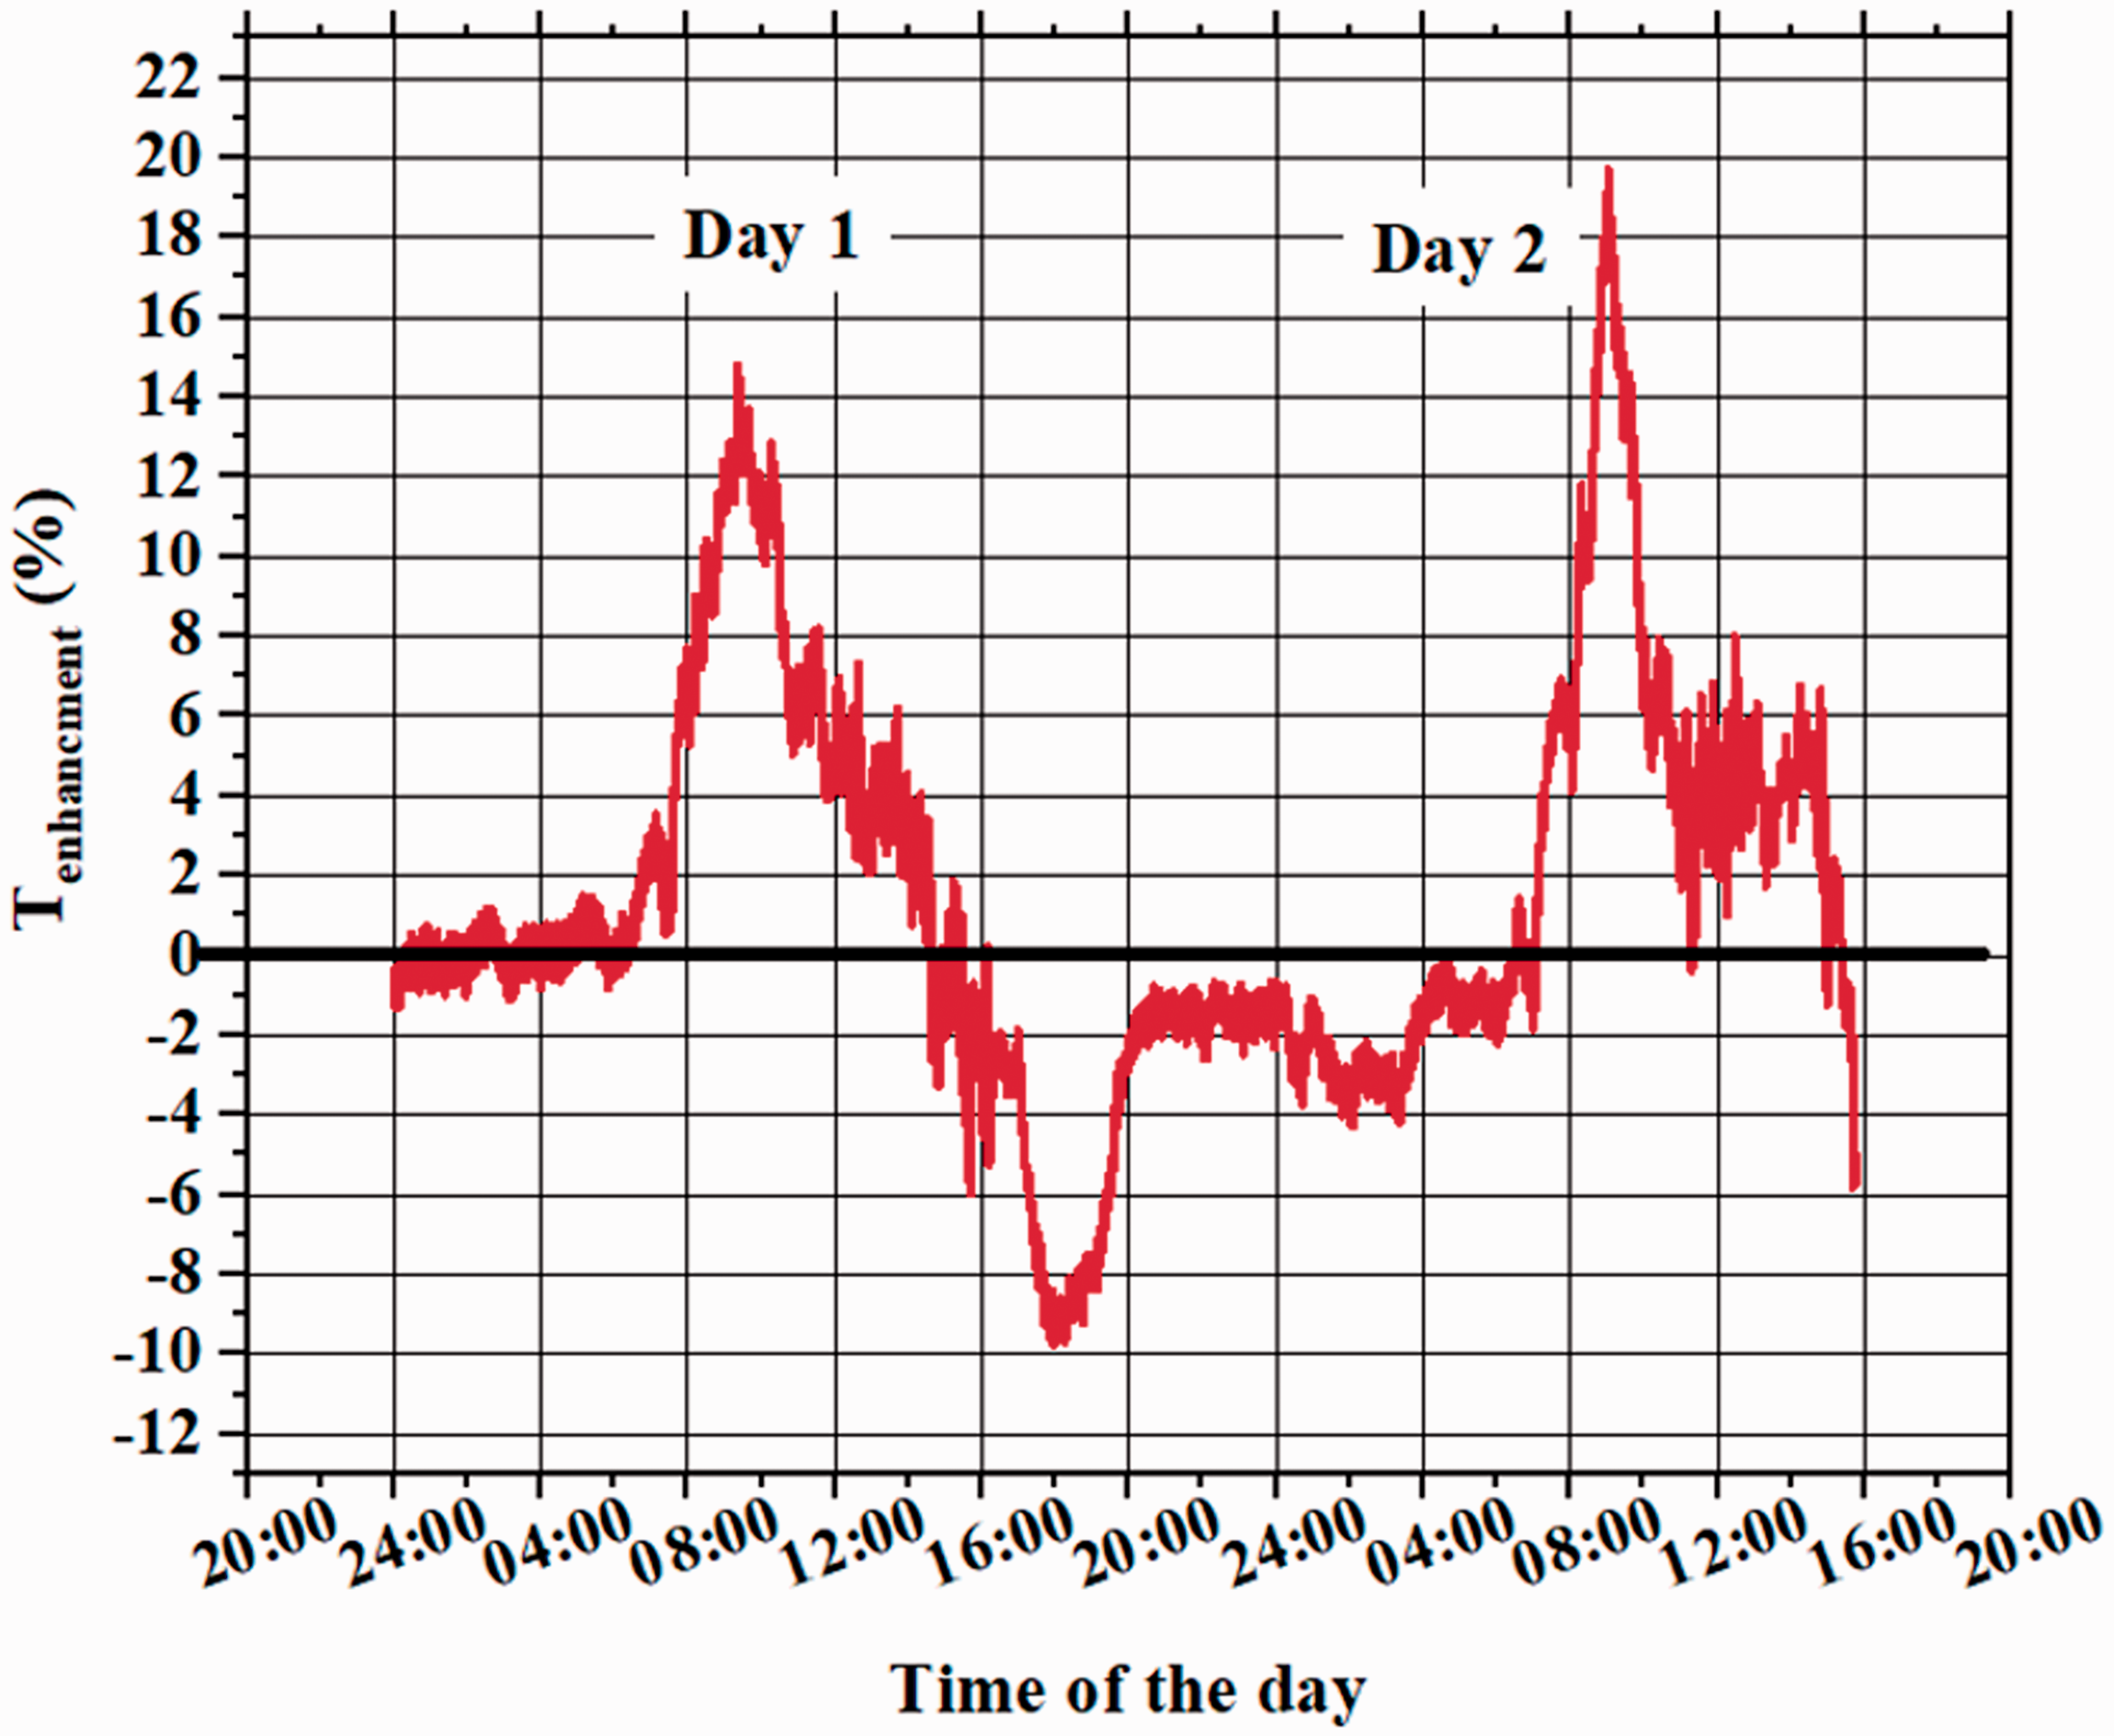
Thermal performance enhancement based on PV module front surface temperature.
Effect of PCM on PV back surface temperature
It is also important to gain the knowledge of the back temperature of the PV module to understand and calculate the heat losses from the PV back surface. For this purpose, two thermocouples were placed at the center of the back side of both PV modules to observe their thermal response, and the results are presented in Figure 7. The PCM temperature that was measured inside the tube at the center point is also presented in Figure 7. It can be observed from Figure 7 that the back surface of the PV module integrated with PCM is up to 2°C cooler compared to the conventional PV module. The average temperature of the back side of the conventional PV module, during day 1 (7:00 till 16:00), was 45.5°C which was reduced to 43°C due to the PCM inclusion. During day 2, the average temperature of the PV back surface without and with PCM was 48.8°C and 46.2°C, respectively. During day 1, PCM started changing its phase from solid to liquid exactly at 8:00 when the PCM temperature was 30°C. At this point, the temperature of the conventional PV module was 33°C while the temperature of the PV-PCM module was 31°C. PCM phase change was completed at ∼11:00. At this point, conventional PV temperature was 45°C while the temperature of the PV-PCM module was 42.5°C. Similar behavior can be observed for day 2 shown also in Figure 7.
Back surface temperature of the PV module with and without PCM. PV: photovoltaic; PCM: phase change material.
It can also be observed that from the time period when PCM completed its phase change till afternoon (for both days) there is 3°C to 4°C temperature difference between PCM and modified PV back surface. There can be two reasons for this phenomenon either the thermal contact between the PCM tube and the PV module is not good or the thermal conductivity of the PCM is too low to absorb excess heat generated by PV more efficiently and effectively. Although it was made sure to fill all air gaps by placing a layer of high thermal conductive grease (κ > 5.0 W/m-K), between the PCM tube and the PV back surface, but some error may be present there. Another reason for PCM having low thermal conductivity may be more valid for this temperature difference as the thermal conductivity of the currently used PCM is only 0.2 W/m-K.
Thermal gradient between PCM and PCM tube
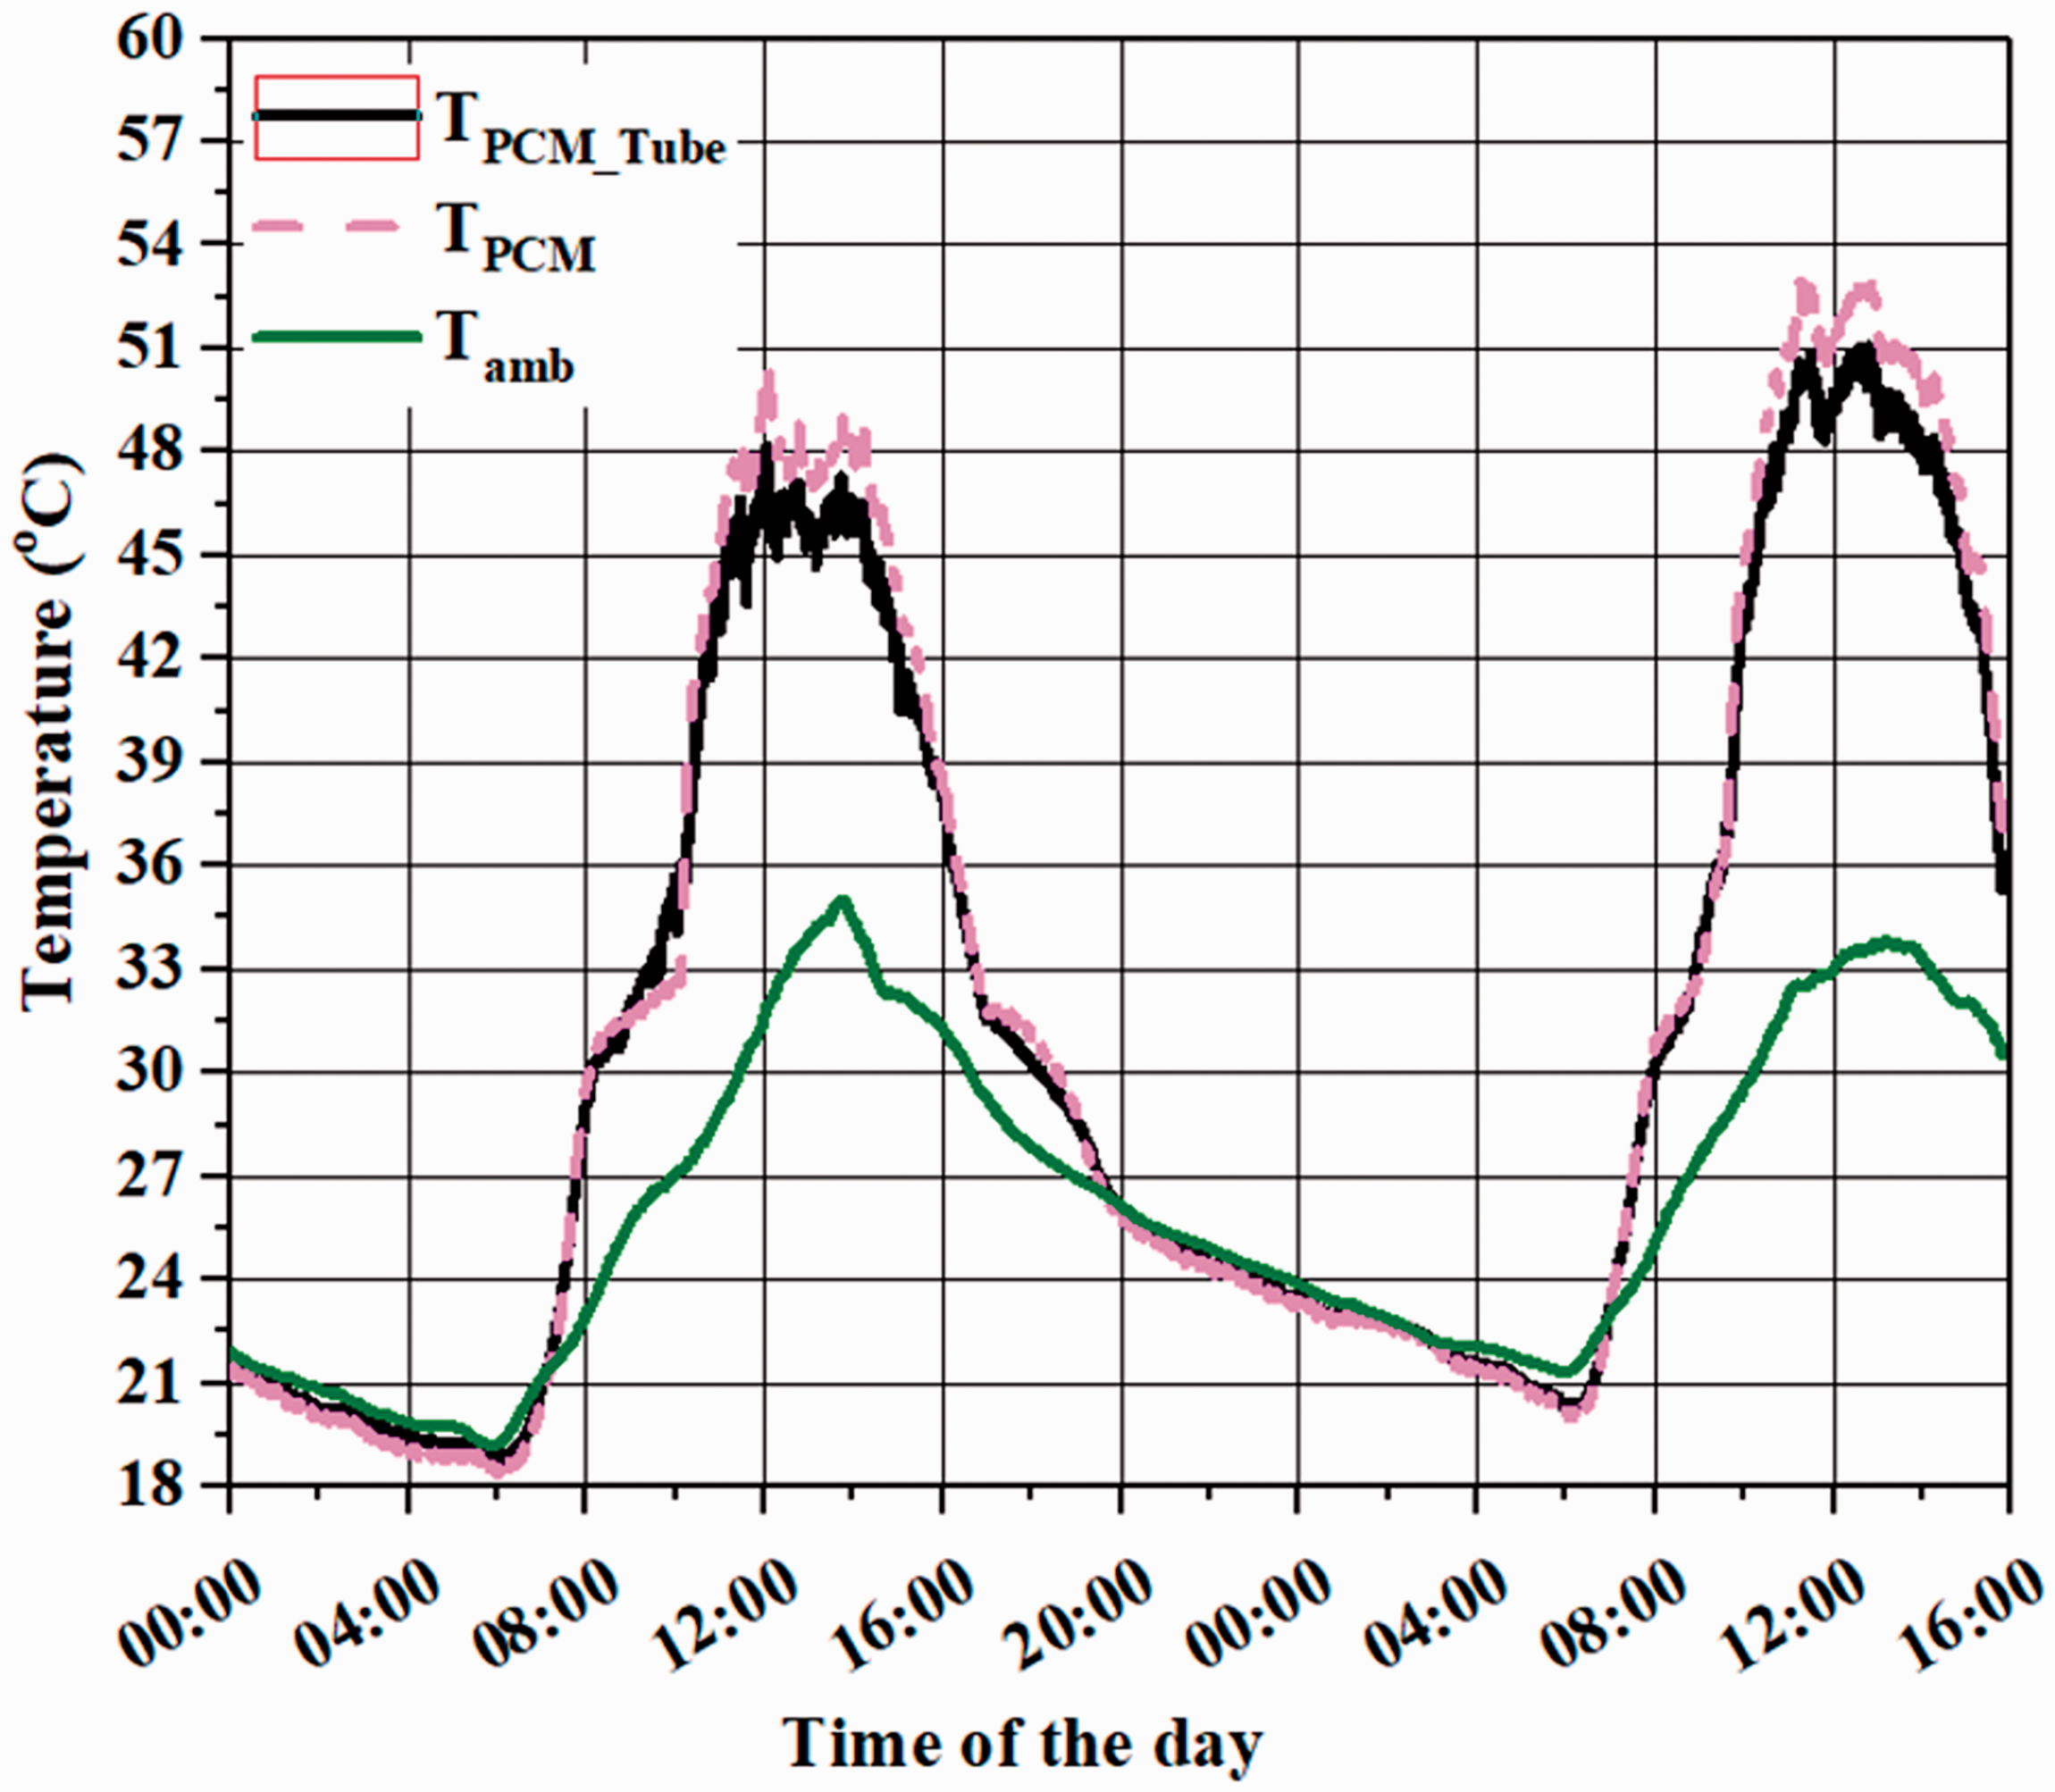
To calculate the heat losses from the back of the PV-PCM module and total heat stored by the PCM, it is also necessary to know the temperature of the PCM and PCM tube. For this purpose, one thermocouple was placed at the middle of the tube at outside wall while the other thermocouple was placed inside PCM at the middle of the tube. Another purpose of this measurement was to know how much resistance the tube walls offer to the heat to flow from PCM to the tube. Through these measurements, it was also aimed to know how the PCM changed its phase and for how long period. Results of the measurements are presented in Figure 8. It can be observed from Figure 8 that the PCM started changing its phase exactly at 8:00 when the PCM temperature was 30°C during both days. During day 1, phase change process lasted for approximately 3 h, and for day 2, it lasted for the shorter time period. PCM phase change process was completed when the PCM temperature reached till ∼32°C during both days. During this time period, the ambient temperature was between 24°C and 27°C, and the conventional PV module temperature was 33°C and 45°C during day 1 (Figure 4(a)). It can be observed that there is very minimal and nonsignificant difference between PCM and tube temperature except during noon time when the temperature difference is up to 2°C to 3°C during both days. This may be that during noon time, convection heat transfer from PCM tube increases due to the higher temperature difference between PCM tube and the ambient, and heat is lost from the tubes more rapidly as the thermal conductivity of aluminum tube is very high compared to PCM. Otherwise, the thermal resistance offered by the aluminum tubes for the heat to flow from PCM to the ambient is very less.
PCM and PCM tube temperature during melting and solidification process. PCM: phase change material.
Electrical efficiency and power of PV module with and without PCM
In this section, the electrical efficiency and the power generated by the two PV modules are analyzed, compared, and discussed. The electrical efficiency is calculated using equation (2) which relates efficiency to the operating temperature of the PV module (Klugmann-Radziemska & Wcisło-Kucharek, 2017).

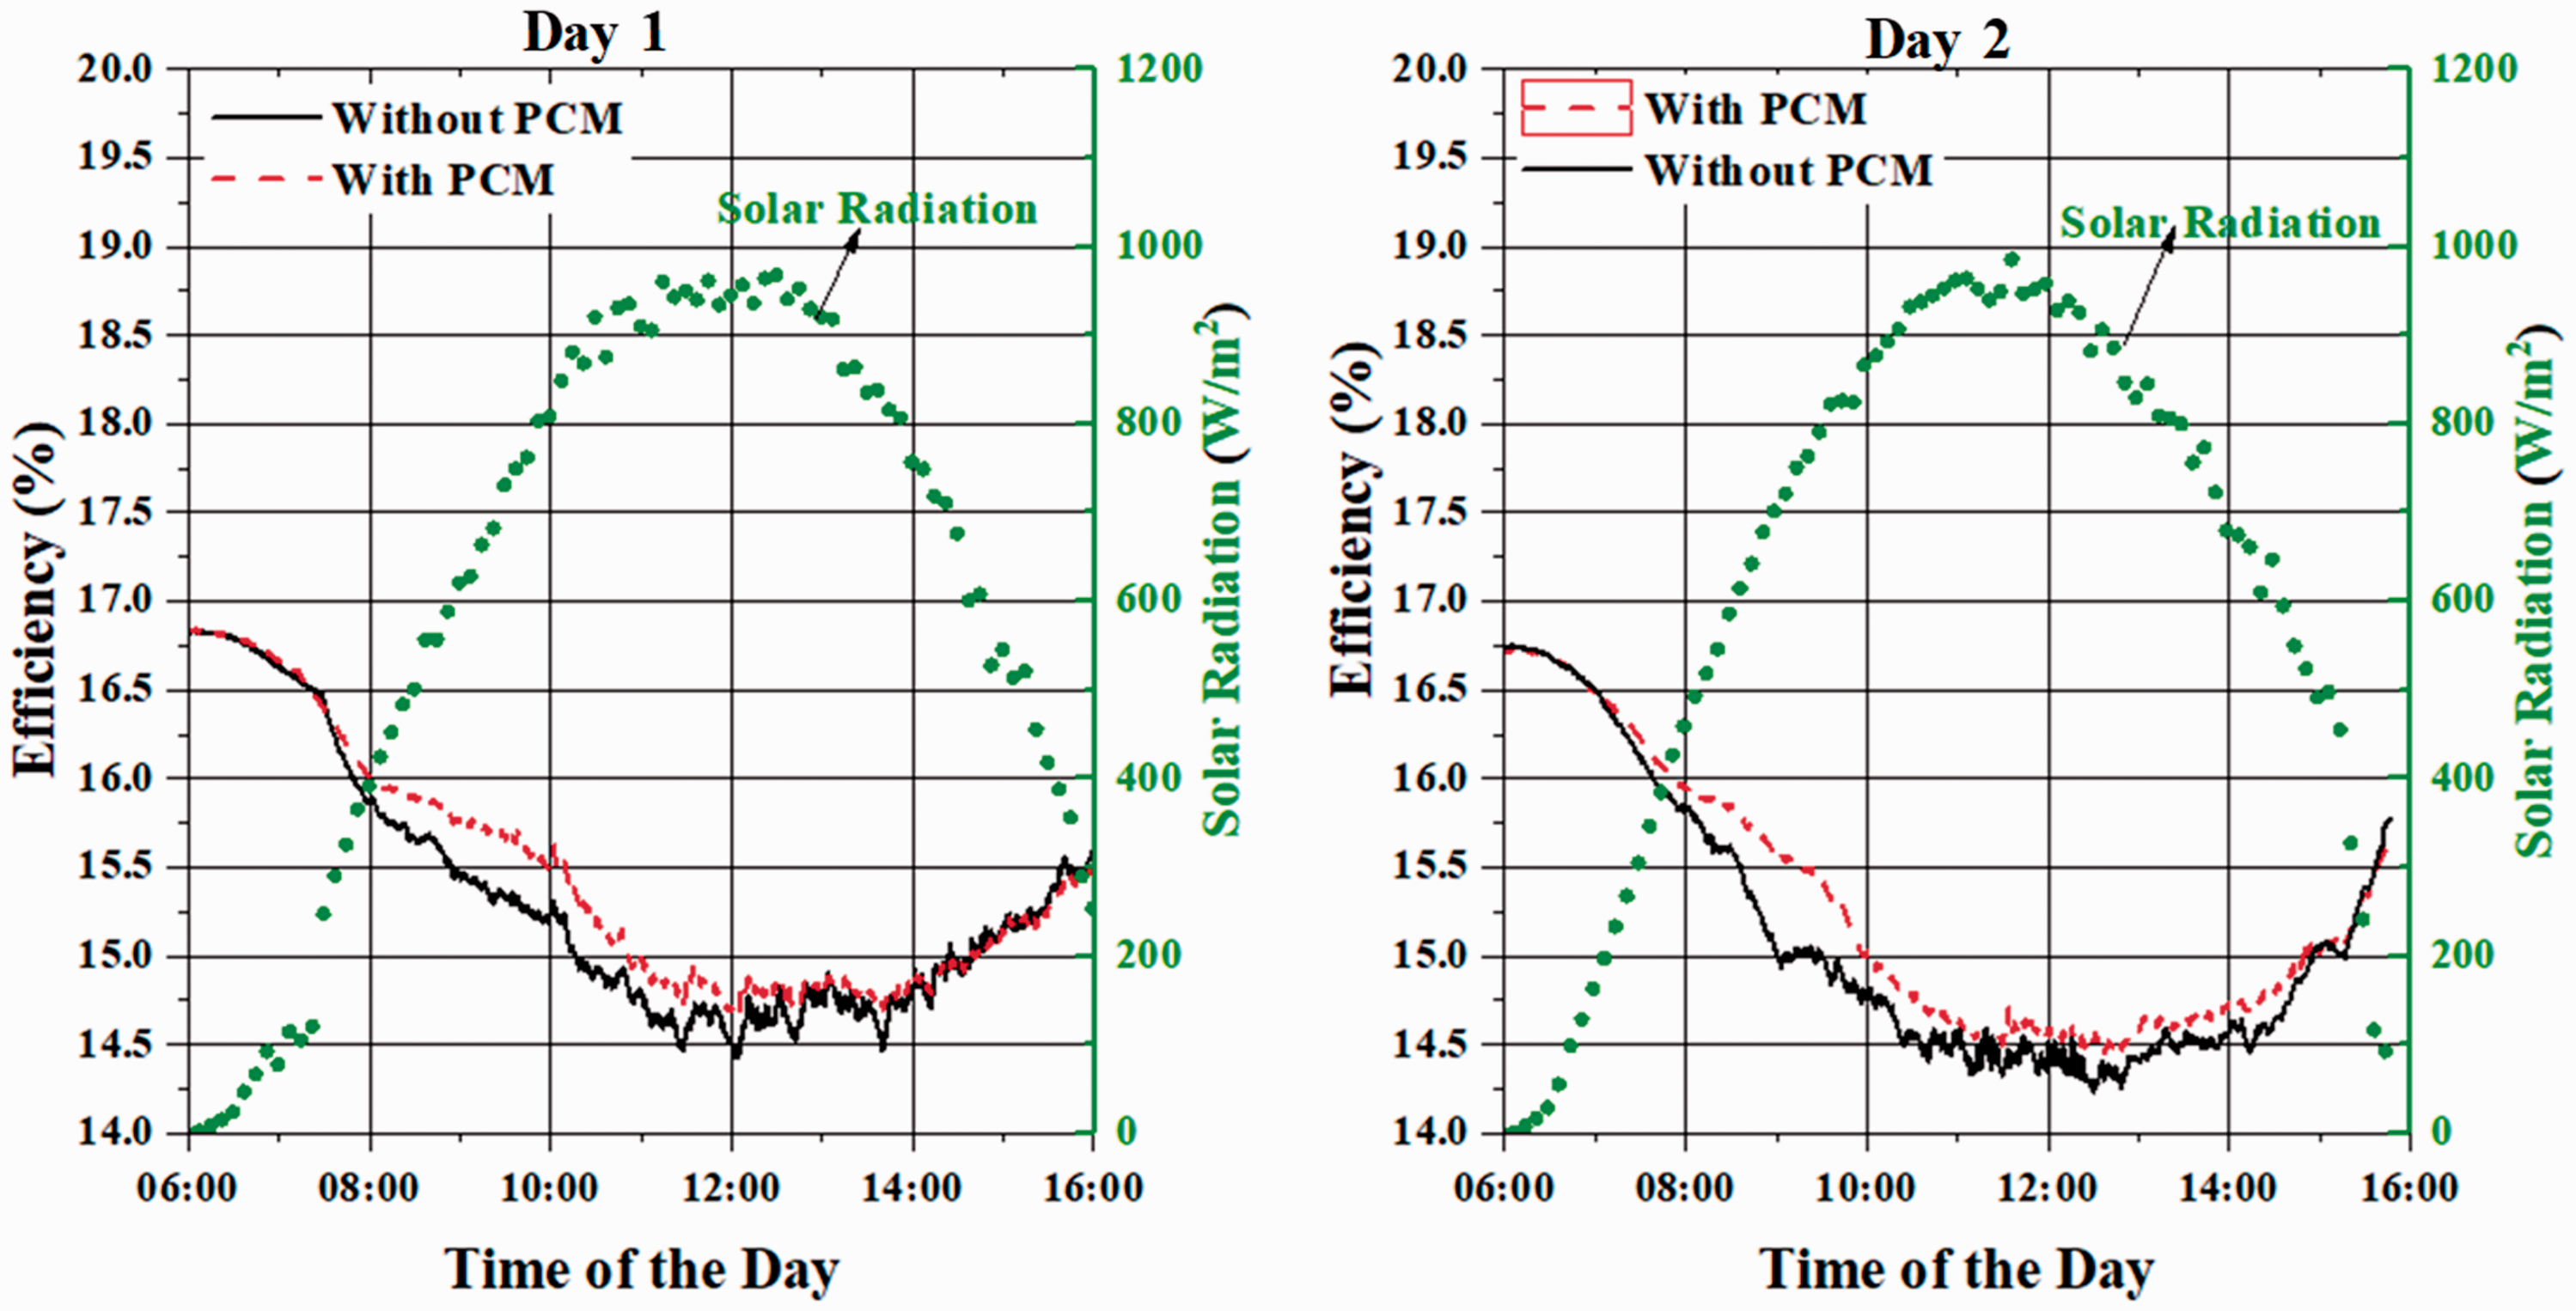
Efficiency results are shown in Figure 9 for the experimental days. Major improvement in the efficiency of the PV module is observed between 8:00 and 11:00 when the PCM changed its phase from solid state to liquid state (Figure 4) with solar radiation in the range of 400W/m2 to 850 W/m2. From 11:00 onwards, improvement in the efficiency of the PV modules was not so significant despite the fact that PV module integrated with PCM was observed 1.5°C to 2°C (average) cooler during this time period. According to equation (2), the temperature difference of 1.5°C to 2°C has little impact on the efficiency of the PV module. The average efficiency during day 1 (7:00–16:00), without PCM, was ∼15% which improved up to 15.2% while during day 2 it was 14.92% without PCM which improved up to 15.2% with PCM integration.
Electrical conversion efficiency of conventional and modified PV modules. PCM: phase change material.
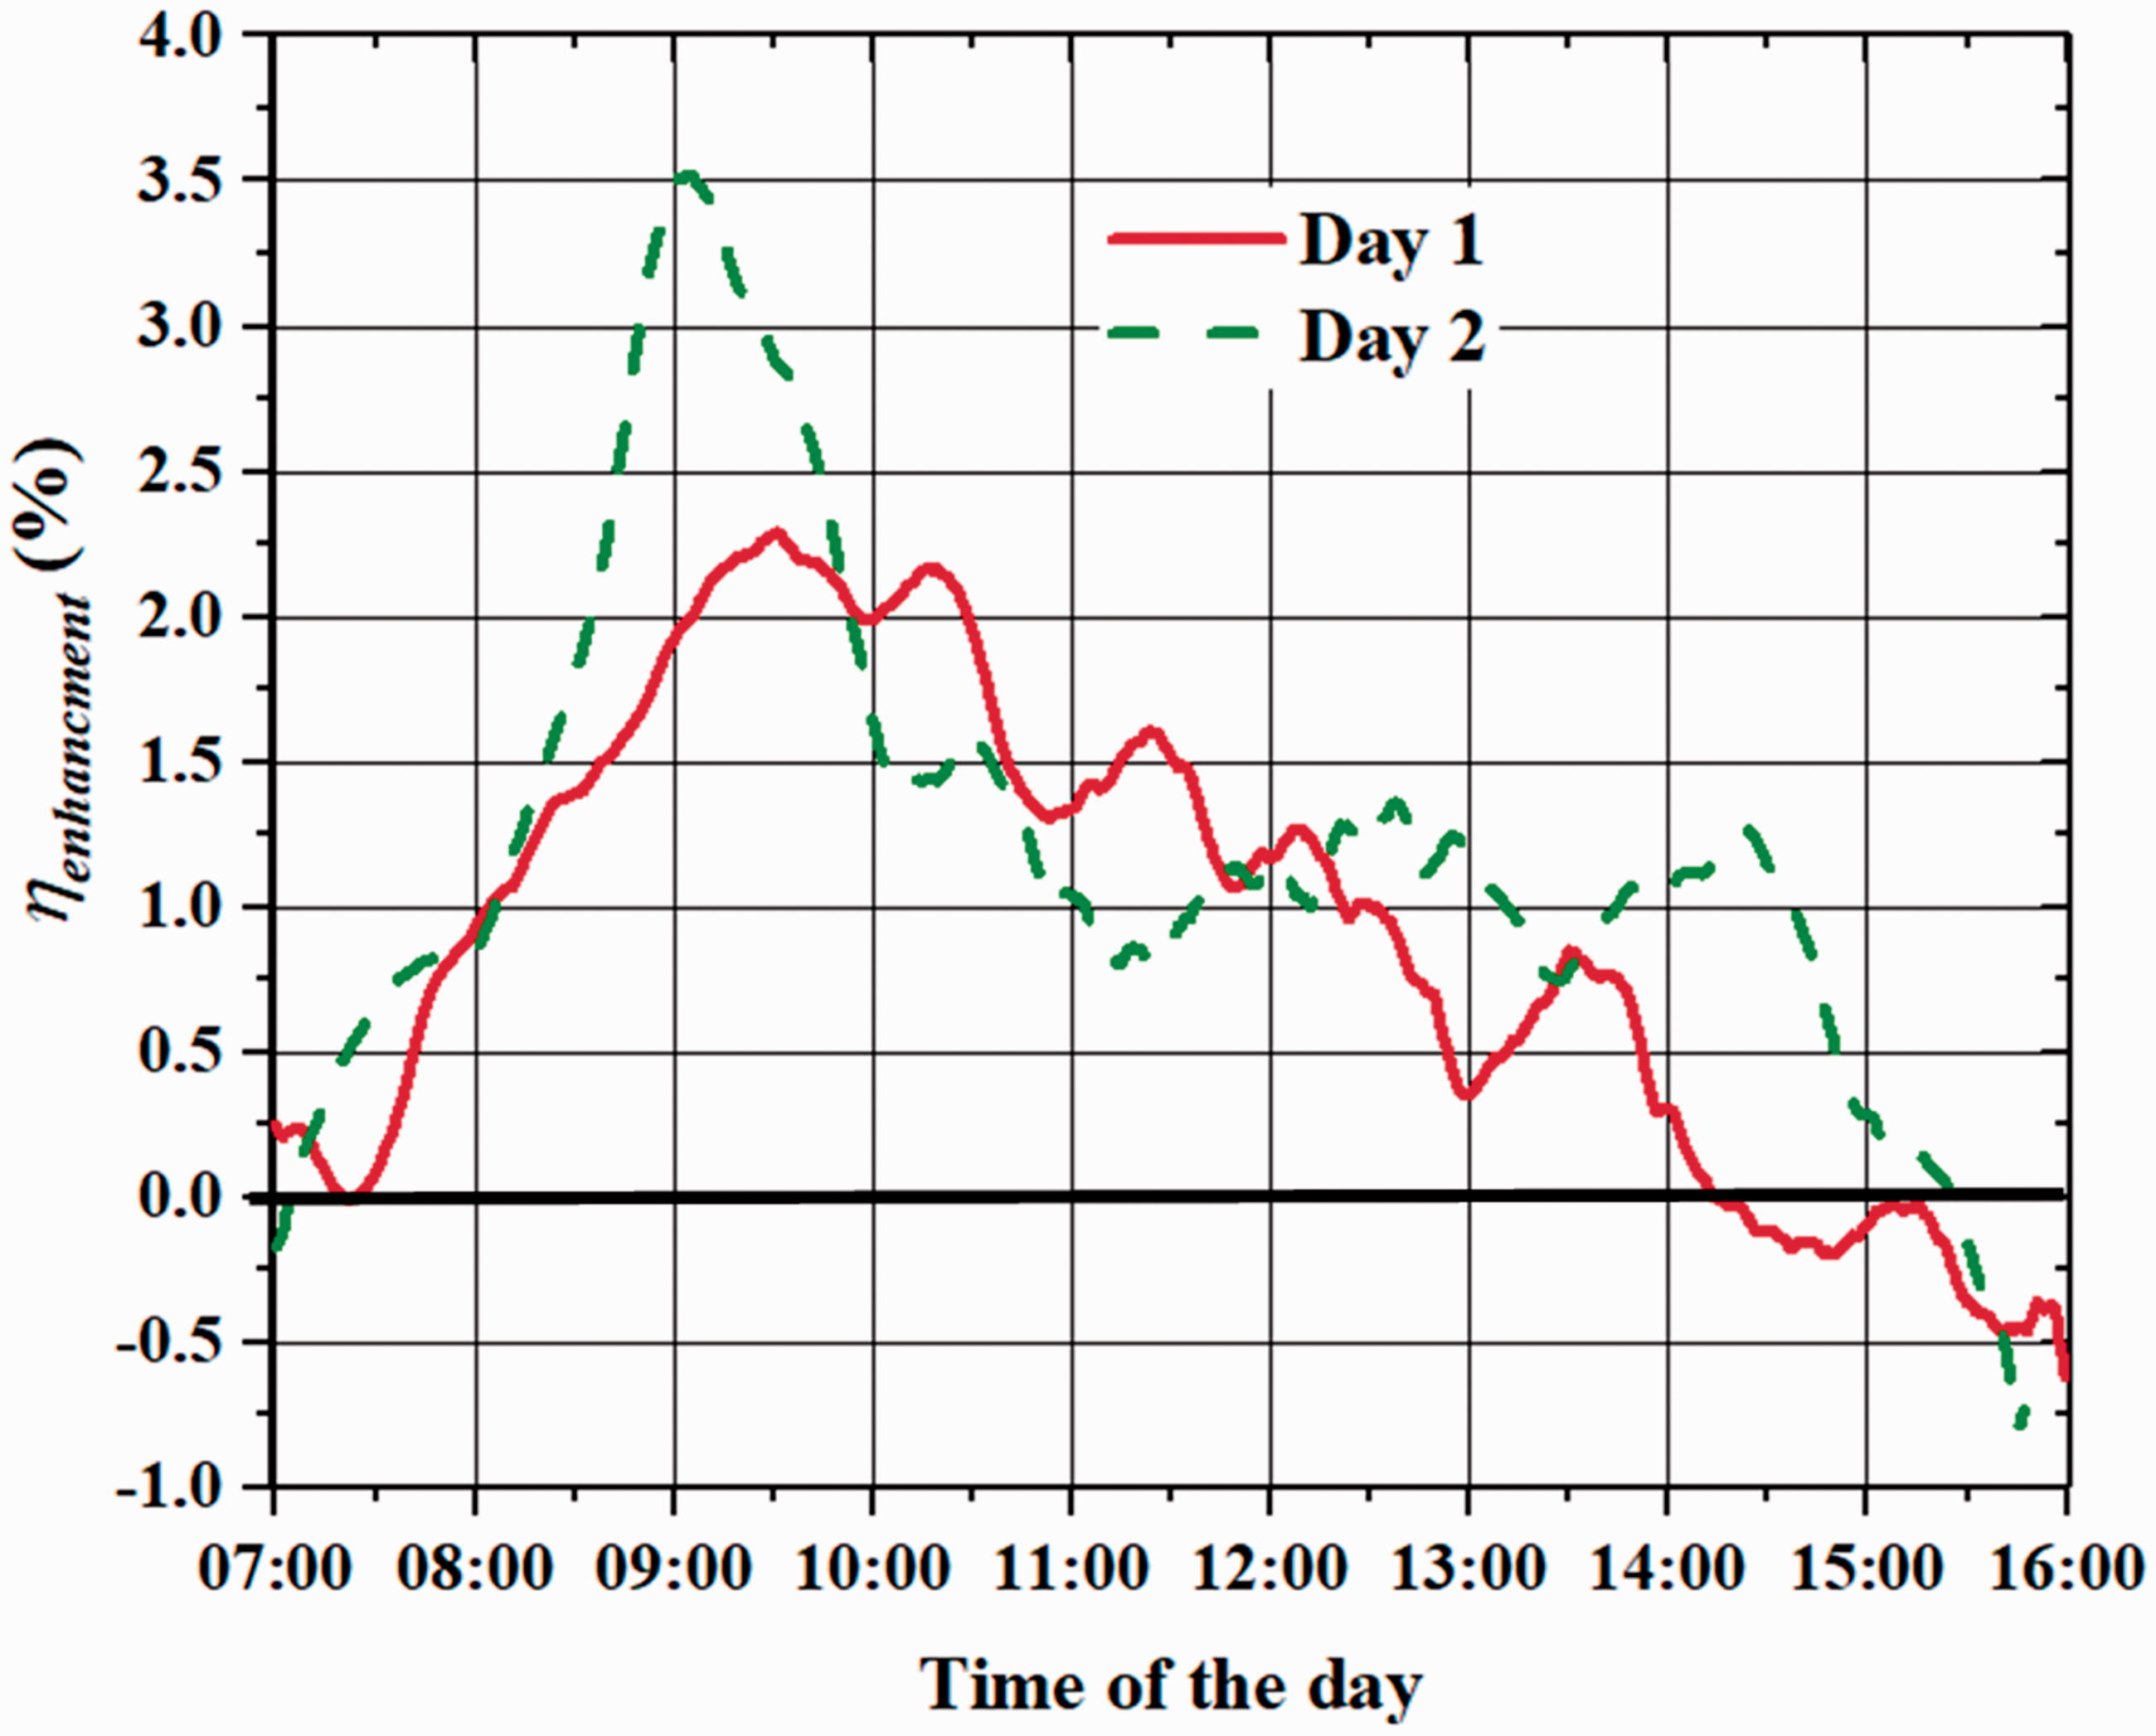
Enhancement in the efficiency of the PV module due to cooling of PCM is calculated using the relation mentioned in equation (3). The results are presented in Figure 10 and discussed below.

Improvement in the electrical efficiency of the PV module during experimental days with PCM.
According to Figure 10 maximum, 2.2% and 3.5% enhancement in the electrical conversion efficiency of the PV module is observed during day 1 and day 2, respectively. At an average, during day 1, the efficiency enhanced by ∼1.2% while during day 2 it enhanced by ∼1.9%. Improvement in the efficiency was only negative during the late afternoon during day 1 when PV-PCM module temperature was higher than conventional PV module. While during day 2, it was always in the positive region except very near to 16:00. The negative efficiency may not affect the overall performance of the PV module as during this time period solar radiation is very low.
The power produced by the current PV module during both days calculated using equation (4) (Ho et al., 2012; Teo et al., 2012) is shown in Figure 11.

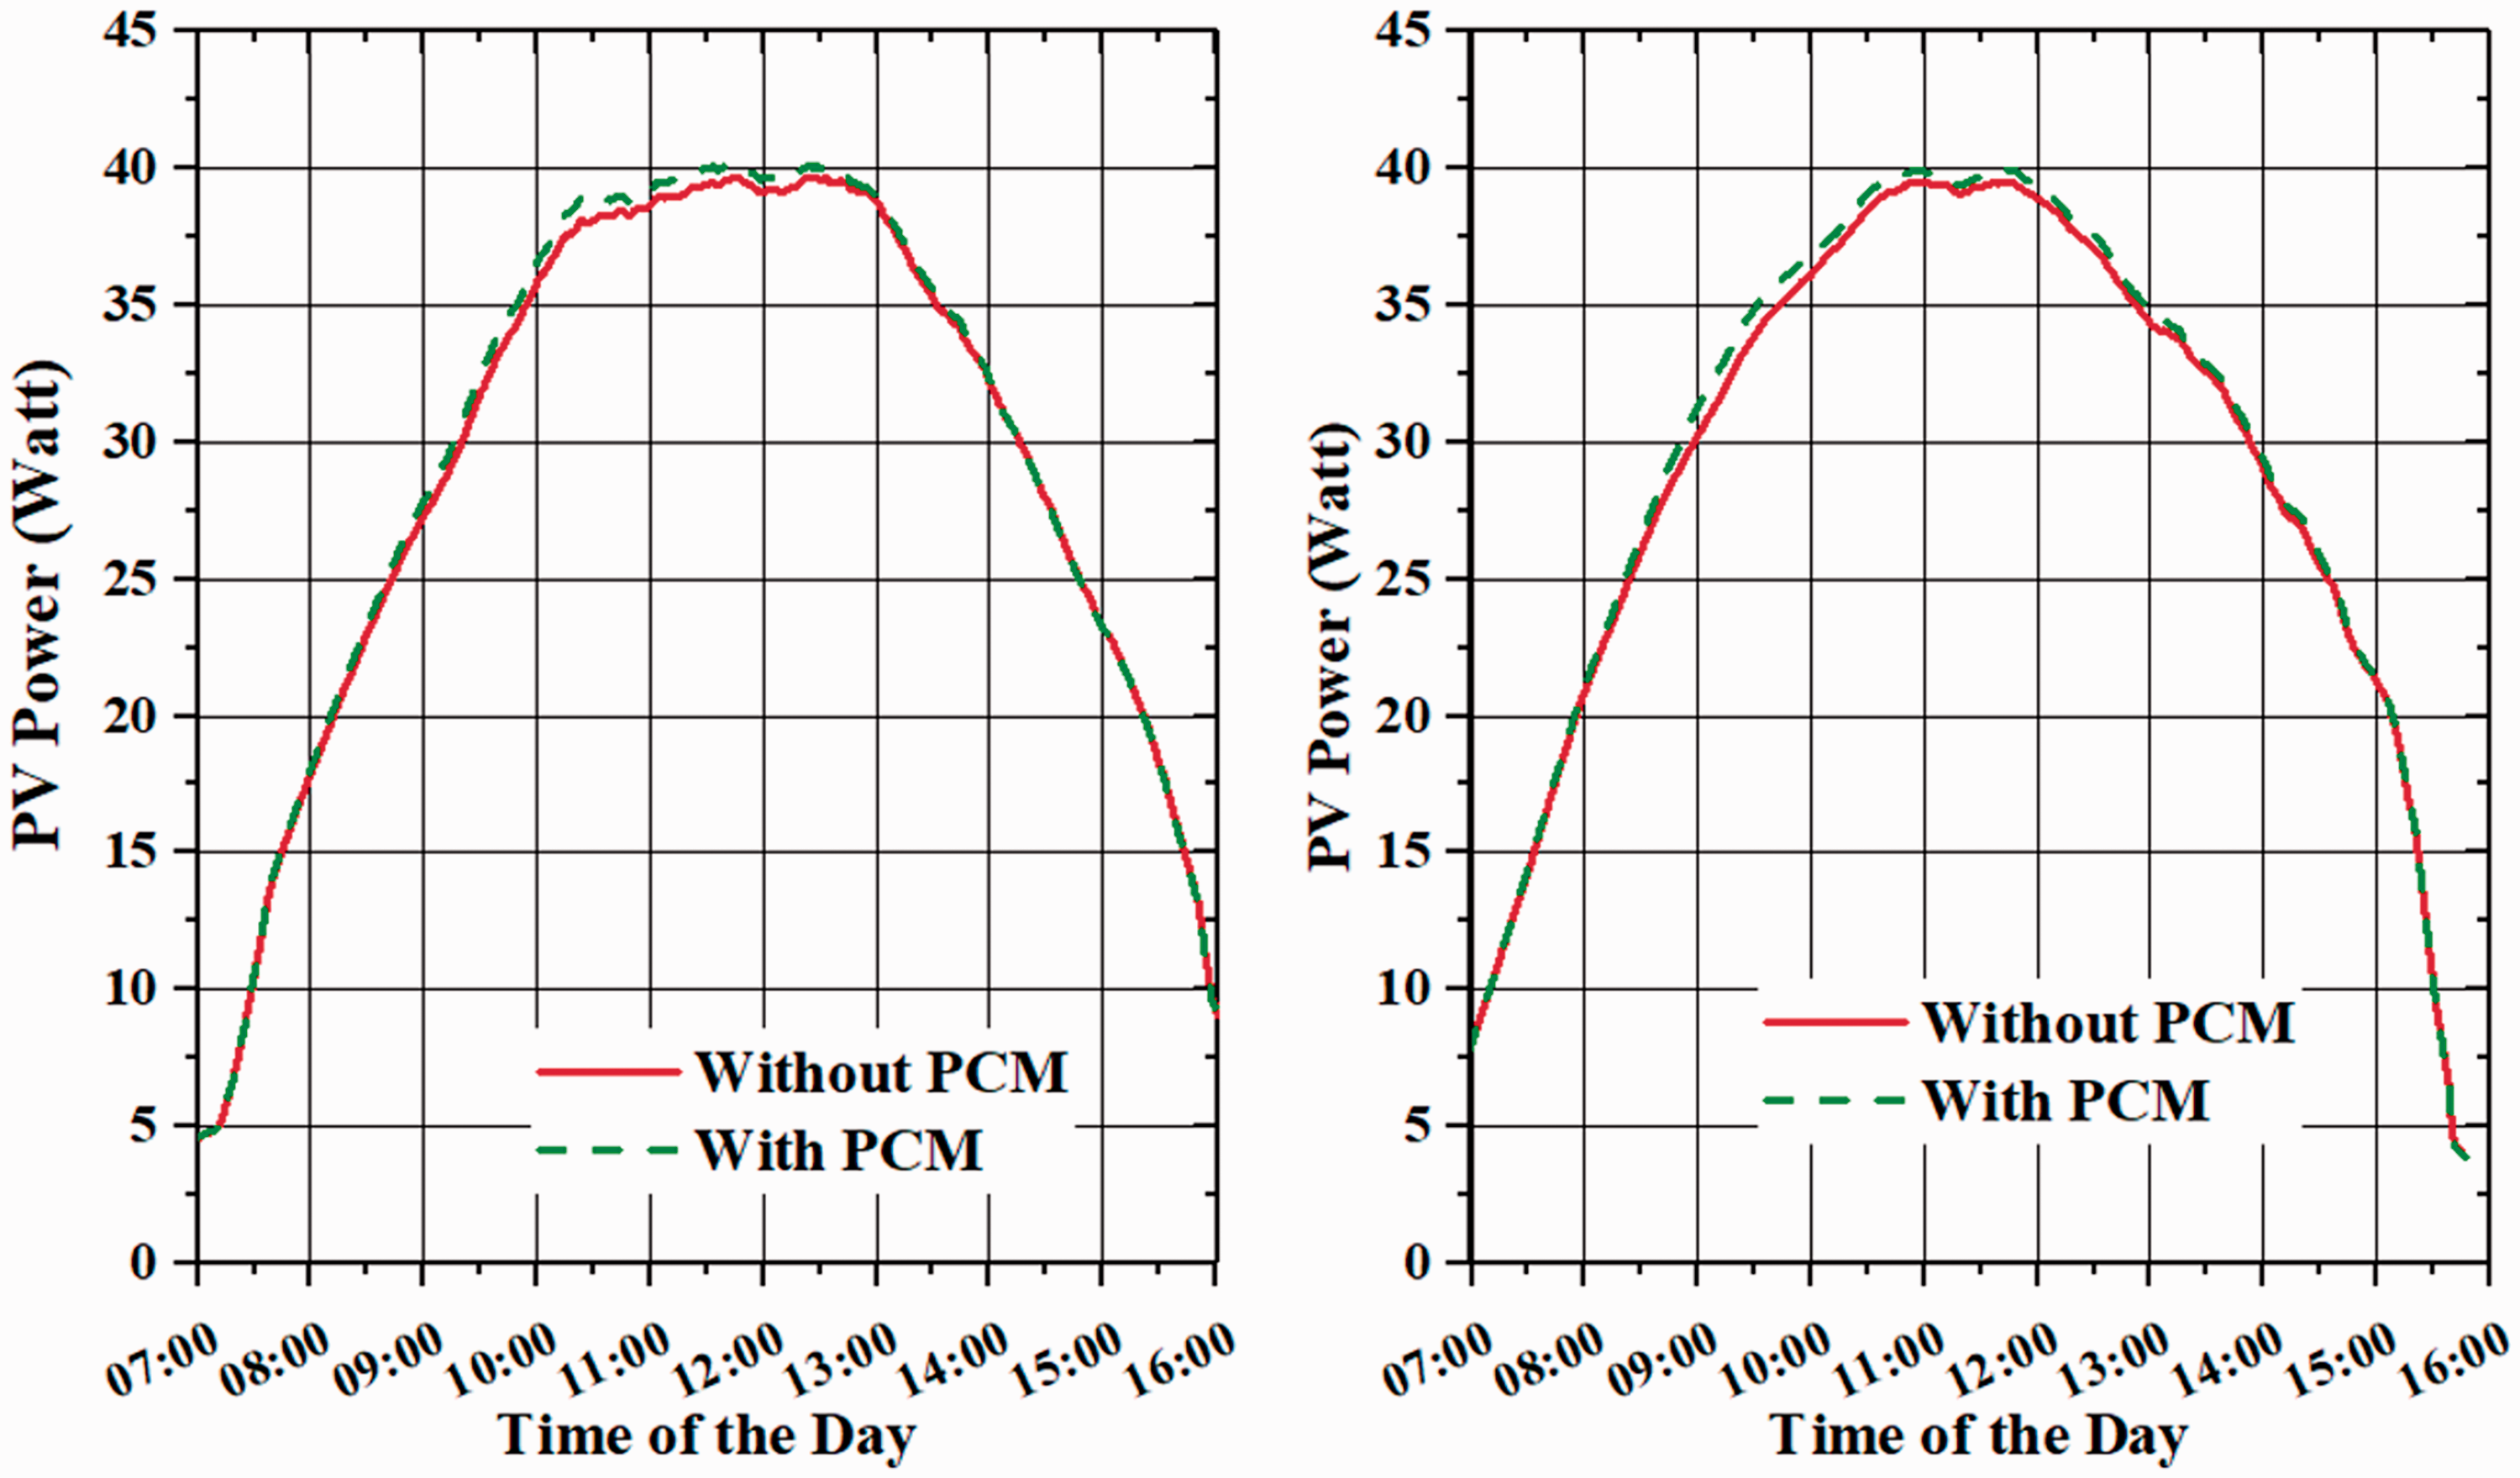
PV power with and without PCM for day 1 and day 2. PV: photovoltaic; PCM: phase change material.
In equation (4), ηPV is the electrical conversion efficiency of the PV module calculated by equation (2). τα is the transmittance and absorptance product of the PV cover for solar radiation. S is the solar radiation fall on the PV module recorded using the pyranometer, and APV is the PV module effective area.
It can be observed in Figure 11 that there is a slight difference between the power produced by the conventional PV module and PV module integrated with PCM. The difference in the power produced started at 9:00 and lasts till 14:00. It can be observed that during the time period when the efficiency enhancement was negative (Figure 10), the power produced was not affected so much mainly due to the low solar radiation at that time. During day 1, the total energy produced by conventional PCM was 260 Wh/day while PV module integrated with PCM produced ∼267 Wh/day. While during day 2, the total energy produced by conventional PCM was 256 Wh/day and PV module integrated with PCM produced ∼264 Wh/day. Therefore, during both days, it was observed an increment of ∼2.8% to 3.0% in the total energy produced by the conventional PV and PV integrated with PCM. PCM with a melting point of 30°C changed its phase when the temperature of the conventional PV module was in the range of 32°C to 47°C (Figure 2). If PCM with high melting temperature (35°C–40°C) is used, then it is possible that PCM phase change effect will take place during high solar radiation time period, and its effect on the power enhancement will be more significant. Also, it should be noted that these results are obtained with only 1.0 kg of the PCM spread over the area of 0.29 m2.
The increment in the energy yield and efficiency shown in Figures 10 and 11 does not deviate too much from the literature. For example, Park et al. (2014) reported a 3% increase in the electrical output using 23 kg of PCM per meter square of the PV area. Similarly, Hasan et al. (2016) reported a 5.5% increase in the electrical yield of the PV module when using ∼24 kg of PCM per meter square of the PV area. In another study (Atkin & Farid, 2015), the maximum gain in the electrical efficiency was reported up to 2.5% and increase in the electrical yield was 9.6% when using 22 kg of PCM per meter square of the PV area. While the current results are obtained using PCM spread over the area of 0.29 m2 or 3.5 kg of PCM per meter square of the PV area. The abovementioned studies are compared with the current study in the coming section.
Energy balance of PV module with and without PCM
In this section, the energy balance of the conventional PV module and PV module integrated with PCM is presented and discussed. Energy balance is presented for day 1 for the time period from 7:00 till 16:00. The total energy falling on the surface of the PV module and energy losses from the PV module is calculated using equation (5) (Hasan et al., 2016).

QL_F is the total energy lost from the front surface, QL_B is the total energy lost from the back side of the PV module, QS is the total energy stored by the PV, and QE is the electrical energy from PV modules during sunshine hours. “QIn” is the total energy falling on the PV module surface which is the same for both PV modules. It is calculated using the relation given in the following equation by Hachem et al. (2017)

In equation (6), “τα” is the product of transmission and absorption coefficient of glazing. “APV” is the surface area of the PV module (as given in Table 2) and “S” is the total radiation falling on the tilted PV surface recorded by the pyranometer.
Heat losses from the front surface
In equation (5), “QL_F” is the sum of the convection losses (Qconv) and the radiation losses (Qrad) from the front surface of the PV module. Convection losses from the front surface are the sum of the free convection losses and convection losses due to the wind as shown in the following equation


In equation (8), hfront is the effective convective heat transfer coefficient from the front surface of the PV module given by Armstrong and Hurley (2010). hfront is derived from the combination of the free and forced convective heat transfer coefficients (Armstrong & Hurley, 2010; Churchill, 1977; Jhc and Sark, 2013) as given in the following equation
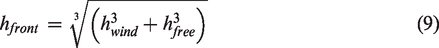
In equation (9), hwind is the convective heat transfer coefficient due to wind while hfree is the free convection heat transfer coefficient from the front surface. There are different correlations reported in the literature to calculate the hwind, in the current study correlations reported by Armstrong and Hurley (2010) and Sharples and Charlesworth (1998) has been used as the experimental setup for the work described in this work is comparable with the one used by Sharples and Charlesworth (1998). Also Armstrong and Hurley (2010) have successfully used the following relation

To calculate the heat losses due to free convection from the front and the back surface of the PV module, the correlation given in equation (11) has been used. The Nusselt number in equation (11) has been calculated using relation provided by Cengel (2006).
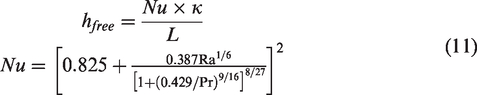
In equation, (11) “Ra” is the Rayleigh number and “Pr” is the Prandtl number. Heat losses from the front surface through radiation are calculated using the following relation

σ is the Stefan–Boltzmann constant, ɛ is the emissivity of the module, and F is the view factor. Sky temperature in equation (12) is calculated using the Swinbank equation (Swinbank, 1963) as follows
Heat losses from the back surface
Convection losses from the back surface of the conventional PV module are calculated as given in equation (11). As mentioned before in PV-PCM system, PCM-filled circular tubes were attached to the back of the PV module. To calculate convective losses from these circular tubes, the correlation provided by Stewart (1981) is used. Stewart (1981) experimentally determined the natural convection from inclined cylinders. The average Nusselt number provided in equation (14) is used to calculate heat transfer from the PCM-filled circular tubes.
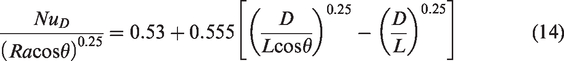
In equation (14) “L” is the critical length and “θ” is the inclination angle of the PV module. Radiative heat losses from the back side are calculated in the same manner as provided in equation (12). The only difference was that instead of the “Tsky” in equation (12), Tground was used, and it was kept equal to the ambient temperature (Armstrong & Hurley, 2010).
Heat stored in PV module
Energy stored in the PV system is calculated using the following relation (Hasan et al., 2016)

Density (ρ), specific heat (Cp), and thickness (t) of the different components of the PV module, in equation (15), which is used in the calculation of the energy stored in the PV module are tabulated in Table 2.
Energy balance results, for the experimental day 1, calculated using equations (5) to (15) are presented in Figure 12(a) and (b). Figure 12(a) shows the total energy falling on the surface of the PV module and totally energy out from both PV modules in terms of Wh/day while Figure 12(b) shows the share of each type of energy lost from PV module in terms of percentage. The total energy received by both modules, from 7:00 till 16:00, was 1770 Wh/day. Energy lost from the front was higher in case of conventional PV module while in case of the PV-PCM system it was observed much reduced due to a lower operative temperature of the PV module integrated with PCM. Electrical energy produced by the conventional PV module was 260 Wh/day that was increased up to ∼267 Wh/day almost 2.8% higher compared to the conventional PV module. Heat lost from the back of the PV module integrated with PCM was also lower compared to the conventional PV due to a low operating temperature of the PV-PCM system. But the heat loss from the back surface of the PV-PCM module was not so much affected compared to the heat losses from the front surface due to the presence of the PCM-filled tubes that worked as fins to remove more heat from PV module.
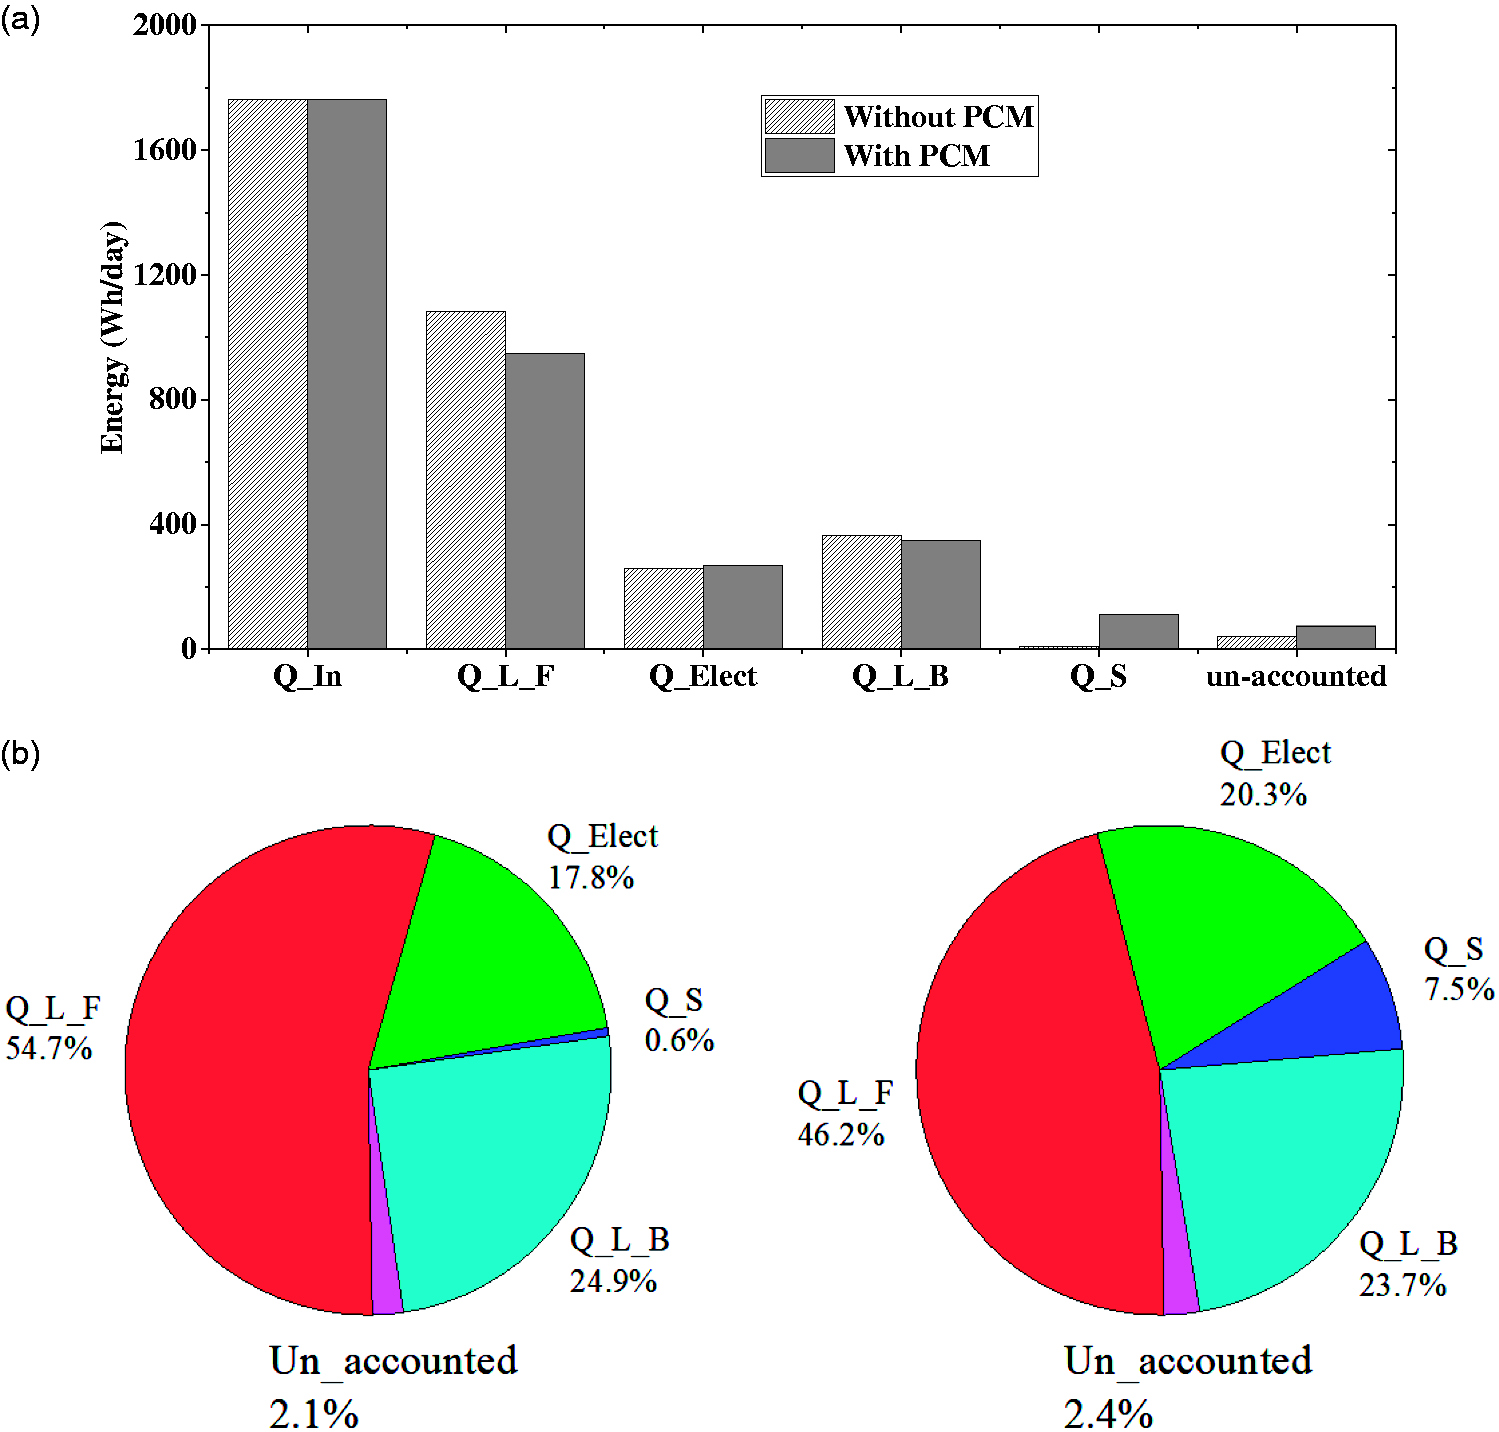
Energy balance of PV and PV-PCM system for day 1. PCM: phase change material.
Energy stored in the PV module integrated with PCM was ∼7.0% higher compared to the conventional PV module. Due to which during the afternoon time period conventional PV module cooled down more quickly compared to the PV module integrated with PCM. When the current energy balance is compared with the study conducted by Hasan et al. (2016), the trend of the energy lost from the PV front surface and PV back surface is very similar except the energy stored in the PV-PCM system which is very low in the current study. This is mainly as the quantity of the PCM used by Hasan et al. (2016) was 13 kg, and in the current study, ∼1.0 kg of PCM has been used. More detailed comparison of the present study with already published studies is conducted in the following section. In Figure 12(a) and (b), approximately 2% are the unaccounted losses that appeared during the calculation process. These unaccounted losses may arise due to measurement inaccuracy or certain device errors.
A brief economic analysis
It is difficult to conduct an accurate and precise economic analysis, including a payback period of the modified PV-PCM module at this very early stage; however, some indication of the relative expense and materials used is provided and discussed here. PCM was locally purchased at the rate $5.50 per kg. The metallic tubes were also locally purchased. The total cost of metallic tubes used during experiments was $10.50. Thermal bonding and thermal grease were also locally available at a very low cost of $4.00. Therefore, the total cost incurred for the thermal regulation of the conventional PV module was $20, ($62/m2 of the PV area or $0.40/W of the PV power). Comparing the cost of the modified PV-PCM system with other published studies, Atkin and Farid (2015) estimated that the total cost of the modified PV-PCM system was $139/m2 of the PV area excluding PV cost. In comparison, the total cost of the current PV-PCM system is 55% lower. The cost incurred for the current system can be further reduced using PCM which is less expensive like salt hydrates that are available at the rate of $2.20 per kg. In the current study, paraffin-based PCMs are used due to availability in the local market.
Comparison with published studies
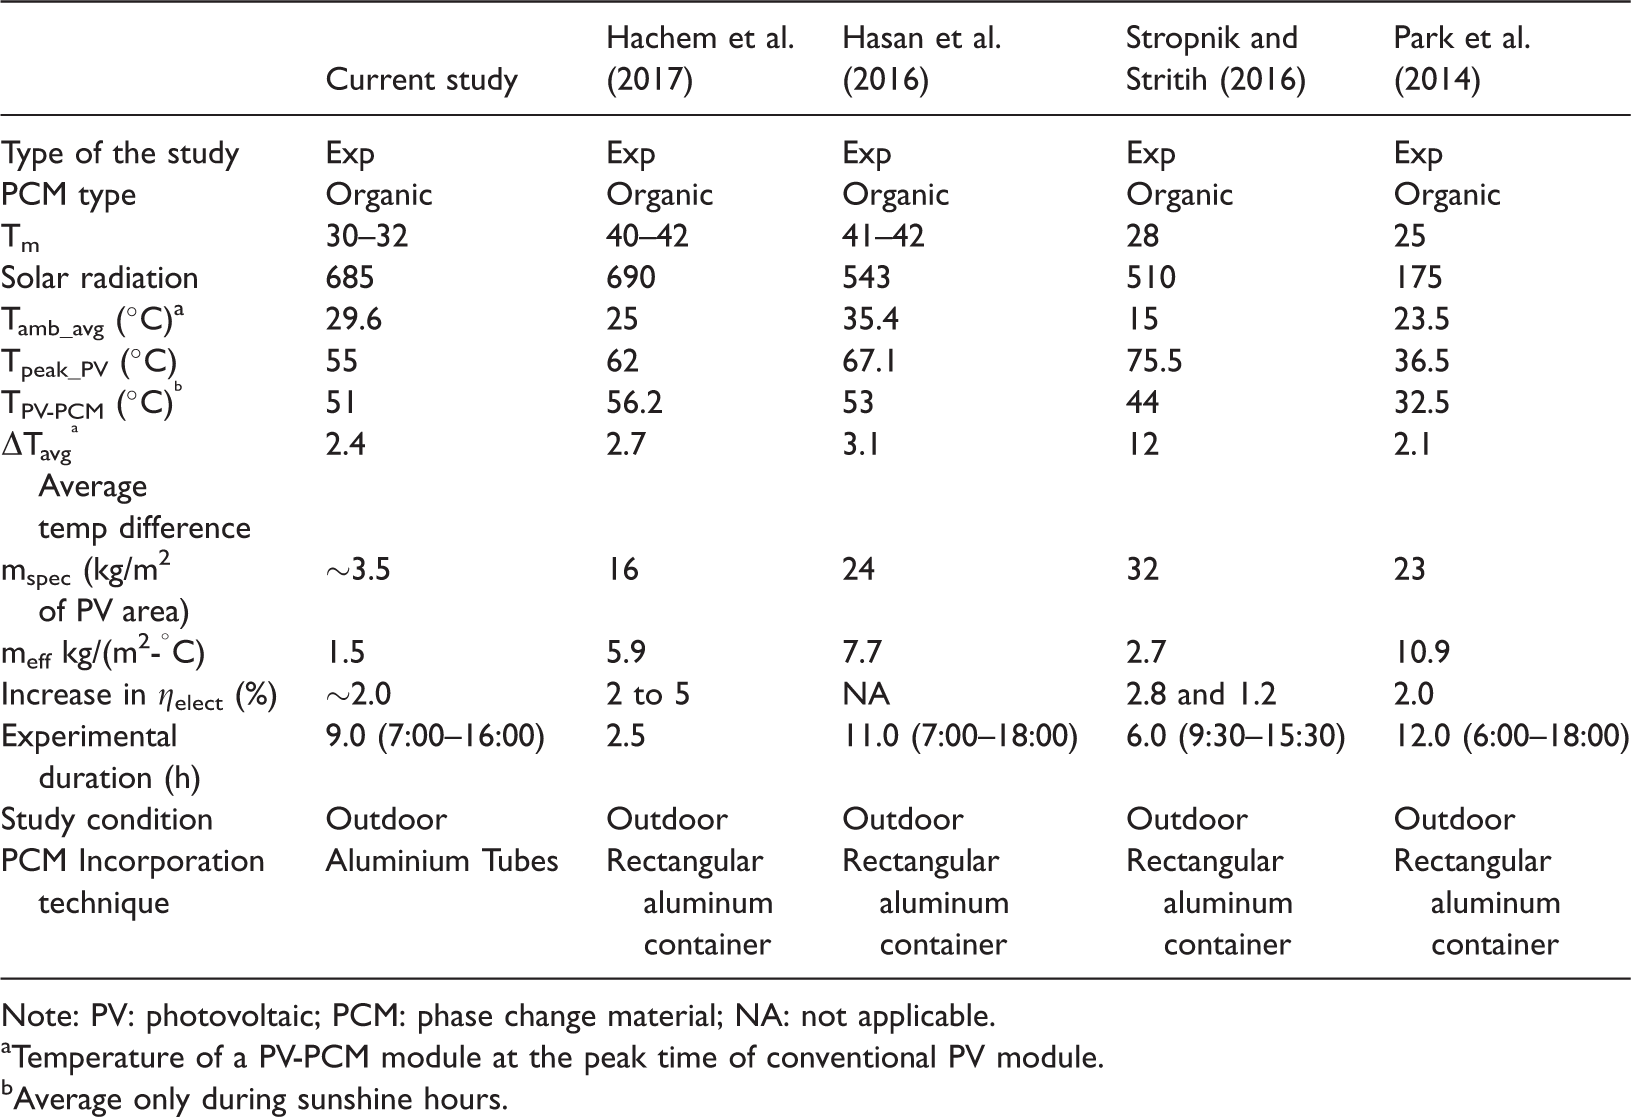
In this section, the results of the current research study are compared with the recently published literature on the same topic. Results and findings of different studies have been summarized and tabulated in Table 3. Following terms have been used to analyze and compare the results tabulated in Table 3:
Comparison between published studies and current research.
Note: PV: photovoltaic; PCM: phase change material; NA: not applicable.
Temperature of a PV-PCM module at the peak time of conventional PV module.
Average only during sunshine hours.
Tpeak_PV = peak temperature of the PV module without PCM.
TPV-PCM = temperature of a PV-PCM module at “Tpeak_PV” time.
ΔTavg = average temperature difference between conventional PV and PV-PCM during the sunshine hour (7:00–16:00).
Specific mass of PCM = mspec = mPCM/PV area (kg/m2).
Specific mass of PCM (mspec) is used to analyze and compare how much mass of the PCM per meter square of the PV area has been used by different authors and in the current study.
Effective mass coefficient = meff = mspec/ΔTavg kg/(m2-°C)
The effective mass coefficient is used to analyze how much specific mass of the PCM has been used to decrease 1° of ΔTavg.
For comparison, only those studies have been selected which are based on experimental work and conducted in the outdoor conditions. Some of the comparative results are discussed below:
Average solar radiation observed during the current research time period was 685 W/m2 (7:00–16:00), and average ambient temperature during this time period was ∼30°C. Hachem et al. (2017) reported 690 W/m2 and 27°C. Hasan et al. (2016) reported 543 W/m2 while the average ambient temperature was 35.4°C. Park et al. (2014) conducted experiments in very low solar radiation and reported 175 W/m2 with an average ambient temperature of 23.5°C. In the current study, 3.5 kg of PCM per meter square of the PV area has been used to achieve the temperature difference (ΔTavg) of 2.3°C. ΔTavg is the average temperature difference between conventional PV and PV-PCM module during sunshine hours. Hachem et al. (2017) reported ΔTavg = 2.7°C using 16 kg/m2, Hasan et al. (2016) reported ΔTavg = 3.1°C using 24 kg/m2, and Park et al. (2014) reported 2.1°C using 23 kg/m2. Only Stropnik and Stritih (2016) reported ΔTavg as high as 12°C using the specific mass of PCM 32 kg/m2. In the current study, 1.5 kg of PCM (per meter square of the PV area) has been used to reduce 1° of PV temperature, while for other studies it is very high as Hachem et al. (2017) reported 5.9 kg/(m2-°C), Hasan et al. (2016) reported 7.7 kg/(m2-°C), Stropnik and Stritih (2016) reported 2.7 kg/(m2-°C), and Park et al. (2014) reported 10.9 kg/(m2-°C). Change in the electrical efficiency reported in the current study is also comparable to other studies which have used a high quantity of PCM. In current study, the average enhancement in the electrical conversion efficiency is observed up to ∼2.0% while Hachem et al. (2017) reported 2% to 5%, Stropnik and Stritih (2016) reported up to 2.8%, and Park et al. (2014) reported 2.0%. The quantity of the PCM used during the current research also shows that the overall weight of the PV-PCM system with current configuration is very much less compared to the other studies.
The abovementioned comparison shows that the results obtained by the current experimental research work do not deviate too much from the recently published literature on the same topic except the mass of the PCM used to regulate the PV module temperature. As observed in Figures 4 and 5, the temperature of the PV module was kept low even when the whole PCM was melted. PCM-filled tubes assisted in enhancing the natural convection heat transfer from the PV module rather suppressing it which is observed an issue with PCM-filled rectangular containers attached to the back side of the conventional PV modules.
Conclusions and future outlook
Thermal management of the conventional monocrystalline PV module using PCM has been discussed and analyzed in the current research article. PCM filled in the aluminum tubes were attached to the back side of the PV module. The total mass of the PCM accommodated in these tubes was ∼1.0 kg which was spread over the PV area of 0.29 m2. Experiments were conducted in the outdoor conditions of Hefei, China, during the month of October. Experimental results showed that the surface temperature of the PV-PCM module was 6°C to 9°C lower compared to the conventional PV module during the experimental time period. At an average, PV module temperature was reduced up to ∼2.4°C and ∼2.7°C during day 1 and day 2, respectively. It was also observed that PCM-filled tubes assisted in enhancing the natural convection as the temperature of the PV-PCM module was kept lower even after the complete utilization of the latent heat of the PCM especially during afternoon time period. The electrical conversion efficiency of the modified PV-PCM module enhanced up to 3% while the power enhanced up to 2.8% to 3.0%. Results presented in the current research are comparable with the existing studies on PV-PCM topic except that the mass of the PCM used in the current study is very less compared to the other studies.
Current research work has been observed effective for the thermal management of the conventional PV modules. One of the future works is to further utilize the heat collected by the PCM from PV modules otherwise for building applications or other heating application. To keep and establish an ideal thermal contact between PCM-filled tubes and PV back surface is also a challenging work and needs further research. Although it has been worked to keep a high thermal contact between PCM tubes and PV back, it still needs further improvement. Selection of the appropriate melting point of the PCM that only changes phase during the time period when there is high solar radiation is also challenging and some criteria needed to be developed to select the PCM melting point.
Footnotes
Declaration of conflicting interests
The author(s) declared no potential conflicts of interest with respect to the research, authorship, and/or publication of this article.
Funding
The author(s) disclosed receipt of the following financial support for the research, authorship, and/or publication of this article: This study is supported by the Bureau of International Cooperation, Chinese Academy of Sciences (211134KYSB20160005), National Key R&D Plan, Grant No. 2016YFE0124800, and Dong Guan Innovative Research Team Program, Grant No. “2014607101008.”