
Abstract
Nations are working to cut greenhouse gas emissions and switch to sustainable, low-carbon energy sources. Because of its scalability, adaptability, increasing efficiency and continually declining cost, solar photovoltaic (PV) technology has become one of the most promising renewable energy sources. In Ireland, interest in renewable energy, particularly PV, has grown rapidly in the last decade even though the climate, often marked by significant cloud cover, poses difficulties for PV system efficiency. The remarkable growth in the PV sector in Ireland can be attributed in many ways to the savings achievable for electricity consumers due to current Government policies and incentives. One of the most effective policies in recent years was the introduction of a feed-in-tariff (FIT) in 2022 for electricity consumers. Prior to this, excess electricity generated by solar PV was lost, if not self-consumed. Batteries can be utilised to store extra electricity produced during the day to supply it back to the system during peak periods or in the evening when solar production is at a minimum. This strategy encourages load shifting, peak shaving, and increased energy self-sufficiency in general. This case study looks at the financial feasibility of combining battery storage with solar PV installations. It uses electricity consumption and PV production data from an educational building located in Ireland. Using solar irradiance figures for the case study location along with day-night tariffs and FIT data, the authors found that the Simple Payback Period for investment in batteries is 11 years, only 1 year more than without batteries. This is despite the case study building being recognised as one of the most sustainable buildings in Ireland and the UK, characterised by inherently low electricity consumption levels. In addition to the financial justification for installing batteries, there is a strong argument for their potential to reduce carbon emissions. To illustrate their environmental value, carbon modelling calculations are conducted in parallel with financial analyses.
Practical Application
Ireland has set ambitious renewable energy targets as part of its commitment to national and international agreements to reduce greenhouse gas emissions, reduce dependency on fossil fuels and ensure energy security. This study examines the PV with Battery Storage market in Ireland – the current installed capacity, evaluation of the technical performance of battery storage technology, Government policy/support mechanisms etc, all of which provides insights for researchers, electricity consumers and policymakers. It is concluded that whilst the payback period for adding battery storage to a PV installation remains relatively high despite the continuing reduction in capital costs, the security of supply, the reduction in carbon emissions and the ability to load shift effectively to maximise self-consumption make this a very attractive solution for electricity consumers.
Literature review
Renewable energy targets in Ireland
Climate change is not a particularly divisive issue in Ireland, with 96% of the population acknowledging the importance of climate change in the recent Environmental Protection Agency (EPA) Climate Change in the Irish Mind publication. 1 The most recent publication regarding energy targets by the Irish Government is the Climate Action Plan 2024 (CAP24). 2 CAP24 went through an extensive public consultation prior to publication, resulting in a document which has been approved by public evaluation. CAP24 sets out the actions required to align with Ireland’s obligations under national and international treaties, particularly the Paris Agreement of 2015 3 and European Green Deal of 2020. 4 The focus of CAP24 is how to achieve the targets of halving carbon dioxide emissions by 2030 and reaching net-zero emissions by 2050. A net-zero or carbon neutral emissions target by 2050 is ambitious and requires innovative solutions across all sectors, including energy. The electricity sector has an emissions ceiling of 40 million tonnes of carbon dioxide equivalent (MtCO2eq) for 2021-2025, reducing to 20 (MtCO2eq) for 2026-2030 – resulting in a 75% reduction in emissions by 2030 based on 2018 levels. In terms of renewable electricity share, this needs to increase from 50% to 80% by 2030, requiring the deployment of up to 8 GW of additional solar powered projects by 2030.
Photovoltaic applications in Ireland
In Ireland, 67.4% of renewable energy generated is used for electricity generation. The largest renewable electricity generator is wind, at 33.7% of total demand, while solar PV is significantly lower at 1.9%; although this is increasing steadily according to the Sustainable Energy Authority of Ireland (SEAI). 5 Ireland’s total capacity of Solar PV in 2024 is 1185 MW, up from 680 MW in 2023. The largest proportion of this comes from utility scale production installations (i.e. greater than 5 MW) at 594 MW, followed closely by micro-generation installations (i.e. domestic properties) at 373 MW. Mini-generation production (i.e. from businesses, farms, other commercial operations and public buildings) is the term used for projects which typically have a capacity between 17 kW and 50 kW. This sector of the market accounts for 26 MW of the total capacity, up from 5 MW in 2023.
Technical performance evaluation of battery storage in PV systems
In Ireland, the deployment of battery storage systems alongside PV installations is gaining interest, particularly in the domestic market. Šimić et al 6 produced a report overviewing battery energy storage technology and they concluded that batteries are ideal for continuous energy storage applications because of their quick response time, short construction time, modularity and flexibility. Battery storage systems are a very efficient way of utilising excess electricity, regardless of how the electricity was generated or the end consumption pattern. Batteries are charged to store the electrical energy in the form of an internal chemical reaction. When this process is reversed, the chemical reaction will discharge the stored electrical energy, Yeleti et al. 7
Battery storage technologies are rapidly evolving, driven by advancements in materials science, engineering, and manufacturing. Saldarini et al 8 looked at the evolving landscape of battery electric storage systems and concluded that ongoing research, increased investment, strengthened regulations on battery management/recycling and the implementation of tax incentives for the installation of energy storage systems would drive positive changes in the industry, paving the way for broader adoption and integration of battery storage solutions. In Ireland, there are no Government financial incentives specifically for utilising battery storage; the grant schemes currently in place offer funding based on PV system size rather than individual components.
In photovoltaic applications, lithium-ion, lead-acid, and more recent technologies like flow and aqueous batteries are the most widely utilised battery types. Because of their high energy density and falling costs, lithium-ion batteries have emerged as the dominating technology according to the International Renewable Energy Agency. 9 Lithium-ion batteries use a positive electrode (cathode), an anode (negative electrode) and electrolyte as the conductor. When a lithium-ion battery is discharged, the ions flow from the cathode to the anode via the electrolyte and during the charging process, the order of flow is reversed. Lithium-ion batteries are used in this case study.
Battery performance can degrade over time due to factors such as cycling frequency and environmental conditions, Hassan et al. 10 Technical data is provided by battery manufacturers; however, these numbers are only relevant in factory-controlled installations. Payback periods for battery storage installations mainly depend on the cost of the chosen battery; despite significant reductions in the cost of both PV panels and batteries, cost remains the most significant barrier for many electricity consumers. The increasing market demand for lithium-ion batteries requires an increased number of critical metals such as lithium, cobalt and nickel, creating resource shortages and increased production costs, according to Von Wald Cresce. 11
The capacity of the battery is another major factor in calculating payback costs. Ideally, the battery capacity should be sized to supply the load demand during peak usage hours when electricity tariffs are highest. The average energy consumed during the Peak Energy Demand (PED) hours divided by the average number of PED hours is one typical calculation used to find the optimum battery capacity, Seng et al. 12
Financial considerations
Earlier studies from Lang et al 13 focused on the technical economical assessment of off-grid hybrid energy systems for domestic and commercial buildings, however Sharma et al 14 considered the impact of grid tariffs on maximising the economic benefits of battery storage. Their calculations and analysis found that for a typical Norwegian domestic dwelling, electricity supply from the grid could be reduced by up to 21% when battery storage technology is utilised with a PV system. The typical dwelling has a floor area of 154 m2, it is facing south-west, the PV array size is 39.9 m2 with a capacity of 7.4kWp. Results are based on annual load profiles and PV generation data. Not surprisingly, for best use of battery storage systems in this case study, self-consumption is essential to overcome the low return on selling the excess electricity back to the grid, when compared with the high cost of buying the electricity from the grid. Another study on the economic viability for battery storage for solar PV systems by Hoppmann et al 15 found that investing in battery storage can be more advantageous for properties where electricity users are economically rational and where there is no FIT or an opportunity to sell excess electricity back to the grid. Therefore, economic benefits are very much dependant on the electricity tariffs in place in the region and whether grid power supply limits are introduced.
Government policy framework
The Irish Government has implemented various policies to promote the adoption of renewable energy, including PV systems and battery storage. Key policies include financial incentives, regulatory support, and targets for renewable energy adoption.
Government support schemes
SEAI grants for mini-generation/non-domestic solar PV and battery storage installations are as follows
5
: • Non-Domestic Microgen Grant (NDMG) – under the SEAI’s PV mini-generation support scheme, businesses, the agricultural sector, public sector bodies, schools, community centres and non-profit organisations are eligible to apply for the NDMG grant. The amount awarded depends on the system size up to a maximum of 1000kWp. It ranges from €900 for 1kWp to €2400 for 6 kWp, systems from 7kWp upwards are granted on a per kWp basis. Total funding up to €162,600 is available under this scheme. • Accelerated Capital Allowance (ACA) – this is a tax incentive scheme for sole traders, farmers or companies paying corporation/income tax on trading/professional income. The ACA scheme is in place to promote investment in energy efficient products and equipment, including Solar PV/battery storage technology equipment. The full cost of the equipment can be deducted from the profits in the year of purchase thereby reducing the tax liability for the organisation. • Energy Contracting Support Scheme – this scheme provides financial support to help businesses and public sector organisations deliver energy efficient and decarbonisation projects via Energy Performance Contracts (EPCs), Local Energy Supply Contracts (LESCs) and Energy Performance Guarantees (EPGs). Organisations can claim for consultancy and/or specialist advisory costs in relation to project appraisal/procurement of pay-for-performance energy contracts. Successful organisations will receive up to 75% funding up to a maximum value of €50,000 for EPCs/LESCs and €25,000 for EPGs.
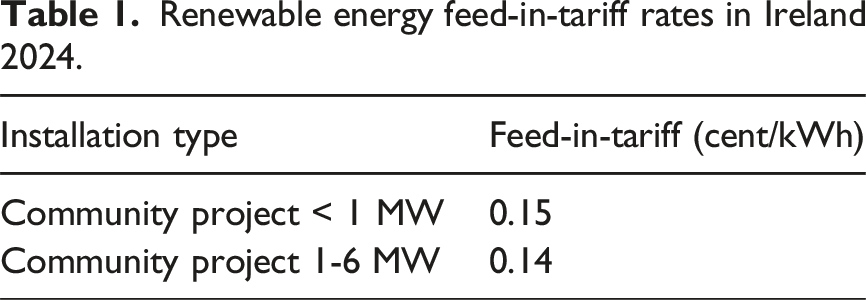
Government FIT scheme
Under the Microgeneration Support Scheme (MSS), the FIT in Ireland for non-domestic buildings, such as this case study is known as the Clean Export Premium (CEP). Introduced in Ireland in February 2022, this payment is made by electricity suppliers to individuals or entities that export excess electricity back to the grid. The CEP is for installations with capacities between 6 kWp and 50 kWp. The FIT is capped at 80% of the generation capacity to encourage self-consumption, according to the Irish Solar Energy Association. 16
Calculation methodology
To evaluate the performance and viability of solar PV systems with battery storage in Ireland, this case study employs a mixed-methods approach combining quantitative modelling and techno-economic analysis. Carbon emissions savings associated with a PV and battery installation are also calculated. A case study approach is used as it provides real world context. Recorded electricity generation and consumption data is available for analyses; this data is often difficult to capture through purely theoretical or abstract modelling approaches.
The method models consumption, production and storage for every hour of the day on the 21st day of the month. The daily data is multiplied by the number of days in the month and monthly figures are summed to give yearly figures. From this data, Simple Payback Period, Discounted Payback Period and Levelised Cost of Energy are calculated for three different scenarios. This is done using a spreadsheet.
System configuration summary
Under the Interreg EU Funding Programme, 18 the Northern Periphery and Artic (NPA) region supports sustainable energy projects. One successful project which showed innovation in energy technologies is the Centre for Renewable Energy & Sustainable Technology (CREST) building located on the campus of South West College (SWC), Co. Fermanagh, Northern Ireland. CREST was selected for a PV/battery installation as it is one of the most sustainable, energy efficient and environmentally remarkable buildings in Ireland. Opened in 2014, CREST is the Passive House Centre of Excellence for the region; a demonstration building for passive house design principles and renewable technologies. It is the first educational building in Northern Ireland to have achieved a combination of Passive House Certification, Building Research Establishment Environmental Assessment Method (BREEAM) Excellent and Net Carbon Zero.
The CREST building has a floor area of 455 m2 and features large south facing glazed panels to assist with solar gain and allow natural light to penetrate deep into the floor plan. This reduces the amount of artificial light required for the exhibition spaces. It incorporates solar control with brise-soleil on the south facing windows along with large overhangs, allowing winter solar gain even in times of low sun and reducing the occurrence of overheating from the high sun in the summer months
The base case scenario includes: • A 49 kW PV system comprising 45 kW of PV on a robotic solar tracker and 4 kW of static wall mounted panels. • A lithium-ion battery with 40 kWh usable capacity.
The consumption load profile is based on pre-occupancy predictions as well as post occupancy monitoring/recorded data. The generation load profile is based on recorded data.
CREST building – electricity consumption & production
Electricity consumption data
Heating for the building is provided via an air to water heat pump, with under floor heating distribution. The heat demand is therefore assumed to be uniform over a 24-h period.
The monthly heating demand for the year 2015 was published by McCarron
19
and is presented in Figure 1 below. Further analysis by McCarron
19
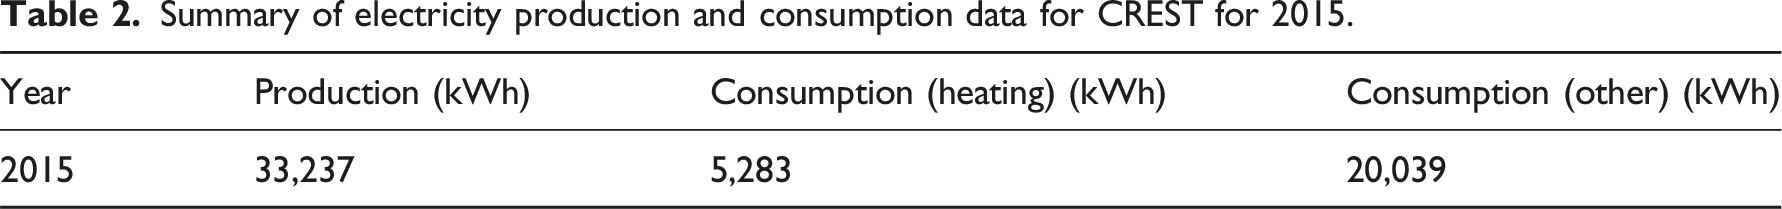
using the Passive House Planning Package (PHPP) estimated a heating load of 11.3 (kWh/m2. a) compared to 11.6 (kWh/m2. a) from post occupancy monitoring. The monthly calculated figures from the PHPP are scaled to give a total annual heat demand for the building (455 m2) of 5,283kWh, which is the figure obtained from post occupancy data. The total electricity usage for the building for 2015, obtained from Kelly,
20
is 25,322kWh. This gives an annual usage of 20,039 kWh for non-heating related use. Since this is due to the day-to-day use of the building, it is assumed to be uniform over the course of the year and uniform from 9a.m. to 7p.m. This gives a consumption rate of 5.49 kW. Monthly heating and other electricity demand for CREST.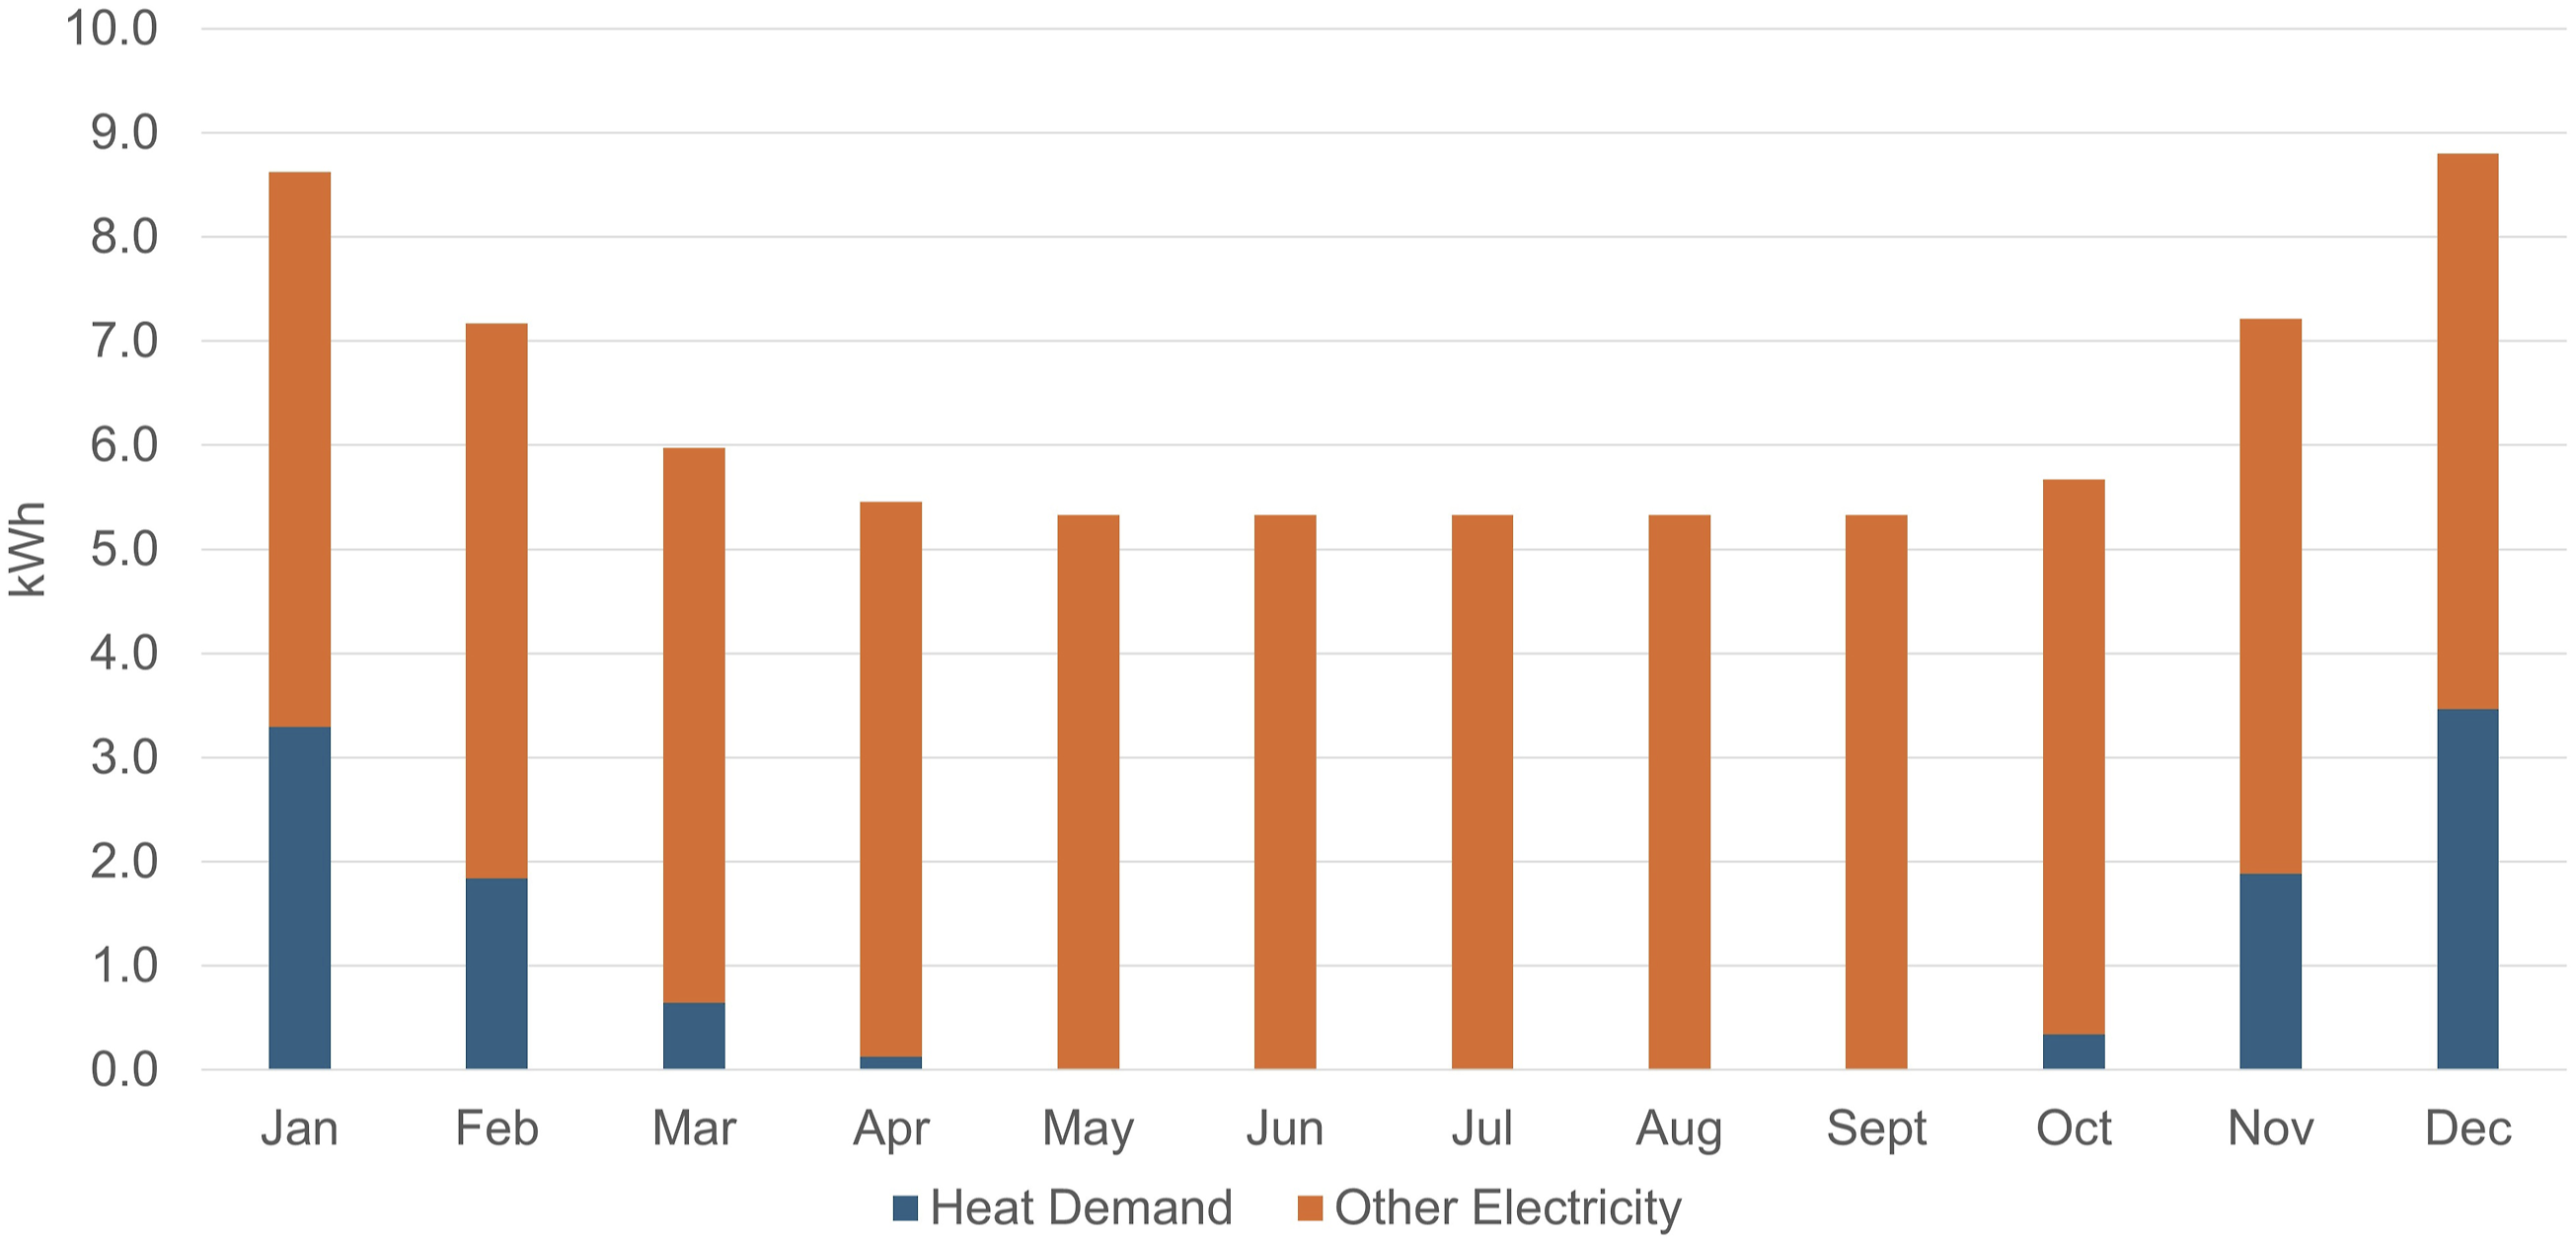
Electricity production data
Monthly Solar Production figures were also taken from McCarron
19
and presented in Figure 2 below. This sums to an annual total of 33,237 kWh. Monthly solar generation for CREST.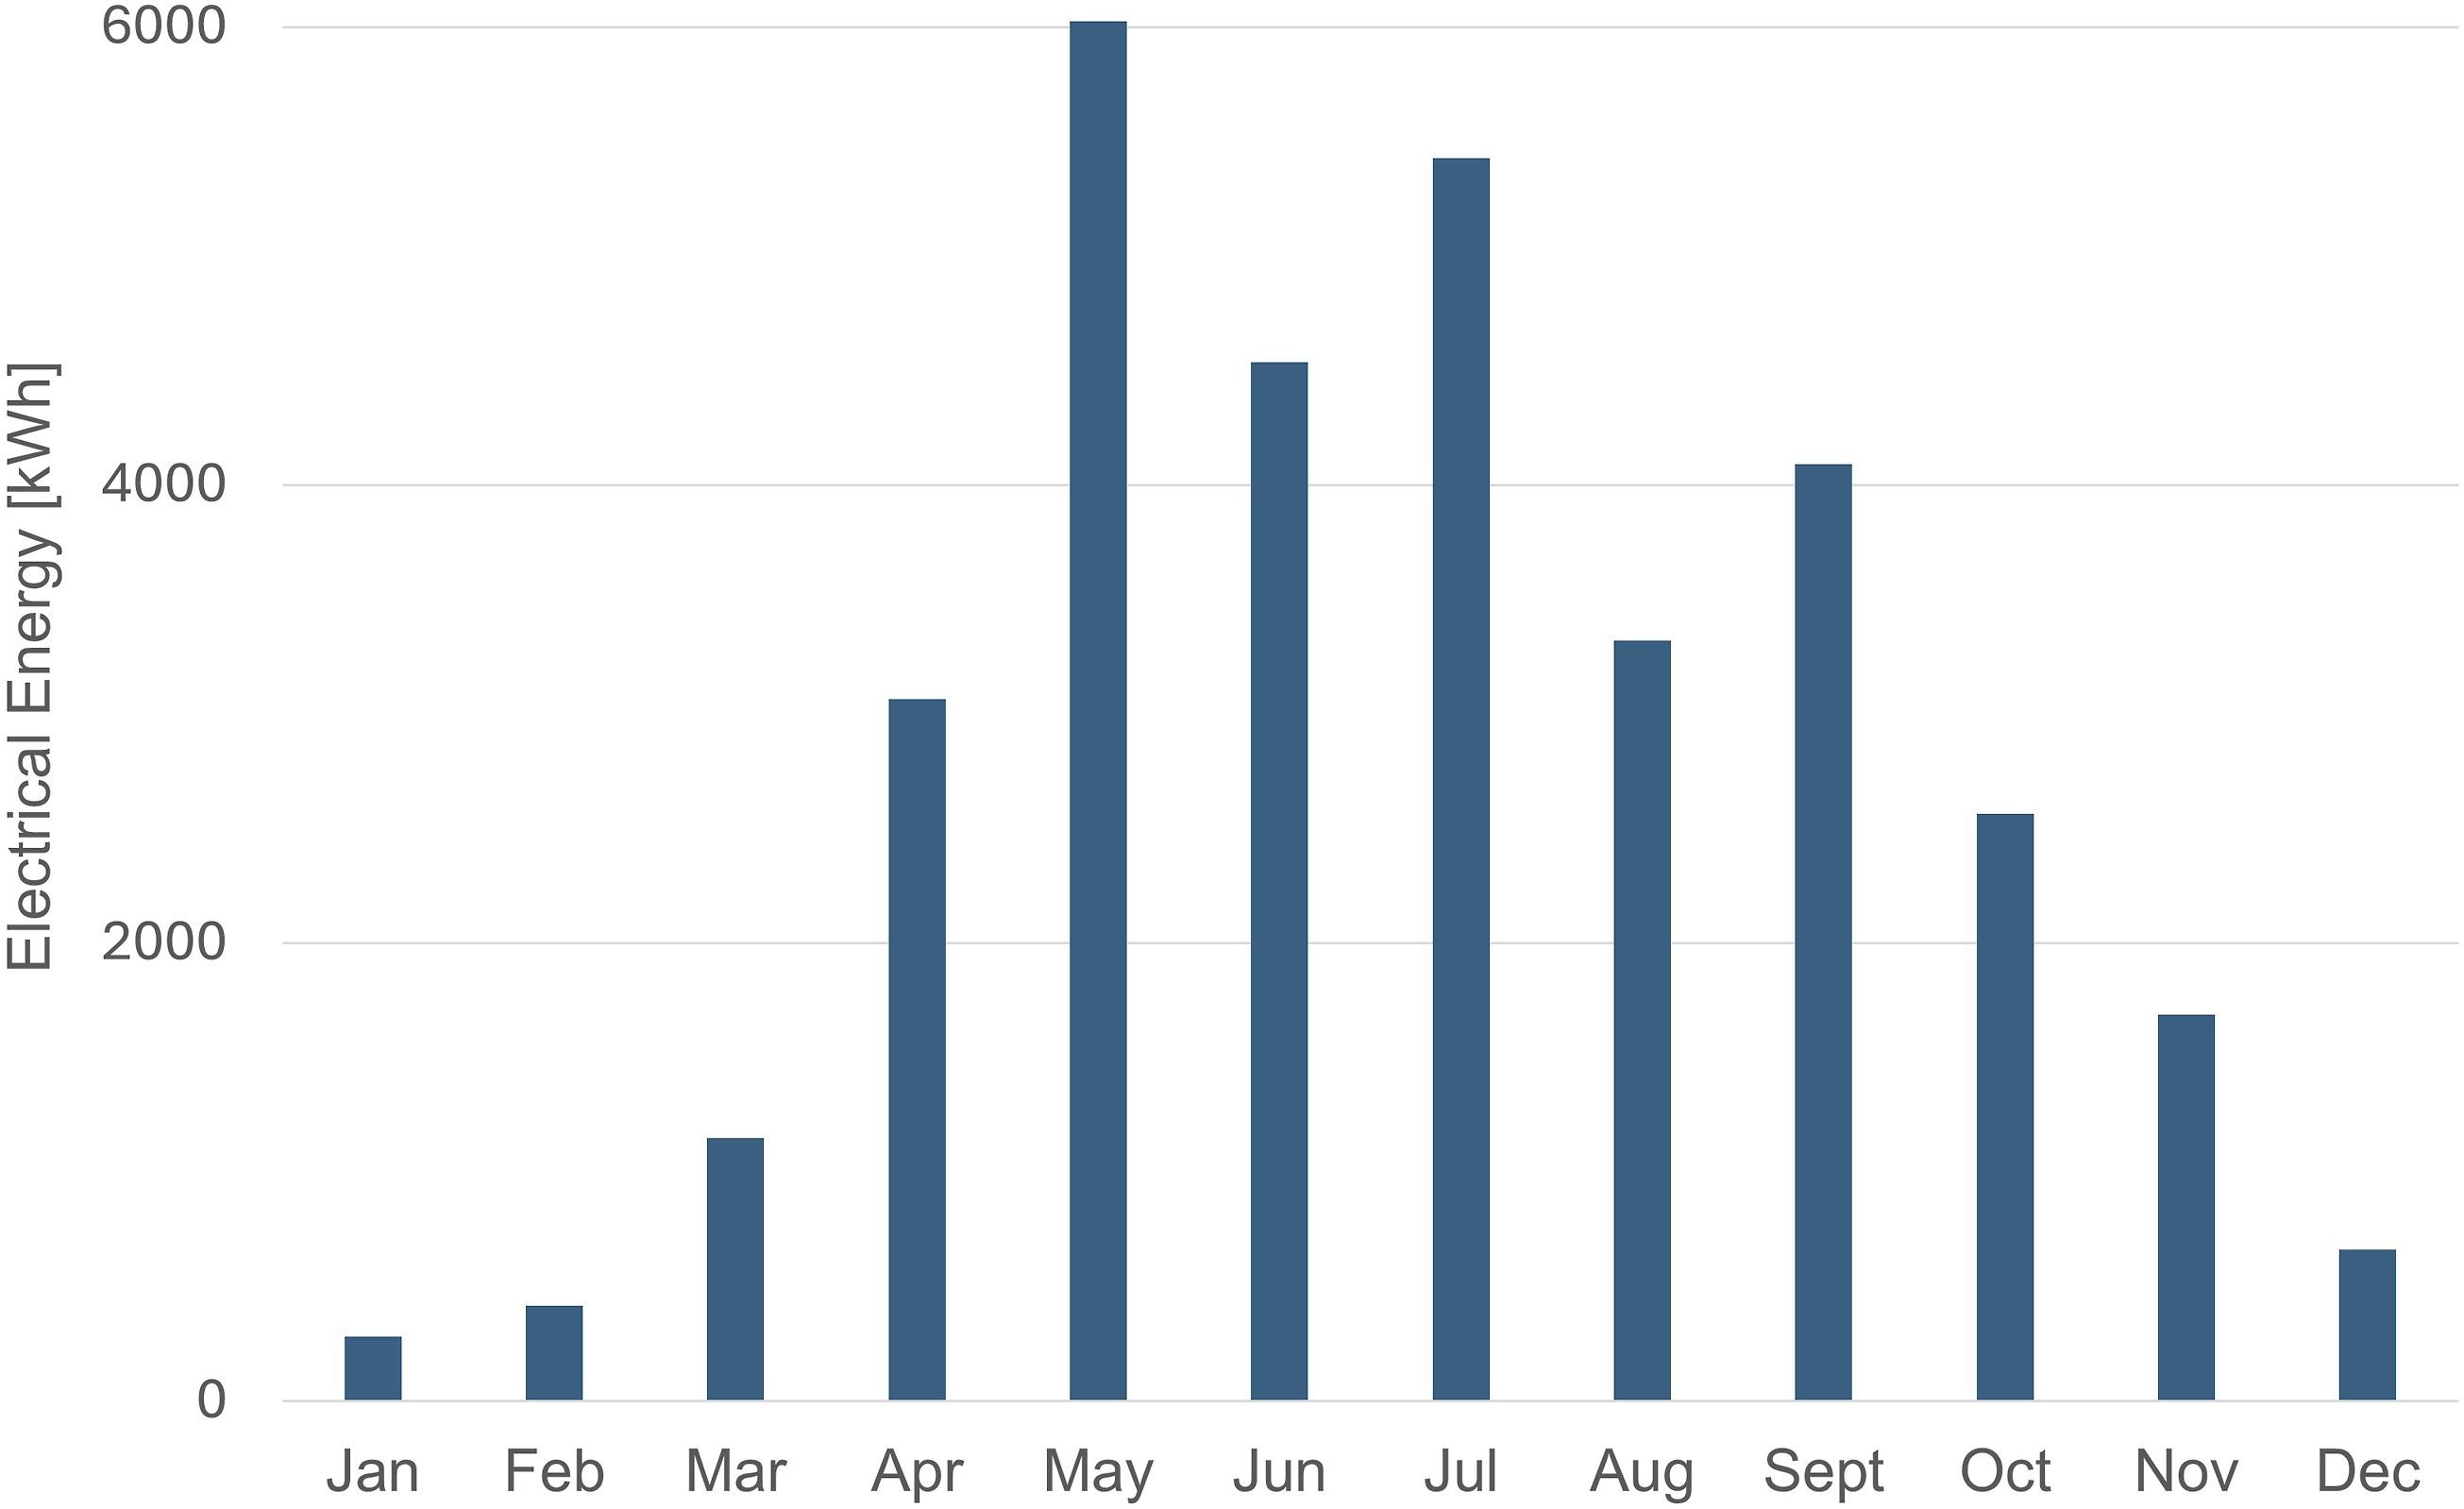
Summary of electricity production and consumption data for CREST for 2015.
Having obtained hour by hour figures for solar production, monthly consumption data and a suitable day-night tariff, the costs for the CREST building are first calculated assuming use of grid electricity only.
To calculate the effect of installing solar, the authors calculated the difference between production and consumption for every hour of the 21st day of each month. If positive, this is turned into an export credit by multiplying it by the FIT. If negative, it is multiplied by the electricity tariff rate per kWh. The cost/credit is then calculated for each month. A negative annual figure, for the cost, is assumed to be used to offset fixed charges which can typically make up 15%–20% of an electricity bill.
Finally, the authors calculated the effect of adding battery storage. During months where demand exceeded the production, night rate electricity was used to charge the battery to ensure that it would not use grid electricity during peak times.
A sample of the calculations for a typical month is included in Appendix A.
Calculation scenarios summary
Three primary scenarios were modelled:
Scenario 1: Grid Only (no PV, no battery).
Scenario 2: Grid plus PV solar system with FIT export.
Scenario 3: Grid plus PV solar system with FIT export and battery storage.
Financial modelling summary
An initial exercise is undertaken on the CREST building using data from 2015 for the three scenarios. The indicators calculated are Annual Benefit (€/year), Simple Payback Period (€), Discounted Payback Period (€) and Levelised Cost of Energy (LCOE) (cent/kWh). 2015 was the first year of operation for the CREST building and for which a full set of consumption and generation data is available. Considering the substantial savings in capital costs of PV and battery installations over the nine-year period between 2015 and now (2024), calculations are repeated using current market prices for system components.
Annual Benefit (€/year): This is the total value of positive economic returns, savings and gains generated by the installation – in this case; the FIT payment plus the electricity savings.
Simple Payback Period (€): This metric is used to determine how long it will take to recoup the expenses of the installation – it does not consider the time value of money. It is calculated by dividing the initial investment amount by the annual cost savings.
Discounted Payback Period (€): The Discounted Payback Period is a financial metric that determines how long it takes for the present value of an investment’s cash inflows to equal or exceed the initial investment, considering the time value of money. A discount rate of 4% is used, as specified for Irish Government projects. 23
Levelised Cost of Energy (LCOE) (cent/kWh): the LCOE is a useful metric for assessing the overall benefit of an energy generating asset. It uses the average total cost of buying/building and operating the asset per unit of total electricity generated over an assumed lifetime, 25 years in this case.
Carbon emissions modelling summary
Carbon emissions modelling is employed to quantify the greenhouse gas (GHG) emissions associated with the CREST building. This modelling estimates emissions resulting from operational energy consumption, including electricity, heating, cooling, and ventilation. The primary aim is to evaluate the environmental impact of the PV and battery systems. By focusing on emissions reduction, the modelling provides a complementary perspective to the financial analyses, enabling a more holistic assessment of the value of PV and battery installations from an environmental standpoint.
Key assumptions
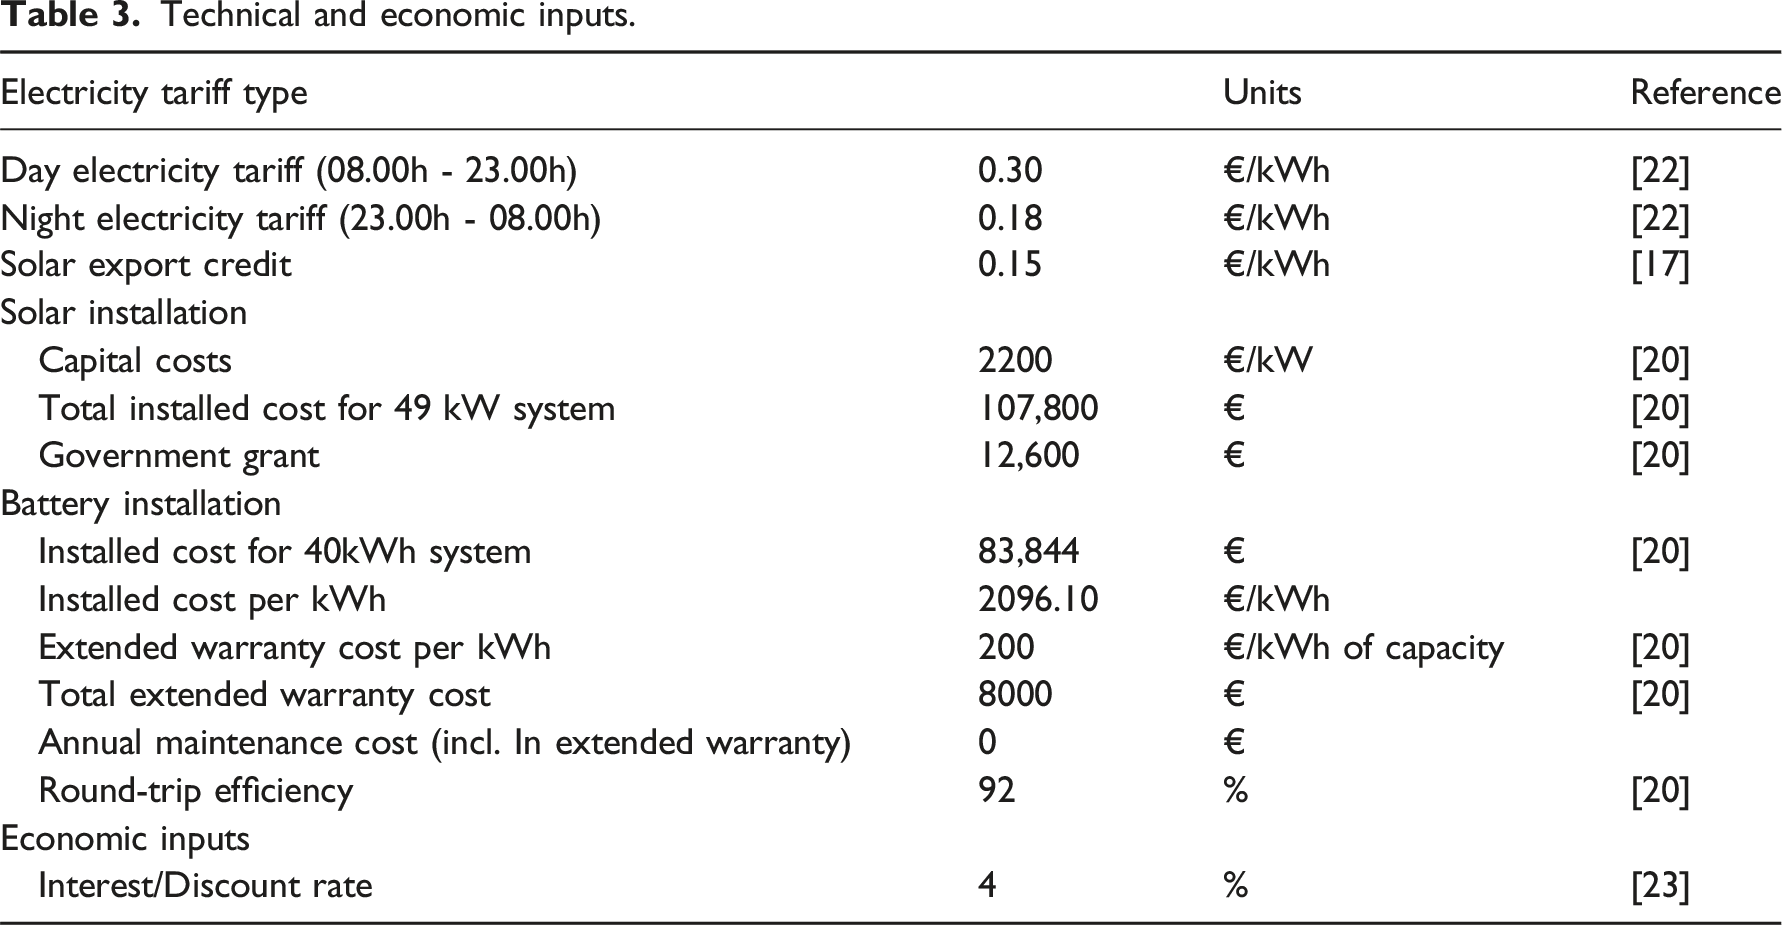
• Heating for the CREST building is provided via an air to water heat pump, with under floor heating distribution. The heat demand is therefore assumed to be uniform over a 24-h period. • The CREST building is assumed to operate daily from 9a.m. to 7p.m., 365 days per year. • Peak time associated with grid electricity consumption is assumed to be from 5p.m. to 7p.m. daily. • The lifetime of the installation (including PV panels, batteries, DC-AC converters etc) is assumed to be 25 years. • Maintenance/replacement costs are assumed to be covered under the extended warranty cost. • Where PV production greatly exceeds demand, it is assumed that the battery is not used and is kept at a fixed level 60% state of charge.
Technical and economic inputs.
Limitations of the research
• The CREST building is one of the most sustainable buildings in Ireland and the UK meeting Passive House, BREEAM Excellent and Carbon Neutral building standards. It is a demonstration/educational facility to support businesses in developing new renewable and sustainable technology products. Further research using a less sustainable building is recommended. • Due to commercial sensitivity, the authors were unable to obtain a suitable “time of use” tariff. A day-night tariff was used in lieu. • While monthly heat demand figures are used, this demand is assumed to be uniform over 24 hours. Thus, no account is taken of the possibility that the COP of the heat pump may be lower at night or perhaps a setback temperature may be used at night. • The nature of the building means that during the summer and autumn months, demand largely coincides with peak solar generation, resulting in the PV system rarely charging the battery. During winter, for the most part, the battery charges using low-cost electricity at night and discharges during the day. This contrasts with a domestic system where the battery could be charged from the solar during the day to negate the use of electricity during peak times.
Results
Electricity production and consumption data, as well as the impact of the battery, are illustrated in Figure 3. The Spring Equinox, Summer Solstice, Autumnal Equinox, and Winter Solstice are selected as representative days, as they capture the seasonal variability of solar irradiance. The Summer and Winter Solstices reflect the annual extremes, while the Spring and Autumnal Equinoxes represent average seasonal conditions. Seasonal electricity production and consumption scenarios for CREST.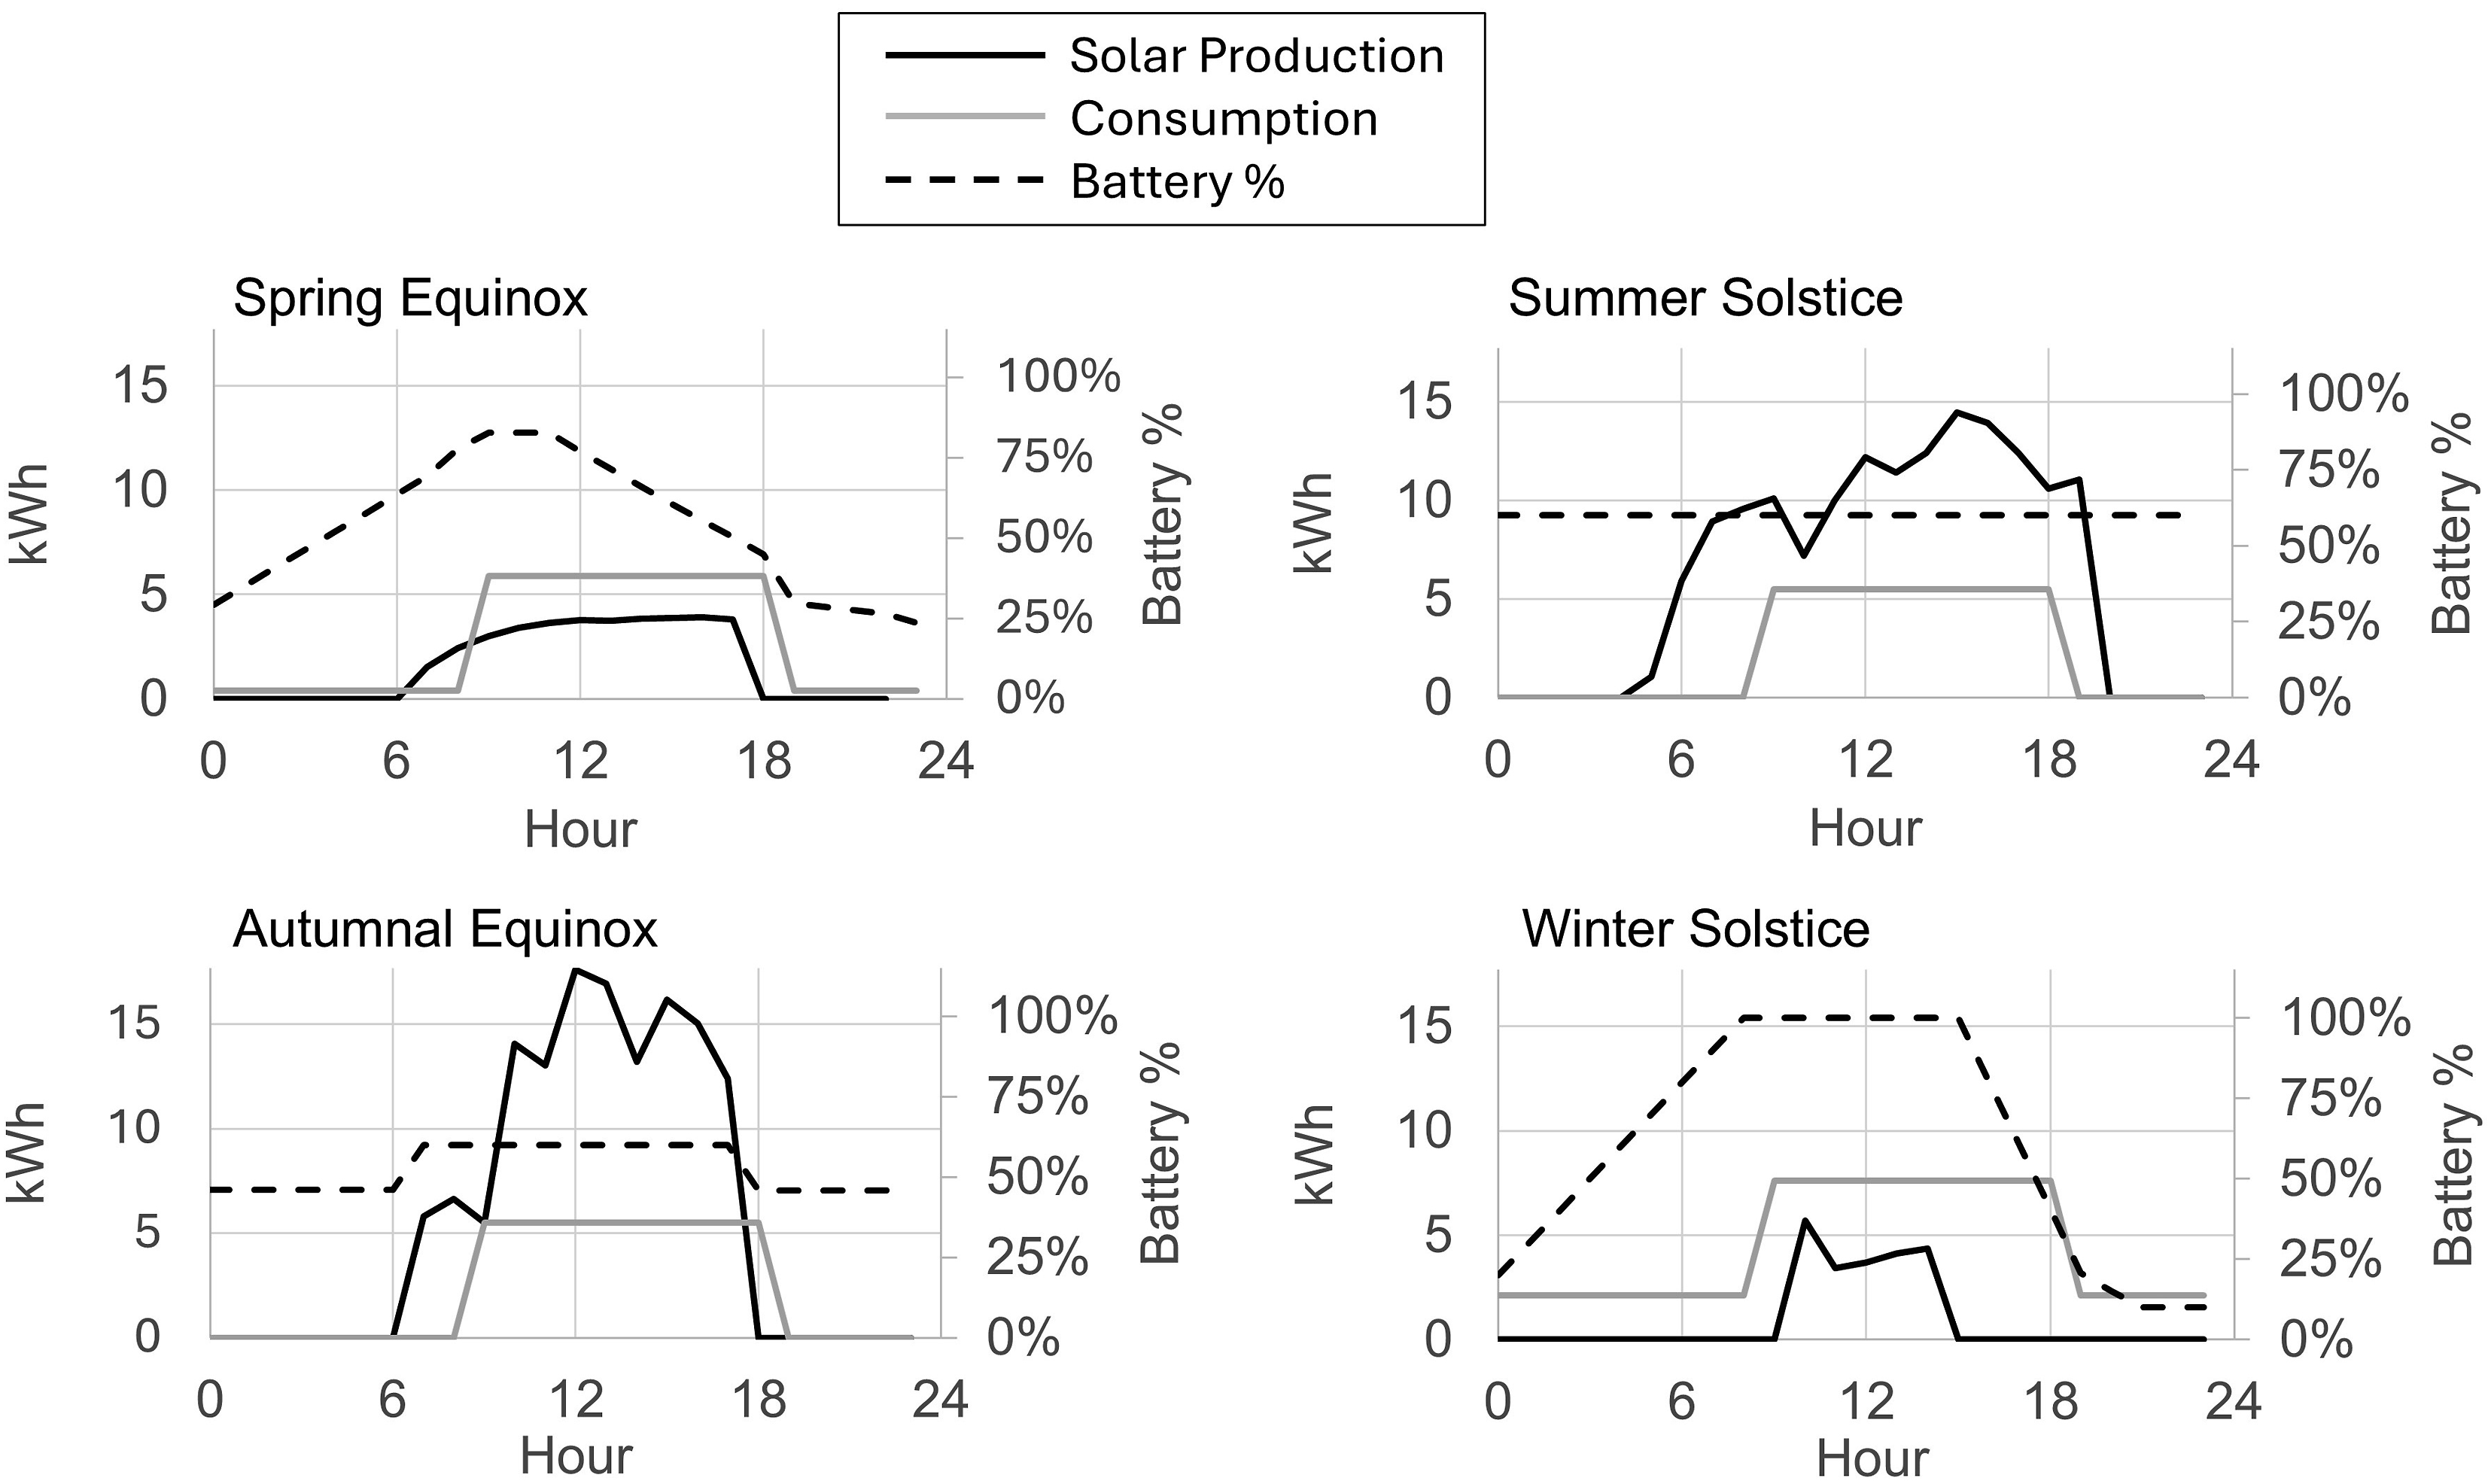
For the Spring Equinox, consumption exceeds solar production. The battery is charged during off-peak periods (23:00 to 08:00) such that there is sufficient energy to cover demand during peak hours (17:00 to 19:00) and for a period after. Where possible, the battery state of charge is kept between 20% and 80% to prolong battery life.
For the Summer Solstice, production always exceeds demand. Any excess is exported to the grid and there is zero heat demand. The battery is not charged or discharged and is kept at a safe level (60%) to prolong life.
For the Autumnal Equinox, production mostly exceeds demand, except for the evening period. The battery is charged to 80% from solar production to cover this demand.
For the Winter Solstice, demand always exceeds supply, so the battery is charged to 100% during off-peak times. This is then discharged from shortly before the usual peak time of 5p.m. until 9p.m. For the months of November to February, the state of charge is allowed vary from 10% to 100% to cover demand.
Figure 4 illustrates the monthly grid electricity consumption, indicating a marked reduction in grid dependency from April to October. This period aligns with the peak operational performance of the PV and battery system, thereby enhancing self-consumption of generated electricity and supporting effective demand-side energy management. For April to October, the battery negates the need for grid electricity usage altogether. Interestingly, from December to February, grid electricity use increases, with the battery charging on low-cost nighttime electricity to offset peak-time demand. This reflects the fact that there is some waste associated with the round-trip efficiency of the battery, given earlier as 92%. Monthly use of grid electricity in CREST.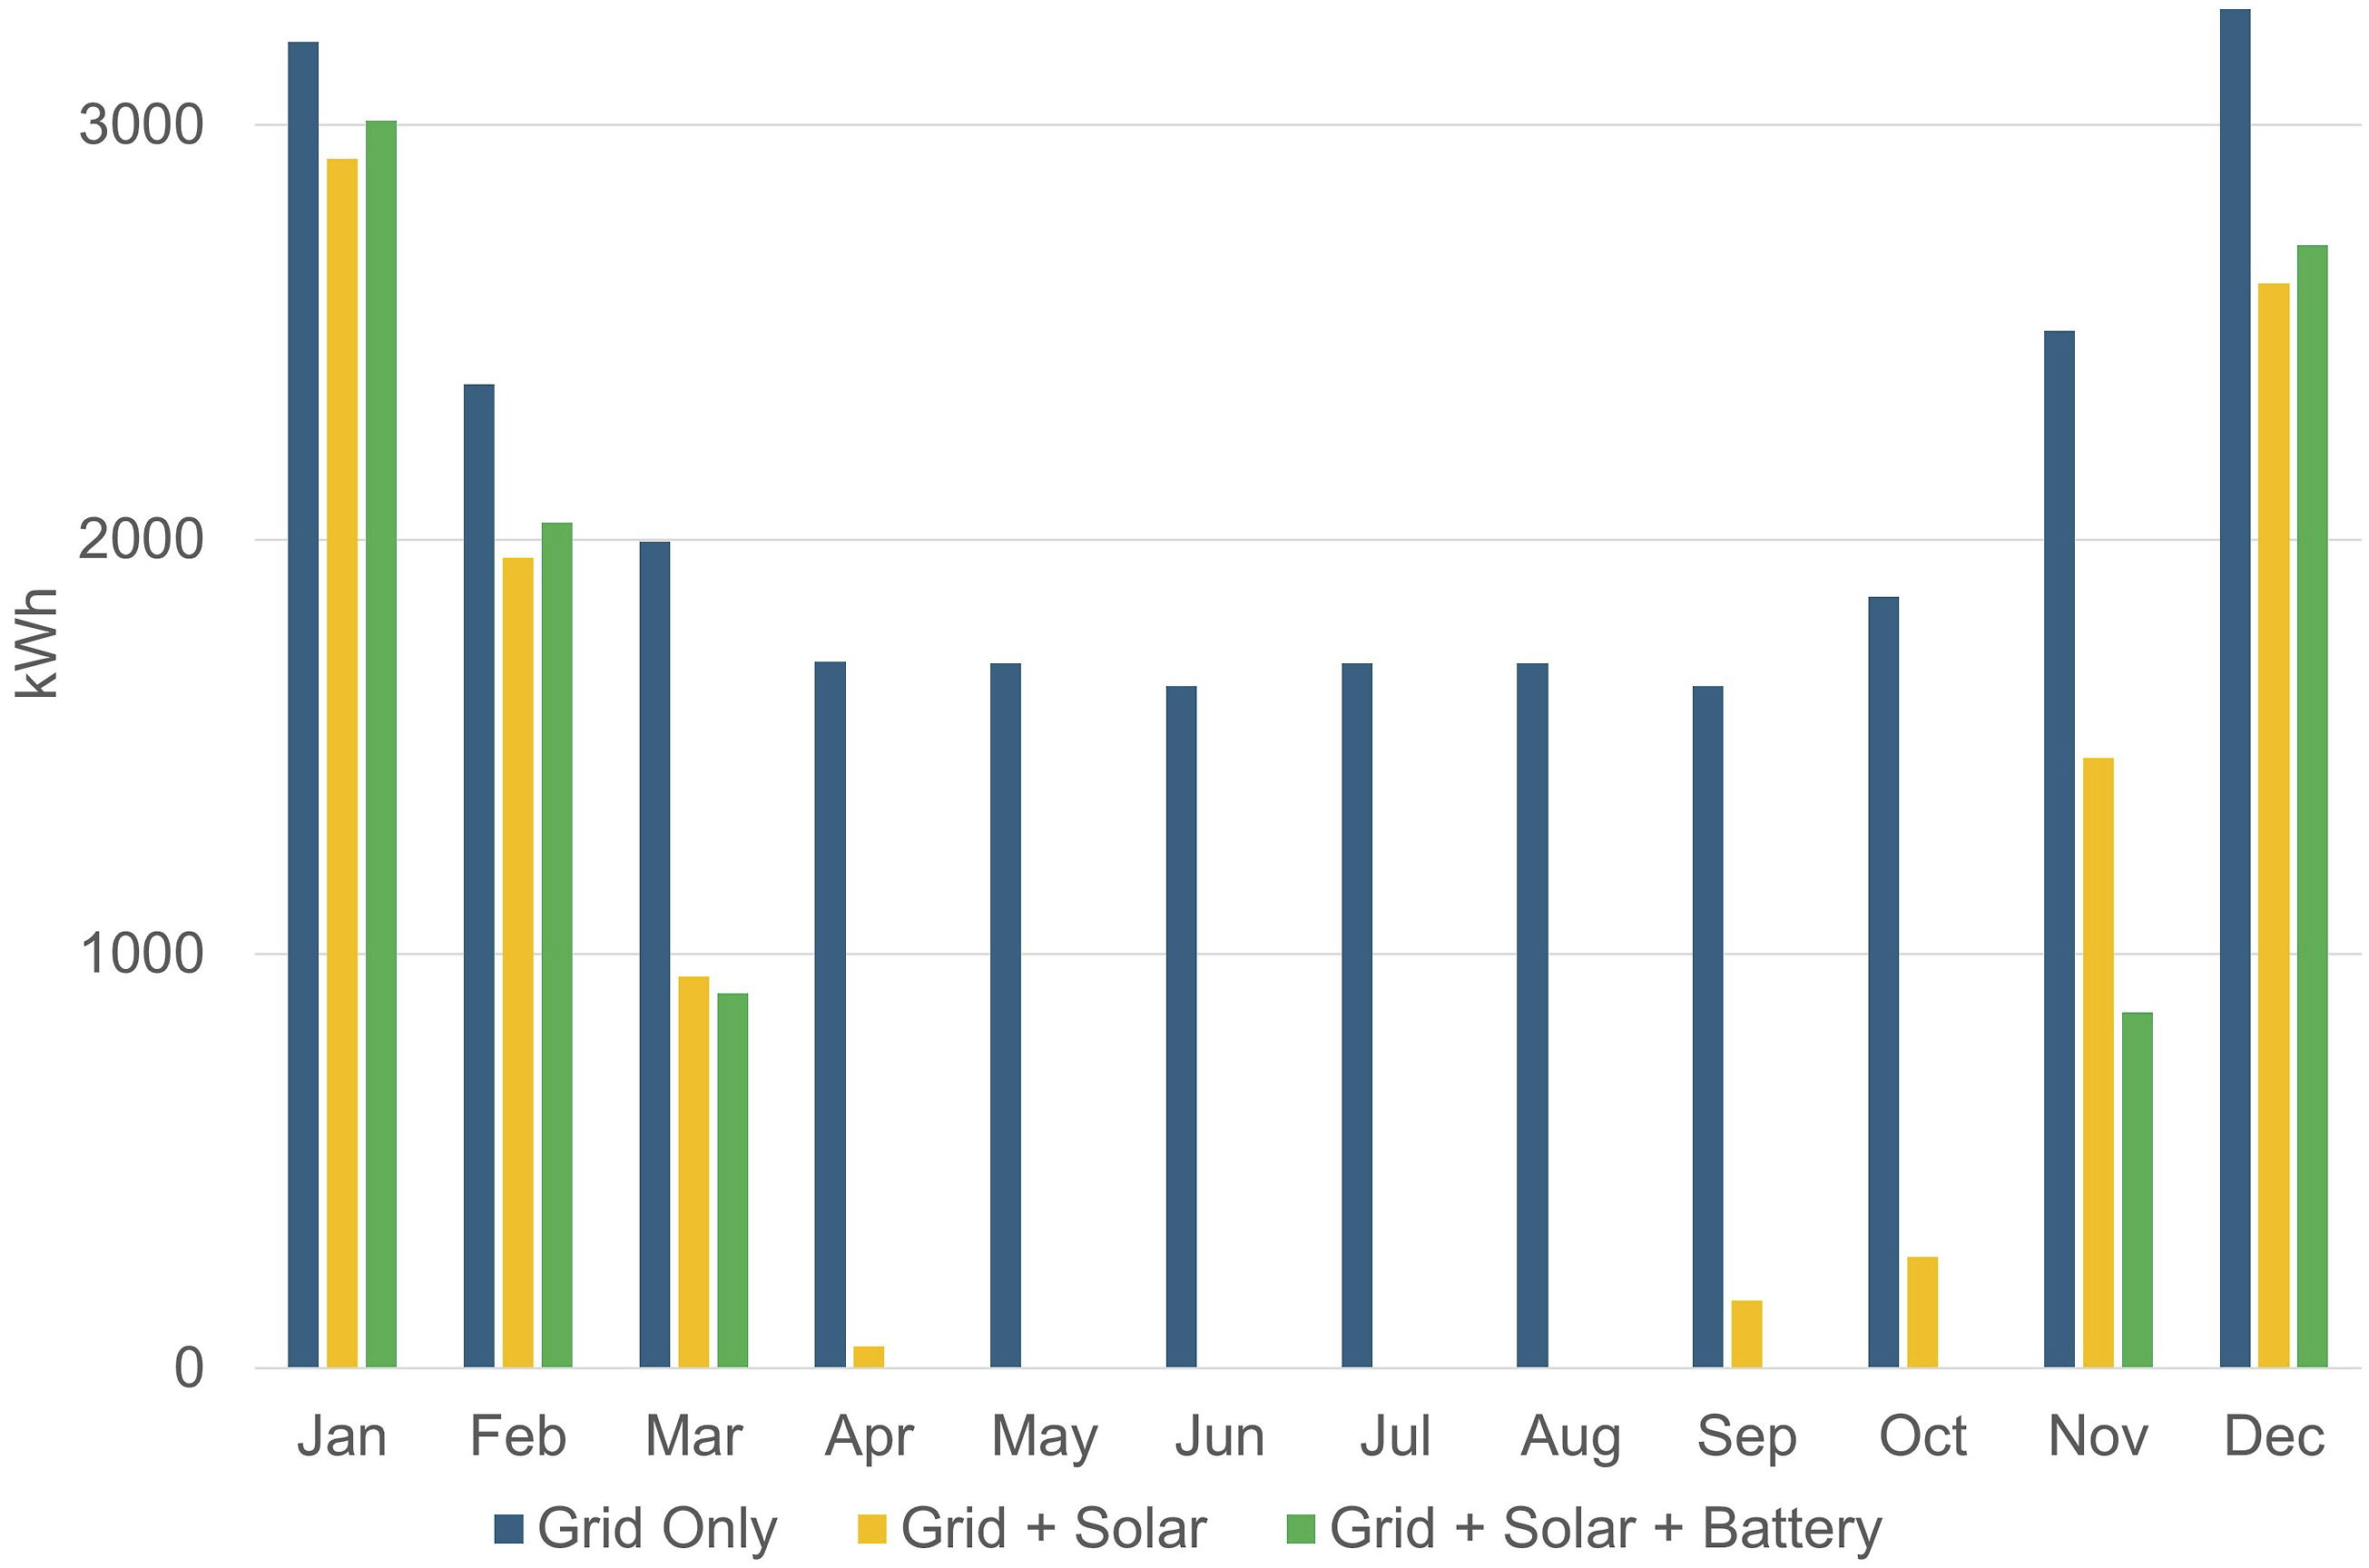
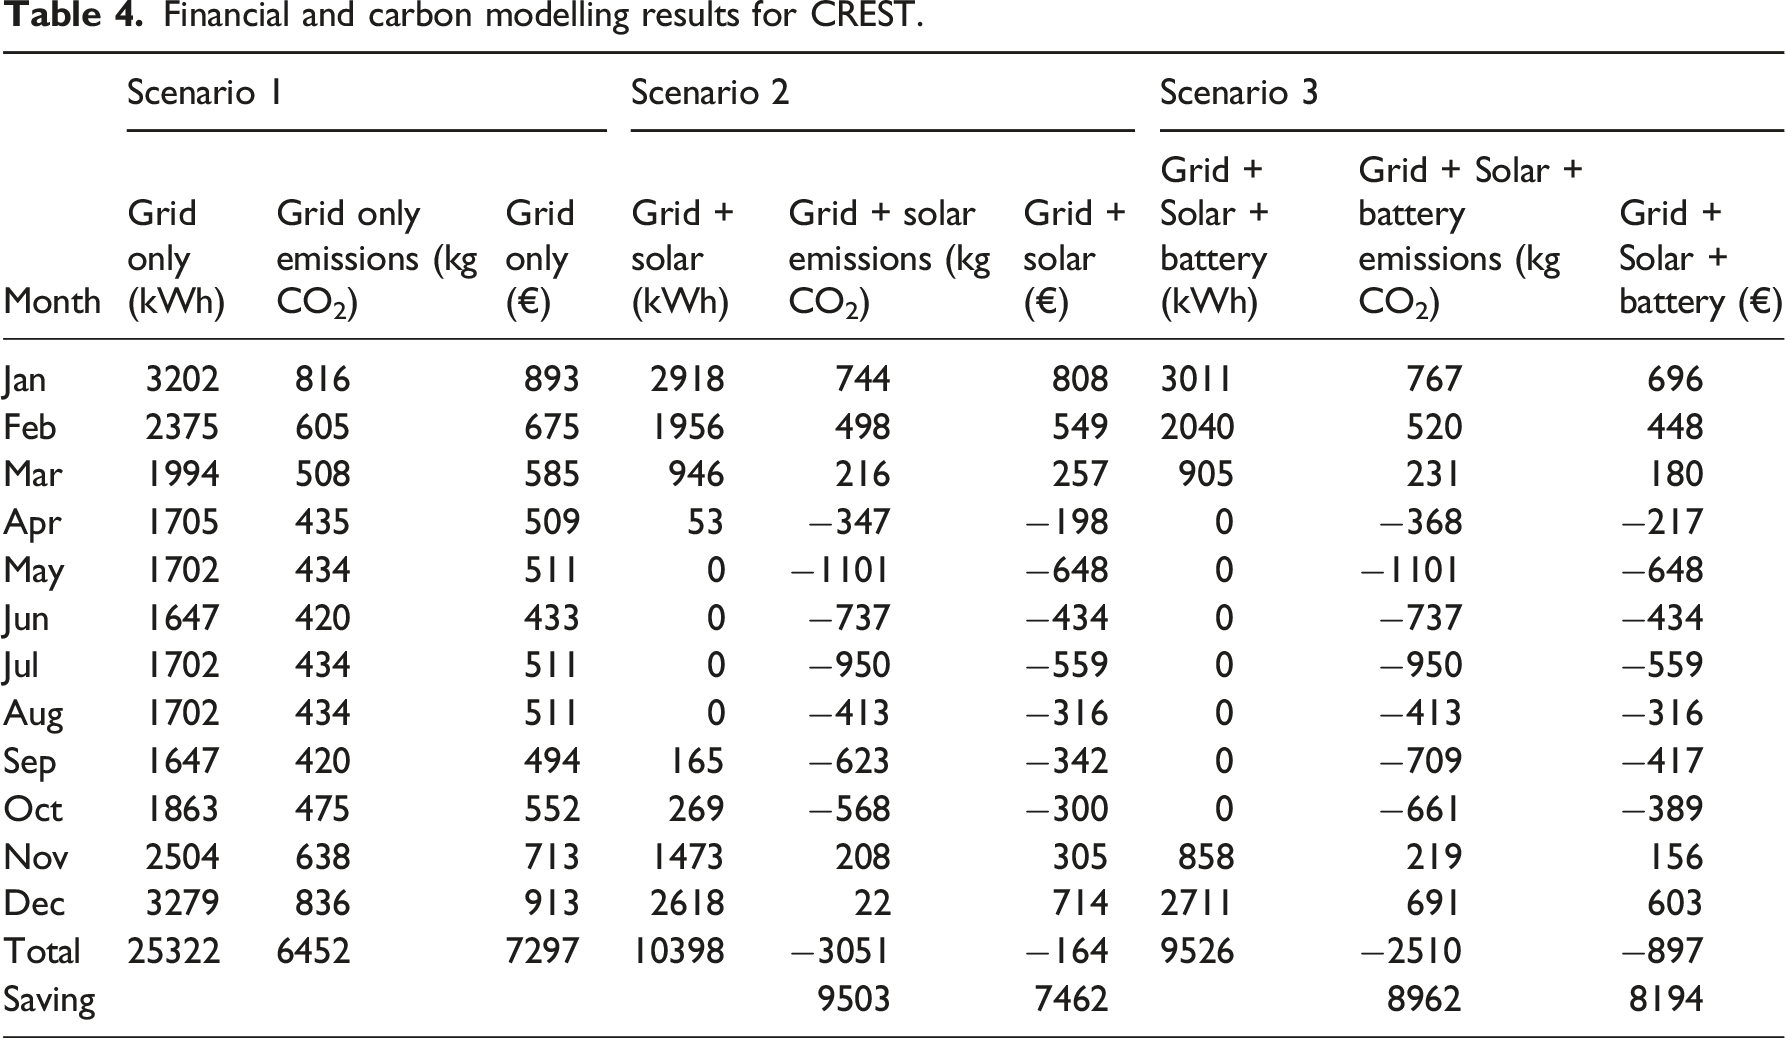
Financial and carbon modelling results for CREST.
Carbon modelling
According to the SEAI, 24 the emissions factor for electricity in Ireland in 2023 is 0.2548 (kg CO2/kwh). This results in emissions associated with running the CREST building using grid electricity only as 6452 kg CO2. When solar is incorporated, then this becomes −3051 kg CO2 as significant grid electricity is offset, a saving of 9503 kg CO2. The addition of the battery reduces this saving to 8962 kg CO2 as the round-trip efficiency of the battery (92%) causes losses when off-peak electricity is stored for use during the day to save money. This does not account for embodied energy in the construction materials used, transportation, maintenance or end of life disposal/recycling.
Financial modelling
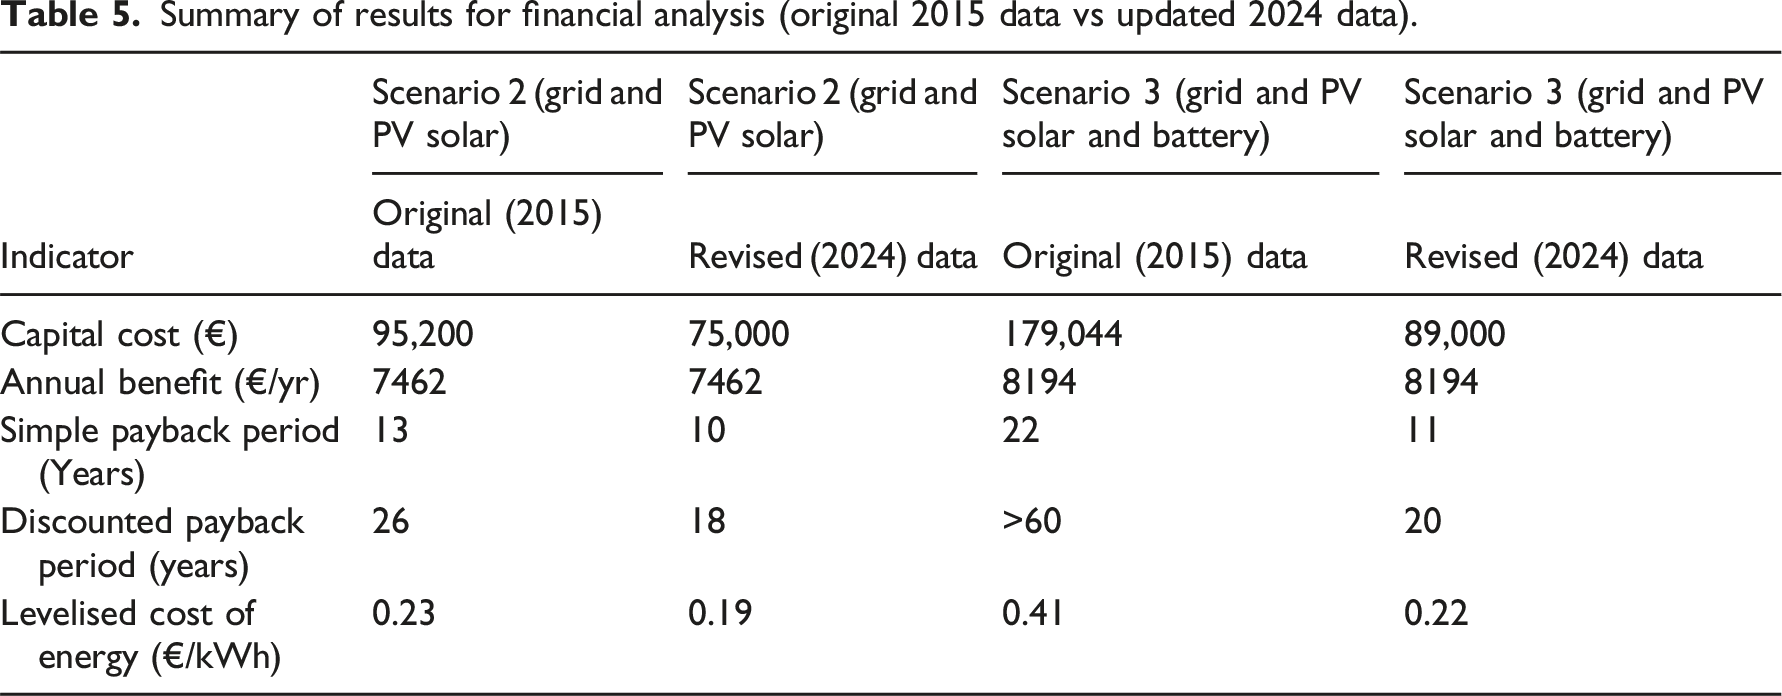
Capital Cost (€) – the capital cost for the PV panels in 2024 in Scenario 2 (Solar with Grid/FIT) is €75,000 according to NuSolas Energy. 25 This is €20,200, or approximately 20%, less than in 2015. When adding the battery to the capital costs for Scenario 3 (Solar with Grid/FIT plus battery), the total becomes €89,000. This is based on a 2024 cost of €350/kWh (€14,000 in total) for the batteries compared with €2096.10/kWh in 2015, a very significant reduction.
Annual Benefit (€/yr) –is €7462 per year for Scenario 2 and €8194 per year for Scenario 3, an increase of €732 per year (approximately 10%) for having a battery installed.
Simple Payback (years) – the payback period is 10 years based on 2024 prices for solar only, and 11 years with the addition of a battery. This is a very significant reduction from 13 to 22 years respectively based on 2015 prices, highlighting the impact of the continuing reduction in capital costs for batteries.
Discounted Payback Period (years) – the Discounted Payback Period for solar only in CREST is 26 years based on 2015 prices and 18 years based on 2024 prices – a considerable reduction of 8 years. When the battery is added to the analysis, the payback period reduces from over 60 years to just 20 years. This is because of the much greater reduction in battery costs (typically 80% less) as opposed to PV costs (typically 20% less). Importantly, the addition of battery backup only adds 2 years to the discounted payback period using 2024 costings.
Summary of results for financial analysis (original 2015 data vs updated 2024 data).
Discussion & Conclusions
Calculations based on 2015 capital costs indicate that incorporating battery storage into the CREST building’s PV system is economically prohibitive. High capital costs and extended payback periods—exceeding 60 years in the case of the Discounted Payback Period —combined with minimal financial returns in terms of annual benefits and LCOE, rendered the investment unattractive from a financial perspective. However, when the calculations were undertaken to reflect 2024 market conditions, the financial outlook improved substantially. Notably, the Discounted Payback Period for battery integration decreased to approximately 20 years. The Simple Payback Period based on 2024 data is 10 years and adding the battery increases this by only 1 year to 11 years. The results highlight the ongoing reduction in the cost of PV and battery technologies and the subsequent shortening of payback periods.
Figures for payback periods on solar battery systems in the UK, for example, depend on a variety of factors, including control systems, system size, location, self-consumption rates and tariff structure. Commercial figures from Hewer UK 26 suggest a payback period of 11-13 years for solar PV with batteries compared to 11-15 years for solar PV only. The CREST case study shows a simple payback of 10 years for PV, but this is increased to 11 years with the addition of batteries. Other academic data suggests greater caution is necessary. A study by Uddin et al. from 2017 27 says that the integration of batteries yields no added benefit over PV alone. A more recent study by Han et al 28 from 2023 shows that while PV is financially competitive, the benefits of lithium battery storage are marginal as the cost is still too high. However, if prices continue to fall, battery storage is only going to become more attractive.
The CREST building is an exceptional sustainable design with relatively low electricity usage. In addition, the building’s load profile closely corresponds with peak solar PV generating periods, hence restricting the frequency of surplus energy being available for battery charging. Conversely, domestic energy demand profiles, for example, often demonstrate a much greater mismatch between generation and consumption, especially when peak consumption tends to occur during evening and overnight hours – there is therefore a much stronger case for utilising battery storage under domestic-type conditions.
The carbon emissions modelling undertaken demonstrates significant savings of 8962 kg CO2/annum when using batteries. Utilising the results from the financial modelling along with the results from the carbon emissions modelling strengthens the case for PV/battery installations and makes such systems increasingly attractive to electricity consumers from both financial and environmental perspectives.
In addition to the financial and environmental benefits of batteries outlined, batteries are desirable from a security of supply point of view. The European Resource Adequacy Assessment (ERAA) 29 states that the adequacy standard in Ireland is set at 8 hours of Loss of Load Expectation (LOLE) (i.e. the expected annual average number of hours/days during which the existing generating capacity fails to meet the demand). National adequacy studies show Ireland to be outside this standard across the study horizon from 2023 to 2032, indicating an increased risk to security of supply in Ireland over the coming years. The ERAA assessment is showing similar increased risk for the early years of the study horizon however the risk decreases in the latter half of the study horizon. The CREST building benefits greatly from increased security of supply provided by the batteries as it enables educational activities to proceed uninterrupted. Calculations indicate that there is significant spare capacity in the installed batteries in CREST, enough to power the building for approximately 6 hours in the event of a power failure.
The amalgamation of battery storage with photovoltaic (PV) systems presents numerous advantages such as diminished carbon emissions, improved energy security, and sustained reductions in electricity expenses. Furthermore, it demonstrates a concrete dedication to environmental sustainability. As technology advances and capital costs continue to decline, such integrated systems are becoming an increasingly attractive option for electricity consumers seeking both economic and environmental gains.
Supplemental Material
Supplemental Material - Feasibility of battery storage in solar photovoltaic (PV) installations in Ireland: A case study
Supplemental Material for Feasibility of battery storage in solar photovoltaic (PV) installations in Ireland: A case study by Moira Kelly, Micheál O’Flaherty in Building Services Engineering Research & Technology.
Footnotes
Declaration of conflicting interests
The author(s) declared no potential conflicts of interest with respect to the research, authorship, and/or publication of this article.
Funding
The author(s) received no financial support for the research, authorship, and/or publication of this article.
Supplemental Material
Supplemental Material for this article is available online.
References
Supplementary Material
Please find the following supplemental material available below.
For Open Access articles published under a Creative Commons License, all supplemental material carries the same license as the article it is associated with.
For non-Open Access articles published, all supplemental material carries a non-exclusive license, and permission requests for re-use of supplemental material or any part of supplemental material shall be sent directly to the copyright owner as specified in the copyright notice associated with the article.