
Abstract
Solar photovoltaic is clean and green energy for renewable power generation, which plays a vital role to fulfil the power shortage for any region. Photovoltaic array is quite expensive and has non-linear characteristics. Under varying conditions, it takes much time to give operating curves. Before mount photovoltaic for any application or at any location, there is a vital phase of analysis, modelling, and simulation of the photovoltaic system, which helps to understand the actual behaviour in real conditions. This paper emphasizes on the stepwise procedure of modelling and simulation for the photovoltaic panel, which is proposed to use for the small application. The proposed system provides a reliable, accurate, and simple method to model the photovoltaic system. It takes a flexible solar panel of 180 W as a reference model. The I–V and P–V characteristics are further investigated at different operating conditions such as a variation of irradiance from 1000 to 400 W/m2, variation of temperature from 15 to 70 °C, and vary shunt resistance from higher to low values. The equation-based modelling of the photovoltaic system is built in the MATLAB/Simulink. This methodology allows investigating the photovoltaic system on different operating conditions (varying temperature and irradiance) and physical parameters (ideality factor, series and shunt resistance) along with partial shading effect.
Introduction
Energy demand is growing day by day with the industrialization and urbanization. With the depletion of fossil fuel resources, there is a need to explore some alternating energy resources to enlighten our homes, businesses, and vehicles.1,2 The conventional way to meet the demand of the world is not suitable and perfect for the green and clean environment because of burning of fossil fuels. The household load along with an automobile has been the leading sources for the depletion of the fossil fuels.3,4 The power generation from the fossil fuels is destroying the environment by the exhaust of polluting gasses.3,5,6 Due to the usage of conventional energy resources to meet the energy demand of domestic and industrial load, there is an adverse effect on the environment such as increasing pollution, acid rain, and global warming.7–9 There is a need to shift all your primary loads from fossil fuels to the alternate energy resources. For this, the wind energy, tidal energy, geothermal, and solar are the best and suitable energy resources to meet the load demand of the world. Solar energy is abundant in nature and has to be utilized for the electric vehicles. 10 The main advantage for these solar-based electric vehicles besides the improved fuel economy is the reduction of the carbon dioxide emissions.11–14 Mathematical modelling of the photovoltaic (PV) system is giving a better understanding of its working for the researchers, and it is continuously updating. Although the models for this PV system differs depending on the software used by the researchers like Excel, C-programming, Simulink, MATLAB, and so on. Literature review suggests that many researchers have developed functions in the MATLAB environment to calculate the power output for the PV panel,15,16 which involves programming that is difficult for the readers to understand who lack such skills. 17 Other methods which are the combination of the C language programming and the MATLAB m-file are even more complex to understand. 18 Some other proposed models are based on the mathematical equations and built in Simulink and show the effect of temperature and irradiance, but these papers did not present simulations, which is again difficult for the researchers and the readers to follow and simulate.19,20 Although it is covered by Jena et al. 21 and Pandiarajan and Muthu, 22 there is a gap regarding the partial shading effect of the PV system. Especially when suggesting the use of the solar panel in electric vehicles, the partial shading effect has a vital role in achieving the maximum power output from the equipped solar panels.
This proposed model presents the complete step by step equation-based design for the PV solar cell. This proposed model is sufficient to understand the effect of all the physical parameters such as saturation current, ideality factor, series resistance, shunt resistance, and environmental operating conditions such as temperature, irradiance, and partial shading effect on the I–V and P–V characteristics of the PV module. Also, this simple and robust method of modelling allows researchers and readers to follow and simulate by themselves to do further research work. In this paper, the detailed mathematical model for the PV cell is represented in section ‘The mathematical model for PV cell’ and the stepwise Simulink circuit is presented in section ‘Stepwise Simulink circuit for PV cell’. The discussion of the simulated results is presented in the section ‘Simulation results’ whereas the outcomes of this research paper are presented in section ‘Conclusion’.
The mathematical model for PV cell
The PV cell is a device which converts the photon energy into the electricity. Now, if the PV cell is connected in series or parallel form, then the PV module is formed. This arrangement generates the green and clean energy. The primary circuit for the PV cell is shown in Figure 1. In the circuit, the

where
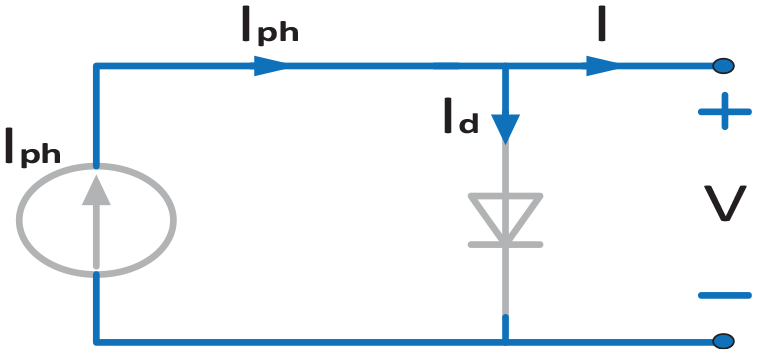
Basic equivalent circuit for photovoltaic cell.
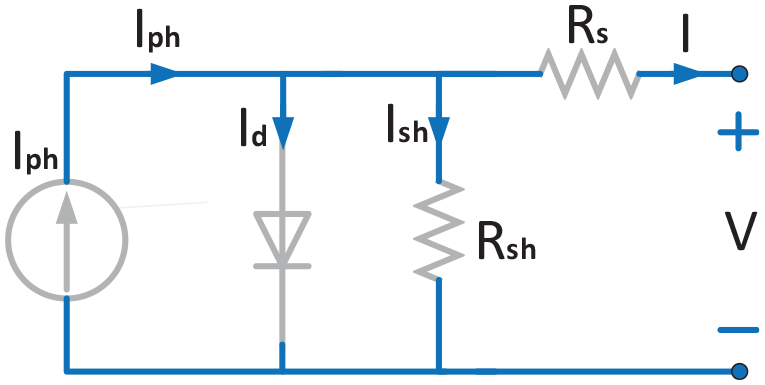
Real equivalent circuit for photovoltaic cell.
The output current for the real equivalent circuit for the PV cell is given in equation (3)


And the diode thermal voltage can be found as in equation (6)
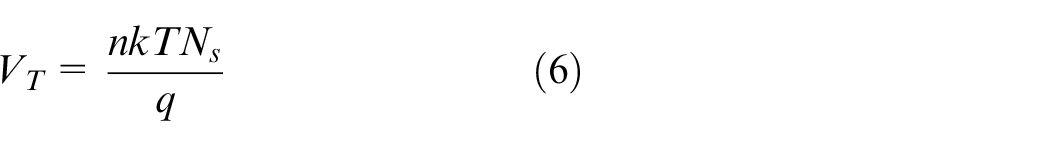
where n is the ideality factor of the diode, k is the Boltzmann’s constant, q is the electron charge
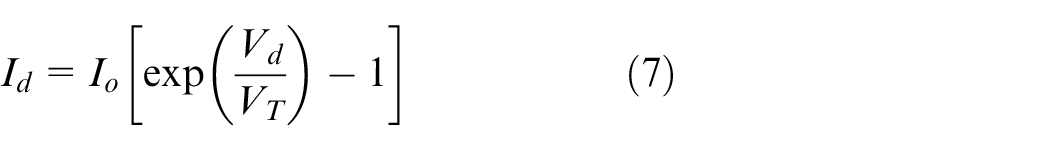
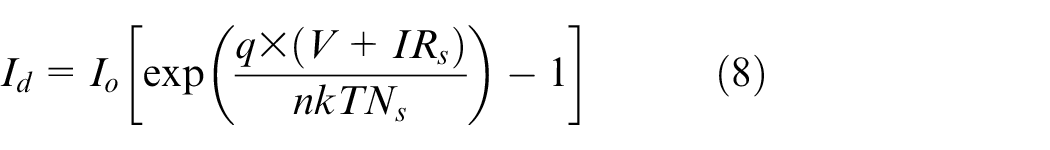
Put equations (5) and (6) in equation (7) and get the diode current as in equation (8)
Here,
where
where
The flexible solar panel is taken as a reference model and all the specifications, along with mathematical parameters, are given in Table 1.
Parameters for the equation-based modelling of PV module.
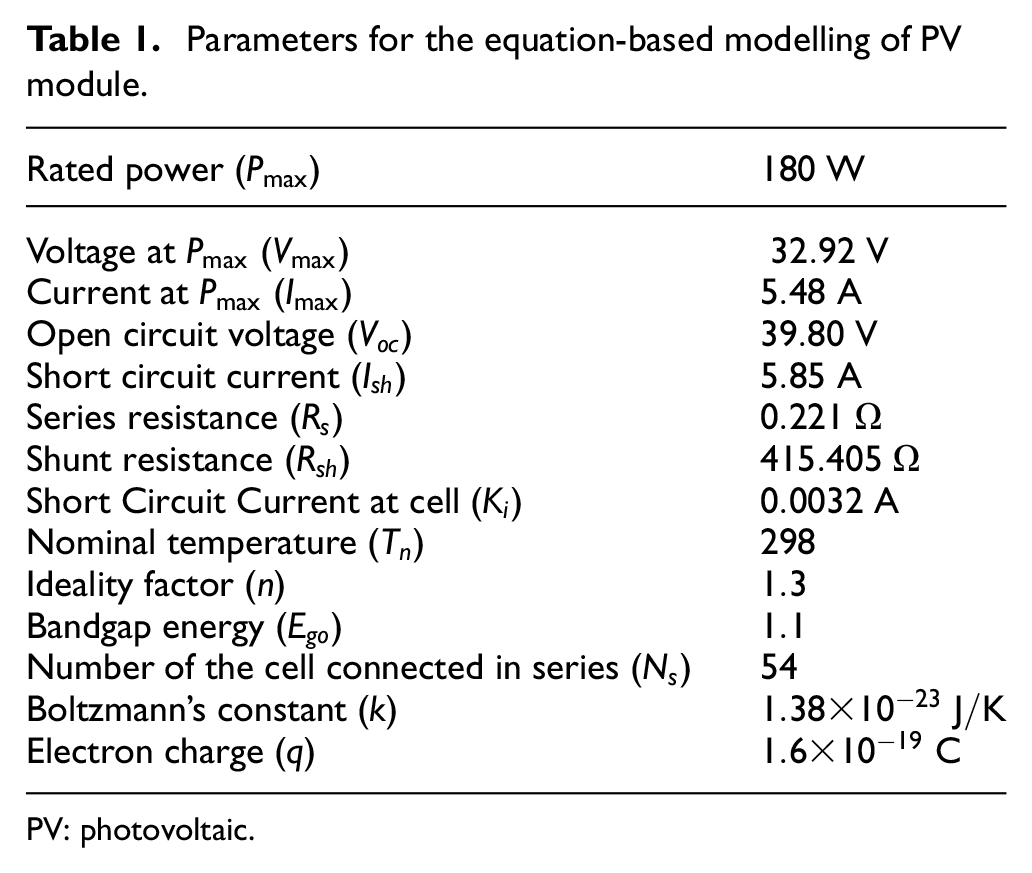
PV: photovoltaic.
Stepwise Simulink circuit for PV cell
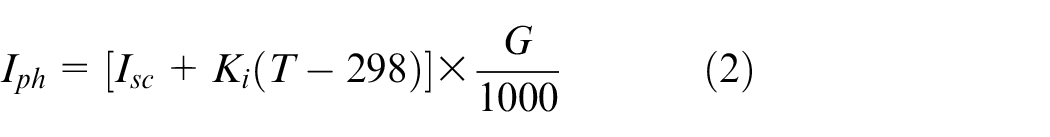
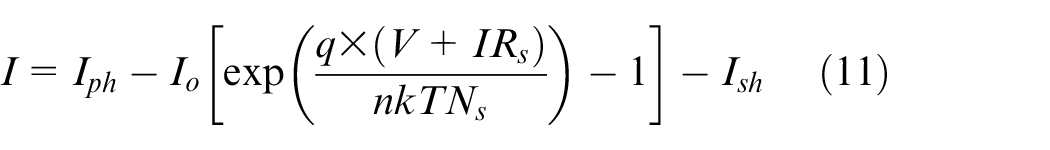
For mathematical modelling of the PV solar cell, MATLAB/Simulink is used to build the model. The step by step design of the PV module is discussed in this paper. To implement equation (11) for the final output current of the solar cell, the first step is to model photocurrent as shown in Figure 3 and given in equation (2).
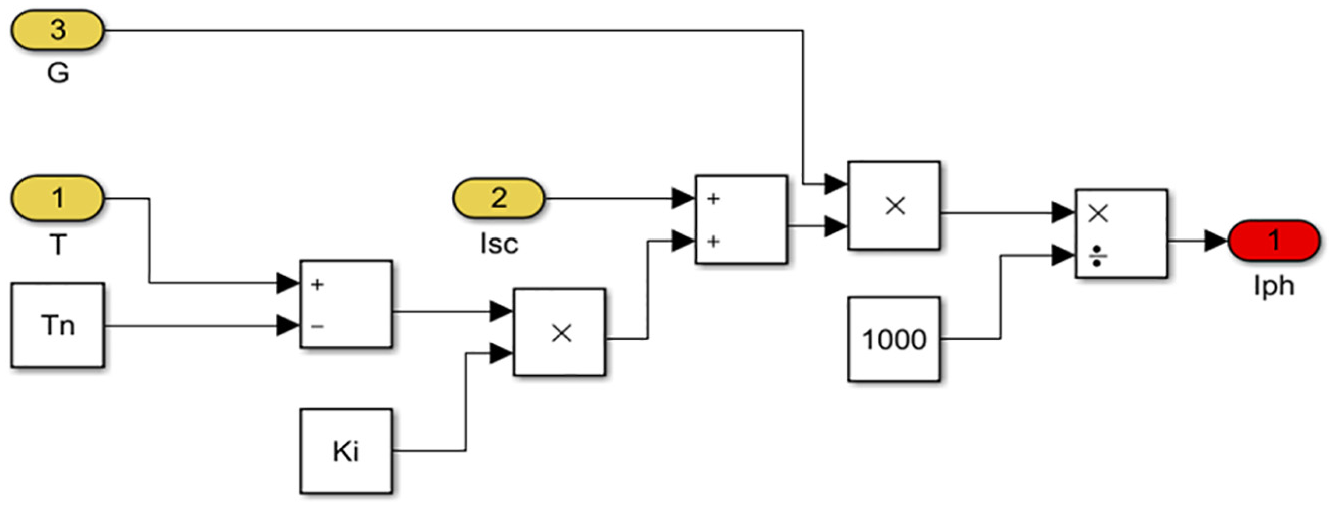
Simulink circuit for current source represent as photocurrent of the solar cell.
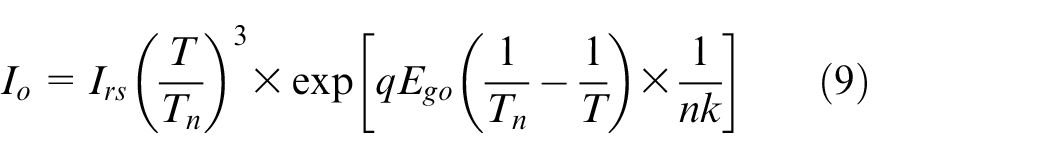
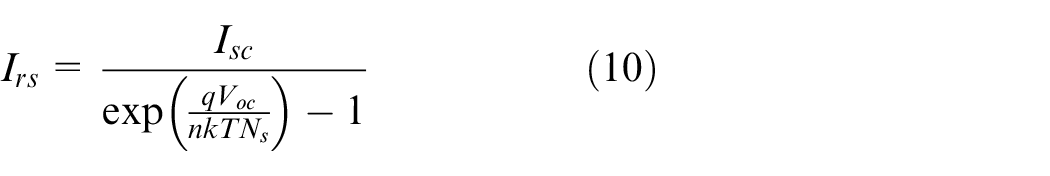
Next step is to model the diode current as given in equation (8), for this need to model saturation current as given in equation (9), again to model this saturation current need to model reverse saturation current first as given in equation (10) as shown in Figure 4.
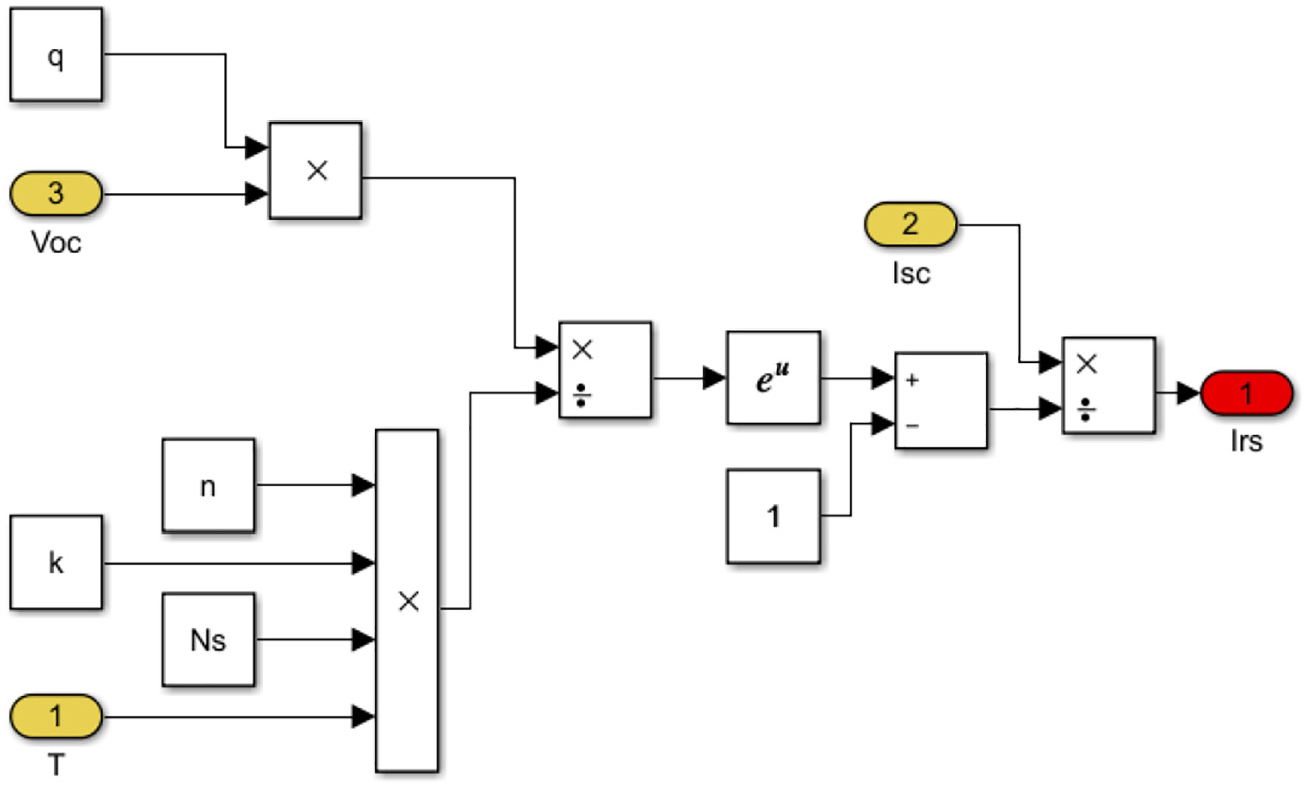
Simulink circuit for reverse saturation current of the diode.
Use the model of the reverse saturation current, as shown in Figure 4, to build the model for saturation current, as shown in Figure 5.
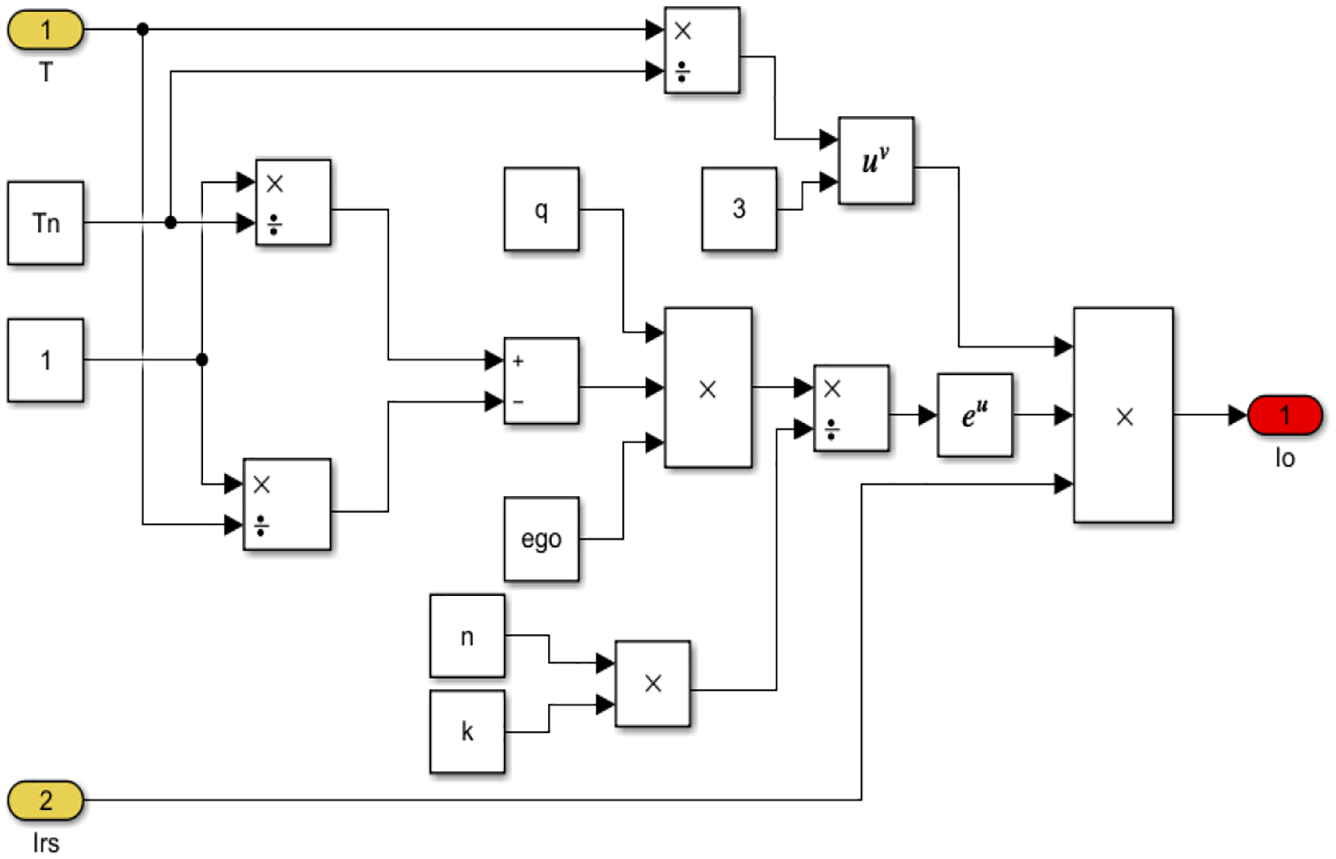
Simulink circuit for saturation current of the diode.
Finally, use the model of the saturation current of Figure 5 to build the model for the diode current as given in equation (8) and shown in Figure 6.
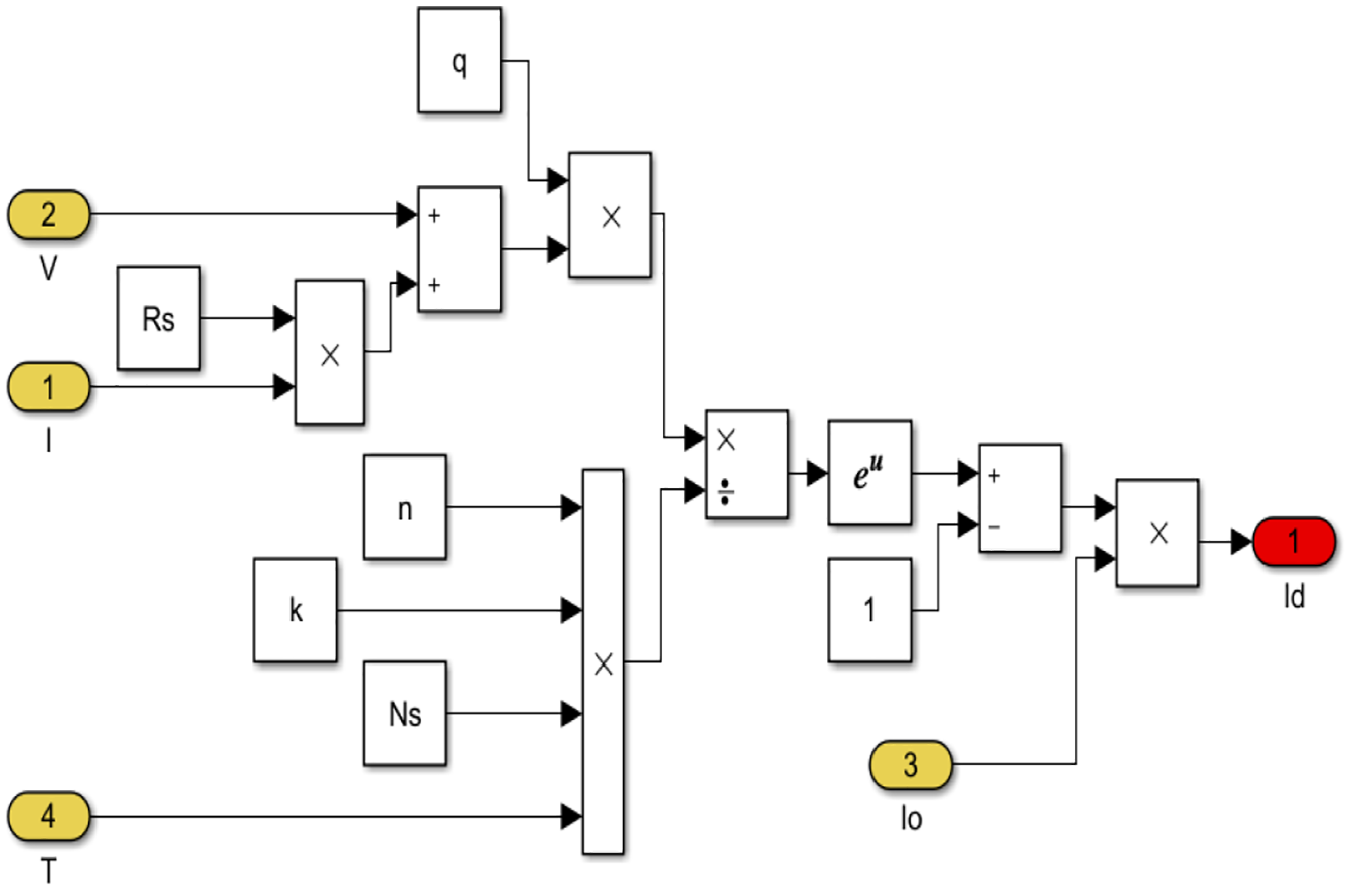
Simulink circuit for the subsystem block of diode current.
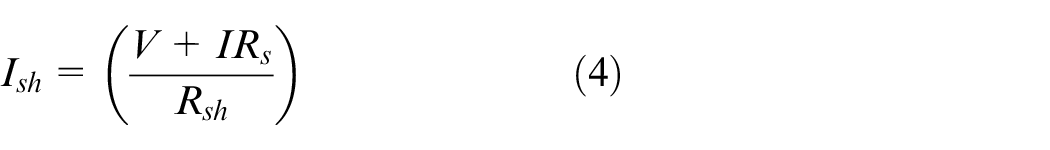
Now, implement the model of the shunt current, as shown in Figure 7. The next step is to implement the equation of the output current by subtracting the shunt current, diode current from the photocurrent, as shown in Figure 8.
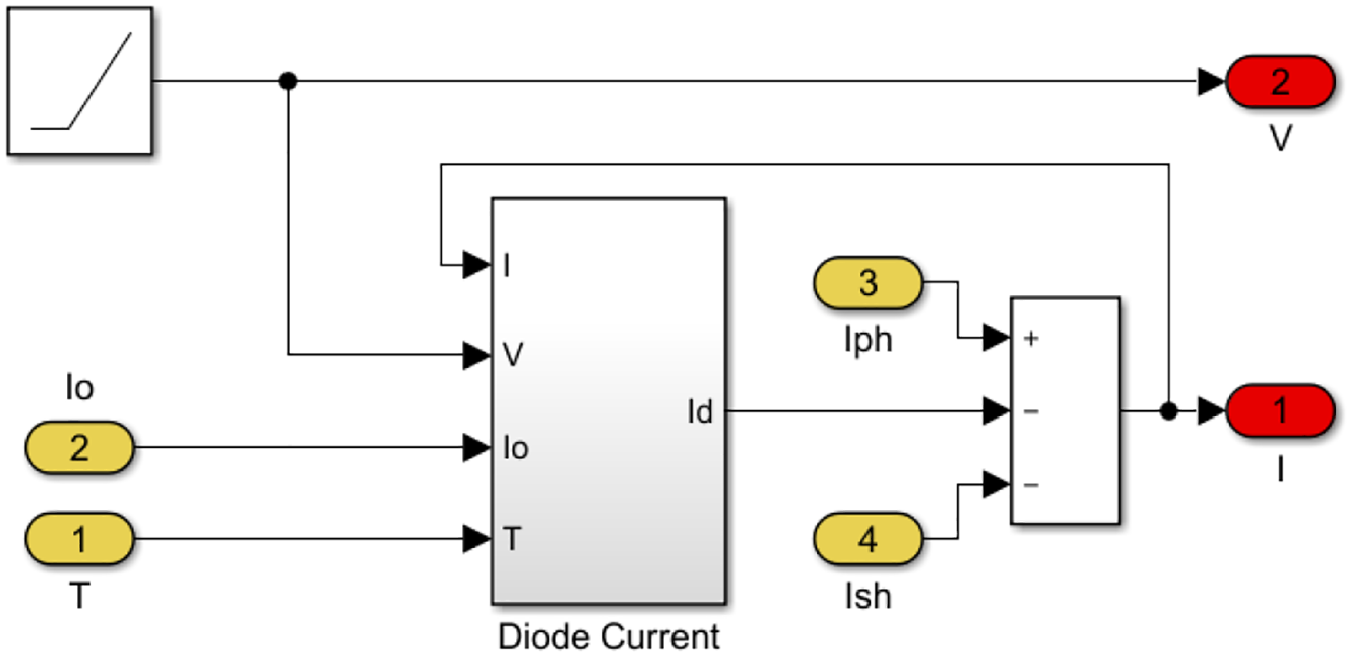
Simulink circuit for the subsystem block of PV array I and V.
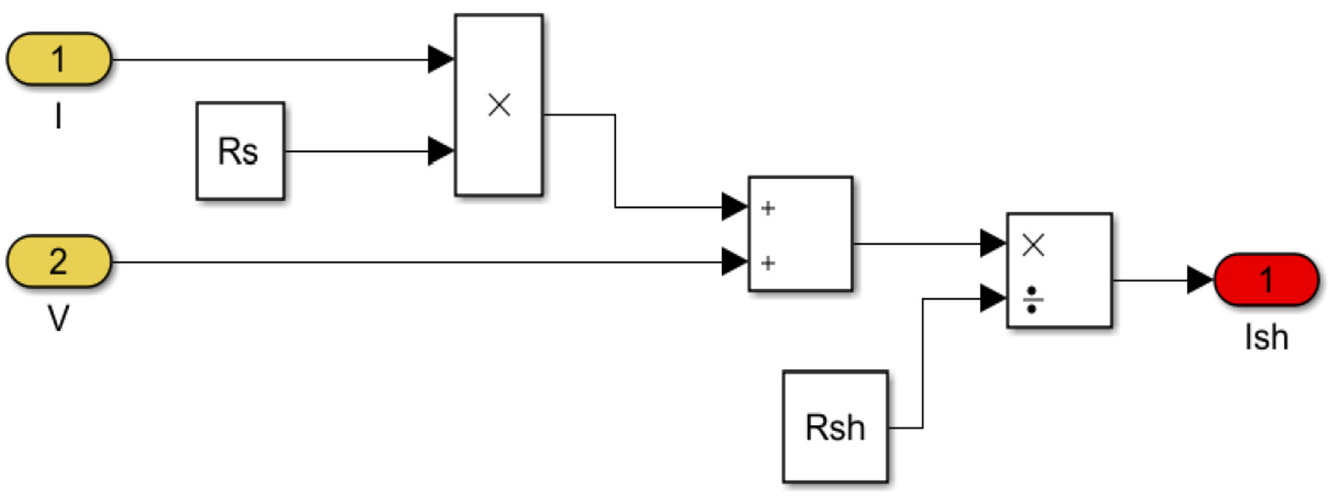
Simulink circuit for the subsystem block of shunt current.
Figure 9 shows the final model for the implementation of the PV module.
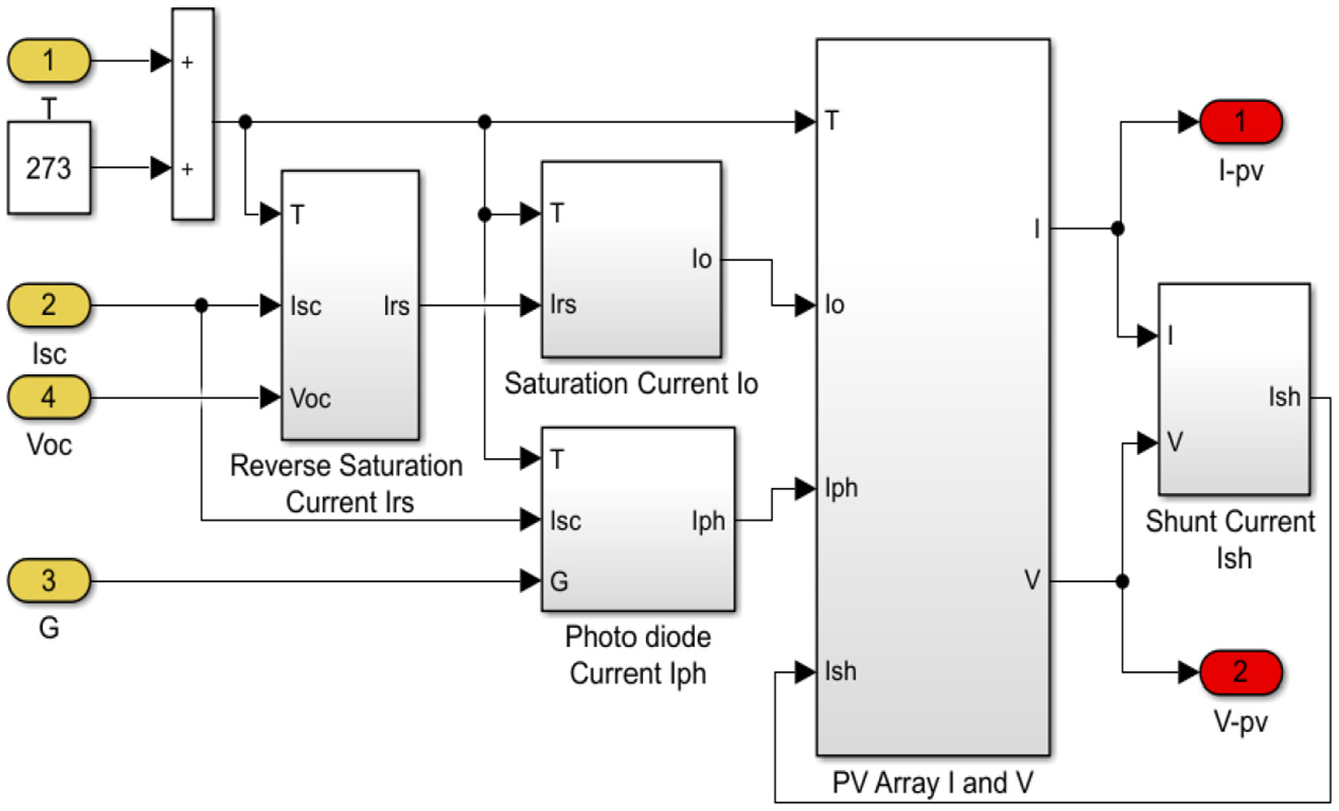
Simulink circuit for the subsystem block of PV module.
For analysis purpose or to check the I–V and P–V characteristics of the designed PV module, Figure 10 shows the completed model design. In this model, many of the tests can be performed by varying the different conditions such as temperature and irradiance, and any PV panel can be designed by changing the shunt current and open-circuit voltage of the cell.
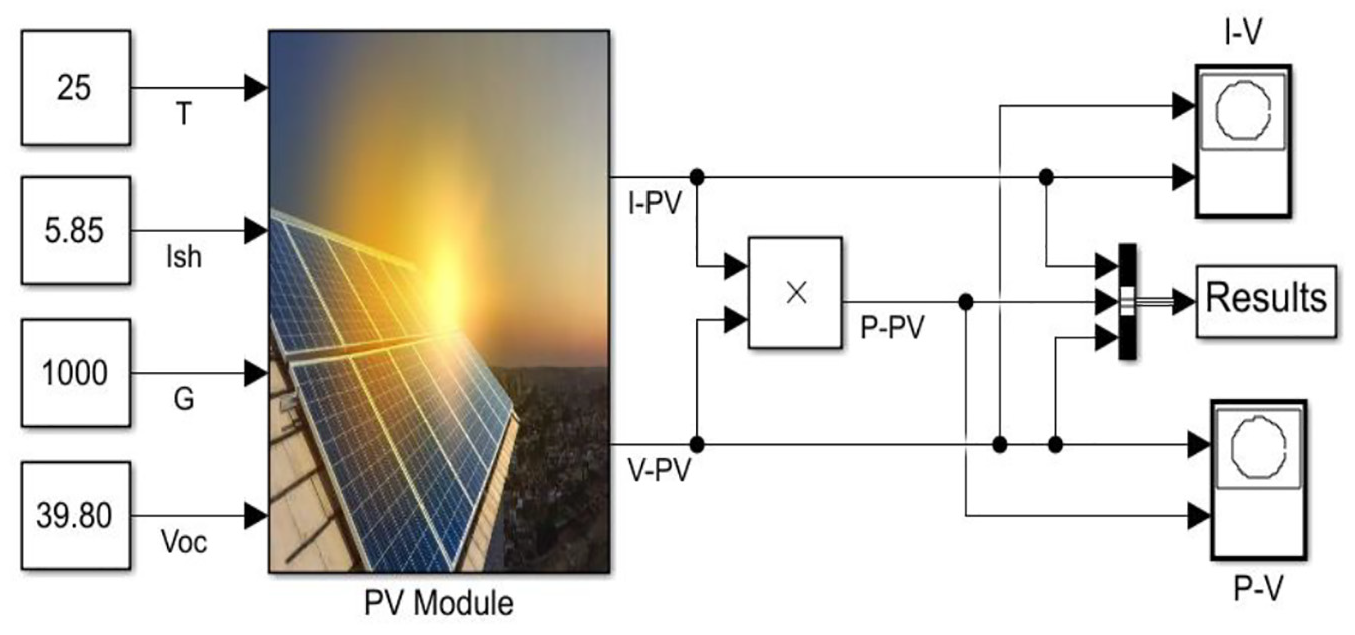
Simulink circuit for the solar panel.
Simulation results
The complete and comprehensive equation-based method is used to build the circuit in the MATLAB/Simulink to investigate its physical parameters and operating conditions as discussed in section ‘Stepwise Simulink circuit for PV cell’, and the simulation results are shown under this section. With the developed model of the PV module, the I–V and P–V characteristics are discussed here.
Figure 11 shows the I–V characteristics in which the operating temperature keeps constant and varying the irradiance from 400 to 1000 W/m2. It shows that by increasing the irradiance from the lower level to high, there is an increase in the output current and the voltage. Figure 12 shows the result of the P–V characteristics of the PV system. As irradiance increases, the power for the PV system rises in the same way and it shows the direct relationship between irradiance and the power.
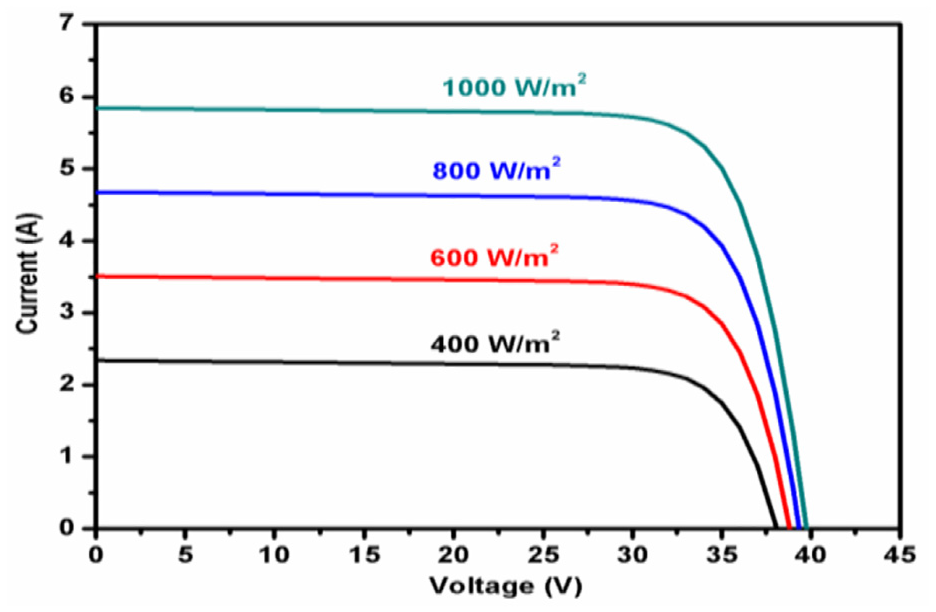
Output I–V curve with the varying irradiance at 25 °C.
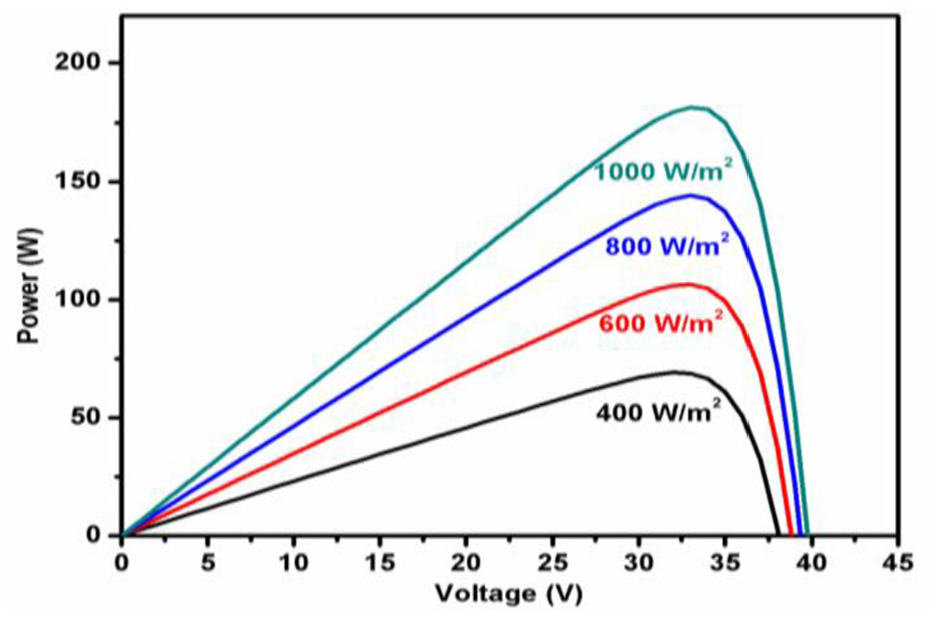
Output P–V curve with the varying irradiance at 25 °C.
Figure 13 shows the I–V characteristics of the PV system where the irradiance is kept constant at 1000 W/m2 and the temperature is varied from 15 to 70 °C.
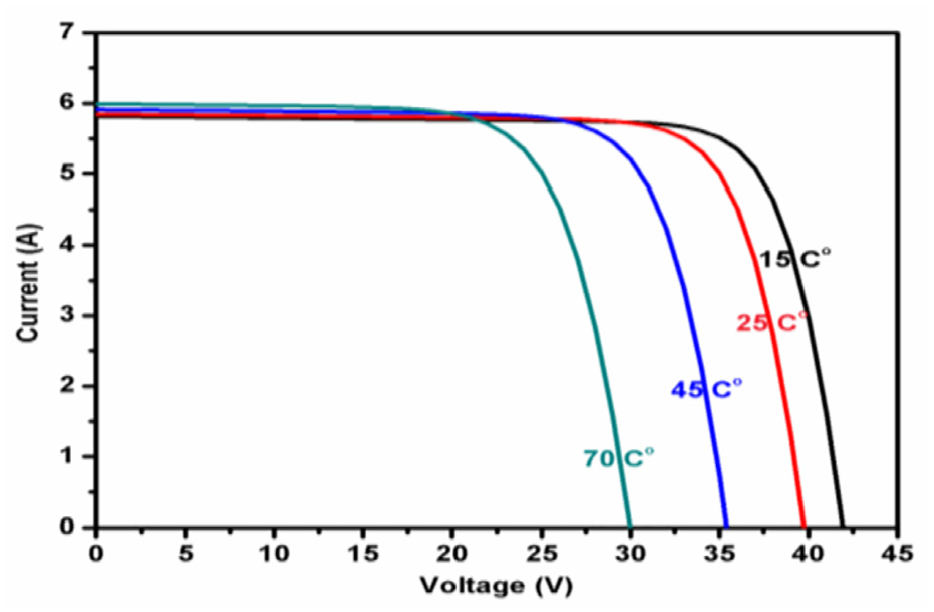
Output I–V curve with the varying temperature at
It shows that while increasing the temperature from lower to higher values, there is a slight change in the current but the voltage drastically decreases. In results, the power output decreases as the temperature increases, as shown in Figure 14, and has an inverse relationship with the temperature.
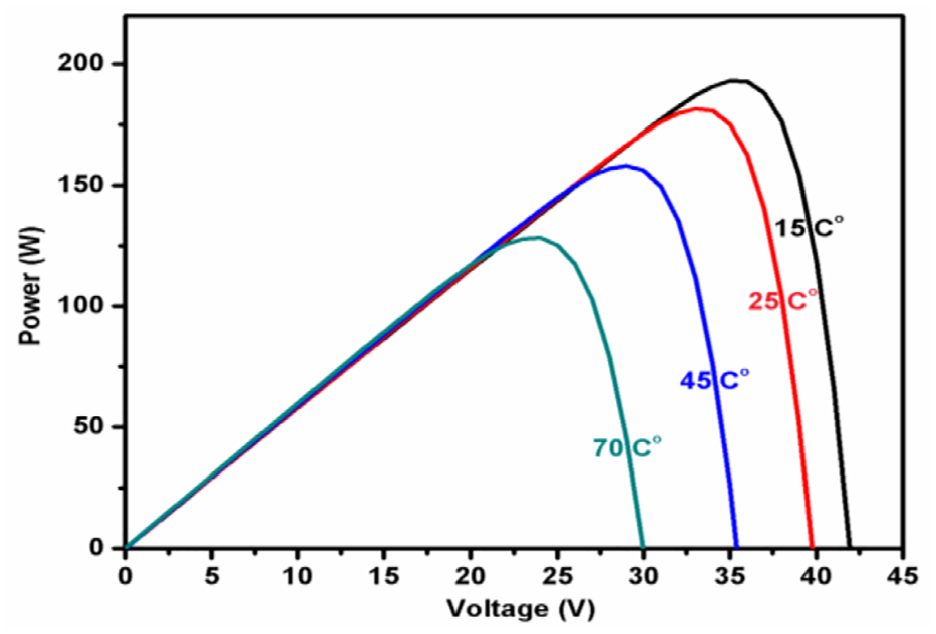
Output P–V curve with the varying temperature at 1000 W/m2.
Shunt resistance also has the role of the power output of the solar cell. Figure 15 shows the I–V characteristics of the PV module in which the shunt resistance is changing from the higher to the lower value while the temperature and irradiance are kept constant on their optimal values 25 °C and 1000 W/m2, respectively.
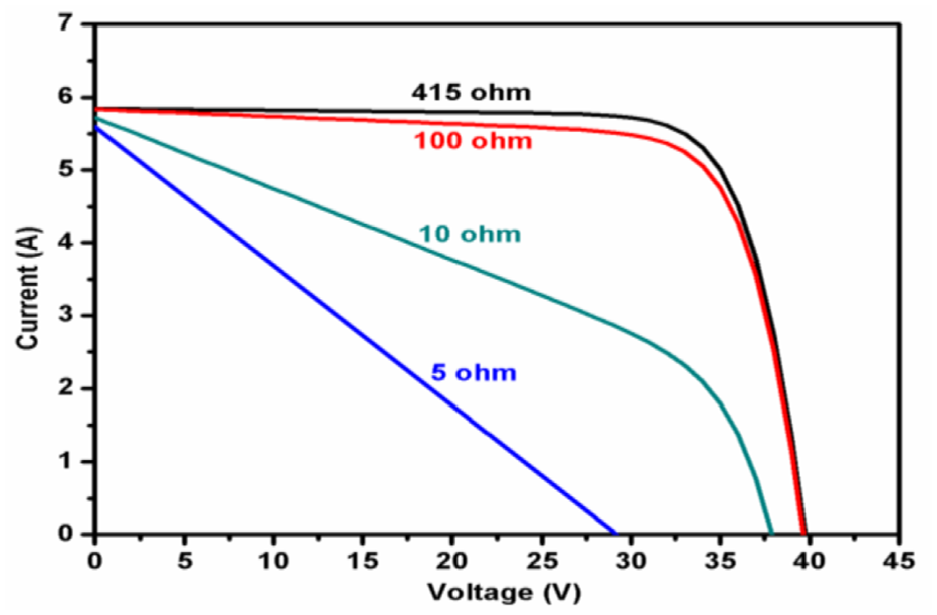
Output I–V curve with the varying shunt resistance at 25 °C and 1000 W/m2.
As the shunt resistance decreases for the higher value such as 415–100, the current and voltage slightly change, which leads to a reduction in the power output. When the shunt resistance decreases to a deficient value such as 10 and 5, the current and voltage change noticeably, which results in a reduction of the power output as shown in Figure 16. So to maintain the optimal power, shunt resistance should be selected with care.
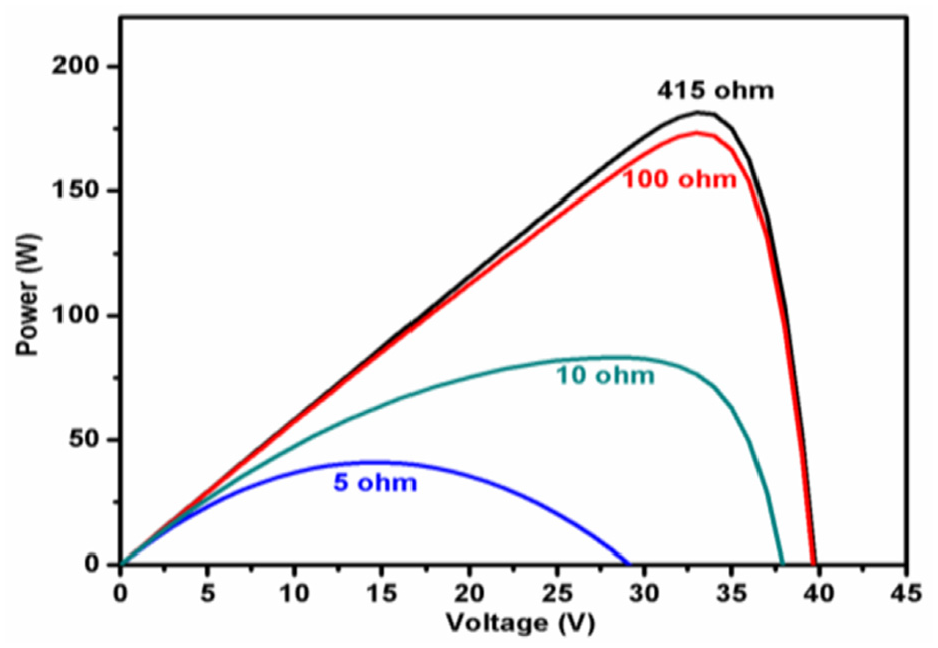
Output P–V curve with the varying shunt resistance at 25 °C and 1000 W/m2.
Shading effect is shown in Figure 17, where the I–V characteristics experience the multiple steps. From Figure 18, the P–V curve gives the number of peaks and the noticeable power decreases due to the partial shading on the PV panels.
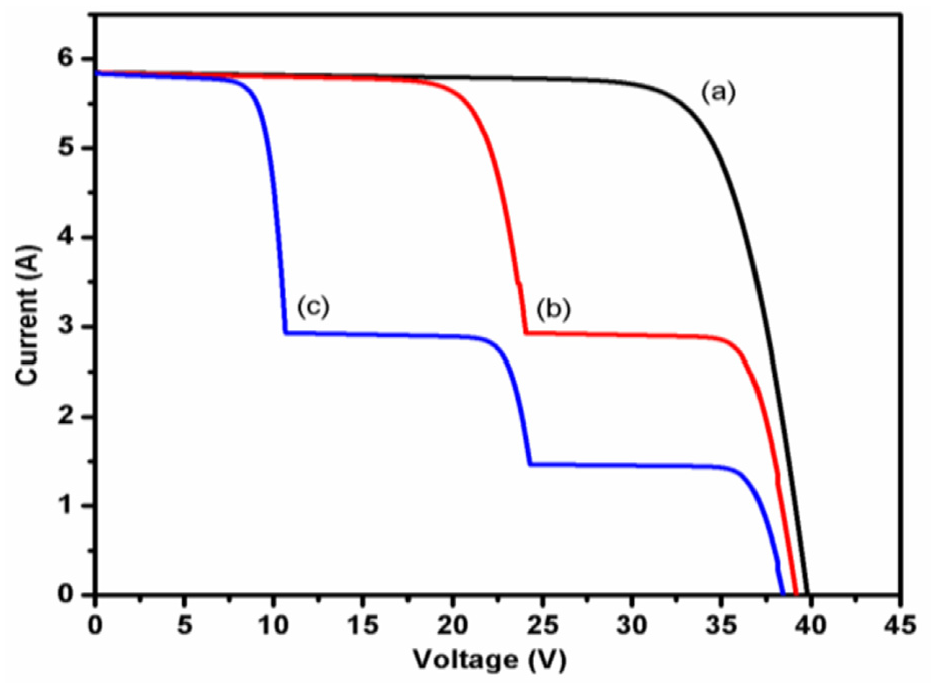
Output I–V curve with partial shading effect: (a) no shaded (full irradiance 1000); (b) partial shading (Cells 1–36: 1000 irradiance, Cells 37–54: 500 irradiance); (c) partial shading (Cells 1–18: 1000 irradiance, Cells 19–36: 500 irradiance, Cells 37–54: 250 irradiance).
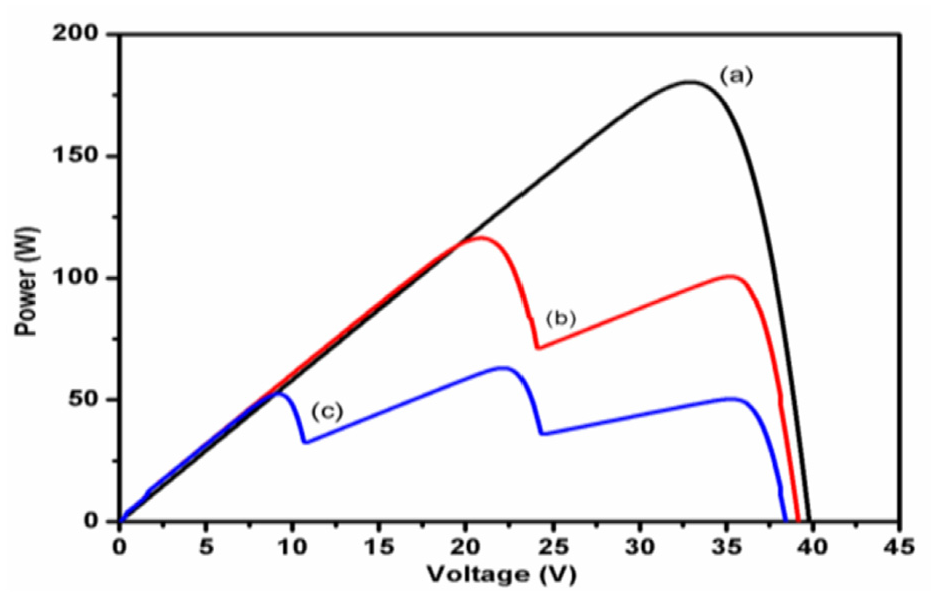
Output P–V curve with partial shading effect: (a) no shaded (full irradiance 1000); (b) partial shading (Cells 1–36: 1000 irradiance, Cells 37–54: 500 irradiance); (c) partial shading (Cells 1–18: 1000 irradiance, Cells 19–36: 500 irradiance, Cells 37–54: 250 irradiance).
Conclusion
This paper presents a step-by-step procedure for equation-based modelling of the PV solar cell, which serves as an aid to the researchers and readers to understand the I–V and P–V characteristics of the system. Before selection of the PV panel at any location and for any application, this study helps the readers a lot because it also represented the robust tool to check the behaviour of the PV module on different physical parameters and environmental conditions such as temperature, irradiance, shunt resistance, and the partial shading. This model is very user-friendly to understand the behaviour of the PV module on several changing conditions. This study highlights the performance of the selected flexible solar panel for the electric vehicles under the shading effect because almost all at the day time there is a 50% portion of the vehicle is partially shading while on mobility or at parking. This research is only the first step towards the hybrid system for the electric vehicles where other renewable power generation connecting with it, such as wind energy source.
Footnotes
Declaration of conflicting interests
The author(s) declared no potential conflicts of interest with respect to the research, authorship, and/or publication of this article.
Funding
The author(s) received no financial support for the research, authorship, and/or publication of this article.