
Abstract
The growth of photovoltaic power plants in both size and number has spurred the development of new approaches in inspection techniques. The most commonly employed methods include visual inspections, current-voltage measurements, infrared thermography, and luminescence imaging. Luminescence, rooted in the electromagnetic radiation capture of semiconductor structures that make up solar cells, proves effective in detecting various failures that may occur throughout the lifespan of a photovoltaic module. This phenomenon can be induced either by injecting current into the photovoltaic module (Electroluminescence) or through optical excitation using an appropriate light source (Photoluminescence). This paper offers an overview of the conventional outdoor luminescence imaging technique, delving into its applications and limitations. Additionally, it provides a comprehensive review of innovative outdoor luminescence technique approaches. These novel techniques aim to address several limitations of conventional methods, such as the considerably lower luminescence emission intensity compared to solar radiation, the need for external energy sources for current injection, the required acquisition time, and the necessity of disconnecting the solar module.
Keywords
Introduction
Global warming is one of the primary challenges facing contemporary society. Global warming has led to a 1.1°C increase in the global average temperature since 1980 (National Aeronautics and Space Administration, 2024). This rise in temperature, along with its associated consequences such as extreme climate events, erratic weather patterns, and rising sea levels, has spurred international cooperation efforts to address global warming. Furthermore, the currently acceleration of climate change (Minière et al., 2023) represents an even greater cause for concern. The Intergovernmental Panel on Climate Change (IPCC) emphasizes that limiting global warming to below a 1.5°C temperature increase could significantly mitigate the impacts and consequences of global warming (Intergovernmental Panel on Climate Change (IPCC), 2022). This objective is outlined in the Paris Agreement (Horowitz, 2016), an international accord signed by 193 countries and the European Union. The agreement aims to implement a series of policies designed to cap global warming below 2°C, with a preferred target of 1.5°C.
Global warming is predominantly driven by anthropogenic greenhouse gas emissions, which have been steadily increasing and recently reached an annual total of 52.8 GtCO2eq (UN Environment programme, 2022). To align with the Paris Agreement, countries worldwide are formulating strategies to attain a net-zero carbon emissions status by mid-century. Achieving this goal necessitates substantial changes across various sectors of the economy and society. According to the International Energy Agency (IEA), the energy sector accounted for 34.17 GtCO2eq in 2021 (International Energy Agency Global Energy Review, 2021), constituting 65% of the total emissions. This identifies the energy sector as the primary source of pollution, demanding the most profound transformation to meet environmental objectives. Approximately 42% of energy-related emissions result from the combustion of fossil fuels for electricity and heat generation (International Energy Agency Global Energy Review, 2021). Therefore, a transformation of the electricity generation industry is imperative to achieve a net-zero carbon emissions scenario and mitigate the consequences of global warming.
The adoption of renewable energy for electricity generation has emerged as a crucial strategy in decarbonizing the electricity sector. As of 2022, 30% of the world's electricity is generated from renewable sources (Ember Climate, 2023). Among these, hydropower leads with a 51% share, while wind and solar energy contribute 25% and 15%, respectively (Ember Climate, 2023). Renewable energies not only provide electricity with a low carbon footprint (Edenhofer et al., 2011) but also demonstrate the capacity to generate electricity at a competitive cost (Fraunhofer Institute for Solar Energy Systems, 2021; IRENA, 2022). Consequently, renewable technologies have witnessed significant growth in recent years, and this upward trend is expected to continue into the future.
Among various technologies, photovoltaic (PV) power has undergone remarkable growth in recent years, surging from a global capacity of 39.3 GWp in 2010 to 891.3 GWp in 2021 (International Energy Agency (IEA), 2022). Forecasts suggest that by 2027, PV will claim the title of the world's highest installed capacity technology, reaching a total of 2359.4 GWp (International Energy Agency (IEA), 2022). This substantial expansion can be largely attributed to the significant reduction in manufacturing costs of PV modules, plummeting from 2.0 USD/Wp in 2010 to less than 0.2 USD/Wp in 2020 (International Energy Agency Evolution of Solar PV, 2024). As PV modules constitute the most expensive component of a PV power plant, the total installed cost for a utility-scale system has seen a remarkable decrease from 4808 USD/kWp in 2010 to 883 USD/kWp in 2021 (IRENA, 2022). This reduction has positioned PV utility-scale power plants as the most cost-effective electricity producers when compared to other technologies, boasting an average levelized cost of energy (LCOE) at around 40 USD/MWh (Fraunhofer Institute for Solar Energy Systems, 2021). Additionally, PV power generation boasts low life cycle greenhouse gas emissions, with only 43 gCO2eq/kWh (NREL, 2021). Finally, solar systems, unlike some other renewable technologies, offer easy integration into urban environments, with rooftop solar PV presenting substantial potential (Bódis et al., 2019; Fakhraian et al., 2021).
Within the operations of a PV power plant, maintenance plays a crucial role (Hernández-Callejo et al., 2019; Peinado Gonzalo et al., 2020; Spertino and Corona, 2013). It serves to maximize energy generation and prevent safety issues, thereby contributing to enhanced profitability through a well-optimized maintenance plan. Maintenance in PV plants encompasses conventional electrical tasks, along with specific maintenance of solar modules, which are the critical components within the direct current electrical system of any PV power plant. The significance of module maintenance arises from their exposure to various environmental loads, including moisture, ultraviolet radiation, thermal loads, soiling, and corrosion (Waqar Akram et al., 2022). These loads contribute to an annual degradation rate between 0.5 to 0.8% (Jordan and Barnes, 2023; Jordan and Kurtz, 2013; Köntges et al., 2014). Additionally, PV modules are susceptible to a range of failures, such as delamination, junction box failure, frame breakage, discoloration, cell cracks, snail tracks, burn marks, potential-induced degradation (PID), disconnected cells, defective bypass diodes, ground faults, back sheet chalking, or cell finger failure, among others (Hong and Pula, 2022; Köntges et al., 2014; Waqar Akram et al., 2022). This degradation and the potential for module failures result in reduced energy yield and can pose safety risks, including an increased risk of fire (Waqar Akram et al., 2022). Consequently, it becomes imperative to implement methods and techniques for measuring, identifying, and analysing faults in PV modules, from their initial manufacturing phase to their end-of-life operation (Høiaas et al., 2022). The inspection of PV modules is crucial, spanning pre- and post-shipment tests, systematic operation and maintenance audits, commissioning tests, and analysis following extreme weather events such as hail or strong winds.
The most common inspection techniques employed in PV plants for assessing the performance of PV modules include visual inspection, current-voltage measurements (I-V curves), thermographic imaging, and luminescence imaging, which encompasses both electroluminescence and photoluminescence (Köntges et al., 2014). Note that the mentioned approaches are non-destructive techniques (Zhu et al., 2011), which is crucial for PV applications. Displays an example of these inspection techniques, where visual, thermographic, and luminescence inspections involve imaging approaches, while current-voltage curves involve electrical measurements. In addition to these mainstream methods, less common techniques can also be utilized, such as ultraviolet fluorescence imaging (Kontges et al., 2020), acoustic microscopy methods (Meng et al., 2011; Xu et al., 2013), electronic speckle pattern interferometry technique (Yin and Wen, 2011), and spectroscopy (de Biasio et al., 2013). These methods are limited to laboratory measurements, and field techniques for them have not yet been developed (Figure 1).

Standard inspections techniques in PV power plants. (a) Visual inspection; (b) Current-Voltage curve; (c) Thermographic inspection; (d) Luminescence inspection.
Visual inspection
Visual inspections represent an effective, simple, and quick method for identifying failures within PV modules. To ensure the collection of homogeneous information, visual inspections must adhere to certain standards. The standard methods for visual inspection are summarized in IEC 61215 and IEC 61646. This technique proves useful in identifying various failures such as burnt cells, delamination, encapsulant yellowing, back sheet blistering, oxidation, corrosion, junction box faults, bubble formation, and many others (Köntges et al., 2014; Waqar Akram et al., 2022). These visual effects are often primary contributors to power losses. Despite its effectiveness, visual inspections have limitations. They are time-consuming, and their accuracy can be affected by human errors, making them less suitable for application in large PV power plants. Moreover, some defect can not be detected by visual inspections.
Current-voltage measurements
Measuring the current-voltage curve of solar modules enables the determination of crucial electrical parameters, including open-circuit voltage, short-circuit current, maximum power output, and other relevant characteristics (Köntges et al., 2014). A typical current-voltage measurement system includes a light source, a temperature control system, and data acquisition equipment. This system captures a current-voltage scatter plot as the module voltage varies, achieved by applying a variable load, a capacity load, an electronic load, a DC-DC converter, or a power supply (Duran et al., 2008). Indoor measurements use an artificial light source, while outdoor measurements harness natural sunlight. However, it's important to note that outdoor measurements are often conducted under non-standard conditions due to variations in solar irradiance, temperature and solar spectrum. Therefore, normalization to standard testing conditions (STC) is necessary, typically involving 1000 W/m² of solar irradiance, a temperature of 25°C, and an AM 1.5G reference spectrum.
Current-voltage measurements precisely quantify power losses resulting from various failures. Analysing the current-voltage curve and comparing it to the manufacturer's specified curve facilitates the determination of module degradation and power losses. These curves are particularly valuable for identifying faults in shunt resistance and series resistance, as the slope of the curve near the short-circuit and open-circuit points directly relates to these characteristics. However, it's important to acknowledge the limitations of current-voltage measurements. They may not detect small failures or faults with low impact on the electrical performance of the module (Waqar Akram et al., 2022). Additionally, conducting current-voltage measurements can be time-consuming, and it is considered an invasive technique as it requires the disconnection of solar modules (Morales-Aragonés et al., 2021a). To address these limitations, conventional current-voltage tracers can be replaced by online tracers. These electronic boards extract current-voltage curves without disconnecting the solar modules, even during the operation of the PV plant (Morales-Aragonés et al., 2021b). This innovation minimizes downtime and enhances the efficiency of fault detection and monitoring. Another non-invasive method for current-voltage characterization could involve the use of inverters with embedded functionality for current-voltage curve sweeps (Spataru et al., 2015b).
Thermography inspection
There are two types of thermography techniques applicable to PV systems (Köntges et al., 2014). The most used and straightforward method is known as passive thermography. This inspection technique provides the thermal performance of a PV module during operation in sunlight. Its contactless nature and rapid data acquisition make thermography the most widely implemented technique in PV power plants (Kandeal et al., 2021; Ulrike Jahn et al., 2018). Thermography inspections excel at detecting various faults within the PV module, including mismatched cells, shaded cells, resistive solder bonds, localized shunting in cells, defective bypass diodes, or degradation of packaging materials (Schirripa Spagnolo et al., 2012). Moreover, thermography inspections can be conducted using unmanned aerial vehicles (Gallardo-Saavedra et al., 2018; Luo et al., 2017), allowing for increased data acquisition. Drone-based inspections achieve an inspection rate of 0.5 MW/h, surpassing the 0.25 MW/h rate in ground inspections (Ulrike Jahn et al., 2018). However, a primary drawback of thermography is its requirement for high irradiance, typically exceeding 600–700 W/m² (Köntges et al., 2014; Weber et al., 2016), for faults to generate an inhomogeneous temperature within the PV modules that thermal cameras can capture.
The alternative methods fall under the category of active thermography, requiring an external heating source and typically conducted under laboratory conditions (Kandeal et al., 2021). One such active method is pulsed thermography (Lopez et al., 2014), where a temperature increase is induced within the solar module using an external heat source, such as a powerful flashlight. Subsequently, the temperature drop is captured by a thermography camera with a high image acquisition frequency. The temperature distribution across the surface is then evaluated using Fourier transformation. The resulting pulsed thermography images provide detailed insights into the inner structure of a PV module. Another technique, lock-in thermography (Besold et al., 2014), operates by exciting and measuring the sample at a controlled frequency. This approach helps reduce the noise ratio, enabling the detection of defects with low thermal impacts as well. Finally, for fields measurements, it is also possible to use a dark steady-state thermography technique (Ulrike Jahn et al., 2018), where a forward bias current is applied to the module to generate heat within it. Meanwhile, a thermographic camera is employed under nocturnal conditions.
Luminescence
Luminescence is an effect where a material emits light when exposed to certain energy sources. PV modules exhibit luminescence emissions when excited by a current injection or an appropriate light source. This emitted light can be captured to generate luminescence images, serving as a powerful tool for fault detection (Köntges et al., 2014; Ulrike Jahn et al., 2018). Luminescence images offer valuable insights into the state of the solar module and can detect failures that may not have an electrical or thermal impact on module performance. Some problems detectable through luminescence images include finger failures, potential induced degradation (PID), short-circuit or open-circuit faults in bypass diodes, mechanical load-induced damages, moisture corrosion, shunt faults, series resistance faults, and cracks or microcracks (Köntges et al., 2014).
The present paper aims to provide an overview of luminescence techniques and their applications within PV plants. The second section of the paper explains theoretical and technical considerations of luminescence imaging, including the types of sensors that can be used to capture luminescence emission. The third section compiles the main applications of luminescence imaging, while the fourth section describes the conventional techniques used for luminescence imaging acquisition in PV plants. Furthermore, this section introduces novel approaches designed to address the drawbacks of conventional luminescence techniques. Finally, the discussion and conclusion appear in the last section of the paper.
Theorical and technical considerations of luminescence imaging
As mentioned earlier, luminescence imaging is based on capturing the electromagnetic emissions generated by the crystalline structures of solar cells. These emissions can be generated in two ways. Firstly, luminescence emission can be induced by an external current injection into the cell or module. In this case, the effect is known as electroluminescence (EL). Secondly, luminescence emission can also be generated through optical excitation, using a light source with an appropriate wavelength and intensity. This effect is termed photoluminescence (PL). Although both types of imaging techniques provide similar information about solar module performance, EL and PL also offer distinct insights. EL imaging, involving the injection of current into the module, is closely linked to electrical performance. In contrast, PL imaging, requiring optical excitation, primarily assesses the quality of the material through PL emission.
The wavelength of luminescence emission depends on the material used in PV solar cells. For the purposes of this discussion, we will focus on the luminescence effect as it pertains to crystalline silicon cells, given that this technology represents approximately 95% of the market (Fraunhofer Institute for Solar Energy Systems, 2023). The electromagnetic emission from silicon structures is near-infrared light and exhibits a wavelength peak at 1150 nm, as depicted in Figure 2. Other technologies may exhibit different wavelength peaks. For example, CdTe modules have an 800 nm wavelength peak for luminescence emission (Weber et al., 2011), while organic modules present a luminescence peak between 1200 and 1400 nm (Hoyer et al., 2010). The electromagnetic emission of silicon structures falls outside the visible spectrum and coincides with one of the H2O absorption bands within the atmosphere, a region where sunlight intensity is lower due to this absorption. It's important to note that the intensity of sunlight is two to three orders of magnitude higher than luminescence emissions in silicon crystalline PV devices (Kunz et al., 2022; Smestad and Ries, 1992), which can make image acquisition challenging under high irradiance conditions.

Normalised luminescence emission, solar spectrum and typical quantum efficiency of silicon and InGaAs sensors (Guada et al., 2020).
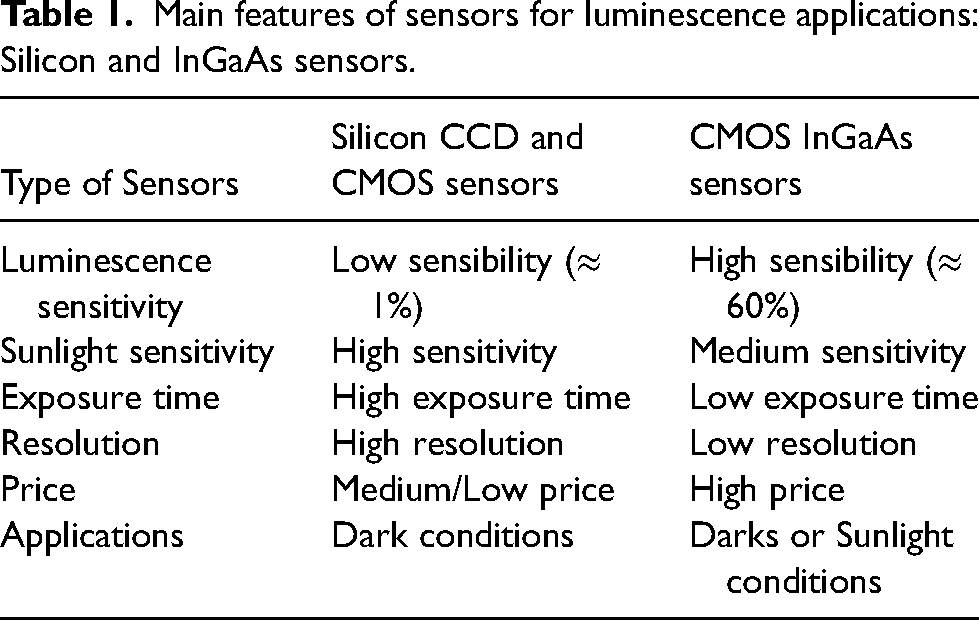
Luminescence emission can be captured using different sensors, with two main semiconductor materials suitable for applications in PV systems (Colvin et al., 2021; Ulrike Jahn et al., 2018). Silicon sensor based on coupled charged devices (CCD) were initially employed in luminescence applications due to their low cost and high resolution (typically exceeding 1080). Additionally, silicon sensors based on complementary metal-oxide-semiconductor (CMOS) are also available, and low-cost EL applications have been developed using them by removing their infrared filter (Frazão et al., 2017; Owen-Bellini et al., 2019). However, devices based on silicon sensors have low sensitivity within the luminescence wavelength range, as illustrated in Figure 2. Consequently, a high exposure time and a dark environment are required. Semiconductor materials with a smaller bandgap, such as InGaAs, exhibit higher sensitivity within the luminescence signal. CMOS InGaAs sensors are commonly used for luminescence applications in PV. The increased sensitivity within the luminescence wavelength allows for faster acquisition and reduced exposure times. Additionally, these sensors have lower sensitivity in the higher intensity wavelengths of the solar spectrum, making them more suitable for daylight applications. However, these sensors tend to have lower resolution (typically 640 by 512 or nowadays 1280 by 1014 pixels resolution) than silicon sensors and are more expensive. Table 1 summarizes the main characteristics of both types of sensors. Finally, it is common to implement bandpass filters and a InGaAs camera in daylight applications (Bhoopathy et al., 2018a, 2018b, 2019, 2020; Dos Reis Benatto et al., 2018b; Guada et al., 2020; Koester et al., 2020; Kropp et al., 2017; Kunz et al., 2021; Martínez et al., 2017; Parikh et al., 2019; Redondo-Plaza et al., 2024; Silverman et al., 2017; Stoicescu et al., 2014; Vuković et al., 2022a; Vuković et al., 2022b). Figure 2 indicates the common region of the electromagnetic spectrum where the transmittance of these bandpass filter is high. Therefore, the bandpass filter blocks different wavelengths of luminescence, increasing the portion of the signal corresponding to luminescence emission and, consequently, improving the quality of the measurements.
Main features of sensors for luminescence applications: Silicon and InGaAs sensors.
Taking into account the variation in luminescence emission from a silicon solar cell or module at different operating points along its I-V curve, it is possible to closely estimate the luminescence signal intensity (IL) using the exponential formula shown in Equation 1 (Kunz et al., 2022).

Normalised current and luminescence intensity as function of normalised voltage in illuminated (a) and darkened (b) PV modules.
The behaviour of luminescence emission and the current-voltage curve in a darkened PV module is depicted in Figure 3-(a). In darkness, any applied voltage to the module results in current injection (CI) and, consequently, EL emission. Throughout the entire current-voltage curve, the module operates in the fourth quadrant as a load. Conversely, the behaviour of luminescence emission and the current-voltage curve under an STC illuminated PV panel is illustrated in Figure 3-(b). From short circuit (SC) to open circuit (OC), the module functions as a generator and operates in the first quadrant of the current-voltage curve. Here, PL emission occurs, peaking under OC conditions. It's noteworthy that PL emission is nearly absent under maximum power point (MMP) conditions and is directly proportional to irradiance (Redondo Plaza et al., 2023). Operating at voltages higher than OC entails current injection into the module, causing it to function in the fourth quadrant as a load. In this scenario, EL effect is added to PL emission.
Luminescence applications
It should be noted that luminescence images are widely used throughout the entire lifecycle of a solar module, from its fabrication to its outdoor operation. PL techniques are commonly employed to assess the quality of the ingot and the wafer in the manufacturing process of PV modules (Trupke et al., 2006; Trupke et al., 2012; Trupke and Weber, 2010). This allows for an evaluation of the material's quality and the prediction of power output before the metallization grid is incorporated into the solar cell. Prior to this step, electric contacts do not exist, making other measurements, such as current-voltage curves or EL images, impossible to perform. Additionally, EL measurements of manufactured modules are typically conducted in PV module factories and laboratories worldwide. Finally, outdoor luminescence images can also be obtained in operational PV plants. Luminescence imaging applications can be divided into qualitative and quantitative analysis.
Qualitative analysis
The analysis of EL or PL pictures enhances the detection of several failures within the PV cell or module. Luminescence pictures show some effects related to the manufacturing process that do not affect the power output and can therefore be considered as non-failures. The inspection of each cell in the solar panel provides a useful tool to identify faults that reduce the power output of the panel, such as cracks, finger failures, humidity corrosion, shunt faults, or disconnected busbars. Additionally, it is possible to identify patterns within the PV module. In this context, luminescence provides a valuable tool to detect potential-induced degradation (PID).
Fault detection and classification can be done manually by an expert. However, new approaches based on artificial intelligence have developed methods that automatically detect and classify failures (Hong and Pula, 2022). This not only allows for the efficient management of a high volume of data but also reduces the time required, resulting in cost savings.
Quantitative analysis
While qualitative analysis of PV faults with EL and PL pictures is a powerful tool, a quantitative analysis is also desirable as it allows determining the amount of power losses that the faults generate. Additionally, a quantitative analysis provides a more precise tool in decision-making. Some of the applications that provide a quantitative analysis are outlined below:
Determination of the minority carrier lifetime (Giesecke et al., 2010; Khatavkar et al., 2013; Trupke et al., 2012): The minority carrier lifetime is the average time a minority carrier spends in the semiconductor material before recombining with a majority carrier. In the context of solar cells, longer minority carrier lifetimes are generally desirable because they allow carriers to travel longer distances in the material, increasing the chances of being collected as electrical current rather than recombining. A longer minority carrier lifetime is associated with lower recombination rates, which can enhance the efficiency of solar cells. However, this is a approach which is limited to factory and laboratory measurement in ingots and wafers, the precursors of solar cells during the manufacturing process (Trupke, 2016). Quantification of cracks in a module (Spataru et al., 2015a): It is possible to quantify the cracks in a module to determine the percentage of the module area affected by the cracks. Estimation of the terminal voltage of a solar cell within a module (Köntges et al., 2009; Potthoff et al., 2010): Since solar cells are encapsulated in the solar module, performing an electrical measurement to determine their voltage becomes impossible. This approach takes advantage of luminescence emission, which is proportional to terminal voltage. In this way, it is possible to determine the voltage of each cell in a module using an EL picture and knowing the total voltage of the panel. Extraction of solar cell parameters: Luminescence images can be used to obtain series resistance images (Dost et al., 2021; Haunschild et al., 2009; Hinken et al., 2007), shunt resistance images (Roy et al., 2014; Roy and Gupta, 2019), and saturation current estimation of the one diode model (Roy and Gupta, 2019). These parameters enhance the reconstruction of the dark current-voltage curve of the PV device for power estimations (Kropp et al., 2018).
Outdoor luminescence techniques
The process of acquiring luminescence images in PV plants can be performed in different ways. Below, the conventional method for acquiring outdoor luminescence images is presented. The term “conventional method” refers to the simple and initially used technique for luminescence imaging. Additionally, alternative methods that aim to improve upon the conventional approach and address its limitations are summarized.
Outdoor conventional method
As previously mentioned, the luminescence signal is much lower than sunlight signal intensity, hindering image acquisition under high-irradiance environments. Therefore, luminescence images have traditionally been taken during the night in PV plants (Kunz et al., 2022; Ulrike Jahn et al., 2018). Furthermore, EL images represent the majority of conventional luminescence pictures, as it is more practical and easier to use a power supply for current injections and achieve the EL effect than to build and use a uniform lighting device for generating the PL effect. Additionally, the light used can introduce noise in the final picture.
Therefore, the conventional set-up method involves a camera for imaging acquisition and a power supply capable of providing the SC current of the module and a higher voltage than the OC module's voltage. It's important to note that it is possible to induce the EL effect in a full PV string if the power supply can generate enough current and voltage to reach an injection current equivalent to the SC current, as EL measurements are typically conducted under this condition. These measurements must be taken under dark conditions to achieve good quality results and therefore silicon sensor as well as InGaAs sensor can be employed. The typical configuration of a conventional EL measurement system is shown in Figure 4.

Configuration of a conventional electroluminescence measurement system.
If EL measurements are done under the technical specification of IEC 60904-13, it is necessary to inject the short-circuit current of the tested PV module. Moreover, to evaluate the quality of the picture, the signal-to-noise ratio (SNR50) can be calculated using three images: two with current injection applied to the module and another with the unpowered module. The formula to calculate the SNR50 is shown below in Equation 2.
Although luminescence pictures provide useful and high-value information about PV module performance, the conventional method has various drawbacks that limit luminescence measurement in PV power plants. First, the requirement to take pictures during the night poses operational and safety issues, such as bad weather conditions, the need for light towers, or difficulties in manoeuvring through the power plant. Moreover, the conventional technique requires the disconnection of solar modules and a power supply. Finally, these measurements are time-consuming, resulting in a low throughput. Therefore, considering that PV power plants have experienced exponential growth in size, typically reaching peak powers above 100 MW (Mansouri et al., 2019), it is desirable to explore new luminescence techniques that are more effective in addressing the mentioned problems of the conventional technique.
Outdoor alternative methods
Alternative methods aim to improve the conventional technique by addressing one or some of the drawbacks it presents, such as avoiding the use of a power supply or enabling the acquisition of luminescence images under high irradiance conditions. Before describing these approaches, it is important to note that most of them, especially those enabling acquisition under high irradiance conditions, are based on a lock-in approach (Bhoopathy et al., 2018a, 2018b, 2019, 2020; Dos Reis Benatto et al., 2018b; Guada et al., 2020; Koester et al., 2020; Kropp et al., 2017; Kunz et al., 2021; Martínez et al., 2017; Parikh et al., 2019; Redondo-Plaza et al., 2024; Silverman et al., 2017; Stoicescu et al., 2014; Vuković et al., 2022a; Vuković et al., 2022b).
The lock-in technique involves capturing image pairs. One of the images is captured where the luminescence emission is high, while the second picture is captured where the luminescence emission is null or much lower. Therefore, it is necessary to change the PV module operating point between two states: one with high luminescence emission and the other with low luminescence emission (see Figure 3). The operating point with high luminescence intensity can be OC or CI, while the operating point with low or null luminescence intensity can be SC or MPP. In this way, the first photo collects the background signal generated by the sunlight and the luminescence signal, while the second one just collects the sunlight background signal. The subtraction of both pictures allows eliminating the background signal, providing an image that only shows the luminescence signal. As the signal generated by the sunlight is much higher than the luminescence signal, the difference between both pictures is low. Therefore, it is necessary to repeat this cycle several times to obtain a high-quality luminescence image that can be useful for fault detection and module characterization. The post-processing of the images involves subtracting each image pair and then average all the results from the subtractions. Additionally, it is possible to average all images under high and low luminescence emission respectively, and then subtract both averages. It should be noted that operations with images simply involve operations with the digital values of each pixel.
Figure 5-(a) displays the average pixel intensity in a sequence of a total of 40 cycles and 80 images obtained using the lock-in technique. The black dots correspond to the images taken under conditions that resulted in high luminescence emission, while the grey dots correspond to the images taken under conditions with low or no luminescence signal. The difference between these intensities represents the luminescence signal, which has low intensity compared to the background signal generated by the sunlight. It is observed that the intensity of both signals changes. This change is caused due to the variation of weather conditions, especially irradiance, during the acquisition process. Proper operations with these images result in the luminescence image shown in Figure 5-(b). This image, like conventional luminescence images, can be used to detect faults within the PV module. The number of cycles improves the quality of the resulting picture. The smaller the intensity gap between high luminescence pictures and low or null luminescence pictures, the higher the number of cycles required.

Average pixel intensity in images sequence of a lock-in technique (a) and resulting EL image (b).
This approach, based on acquiring images with high and low luminescence signal alternately, is called sequential measurement, and just two pictures are taken per cycle, one with high luminescence signal intensity and the other with null or low luminescence signal intensity. However, it is also possible to acquire two or more pictures during the time the solar module is emitting luminescence signal or not (Guada et al., 2020), increasing the number of pictures per cycle. For the same number of cycles, increasing the number of pictures per cycle improves the quality of the picture. In fact, it is also possible to first capture all the images under high luminescence intensity and then capture all the images under low or null luminescence intensity. This approach is called batch measurement and fits well with techniques that require a high time to change the working point of the solar module (Bhoopathy et al., 2020; Koester et al., 2020; Vuković et al., 2022a; Vuković et al., 2022b), as it only requires one cycle. For the same number of pictures, batch measurement provides luminescence pictures with lower quality, since changing irradiance affects the measurement process. Therefore, it is also possible to multiply the pixel intensity by an irradiance correction factor to normalize the signal intensity and improve the quality of the measurement.
In order to evaluate the quality of the picture, as conventional EL images, is possible to calculate the signal to noise ratio of the luminescence picture that have obtained due to a lock-in images stack (Mantel et al., 2018). The equation presented before to calculate SNR50 can be modified to calculate SNRAVG as Equation 3 shows.
Photoluminescence with artificial light excitation
Similar to conventional EL measurements, it is also possible to capture outdoor PL pictures of PV modules during the night (Doll et al., 2018; Doll et al., 2021). To achieve these measurements, a lighting and camera system are needed (see Figure 6). When designing the lighting system, it is crucial to choose an excitation light with a wavelength that has low sensitivity in the implemented sensor to minimize noise in the resulting picture. Additionally, achieving homogeneous illumination across the entire solar module surface is important. Note that pictures must be taken under dark conditions to avoid sunlight noise.

Setup for a photoluminescence technique with artificial light excitation.
The main advantage of this technique, in comparison with the conventional method, is that it does not require the disconnection of PV modules, which improves acquisition time, reaching a throughput of 37 modules per minute (Doll et al., 2021). However, the construction and use of the lighting system can be challenging due to the requirement of uniform light across the entire solar module surface. Furthermore, the lighting system needs to be carried throughout the plant, and a power supply system is also needed.
Photovoltaic mobile laboratory
One of the simplest approaches to enable luminescence measurements during the day is to use a PV mobile laboratory. This mobile laboratory is a truck or van equipped with the required tools to perform a full inspection of solar modules, including visual inspection, electrical insulation tests, infrared thermography, current-voltage measurements, and EL imaging (Coello et al., 2014; Navarrete et al., 2015). The main advantage of this method is that measurements can be performed under standard conditions, achieving a similar quality compared to measurements performed in a laboratory. However, unlike measurements done in a laboratory, this method avoids all the issues related to the transportation and handling of PV modules from the power plant to the laboratory. It saves time and avoids possible faults caused in this transportation process. Furthermore, the system allows for solar module inspections throughout the full lifecycle of the solar module.
The EL measurements are performed inside the truck using a power supply. The EL signal is captured in a dark environment with a Silicon CCD camera, providing EL pictures with high resolution. A real experience using a PV mobile truck allowed the full inspection of a total of 500 modules in two different plants in two weeks (Coello et al., 2014). The EL measurements were able to identify a total of 8.0% and 19.6% of faulty modules in the two different PV power plants (Coello et al., 2014). However, the main problem with this method is that it requires the disassembly of the modules from the racks to perform the measurements inside the truck. This disassembly is not desirable as it could be time-consuming and could lead to faults in the modules.
Bidirectional inverter
A bidirectional inverter can be employed to capture EL images. PV inverters are electronic devices that transform the DC current generated by the PV array into AC current, which can be injected into the electrical grid while ensuring that the solar array operates at the MPP (Maximum Power Point) of its current-voltage curve. Commercial PV inverters typically have an electronic topology that cannot transform AC current back into DC. However, it is possible to manufacture bidirectional inverters that function as conventional PV inverters but can also act as power supplies, injecting current into the PV array for EL imaging acquisition (Ballestín-Fuertes et al., 2020) (see Figure 7).

Setup for an electroluminescence technique with bidirectional inverter.
The installation of bidirectional inverters involves a higher initial investment compared to conventional PV inverters. Additionally, large PV plants may need multiple breakers and switches to energize specific sections of the power plant at the same time. Despite these challenges, bidirectional inverters could be a simple and efficient solution for EL measurements in large PV plants. This approach eliminates the need for a separate power supply and avoids the disconnection of solar modules, enhancing safety and reducing measurement acquisition time. It's important to note that this method requires measurements to be taken during the night to mitigate the noise generated by sunlight and avoid power production hours.
Finally, the implementation of bidirectional inverters can be desirable due to other factors. For example, bidirectional inverters may be required in PV plants that integrate electrical-battery storage systems (Bullich-Massagué et al., 2020) to enhance a bidirectional flow between the batteries and the grid. Furthermore, the injection of current into the PV array can be used as a tool for snow removal (Aragon-Aviles et al., 2022). The current injection produces module heating that melts the snow or ice covering the PV modules, which can increase energy output and reduce mechanical load.
Daylight electroluminescence and photoluminescence
As previously mentioned, a lock-in technique can be implemented to capture EL or PL images in high irradiance environments. The easiest way to do this is to use an electronic device connected between the power supply and the solar module (Dos Reis Benatto et al., 2018b; Guada et al., 2020; Martínez et al., 2017; Stoicescu et al., 2014) (see Figure 8-(a)). Note that a programmable power supply can also be used (Parikh et al., 2019). The electronic device can be based on MOSFET transistors (Silverman et al., 2017), allowing for the change in the state of the module. For EL imaging, the device switches the PV module state between current injection (high EL emission) and short-circuit (null EL emission). The electronic device can also work without a power supply, using sunlight to generate the PL effect in the module (see Figure 8-(b)). Here, the electronic device must switch the solar module state between open-circuit (high PL emission) and short-circuit (null PL emission).

Setup for daylight electroluminescence (a) and daylight photoluminescence (b) lock-in techniques.
The modulation of the PL or EL signal at a specific frequency, along with proper coordination with a sensor capturing the signal, allows the capture of a set of images. Lock-in processing of these images produces an EL or PL image suitable for fault detection. It's important to note that PL emission is lower than EL emission, requiring a higher number of cycles. Moreover, PL acquisition requires an irradiance threshold, as it improves with higher irradiance. On the other hand, EL pictures display better quality when the irradiance is low. In this method, InGaAs cameras are mandatory, crucial to ensuring a low exposure time to reduce acquisition time, as CCD cameras based on silicon sensors are extremely sensitive to sunlight. Additionally, bandpass filters must be implemented (Guada et al., 2020) to block a part of the solar spectrum and consequently increase the fraction of luminescence emission in comparison with background signal.
The main advantage of these techniques is that they enhance PL and EL characterizations during the day without the need for the disassembly of solar modules, reducing the possibility of introducing faults. This system can achieve a high throughput, capturing up to 1MWp of modules in 24 h with two operators and one camera (Guada et al., 2020). However, it requires the disconnection of PV modules to connect the electronic device, increasing acquisition time and potentially reducing the energy yield of the power plant due to the need to disconnect the PV string for safety reasons.
Daylight photoluminescence (control cell method)
Another possibility for integrating a daylight lock-in technique is to use a solar cell as a control cell to switch the solar module's operating point (Bhoopathy et al., 2018a, 2018b). PV solar modules typically include three substrings of solar cells, which are connected in parallel with bypass diodes. The present method is based on controlling the irradiance that one solar cell receives using an LED light system (see Figure 9). When the LED light system is on, all the solar cells that make up the substring work at the MPP where PL emission is almost null. On the other hand, if the control cell does not receive light, it leads all the solar cells of the substring to work in open circuit as the current generated by this substring is null. Therefore, this system enhances the PL signal modulation for the integration of a lock-in technique.

Setup for daylight photoluminescence lock-in technique with control cell method.
In a large PV plant where central inverters are used, losing 1/3 of the power of one module due to the shading of one solar cell does not affect the behaviour of the MPP tracking system, as it tracks the MPP of many modules. However, this power loss affects the performance of microinverters that track the MPP of a single module. When the LED control system is switched off, the module starts operating in open circuit. Then, when the LED control system is switched on, it takes the inverter around 6 s to reach the MPP. Consequently, it is not possible to use a sequential lock-in technique since the acquisition time would be very high, and changing irradiance conditions could affect the quality of the measurements. A batch measurement approach is implemented (Bhoopathy et al., 2019, 2020), where all the pictures under the MPP are firstly taken, and then, all pictures under the open-circuit operating point are captured. In addition, each picture is multiplied by an irradiance correction factor to avoid the effect of changing irradiance.
The present technique has a relatively low throughput, around 48 kWp per hour. Other limitations of the technique include the requirement of moving the LED system control onto each module, which limits the throughput. Two images of the same module are also required as the control cells are not captured. Finally, the implementation of the technique in novel technologies such as partial-cell modules could be complicated. So, it is also possible to modulate the PL signal in a full PV string using this technique (Kunz et al., 2021). This approach only works in power plants with large central inverters and needs to control through an LED system one cell per substring in a total of five modules within the same PV string. To shadow all cells, it leads all five modules to work in OC. The string must have the same voltage, which is fixed by the inverter, so the rest of the solar modules increase their voltage, reaching OC voltage. This configuration allows modulating a PL signal in a full PV string, improving the acquisition time and throughput (240 kWp per hour).
Daylight photoluminescence (inverter control method)
It is also possible to implement a daylight lock-in technique using the PV inverter as the device that enhances a switch between MPP, where PL emission is high, and the OC point, where PL emission is null (Koester et al., 2020; Vuković et al., 2022a; Vuković et al., 2022b). This method allows PL signal modulation thanks to the MPP tracking system (see Figure 10). The transition between OC point and MPP requires several seconds (around 6 s). Therefore, a batch measurement process is more desirable than a sequential measurement process. Here, all the pictures under MPP are continuously taken. Then, a command is sent to the inverter to set the OC voltage in the PV array and take all the pictures under OC conditions. After the measurement process, the solar inverter sets again the MPP, and normal operation is restored.

Setup for daylight photoluminescence lock-in technique with inverter control method.
This technique can also be based on the functionality present in certain inverters, which allows for current-voltage curve sweeps (Dos Reis Benatto et al., 2023; Vuković et al., 2022c). During the tracing of the current-voltage curve, the photovoltaic array changes its operating point from OC to SC, or vice versa. This provides two different points where the PL signal is high and low, respectively. Therefore, it is possible to utilize a high-frequency InGaAs camera and a batch approach for lock-in integration and PL imaging acquisition during high irradiance conditions.
The main advantage of this system is that it does not require an additional device to modulate the luminescence signal since the PV inverter is able to do it. However, the system sets OC conditions in the total of modules that are tracked by the same MMP tracking system, which can lead to significant power losses in large central inverters due to significant energy yield reductions caused by the measurement process.
Self-sourced electroluminescence
Other method that enables changing the operating point of a PV module to integrate a daylight lock technique is called self-sourced EL (Kropp et al., 2017). This technique is based on electronics that extract current from the tested PV module. The energy is stored in a capacitor, and then a boost converter increases the voltage to inject the current back into the same module. During current extraction, the solar module works in the first quadrant of the current-voltage curve close to MPP, where luminescence emission is almost null. On the other hand, during current injection, the module works in the fourth quadrant, leading to the EL effect. Several extraction and injection cycles allow modulating an EL signal that is needed for the lock-in technique.
The main advantage of this method is that it provides a way to obtain EL pictures during high irradiance conditions without the need for a power supply. However, the reported acquisition time (10 min per module) limits the effectiveness of this technique. Additionally, the technique requires the disconnection of the modules from the string to connect the electronic device for current extraction and injection.
Passive electroluminescence and photoluminescence
The last approach which allows modulating EL and PL signal for lock-in integration and daylight measurements is called passive EL and PL (Redondo-Plaza et al., 2024). This method is based on an electronic board which must be installed in the photovoltaic modules (see Figure 11). The board enhances to change the polarity of the module in order to use the string current for modulating EL signal. Moreover, the device is also able to bypass the module and set a OC or SC point in the PV module, which provide a tool for PL modulation.

Setup for passive electroluminescence and photoluminescence.
The main advantage of the system is the fact that measurement can be performance while the PV power plant is under regular operation, and no disconnections are required, which reduce measurement time, increase throughput. However, the integration of an electronic device in each module poses the main limitation in this approach.
Moreover, it is also possible to use one half of the solar cells as generators in order to inject current and thereby produce EL signal in the other half of the module (Kontges et al., 2022). This approach is based on the parallel interconnections of the sub-strings in the PV module. However, the method is limited to PV module technologies that include parallel connections, typically partial-cell PV modules.
Daylight photoluminescence at constant operational point
This technique allows for the use of a daylight lock-in technique by subtraction and addition of pictures that differ in PL emission. However, unlike other lock-in techniques, it is not necessary to change the operating point of the tested solar module (Kunz et al., 2020). Instead, all the images are taken under the same operating point (OC) using different optical filters. A standard filter is used to capture the peak intensity of PL emission. Two additional filters, with a centre wavelength higher and lower than the standard filter, are employed. These filters must be chosen with a centre wavelength as close as possible to the wavelength of the standard filter but far enough so that PL emission is low. This approach enables the measurement of a similar signal noise, allowing for subtraction with the image taken with the standard filter. However, the current approach has only been demonstrated in highly efficient SunPower interdigitated all back-contact (IBC) solar modules. The investigation with other types of PV modules becomes mandatory in order to consolidate the method as an inspection technique for solar PV power plants.
Daylight photoluminescence with ultranarrow bandpass filter
This technique takes advantage of sunlight absorption in the Earth's atmosphere by water vapour and utilizes developments in ultranarrow bandpass optical filters (Rey et al., 2022). The concentration of water vapour varies across the globe, seasons, and weather conditions, leading to modifications in the spectral absorption spectrum. This spectrum contains several narrow bands (1–2 nm) where sunlight is nearly blocked. Moreover, water vapour absorption aligns with luminescence emission. Consequently, it becomes feasible to construct a custom ultranarrow bandpass filter that aligns with this band and use an InGaAs camera to capture the PL signal of the module, as the luminescence signal represents around 90% of the total captured signal.
The main advantage of this method is that the PL signal can be captured in a daylight environment with a single camera shot, eliminating the need to obtain several pictures under high and low luminescence emission ratios for a lock-in technique. The technique exhibits a low acquisition time ranging between 1 and 50 s. While a higher acquisition time results in better quality, even 1 s of acquisition time allows for the detection of most failures. This short acquisition time contributes to a high throughput, reaching up to 1.5 MWp/h when used in conjunction with unmanned aerial vehicles. However, this technique requires a custom ultranarrow bandpass optical filter, a customised camara lens system and a low noise InGaAs camera, which pose technical and operational issues. Moreover, the proper performance of the ultranarrow bandpass filter depends on the concentration of water vapour in the atmosphere, which can vary. Finally, this concept has been demonstrated in passivated emitter and rear contact (PERC) modules, which exhibit higher luminescence emission compared to conventional silicon crystalline PV modules.
Inhomogeneous photoluminescence
The inhomogeneous PL technique involves illuminating only one region of the solar cell. Despite illuminating a specific portion of the cell, the induced voltage is distributed across the entire area and the full solar cell exhibits PL emission. The PL images obtained with this technique may differ from conventional PL or EL images due to the occurrence of lateral currents (Sulas et al., 2019). Additionally, the interpretation of these pictures must take into account the effects of lateral currents, the relative position of the solar cell, and the percentage of the illuminated area.
First, a laboratory technique involves illuminating a large area of the solar cell while capturing the PL emission in a small dark area using a photodetector (Kasemann et al., 2012). This can also be achieved by lighting one half of the cell and capturing the PL emission in the other half under dark conditions to avoid the effect of excitation light. The process is then replicated for the other half of the solar cell to reconstruct the image of the entire cell area in a single image. This technique can be implemented in a laboratory setup using an LED lighting device and a CCD camera (Johnston, 2015). Alternatively, sunlight and an InGaAs camera can be used to acquire PL images (Redondo Plaza et al., 2023).
Another possibility is the use of line-scan techniques (Dos Reis Benatto et al., 2018a; Dos Reis Benatto et al., 2021; Juhl et al., 2016). These techniques involve employing a CCD line-scan camera with a one-row pixel matrix and a line lighting device. The method includes moving the module across the area captured by the line-scan camera while the camera consistently takes pictures. A subsequent reconstruction using all the captured images provides a high-quality PL image of the entire PV module. Line-scan PL images offer exceptional quality and can be more effective than conventional EL images in detecting certain types of failures, such as series resistance issues or broken fingers. The key advantage of line-scan images is their ability to achieve high-quality measurements without the need for electrical contacts, reducing the risk of module damage.
The previously mentioned techniques can be easily integrated into laboratories or module factories. Line-scan PL, in particular, has the potential to be seamlessly incorporated into the conveyor belts of module factories, offering a contactless and efficient measurement method. However, integrating these techniques into field applications presents various challenges. PV modules are often cleaned to remove soiling and maximize energy output, a task sometimes performed automatically by robots, especially in large PV power plants. Consequently, it becomes feasible to integrate an inhomogeneous PL system into these cleaning robots, capturing PL images while the modules are being cleaned (Peng et al., 2015). This system includes a LED lighting system and a CCD camera, collecting multiple images across the entire surface of the PV module. Subsequently, a reconstruction using all the pictures enhances the acquisition of a complete PL image of the module area.
Integrations with unmanned aerial vehicles
The use of unmanned aerial vehicles (UAVs) presents significant advantages in outdoor PV power plant inspections. UAVs serve as efficient tools that can substantially reduce the required measurement time compared to ground inspections. While ground-based luminescence measurements achieve a throughput of 30 kWp per hour, aerial luminescence measurements have the potential to surpass a throughput of 125 kWp per hour (Ulrike Jahn et al., 2018). Additionally, aerial inspections facilitate the measurement of PV facilities on roofs or floating PV power plants (Weber et al., 2016), which can be challenging or even impossible with conventional techniques that involve a camera placed on a tripod. Lastly, the combination of aerial image acquisition with computational and artificial intelligence techniques holds tremendous potential for large PV plants, offering efficiency gains in both time and cost for inspections (Niccolai et al., 2019).
Infrared thermography inspections conducted with UAVs have become a standard practice in the operation and maintenance of large PV plants (Gallardo-Saavedra et al., 2018). Unlike EL or PL measurements, infrared thermography images can be easily obtained in a single shot while the PV array is operating under normal conditions. However, thermography inspections are limited to irradiance levels higher than 600–700 W/m2 (Köntges et al., 2014; Weber et al., 2016). Therefore, luminescence aerial inspections become valuable as they offer more hours during the day when inspections are feasible.
It is possible to capture aerial EL images during the night. However, for aerial inspections, the use of an InGaAs sensor is recommended since Silicon CCD devices require high exposure times, leading to increased acquisition time and lower quality due to drone instability compared to a tripod (Vidal de Oliveira et al., 2019). The use of an InGaAs camera allows for exposure times lower than 20 ms, making EL filming feasible for drone inspections (Adams et al., 2016), which avoids the need to stop the drone while the camera is shooting. To generate the EL effect for aerial inspections, a power supply (Vidal de Oliveira et al., 2019) or a bidirectional inverter (Hernández-Callejo et al., 2022) can be employed. The first option requires module disconnection during the night, which is not desirable from an operational standpoint and limits the acquisition time. On the other hand, bidirectional inverters are not common equipment in most PV power plants.
Drone-based daylight EL is also possible using a lock-in technique (Del Prado Santamaría et al., 2023; Dos Reis Benatto et al., 2020). Multiple images are captured with an InGaAs camera attached to the UAV while an EL signal is modulated in the PV module using a power supply. The integration of a lock-in technique using UAVs is challenging. It is crucial to achieve high stability, and special processing of the images is needed, including the detection of module edges and motion compensation for the entire image sequence. These two steps are not needed in luminescence imaging using a fixed tripod.
Discussion and conclusions
Both EL and PL images are powerful tools for fault detection and module characterization in PV cells and modules. The luminescence technique is implemented throughout the life cycle of the PV device, from its fabrication to the end of its life. While PL and EL measurements are standard procedures in PV factories, outdoor measurements are less common in operational PV plants. However, luminescence images provide additional and highly valuable information compared to standard inspection techniques such as thermography or current-voltage measurements, as these techniques may not detect faults with low or null impact on the electrical or thermal performance of the module. Additionally, EL and PL measurements have more potential hours for measurement since current-voltage curve measurements and thermography inspections typically require irradiance thresholds.
The conventional luminescence technique is based on EL picture acquisitions because it is more practical and easier to use a power supply for current injections and EL effect generation than to build and use a uniform lighting device for PL image acquisition. The characteristics of this method explain why outdoor luminescence images are not standard in PV plants and are only acquired in exceptional situations, such as after extreme weather events or breaches of the manufacturer's warranty detected by other techniques. Firstly, conventional EL measurements involve acquisition during the night since luminescence emission is much lower than the signal generated by sunlight. Additionally, the need to use a power supply, along with the need for module disconnections, poses more disadvantages. This leads to conventional EL measurements being time-consuming, with lower throughput than other techniques. These facts explain their lower integration into routines in PV plants despite their high utility in fault detection.
Alternative luminescence techniques have been proposed to solve the drawbacks of the conventional technique, making EL or PL methods suitable for outdoor measurements in large PV power plants. The lock-in technique has become a standard for PL or EL imaging under high irradiance levels. Furthermore, this technique can take advantage of sunlight excitation to generate the PL effect, avoiding the use of a power supply or a lighting device. Note that the EL effect can also be achieved with a bidirectional inverter or using the energy generated by the PV modules of the power plant. The main drawback of the lock-in technique is that it requires the modulation of the luminescence signal in the tested PV module or string, limiting the acquisition time and typically requiring the disconnection of the array to connect an electronic device that modulates the signal by changing the operational point of the module.
In this way, the optimal luminescence technique involves a contactless method that can obtain pictures under high irradiance conditions with enough quality. A high throughput with minimal additional hardware is crucial to achieving a cost-effective technique for outdoor applications in large facilities. Additionally, easy integration into UAVs is desirable, which can make the acquisition of luminescence images cheaper and faster. Table 2 summarizes all the techniques for outdoor luminescence acquisition, providing their features, advantages, and disadvantages.
Summary of luminescence techniques for photovoltaic outdoor applications.

Footnotes
Declaration of conflicting interests
The authors declared no potential conflicts of interest with respect to the research, authorship, and/or publication of this article.
Funding
The authors disclosed receipt of the following financial support for the research, authorship, and/or publication of this article: This work has been funded by the Spanish Ministry of Universities through the National Program FPU (grant number FPU21/04288). This work has been financed also by the Spanish Ministry of Science and Innovation, under project PID2020-113533RB-C33.
Author biographies